

Form N-CSR FIDELITY ADVISOR SERIES For: Jul 31
 Tweet
Tweet Share
ShareUNITED STATES
SECURITIES AND EXCHANGE COMMISSION
Washington, D.C. 20549
FORM N-CSR
CERTIFIED SHAREHOLDER REPORT OF REGISTERED
MANAGEMENT INVESTMENT COMPANIES
Investment Company Act file number 811-03010
Fidelity Advisor Series VII
(Exact name of registrant as specified in charter)
245 Summer St., Boston, Massachusetts 02210
(Address of principal executive offices) (Zip code)
Cynthia Lo Bessette, Secretary
245 Summer St.
Boston, Massachusetts 02210
(Name and address of agent for service)
Registrant's telephone number, including area code:
617-563-7000
Date of fiscal year end: | July 31 |
Date of reporting period: | July 31, 2021 |
Item 1.
Reports to Stockholders
Fidelity Advisor Focus Funds®
Fidelity Advisor® Biotechnology Fund
Fidelity Advisor® Communications Equipment Fund
Fidelity Advisor® Consumer Discretionary Fund
Fidelity Advisor® Energy Fund
Fidelity Advisor® Financial Services Fund
Fidelity Advisor® Health Care Fund
Fidelity Advisor® Industrials Fund
Fidelity Advisor® Semiconductors Fund
Fidelity Advisor® Technology Fund
Fidelity Advisor® Utilities Fund
July 31, 2021

Contents
|
Fidelity Advisor® Biotechnology Fund | |
|
Fidelity Advisor® Communications Equipment Fund | |
|
Fidelity Advisor® Consumer Discretionary Fund | |
|
Fidelity Advisor® Energy Fund | |
|
Fidelity Advisor® Financial Services Fund | |
|
Fidelity Advisor® Health Care Fund | |
|
Fidelity Advisor® Industrials Fund | |
|
Fidelity Advisor® Semiconductors Fund | |
|
Fidelity Advisor® Technology Fund | |
|
Fidelity Advisor® Utilities Fund | |
|
Board Approval of Investment Advisory Contracts and Management Fees | |
To view a fund's proxy voting guidelines and proxy voting record for the 12-month period ended June 30, visit http://www.fidelity.com/proxyvotingresults or visit the Securities and Exchange Commission's (SEC) web site at http://www.sec.gov.
You may also call 1-877-208-0098 to request a free copy of the proxy voting guidelines.
Standard & Poor's, S&P and S&P 500 are registered service marks of The McGraw-Hill Companies, Inc. and have been licensed for use by Fidelity Distributors Corporation.
Other third-party marks appearing herein are the property of their respective owners.
All other marks appearing herein are registered or unregistered trademarks or service marks of FMR LLC or an affiliated company. © 2021 FMR LLC. All rights reserved.
This report and the financial statements contained herein are submitted for the general information of the shareholders of the Funds. This report is not authorized for distribution to prospective investors in the Funds unless preceded or accompanied by an effective prospectus.
A fund files its complete schedule of portfolio holdings with the SEC for the first and third quarters of each fiscal year on Form N-PORT. Forms N-PORT are available on the SEC’s web site at http://www.sec.gov. A fund's Forms N-PORT may be reviewed and copied at the SEC’s Public Reference Room in Washington, DC. Information regarding the operation of the SEC's Public Reference Room may be obtained by calling 1-800-SEC-0330.
For a complete list of a fund's portfolio holdings, view the most recent holdings listing, semiannual report, or annual report on Fidelity's web site at http://www.fidelity.com, http://www.institutional.fidelity.com, or http://www.401k.com, as applicable.
NOT FDIC INSURED •MAY LOSE VALUE •NO BANK GUARANTEE
Neither the Funds nor Fidelity Distributors Corporation is a bank.
Note to Shareholders:
Early in 2020, the outbreak and spread of a new coronavirus emerged as a public health emergency that had a major influence on financial markets, primarily based on its impact on the global economy and the outlook for corporate earnings. The virus causes a respiratory disease known as COVID-19. On March 11, 2020 the World Health Organization declared the COVID-19 outbreak a pandemic, citing sustained risk of further global spread.
In the weeks following, as the crisis worsened, we witnessed an escalating human tragedy with wide-scale social and economic consequences from coronavirus-containment measures. The outbreak of COVID-19 prompted a number of measures to limit the spread, including travel and border restrictions, quarantines, and restrictions on large gatherings. In turn, these resulted in lower consumer activity, diminished demand for a wide range of products and services, disruption in manufacturing and supply chains, and – given the wide variability in outcomes regarding the outbreak – significant market uncertainty and volatility. Amid the turmoil, global governments and central banks took unprecedented action to help support consumers, businesses, and the broader economies, and to limit disruption to financial systems.
The situation continues to unfold, and the extent and duration of its impact on financial markets and the economy remain highly uncertain. Extreme events such as the coronavirus crisis are “exogenous shocks” that can have significant adverse effects on mutual funds and their investments. Although multiple asset classes may be affected by market disruption, the duration and impact may not be the same for all types of assets.
Fidelity is committed to helping you stay informed amid news about COVID-19 and during increased market volatility, and we’re taking extra steps to be responsive to customer needs. We encourage you to visit our websites, where we offer ongoing updates, commentary, and analysis on the markets and our funds.
Fidelity Advisor® Biotechnology Fund
Performance: The Bottom Line
Average annual total return reflects the change in the value of an investment, assuming reinvestment of distributions from dividend income and capital gains (the profits earned upon the sale of securities that have grown in value, if any) and assuming a constant rate of performance each year. The hypothetical investment and the average annual total returns do not reflect the deduction of taxes that a shareholder would pay on fund distributions or the redemption of fund shares. During periods of reimbursement by Fidelity, a fund’s total return will be greater than it would be had the reimbursement not occurred. How a fund did yesterday is no guarantee of how it will do tomorrow.
Average Annual Total Returns
| For the periods ended July 31, 2021 | Past 1 year | Past 5 years | Past 10 years |
| Class A (incl. 5.75% sales charge) | 7.48% | 11.25% | 16.81% |
| Class M (incl. 3.50% sales charge) | 9.71% | 11.43% | 16.73% |
| Class C (incl. contingent deferred sales charge) | 12.15% | 11.74% | 16.81% |
| Class I | 14.34% | 12.87% | 17.84% |
| Class Z | 14.49% | 12.95% | 17.88% |
Class C shares' contingent deferred sales charges included in the past one year, past five years and past ten years total return figures are 1%, 0% and 0%, respectively.
The initial offering of Class Z shares took place on October 2, 2018. Returns prior to October 2, 2018, are those of Class I.
$10,000 Over 10 Years
Let's say hypothetically that $10,000 was invested in Fidelity Advisor® Biotechnology Fund - Class A on July 31, 2011, and the current 5.75% sales charge was paid.
The chart shows how the value of your investment would have changed, and also shows how the S&P 500® Index performed over the same period.
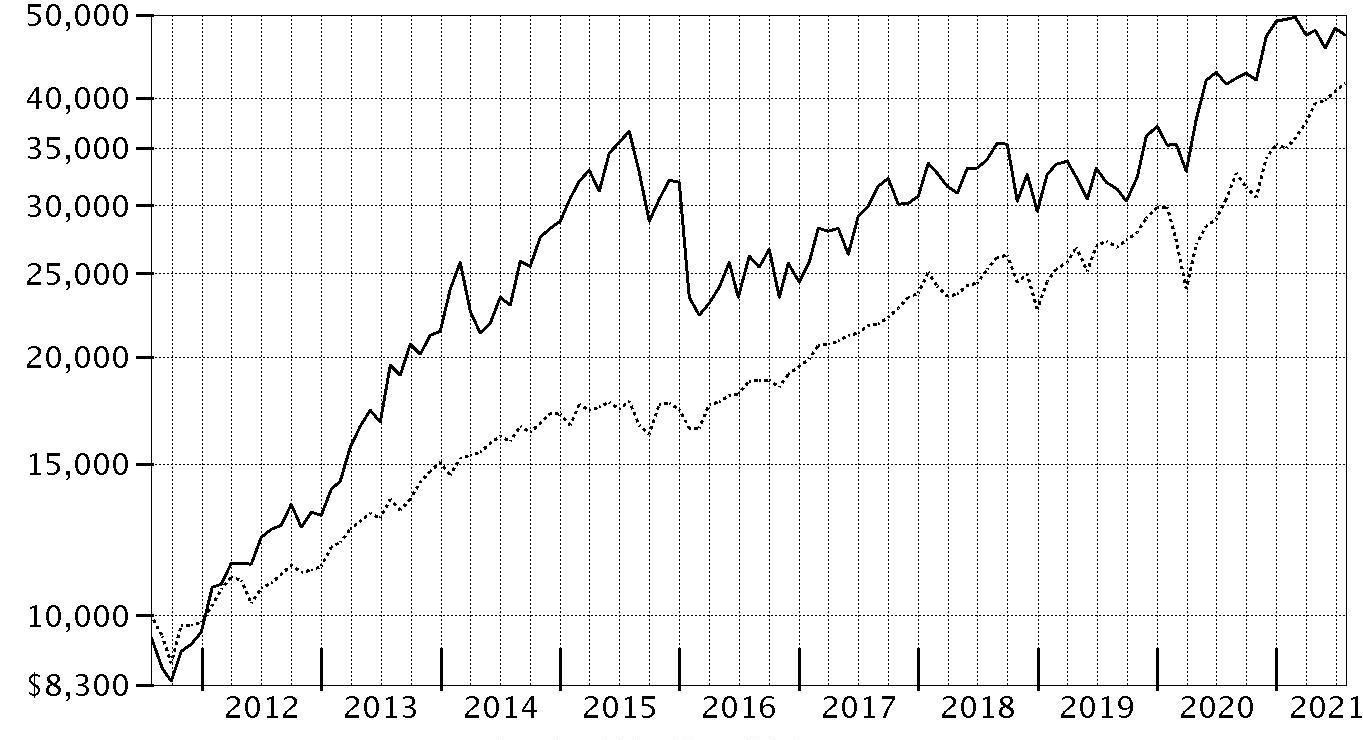
| Period Ending Values | ||
|
| $47,313 | Fidelity Advisor® Biotechnology Fund - Class A |
|
| $41,689 | S&P 500® Index |
Fidelity Advisor® Biotechnology Fund
Management's Discussion of Fund Performance
Market Recap: The S&P 500® index gained 36.45% for the 12 months ending July 31, 2021, as U.S. equities continued a historic rebound following a steep but brief decline due to the early-2020 outbreak and spread of COVID-19. A confluence of powerful forces propelled risk assets, returning the stock market to pre-pandemic highs by late August 2020. The rally slowed in September, when stocks began a two-month retreat amid Congress’s inability to reach a deal on additional fiscal stimulus, as well as uncertainty about the election. But as the calendar turned, investors grew hopeful. The rollout of three COVID-19 vaccines was underway, the U.S. Federal Reserve pledged to hold interest rates near zero until the economy recovered, and the federal government planned to deploy trillions of dollars to boost consumers and the economy. This backdrop fueled a sharp rotation, with small-cap value usurping leadership from large growth. As part of the “reopening” theme, investors moved out of tech-driven mega-caps that had thrived due to the work-from-home trend in favor of cheap smaller companies that stood to benefit from a broad cyclical recovery. A flattish May reflected concerns about inflation and jobs, but the uptrend resumed through July, driven by corporate earnings. Notably, this leg saw momentum shift back to large growth, as easing rates and a hawkish Fed stymied the reflation trade. By sector, financials (+55%) led, driven by banks (+63%), whereas utilities (+12%) and consumer staples (+18%) notably lagged. Comments from Portfolio Manager Eirene Kontopoulos: For the fiscal year ending July 31, 2021, the fund's share classes (excluding sales charges, if applicable) gained about 13% to 14%, trailing the 18.34% advance of the MSCI US IMI Biotechnology 25/50 Index, as well as the broad-based S&P 500® index. Versus the industry index, an overweighting in pharmaceuticals and stock selection in biotechnology each detracted meaningfully the past 12 months. Not owning Moderna, an index component that gained 377%, was by far the biggest individual relative detractor. The fund's non-index stake in Ascendis Pharma, one of our largest holdings, returned -14% and also hurt. Also hindering performance was our overweighting in Exelixis, which returned -27%. We added to our position the past year. Conversely, the biggest contributor to performance versus the industry index was stock selection in pharmaceuticals. Our non-index stake in MyoKardia was the fund's largest individual relative contributor, driven by a rise of 145%. MyoKardia was not held at period end. Also lifting performance was an underweighting in Amgen (+2%). Amgen was not held at period end. Another notable relative contributor was our overweighting in Immunomedics (+102%), a position not held at period end. Notable changes in positioning include increased exposure to the pharmaceuticals subindustry.The views expressed above reflect those of the portfolio manager(s) only through the end of the period as stated on the cover of this report and do not necessarily represent the views of Fidelity or any other person in the Fidelity organization. Any such views are subject to change at any time based upon market or other conditions and Fidelity disclaims any responsibility to update such views. These views may not be relied on as investment advice and, because investment decisions for a Fidelity fund are based on numerous factors, may not be relied on as an indication of trading intent on behalf of any Fidelity fund.
Fidelity Advisor® Biotechnology Fund
Investment Summary (Unaudited)
Top Ten Stocks as of July 31, 2021
| % of fund's net assets | |
| AbbVie, Inc. | 21.6 |
| Regeneron Pharmaceuticals, Inc. | 8.9 |
| Alnylam Pharmaceuticals, Inc. | 6.9 |
| Vertex Pharmaceuticals, Inc. | 5.1 |
| Novavax, Inc. | 3.8 |
| Argenx SE ADR | 3.3 |
| Ascendis Pharma A/S sponsored ADR | 2.4 |
| TG Therapeutics, Inc. | 2.2 |
| Exelixis, Inc. | 2.1 |
| Protagonist Therapeutics, Inc. | 2.0 |
| 58.3 |
Top Industries (% of fund's net assets)
| As of July 31, 2021 | ||
| Biotechnology | 94.0% | |
| Pharmaceuticals | 5.1% | |
| Consumer Finance | 0.2% | |
| Diversified Financial Services | 0.2% | |
| Health Care Providers & Services | 0.2% | |
| All Others* | 0.3% | |

* Includes short-term investments and net other assets (liabilities).
Fidelity Advisor® Biotechnology Fund
Schedule of Investments July 31, 2021
Showing Percentage of Net Assets
| Common Stocks - 98.0% | |||
| Shares | Value | ||
| Biotechnology - 92.8% | |||
| Biotechnology - 92.8% | |||
| AbbVie, Inc. | 4,679,980 | $544,281,674 | |
| ACADIA Pharmaceuticals, Inc. (a) | 614,700 | 13,295,961 | |
| Acceleron Pharma, Inc. (a) | 230,289 | 28,799,942 | |
| ADC Therapeutics SA (a)(b) | 259,223 | 5,454,052 | |
| Aerovate Therapeutics, Inc. (b) | 432,100 | 5,552,485 | |
| Agios Pharmaceuticals, Inc. (a)(b) | 726,943 | 34,958,689 | |
| Allakos, Inc. (a)(b) | 425,300 | 33,836,868 | |
| Alnylam Pharmaceuticals, Inc. (a) | 976,386 | 174,714,511 | |
| Ambrx Biopharma, Inc.: | |||
| ADR | 21,300 | 416,415 | |
| ADR | 434,097 | 7,637,937 | |
| Annexon, Inc. (a)(b) | 191,975 | 4,042,994 | |
| Apellis Pharmaceuticals, Inc. (a) | 201,115 | 12,869,349 | |
| Arcutis Biotherapeutics, Inc. (a)(b) | 820,433 | 19,140,702 | |
| Argenx SE ADR (a) | 273,100 | 83,139,833 | |
| Ascendis Pharma A/S sponsored ADR (a) | 505,946 | 59,797,758 | |
| Aurinia Pharmaceuticals, Inc. (a)(b) | 1,966,900 | 26,671,164 | |
| Autolus Therapeutics PLC ADR (a)(b) | 996,000 | 5,298,720 | |
| BeiGene Ltd. (a) | 109,800 | 2,593,541 | |
| BeiGene Ltd. ADR (a) | 41,500 | 13,138,485 | |
| BioAtla, Inc. (b) | 229,990 | 9,427,290 | |
| Bolt Biotherapeutics, Inc. | 496,400 | 5,534,860 | |
| C4 Therapeutics, Inc. | 69,700 | 3,006,858 | |
| Celldex Therapeutics, Inc. (a) | 630,503 | 27,584,506 | |
| Century Therapeutics, Inc. | 21,900 | 638,385 | |
| Century Therapeutics, Inc. | 460,571 | 12,083,080 | |
| Cerevel Therapeutics Holdings (a)(b) | 415,228 | 10,231,218 | |
| ChemoCentryx, Inc. (a) | 548,074 | 8,100,534 | |
| Connect Biopharma Holdings Ltd. ADR (a)(b) | 704,200 | 15,499,442 | |
| Crinetics Pharmaceuticals, Inc. (a) | 732,707 | 13,174,072 | |
| Cullinan Oncology, Inc. | 234,600 | 5,379,378 | |
| Cytokinetics, Inc. (a)(b) | 1,370,007 | 40,661,808 | |
| Day One Biopharmaceuticals, Inc. (a) | 38,600 | 915,592 | |
| Eledon Pharmaceuticals, Inc. (a) | 103,364 | 670,832 | |
| Erasca, Inc. | 270,441 | 5,679,261 | |
| Exelixis, Inc. (a) | 3,189,300 | 53,739,705 | |
| Forma Therapeutics Holdings, Inc. (a)(b) | 661,252 | 15,136,058 | |
| Fusion Pharmaceuticals, Inc. (a)(b) | 1,061,662 | 8,652,545 | |
| Global Blood Therapeutics, Inc. (a)(b) | 935,418 | 25,564,974 | |
| Gossamer Bio, Inc. (a)(b) | 697,166 | 5,479,725 | |
| Graphite Bio, Inc. | 35,500 | 758,280 | |
| Graphite Bio, Inc. | 420,780 | 8,089,075 | |
| Icosavax, Inc. | 14,600 | 362,810 | |
| Imago BioSciences, Inc. | 132,827 | 2,433,391 | |
| Immunocore Holdings PLC | 93,760 | 3,037,149 | |
| Instil Bio, Inc. (a)(b) | 725,196 | 10,914,200 | |
| Instil Bio, Inc. | 852,386 | 12,186,989 | |
| Iovance Biotherapeutics, Inc. (a) | 451,900 | 10,063,813 | |
| Janux Therapeutics, Inc. (b) | 69,320 | 2,248,048 | |
| Keros Therapeutics, Inc. (a)(b) | 343,600 | 12,644,480 | |
| Kinnate Biopharma, Inc. | 8,800 | 189,904 | |
| Kinnate Biopharma, Inc. (c) | 208,710 | 4,503,962 | |
| Kura Oncology, Inc. (a)(b) | 522,300 | 9,892,362 | |
| Magenta Therapeutics, Inc. (a)(b) | 672,300 | 4,786,776 | |
| Mirati Therapeutics, Inc. (a) | 204,720 | 32,767,483 | |
| Monte Rosa Therapeutics, Inc. | 30,700 | 752,764 | |
| Monte Rosa Therapeutics, Inc. | 477,858 | 10,545,370 | |
| Morphic Holding, Inc. (a) | 203,400 | 11,719,908 | |
| Novavax, Inc. (a)(b) | 526,647 | 94,443,607 | |
| Nuvalent, Inc. | 673,254 | 11,058,197 | |
| Nuvalent, Inc. Class A | 46,953 | 856,892 | |
| ORIC Pharmaceuticals, Inc. (a)(b) | 434,800 | 7,239,420 | |
| Passage Bio, Inc. (a)(b) | 438,459 | 5,173,816 | |
| Poseida Therapeutics, Inc. (a)(b) | 428,946 | 3,478,752 | |
| Praxis Precision Medicines, Inc. | 209,600 | 3,269,760 | |
| Prelude Therapeutics, Inc. | 120,636 | 3,865,177 | |
| Prelude Therapeutics, Inc. (c) | 413,234 | 13,240,017 | |
| Protagonist Therapeutics, Inc. (a) | 1,040,133 | 51,413,774 | |
| PTC Therapeutics, Inc. (a) | 789,040 | 30,243,903 | |
| Regeneron Pharmaceuticals, Inc. (a) | 391,192 | 224,782,835 | |
| Relay Therapeutics, Inc. (a)(b) | 596,164 | 19,339,560 | |
| Repare Therapeutics, Inc. (a)(b) | 438,247 | 14,637,450 | |
| Revolution Medicines, Inc. (a)(b) | 361,916 | 10,365,274 | |
| Sarepta Therapeutics, Inc. (a) | 361,681 | 24,514,738 | |
| Scholar Rock Holding Corp. (a)(b) | 424,230 | 13,257,188 | |
| Shattuck Labs, Inc. (b) | 694,934 | 15,316,345 | |
| Silverback Therapeutics, Inc. | 16,200 | 490,536 | |
| Silverback Therapeutics, Inc. (c) | 98,114 | 2,970,892 | |
| Stoke Therapeutics, Inc. (a)(b) | 239,519 | 6,857,429 | |
| Syros Pharmaceuticals, Inc. (a)(b) | 701,833 | 3,242,468 | |
| Taysha Gene Therapies, Inc. (b) | 358,039 | 6,190,494 | |
| Tenaya Therapeutics, Inc. | 407,412 | 6,253,774 | |
| Tenaya Therapeutics, Inc. | 402,187 | 5,556,213 | |
| TG Therapeutics, Inc. (a) | 1,556,200 | 54,451,438 | |
| Vaxcyte, Inc. (a)(b) | 685,551 | 14,862,746 | |
| Vera Therapeutics, Inc. (a) | 251,300 | 4,523,400 | |
| Vera Therapeutics, Inc. | 729,168 | 11,812,522 | |
| Vertex Pharmaceuticals, Inc. (a) | 630,627 | 127,121,791 | |
| Verve Therapeutics, Inc. | 23,700 | 1,408,491 | |
| Xenon Pharmaceuticals, Inc. (a) | 849,835 | 14,676,650 | |
| Y-mAbs Therapeutics, Inc. (a) | 194,803 | 6,447,979 | |
| Zentalis Pharmaceuticals, Inc. (a) | 553,853 | 29,470,518 | |
| Zymeworks, Inc. (a)(b) | 415,853 | 13,344,723 | |
| 2,336,876,736 | |||
| Consumer Finance - 0.2% | |||
| Consumer Finance - 0.2% | |||
| Celularity, Inc. Class A (a)(b) | 644,600 | 5,672,480 | |
| Diversified Financial Services - 0.2% | |||
| Other Diversified Financial Services - 0.2% | |||
| BCTG Acquisition Corp. (a) | 479,300 | 4,793,000 | |
| Health Care Providers & Services - 0.0% | |||
| Health Care Services - 0.0% | |||
| Precipio, Inc. (a)(d) | 30 | 93 | |
| Pharmaceuticals - 4.8% | |||
| Pharmaceuticals - 4.8% | |||
| Afferent Pharmaceuticals, Inc. rights 12/31/24 (a)(e) | 1,915,787 | 3,122,733 | |
| Arvinas Holding Co. LLC (a) | 318,000 | 32,149,800 | |
| Axsome Therapeutics, Inc. (a)(b) | 100,800 | 4,897,872 | |
| Chiasma, Inc. warrants 12/16/24 (a) | 81,298 | 43,957 | |
| Cyteir Therapeutics, Inc. | 652,343 | 12,557,603 | |
| Edgewise Therapeutics, Inc. (a)(b) | 420,800 | 7,368,208 | |
| GH Research PLC (b) | 311,000 | 6,126,700 | |
| Ikena Oncology, Inc. (a)(b) | 519,514 | 5,148,384 | |
| Ikena Oncology, Inc. | 282,736 | 2,661,818 | |
| IMARA, Inc. (a)(b) | 310,346 | 1,672,765 | |
| Intra-Cellular Therapies, Inc. (a) | 115,015 | 3,948,465 | |
| Longboard Pharmaceuticals, Inc. (a)(b) | 379,100 | 3,411,900 | |
| NGM Biopharmaceuticals, Inc. (a) | 210,553 | 4,293,176 | |
| Pharvaris BV | 172,633 | 3,067,688 | |
| Pliant Therapeutics, Inc. (a)(b) | 381,173 | 7,699,695 | |
| Reata Pharmaceuticals, Inc. (a)(b) | 49,800 | 6,240,438 | |
| Stemcentrx, Inc. rights 12/31/21 (a)(e) | 208,907 | 2 | |
| Terns Pharmaceuticals, Inc. (b) | 906,792 | 6,800,940 | |
| Theravance Biopharma, Inc. (a)(b) | 746,326 | 9,687,311 | |
| 120,899,455 | |||
| TOTAL COMMON STOCKS | |||
| (Cost $1,858,863,213) | 2,468,241,764 | ||
| Convertible Preferred Stocks - 1.9% | |||
| Biotechnology - 1.2% | |||
| Biotechnology - 1.2% | |||
| Bright Peak Therapeutics AG Series B (d)(e) | 1,920,122 | 7,499,997 | |
| Sonoma Biotherapeutics, Inc.: | |||
| Series B (d)(e) | 1,967,762 | 4,565,208 | |
| Series B1 (d)(e) | 1,049,456 | 2,434,738 | |
| T-Knife Therapeutics, Inc. Series B (d)(e) | 1,300,097 | 7,500,000 | |
| ValenzaBio, Inc. Series A (d)(e) | 951,971 | 8,472,950 | |
| 30,472,893 | |||
| Health Care Providers & Services - 0.2% | |||
| Health Care Facilities - 0.2% | |||
| Boundless Bio, Inc. Series B (d)(e) | 3,703,704 | 5,000,000 | |
| Health Care Technology - 0.2% | |||
| Health Care Technology - 0.2% | |||
| Wugen, Inc. Series B (d)(e) | 580,277 | 4,499,990 | |
| Pharmaceuticals - 0.3% | |||
| Pharmaceuticals - 0.3% | |||
| Afferent Pharmaceuticals, Inc. Series C (a)(d)(e) | 1,915,787 | 19 | |
| Aristea Therapeutics, Inc. Series B (d)(e) | 677,328 | 6,244,964 | |
| 6,244,983 | |||
| Textiles, Apparel & Luxury Goods - 0.0% | |||
| Textiles - 0.0% | |||
| Treeline Biosciences Series A (d)(e) | 47,600 | 372,589 | |
| TOTAL CONVERTIBLE PREFERRED STOCKS | |||
| (Cost $44,080,110) | 46,590,455 | ||
| Money Market Funds - 9.4% | |||
| Fidelity Cash Central Fund 0.06% (f) | 19,150,658 | 19,154,488 | |
| Fidelity Securities Lending Cash Central Fund 0.06% (f)(g) | 217,599,843 | 217,621,603 | |
| TOTAL MONEY MARKET FUNDS | |||
| (Cost $236,771,968) | 236,776,091 | ||
| TOTAL INVESTMENT IN SECURITIES - 109.3% | |||
| (Cost $2,139,715,291) | 2,751,608,310 | ||
| NET OTHER ASSETS (LIABILITIES) - (9.3)% | (233,829,717) | ||
| NET ASSETS - 100% | $2,517,778,593 |
Legend
(a) Non-income producing
(b) Security or a portion of the security is on loan at period end.
(c) Security exempt from registration under Rule 144A of the Securities Act of 1933. These securities may be resold in transactions exempt from registration, normally to qualified institutional buyers. At the end of the period, the value of these securities amounted to $20,714,871 or 0.8% of net assets.
(d) Restricted securities (including private placements) - Investment in securities not registered under the Securities Act of 1933 (excluding 144A issues). At the end of the period, the value of restricted securities (excluding 144A issues) amounted to $46,590,548 or 1.9% of net assets.
(e) Level 3 security
(f) Affiliated fund that is generally available only to investment companies and other accounts managed by Fidelity Investments. The rate quoted is the annualized seven-day yield of the fund at period end. A complete unaudited listing of the fund's holdings as of its most recent quarter end is available upon request. In addition, each Fidelity Central Fund's financial statements, which are not covered by the Fund's Report of Independent Registered Public Accounting Firm, are available on the SEC's website or upon request.
(g) Investment made with cash collateral received from securities on loan.
Additional information on each restricted holding is as follows:
| Security | Acquisition Date | Acquisition Cost |
| Afferent Pharmaceuticals, Inc. Series C | 7/1/15 | $0 |
| Aristea Therapeutics, Inc. Series B | 10/6/20 - 7/27/21 | $3,734,584 |
| Boundless Bio, Inc. Series B | 4/23/21 | $5,000,000 |
| Bright Peak Therapeutics AG Series B | 5/14/21 | $7,499,997 |
| Precipio, Inc. | 2/3/12 | $161,441 |
| Sonoma Biotherapeutics, Inc. Series B | 7/26/21 | $3,888,888 |
| Sonoma Biotherapeutics, Inc. Series B1 | 7/26/21 | $3,111,112 |
| T-Knife Therapeutics, Inc. Series B | 6/30/21 | $7,500,000 |
| Treeline Biosciences Series A | 7/30/21 | $372,589 |
| ValenzaBio, Inc. Series A | 3/25/21 | $8,472,951 |
| Wugen, Inc. Series B | 7/9/21 | $4,499,990 |
Affiliated Central Funds
Information regarding fiscal year to date income earned by the Fund from investments in Fidelity Central Funds is as follows:
| Fund | Income earned |
| Fidelity Cash Central Fund | $19,645 |
| Fidelity Securities Lending Cash Central Fund | 736,788 |
| Total | $756,433 |
Amounts in the income column in the above table include any capital gain distributions from underlying funds, which are presented in the corresponding line-item in the Statement of Operations, if applicable. Amount for Fidelity Securities Lending Cash Central Fund represents the income earned on investing cash collateral, less rebates paid to borrowers and any lending agent fees associated with the loan, plus any premium payments received for lending certain types of securities.
Fiscal year to date information regarding the Fund's investments in Fidelity Central Funds, including the ownership percentage, is presented below.
| Fund | Value, beginning of period | Purchases | Sales Proceeds | Realized Gain/Loss | Change in Unrealized appreciation (depreciation) | Value, end of period | % ownership, end of period |
| Fidelity Cash Central Fund 0.06% | $40,119,716 | $1,014,540,483 | $1,035,502,587 | $559 | $(3,683) | $19,154,488 | 0.0% |
| Fidelity Securities Lending Cash Central Fund 0.06% | 81,419,588 | 1,211,452,067 | 1,075,250,052 | -- | -- | 217,621,603 | 0.7% |
| Total | $121,539,304 | $2,225,992,550 | $2,110,752,639 | $559 | $(3,683) | $236,776,091 |
Investment Valuation
The following is a summary of the inputs used, as of July 31, 2021, involving the Fund's assets and liabilities carried at fair value. The inputs or methodology used for valuing securities may not be an indication of the risk associated with investing in those securities. For more information on valuation inputs, and their aggregation into the levels used below, please refer to the Investment Valuation section in the accompanying Notes to Financial Statements.
| Valuation Inputs at Reporting Date: | ||||
| Description | Total | Level 1 | Level 2 | Level 3 |
| Investments in Securities: | ||||
| Common Stocks | $2,468,241,764 | $2,377,813,181 | $87,305,848 | $3,122,735 |
| Convertible Preferred Stocks | 46,590,455 | -- | -- | 46,590,455 |
| Money Market Funds | 236,776,091 | 236,776,091 | -- | -- |
| Total Investments in Securities: | $2,751,608,310 | $2,614,589,272 | $87,305,848 | $49,713,190 |
| Net unrealized depreciation on unfunded commitments | $(215,400) | $ | $( 215,400) | $ |
The following is a reconciliation of Investments in Securities for which Level 3 inputs were used in determining value:
| Investments in Securities: | |
| Common Stocks | |
| Beginning Balance | $15,230,959 |
| Total Realized Gain (Loss) | 9,006,191 |
| Total Unrealized Gain (Loss) | (6,531,423) |
| Cost of Purchases | -- |
| Proceeds of Sales | (14,582,992) |
| Amortization/Accretion | -- |
| Transfers in to Level 3 | -- |
| Transfers out of Level 3 | -- |
| Ending Balance | $3,122,735 |
| The change in unrealized gain (loss) for the period attributable to Level 3 securities held at July 31, 2021 | $(172,421) |
| Convertible Preferred Stocks | |
| Beginning Balance | $ 17,868,960 |
| Total Realized Gain (Loss) | -- |
| Total Unrealized Gain (Loss) | 2,510,325 |
| Cost of Purchases | 44,080,111 |
| Proceeds of Sales | -- |
| Amortization/Accretion | -- |
| Transfers in to Level 3 | -- |
| Transfers out of Level 3 | (17,868,941) |
| Ending Balance | $46,590,455 |
| The change in unrealized gain (loss) for the period attributable to Level 3 securities held at July 31, 2021 | $2,510,325 |
The information used in the above reconciliation represents fiscal year to date activity for any Investments in Securities identified as using Level 3 inputs at either the beginning or the end of the current fiscal period. Cost of purchases and proceeds of sales may include securities received and/or delivered through in-kind transactions. Transfers in or out of Level 3 represent the beginning value of any Security or Instrument where a change in the pricing level occurred from the beginning to the end of the period. The cost of purchases and the proceeds of sales may include securities received or delivered through corporate actions or exchanges. Realized and unrealized gains (losses) disclosed in the reconciliation are included in Net Gain (Loss) on the Fund's Statement of Operations.
Other Information
Distribution of investments by country or territory of incorporation, as a percentage of Total Net Assets, is as follows (Unaudited):
| United States of America | 89.5% |
| Netherlands | 3.3% |
| Denmark | 2.4% |
| Canada | 2.2% |
| Cayman Islands | 1.9% |
| Others (Individually Less Than 1%) | 0.7% |
| 100.0% |
See accompanying notes which are an integral part of the financial statements.
Fidelity Advisor® Biotechnology Fund
Financial Statements
Statement of Assets and Liabilities
| July 31, 2021 | ||
| Assets | ||
| Investment in securities, at value (including securities loaned of $207,932,411) — See accompanying schedule: Unaffiliated issuers (cost $1,902,943,323) | $2,514,832,219 | |
| Fidelity Central Funds (cost $236,771,968) | 236,776,091 | |
| Total Investment in Securities (cost $2,139,715,291) | $2,751,608,310 | |
| Receivable for investments sold | 17,808,561 | |
| Receivable for fund shares sold | 1,017,233 | |
| Dividends receivable | 6,512,194 | |
| Distributions receivable from Fidelity Central Funds | 82,388 | |
| Prepaid expenses | 13,840 | |
| Other receivables | 60,533 | |
| Total assets | 2,777,103,059 | |
| Liabilities | ||
| Payable for investments purchased | $34,298,706 | |
| Payable for fund shares redeemed | 5,040,004 | |
| Accrued management fee | 1,131,405 | |
| Distribution and service plan fees payable | 524,171 | |
| Other affiliated payables | 446,872 | |
| Unrealized depreciation on unfunded commitments | 215,400 | |
| Other payables and accrued expenses | 79,408 | |
| Collateral on securities loaned | 217,588,500 | |
| Total liabilities | 259,324,466 | |
| Net Assets | $2,517,778,593 | |
| Net Assets consist of: | ||
| Paid in capital | $1,620,960,288 | |
| Total accumulated earnings (loss) | 896,818,305 | |
| Net Assets | $2,517,778,593 | |
| Net Asset Value and Maximum Offering Price | ||
| Class A: | ||
| Net Asset Value and redemption price per share ($808,609,852 ÷ 24,821,445 shares)(a) | $32.58 | |
| Maximum offering price per share (100/94.25 of $32.58) | $34.57 | |
| Class M: | ||
| Net Asset Value and redemption price per share ($161,618,605 ÷ 5,325,394 shares)(a) | $30.35 | |
| Maximum offering price per share (100/96.50 of $30.35) | $31.45 | |
| Class C: | ||
| Net Asset Value and offering price per share ($328,416,607 ÷ 12,257,365 shares)(a) | $26.79 | |
| Class I: | ||
| Net Asset Value, offering price and redemption price per share ($1,129,492,474 ÷ 32,272,195 shares) | $35.00 | |
| Class Z: | ||
| Net Asset Value, offering price and redemption price per share ($89,641,055 ÷ 2,557,598 shares) | $35.05 |
(a) Redemption price per share is equal to net asset value less any applicable contingent deferred sales charge.
See accompanying notes which are an integral part of the financial statements.
Statement of Operations
| Year ended July 31, 2021 | ||
| Investment Income | ||
| Dividends | $30,855,006 | |
| Income from Fidelity Central Funds (including $736,788 from security lending) | 756,433 | |
| Total income | 31,611,439 | |
| Expenses | ||
| Management fee | $13,877,275 | |
| Transfer agent fees | 4,675,677 | |
| Distribution and service plan fees | 6,694,056 | |
| Accounting fees | 780,939 | |
| Custodian fees and expenses | 66,954 | |
| Independent trustees' fees and expenses | 11,424 | |
| Registration fees | 119,070 | |
| Audit | 66,947 | |
| Legal | 5,735 | |
| Interest | 570 | |
| Miscellaneous | 15,213 | |
| Total expenses before reductions | 26,313,860 | |
| Expense reductions | (161,873) | |
| Total expenses after reductions | 26,151,987 | |
| Net investment income (loss) | 5,459,452 | |
| Realized and Unrealized Gain (Loss) | ||
| Net realized gain (loss) on: | ||
| Investment securities: | ||
| Unaffiliated issuers | 577,410,681 | |
| Fidelity Central Funds | 559 | |
| Total net realized gain (loss) | 577,411,240 | |
| Change in net unrealized appreciation (depreciation) on: | ||
| Investment securities: | ||
| Unaffiliated issuers | (244,610,197) | |
| Fidelity Central Funds | (3,683) | |
| Unfunded commitments | (215,400) | |
| Total change in net unrealized appreciation (depreciation) | (244,829,280) | |
| Net gain (loss) | 332,581,960 | |
| Net increase (decrease) in net assets resulting from operations | $338,041,412 |
See accompanying notes which are an integral part of the financial statements.
Statement of Changes in Net Assets
| Year ended July 31, 2021 | Year ended July 31, 2020 | |
| Increase (Decrease) in Net Assets | ||
| Operations | ||
| Net investment income (loss) | $5,459,452 | $1,962,344 |
| Net realized gain (loss) | 577,411,240 | 5,639,561 |
| Change in net unrealized appreciation (depreciation) | (244,829,280) | 538,898,836 |
| Net increase (decrease) in net assets resulting from operations | 338,041,412 | 546,500,741 |
| Distributions to shareholders | (228,190,286) | (142,937,680) |
| Share transactions - net increase (decrease) | 1,156,643 | (167,947,129) |
| Total increase (decrease) in net assets | 111,007,769 | 235,615,932 |
| Net Assets | ||
| Beginning of period | 2,406,770,824 | 2,171,154,892 |
| End of period | $2,517,778,593 | $2,406,770,824 |
See accompanying notes which are an integral part of the financial statements.
Financial Highlights
Fidelity Advisor Biotechnology Fund Class A
| Years ended July 31, | 2021 | 2020 | 2019 | 2018 | 2017 |
| Selected Per–Share Data | |||||
| Net asset value, beginning of period | $31.03 | $25.48 | $27.80 | $24.45 | $21.39 |
| Income from Investment Operations | |||||
| Net investment income (loss)A | .07 | .03 | .03 | (.14) | (.15)B |
| Net realized and unrealized gain (loss) | 4.42 | 7.40 | (1.76) | 3.49 | 3.21 |
| Total from investment operations | 4.49 | 7.43 | (1.73) | 3.35 | 3.06 |
| Distributions from net investment income | (.13) | – | – | – | – |
| Distributions from net realized gain | (2.81) | (1.88) | (.59) | – | – |
| Total distributions | (2.94) | (1.88) | (.59) | – | – |
| Redemption fees added to paid in capitalA | – | – | – | – | –C |
| Net asset value, end of period | $32.58 | $31.03 | $25.48 | $27.80 | $24.45 |
| Total ReturnD,E | 14.03% | 30.00% | (6.17)% | 13.70% | 14.31% |
| Ratios to Average Net AssetsF,G | |||||
| Expenses before reductions | 1.01% | 1.02% | 1.04% | 1.06% | 1.05% |
| Expenses net of fee waivers, if any | 1.00% | 1.02% | 1.03% | 1.06% | 1.05% |
| Expenses net of all reductions | 1.00% | 1.02% | 1.03% | 1.06% | 1.04% |
| Net investment income (loss) | .20% | .11% | .13% | (.53)% | (.69)%B |
| Supplemental Data | |||||
| Net assets, end of period (000 omitted) | $808,610 | $722,896 | $616,894 | $766,303 | $787,802 |
| Portfolio turnover rateH | 72% | 66% | 62% | 45% | 30% |
A Calculated based on average shares outstanding during the period.
B Net investment income per share reflects one or more large, non-recurring dividend(s) which amounted to $.01 per share. Excluding such non-recurring dividend(s), the ratio of net investment income (loss) to average net assets would have been (.71) %.
C Amount represents less than $.005 per share.
D Total returns would have been lower if certain expenses had not been reduced during the applicable periods shown.
E Total returns do not include the effect of the sales charges.
F Fees and expenses of any underlying mutual funds or exchange-traded funds (ETFs) are not included in the Fund's expense ratio. The Fund indirectly bears its proportionate share of these expenses. For additional expense information related to investments in Fidelity Central Funds, please refer to the "Investments in Fidelity Central Funds" note found in the Notes to Financial Statements section of the most recent Annual or Semi-Annual report.
G Expense ratios reflect operating expenses of the class. Expenses before reductions do not reflect amounts reimbursed, waived, or reduced through arrangements with the investment adviser, brokerage services, or other offset arrangements, if applicable, and do not represent the amount paid by the class during periods when reimbursements, waivers or reductions occur.
H Amount does not include the portfolio activity of any underlying mutual funds or exchange-traded funds (ETFs).
See accompanying notes which are an integral part of the financial statements.
Fidelity Advisor Biotechnology Fund Class M
| Years ended July 31, | 2021 | 2020 | 2019 | 2018 | 2017 |
| Selected Per–Share Data | |||||
| Net asset value, beginning of period | $29.08 | $24.02 | $26.32 | $23.22 | $20.39 |
| Income from Investment Operations | |||||
| Net investment income (loss)A | (.02) | (.05) | (.04) | (.21) | (.21)B |
| Net realized and unrealized gain (loss) | 4.14 | 6.96 | (1.67) | 3.31 | 3.04 |
| Total from investment operations | 4.12 | 6.91 | (1.71) | 3.10 | 2.83 |
| Distributions from net investment income | (.07) | – | – | – | – |
| Distributions from net realized gain | (2.78) | (1.85) | (.59) | – | – |
| Total distributions | (2.85) | (1.85) | (.59) | – | – |
| Redemption fees added to paid in capitalA | – | – | – | – | –C |
| Net asset value, end of period | $30.35 | $29.08 | $24.02 | $26.32 | $23.22 |
| Total ReturnD,E | 13.69% | 29.64% | (6.44)% | 13.35% | 13.88% |
| Ratios to Average Net AssetsF,G | |||||
| Expenses before reductions | 1.28% | 1.32% | 1.34% | 1.38% | 1.38% |
| Expenses net of fee waivers, if any | 1.28% | 1.32% | 1.34% | 1.38% | 1.38% |
| Expenses net of all reductions | 1.28% | 1.31% | 1.34% | 1.38% | 1.38% |
| Net investment income (loss) | (.07)% | (.18)% | (.18)% | (.84)% | (1.02)%B |
| Supplemental Data | |||||
| Net assets, end of period (000 omitted) | $161,619 | $144,568 | $119,312 | $135,879 | $127,734 |
| Portfolio turnover rateH | 72% | 66% | 62% | 45% | 30% |
A Calculated based on average shares outstanding during the period.
B Net investment income per share reflects one or more large, non-recurring dividend(s) which amounted to $.01 per share. Excluding such non-recurring dividend(s), the ratio of net investment income (loss) to average net assets would have been (1.05) %.
C Amount represents less than $.005 per share.
D Total returns would have been lower if certain expenses had not been reduced during the applicable periods shown.
E Total returns do not include the effect of the sales charges.
F Fees and expenses of any underlying mutual funds or exchange-traded funds (ETFs) are not included in the Fund's expense ratio. The Fund indirectly bears its proportionate share of these expenses. For additional expense information related to investments in Fidelity Central Funds, please refer to the "Investments in Fidelity Central Funds" note found in the Notes to Financial Statements section of the most recent Annual or Semi-Annual report.
G Expense ratios reflect operating expenses of the class. Expenses before reductions do not reflect amounts reimbursed, waived, or reduced through arrangements with the investment adviser, brokerage services, or other offset arrangements, if applicable, and do not represent the amount paid by the class during periods when reimbursements, waivers or reductions occur.
H Amount does not include the portfolio activity of any underlying mutual funds or exchange-traded funds (ETFs).
See accompanying notes which are an integral part of the financial statements.
Fidelity Advisor Biotechnology Fund Class C
| Years ended July 31, | 2021 | 2020 | 2019 | 2018 | 2017 |
| Selected Per–Share Data | |||||
| Net asset value, beginning of period | $25.97 | $21.71 | $23.96 | $21.23 | $18.71 |
| Income from Investment Operations | |||||
| Net investment income (loss)A | (.15) | (.15) | (.14) | (.29) | (.27)B |
| Net realized and unrealized gain (loss) | 3.71 | 6.26 | (1.52) | 3.02 | 2.79 |
| Total from investment operations | 3.56 | 6.11 | (1.66) | 2.73 | 2.52 |
| Distributions from net investment income | (.01) | – | – | – | – |
| Distributions from net realized gain | (2.73) | (1.85) | (.59) | – | – |
| Total distributions | (2.74) | (1.85) | (.59) | – | – |
| Redemption fees added to paid in capitalA | – | – | – | – | –C |
| Net asset value, end of period | $26.79 | $25.97 | $21.71 | $23.96 | $21.23 |
| Total ReturnD,E | 13.15% | 29.07% | (6.87)% | 12.86% | 13.47% |
| Ratios to Average Net AssetsF,G | |||||
| Expenses before reductions | 1.75% | 1.77% | 1.78% | 1.80% | 1.79% |
| Expenses net of fee waivers, if any | 1.75% | 1.77% | 1.77% | 1.80% | 1.79% |
| Expenses net of all reductions | 1.75% | 1.76% | 1.77% | 1.80% | 1.79% |
| Net investment income (loss) | (.55)% | (.63)% | (.61)% | (1.27)% | (1.43)%B |
| Supplemental Data | |||||
| Net assets, end of period (000 omitted) | $328,417 | $384,420 | $398,749 | $558,420 | $593,489 |
| Portfolio turnover rateH | 72% | 66% | 62% | 45% | 30% |
A Calculated based on average shares outstanding during the period.
B Net investment income per share reflects one or more large, non-recurring dividend(s) which amounted to $.01 per share. Excluding such non-recurring dividend(s), the ratio of net investment income (loss) to average net assets would have been (1.46) %.
C Amount represents less than $.005 per share.
D Total returns would have been lower if certain expenses had not been reduced during the applicable periods shown.
E Total returns do not include the effect of the contingent deferred sales charge.
F Fees and expenses of any underlying mutual funds or exchange-traded funds (ETFs) are not included in the Fund's expense ratio. The Fund indirectly bears its proportionate share of these expenses. For additional expense information related to investments in Fidelity Central Funds, please refer to the "Investments in Fidelity Central Funds" note found in the Notes to Financial Statements section of the most recent Annual or Semi-Annual report.
G Expense ratios reflect operating expenses of the class. Expenses before reductions do not reflect amounts reimbursed, waived, or reduced through arrangements with the investment adviser, brokerage services, or other offset arrangements, if applicable, and do not represent the amount paid by the class during periods when reimbursements, waivers or reductions occur.
H Amount does not include the portfolio activity of any underlying mutual funds or exchange-traded funds (ETFs).
See accompanying notes which are an integral part of the financial statements.
Fidelity Advisor Biotechnology Fund Class I
| Years ended July 31, | 2021 | 2020 | 2019 | 2018 | 2017 |
| Selected Per–Share Data | |||||
| Net asset value, beginning of period | $33.16 | $27.08 | $29.42 | $25.80 | $22.52 |
| Income from Investment Operations | |||||
| Net investment income (loss)A | .17 | .11 | .11 | (.07) | (.10)B |
| Net realized and unrealized gain (loss) | 4.72 | 7.88 | (1.86) | 3.69 | 3.38 |
| Total from investment operations | 4.89 | 7.99 | (1.75) | 3.62 | 3.28 |
| Distributions from net investment income | (.21) | – | – | – | – |
| Distributions from net realized gain | (2.85) | (1.91) | (.59) | – | – |
| Total distributions | (3.05)C | (1.91) | (.59) | – | – |
| Redemption fees added to paid in capitalA | – | – | – | – | –D |
| Net asset value, end of period | $35.00 | $33.16 | $27.08 | $29.42 | $25.80 |
| Total ReturnE | 14.34% | 30.32% | (5.89)% | 14.03% | 14.56% |
| Ratios to Average Net AssetsF,G | |||||
| Expenses before reductions | .74% | .75% | .76% | .79% | .78% |
| Expenses net of fee waivers, if any | .74% | .75% | .76% | .79% | .78% |
| Expenses net of all reductions | .74% | .75% | .76% | .79% | .77% |
| Net investment income (loss) | .47% | .38% | .40% | (.26)% | (.42)%B |
| Supplemental Data | |||||
| Net assets, end of period (000 omitted) | $1,129,492 | $1,092,145 | $1,006,084 | $1,307,833 | $1,156,358 |
| Portfolio turnover rateH | 72% | 66% | 62% | 45% | 30% |
A Calculated based on average shares outstanding during the period.
B Net investment income per share reflects one or more large, non-recurring dividend(s) which amounted to $.01 per share. Excluding such non-recurring dividend(s), the ratio of net investment income (loss) to average net assets would have been (.44) %.
C Total distributions per share do not sum due to rounding.
D Amount represents less than $.005 per share.
E Total returns would have been lower if certain expenses had not been reduced during the applicable periods shown.
F Fees and expenses of any underlying mutual funds or exchange-traded funds (ETFs) are not included in the Fund's expense ratio. The Fund indirectly bears its proportionate share of these expenses. For additional expense information related to investments in Fidelity Central Funds, please refer to the "Investments in Fidelity Central Funds" note found in the Notes to Financial Statements section of the most recent Annual or Semi-Annual report.
G Expense ratios reflect operating expenses of the class. Expenses before reductions do not reflect amounts reimbursed, waived, or reduced through arrangements with the investment adviser, brokerage services, or other offset arrangements, if applicable, and do not represent the amount paid by the class during periods when reimbursements, waivers or reductions occur.
H Amount does not include the portfolio activity of any underlying mutual funds or exchange-traded funds (ETFs).
See accompanying notes which are an integral part of the financial statements.
Fidelity Advisor Biotechnology Fund Class Z
| Years ended July 31, | 2021 | 2020 | 2019 A |
| Selected Per–Share Data | |||
| Net asset value, beginning of period | $33.22 | $27.10 | $30.06 |
| Income from Investment Operations | |||
| Net investment income (loss)B | .21 | .15 | .16 |
| Net realized and unrealized gain (loss) | 4.74 | 7.90 | (2.53) |
| Total from investment operations | 4.95 | 8.05 | (2.37) |
| Distributions from net investment income | (.26) | (.02) | – |
| Distributions from net realized gain | (2.87) | (1.91) | (.59) |
| Total distributions | (3.12)C | (1.93) | (.59) |
| Redemption fees added to paid in capitalB | – | – | – |
| Net asset value, end of period | $35.05 | $33.22 | $27.10 |
| Total ReturnD,E | 14.49% | 30.53% | (7.83)% |
| Ratios to Average Net AssetsF,G | |||
| Expenses before reductions | .61% | .62% | .63%H |
| Expenses net of fee waivers, if any | .61% | .62% | .63%H |
| Expenses net of all reductions | .61% | .62% | .62%H |
| Net investment income (loss) | .60% | .51% | .73%H |
| Supplemental Data | |||
| Net assets, end of period (000 omitted) | $89,641 | $62,743 | $30,116 |
| Portfolio turnover rateI | 72% | 66% | 62%H |
A For the period October 2, 2018 (commencement of sale of shares) to July 31, 2019.
B Calculated based on average shares outstanding during the period.
C Total distributions per share do not sum due to rounding.
D Total returns for periods of less than one year are not annualized.
E Total returns would have been lower if certain expenses had not been reduced during the applicable periods shown.
F Fees and expenses of any underlying mutual funds or exchange-traded funds (ETFs) are not included in the Fund's expense ratio. The Fund indirectly bears its proportionate share of these expenses. For additional expense information related to investments in Fidelity Central Funds, please refer to the "Investments in Fidelity Central Funds" note found in the Notes to Financial Statements section of the most recent Annual or Semi-Annual report.
G Expense ratios reflect operating expenses of the class. Expenses before reductions do not reflect amounts reimbursed, waived, or reduced through arrangements with the investment adviser, brokerage services, or other offset arrangements, if applicable, and do not represent the amount paid by the class during periods when reimbursements, waivers or reductions occur.
H Annualized
I Amount does not include the portfolio activity of any underlying mutual funds or exchange-traded funds (ETFs).
See accompanying notes which are an integral part of the financial statements.
Fidelity Advisor® Communications Equipment Fund
Performance: The Bottom Line
Average annual total return reflects the change in the value of an investment, assuming reinvestment of distributions from dividend income and capital gains (the profits earned upon the sale of securities that have grown in value, if any) and assuming a constant rate of performance each year. The hypothetical investment and the average annual total returns do not reflect the deduction of taxes that a shareholder would pay on fund distributions or the redemption of fund shares. During periods of reimbursement by Fidelity, a fund’s total return will be greater than it would be had the reimbursement not occurred. How a fund did yesterday is no guarantee of how it will do tomorrow.
Average Annual Total Returns
| For the periods ended July 31, 2021 | Past 1 year | Past 5 years | Past 10 years |
| Class A (incl. 5.75% sales charge) | 21.02% | 10.12% | 7.89% |
| Class M (incl. 3.50% sales charge) | 23.62% | 10.38% | 7.88% |
| Class C (incl. contingent deferred sales charge) | 26.44% | 10.61% | 7.88% |
| Class I | 28.74 % | 11.73% | 8.80% |
Class C shares' contingent deferred sales charges included in the past one year, past five years and past ten years total return figures are 1%, 0% and 0%, respectively.
$10,000 Over 10 Years
Let's say hypothetically that $10,000 was invested in Fidelity Advisor® Communications Equipment Fund - Class A on July 31, 2011, and the current 5.75% sales charge was paid.
The chart shows how the value of your investment would have changed, and also shows how the S&P 500® Index performed over the same period.
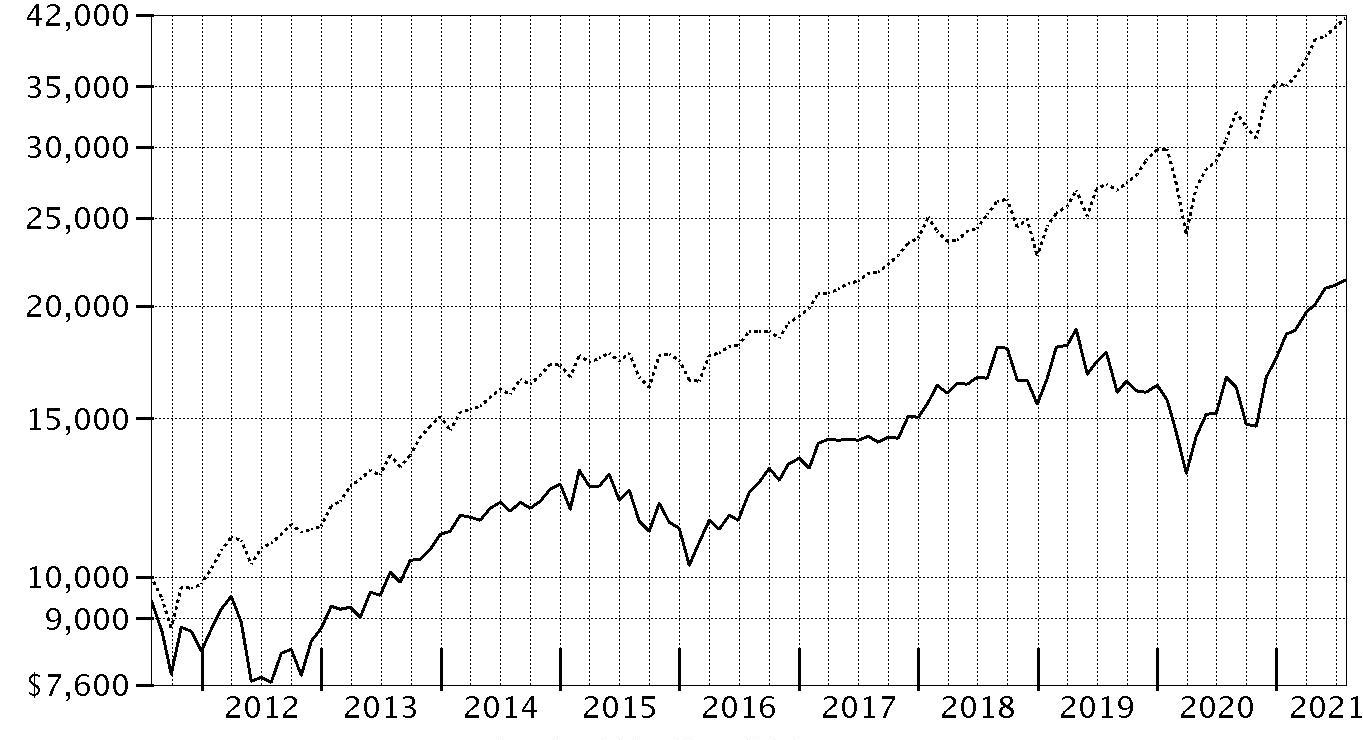
| Period Ending Values | ||
|
| $21,373 | Fidelity Advisor® Communications Equipment Fund - Class A |
|
| $41,689 | S&P 500® Index |
Fidelity Advisor® Communications Equipment Fund
Management's Discussion of Fund Performance
Market Recap: The S&P 500® index gained 36.45% for the 12 months ending July 31, 2021, as U.S. equities continued a historic rebound following a steep but brief decline due to the early-2020 outbreak and spread of COVID-19. A confluence of powerful forces propelled risk assets, returning the stock market to pre-pandemic highs by late August 2020. The rally slowed in September, when stocks began a two-month retreat amid Congress’s inability to reach a deal on additional fiscal stimulus, as well as uncertainty about the election. But as the calendar turned, investors grew hopeful. The rollout of three COVID-19 vaccines was underway, the U.S. Federal Reserve pledged to hold interest rates near zero until the economy recovered, and the federal government planned to deploy trillions of dollars to boost consumers and the economy. This backdrop fueled a sharp rotation, with small-cap value usurping leadership from large growth. As part of the “reopening” theme, investors moved out of tech-driven mega-caps that had thrived due to the work-from-home trend in favor of cheap smaller companies that stood to benefit from a broad cyclical recovery. A flattish May reflected concerns about inflation and jobs, but the uptrend resumed through July, driven by corporate earnings. Notably, this leg saw momentum shift back to large growth, as easing rates and a hawkish Fed stymied the reflation trade. By sector, financials (+55%) led, driven by banks (+63%), whereas utilities (+12%) and consumer staples (+18%) notably lagged. Comments from Portfolio Manager Caroline Tall: For the fiscal year ending July 31, 2021, the fund's share classes (excluding sales charges, if applicable) gained roughly 27% to 29%, roughly in line with the 27.58% gain of the MSCI North America IMI + ADR Custom Communications Equipment 25/50 Linked Index, but underperforming the broad-based S&P 500® index. Versus the industry index, out-of-index exposure to the systems software industry was a meaningful contributor. Security selection in communications equipment also lifted the fund's relative result. Our top individual relative contributor was an out-of-index stake in Cloudflare (+197%). Also boosting value was our outsized stake in Calix Networks, which gained about 133%. Calix Networks was among our largest holdings. Another notable relative contributor was our lighter-than-index stake in index heavyweight Cisco Systems (+21%), which was the fund's biggest holding. Conversely, the primary detractor from performance versus the industry index was a small non-index stake in internet services & infrastructure. Security selection in application software also hindered relative performance. The biggest individual relative detractor was an underweight position in Nokia (+27%), which was among the fund's largest holdings. The fund's non-index stake in Ping Identity Holding, a position not held at period end, returned -34%. Another notable relative detractor was an underweighting in Arista Networks (+46%).The views expressed above reflect those of the portfolio manager(s) only through the end of the period as stated on the cover of this report and do not necessarily represent the views of Fidelity or any other person in the Fidelity organization. Any such views are subject to change at any time based upon market or other conditions and Fidelity disclaims any responsibility to update such views. These views may not be relied on as investment advice and, because investment decisions for a Fidelity fund are based on numerous factors, may not be relied on as an indication of trading intent on behalf of any Fidelity fund.
Fidelity Advisor® Communications Equipment Fund
Investment Summary (Unaudited)
Top Ten Stocks as of July 31, 2021
| % of fund's net assets | |
| Cisco Systems, Inc. | 24.3 |
| Ericsson (B Shares) sponsored ADR | 14.4 |
| Motorola Solutions, Inc. | 6.2 |
| Nokia Corp. sponsored ADR | 5.3 |
| Ciena Corp. | 5.0 |
| F5 Networks, Inc. | 4.9 |
| Calix, Inc. | 4.7 |
| Juniper Networks, Inc. | 4.5 |
| Lumentum Holdings, Inc. | 3.8 |
| CommScope Holding Co., Inc. | 3.7 |
| 76.8 |
Top Industries (% of fund's net assets)
| As of July 31, 2021 | ||
| Communications Equipment | 97.7% | |
| Software | 2.3% | |
| IT Services | 0.5% | |
| All Others*,** | (0.5)% | |

* Includes short-term investments and net other assets (liabilities).
** Not included in pie chart.
Fidelity Advisor® Communications Equipment Fund
Schedule of Investments July 31, 2021
Showing Percentage of Net Assets
| Common Stocks - 100.5% | |||
| Shares | Value | ||
| Communications Equipment - 97.7% | |||
| Communications Equipment - 97.7% | |||
| ADTRAN, Inc. | 14,479 | $324,474 | |
| Arista Networks, Inc. (a) | 1,605 | 610,526 | |
| Calix, Inc. (a) | 19,773 | 924,981 | |
| Cambium Networks Corp. (a) | 6,233 | 274,564 | |
| Casa Systems, Inc. (a) | 7,819 | 58,721 | |
| Ciena Corp. (a) | 16,757 | 974,252 | |
| Cisco Systems, Inc. | 85,862 | 4,754,180 | |
| CommScope Holding Co., Inc. (a) | 34,170 | 723,037 | |
| Digi International, Inc. (a) | 6,780 | 140,210 | |
| EchoStar Holding Corp. Class A (a)(b) | 14,786 | 329,728 | |
| Ericsson (B Shares) sponsored ADR | 244,105 | 2,814,531 | |
| Evertz Technologies Ltd. | 4,790 | 54,749 | |
| Extreme Networks, Inc. (a) | 30,409 | 334,803 | |
| F5 Networks, Inc. (a) | 4,620 | 954,076 | |
| Harmonic, Inc. (a) | 16,874 | 149,335 | |
| Inseego Corp. (a)(b) | 7,934 | 68,946 | |
| Juniper Networks, Inc. | 31,111 | 875,464 | |
| Lumentum Holdings, Inc. (a) | 8,885 | 746,251 | |
| Motorola Solutions, Inc. | 5,401 | 1,209,392 | |
| NetScout Systems, Inc. (a) | 13,120 | 377,331 | |
| Nokia Corp. sponsored ADR (a) | 168,968 | 1,027,325 | |
| Radware Ltd. (a) | 19 | 612 | |
| Ribbon Communications, Inc. (a) | 10,842 | 74,918 | |
| Sierra Wireless, Inc. (a) | 10,356 | 199,965 | |
| ViaSat, Inc. (a) | 10,273 | 509,952 | |
| Viavi Solutions, Inc. (a) | 35,058 | 585,118 | |
| 19,097,441 | |||
| Electronic Equipment & Components - 0.0% | |||
| Electronic Components - 0.0% | |||
| Corning, Inc. | 33 | 1,381 | |
| IT Services - 0.5% | |||
| Internet Services & Infrastructure - 0.5% | |||
| Rackspace Technology, Inc. (a)(b) | 5,027 | 89,229 | |
| Software - 2.3% | |||
| Application Software - 0.1% | |||
| Citrix Systems, Inc. | 1 | 101 | |
| Smith Micro Software, Inc. (a) | 2,800 | 15,848 | |
| 15,949 | |||
| Systems Software - 2.2% | |||
| Cloudflare, Inc. (a) | 2,682 | 318,166 | |
| Fortinet, Inc. (a) | 436 | 118,697 | |
| 436,863 | |||
| TOTAL SOFTWARE | 452,812 | ||
| TOTAL COMMON STOCKS | |||
| (Cost $11,460,865) | 19,640,863 | ||
| Money Market Funds - 0.8% | |||
| Fidelity Securities Lending Cash Central Fund 0.06% (c)(d) | |||
| (Cost $158,575) | 158,559 | 158,575 | |
| TOTAL INVESTMENT IN SECURITIES - 101.3% | |||
| (Cost $11,619,440) | 19,799,438 | ||
| NET OTHER ASSETS (LIABILITIES) - (1.3)% | (257,522) | ||
| NET ASSETS - 100% | $19,541,916 |
Legend
(a) Non-income producing
(b) Security or a portion of the security is on loan at period end.
(c) Investment made with cash collateral received from securities on loan.
(d) Affiliated fund that is generally available only to investment companies and other accounts managed by Fidelity Investments. The rate quoted is the annualized seven-day yield of the fund at period end. A complete unaudited listing of the fund's holdings as of its most recent quarter end is available upon request. In addition, each Fidelity Central Fund's financial statements, which are not covered by the Fund's Report of Independent Registered Public Accounting Firm, are available on the SEC's website or upon request.
Affiliated Central Funds
Information regarding fiscal year to date income earned by the Fund from investments in Fidelity Central Funds is as follows:
| Fund | Income earned |
| Fidelity Cash Central Fund | $299 |
| Fidelity Securities Lending Cash Central Fund | 5,889 |
| Total | $6,188 |
Amounts in the income column in the above table include any capital gain distributions from underlying funds, which are presented in the corresponding line-item in the Statement of Operations, if applicable. Amount for Fidelity Securities Lending Cash Central Fund represents the income earned on investing cash collateral, less rebates paid to borrowers and any lending agent fees associated with the loan, plus any premium payments received for lending certain types of securities.
Fiscal year to date information regarding the Fund's investments in Fidelity Central Funds, including the ownership percentage, is presented below.
| Fund | Value, beginning of period | Purchases | Sales Proceeds | Realized Gain/Loss | Change in Unrealized appreciation (depreciation) | Value, end of period | % ownership, end of period |
| Fidelity Cash Central Fund 0.06% | $810,855 | $8,309,844 | $9,120,663 | $(36) | $-- | $-- | 0.0% |
| Fidelity Securities Lending Cash Central Fund 0.06% | 266,925 | 7,715,285 | 7,823,635 | -- | -- | 158,575 | 0.0% |
| Total | $1,077,780 | $16,025,129 | $16,944,298 | $(36) | $-- | $158,575 |
Investment Valuation
The following is a summary of the inputs used, as of July 31, 2021, involving the Fund's assets and liabilities carried at fair value. The inputs or methodology used for valuing securities may not be an indication of the risk associated with investing in those securities. For more information on valuation inputs, and their aggregation into the levels used below, please refer to the Investment Valuation section in the accompanying Notes to Financial Statements.
| Valuation Inputs at Reporting Date: | ||||
| Description | Total | Level 1 | Level 2 | Level 3 |
| Investments in Securities: | ||||
| Common Stocks | $19,640,863 | $19,640,863 | $-- | $-- |
| Money Market Funds | 158,575 | 158,575 | -- | -- |
| Total Investments in Securities: | $19,799,438 | $19,799,438 | $-- | $-- |
Other Information
Distribution of investments by country or territory of incorporation, as a percentage of Total Net Assets, is as follows (Unaudited):
| United States of America | 77.6% |
| Sweden | 14.4% |
| Finland | 5.3% |
| Cayman Islands | 1.4% |
| Canada | 1.3% |
| Others (Individually Less Than 1%) | 0.0% |
| 100.0% |
See accompanying notes which are an integral part of the financial statements.
Fidelity Advisor® Communications Equipment Fund
Financial Statements
Statement of Assets and Liabilities
| July 31, 2021 | ||
| Assets | ||
| Investment in securities, at value (including securities loaned of $149,810) — See accompanying schedule: Unaffiliated issuers (cost $11,460,865) | $19,640,863 | |
| Fidelity Central Funds (cost $158,575) | 158,575 | |
| Total Investment in Securities (cost $11,619,440) | $19,799,438 | |
| Receivable for investments sold | 645,198 | |
| Distributions receivable from Fidelity Central Funds | 48 | |
| Prepaid expenses | 87 | |
| Other receivables | 651 | |
| Total assets | 20,445,422 | |
| Liabilities | ||
| Payable to custodian bank | $506,599 | |
| Payable for fund shares redeemed | 178,420 | |
| Accrued management fee | 10,795 | |
| Distribution and service plan fees payable | 6,057 | |
| Other affiliated payables | 5,480 | |
| Other payables and accrued expenses | 37,805 | |
| Collateral on securities loaned | 158,350 | |
| Total liabilities | 903,506 | |
| Net Assets | $19,541,916 | |
| Net Assets consist of: | ||
| Paid in capital | $10,539,033 | |
| Total accumulated earnings (loss) | 9,002,883 | |
| Net Assets | $19,541,916 | |
| Net Asset Value and Maximum Offering Price | ||
| Class A: | ||
| Net Asset Value and redemption price per share ($10,484,689 ÷ 553,563 shares)(a) | $18.94 | |
| Maximum offering price per share (100/94.25 of $18.94) | $20.10 | |
| Class M: | ||
| Net Asset Value and redemption price per share ($4,746,728 ÷ 263,010 shares)(a) | $18.05 | |
| Maximum offering price per share (100/96.50 of $18.05) | $18.70 | |
| Class C: | ||
| Net Asset Value and offering price per share ($1,853,343 ÷ 114,356 shares)(a) | $16.21 | |
| Class I: | ||
| Net Asset Value, offering price and redemption price per share ($2,457,156 ÷ 123,543 shares) | $19.89 |
(a) Redemption price per share is equal to net asset value less any applicable contingent deferred sales charge.
See accompanying notes which are an integral part of the financial statements.
Statement of Operations
| Year ended July 31, 2021 | ||
| Investment Income | ||
| Dividends | $225,461 | |
| Income from Fidelity Central Funds (including $5,889 from security lending) | 6,188 | |
| Total income | 231,649 | |
| Expenses | ||
| Management fee | $105,683 | |
| Transfer agent fees | 53,664 | |
| Distribution and service plan fees | 75,328 | |
| Accounting fees | 7,801 | |
| Custodian fees and expenses | 8,430 | |
| Independent trustees' fees and expenses | 85 | |
| Registration fees | 52,306 | |
| Audit | 45,557 | |
| Legal | 244 | |
| Miscellaneous | 196 | |
| Total expenses before reductions | 349,294 | |
| Expense reductions | (44,595) | |
| Total expenses after reductions | 304,699 | |
| Net investment income (loss) | (73,050) | |
| Realized and Unrealized Gain (Loss) | ||
| Net realized gain (loss) on: | ||
| Investment securities: | ||
| Unaffiliated issuers | 2,250,915 | |
| Fidelity Central Funds | (36) | |
| Foreign currency transactions | 174 | |
| Total net realized gain (loss) | 2,251,053 | |
| Change in net unrealized appreciation (depreciation) on: | ||
| Investment securities: | ||
| Unaffiliated issuers | 2,789,919 | |
| Assets and liabilities in foreign currencies | (1) | |
| Total change in net unrealized appreciation (depreciation) | 2,789,918 | |
| Net gain (loss) | 5,040,971 | |
| Net increase (decrease) in net assets resulting from operations | $4,967,921 |
See accompanying notes which are an integral part of the financial statements.
Statement of Changes in Net Assets
| Year ended July 31, 2021 | Year ended July 31, 2020 | |
| Increase (Decrease) in Net Assets | ||
| Operations | ||
| Net investment income (loss) | $(73,050) | $(73,819) |
| Net realized gain (loss) | 2,251,053 | (974,368) |
| Change in net unrealized appreciation (depreciation) | 2,789,918 | (1,126,563) |
| Net increase (decrease) in net assets resulting from operations | 4,967,921 | (2,174,750) |
| Share transactions - net increase (decrease) | (4,536,847) | (8,916,500) |
| Total increase (decrease) in net assets | 431,074 | (11,091,250) |
| Net Assets | ||
| Beginning of period | 19,110,842 | 30,202,092 |
| End of period | $19,541,916 | $19,110,842 |
See accompanying notes which are an integral part of the financial statements.
Financial Highlights
Fidelity Advisor Communications Equipment Fund Class A
| Years ended July 31, | 2021 | 2020 | 2019 | 2018 | 2017 |
| Selected Per–Share Data | |||||
| Net asset value, beginning of period | $14.75 | $15.76 | $15.17 | $13.69 | $12.09 |
| Income from Investment Operations | |||||
| Net investment income (loss)A | (.04) | (.03) | (.01) | .03 | .07 |
| Net realized and unrealized gain (loss) | 4.23 | (.98) | 1.04 | 2.08 | 1.76 |
| Total from investment operations | 4.19 | (1.01) | 1.03 | 2.11 | 1.83 |
| Distributions from net investment income | – | – | – | (.04)B | (.05) |
| Distributions from net realized gain | – | – | (.44) | (.59)B | (.18) |
| Total distributions | – | – | (.44) | (.63) | (.23) |
| Redemption fees added to paid in capitalA | – | – | – | –C | –C |
| Net asset value, end of period | $18.94 | $14.75 | $15.76 | $15.17 | $13.69 |
| Total ReturnD,E | 28.41% | (6.41)% | 7.09% | 15.86% | 15.24% |
| Ratios to Average Net AssetsF,G | |||||
| Expenses before reductions | 1.63% | 1.64% | 1.47% | 1.76% | 1.78% |
| Expenses net of fee waivers, if any | 1.40% | 1.41% | 1.40% | 1.40% | 1.40% |
| Expenses net of all reductions | 1.39% | 1.37% | 1.39% | 1.39% | 1.39% |
| Net investment income (loss) | (.24)% | (.20)% | (.09)% | .21% | .56% |
| Supplemental Data | |||||
| Net assets, end of period (000 omitted) | $10,485 | $10,654 | $14,991 | $8,860 | $6,247 |
| Portfolio turnover rateH | 63% | 138% | 98% | 60% | 71% |
A Calculated based on average shares outstanding during the period.
B The amounts shown reflect certain reclassifications related to book to tax differences that were made in the year shown.
C Amount represents less than $.005 per share.
D Total returns would have been lower if certain expenses had not been reduced during the applicable periods shown.
E Total returns do not include the effect of the sales charges.
F Fees and expenses of any underlying mutual funds or exchange-traded funds (ETFs) are not included in the Fund's expense ratio. The Fund indirectly bears its proportionate share of these expenses. For additional expense information related to investments in Fidelity Central Funds, please refer to the "Investments in Fidelity Central Funds" note found in the Notes to Financial Statements section of the most recent Annual or Semi-Annual report.
G Expense ratios reflect operating expenses of the class. Expenses before reductions do not reflect amounts reimbursed, waived, or reduced through arrangements with the investment adviser, brokerage services, or other offset arrangements, if applicable, and do not represent the amount paid by the class during periods when reimbursements, waivers or reductions occur.
H Amount does not include the portfolio activity of any underlying mutual funds or exchange-traded funds (ETFs).
See accompanying notes which are an integral part of the financial statements.
Fidelity Advisor Communications Equipment Fund Class M
| Years ended July 31, | 2021 | 2020 | 2019 | 2018 | 2017 |
| Selected Per–Share Data | |||||
| Net asset value, beginning of period | $14.09 | $15.09 | $14.59 | $13.18 | $11.65 |
| Income from Investment Operations | |||||
| Net investment income (loss)A | (.08) | (.06) | (.05) | – | .04 |
| Net realized and unrealized gain (loss) | 4.04 | (.94) | .99 | 2.00 | 1.69 |
| Total from investment operations | 3.96 | (1.00) | .94 | 2.00 | 1.73 |
| Distributions from net investment income | – | – | – | (.02)B | (.02) |
| Distributions from net realized gain | – | – | (.44) | (.57)B | (.18) |
| Total distributions | – | – | (.44) | (.59) | (.20) |
| Redemption fees added to paid in capitalA | – | – | – | –C | –C |
| Net asset value, end of period | $18.05 | $14.09 | $15.09 | $14.59 | $13.18 |
| Total ReturnD,E | 28.11% | (6.63)% | 6.75% | 15.69% | 14.94% |
| Ratios to Average Net AssetsF,G | |||||
| Expenses before reductions | 1.90% | 1.91% | 1.80% | 2.11% | 2.11% |
| Expenses net of fee waivers, if any | 1.65% | 1.66% | 1.65% | 1.65% | 1.65% |
| Expenses net of all reductions | 1.64% | 1.62% | 1.64% | 1.64% | 1.64% |
| Net investment income (loss) | (.49)% | (.45)% | (.34)% | (.04)% | .31% |
| Supplemental Data | |||||
| Net assets, end of period (000 omitted) | $4,747 | $4,197 | $5,242 | $4,943 | $4,236 |
| Portfolio turnover rateH | 63% | 138% | 98% | 60% | 71% |
A Calculated based on average shares outstanding during the period.
B The amounts shown reflect certain reclassifications related to book to tax differences that were made in the year shown.
C Amount represents less than $.005 per share.
D Total returns would have been lower if certain expenses had not been reduced during the applicable periods shown.
E Total returns do not include the effect of the sales charges.
F Fees and expenses of any underlying mutual funds or exchange-traded funds (ETFs) are not included in the Fund's expense ratio. The Fund indirectly bears its proportionate share of these expenses. For additional expense information related to investments in Fidelity Central Funds, please refer to the "Investments in Fidelity Central Funds" note found in the Notes to Financial Statements section of the most recent Annual or Semi-Annual report.
G Expense ratios reflect operating expenses of the class. Expenses before reductions do not reflect amounts reimbursed, waived, or reduced through arrangements with the investment adviser, brokerage services, or other offset arrangements, if applicable, and do not represent the amount paid by the class during periods when reimbursements, waivers or reductions occur.
H Amount does not include the portfolio activity of any underlying mutual funds or exchange-traded funds (ETFs).
See accompanying notes which are an integral part of the financial statements.
Fidelity Advisor Communications Equipment Fund Class C
| Years ended July 31, | 2021 | 2020 | 2019 | 2018 | 2017 |
| Selected Per–Share Data | |||||
| Net asset value, beginning of period | $12.72 | $13.69 | $13.34 | $12.10 | $10.74 |
| Income from Investment Operations | |||||
| Net investment income (loss)A | (.14) | (.12) | (.11) | (.07) | (.02) |
| Net realized and unrealized gain (loss) | 3.63 | (.85) | .90 | 1.84 | 1.56 |
| Total from investment operations | 3.49 | (.97) | .79 | 1.77 | 1.54 |
| Distributions from net investment income | – | – | – | – | – |
| Distributions from net realized gain | – | – | (.44) | (.53) | (.18) |
| Total distributions | – | – | (.44) | (.53) | (.18) |
| Redemption fees added to paid in capitalA | – | – | – | –B | –B |
| Net asset value, end of period | $16.21 | $12.72 | $13.69 | $13.34 | $12.10 |
| Total ReturnC,D | 27.44% | (7.09)% | 6.25% | 15.06% | 14.39% |
| Ratios to Average Net AssetsE,F | |||||
| Expenses before reductions | 2.42% | 2.42% | 2.28% | 2.54% | 2.55% |
| Expenses net of fee waivers, if any | 2.15% | 2.16% | 2.15% | 2.15% | 2.15% |
| Expenses net of all reductions | 2.15% | 2.12% | 2.14% | 2.14% | 2.14% |
| Net investment income (loss) | (.99)% | (.95)% | (.84)% | (.54)% | (.19)% |
| Supplemental Data | |||||
| Net assets, end of period (000 omitted) | $1,853 | $2,695 | $5,264 | $4,684 | $3,066 |
| Portfolio turnover rateG | 63% | 138% | 98% | 60% | 71% |
A Calculated based on average shares outstanding during the period.
B Amount represents less than $.005 per share.
C Total returns would have been lower if certain expenses had not been reduced during the applicable periods shown.
D Total returns do not include the effect of the contingent deferred sales charge.
E Fees and expenses of any underlying mutual funds or exchange-traded funds (ETFs) are not included in the Fund's expense ratio. The Fund indirectly bears its proportionate share of these expenses. For additional expense information related to investments in Fidelity Central Funds, please refer to the "Investments in Fidelity Central Funds" note found in the Notes to Financial Statements section of the most recent Annual or Semi-Annual report.
F Expense ratios reflect operating expenses of the class. Expenses before reductions do not reflect amounts reimbursed, waived, or reduced through arrangements with the investment adviser, brokerage services, or other offset arrangements, if applicable, and do not represent the amount paid by the class during periods when reimbursements, waivers or reductions occur.
G Amount does not include the portfolio activity of any underlying mutual funds or exchange-traded funds (ETFs).
See accompanying notes which are an integral part of the financial statements.
Fidelity Advisor Communications Equipment Fund Class I
| Years ended July 31, | 2021 | 2020 | 2019 | 2018 | 2017 |
| Selected Per–Share Data | |||||
| Net asset value, beginning of period | $15.45 | $16.47 | $15.79 | $14.22 | $12.54 |
| Income from Investment Operations | |||||
| Net investment income (loss)A | –B | .01 | .03 | .07 | .11 |
| Net realized and unrealized gain (loss) | 4.44 | (1.03) | 1.09 | 2.16 | 1.83 |
| Total from investment operations | 4.44 | (1.02) | 1.12 | 2.23 | 1.94 |
| Distributions from net investment income | – | – | – | (.05)C | (.08) |
| Distributions from net realized gain | – | – | (.44) | (.61)C | (.18) |
| Total distributions | – | – | (.44) | (.66) | (.26) |
| Redemption fees added to paid in capitalA | – | – | – | –B | –B |
| Net asset value, end of period | $19.89 | $15.45 | $16.47 | $15.79 | $14.22 |
| Total ReturnD | 28.74% | (6.19)% | 7.39% | 16.21% | 15.55% |
| Ratios to Average Net AssetsE,F | |||||
| Expenses before reductions | 1.20% | 1.27% | 1.12% | 1.42% | 1.46% |
| Expenses net of fee waivers, if any | 1.15% | 1.16% | 1.12% | 1.15% | 1.15% |
| Expenses net of all reductions | 1.14% | 1.12% | 1.11% | 1.14% | 1.14% |
| Net investment income (loss) | .01% | .05% | .19% | .47% | .81% |
| Supplemental Data | |||||
| Net assets, end of period (000 omitted) | $2,457 | $1,565 | $4,705 | $2,773 | $4,733 |
| Portfolio turnover rateG | 63% | 138% | 98% | 60% | 71% |
A Calculated based on average shares outstanding during the period.
B Amount represents less than $.005 per share.
C The amounts shown reflect certain reclassifications related to book to tax differences that were made in the year shown.
D Total returns would have been lower if certain expenses had not been reduced during the applicable periods shown.
E Fees and expenses of any underlying mutual funds or exchange-traded funds (ETFs) are not included in the Fund's expense ratio. The Fund indirectly bears its proportionate share of these expenses. For additional expense information related to investments in Fidelity Central Funds, please refer to the "Investments in Fidelity Central Funds" note found in the Notes to Financial Statements section of the most recent Annual or Semi-Annual report.
F Expense ratios reflect operating expenses of the class. Expenses before reductions do not reflect amounts reimbursed, waived, or reduced through arrangements with the investment adviser, brokerage services, or other offset arrangements, if applicable, and do not represent the amount paid by the class during periods when reimbursements, waivers or reductions occur.
G Amount does not include the portfolio activity of any underlying mutual funds or exchange-traded funds (ETFs).
See accompanying notes which are an integral part of the financial statements.
Fidelity Advisor® Consumer Discretionary Fund
Performance: The Bottom Line
Average annual total return reflects the change in the value of an investment, assuming reinvestment of distributions from dividend income and capital gains (the profits earned upon the sale of securities that have grown in value, if any) and assuming a constant rate of performance each year. The hypothetical investment and the average annual total returns do not reflect the deduction of taxes that a shareholder would pay on fund distributions or the redemption of fund shares. During periods of reimbursement by Fidelity, a fund’s total return will be greater than it would be had the reimbursement not occurred. How a fund did yesterday is no guarantee of how it will do tomorrow.
Average Annual Total Returns
| For the periods ended July 31, 2021 | Past 1 year | Past 5 years | Past 10 years |
| Class A (incl. 5.75% sales charge) | 29.76% | 16.83% | 15.38% |
| Class M (incl. 3.50% sales charge) | 32.52% | 17.07% | 15.32% |
| Class C (incl. contingent deferred sales charge) | 35.66% | 17.33% | 15.37% |
| Class I | 38.05% | 18.55% | 16.40% |
| Class Z | 38.23% | 18.64% | 16.44% |
Class C shares' contingent deferred sales charges included in the past one year, past five years and past ten years total return figures are 1%, 0% and 0%, respectively.
The initial offering of Class Z shares took place on October 2, 2018. Returns prior to October 2, 2018, are those of Class I.
$10,000 Over 10 Years
Let's say hypothetically that $10,000 was invested in Fidelity Advisor® Consumer Discretionary Fund - Class A on July 31, 2011, and the current 5.75% sales charge was paid.
The chart shows how the value of your investment would have changed, and also shows how the S&P 500® Index performed over the same period.
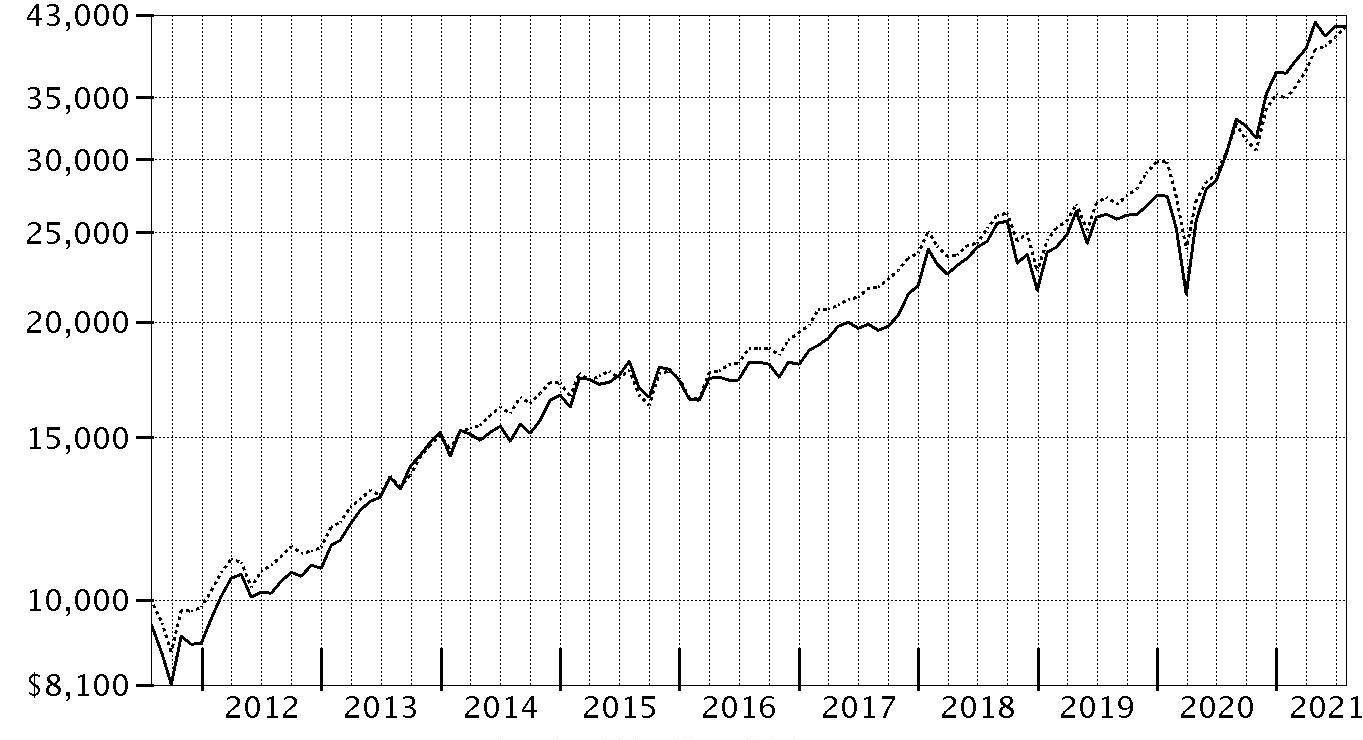
| Period Ending Values | ||
|
| $41,795 | Fidelity Advisor® Consumer Discretionary Fund - Class A |
|
| $41,689 | S&P 500® Index |
Fidelity Advisor® Consumer Discretionary Fund
Management's Discussion of Fund Performance
Market Recap: The S&P 500® index gained 36.45% for the 12 months ending July 31, 2021, as U.S. equities continued a historic rebound following a steep but brief decline due to the early-2020 outbreak and spread of COVID-19. A confluence of powerful forces propelled risk assets, returning the stock market to pre-pandemic highs by late August 2020. The rally slowed in September, when stocks began a two-month retreat amid Congress’s inability to reach a deal on additional fiscal stimulus, as well as uncertainty about the election. But as the calendar turned, investors grew hopeful. The rollout of three COVID-19 vaccines was underway, the U.S. Federal Reserve pledged to hold interest rates near zero until the economy recovered, and the federal government planned to deploy trillions of dollars to boost consumers and the economy. This backdrop fueled a sharp rotation, with small-cap value usurping leadership from large growth. As part of the “reopening” theme, investors moved out of tech-driven mega-caps that had thrived due to the work-from-home trend in favor of cheap smaller companies that stood to benefit from a broad cyclical recovery. A flattish May reflected concerns about inflation and jobs, but the uptrend resumed through July, driven by corporate earnings. Notably, this leg saw momentum shift back to large growth, as easing rates and a hawkish Fed stymied the reflation trade. By sector, financials (+55%) led, driven by banks (+63%), whereas utilities (+12%) and consumer staples (+18%) notably lagged. Comments from Portfolio Manager Katherine Shaw: For the fiscal year ending July 31, 2021, the fund's share classes (excluding sales charges, if applicable) gained about 37% to 38%, trailing the 47.04% advance of the MSCI US IMI Consumer Discretionary 25/50 Index, but outperforming the broad-based S&P 500® index. The largest detractor from performance versus the sector index was an underweighting in automobile manufacturers. Security selection in general merchandise stores and computer & electronics retail also hurt. An underweighting in Tesla, a stake we established this period, was the fund's largest individual relative detractor and gained 140% the past year. Our second-largest relative detractor this period was avoiding General Motors, an index component that gained approximately 128%. Also hurting performance was our overweighting in Ollies Bargain Outlet Holdings, which returned about -11%. We added to our position the past 12 months. Conversely, the biggest contributor to performance versus the sector index were stock picks in apparel, accessories & luxury goods. Also helping the fund's relative performance was an overweighting in apparel retail and an underweighting in internet & direct marketing retail. The fund's largest individual relative contributor was an outsized stake in Capri Holdings, which gained 277% the past year. We increased our stake in this company. Also helping performance was our overweighting in Tapestry, which gained roughly 216%. We added to our position the past 12 months. Another notable relative contributor was an outsized stake in Caesars Entertainment (+180%). Notable changes in positioning include a higher allocation to the apparel, accessories & luxury goods and hotels, resorts & cruise lines subindustries.The views expressed above reflect those of the portfolio manager(s) only through the end of the period as stated on the cover of this report and do not necessarily represent the views of Fidelity or any other person in the Fidelity organization. Any such views are subject to change at any time based upon market or other conditions and Fidelity disclaims any responsibility to update such views. These views may not be relied on as investment advice and, because investment decisions for a Fidelity fund are based on numerous factors, may not be relied on as an indication of trading intent on behalf of any Fidelity fund.
Fidelity Advisor® Consumer Discretionary Fund
Investment Summary (Unaudited)
Top Ten Stocks as of July 31, 2021
| % of fund's net assets | |
| Amazon.com, Inc. | 21.6 |
| The Home Depot, Inc. | 5.7 |
| Tesla, Inc. | 5.6 |
| NIKE, Inc. Class B | 4.2 |
| Capri Holdings Ltd. | 3.2 |
| Lowe's Companies, Inc. | 2.9 |
| Starbucks Corp. | 2.7 |
| Tapestry, Inc. | 2.5 |
| Burlington Stores, Inc. | 2.4 |
| Booking Holdings, Inc. | 2.2 |
| 53.0 |
Top Industries (% of fund's net assets)
| As of July 31, 2021 | ||
| Internet & Direct Marketing Retail | 24.5% | |
| Specialty Retail | 19.3% | |
| Hotels, Restaurants & Leisure | 19.2% | |
| Textiles, Apparel & Luxury Goods | 16.6% | |
| Multiline Retail | 6.3% | |
| All Others* | 14.1% | |

* Includes short-term investments and net other assets (liabilities).
Fidelity Advisor® Consumer Discretionary Fund
Schedule of Investments July 31, 2021
Showing Percentage of Net Assets
| Common Stocks - 100.0% | |||
| Shares | Value | ||
| Auto Components - 0.2% | |||
| Auto Parts & Equipment - 0.2% | |||
| Adient PLC (a) | 41,231 | $1,737,062 | |
| Automobiles - 6.1% | |||
| Automobile Manufacturers - 6.1% | |||
| Ferrari NV | 15,403 | 3,362,321 | |
| Tesla, Inc. (a) | 60,500 | 41,575,600 | |
| 44,937,921 | |||
| Building Products - 0.3% | |||
| Building Products - 0.3% | |||
| The AZEK Co., Inc. (a) | 52,400 | 1,905,788 | |
| Commercial Services & Supplies - 0.3% | |||
| Diversified Support Services - 0.3% | |||
| Copart, Inc. (a) | 14,251 | 2,094,897 | |
| Diversified Consumer Services - 0.2% | |||
| Education Services - 0.2% | |||
| Grand Canyon Education, Inc. (a) | 12,082 | 1,116,014 | |
| Entertainment - 0.6% | |||
| Movies & Entertainment - 0.6% | |||
| Cinemark Holdings, Inc. (a)(b) | 136,800 | 2,124,504 | |
| Live Nation Entertainment, Inc. (a) | 33,000 | 2,603,370 | |
| 4,727,874 | |||
| Food & Staples Retailing - 1.5% | |||
| Food Distributors - 1.1% | |||
| Performance Food Group Co. (a) | 77,508 | 3,551,417 | |
| U.S. Foods Holding Corp. (a) | 146,400 | 5,027,376 | |
| 8,578,793 | |||
| Hypermarkets & Super Centers - 0.4% | |||
| BJ's Wholesale Club Holdings, Inc. (a) | 56,690 | 2,870,782 | |
| TOTAL FOOD & STAPLES RETAILING | 11,449,575 | ||
| Hotels, Restaurants & Leisure - 19.2% | |||
| Casinos & Gaming - 3.6% | |||
| Caesars Entertainment, Inc. (a) | 146,385 | 12,788,194 | |
| Churchill Downs, Inc. | 36,609 | 6,801,952 | |
| MGM Resorts International | 10,100 | 379,053 | |
| Penn National Gaming, Inc. (a) | 95,600 | 6,537,128 | |
| 26,506,327 | |||
| Hotels, Resorts & Cruise Lines - 8.3% | |||
| Airbnb, Inc. Class A | 28,700 | 4,133,087 | |
| Booking Holdings, Inc. (a) | 7,550 | 16,445,863 | |
| Expedia, Inc. (a) | 70,100 | 11,276,987 | |
| Hilton Worldwide Holdings, Inc. (a) | 90,400 | 11,883,080 | |
| Lindblad Expeditions Holdings (a) | 80,642 | 1,103,989 | |
| Marriott International, Inc. Class A (a) | 66,170 | 9,659,497 | |
| Marriott Vacations Worldwide Corp. (a) | 26,346 | 3,882,610 | |
| Wyndham Hotels & Resorts, Inc. | 47,600 | 3,430,056 | |
| 61,815,169 | |||
| Leisure Facilities - 0.8% | |||
| Planet Fitness, Inc. (a) | 36,543 | 2,749,130 | |
| Vail Resorts, Inc. (a) | 10,817 | 3,301,348 | |
| 6,050,478 | |||
| Restaurants - 6.5% | |||
| ARAMARK Holdings Corp. | 81,317 | 2,856,666 | |
| Chipotle Mexican Grill, Inc. (a) | 3,828 | 7,133,248 | |
| Domino's Pizza, Inc. | 7,800 | 4,098,822 | |
| McDonald's Corp. | 28,108 | 6,822,093 | |
| Noodles & Co. (a) | 186,813 | 2,230,547 | |
| Restaurant Brands International, Inc. | 53,400 | 3,643,322 | |
| Ruth's Hospitality Group, Inc. (a) | 46,631 | 931,221 | |
| Starbucks Corp. | 165,979 | 20,154,830 | |
| 47,870,749 | |||
| TOTAL HOTELS, RESTAURANTS & LEISURE | 142,242,723 | ||
| Household Durables - 3.1% | |||
| Home Furnishings - 0.5% | |||
| Purple Innovation, Inc. (a) | 80,141 | 2,110,914 | |
| Tempur Sealy International, Inc. | 36,300 | 1,570,701 | |
| 3,681,615 | |||
| Homebuilding - 2.6% | |||
| D.R. Horton, Inc. | 81,519 | 7,779,358 | |
| Lennar Corp. Class A | 60,007 | 6,309,736 | |
| NVR, Inc. (a) | 972 | 5,076,367 | |
| 19,165,461 | |||
| TOTAL HOUSEHOLD DURABLES | 22,847,076 | ||
| Interactive Media & Services - 1.0% | |||
| Interactive Media & Services - 1.0% | |||
| Alphabet, Inc. Class A (a) | 1,453 | 3,915,152 | |
| Facebook, Inc. Class A (a) | 9,100 | 3,242,330 | |
| 7,157,482 | |||
| Internet & Direct Marketing Retail - 24.5% | |||
| Internet & Direct Marketing Retail - 24.5% | |||
| Alibaba Group Holding Ltd. sponsored ADR (a) | 8,200 | 1,600,558 | |
| Amazon.com, Inc. (a) | 48,150 | 160,223,458 | |
| Deliveroo PLC | 20,000 | 87,153 | |
| Deliveroo PLC Class A (a)(c) | 68,400 | 313,751 | |
| eBay, Inc. | 81,900 | 5,586,399 | |
| Farfetch Ltd. Class A (a) | 65,291 | 3,272,385 | |
| Global-e Online Ltd. (a) | 5,500 | 383,020 | |
| MercadoLibre, Inc. (a) | 4,000 | 6,274,800 | |
| The RealReal, Inc. (a) | 151,305 | 2,498,046 | |
| Wayfair LLC Class A (a) | 6,719 | 1,621,698 | |
| 181,861,268 | |||
| IT Services - 0.2% | |||
| Data Processing & Outsourced Services - 0.2% | |||
| Visa, Inc. Class A | 6,400 | 1,576,896 | |
| Multiline Retail - 6.3% | |||
| Department Stores - 0.8% | |||
| Kohl's Corp. | 53,900 | 2,738,120 | |
| Nordstrom, Inc. (a) | 93,200 | 3,084,920 | |
| 5,823,040 | |||
| General Merchandise Stores - 5.5% | |||
| B&M European Value Retail SA | 140,776 | 1,082,103 | |
| Dollar General Corp. | 61,758 | 14,367,381 | |
| Dollar Tree, Inc. (a) | 75,116 | 7,495,826 | |
| Ollie's Bargain Outlet Holdings, Inc. (a)(b) | 60,943 | 5,673,793 | |
| Target Corp. | 46,100 | 12,034,405 | |
| 40,653,508 | |||
| TOTAL MULTILINE RETAIL | 46,476,548 | ||
| Personal Products - 0.0% | |||
| Personal Products - 0.0% | |||
| Herbalife Nutrition Ltd. (a) | 2,200 | 112,068 | |
| Road & Rail - 0.6% | |||
| Trucking - 0.6% | |||
| Lyft, Inc. (a) | 45,252 | 2,503,341 | |
| Uber Technologies, Inc. (a) | 45,100 | 1,960,046 | |
| 4,463,387 | |||
| Specialty Retail - 19.3% | |||
| Apparel Retail - 6.9% | |||
| American Eagle Outfitters, Inc. (b) | 222,600 | 7,673,022 | |
| Aritzia LP (a) | 35,500 | 1,041,155 | |
| Bath & Body Works, Inc. | 42,433 | 3,397,610 | |
| Burlington Stores, Inc. (a) | 52,725 | 17,652,330 | |
| Ross Stores, Inc. | 81,011 | 9,939,240 | |
| TJX Companies, Inc. | 167,148 | 11,501,454 | |
| Torrid Holdings, Inc. | 6,200 | 144,770 | |
| 51,349,581 | |||
| Automotive Retail - 0.7% | |||
| Carvana Co. Class A (a) | 14,915 | 5,034,707 | |
| Home Improvement Retail - 9.5% | |||
| Floor & Decor Holdings, Inc. Class A (a) | 52,677 | 6,427,121 | |
| Lowe's Companies, Inc. | 113,272 | 21,826,382 | |
| The Home Depot, Inc. | 127,718 | 41,915,770 | |
| 70,169,273 | |||
| Specialty Stores - 2.2% | |||
| Academy Sports & Outdoors, Inc. | 40,267 | 1,491,892 | |
| Dick's Sporting Goods, Inc. | 32,200 | 3,353,308 | |
| Five Below, Inc. (a) | 26,063 | 5,067,168 | |
| Sally Beauty Holdings, Inc. (a) | 60,400 | 1,142,768 | |
| Ulta Beauty, Inc. (a) | 15,800 | 5,305,640 | |
| 16,360,776 | |||
| TOTAL SPECIALTY RETAIL | 142,914,337 | ||
| Textiles, Apparel & Luxury Goods - 16.6% | |||
| Apparel, Accessories & Luxury Goods - 11.1% | |||
| adidas AG | 6,984 | 2,535,968 | |
| Canada Goose Holdings, Inc. (a) | 17,066 | 724,443 | |
| Capri Holdings Ltd. (a) | 422,179 | 23,772,899 | |
| G-III Apparel Group Ltd. (a) | 64,255 | 1,918,654 | |
| Hermes International SCA | 726 | 1,110,109 | |
| Kontoor Brands, Inc. | 26,900 | 1,489,722 | |
| Levi Strauss & Co. Class A | 91,700 | 2,523,584 | |
| lululemon athletica, Inc. (a) | 14,158 | 5,665,607 | |
| LVMH Moet Hennessy Louis Vuitton SE | 6,215 | 4,976,148 | |
| PVH Corp. (a) | 147,716 | 15,454,048 | |
| Ralph Lauren Corp. | 32,200 | 3,655,344 | |
| Tapestry, Inc. (a) | 442,052 | 18,698,800 | |
| 82,525,326 | |||
| Footwear - 5.5% | |||
| Crocs, Inc. (a) | 1,900 | 258,039 | |
| Deckers Outdoor Corp. (a) | 20,927 | 8,597,858 | |
| NIKE, Inc. Class B | 184,454 | 30,897,890 | |
| Skechers U.S.A., Inc. Class A (sub. vtg.) (a) | 19,500 | 1,046,760 | |
| 40,800,547 | |||
| TOTAL TEXTILES, APPAREL & LUXURY GOODS | 123,325,873 | ||
| TOTAL COMMON STOCKS | |||
| (Cost $433,843,223) | 740,946,789 | ||
| Money Market Funds - 1.9% | |||
| Fidelity Securities Lending Cash Central Fund 0.06% (d)(e) | |||
| (Cost $13,937,765) | 13,936,372 | 13,937,765 | |
| TOTAL INVESTMENT IN SECURITIES - 101.9% | |||
| (Cost $447,780,988) | 754,884,554 | ||
| NET OTHER ASSETS (LIABILITIES) - (1.9)% | (14,069,734) | ||
| NET ASSETS - 100% | $740,814,820 |
Legend
(a) Non-income producing
(b) Security or a portion of the security is on loan at period end.
(c) Security exempt from registration under Rule 144A of the Securities Act of 1933. These securities may be resold in transactions exempt from registration, normally to qualified institutional buyers. At the end of the period, the value of these securities amounted to $313,751 or 0.0% of net assets.
(d) Investment made with cash collateral received from securities on loan.
(e) Affiliated fund that is generally available only to investment companies and other accounts managed by Fidelity Investments. The rate quoted is the annualized seven-day yield of the fund at period end. A complete unaudited listing of the fund's holdings as of its most recent quarter end is available upon request. In addition, each Fidelity Central Fund's financial statements, which are not covered by the Fund's Report of Independent Registered Public Accounting Firm, are available on the SEC's website or upon request.
Affiliated Central Funds
Information regarding fiscal year to date income earned by the Fund from investments in Fidelity Central Funds is as follows:
| Fund | Income earned |
| Fidelity Cash Central Fund | $2,369 |
| Fidelity Securities Lending Cash Central Fund | 6,301 |
| Total | $8,670 |
Amounts in the income column in the above table include any capital gain distributions from underlying funds, which are presented in the corresponding line-item in the Statement of Operations, if applicable. Amount for Fidelity Securities Lending Cash Central Fund represents the income earned on investing cash collateral, less rebates paid to borrowers and any lending agent fees associated with the loan, plus any premium payments received for lending certain types of securities.
Fiscal year to date information regarding the Fund's investments in Fidelity Central Funds, including the ownership percentage, is presented below.
| Fund | Value, beginning of period | Purchases | Sales Proceeds | Realized Gain/Loss | Change in Unrealized appreciation (depreciation) | Value, end of period | % ownership, end of period |
| Fidelity Cash Central Fund 0.06% | $1,545,113 | $157,065,954 | $158,611,099 | $187 | $(155) | $-- | 0.0% |
| Fidelity Securities Lending Cash Central Fund 0.06% | 1,635,025 | 73,128,853 | 60,826,113 | -- | -- | 13,937,765 | 0.0% |
| Total | $3,180,138 | $230,194,807 | $219,437,212 | $187 | $(155) | $13,937,765 |
Investment Valuation
The following is a summary of the inputs used, as of July 31, 2021, involving the Fund's assets and liabilities carried at fair value. The inputs or methodology used for valuing securities may not be an indication of the risk associated with investing in those securities. For more information on valuation inputs, and their aggregation into the levels used below, please refer to the Investment Valuation section in the accompanying Notes to Financial Statements.
| Valuation Inputs at Reporting Date: | ||||
| Description | Total | Level 1 | Level 2 | Level 3 |
| Investments in Securities: | ||||
| Common Stocks | $740,946,789 | $735,883,488 | $5,063,301 | $-- |
| Money Market Funds | 13,937,765 | 13,937,765 | -- | -- |
| Total Investments in Securities: | $754,884,554 | $749,821,253 | $5,063,301 | $-- |
See accompanying notes which are an integral part of the financial statements.
Fidelity Advisor® Consumer Discretionary Fund
Financial Statements
Statement of Assets and Liabilities
| July 31, 2021 | ||
| Assets | ||
| Investment in securities, at value (including securities loaned of $13,602,672) — See accompanying schedule: Unaffiliated issuers (cost $433,843,223) | $740,946,789 | |
| Fidelity Central Funds (cost $13,937,765) | 13,937,765 | |
| Total Investment in Securities (cost $447,780,988) | $754,884,554 | |
| Receivable for investments sold | 2,237,447 | |
| Receivable for fund shares sold | 704,338 | |
| Dividends receivable | 126,633 | |
| Distributions receivable from Fidelity Central Funds | 1,732 | |
| Prepaid expenses | 2,046 | |
| Other receivables | 11,549 | |
| Total assets | 757,968,299 | |
| Liabilities | ||
| Payable to custodian bank | $861,351 | |
| Payable for investments purchased | $1,340,977 | |
| Payable for fund shares redeemed | 369,942 | |
| Accrued management fee | 325,488 | |
| Distribution and service plan fees payable | 146,766 | |
| Other affiliated payables | 118,889 | |
| Other payables and accrued expenses | 52,476 | |
| Collateral on securities loaned | 13,937,590 | |
| Total liabilities | 17,153,479 | |
| Net Assets | $740,814,820 | |
| Net Assets consist of: | ||
| Paid in capital | $406,897,422 | |
| Total accumulated earnings (loss) | 333,917,398 | |
| Net Assets | $740,814,820 | |
| Net Asset Value and Maximum Offering Price | ||
| Class A: | ||
| Net Asset Value and redemption price per share ($259,487,907 ÷ 5,673,096 shares)(a) | $45.74 | |
| Maximum offering price per share (100/94.25 of $45.74) | $48.53 | |
| Class M: | ||
| Net Asset Value and redemption price per share ($48,287,861 ÷ 1,143,436 shares)(a) | $42.23 | |
| Maximum offering price per share (100/96.50 of $42.23) | $43.76 | |
| Class C: | ||
| Net Asset Value and offering price per share ($85,549,234 ÷ 2,388,129 shares)(a) | $35.82 | |
| Class I: | ||
| Net Asset Value, offering price and redemption price per share ($259,845,680 ÷ 5,206,510 shares) | $49.91 | |
| Class Z: | ||
| Net Asset Value, offering price and redemption price per share ($87,644,138 ÷ 1,749,311 shares) | $50.10 |
(a) Redemption price per share is equal to net asset value less any applicable contingent deferred sales charge.
See accompanying notes which are an integral part of the financial statements.
Statement of Operations
| Year ended July 31, 2021 | ||
| Investment Income | ||
| Dividends | $3,261,977 | |
| Income from Fidelity Central Funds (including $6,301 from security lending) | 8,670 | |
| Total income | 3,270,647 | |
| Expenses | ||
| Management fee | $3,159,015 | |
| Transfer agent fees | 986,549 | |
| Distribution and service plan fees | 1,544,156 | |
| Accounting fees | 221,211 | |
| Custodian fees and expenses | 14,361 | |
| Independent trustees' fees and expenses | 2,400 | |
| Registration fees | 129,982 | |
| Audit | 57,129 | |
| Legal | 3,156 | |
| Interest | 426 | |
| Miscellaneous | 2,854 | |
| Total expenses before reductions | 6,121,239 | |
| Expense reductions | (27,264) | |
| Total expenses after reductions | 6,093,975 | |
| Net investment income (loss) | (2,823,328) | |
| Realized and Unrealized Gain (Loss) | ||
| Net realized gain (loss) on: | ||
| Investment securities: | ||
| Unaffiliated issuers | 37,042,588 | |
| Fidelity Central Funds | 187 | |
| Foreign currency transactions | 3,033 | |
| Total net realized gain (loss) | 37,045,808 | |
| Change in net unrealized appreciation (depreciation) on: | ||
| Investment securities: | ||
| Unaffiliated issuers | 139,568,192 | |
| Fidelity Central Funds | (155) | |
| Assets and liabilities in foreign currencies | 133 | |
| Total change in net unrealized appreciation (depreciation) | 139,568,170 | |
| Net gain (loss) | 176,613,978 | |
| Net increase (decrease) in net assets resulting from operations | $173,790,650 |
See accompanying notes which are an integral part of the financial statements.
Statement of Changes in Net Assets
| Year ended July 31, 2021 | Year ended July 31, 2020 | |
| Increase (Decrease) in Net Assets | ||
| Operations | ||
| Net investment income (loss) | $(2,823,328) | $(691,258) |
| Net realized gain (loss) | 37,045,808 | 7,551,819 |
| Change in net unrealized appreciation (depreciation) | 139,568,170 | 44,691,635 |
| Net increase (decrease) in net assets resulting from operations | 173,790,650 | 51,552,196 |
| Distributions to shareholders | (7,826,027) | (11,256,995) |
| Share transactions - net increase (decrease) | 132,554,621 | (27,377,411) |
| Total increase (decrease) in net assets | 298,519,244 | 12,917,790 |
| Net Assets | ||
| Beginning of period | 442,295,576 | 429,377,786 |
| End of period | $740,814,820 | $442,295,576 |
See accompanying notes which are an integral part of the financial statements.
Financial Highlights
Fidelity Advisor Consumer Discretionary Fund Class A
| Years ended July 31, | 2021 | 2020 | 2019 | 2018 | 2017 |
| Selected Per–Share Data | |||||
| Net asset value, beginning of period | $33.70 | $29.83 | $28.22 | $22.92 | $20.94 |
| Income from Investment Operations | |||||
| Net investment income (loss)A | (.20) | (.04) | (.02) | (.02) | .06 |
| Net realized and unrealized gain (loss) | 12.82 | 4.73 | 1.90 | 5.32 | 2.01 |
| Total from investment operations | 12.62 | 4.69 | 1.88 | 5.30 | 2.07 |
| Distributions from net investment income | – | – | – | – | (.09) |
| Distributions from net realized gain | (.58) | (.82) | (.27) | – | – |
| Total distributions | (.58) | (.82) | (.27) | – | (.09) |
| Redemption fees added to paid in capitalA | – | – | – | – | –B |
| Net asset value, end of period | $45.74 | $33.70 | $29.83 | $28.22 | $22.92 |
| Total ReturnC,D | 37.68% | 16.03% | 6.81% | 23.12% | 9.93% |
| Ratios to Average Net AssetsE,F | |||||
| Expenses before reductions | 1.03% | 1.07% | 1.08% | 1.12% | 1.10% |
| Expenses net of fee waivers, if any | 1.03% | 1.07% | 1.08% | 1.12% | 1.10% |
| Expenses net of all reductions | 1.03% | 1.06% | 1.07% | 1.11% | 1.10% |
| Net investment income (loss) | (.48)% | (.14)% | (.09)% | (.08)% | .26% |
| Supplemental Data | |||||
| Net assets, end of period (000 omitted) | $259,488 | $159,603 | $159,298 | $146,605 | $109,303 |
| Portfolio turnover rateG | 35% | 41%H | 60% | 60% | 47% |
A Calculated based on average shares outstanding during the period.
B Amount represents less than $.005 per share.
C Total returns would have been lower if certain expenses had not been reduced during the applicable periods shown.
D Total returns do not include the effect of the sales charges.
E Fees and expenses of any underlying mutual funds or exchange-traded funds (ETFs) are not included in the Fund's expense ratio. The Fund indirectly bears its proportionate share of these expenses. For additional expense information related to investments in Fidelity Central Funds, please refer to the "Investments in Fidelity Central Funds" note found in the Notes to Financial Statements section of the most recent Annual or Semi-Annual report.
F Expense ratios reflect operating expenses of the class. Expenses before reductions do not reflect amounts reimbursed, waived, or reduced through arrangements with the investment adviser, brokerage services, or other offset arrangements, if applicable, and do not represent the amount paid by the class during periods when reimbursements, waivers or reductions occur.
G Amount does not include the portfolio activity of any underlying mutual funds or exchange-traded funds (ETFs).
H Portfolio turnover rate excludes securities received or delivered in-kind.
See accompanying notes which are an integral part of the financial statements.
Fidelity Advisor Consumer Discretionary Fund Class M
| Years ended July 31, | 2021 | 2020 | 2019 | 2018 | 2017 |
| Selected Per–Share Data | |||||
| Net asset value, beginning of period | $31.23 | $27.78 | $26.36 | $21.47 | $19.66 |
| Income from Investment Operations | |||||
| Net investment income (loss)A | (.29) | (.11) | (.09) | (.08) | –B |
| Net realized and unrealized gain (loss) | 11.87 | 4.38 | 1.78 | 4.97 | 1.89 |
| Total from investment operations | 11.58 | 4.27 | 1.69 | 4.89 | 1.89 |
| Distributions from net investment income | – | – | – | – | (.08) |
| Distributions from net realized gain | (.58) | (.82) | (.27) | – | – |
| Total distributions | (.58) | (.82) | (.27) | – | (.08) |
| Redemption fees added to paid in capitalA | – | – | – | – | –B |
| Net asset value, end of period | $42.23 | $31.23 | $27.78 | $26.36 | $21.47 |
| Total ReturnC,D | 37.32% | 15.70% | 6.56% | 22.78% | 9.62% |
| Ratios to Average Net AssetsE,F | |||||
| Expenses before reductions | 1.30% | 1.34% | 1.34% | 1.38% | 1.39% |
| Expenses net of fee waivers, if any | 1.30% | 1.34% | 1.34% | 1.38% | 1.39% |
| Expenses net of all reductions | 1.29% | 1.33% | 1.34% | 1.38% | 1.39% |
| Net investment income (loss) | (.75)% | (.41)% | (.35)% | (.35)% | (.02)% |
| Supplemental Data | |||||
| Net assets, end of period (000 omitted) | $48,288 | $33,896 | $32,792 | $34,622 | $26,398 |
| Portfolio turnover rateG | 35% | 41%H | 60% | 60% | 47% |
A Calculated based on average shares outstanding during the period.
B Amount represents less than $.005 per share.
C Total returns would have been lower if certain expenses had not been reduced during the applicable periods shown.
D Total returns do not include the effect of the sales charges.
E Fees and expenses of any underlying mutual funds or exchange-traded funds (ETFs) are not included in the Fund's expense ratio. The Fund indirectly bears its proportionate share of these expenses. For additional expense information related to investments in Fidelity Central Funds, please refer to the "Investments in Fidelity Central Funds" note found in the Notes to Financial Statements section of the most recent Annual or Semi-Annual report.
F Expense ratios reflect operating expenses of the class. Expenses before reductions do not reflect amounts reimbursed, waived, or reduced through arrangements with the investment adviser, brokerage services, or other offset arrangements, if applicable, and do not represent the amount paid by the class during periods when reimbursements, waivers or reductions occur.
G Amount does not include the portfolio activity of any underlying mutual funds or exchange-traded funds (ETFs).
H Portfolio turnover rate excludes securities received or delivered in-kind.
See accompanying notes which are an integral part of the financial statements.
Fidelity Advisor Consumer Discretionary Fund Class C
| Years ended July 31, | 2021 | 2020 | 2019 | 2018 | 2017 |
| Selected Per–Share Data | |||||
| Net asset value, beginning of period | $26.69 | $23.97 | $22.90 | $18.74 | $17.18 |
| Income from Investment Operations | |||||
| Net investment income (loss)A | (.40) | (.21) | (.19) | (.17) | (.09) |
| Net realized and unrealized gain (loss) | 10.11 | 3.75 | 1.53 | 4.33 | 1.65 |
| Total from investment operations | 9.71 | 3.54 | 1.34 | 4.16 | 1.56 |
| Distributions from net investment income | – | – | – | – | – |
| Distributions from net realized gain | (.58) | (.82) | (.27) | – | – |
| Total distributions | (.58) | (.82) | (.27) | – | – |
| Redemption fees added to paid in capitalA | – | – | – | – | –B |
| Net asset value, end of period | $35.82 | $26.69 | $23.97 | $22.90 | $18.74 |
| Total ReturnC,D | 36.66% | 15.14% | 6.02% | 22.20% | 9.08% |
| Ratios to Average Net AssetsE,F | |||||
| Expenses before reductions | 1.79% | 1.82% | 1.83% | 1.87% | 1.85% |
| Expenses net of fee waivers, if any | 1.79% | 1.82% | 1.83% | 1.87% | 1.85% |
| Expenses net of all reductions | 1.79% | 1.82% | 1.82% | 1.86% | 1.85% |
| Net investment income (loss) | (1.24)% | (.90)% | (.83)% | (.83)% | (.49)% |
| Supplemental Data | |||||
| Net assets, end of period (000 omitted) | $85,549 | $65,223 | $70,890 | $71,116 | $59,958 |
| Portfolio turnover rateG | 35% | 41%H | 60% | 60% | 47% |
A Calculated based on average shares outstanding during the period.
B Amount represents less than $.005 per share.
C Total returns would have been lower if certain expenses had not been reduced during the applicable periods shown.
D Total returns do not include the effect of the contingent deferred sales charge.
E Fees and expenses of any underlying mutual funds or exchange-traded funds (ETFs) are not included in the Fund's expense ratio. The Fund indirectly bears its proportionate share of these expenses. For additional expense information related to investments in Fidelity Central Funds, please refer to the "Investments in Fidelity Central Funds" note found in the Notes to Financial Statements section of the most recent Annual or Semi-Annual report.
F Expense ratios reflect operating expenses of the class. Expenses before reductions do not reflect amounts reimbursed, waived, or reduced through arrangements with the investment adviser, brokerage services, or other offset arrangements, if applicable, and do not represent the amount paid by the class during periods when reimbursements, waivers or reductions occur.
G Amount does not include the portfolio activity of any underlying mutual funds or exchange-traded funds (ETFs).
H Portfolio turnover rate excludes securities received or delivered in-kind.
See accompanying notes which are an integral part of the financial statements.
Fidelity Advisor Consumer Discretionary Fund Class I
| Years ended July 31, | 2021 | 2020 | 2019 | 2018 | 2017 |
| Selected Per–Share Data | |||||
| Net asset value, beginning of period | $36.63 | $32.27 | $30.42 | $24.64 | $22.48 |
| Income from Investment Operations | |||||
| Net investment income (loss)A | (.10) | .04 | .06 | .06 | .12 |
| Net realized and unrealized gain (loss) | 13.96 | 5.14 | 2.06 | 5.72 | 2.18 |
| Total from investment operations | 13.86 | 5.18 | 2.12 | 5.78 | 2.30 |
| Distributions from net investment income | – | – | – | – | (.14) |
| Distributions from net realized gain | (.58) | (.82) | (.27) | – | – |
| Total distributions | (.58) | (.82) | (.27) | – | (.14) |
| Redemption fees added to paid in capitalA | – | – | – | – | –B |
| Net asset value, end of period | $49.91 | $36.63 | $32.27 | $30.42 | $24.64 |
| Total ReturnC | 38.05% | 16.34% | 7.10% | 23.46% | 10.27% |
| Ratios to Average Net AssetsD,E | |||||
| Expenses before reductions | .77% | .79% | .80% | .84% | .83% |
| Expenses net of fee waivers, if any | .76% | .79% | .80% | .83% | .83% |
| Expenses net of all reductions | .76% | .79% | .80% | .83% | .83% |
| Net investment income (loss) | (.22)% | .13% | .19% | .20% | .54% |
| Supplemental Data | |||||
| Net assets, end of period (000 omitted) | $259,846 | $134,907 | $159,613 | $152,711 | $82,195 |
| Portfolio turnover rateF | 35% | 41%G | 60% | 60% | 47% |
A Calculated based on average shares outstanding during the period.
B Amount represents less than $.005 per share.
C Total returns would have been lower if certain expenses had not been reduced during the applicable periods shown.
D Fees and expenses of any underlying mutual funds or exchange-traded funds (ETFs) are not included in the Fund's expense ratio. The Fund indirectly bears its proportionate share of these expenses. For additional expense information related to investments in Fidelity Central Funds, please refer to the "Investments in Fidelity Central Funds" note found in the Notes to Financial Statements section of the most recent Annual or Semi-Annual report.
E Expense ratios reflect operating expenses of the class. Expenses before reductions do not reflect amounts reimbursed, waived, or reduced through arrangements with the investment adviser, brokerage services, or other offset arrangements, if applicable, and do not represent the amount paid by the class during periods when reimbursements, waivers or reductions occur.
F Amount does not include the portfolio activity of any underlying mutual funds or exchange-traded funds (ETFs).
G Portfolio turnover rate excludes securities received or delivered in-kind.
See accompanying notes which are an integral part of the financial statements.
Fidelity Advisor Consumer Discretionary Fund Class Z
| Years ended July 31, | 2021 | 2020 | 2019 A |
| Selected Per–Share Data | |||
| Net asset value, beginning of period | $36.72 | $32.31 | $31.56 |
| Income from Investment Operations | |||
| Net investment income (loss)B | (.04) | .09 | .10 |
| Net realized and unrealized gain (loss) | 14.00 | 5.14 | .92 |
| Total from investment operations | 13.96 | 5.23 | 1.02 |
| Distributions from net investment income | – | – | – |
| Distributions from net realized gain | (.58) | (.82) | (.27) |
| Total distributions | (.58) | (.82) | (.27) |
| Redemption fees added to paid in capitalB | – | – | – |
| Net asset value, end of period | $50.10 | $36.72 | $32.31 |
| Total ReturnC,D | 38.23% | 16.48% | 3.36% |
| Ratios to Average Net AssetsE,F | |||
| Expenses before reductions | .64% | .66% | .67%G |
| Expenses net of fee waivers, if any | .64% | .66% | .66%G |
| Expenses net of all reductions | .64% | .66% | .66%G |
| Net investment income (loss) | (.09)% | .26% | .39%G |
| Supplemental Data | |||
| Net assets, end of period (000 omitted) | $87,644 | $48,668 | $6,786 |
| Portfolio turnover rateH | 35% | 41%I | 60%G |
A For the period October 2, 2018 (commencement of sale of shares) to July 31, 2019.
B Calculated based on average shares outstanding during the period.
C Total returns for periods of less than one year are not annualized.
D Total returns would have been lower if certain expenses had not been reduced during the applicable periods shown.
E Fees and expenses of any underlying mutual funds or exchange-traded funds (ETFs) are not included in the Fund's expense ratio. The Fund indirectly bears its proportionate share of these expenses. For additional expense information related to investments in Fidelity Central Funds, please refer to the "Investments in Fidelity Central Funds" note found in the Notes to Financial Statements section of the most recent Annual or Semi-Annual report.
F Expense ratios reflect operating expenses of the class. Expenses before reductions do not reflect amounts reimbursed, waived, or reduced through arrangements with the investment adviser, brokerage services, or other offset arrangements, if applicable, and do not represent the amount paid by the class during periods when reimbursements, waivers or reductions occur.
G Annualized
H Amount does not include the portfolio activity of any underlying mutual funds or exchange-traded funds (ETFs).
I Portfolio turnover rate excludes securities received or delivered in-kind.
See accompanying notes which are an integral part of the financial statements.
Fidelity Advisor® Energy Fund
Performance: The Bottom Line
Average annual total return reflects the change in the value of an investment, assuming reinvestment of distributions from dividend income and capital gains (the profits earned upon the sale of securities that have grown in value, if any) and assuming a constant rate of performance each year. The hypothetical investment and the average annual total returns do not reflect the deduction of taxes that a shareholder would pay on fund distributions or the redemption of fund shares. During periods of reimbursement by Fidelity, a fund’s total return will be greater than it would be had the reimbursement not occurred. How a fund did yesterday is no guarantee of how it will do tomorrow.
Average Annual Total Returns
| For the periods ended July 31, 2021 | Past 1 year | Past 5 years | Past 10 years |
| Class A (incl. 5.75% sales charge) | 38.34% | (5.13)% | (3.94)% |
| Class M (incl. 3.50% sales charge) | 41.24% | (4.92)% | (3.95)% |
| Class C (incl. contingent deferred sales charge) | 44.68% | (4.69)% | (3.93)% |
| Class I | 47.26% | (3.70)% | (3.08)% |
| Class Z | 47.47% | (3.61)% | (3.04)% |
Class C shares' contingent deferred sales charges included in the past one year, past five years and past ten years total return figures are 1%, 0% and 0%, respectively.
The initial offering of Class Z shares took place on October 2, 2018. Returns prior to October 2, 2018 are those of Class I.
$10,000 Over 10 Years
Let's say hypothetically that $10,000 was invested in Fidelity Advisor® Energy Fund - Class A on July 31, 2011, and the current 5.75% sales charge was paid.
The chart shows how the value of your investment would have changed, and also shows how the S&P 500® Index performed over the same period.
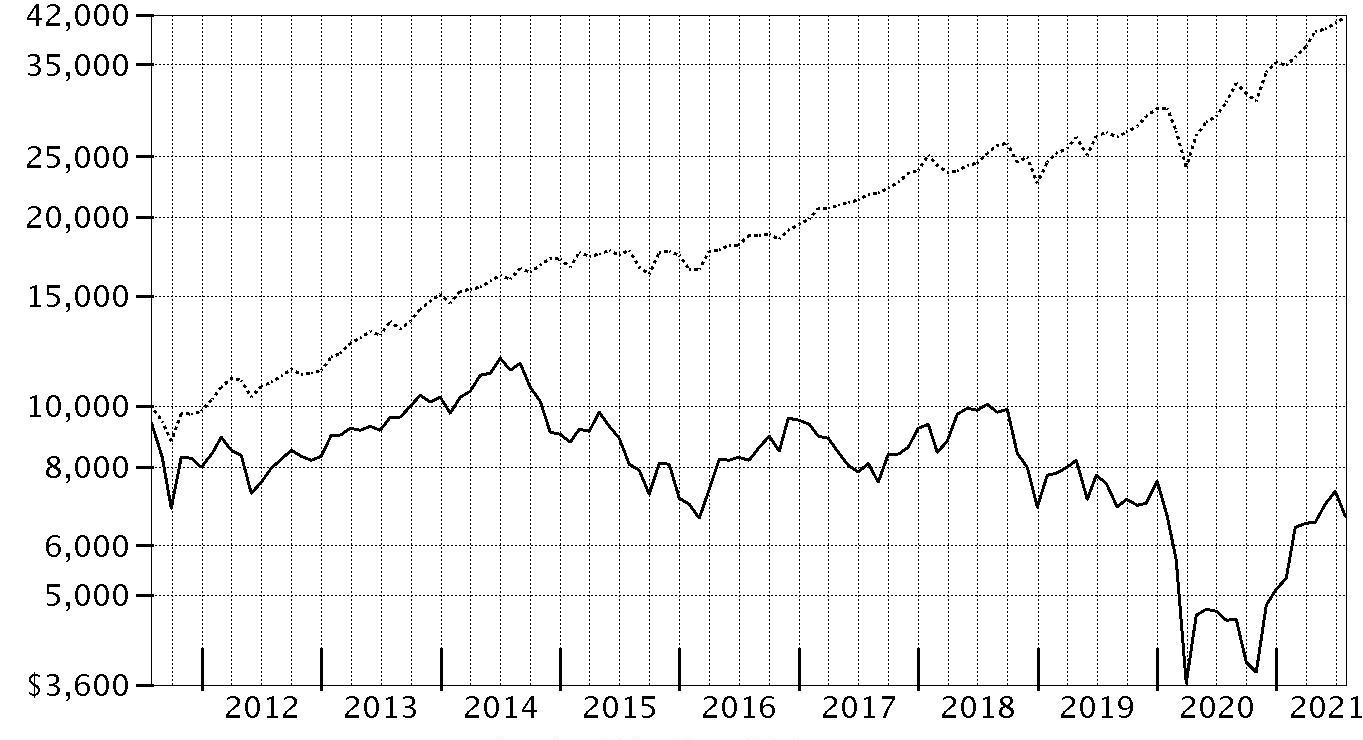
| Period Ending Values | ||
|
| $6,691 | Fidelity Advisor® Energy Fund - Class A |
|
| $41,689 | S&P 500® Index |
Fidelity Advisor® Energy Fund
Management's Discussion of Fund Performance
Market Recap: The S&P 500® index gained 36.45% for the 12 months ending July 31, 2021, as U.S. equities continued a historic rebound following a steep but brief decline due to the early-2020 outbreak and spread of COVID-19. A confluence of powerful forces propelled risk assets, returning the stock market to pre-pandemic highs by late August 2020. The rally slowed in September, when stocks began a two-month retreat amid Congress’s inability to reach a deal on additional fiscal stimulus, as well as uncertainty about the election. But as the calendar turned, investors grew hopeful. The rollout of three COVID-19 vaccines was underway, the U.S. Federal Reserve pledged to hold interest rates near zero until the economy recovered, and the federal government planned to deploy trillions of dollars to boost consumers and the economy. This backdrop fueled a sharp rotation, with small-cap value usurping leadership from large growth. As part of the “reopening” theme, investors moved out of tech-driven mega-caps that had thrived due to the work-from-home trend in favor of cheap smaller companies that stood to benefit from a broad cyclical recovery. A flattish May reflected concerns about inflation and jobs, but the uptrend resumed through July, driven by corporate earnings. Notably, this leg saw momentum shift back to large growth, as easing rates and a hawkish Fed stymied the reflation trade. By sector, financials (+55%) led, driven by banks (+63%), whereas utilities (+12%) and consumer staples (+18%) notably lagged. Comments from Portfolio Manager Maurice FitzMaurice: For the fiscal year ending July 31, 2021, the fund's share classes (excluding sales charges, if applicable) gained roughly 46% to 47%, underperforming the 50.13% gain of the MSCI US IMI Energy 25/50 Index, but outperforming the broad-based S&P 500® index. Versus the sector index, security selection was the primary detractor, especially in the integrated oil & gas group. We also had weak stock picks in independent power producers & energy traders and oil & gas refining & marketing. Our non-index stake in BP was the fund's largest individual relative detractor, due to its 18% advance. We decreased our stake in the company the past year. The fund's non-index stake in Vistra, another notable detractor, gained roughly 4%. Avoiding ONEOK, an index component that gained 104%, also hurt relative performance. In contrast, the largest contributor to performance versus the sector index was our stock picks in oil & gas equipment & services. Security selection and an overweighting in oil & gas exploration & production and an underweighting in oil & gas refining & marketing also lifted the fund's relative performance. The biggest individual relative contributor was an overweight position in PDC Energy (+177%). Also adding value was our lighter-than-index stake in Chevron, which gained 28%. The company was among our biggest holdings. The fund's non-index stake in Canadian National Resources, one of our largest holdings as of July 31, gained 94%. Notable changes in positioning include increased exposure to the oil & gas exploration & production subindustry and a lower allocation to oil & gas storage & transportation.The views expressed above reflect those of the portfolio manager(s) only through the end of the period as stated on the cover of this report and do not necessarily represent the views of Fidelity or any other person in the Fidelity organization. Any such views are subject to change at any time based upon market or other conditions and Fidelity disclaims any responsibility to update such views. These views may not be relied on as investment advice and, because investment decisions for a Fidelity fund are based on numerous factors, may not be relied on as an indication of trading intent on behalf of any Fidelity fund.
Fidelity Advisor® Energy Fund
Investment Summary (Unaudited)
Top Ten Stocks as of July 31, 2021
| % of fund's net assets | |
| Exxon Mobil Corp. | 14.7 |
| Chevron Corp. | 9.8 |
| Royal Dutch Shell PLC Class B sponsored ADR | 7.1 |
| Cheniere Energy, Inc. | 5.6 |
| Pioneer Natural Resources Co. | 4.5 |
| ConocoPhillips Co. | 3.9 |
| Canadian Natural Resources Ltd. | 3.3 |
| Devon Energy Corp. | 3.2 |
| Marathon Petroleum Corp. | 3.1 |
| EOG Resources, Inc. | 2.9 |
| 58.1 |
Top Industries (% of fund's net assets)
| As of July 31, 2021 | ||
| Oil, Gas & Consumable Fuels | 88.1% | |
| Energy Equipment & Services | 8.7% | |
| Independent Power and Renewable Electricity Producers | 2.4% | |
| Food Products | 0.6% | |
| All Others* | 0.2% | |

* Includes short-term investments and net other assets (liabilities).
Fidelity Advisor® Energy Fund
Schedule of Investments July 31, 2021
Showing Percentage of Net Assets
| Common Stocks - 99.8% | |||
| Shares | Value | ||
| Energy Equipment & Services - 8.7% | |||
| Oil & Gas Drilling - 0.6% | |||
| Nabors Industries Ltd. (a) | 13,312 | $1,164,933 | |
| Nabors Industries Ltd. warrants 6/11/26 (a) | 6,604 | 42,926 | |
| Odfjell Drilling Ltd. (a) | 914,756 | 2,099,805 | |
| Shelf Drilling Ltd. (a)(b) | 691,228 | 373,594 | |
| 3,681,258 | |||
| Oil & Gas Equipment & Services - 8.1% | |||
| Baker Hughes Co. Class A | 566,500 | 12,032,460 | |
| Cactus, Inc. | 38,900 | 1,401,956 | |
| Championx Corp. (a) | 89,200 | 2,073,008 | |
| Nextier Oilfield Solutions, Inc. (a) | 993,900 | 3,796,698 | |
| Oceaneering International, Inc. (a) | 251,700 | 3,337,542 | |
| ProPetro Holding Corp. (a) | 547,700 | 4,135,135 | |
| Schlumberger Ltd. | 253,818 | 7,317,573 | |
| Technip Energies NV (a) | 252,020 | 3,415,603 | |
| TechnipFMC PLC (a) | 982,500 | 7,093,650 | |
| 44,603,625 | |||
| TOTAL ENERGY EQUIPMENT & SERVICES | 48,284,883 | ||
| Food Products - 0.6% | |||
| Agricultural Products - 0.6% | |||
| Darling Ingredients, Inc. (a) | 46,700 | 3,225,569 | |
| Independent Power and Renewable Electricity Producers - 2.4% | |||
| Independent Power Producers & Energy Traders - 2.4% | |||
| The AES Corp. | 33,200 | 786,840 | |
| Vistra Corp. | 632,700 | 12,116,205 | |
| 12,903,045 | |||
| Oil, Gas & Consumable Fuels - 88.1% | |||
| Coal & Consumable Fuels - 0.2% | |||
| Enviva Partners LP | 24,800 | 1,339,200 | |
| Integrated Oil & Gas - 37.2% | |||
| BP PLC sponsored ADR | 402,800 | 9,739,704 | |
| Chevron Corp. | 530,170 | 53,976,608 | |
| Exxon Mobil Corp. | 1,413,861 | 81,395,980 | |
| Occidental Petroleum Corp. | 424,500 | 11,079,450 | |
| Occidental Petroleum Corp. warrants 8/3/27 (a) | 36,987 | 396,871 | |
| Royal Dutch Shell PLC Class B sponsored ADR | 987,600 | 39,059,580 | |
| Suncor Energy, Inc. | 481,300 | 9,474,774 | |
| Total SA sponsored ADR | 13,000 | 567,190 | |
| 205,690,157 | |||
| Oil & Gas Exploration & Production - 32.5% | |||
| Antero Resources Corp. (a) | 421,400 | 5,731,040 | |
| APA Corp. | 830,400 | 15,570,000 | |
| Callon Petroleum Co. (a)(c) | 46,440 | 1,827,878 | |
| Canadian Natural Resources Ltd. | 551,800 | 18,209,046 | |
| Cimarex Energy Co. | 108,300 | 7,061,160 | |
| ConocoPhillips Co. | 386,050 | 21,641,963 | |
| Devon Energy Corp. | 681,400 | 17,607,376 | |
| Diamondback Energy, Inc. | 55,600 | 4,288,428 | |
| EOG Resources, Inc. | 221,586 | 16,144,756 | |
| Extraction Oil & Gas, Inc. (a) | 39,800 | 1,770,702 | |
| Hess Corp. | 165,000 | 12,612,600 | |
| Magnolia Oil & Gas Corp. Class A | 233,400 | 3,267,600 | |
| National Energy Services Reunited Corp. (a) | 487,800 | 6,292,620 | |
| Northern Oil & Gas, Inc. | 70,830 | 1,223,234 | |
| Ovintiv, Inc. | 140,800 | 3,612,928 | |
| PDC Energy, Inc. | 337,688 | 13,355,560 | |
| Pioneer Natural Resources Co. | 170,425 | 24,774,682 | |
| Range Resources Corp. (a) | 92,000 | 1,401,160 | |
| SM Energy Co. | 61,800 | 1,155,660 | |
| Viper Energy Partners LP | 107,400 | 1,934,274 | |
| 179,482,667 | |||
| Oil & Gas Refining & Marketing - 8.6% | |||
| Marathon Petroleum Corp. | 307,778 | 16,995,501 | |
| Phillips 66 Co. | 187,018 | 13,732,732 | |
| Renewable Energy Group, Inc. (a) | 20,600 | 1,261,750 | |
| Valero Energy Corp. | 231,600 | 15,510,252 | |
| 47,500,235 | |||
| Oil & Gas Storage & Transport - 9.6% | |||
| Cheniere Energy, Inc. (a) | 362,900 | 30,821,097 | |
| Energy Transfer LP | 602,300 | 5,938,678 | |
| Golar LNG Ltd. (a) | 197,900 | 2,208,564 | |
| Targa Resources Corp. | 148,400 | 6,249,124 | |
| Teekay LNG Partners LP | 150,758 | 2,184,483 | |
| The Williams Companies, Inc. | 236,100 | 5,914,305 | |
| 53,316,251 | |||
| TOTAL OIL, GAS & CONSUMABLE FUELS | 487,328,510 | ||
| TOTAL COMMON STOCKS | |||
| (Cost $474,032,590) | 551,742,007 | ||
| Money Market Funds - 0.3% | |||
| Fidelity Cash Central Fund 0.06% (d) | 576,027 | 576,142 | |
| Fidelity Securities Lending Cash Central Fund 0.06% (d)(e) | 1,344,990 | 1,345,124 | |
| TOTAL MONEY MARKET FUNDS | |||
| (Cost $1,921,266) | 1,921,266 | ||
| TOTAL INVESTMENT IN SECURITIES - 100.1% | |||
| (Cost $475,953,856) | 553,663,273 | ||
| NET OTHER ASSETS (LIABILITIES) - (0.1)% | (704,096) | ||
| NET ASSETS - 100% | $552,959,177 |
Legend
(a) Non-income producing
(b) Security exempt from registration under Rule 144A of the Securities Act of 1933. These securities may be resold in transactions exempt from registration, normally to qualified institutional buyers. At the end of the period, the value of these securities amounted to $373,594 or 0.1% of net assets.
(c) Security or a portion of the security is on loan at period end.
(d) Affiliated fund that is generally available only to investment companies and other accounts managed by Fidelity Investments. The rate quoted is the annualized seven-day yield of the fund at period end. A complete unaudited listing of the fund's holdings as of its most recent quarter end is available upon request. In addition, each Fidelity Central Fund's financial statements, which are not covered by the Fund's Report of Independent Registered Public Accounting Firm, are available on the SEC's website or upon request.
(e) Investment made with cash collateral received from securities on loan.
Affiliated Central Funds
Information regarding fiscal year to date income earned by the Fund from investments in Fidelity Central Funds is as follows:
| Fund | Income earned |
| Fidelity Cash Central Fund | $1,549 |
| Fidelity Securities Lending Cash Central Fund | 20,448 |
| Total | $21,997 |
Amounts in the income column in the above table include any capital gain distributions from underlying funds, which are presented in the corresponding line-item in the Statement of Operations, if applicable. Amount for Fidelity Securities Lending Cash Central Fund represents the income earned on investing cash collateral, less rebates paid to borrowers and any lending agent fees associated with the loan, plus any premium payments received for lending certain types of securities.
Fiscal year to date information regarding the Fund's investments in Fidelity Central Funds, including the ownership percentage, is presented below.
| Fund | Value, beginning of period | Purchases | Sales Proceeds | Realized Gain/Loss | Change in Unrealized appreciation (depreciation) | Value, end of period | % ownership, end of period |
| Fidelity Cash Central Fund 0.06% | $2,060,157 | $109,109,377 | $110,593,162 | $(230) | $-- | $576,142 | 0.0% |
| Fidelity Securities Lending Cash Central Fund 0.06% | 3,298,724 | 83,338,050 | 85,291,650 | -- | -- | 1,345,124 | 0.0% |
| Total | $5,358,881 | $192,447,427 | $195,884,812 | $(230) | $-- | $1,921,266 |
Investment Valuation
The following is a summary of the inputs used, as of July 31, 2021, involving the Fund's assets and liabilities carried at fair value. The inputs or methodology used for valuing securities may not be an indication of the risk associated with investing in those securities. For more information on valuation inputs, and their aggregation into the levels used below, please refer to the Investment Valuation section in the accompanying Notes to Financial Statements.
| Valuation Inputs at Reporting Date: | ||||
| Description | Total | Level 1 | Level 2 | Level 3 |
| Investments in Securities: | ||||
| Common Stocks | $551,742,007 | $551,742,007 | $-- | $-- |
| Money Market Funds | 1,921,266 | 1,921,266 | -- | -- |
| Total Investments in Securities: | $553,663,273 | $553,663,273 | $-- | $-- |
Other Information
Distribution of investments by country or territory of incorporation, as a percentage of Total Net Assets, is as follows (Unaudited):
| United States of America | 80.4% |
| United Kingdom | 10.1% |
| Canada | 5.0% |
| Curacao | 1.3% |
| British Virgin Islands | 1.1% |
| Bermuda | 1.0% |
| Others (Individually Less Than 1%) | 1.1% |
| 100.0% |
See accompanying notes which are an integral part of the financial statements.
Fidelity Advisor® Energy Fund
Financial Statements
Statement of Assets and Liabilities
| July 31, 2021 | ||
| Assets | ||
| Investment in securities, at value (including securities loaned of $1,291,008) — See accompanying schedule: Unaffiliated issuers (cost $474,032,590) | $551,742,007 | |
| Fidelity Central Funds (cost $1,921,266) | 1,921,266 | |
| Total Investment in Securities (cost $475,953,856) | $553,663,273 | |
| Receivable for investments sold | 1,341,152 | |
| Receivable for fund shares sold | 878,833 | |
| Dividends receivable | 222,555 | |
| Distributions receivable from Fidelity Central Funds | 562 | |
| Prepaid expenses | 4,146 | |
| Other receivables | 158,285 | |
| Total assets | 556,268,806 | |
| Liabilities | ||
| Payable for investments purchased | $769,351 | |
| Payable for fund shares redeemed | 577,334 | |
| Accrued management fee | 249,879 | |
| Distribution and service plan fees payable | 113,276 | |
| Other affiliated payables | 114,507 | |
| Other payables and accrued expenses | 140,482 | |
| Collateral on securities loaned | 1,344,800 | |
| Total liabilities | 3,309,629 | |
| Net Assets | $552,959,177 | |
| Net Assets consist of: | ||
| Paid in capital | $808,551,965 | |
| Total accumulated earnings (loss) | (255,592,788) | |
| Net Assets | $552,959,177 | |
| Net Asset Value and Maximum Offering Price | ||
| Class A: | ||
| Net Asset Value and redemption price per share ($175,221,009 ÷ 7,427,000 shares)(a) | $23.59 | |
| Maximum offering price per share (100/94.25 of $23.59) | $25.03 | |
| Class M: | ||
| Net Asset Value and redemption price per share ($62,519,274 ÷ 2,583,456 shares)(a) | $24.20 | |
| Maximum offering price per share (100/96.50 of $24.20) | $25.08 | |
| Class C: | ||
| Net Asset Value and offering price per share ($56,067,860 ÷ 2,595,238 shares)(a) | $21.60 | |
| Class I: | ||
| Net Asset Value, offering price and redemption price per share ($177,247,918 ÷ 7,103,723 shares) | $24.95 | |
| Class Z: | ||
| Net Asset Value, offering price and redemption price per share ($81,903,116 ÷ 3,287,675 shares) | $24.91 |
(a) Redemption price per share is equal to net asset value less any applicable contingent deferred sales charge.
See accompanying notes which are an integral part of the financial statements.
Statement of Operations
| Year ended July 31, 2021 | ||
| Investment Income | ||
| Dividends | $17,796,087 | |
| Non-Cash dividends | 2,606,309 | |
| Income from Fidelity Central Funds (including $20,448 from security lending) | 21,997 | |
| Total income | 20,424,393 | |
| Expenses | ||
| Management fee | $2,523,654 | |
| Transfer agent fees | 992,759 | |
| Distribution and service plan fees | 1,137,977 | |
| Accounting fees | 182,699 | |
| Custodian fees and expenses | 8,349 | |
| Independent trustees' fees and expenses | 1,977 | |
| Registration fees | 97,274 | |
| Audit | 63,767 | |
| Legal | 1,156 | |
| Interest | 189 | |
| Miscellaneous | 9,819 | |
| Total expenses before reductions | 5,019,620 | |
| Expense reductions | (8,604) | |
| Total expenses after reductions | 5,011,016 | |
| Net investment income (loss) | 15,413,377 | |
| Realized and Unrealized Gain (Loss) | ||
| Net realized gain (loss) on: | ||
| Investment securities: | ||
| Unaffiliated issuers | (53,596,879) | |
| Fidelity Central Funds | (230) | |
| Foreign currency transactions | 2,722 | |
| Total net realized gain (loss) | (53,594,387) | |
| Change in net unrealized appreciation (depreciation) on: | ||
| Investment securities: | ||
| Unaffiliated issuers | 210,754,411 | |
| Assets and liabilities in foreign currencies | (86) | |
| Total change in net unrealized appreciation (depreciation) | 210,754,325 | |
| Net gain (loss) | 157,159,938 | |
| Net increase (decrease) in net assets resulting from operations | $172,573,315 |
See accompanying notes which are an integral part of the financial statements.
Statement of Changes in Net Assets
| Year ended July 31, 2021 | Year ended July 31, 2020 | |
| Increase (Decrease) in Net Assets | ||
| Operations | ||
| Net investment income (loss) | $15,413,377 | $12,678,859 |
| Net realized gain (loss) | (53,594,387) | (62,521,551) |
| Change in net unrealized appreciation (depreciation) | 210,754,325 | (157,224,576) |
| Net increase (decrease) in net assets resulting from operations | 172,573,315 | (207,067,268) |
| Distributions to shareholders | (13,506,451) | (8,780,599) |
| Share transactions - net increase (decrease) | (4,727,059) | 12,036,839 |
| Total increase (decrease) in net assets | 154,339,805 | (203,811,028) |
| Net Assets | ||
| Beginning of period | 398,619,372 | 602,430,400 |
| End of period | $552,959,177 | $398,619,372 |
See accompanying notes which are an integral part of the financial statements.
Financial Highlights
Fidelity Advisor Energy Fund Class A
| Years ended July 31, | 2021 | 2020 | 2019 | 2018 | 2017 |
| Selected Per–Share Data | |||||
| Net asset value, beginning of period | $16.59 | $27.88 | $37.52 | $30.70 | $31.12 |
| Income from Investment Operations | |||||
| Net investment income (loss)A | .65B | .57 | .35 | .12 | .38C |
| Net realized and unrealized gain (loss) | 6.94 | (11.42) | (9.76) | 7.18 | (.72) |
| Total from investment operations | 7.59 | (10.85) | (9.41) | 7.30 | (.34) |
| Distributions from net investment income | (.59) | (.44) | (.18)D | (.48) | – |
| Distributions from net realized gain | – | – | (.05)D | –E | (.08) |
| Total distributions | (.59) | (.44) | (.23) | (.48) | (.08) |
| Redemption fees added to paid in capitalA | – | – | – | – | –E |
| Net asset value, end of period | $23.59 | $16.59 | $27.88 | $37.52 | $30.70 |
| Total ReturnF,G | 46.78% | (39.54)% | (25.07)% | 24.07% | (1.14)% |
| Ratios to Average Net AssetsH,I | |||||
| Expenses before reductions | 1.11% | 1.14% | 1.10% | 1.11% | 1.09% |
| Expenses net of fee waivers, if any | 1.11% | 1.14% | 1.10% | 1.11% | 1.09% |
| Expenses net of all reductions | 1.11% | 1.12% | 1.09% | 1.10% | 1.08% |
| Net investment income (loss) | 3.15%B | 2.62% | 1.14% | .36% | 1.15%C |
| Supplemental Data | |||||
| Net assets, end of period (000 omitted) | $175,221 | $114,321 | $190,992 | $278,555 | $277,378 |
| Portfolio turnover rateJ | 45% | 84%K | 47% | 56% | 90% |
A Calculated based on average shares outstanding during the period.
B Net investment income per share reflects one or more large, non-recurring dividend(s) which amounted to $.11 per share. Excluding such non-recurring dividend(s), the ratio of net investment income (loss) to average net assets would have been 2.60%.
C Net investment income per share reflects one or more large, non-recurring dividend(s) which amounted to $.35 per share. Excluding such non-recurring dividend(s), the ratio of net investment income (loss) to average net assets would have been .11%.
D The amounts shown reflect certain reclassifications related to book to tax differences that were made in the year shown.
E Amount represents less than $.005 per share.
F Total returns would have been lower if certain expenses had not been reduced during the applicable periods shown.
G Total returns do not include the effect of the sales charges.
H Fees and expenses of any underlying mutual funds or exchange-traded funds (ETFs) are not included in the Fund's expense ratio. The Fund indirectly bears its proportionate share of these expenses. For additional expense information related to investments in Fidelity Central Funds, please refer to the "Investments in Fidelity Central Funds" note found in the Notes to Financial Statements section of the most recent Annual or Semi-Annual report.
I Expense ratios reflect operating expenses of the class. Expenses before reductions do not reflect amounts reimbursed, waived, or reduced through arrangements with the investment adviser, brokerage services, or other offset arrangements, if applicable, and do not represent the amount paid by the class during periods when reimbursements, waivers or reductions occur.
J Amount does not include the portfolio activity of any underlying mutual funds or exchange-traded funds (ETFs).
K Portfolio turnover rate excludes securities received or delivered in-kind.
See accompanying notes which are an integral part of the financial statements.
Fidelity Advisor Energy Fund Class M
| Years ended July 31, | 2021 | 2020 | 2019 | 2018 | 2017 |
| Selected Per–Share Data | |||||
| Net asset value, beginning of period | $17.00 | $28.53 | $38.36 | $31.37 | $31.82 |
| Income from Investment Operations | |||||
| Net investment income (loss)A | .60B | .53 | .27 | .03 | .30C |
| Net realized and unrealized gain (loss) | 7.13 | (11.71) | (9.97) | 7.35 | (.75) |
| Total from investment operations | 7.73 | (11.18) | (9.70) | 7.38 | (.45) |
| Distributions from net investment income | (.53) | (.35) | (.08)D | (.39) | – |
| Distributions from net realized gain | – | – | (.05)D | –E | – |
| Total distributions | (.53) | (.35) | (.13) | (.39) | – |
| Redemption fees added to paid in capitalA | – | – | – | – | –E |
| Net asset value, end of period | $24.20 | $17.00 | $28.53 | $38.36 | $31.37 |
| Total ReturnF,G | 46.37% | (39.66)% | (25.28)% | 23.75% | (1.41)% |
| Ratios to Average Net AssetsH,I | |||||
| Expenses before reductions | 1.38% | 1.40% | 1.37% | 1.38% | 1.36% |
| Expenses net of fee waivers, if any | 1.38% | 1.40% | 1.36% | 1.38% | 1.36% |
| Expenses net of all reductions | 1.38% | 1.38% | 1.36% | 1.37% | 1.35% |
| Net investment income (loss) | 2.88%B | 2.36% | .88% | .09% | .88%C |
| Supplemental Data | |||||
| Net assets, end of period (000 omitted) | $62,519 | $43,768 | $87,147 | $136,828 | $125,951 |
| Portfolio turnover rateJ | 45% | 84%K | 47% | 56% | 90% |
A Calculated based on average shares outstanding during the period.
B Net investment income per share reflects one or more large, non-recurring dividend(s) which amounted to $.11 per share. Excluding such non-recurring dividend(s), the ratio of net investment income (loss) to average net assets would have been 2.34%.
C Net investment income per share reflects one or more large, non-recurring dividend(s) which amounted to $.35 per share. Excluding such non-recurring dividend(s), the ratio of net investment income (loss) to average net assets would have been (.16) %.
D The amounts shown reflect certain reclassifications related to book to tax differences that were made in the year shown.
E Amount represents less than $.005 per share.
F Total returns would have been lower if certain expenses had not been reduced during the applicable periods shown.
G Total returns do not include the effect of the sales charges.
H Fees and expenses of any underlying mutual funds or exchange-traded funds (ETFs) are not included in the Fund's expense ratio. The Fund indirectly bears its proportionate share of these expenses. For additional expense information related to investments in Fidelity Central Funds, please refer to the "Investments in Fidelity Central Funds" note found in the Notes to Financial Statements section of the most recent Annual or Semi-Annual report.
I Expense ratios reflect operating expenses of the class. Expenses before reductions do not reflect amounts reimbursed, waived, or reduced through arrangements with the investment adviser, brokerage services, or other offset arrangements, if applicable, and do not represent the amount paid by the class during periods when reimbursements, waivers or reductions occur.
J Amount does not include the portfolio activity of any underlying mutual funds or exchange-traded funds (ETFs).
K Portfolio turnover rate excludes securities received or delivered in-kind.
See accompanying notes which are an integral part of the financial statements.
Fidelity Advisor Energy Fund Class C
| Years ended July 31, | 2021 | 2020 | 2019 | 2018 | 2017 |
| Selected Per–Share Data | |||||
| Net asset value, beginning of period | $15.23 | $25.58 | $34.39 | $28.16 | $28.69 |
| Income from Investment Operations | |||||
| Net investment income (loss)A | .45B | .39 | .12 | (.11) | .13C |
| Net realized and unrealized gain (loss) | 6.38 | (10.52) | (8.93) | 6.59 | (.66) |
| Total from investment operations | 6.83 | (10.13) | (8.81) | 6.48 | (.53) |
| Distributions from net investment income | (.46) | (.22) | – | (.24) | – |
| Distributions from net realized gain | – | – | – | –D | – |
| Total distributions | (.46) | (.22) | – | (.25)E | – |
| Redemption fees added to paid in capitalA | – | – | – | – | –D |
| Net asset value, end of period | $21.60 | $15.23 | $25.58 | $34.39 | $28.16 |
| Total ReturnF,G | 45.68% | (39.95)% | (25.62)% | 23.16% | (1.85)% |
| Ratios to Average Net AssetsH,I | |||||
| Expenses before reductions | 1.84% | 1.86% | 1.82% | 1.84% | 1.82% |
| Expenses net of fee waivers, if any | 1.84% | 1.86% | 1.82% | 1.83% | 1.81% |
| Expenses net of all reductions | 1.84% | 1.84% | 1.81% | 1.83% | 1.80% |
| Net investment income (loss) | 2.42%B | 1.90% | .42% | (.37)% | .42%C |
| Supplemental Data | |||||
| Net assets, end of period (000 omitted) | $56,068 | $45,212 | $90,437 | $179,521 | $212,105 |
| Portfolio turnover rateJ | 45% | 84%K | 47% | 56% | 90% |
A Calculated based on average shares outstanding during the period.
B Net investment income per share reflects one or more large, non-recurring dividend(s) which amounted to $.10 per share. Excluding such non-recurring dividend(s), the ratio of net investment income (loss) to average net assets would have been 1.88%.
C Net investment income per share reflects one or more large, non-recurring dividend(s) which amounted to $.32 per share. Excluding such non-recurring dividend(s), the ratio of net investment income (loss) to average net assets would have been (.62) %.
D Amount represents less than $.005 per share.
E Total distributions per share do not sum due to rounding.
F Total returns would have been lower if certain expenses had not been reduced during the applicable periods shown.
G Total returns do not include the effect of the contingent deferred sales charge.
H Fees and expenses of any underlying mutual funds or exchange-traded funds (ETFs) are not included in the Fund's expense ratio. The Fund indirectly bears its proportionate share of these expenses. For additional expense information related to investments in Fidelity Central Funds, please refer to the "Investments in Fidelity Central Funds" note found in the Notes to Financial Statements section of the most recent Annual or Semi-Annual report.
I Expense ratios reflect operating expenses of the class. Expenses before reductions do not reflect amounts reimbursed, waived, or reduced through arrangements with the investment adviser, brokerage services, or other offset arrangements, if applicable, and do not represent the amount paid by the class during periods when reimbursements, waivers or reductions occur.
J Amount does not include the portfolio activity of any underlying mutual funds or exchange-traded funds (ETFs).
K Portfolio turnover rate excludes securities received or delivered in-kind.
See accompanying notes which are an integral part of the financial statements.
Fidelity Advisor Energy Fund Class I
| Years ended July 31, | 2021 | 2020 | 2019 | 2018 | 2017 |
| Selected Per–Share Data | |||||
| Net asset value, beginning of period | $17.51 | $29.39 | $39.57 | $32.36 | $32.78 |
| Income from Investment Operations | |||||
| Net investment income (loss)A | .74B | .67 | .47 | .23 | .50C |
| Net realized and unrealized gain (loss) | 7.35 | (12.02) | (10.31) | 7.57 | (.75) |
| Total from investment operations | 8.09 | (11.35) | (9.84) | 7.80 | (.25) |
| Distributions from net investment income | (.65) | (.53) | (.30)D | (.58) | (.08) |
| Distributions from net realized gain | – | – | (.05)D | –E | (.09) |
| Total distributions | (.65) | (.53) | (.34)F | (.59)F | (.17) |
| Redemption fees added to paid in capitalA | – | – | – | – | –E |
| Net asset value, end of period | $24.95 | $17.51 | $29.39 | $39.57 | $32.36 |
| Total ReturnG | 47.26% | (39.33)% | (24.85)% | 24.43% | (.86)% |
| Ratios to Average Net AssetsH,I | |||||
| Expenses before reductions | .79% | .82% | .80% | .83% | .81% |
| Expenses net of fee waivers, if any | .79% | .82% | .80% | .83% | .81% |
| Expenses net of all reductions | .79% | .80% | .79% | .82% | .80% |
| Net investment income (loss) | 3.47%B | 2.95% | 1.44% | .64% | 1.43%C |
| Supplemental Data | |||||
| Net assets, end of period (000 omitted) | $177,248 | $154,575 | $224,599 | $373,714 | $277,385 |
| Portfolio turnover rateJ | 45% | 84%K | 47% | 56% | 90% |
A Calculated based on average shares outstanding during the period.
B Net investment income per share reflects one or more large, non-recurring dividend(s) which amounted to $.12 per share. Excluding such non-recurring dividend(s), the ratio of net investment income (loss) to average net assets would have been 2.93%.
C Net investment income per share reflects one or more large, non-recurring dividend(s) which amounted to $.36 per share. Excluding such non-recurring dividend(s), the ratio of net investment income (loss) to average net assets would have been .39%.
D The amounts shown reflect certain reclassifications related to book to tax differences that were made in the year shown.
E Amount represents less than $.005 per share.
F Total distributions per share do not sum due to rounding.
G Total returns would have been lower if certain expenses had not been reduced during the applicable periods shown.
H Fees and expenses of any underlying mutual funds or exchange-traded funds (ETFs) are not included in the Fund's expense ratio. The Fund indirectly bears its proportionate share of these expenses. For additional expense information related to investments in Fidelity Central Funds, please refer to the "Investments in Fidelity Central Funds" note found in the Notes to Financial Statements section of the most recent Annual or Semi-Annual report.
I Expense ratios reflect operating expenses of the class. Expenses before reductions do not reflect amounts reimbursed, waived, or reduced through arrangements with the investment adviser, brokerage services, or other offset arrangements, if applicable, and do not represent the amount paid by the class during periods when reimbursements, waivers or reductions occur.
J Amount does not include the portfolio activity of any underlying mutual funds or exchange-traded funds (ETFs).
K Portfolio turnover rate excludes securities received or delivered in-kind.
See accompanying notes which are an integral part of the financial statements.
Fidelity Advisor Energy Fund Class Z
| Years ended July 31, | 2021 | 2020 | 2019 A |
| Selected Per–Share Data | |||
| Net asset value, beginning of period | $17.48 | $29.35 | $39.35 |
| Income from Investment Operations | |||
| Net investment income (loss)B | .80C | .69 | .45 |
| Net realized and unrealized gain (loss) | 7.30 | (11.97) | (10.03) |
| Total from investment operations | 8.10 | (11.28) | (9.58) |
| Distributions from net investment income | (.67) | (.59) | (.37)D |
| Distributions from net realized gain | – | – | (.05)D |
| Total distributions | (.67) | (.59) | (.42) |
| Redemption fees added to paid in capitalB | – | – | – |
| Net asset value, end of period | $24.91 | $17.48 | $29.35 |
| Total ReturnE,F | 47.47% | (39.22)% | (24.34)% |
| Ratios to Average Net AssetsG,H | |||
| Expenses before reductions | .65% | .66% | .65%I |
| Expenses net of fee waivers, if any | .64% | .66% | .64%I |
| Expenses net of all reductions | .64% | .64% | .64%I |
| Net investment income (loss) | 3.62%C | 3.10% | 1.82%I |
| Supplemental Data | |||
| Net assets, end of period (000 omitted) | $81,903 | $40,742 | $9,255 |
| Portfolio turnover rateJ | 45% | 84%K | 47%I |
A For the period October 2, 2018 (commencement of sale of shares) to July 31, 2019.
B Calculated based on average shares outstanding during the period.
C Net investment income per share reflects one or more large, non-recurring dividend(s) which amounted to $.12 per share. Excluding such non-recurring dividend(s), the ratio of net investment income (loss) to average net assets would have been 3.07%.
D The amounts shown reflect certain reclassifications related to book to tax differences that were made in the year shown.
E Total returns for periods of less than one year are not annualized.
F Total returns would have been lower if certain expenses had not been reduced during the applicable periods shown.
G Fees and expenses of any underlying mutual funds or exchange-traded funds (ETFs) are not included in the Fund's expense ratio. The Fund indirectly bears its proportionate share of these expenses. For additional expense information related to investments in Fidelity Central Funds, please refer to the "Investments in Fidelity Central Funds" note found in the Notes to Financial Statements section of the most recent Annual or Semi-Annual report.
H Expense ratios reflect operating expenses of the class. Expenses before reductions do not reflect amounts reimbursed, waived, or reduced through arrangements with the investment adviser, brokerage services, or other offset arrangements, if applicable, and do not represent the amount paid by the class during periods when reimbursements, waivers or reductions occur.
I Annualized
J Amount does not include the portfolio activity of any underlying mutual funds or exchange-traded funds (ETFs).
K Portfolio turnover rate excludes securities received or delivered in-kind.
See accompanying notes which are an integral part of the financial statements.
Fidelity Advisor® Financial Services Fund
Performance: The Bottom Line
Average annual total return reflects the change in the value of an investment, assuming reinvestment of distributions from dividend income and capital gains (the profits earned upon the sale of securities that have grown in value, if any) and assuming a constant rate of performance each year. The hypothetical investment and the average annual total returns do not reflect the deduction of taxes that a shareholder would pay on fund distributions or the redemption of fund shares. During periods of reimbursement by Fidelity, a fund’s total return will be greater than it would be had the reimbursement not occurred. How a fund did yesterday is no guarantee of how it will do tomorrow.
Average Annual Total Returns
| For the periods ended July 31, 2021 | Past 1 year | Past 5 years | Past 10 years |
| Class A (incl. 5.75% sales charge) | 52.53% | 13.46% | 11.52% |
| Class M (incl. 3.50% sales charge) | 55.83% | 13.70% | 11.48% |
| Class C (incl. contingent deferred sales charge) | 59.62% | 13.96% | 11.51% |
| Class I | 62.31% | 15.15% | 12.52% |
| Class Z | 62.53% | 15.24% | 12.57% |
Class C shares' contingent deferred sales charges included in the past one year, past five years and past ten years total return figures are 1%, 0% and 0%, respectively.
The initial offering of Class Z shares took place on October 2, 2018. Returns prior to October 2, 2018 are those of Class I.
$10,000 Over 10 Years
Let's say hypothetically that $10,000 was invested in Fidelity Advisor® Financial Services Fund - Class A on July 31, 2011, and the current 5.75% sales charge was paid.
The chart shows how the value of your investment would have changed, and also shows how the S&P 500® Index performed over the same period.
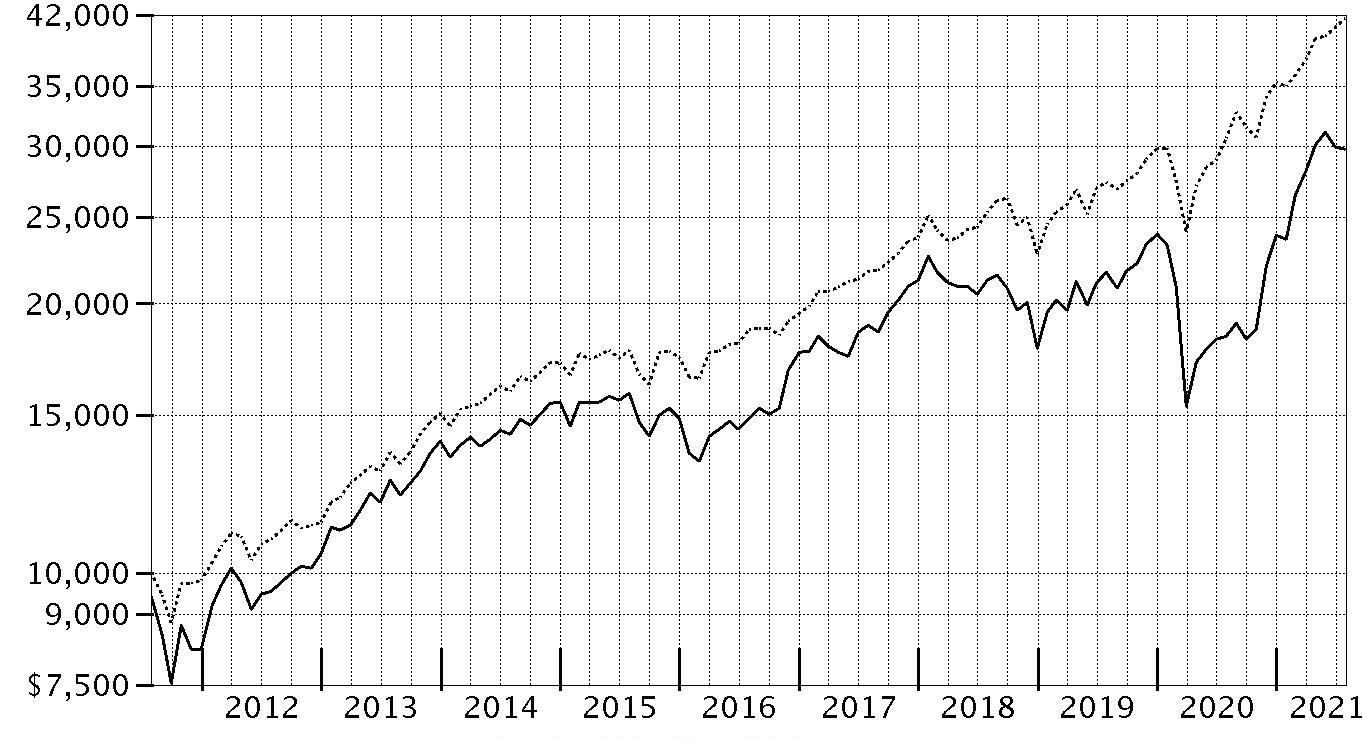
| Period Ending Values | ||
|
| $29,747 | Fidelity Advisor® Financial Services Fund - Class A |
|
| $41,689 | S&P 500® Index |
Fidelity Advisor® Financial Services Fund
Management's Discussion of Fund Performance
Market Recap: The S&P 500® index gained 36.45% for the 12 months ending July 31, 2021, as U.S. equities continued a historic rebound following a steep but brief decline due to the early-2020 outbreak and spread of COVID-19. A confluence of powerful forces propelled risk assets, returning the stock market to pre-pandemic highs by late August 2020. The rally slowed in September, when stocks began a two-month retreat amid Congress’s inability to reach a deal on additional fiscal stimulus, as well as uncertainty about the election. But as the calendar turned, investors grew hopeful. The rollout of three COVID-19 vaccines was underway, the U.S. Federal Reserve pledged to hold interest rates near zero until the economy recovered, and the federal government planned to deploy trillions of dollars to boost consumers and the economy. This backdrop fueled a sharp rotation, with small-cap value usurping leadership from large growth. As part of the “reopening” theme, investors moved out of tech-driven mega-caps that had thrived due to the work-from-home trend in favor of cheap smaller companies that stood to benefit from a broad cyclical recovery. A flattish May reflected concerns about inflation and jobs, but the uptrend resumed through July, driven by corporate earnings. Notably, this leg saw momentum shift back to large growth, as easing rates and a hawkish Fed stymied the reflation trade. By sector, financials (+55%) led, driven by banks (+63%), whereas utilities (+12%) and consumer staples (+18%) notably lagged. Comments from Portfolio Manager Matthew Reed: For the fiscal year ending July 31, 2021, the fund's share classes (excluding sales charges, if applicable) gained about 61% to 63%, outperforming the 57.15% advance of the MSCI US IMI Financials 5% Capped Linked Index, as well as the broad-based S&P 500® index. The top contributors to performance versus the sector index were security selection and an overweighting in consumer finance. Picks among regional banks and an underweighting in the financial exchanges & data segment also bolstered the fund's relative result. The portfolio's largest individual relative contributor was an overweighting in Capital One Financial, which gained 156% the past year and was among our biggest holdings. Also lifting performance was our outsized stake in Wells Fargo, which advanced 92%. The company was the fund's largest holding as of period end. Another notable relative contributor was a larger-than-benchmark position in Morgan Stanley (+101%), also one of our biggest holdings. Conversely, the primary detractor from performance versus the sector index was security selection in investment banking & brokerage. Weak investment choices among data processing & outsourced services companies and multi-sector holdings also hindered the fund's relative result. The portfolio's largest individual relative detractor was an outsized stake in Cannae Holdings, which returned roughly -11% the past 12 months. Also hindering performance was our overweighting in Reinsurance Group of America, which gained 15% and was a stake we established the past year. Also hurting performance was our overweighting in Travelers Companies, which rose about 33%. The stock was one of the fund's biggest holdings the past 12 months. Notable changes in positioning include a higher allocation to asset management & custody banks and consumer finance stocks.The views expressed above reflect those of the portfolio manager(s) only through the end of the period as stated on the cover of this report and do not necessarily represent the views of Fidelity or any other person in the Fidelity organization. Any such views are subject to change at any time based upon market or other conditions and Fidelity disclaims any responsibility to update such views. These views may not be relied on as investment advice and, because investment decisions for a Fidelity fund are based on numerous factors, may not be relied on as an indication of trading intent on behalf of any Fidelity fund.
Fidelity Advisor® Financial Services Fund
Investment Summary (Unaudited)
Top Ten Stocks as of July 31, 2021
| % of fund's net assets | |
| Wells Fargo & Co. | 5.9 |
| Morgan Stanley | 4.8 |
| American Express Co. | 4.6 |
| Citigroup, Inc. | 4.4 |
| Bank of America Corp. | 4.2 |
| Capital One Financial Corp. | 3.7 |
| The Travelers Companies, Inc. | 3.3 |
| State Street Corp. | 3.1 |
| PNC Financial Services Group, Inc. | 2.5 |
| Bank of New York Mellon Corp. | 2.5 |
| 39.0 |
Top Industries (% of fund's net assets)
| As of July 31, 2021 | ||
| Banks | 34.5% | |
| Insurance | 23.1% | |
| Capital Markets | 21.7% | |
| Consumer Finance | 9.5% | |
| Thrifts & Mortgage Finance | 4.9% | |
| All Others* | 6.3% | |

* Includes short-term investments and net other assets (liabilities).
Fidelity Advisor® Financial Services Fund
Schedule of Investments July 31, 2021
Showing Percentage of Net Assets
| Common Stocks - 99.3% | |||
| Shares | Value | ||
| Banks - 34.5% | |||
| Diversified Banks - 17.0% | |||
| Bank of America Corp. | 517,156 | $19,838,104 | |
| Citigroup, Inc. | 301,205 | 20,367,482 | |
| Piraeus Financial Holdings SA (a) | 192,600 | 331,284 | |
| U.S. Bancorp | 200,100 | 11,113,554 | |
| Wells Fargo & Co. | 605,128 | 27,799,581 | |
| 79,450,005 | |||
| Regional Banks - 17.5% | |||
| Ameris Bancorp | 41,000 | 1,993,010 | |
| Associated Banc-Corp. | 112,500 | 2,227,500 | |
| Bank OZK | 98,400 | 4,005,864 | |
| BOK Financial Corp. | 31,716 | 2,664,461 | |
| Cadence Bancorp Class A | 175,764 | 3,339,516 | |
| East West Bancorp, Inc. | 57,300 | 4,076,895 | |
| First Horizon National Corp. | 307,379 | 4,749,006 | |
| First Interstate Bancsystem, Inc. | 41,100 | 1,722,912 | |
| Great Western Bancorp, Inc. | 43,300 | 1,333,640 | |
| Heartland Financial U.S.A., Inc. | 52,500 | 2,395,050 | |
| Huntington Bancshares, Inc./Ohio | 745,920 | 10,502,554 | |
| KeyCorp | 212,700 | 4,181,682 | |
| M&T Bank Corp. | 64,800 | 8,673,480 | |
| PacWest Bancorp | 80,100 | 3,189,582 | |
| Peoples United Financial, Inc. | 111,900 | 1,756,830 | |
| PNC Financial Services Group, Inc. | 64,700 | 11,801,927 | |
| Signature Bank | 27,100 | 6,150,887 | |
| WesBanco, Inc. | 69,400 | 2,240,232 | |
| Wintrust Financial Corp. | 64,100 | 4,576,740 | |
| 81,581,768 | |||
| TOTAL BANKS | 161,031,773 | ||
| Capital Markets - 21.7% | |||
| Asset Management & Custody Banks - 12.0% | |||
| Affiliated Managers Group, Inc. | 30,100 | 4,769,044 | |
| AllianceBernstein Holding LP | 128,005 | 6,178,801 | |
| Bank of New York Mellon Corp. | 225,200 | 11,559,516 | |
| Brookfield Asset Management, Inc. Class A | 128,300 | 6,926,917 | |
| Carlyle Group LP | 131,200 | 6,621,664 | |
| Northern Trust Corp. | 20,600 | 2,324,710 | |
| Patria Investments Ltd. | 216,100 | 3,381,965 | |
| State Street Corp. | 165,800 | 14,447,812 | |
| 56,210,429 | |||
| Financial Exchanges & Data - 2.1% | |||
| Bolsa Mexicana de Valores S.A.B. de CV | 1,278,800 | 2,610,117 | |
| Cboe Global Markets, Inc. | 60,273 | 7,140,542 | |
| 9,750,659 | |||
| Investment Banking & Brokerage - 7.6% | |||
| Lazard Ltd. Class A | 125,600 | 5,928,320 | |
| Morgan Stanley | 232,500 | 22,315,350 | |
| Raymond James Financial, Inc. | 36,500 | 4,726,020 | |
| Virtu Financial, Inc. Class A | 87,900 | 2,262,546 | |
| 35,232,236 | |||
| TOTAL CAPITAL MARKETS | 101,193,324 | ||
| Consumer Finance - 9.5% | |||
| Consumer Finance - 9.5% | |||
| American Express Co. | 125,100 | 21,333,303 | |
| Capital One Financial Corp. | 108,238 | 17,502,085 | |
| OneMain Holdings, Inc. | 94,900 | 5,788,900 | |
| 44,624,288 | |||
| Diversified Financial Services - 1.2% | |||
| Multi-Sector Holdings - 1.2% | |||
| Cannae Holdings, Inc. (a) | 162,640 | 5,407,780 | |
| Insurance - 23.1% | |||
| Insurance Brokers - 3.5% | |||
| Arthur J. Gallagher & Co. | 73,900 | 10,295,009 | |
| Willis Towers Watson PLC | 30,100 | 6,203,008 | |
| 16,498,017 | |||
| Life & Health Insurance - 2.4% | |||
| CNO Financial Group, Inc. | 137,200 | 3,133,648 | |
| MetLife, Inc. | 104,900 | 6,052,730 | |
| Primerica, Inc. | 15,100 | 2,207,922 | |
| 11,394,300 | |||
| Multi-Line Insurance - 5.8% | |||
| American Financial Group, Inc. | 54,200 | 6,855,758 | |
| American International Group, Inc. | 151,700 | 7,182,995 | |
| Assurant, Inc. | 41,200 | 6,501,772 | |
| Hartford Financial Services Group, Inc. | 99,300 | 6,317,466 | |
| 26,857,991 | |||
| Property & Casualty Insurance - 8.2% | |||
| Chubb Ltd. | 50,600 | 8,538,244 | |
| First American Financial Corp. | 62,000 | 4,173,220 | |
| Hiscox Ltd. (a) | 344,100 | 4,191,812 | |
| Kemper Corp. | 34,800 | 2,297,148 | |
| Old Republic International Corp. | 154,800 | 3,817,368 | |
| The Travelers Companies, Inc. | 102,900 | 15,323,868 | |
| 38,341,660 | |||
| Reinsurance - 3.2% | |||
| Brookfield Asset Management Reinsurance Partners Ltd. (a)(b) | 944 | 51,165 | |
| Reinsurance Group of America, Inc. | 79,000 | 8,704,220 | |
| RenaissanceRe Holdings Ltd. | 40,100 | 6,122,869 | |
| 14,878,254 | |||
| TOTAL INSURANCE | 107,970,222 | ||
| IT Services - 2.1% | |||
| Data Processing & Outsourced Services - 2.1% | |||
| Computer Services, Inc. | 16,891 | 980,691 | |
| Fidelity National Information Services, Inc. | 23,700 | 3,532,485 | |
| Visa, Inc. Class A | 21,700 | 5,346,663 | |
| 9,859,839 | |||
| Professional Services - 2.3% | |||
| Research & Consulting Services - 2.3% | |||
| Dun & Bradstreet Holdings, Inc. (a) | 276,200 | 5,789,152 | |
| Equifax, Inc. | 18,900 | 4,925,340 | |
| 10,714,492 | |||
| Thrifts & Mortgage Finance - 4.9% | |||
| Thrifts & Mortgage Finance - 4.9% | |||
| Essent Group Ltd. | 173,700 | 7,846,029 | |
| MGIC Investment Corp. | 575,500 | 7,964,920 | |
| NMI Holdings, Inc. (a) | 287,700 | 6,335,154 | |
| Radian Group, Inc. | 36,800 | 830,944 | |
| 22,977,047 | |||
| TOTAL COMMON STOCKS | |||
| (Cost $342,477,387) | 463,778,765 | ||
| Money Market Funds - 0.6% | |||
| Fidelity Cash Central Fund 0.06% (c) | 2,915,731 | 2,916,314 | |
| Fidelity Securities Lending Cash Central Fund 0.06% (c)(d) | 11,249 | 11,250 | |
| TOTAL MONEY MARKET FUNDS | |||
| (Cost $2,927,564) | 2,927,564 | ||
| TOTAL INVESTMENT IN SECURITIES - 99.9% | |||
| (Cost $345,404,951) | 466,706,329 | ||
| NET OTHER ASSETS (LIABILITIES) - 0.1% | 546,486 | ||
| NET ASSETS - 100% | $467,252,815 |
Legend
(a) Non-income producing
(b) Security or a portion of the security is on loan at period end.
(c) Affiliated fund that is generally available only to investment companies and other accounts managed by Fidelity Investments. The rate quoted is the annualized seven-day yield of the fund at period end. A complete unaudited listing of the fund's holdings as of its most recent quarter end is available upon request. In addition, each Fidelity Central Fund's financial statements, which are not covered by the Fund's Report of Independent Registered Public Accounting Firm, are available on the SEC's website or upon request.
(d) Investment made with cash collateral received from securities on loan.
Affiliated Central Funds
Information regarding fiscal year to date income earned by the Fund from investments in Fidelity Central Funds is as follows:
| Fund | Income earned |
| Fidelity Cash Central Fund | $1,382 |
| Fidelity Securities Lending Cash Central Fund | 641 |
| Total | $2,023 |
Amounts in the income column in the above table include any capital gain distributions from underlying funds, which are presented in the corresponding line-item in the Statement of Operations, if applicable. Amount for Fidelity Securities Lending Cash Central Fund represents the income earned on investing cash collateral, less rebates paid to borrowers and any lending agent fees associated with the loan, plus any premium payments received for lending certain types of securities.
Fiscal year to date information regarding the Fund's investments in Fidelity Central Funds, including the ownership percentage, is presented below.
| Fund | Value, beginning of period | Purchases | Sales Proceeds | Realized Gain/Loss | Change in Unrealized appreciation (depreciation) | Value, end of period | % ownership, end of period |
| Fidelity Cash Central Fund 0.06% | $436,584 | $104,757,741 | $102,277,846 | $(122) | $(43) | $2,916,314 | 0.0% |
| Fidelity Securities Lending Cash Central Fund 0.06% | -- | 35,271,782 | 35,260,532 | -- | -- | 11,250 | 0.0% |
| Total | $436,584 | $140,029,523 | $137,538,378 | $(122) | $(43) | $2,927,564 |
Investment Valuation
The following is a summary of the inputs used, as of July 31, 2021, involving the Fund's assets and liabilities carried at fair value. The inputs or methodology used for valuing securities may not be an indication of the risk associated with investing in those securities. For more information on valuation inputs, and their aggregation into the levels used below, please refer to the Investment Valuation section in the accompanying Notes to Financial Statements.
| Valuation Inputs at Reporting Date: | ||||
| Description | Total | Level 1 | Level 2 | Level 3 |
| Investments in Securities: | ||||
| Common Stocks | $463,778,765 | $463,778,765 | $-- | $-- |
| Money Market Funds | 2,927,564 | 2,927,564 | -- | -- |
| Total Investments in Securities: | $466,706,329 | $466,706,329 | $-- | $-- |
Other Information
Distribution of investments by country or territory of incorporation, as a percentage of Total Net Assets, is as follows (Unaudited):
| United States of America | 89.5% |
| Bermuda | 5.2% |
| Switzerland | 1.8% |
| Canada | 1.5% |
| United Kingdom | 1.3% |
| Others (Individually Less Than 1%) | 0.7% |
| 100.0% |
See accompanying notes which are an integral part of the financial statements.
Fidelity Advisor® Financial Services Fund
Financial Statements
Statement of Assets and Liabilities
| July 31, 2021 | ||
| Assets | ||
| Investment in securities, at value (including securities loaned of $10,840) — See accompanying schedule: Unaffiliated issuers (cost $342,477,387) | $463,778,765 | |
| Fidelity Central Funds (cost $2,927,564) | 2,927,564 | |
| Total Investment in Securities (cost $345,404,951) | $466,706,329 | |
| Receivable for fund shares sold | 500,776 | |
| Dividends receivable | 690,636 | |
| Distributions receivable from Fidelity Central Funds | 108 | |
| Prepaid expenses | 2,691 | |
| Other receivables | 9,747 | |
| Total assets | 467,910,287 | |
| Liabilities | ||
| Payable for fund shares redeemed | 203,916 | |
| Accrued management fee | 202,651 | |
| Transfer agent fee payable | 71,192 | |
| Distribution and service plan fees payable | 110,610 | |
| Other affiliated payables | 15,010 | |
| Other payables and accrued expenses | 42,843 | |
| Collateral on securities loaned | 11,250 | |
| Total liabilities | 657,472 | |
| Net Assets | $467,252,815 | |
| Net Assets consist of: | ||
| Paid in capital | $340,606,732 | |
| Total accumulated earnings (loss) | 126,646,083 | |
| Net Assets | $467,252,815 | |
| Net Asset Value and Maximum Offering Price | ||
| Class A: | ||
| Net Asset Value and redemption price per share ($181,251,089 ÷ 6,379,198 shares)(a) | $28.41 | |
| Maximum offering price per share (100/94.25 of $28.41) | $30.14 | |
| Class M: | ||
| Net Asset Value and redemption price per share ($60,507,844 ÷ 2,155,133 shares)(a) | $28.08 | |
| Maximum offering price per share (100/96.50 of $28.08) | $29.10 | |
| Class C: | ||
| Net Asset Value and offering price per share ($57,856,000 ÷ 2,184,863 shares)(a) | $26.48 | |
| Class I: | ||
| Net Asset Value, offering price and redemption price per share ($118,423,908 ÷ 4,038,574 shares) | $29.32 | |
| Class Z: | ||
| Net Asset Value, offering price and redemption price per share ($49,213,974 ÷ 1,681,065 shares) | $29.28 |
(a) Redemption price per share is equal to net asset value less any applicable contingent deferred sales charge.
See accompanying notes which are an integral part of the financial statements.
Statement of Operations
| Year ended July 31, 2021 | ||
| Investment Income | ||
| Dividends | $10,192,775 | |
| Income from Fidelity Central Funds (including $641 from security lending) | 2,023 | |
| Total income | 10,194,798 | |
| Expenses | ||
| Management fee | $1,901,717 | |
| Transfer agent fees | 662,966 | |
| Distribution and service plan fees | 1,081,161 | |
| Accounting fees | 140,415 | |
| Custodian fees and expenses | 8,342 | |
| Independent trustees' fees and expenses | 1,454 | |
| Registration fees | 104,127 | |
| Audit | 52,560 | |
| Legal | 1,843 | |
| Interest | 1,274 | |
| Miscellaneous | 3,813 | |
| Total expenses before reductions | 3,959,672 | |
| Expense reductions | (26,143) | |
| Total expenses after reductions | 3,933,529 | |
| Net investment income (loss) | 6,261,269 | |
| Realized and Unrealized Gain (Loss) | ||
| Net realized gain (loss) on: | ||
| Investment securities: | ||
| Unaffiliated issuers | 6,250,588 | |
| Fidelity Central Funds | (122) | |
| Foreign currency transactions | 6,678 | |
| Total net realized gain (loss) | 6,257,144 | |
| Change in net unrealized appreciation (depreciation) on: | ||
| Investment securities: | ||
| Unaffiliated issuers | 138,800,098 | |
| Fidelity Central Funds | (43) | |
| Total change in net unrealized appreciation (depreciation) | 138,800,055 | |
| Net gain (loss) | 145,057,199 | |
| Net increase (decrease) in net assets resulting from operations | $151,318,468 |
See accompanying notes which are an integral part of the financial statements.
Statement of Changes in Net Assets
| Year ended July 31, 2021 | Year ended July 31, 2020 | |
| Increase (Decrease) in Net Assets | ||
| Operations | ||
| Net investment income (loss) | $6,261,269 | $6,650,433 |
| Net realized gain (loss) | 6,257,144 | 13,281,773 |
| Change in net unrealized appreciation (depreciation) | 138,800,055 | (73,279,249) |
| Net increase (decrease) in net assets resulting from operations | 151,318,468 | (53,347,043) |
| Distributions to shareholders | (7,232,777) | (4,735,011) |
| Share transactions - net increase (decrease) | 25,541,998 | (24,010,625) |
| Total increase (decrease) in net assets | 169,627,689 | (82,092,679) |
| Net Assets | ||
| Beginning of period | 297,625,126 | 379,717,805 |
| End of period | $467,252,815 | $297,625,126 |
See accompanying notes which are an integral part of the financial statements.
Financial Highlights
Fidelity Advisor Financial Services Fund Class A
| Years ended July 31, | 2021 | 2020 | 2019 | 2018 | 2017 |
| Selected Per–Share Data | |||||
| Net asset value, beginning of period | $18.00 | $21.47 | $21.84 | $19.55 | $15.43 |
| Income from Investment Operations | |||||
| Net investment income (loss)A | .42 | .40 | .27 | .12 | .08 |
| Net realized and unrealized gain (loss) | 10.55 | (3.59) | .07B | 2.25 | 4.08 |
| Total from investment operations | 10.97 | (3.19) | .34 | 2.37 | 4.16 |
| Distributions from net investment income | (.45) | (.28) | (.18) | (.07) | (.04) |
| Distributions from net realized gain | (.11) | – | (.53) | (.01) | – |
| Total distributions | (.56) | (.28) | (.71) | (.08) | (.04) |
| Redemption fees added to paid in capitalA | – | – | – | – | –C |
| Net asset value, end of period | $28.41 | $18.00 | $21.47 | $21.84 | $19.55 |
| Total ReturnD,E | 61.84% | (15.15)% | 2.05% | 12.13% | 26.97% |
| Ratios to Average Net AssetsF,G | |||||
| Expenses before reductions | 1.07% | 1.09% | 1.08% | 1.10% | 1.12% |
| Expenses net of fee waivers, if any | 1.07% | 1.09% | 1.07% | 1.10% | 1.12% |
| Expenses net of all reductions | 1.06% | 1.08% | 1.07% | 1.09% | 1.12% |
| Net investment income (loss) | 1.76% | 1.97% | 1.31% | .55% | .48% |
| Supplemental Data | |||||
| Net assets, end of period (000 omitted) | $181,251 | $104,761 | $145,799 | $174,786 | $144,144 |
| Portfolio turnover rateH | 51% | 88%I | 51% | 46% | 81% |
A Calculated based on average shares outstanding during the period.
B The amount shown for a share outstanding does not correspond with the aggregate net gain (loss) on investments for the period due to the timing of sales and repurchases of shares in relation to fluctuating market values of the investments of the Fund.
C Amount represents less than $.005 per share.
D Total returns would have been lower if certain expenses had not been reduced during the applicable periods shown.
E Total returns do not include the effect of the sales charges.
F Fees and expenses of any underlying mutual funds or exchange-traded funds (ETFs) are not included in the Fund's expense ratio. The Fund indirectly bears its proportionate share of these expenses. For additional expense information related to investments in Fidelity Central Funds, please refer to the "Investments in Fidelity Central Funds" note found in the Notes to Financial Statements section of the most recent Annual or Semi-Annual report.
G Expense ratios reflect operating expenses of the class. Expenses before reductions do not reflect amounts reimbursed, waived, or reduced through arrangements with the investment adviser, brokerage services, or other offset arrangements, if applicable, and do not represent the amount paid by the class during periods when reimbursements, waivers or reductions occur.
H Amount does not include the portfolio activity of any underlying mutual funds or exchange-traded funds (ETFs).
I Portfolio turnover rate excludes securities received or delivered in-kind.
See accompanying notes which are an integral part of the financial statements.
Fidelity Advisor Financial Services Fund Class M
| Years ended July 31, | 2021 | 2020 | 2019 | 2018 | 2017 |
| Selected Per–Share Data | |||||
| Net asset value, beginning of period | $17.79 | $21.23 | $21.60 | $19.34 | $15.29 |
| Income from Investment Operations | |||||
| Net investment income (loss)A | .36 | .34 | .21 | .06 | .04 |
| Net realized and unrealized gain (loss) | 10.44 | (3.55) | .07B | 2.23 | 4.03 |
| Total from investment operations | 10.80 | (3.21) | .28 | 2.29 | 4.07 |
| Distributions from net investment income | (.39) | (.23) | (.13) | (.02) | (.02) |
| Distributions from net realized gain | (.11) | – | (.53) | (.01) | – |
| Total distributions | (.51)C | (.23) | (.65)C | (.03) | (.02) |
| Redemption fees added to paid in capitalA | – | – | – | – | –D |
| Net asset value, end of period | $28.08 | $17.79 | $21.23 | $21.60 | $19.34 |
| Total ReturnE,F | 61.48% | (15.38)% | 1.77% | 11.84% | 26.63% |
| Ratios to Average Net AssetsG,H | |||||
| Expenses before reductions | 1.32% | 1.35% | 1.34% | 1.37% | 1.40% |
| Expenses net of fee waivers, if any | 1.32% | 1.35% | 1.34% | 1.37% | 1.40% |
| Expenses net of all reductions | 1.31% | 1.34% | 1.33% | 1.36% | 1.40% |
| Net investment income (loss) | 1.51% | 1.72% | 1.04% | .28% | .20% |
| Supplemental Data | |||||
| Net assets, end of period (000 omitted) | $60,508 | $34,828 | $48,210 | $53,178 | $45,920 |
| Portfolio turnover rateI | 51% | 88%J | 51% | 46% | 81% |
A Calculated based on average shares outstanding during the period.
B The amount shown for a share outstanding does not correspond with the aggregate net gain (loss) on investments for the period due to the timing of sales and repurchases of shares in relation to fluctuating market values of the investments of the Fund.
C Total distributions per share do not sum due to rounding.
D Amount represents less than $.005 per share.
E Total returns would have been lower if certain expenses had not been reduced during the applicable periods shown.
F Total returns do not include the effect of the sales charges.
G Fees and expenses of any underlying mutual funds or exchange-traded funds (ETFs) are not included in the Fund's expense ratio. The Fund indirectly bears its proportionate share of these expenses. For additional expense information related to investments in Fidelity Central Funds, please refer to the "Investments in Fidelity Central Funds" note found in the Notes to Financial Statements section of the most recent Annual or Semi-Annual report.
H Expense ratios reflect operating expenses of the class. Expenses before reductions do not reflect amounts reimbursed, waived, or reduced through arrangements with the investment adviser, brokerage services, or other offset arrangements, if applicable, and do not represent the amount paid by the class during periods when reimbursements, waivers or reductions occur.
I Amount does not include the portfolio activity of any underlying mutual funds or exchange-traded funds (ETFs).
J Portfolio turnover rate excludes securities received or delivered in-kind.
See accompanying notes which are an integral part of the financial statements.
Fidelity Advisor Financial Services Fund Class C
| Years ended July 31, | 2021 | 2020 | 2019 | 2018 | 2017 |
| Selected Per–Share Data | |||||
| Net asset value, beginning of period | $16.80 | $20.04 | $20.41 | $18.34 | $14.55 |
| Income from Investment Operations | |||||
| Net investment income (loss)A | .22 | .23 | .11 | (.04) | (.05) |
| Net realized and unrealized gain (loss) | 9.85 | (3.37) | .07B | 2.11 | 3.84 |
| Total from investment operations | 10.07 | (3.14) | .18 | 2.07 | 3.79 |
| Distributions from net investment income | (.28) | (.10) | (.03) | – | –C |
| Distributions from net realized gain | (.11) | – | (.53) | – | – |
| Total distributions | (.39) | (.10) | (.55)D | – | –C |
| Redemption fees added to paid in capitalA | – | – | – | – | –C |
| Net asset value, end of period | $26.48 | $16.80 | $20.04 | $20.41 | $18.34 |
| Total ReturnE,F | 60.62% | (15.79)% | 1.29% | 11.29% | 26.06% |
| Ratios to Average Net AssetsG,H | |||||
| Expenses before reductions | 1.83% | 1.84% | 1.83% | 1.86% | 1.87% |
| Expenses net of fee waivers, if any | 1.82% | 1.84% | 1.82% | 1.85% | 1.87% |
| Expenses net of all reductions | 1.82% | 1.83% | 1.82% | 1.85% | 1.87% |
| Net investment income (loss) | 1.00% | 1.22% | .56% | (.20)% | (.27)% |
| Supplemental Data | |||||
| Net assets, end of period (000 omitted) | $57,856 | $41,947 | $71,609 | $120,947 | $92,593 |
| Portfolio turnover rateI | 51% | 88%J | 51% | 46% | 81% |
A Calculated based on average shares outstanding during the period.
B The amount shown for a share outstanding does not correspond with the aggregate net gain (loss) on investments for the period due to the timing of sales and repurchases of shares in relation to fluctuating market values of the investments of the Fund.
C Amount represents less than $.005 per share.
D Total distributions per share do not sum due to rounding.
E Total returns would have been lower if certain expenses had not been reduced during the applicable periods shown.
F Total returns do not include the effect of the contingent deferred sales charge.
G Fees and expenses of any underlying mutual funds or exchange-traded funds (ETFs) are not included in the Fund's expense ratio. The Fund indirectly bears its proportionate share of these expenses. For additional expense information related to investments in Fidelity Central Funds, please refer to the "Investments in Fidelity Central Funds" note found in the Notes to Financial Statements section of the most recent Annual or Semi-Annual report.
H Expense ratios reflect operating expenses of the class. Expenses before reductions do not reflect amounts reimbursed, waived, or reduced through arrangements with the investment adviser, brokerage services, or other offset arrangements, if applicable, and do not represent the amount paid by the class during periods when reimbursements, waivers or reductions occur.
I Amount does not include the portfolio activity of any underlying mutual funds or exchange-traded funds (ETFs).
J Portfolio turnover rate excludes securities received or delivered in-kind.
See accompanying notes which are an integral part of the financial statements.
Fidelity Advisor Financial Services Fund Class I
| Years ended July 31, | 2021 | 2020 | 2019 | 2018 | 2017 |
| Selected Per–Share Data | |||||
| Net asset value, beginning of period | $18.55 | $22.11 | $22.47 | $20.11 | $15.84 |
| Income from Investment Operations | |||||
| Net investment income (loss)A | .52 | .47 | .33 | .18 | .14 |
| Net realized and unrealized gain (loss) | 10.86 | (3.69) | .08B | 2.32 | 4.19 |
| Total from investment operations | 11.38 | (3.22) | .41 | 2.50 | 4.33 |
| Distributions from net investment income | (.50) | (.34) | (.25) | (.13) | (.06) |
| Distributions from net realized gain | (.11) | – | (.53) | (.01) | – |
| Total distributions | (.61) | (.34) | (.77)C | (.14) | (.06) |
| Redemption fees added to paid in capitalA | – | – | – | – | –D |
| Net asset value, end of period | $29.32 | $18.55 | $22.11 | $22.47 | $20.11 |
| Total ReturnE | 62.31% | (14.91)% | 2.36% | 12.43% | 27.36% |
| Ratios to Average Net AssetsF,G | |||||
| Expenses before reductions | .79% | .80% | .80% | .83% | .84% |
| Expenses net of fee waivers, if any | .79% | .80% | .79% | .83% | .84% |
| Expenses net of all reductions | .78% | .78% | .79% | .82% | .83% |
| Net investment income (loss) | 2.04% | 2.27% | 1.59% | .83% | .76% |
| Supplemental Data | |||||
| Net assets, end of period (000 omitted) | $118,424 | $85,299 | $107,059 | $162,724 | $96,789 |
| Portfolio turnover rateH | 51% | 88%I | 51% | 46% | 81% |
A Calculated based on average shares outstanding during the period.
B The amount shown for a share outstanding does not correspond with the aggregate net gain (loss) on investments for the period due to the timing of sales and repurchases of shares in relation to fluctuating market values of the investments of the Fund.
C Total distributions per share do not sum due to rounding.
D Amount represents less than $.005 per share.
E Total returns would have been lower if certain expenses had not been reduced during the applicable periods shown.
F Fees and expenses of any underlying mutual funds or exchange-traded funds (ETFs) are not included in the Fund's expense ratio. The Fund indirectly bears its proportionate share of these expenses. For additional expense information related to investments in Fidelity Central Funds, please refer to the "Investments in Fidelity Central Funds" note found in the Notes to Financial Statements section of the most recent Annual or Semi-Annual report.
G Expense ratios reflect operating expenses of the class. Expenses before reductions do not reflect amounts reimbursed, waived, or reduced through arrangements with the investment adviser, brokerage services, or other offset arrangements, if applicable, and do not represent the amount paid by the class during periods when reimbursements, waivers or reductions occur.
H Amount does not include the portfolio activity of any underlying mutual funds or exchange-traded funds (ETFs).
I Portfolio turnover rate excludes securities received or delivered in-kind.
See accompanying notes which are an integral part of the financial statements.
Fidelity Advisor Financial Services Fund Class Z
| Years ended July 31, | 2021 | 2020 | 2019 A |
| Selected Per–Share Data | |||
| Net asset value, beginning of period | $18.53 | $22.09 | $21.99 |
| Income from Investment Operations | |||
| Net investment income (loss)B | .54 | .49 | .25 |
| Net realized and unrealized gain (loss) | 10.86 | (3.67) | .66C |
| Total from investment operations | 11.40 | (3.18) | .91 |
| Distributions from net investment income | (.54) | (.38) | (.29) |
| Distributions from net realized gain | (.11) | – | (.53) |
| Total distributions | (.65) | (.38) | (.81)D |
| Redemption fees added to paid in capitalB | – | – | – |
| Net asset value, end of period | $29.28 | $18.53 | $22.09 |
| Total ReturnE,F | 62.53% | (14.79)% | 4.72% |
| Ratios to Average Net AssetsG,H | |||
| Expenses before reductions | .66% | .67% | .66%I |
| Expenses net of fee waivers, if any | .66% | .67% | .65%I |
| Expenses net of all reductions | .65% | .65% | .65%I |
| Net investment income (loss) | 2.17% | 2.40% | 1.44%I |
| Supplemental Data | |||
| Net assets, end of period (000 omitted) | $49,214 | $30,790 | $7,041 |
| Portfolio turnover rateJ | 51% | 88%K | 51%I |
A For the period October 2, 2018 (commencement of sale of shares) to July 31, 2019.
B Calculated based on average shares outstanding during the period.
C The amount shown for a share outstanding does not correspond with the aggregate net gain (loss) on investments for the period due to the timing of sales and repurchases of shares in relation to fluctuating market values of the investments of the Fund.
D Total distributions per share do not sum due to rounding.
E Total returns for periods of less than one year are not annualized.
F Total returns would have been lower if certain expenses had not been reduced during the applicable periods shown.
G Fees and expenses of any underlying mutual funds or exchange-traded funds (ETFs) are not included in the Fund's expense ratio. The Fund indirectly bears its proportionate share of these expenses. For additional expense information related to investments in Fidelity Central Funds, please refer to the "Investments in Fidelity Central Funds" note found in the Notes to Financial Statements section of the most recent Annual or Semi-Annual report.
H Expense ratios reflect operating expenses of the class. Expenses before reductions do not reflect amounts reimbursed, waived, or reduced through arrangements with the investment adviser, brokerage services, or other offset arrangements, if applicable, and do not represent the amount paid by the class during periods when reimbursements, waivers or reductions occur.
I Annualized
J Amount does not include the portfolio activity of any underlying mutual funds or exchange-traded funds (ETFs).
K Portfolio turnover rate excludes securities received or delivered in-kind.
See accompanying notes which are an integral part of the financial statements.
Fidelity Advisor® Health Care Fund
Performance: The Bottom Line
Average annual total return reflects the change in the value of an investment, assuming reinvestment of distributions from dividend income and capital gains (the profits earned upon the sale of securities that have grown in value, if any) and assuming a constant rate of performance each year. The hypothetical investment and the average annual total returns do not reflect the deduction of taxes that a shareholder would pay on fund distributions or the redemption of fund shares. During periods of reimbursement by Fidelity, a fund’s total return will be greater than it would be had the reimbursement not occurred. How a fund did yesterday is no guarantee of how it will do tomorrow.
Average Annual Total Returns
| For the periods ended July 31, 2021 | Past 1 year | Past 5 years | Past 10 years |
| Class A (incl. 5.75% sales charge) | 13.76% | 13.83% | 16.94% |
| Class M (incl. 3.50% sales charge) | 16.17% | 14.07% | 16.91% |
| Class C (incl. contingent deferred sales charge) | 18.78% | 14.32% | 16.94% |
| Class I | 21.01% | 15.49% | 17.95% |
| Class Z | 21.15% | 15.57% | 17.99% |
Class C shares' contingent deferred sales charges included in the past one year, past five years and past ten years total return figures are 1%, 0% and 0%, respectively.
The initial offering of Class Z shares took place on October 2, 2018. Returns prior to October 2, 2018, are those of Class I.
$10,000 Over 10 Years
Let's say hypothetically that $10,000 was invested in Fidelity Advisor® Health Care Fund - Class A on July 31, 2011, and the current 5.75% sales charge was paid.
The chart shows how the value of your investment would have changed, and also shows how the S&P 500® Index performed over the same period.
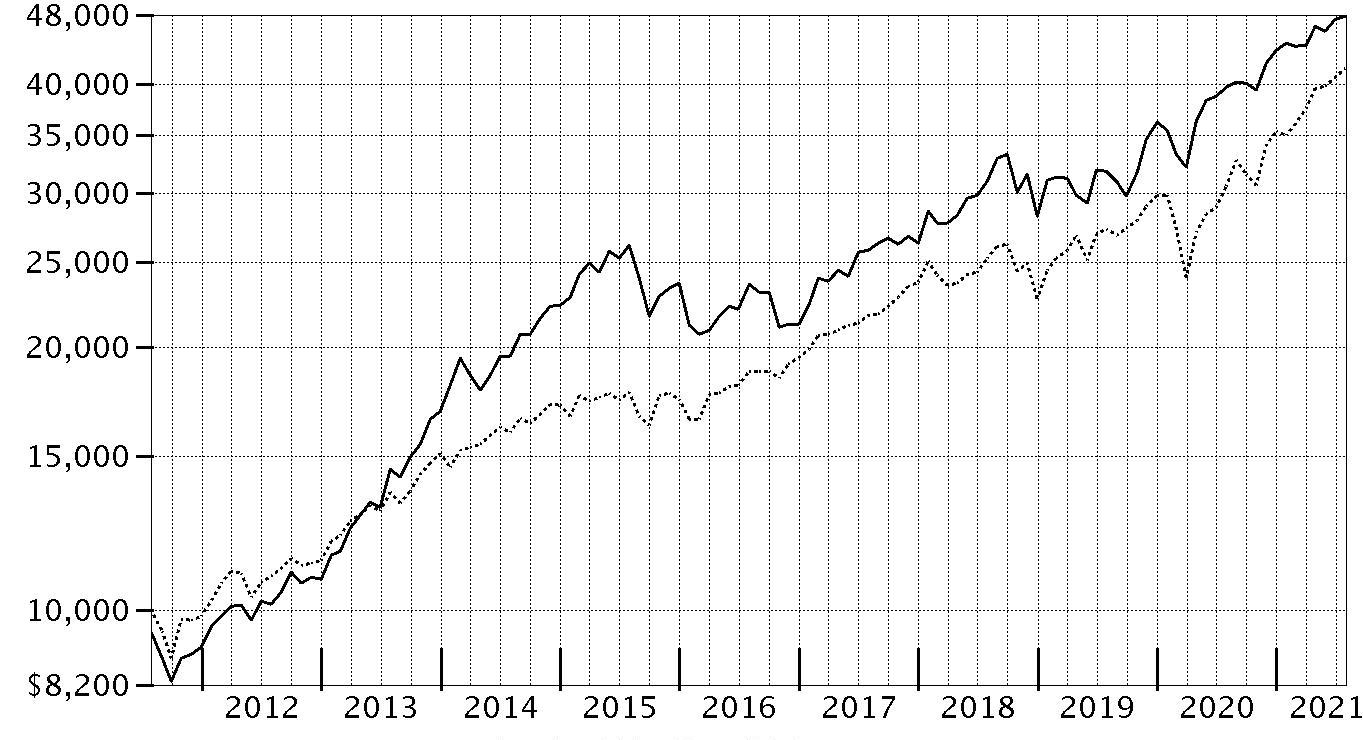
| Period Ending Values | ||
|
| $47,829 | Fidelity Advisor® Health Care Fund - Class A |
|
| $41,689 | S&P 500® Index |
Fidelity Advisor® Health Care Fund
Management's Discussion of Fund Performance
Market Recap: The S&P 500® index gained 36.45% for the 12 months ending July 31, 2021, as U.S. equities continued a historic rebound following a steep but brief decline due to the early-2020 outbreak and spread of COVID-19. A confluence of powerful forces propelled risk assets, returning the stock market to pre-pandemic highs by late August 2020. The rally slowed in September, when stocks began a two-month retreat amid Congress’s inability to reach a deal on additional fiscal stimulus, as well as uncertainty about the election. But as the calendar turned, investors grew hopeful. The rollout of three COVID-19 vaccines was underway, the U.S. Federal Reserve pledged to hold interest rates near zero until the economy recovered, and the federal government planned to deploy trillions of dollars to boost consumers and the economy. This backdrop fueled a sharp rotation, with small-cap value usurping leadership from large growth. As part of the “reopening” theme, investors moved out of tech-driven mega-caps that had thrived due to the work-from-home trend in favor of cheap smaller companies that stood to benefit from a broad cyclical recovery. A flattish May reflected concerns about inflation and jobs, but the uptrend resumed through July, driven by corporate earnings. Notably, this leg saw momentum shift back to large growth, as easing rates and a hawkish Fed stymied the reflation trade. By sector, financials (+55%) led, driven by banks (+63%), whereas utilities (+12%) and consumer staples (+18%) notably lagged. Comments from Portfolio Manager Eddie Yoon: For the fiscal year ending July 31, 2021, the fund's share classes (excluding sales charges, if applicable) gained about 20% to 21%, trailing the 28.16% advance of the MSCI US IMI Health Care 25/50 Index, as well as the broad-based S&P 500® index. Versus the sector index, security selection was the primary detractor, especially in the biotechnology group. We also had weak stock picks in managed health care and health care equipment. Not owning Moderna, an index component that gained 377%, was the largest individual relative detractor. Also holding back performance was our overweighting in Regeneron Pharmaceuticals, which returned -9%. Regeneron Pharmaceuticals was one of the fund's biggest holdings. The fund's non-index stake in AstraZeneca, one of our largest holdings the past 12 months, gained about 5%. Conversely, the largest contributor to performance versus the sector index were stock picks in health care technology. Also lifting the fund's relative performance was stock selection and an overweighting in health care services and security selection and an underweighting in pharmaceuticals. The fund's top individual relative contributor was our overweighting in MyoKardia, which gained about 147%. This is a position that was sold the past 12 months. Also boosting value was our outsized stake in Oak Street Health, which gained 75%. This was a position we established the past year. Avoiding Merck, an index component that gained 4%, also helped relative performance. Notable changes in positioning include increased exposure to the health care services subindustry and a lower allocation to pharmaceuticals.The views expressed above reflect those of the portfolio manager(s) only through the end of the period as stated on the cover of this report and do not necessarily represent the views of Fidelity or any other person in the Fidelity organization. Any such views are subject to change at any time based upon market or other conditions and Fidelity disclaims any responsibility to update such views. These views may not be relied on as investment advice and, because investment decisions for a Fidelity fund are based on numerous factors, may not be relied on as an indication of trading intent on behalf of any Fidelity fund.
Fidelity Advisor® Health Care Fund
Investment Summary (Unaudited)
Top Ten Stocks as of July 31, 2021
| % of fund's net assets | |
| UnitedHealth Group, Inc. | 9.0 |
| Humana, Inc. | 5.8 |
| Danaher Corp. | 5.6 |
| Boston Scientific Corp. | 5.5 |
| Eli Lilly & Co. | 5.1 |
| Cigna Corp. | 5.0 |
| Regeneron Pharmaceuticals, Inc. | 2.9 |
| Centene Corp. | 2.9 |
| Penumbra, Inc. | 2.8 |
| Insulet Corp. | 2.5 |
| 47.1 |
Top Industries (% of fund's net assets)
| As of July 31, 2021 | ||
| Health Care Providers & Services | 29.8% | |
| Health Care Equipment & Supplies | 22.0% | |
| Biotechnology | 21.2% | |
| Pharmaceuticals | 14.5% | |
| Life Sciences Tools & Services | 9.7% | |
| All Others* | 2.8% | |

* Includes short-term investments and net other assets (liabilities).
Fidelity Advisor® Health Care Fund
Schedule of Investments July 31, 2021
Showing Percentage of Net Assets
| Common Stocks - 98.9% | |||
| Shares | Value | ||
| Biotechnology - 20.7% | |||
| Biotechnology - 20.7% | |||
| Acceleron Pharma, Inc. (a) | 280,000 | $35,016,800 | |
| ADC Therapeutics SA (a) | 579,797 | 12,198,929 | |
| Agios Pharmaceuticals, Inc. (a) | 700,000 | 33,663,000 | |
| Alnylam Pharmaceuticals, Inc. (a) | 641,600 | 114,807,904 | |
| Ambrx Biopharma, Inc. ADR | 85,456 | 1,670,665 | |
| Arcutis Biotherapeutics, Inc. (a) | 380,500 | 8,877,065 | |
| Argenx SE ADR (a) | 500,000 | 152,215,000 | |
| Ascendis Pharma A/S sponsored ADR (a) | 565,107 | 66,789,996 | |
| Avid Bioservices, Inc. (a) | 1,000,000 | 25,650,000 | |
| BeiGene Ltd. ADR (a) | 80,000 | 25,327,200 | |
| BioAtla, Inc. | 340,000 | 13,936,600 | |
| Blueprint Medicines Corp. (a) | 230,000 | 20,210,100 | |
| Century Therapeutics, Inc. (b) | 270,585 | 7,887,553 | |
| Cerevel Therapeutics Holdings (a) | 521,542 | 12,850,795 | |
| Cytokinetics, Inc. (a) | 900,000 | 26,712,000 | |
| Denali Therapeutics, Inc. (a) | 360,000 | 18,370,800 | |
| Erasca, Inc. | 275,657 | 5,788,797 | |
| Exelixis, Inc. (a) | 1,280,000 | 21,568,000 | |
| Fate Therapeutics, Inc. (a) | 405,800 | 33,600,240 | |
| Forma Therapeutics Holdings, Inc. (a) | 460,000 | 10,529,400 | |
| Generation Bio Co. (a) | 249,620 | 5,426,739 | |
| Graphite Bio, Inc. | 400,000 | 8,544,000 | |
| Imago BioSciences, Inc. | 28,000 | 512,960 | |
| Innovent Biologics, Inc. (a)(c) | 4,000,000 | 40,791,903 | |
| Instil Bio, Inc. (a) | 500,000 | 7,525,000 | |
| Intellia Therapeutics, Inc. (a) | 120,000 | 17,022,000 | |
| Janux Therapeutics, Inc. | 171,000 | 5,545,530 | |
| Keros Therapeutics, Inc. (a) | 320,000 | 11,776,000 | |
| Kinnate Biopharma, Inc. (b) | 180,000 | 3,884,400 | |
| Kura Oncology, Inc. (a) | 960,000 | 18,182,400 | |
| Kymera Therapeutics, Inc. (a) | 280,000 | 16,850,400 | |
| Mirati Therapeutics, Inc. (a) | 350,000 | 56,021,000 | |
| Morphic Holding, Inc. (a) | 175,200 | 10,095,024 | |
| Novavax, Inc. (a) | 190,000 | 34,072,700 | |
| Nuvalent, Inc. Class A | 158,800 | 2,898,100 | |
| ORIC Pharmaceuticals, Inc. (a) | 426,600 | 7,102,890 | |
| Passage Bio, Inc. (a) | 460,000 | 5,428,000 | |
| Poseida Therapeutics, Inc. (a) | 975,154 | 7,908,499 | |
| Prelude Therapeutics, Inc. (b) | 570,200 | 18,269,208 | |
| PTC Therapeutics, Inc. (a) | 693,000 | 26,562,690 | |
| Recursion Pharmaceuticals, Inc. (a)(b) | 200,000 | 6,070,000 | |
| Regeneron Pharmaceuticals, Inc. (a) | 364,000 | 209,158,040 | |
| Relay Therapeutics, Inc. (a) | 840,000 | 27,249,600 | |
| Repare Therapeutics, Inc. (a) | 284,700 | 9,508,980 | |
| Revolution Medicines, Inc. (a)(b) | 750,000 | 21,480,000 | |
| Sarepta Therapeutics, Inc. (a) | 580,000 | 39,312,400 | |
| Scholar Rock Holding Corp. (a)(b) | 82,775 | 2,586,719 | |
| Shattuck Labs, Inc. | 637,671 | 14,054,269 | |
| Stoke Therapeutics, Inc. (a) | 320,000 | 9,161,600 | |
| Taysha Gene Therapies, Inc. | 222,421 | 3,845,659 | |
| TG Therapeutics, Inc. (a) | 1,900,000 | 66,481,000 | |
| Twist Bioscience Corp. (a) | 120,400 | 14,815,220 | |
| uniQure B.V. (a) | 440,000 | 12,764,400 | |
| Vaxcyte, Inc. (a) | 479,723 | 10,400,395 | |
| Xencor, Inc. (a) | 900,000 | 27,702,000 | |
| Zentalis Pharmaceuticals, Inc. (a) | 796,725 | 42,393,737 | |
| Zymeworks, Inc. (a) | 588,995 | 18,900,850 | |
| 1,487,975,156 | |||
| Health Care Equipment & Supplies - 22.0% | |||
| Health Care Equipment - 22.0% | |||
| Boston Scientific Corp. (a) | 8,700,000 | 396,720,000 | |
| Danaher Corp. | 1,360,000 | 404,586,400 | |
| DexCom, Inc. (a) | 72,000 | 37,116,720 | |
| Envista Holdings Corp. (a) | 1,263,500 | 54,431,580 | |
| Hologic, Inc. (a) | 1,080,000 | 81,043,200 | |
| Insulet Corp. (a) | 651,023 | 182,084,623 | |
| Intuitive Surgical, Inc. (a) | 58,000 | 57,504,680 | |
| Masimo Corp. (a) | 270,000 | 73,545,300 | |
| Nevro Corp. (a) | 100,000 | 15,500,000 | |
| Outset Medical, Inc. | 582,262 | 23,849,452 | |
| Penumbra, Inc. (a) | 765,000 | 203,665,950 | |
| Tandem Diabetes Care, Inc. (a) | 500,000 | 54,335,000 | |
| 1,584,382,905 | |||
| Health Care Providers & Services - 29.8% | |||
| Health Care Facilities - 3.5% | |||
| Cano Health, Inc. (a)(b) | 1,080,000 | 11,610,000 | |
| Cano Health, Inc. (d) | 2,487,400 | 26,739,550 | |
| HCA Holdings, Inc. | 580,000 | 143,956,000 | |
| Rede D'Oregon Sao Luiz SA (c) | 3,900,000 | 51,668,027 | |
| Surgery Partners, Inc. (a) | 280,000 | 15,276,800 | |
| 249,250,377 | |||
| Health Care Services - 7.5% | |||
| 1Life Healthcare, Inc. (a) | 365,136 | 9,873,277 | |
| agilon health, Inc. (a)(b) | 900,000 | 33,111,000 | |
| Cigna Corp. | 1,560,000 | 358,004,400 | |
| Guardant Health, Inc. (a) | 360,000 | 39,528,000 | |
| LifeStance Health Group, Inc. | 390,000 | 9,243,000 | |
| Oak Street Health, Inc. (a)(b) | 1,400,000 | 88,256,000 | |
| Option Care Health, Inc. (a) | 176,469 | 3,656,438 | |
| 541,672,115 | |||
| Managed Health Care - 18.8% | |||
| Alignment Healthcare, Inc. (a)(b) | 636,548 | 13,259,295 | |
| Alignment Healthcare, Inc. | 1,734,698 | 34,327,071 | |
| Anthem, Inc. | 85,000 | 32,640,850 | |
| Centene Corp. (a) | 3,000,000 | 205,830,000 | |
| Humana, Inc. | 990,000 | 421,601,400 | |
| UnitedHealth Group, Inc. | 1,565,000 | 645,124,298 | |
| 1,352,782,914 | |||
| TOTAL HEALTH CARE PROVIDERS & SERVICES | 2,143,705,406 | ||
| Health Care Technology - 1.9% | |||
| Health Care Technology - 1.9% | |||
| Castlight Health, Inc. (a) | 331,400 | 772,162 | |
| Castlight Health, Inc. Class B (a) | 2,768,459 | 6,450,509 | |
| Doximity, Inc. | 20,000 | 1,238,000 | |
| Evolent Health, Inc. (a) | 252,170 | 5,784,780 | |
| Health Catalyst, Inc. (a) | 821,200 | 47,678,872 | |
| Inspire Medical Systems, Inc. (a) | 200,000 | 36,632,000 | |
| Phreesia, Inc. (a) | 575,000 | 39,301,250 | |
| 137,857,573 | |||
| Life Sciences Tools & Services - 9.7% | |||
| Life Sciences Tools & Services - 9.7% | |||
| 10X Genomics, Inc. (a) | 630,000 | 115,434,900 | |
| Bio-Rad Laboratories, Inc. Class A (a) | 134,000 | 99,094,340 | |
| Bruker Corp. | 1,280,000 | 105,280,000 | |
| Charles River Laboratories International, Inc. (a) | 124,000 | 50,458,080 | |
| Lonza Group AG | 121,800 | 94,836,652 | |
| Maravai LifeSciences Holdings, Inc. | 560,000 | 24,623,200 | |
| Olink Holding AB ADR (a) | 375,593 | 14,035,910 | |
| Seer, Inc. | 6,065 | 193,716 | |
| Seer, Inc. Class A (d) | 273,935 | 8,749,484 | |
| Stevanato Group SpA (b) | 580,300 | 11,716,257 | |
| Thermo Fisher Scientific, Inc. | 330,000 | 178,203,300 | |
| 702,625,839 | |||
| Personal Products - 0.4% | |||
| Personal Products - 0.4% | |||
| The Beauty Health Co. (a) | 600,000 | 10,536,000 | |
| The Beauty Health Co. (d) | 1,000,000 | 17,560,000 | |
| 28,096,000 | |||
| Pharmaceuticals - 14.4% | |||
| Pharmaceuticals - 14.4% | |||
| Arvinas Holding Co. LLC (a) | 500,000 | 50,550,000 | |
| AstraZeneca PLC (United Kingdom) | 1,400,000 | 160,873,833 | |
| Atea Pharmaceuticals, Inc. | 160,000 | 4,006,400 | |
| Bristol-Myers Squibb Co. | 1,700,000 | 115,379,000 | |
| Eli Lilly & Co. | 1,500,000 | 365,250,000 | |
| Harmony Biosciences Holdings, Inc. (c) | 20,418 | 534,135 | |
| Nektar Therapeutics (a) | 1,280,000 | 20,211,200 | |
| Pharvaris BV | 350,000 | 6,219,500 | |
| Pliant Therapeutics, Inc. (a) | 571,321 | 11,540,684 | |
| Revance Therapeutics, Inc. (a) | 400,000 | 11,632,000 | |
| Roche Holding AG (participation certificate) | 470,000 | 181,566,729 | |
| Royalty Pharma PLC | 2,160,000 | 82,512,000 | |
| Theravance Biopharma, Inc. (a) | 693,626 | 9,003,265 | |
| UCB SA | 150,000 | 16,227,900 | |
| 1,035,506,646 | |||
| TOTAL COMMON STOCKS | |||
| (Cost $4,686,017,502) | 7,120,149,525 | ||
| Preferred Stocks - 0.8% | |||
| Convertible Preferred Stocks - 0.7% | |||
| Biotechnology - 0.5% | |||
| Biotechnology - 0.5% | |||
| Caris Life Sciences, Inc. Series D (d)(e) | 2,082,481 | 16,868,096 | |
| Element Biosciences, Inc. Series C (d)(e) | 376,690 | 7,743,616 | |
| ElevateBio LLC Series C (d)(e) | 163,300 | 685,044 | |
| Inscripta, Inc. Series E (d)(e) | 826,424 | 7,297,324 | |
| 32,594,080 | |||
| Health Care Providers & Services - 0.0% | |||
| Health Care Services - 0.0% | |||
| dMed Biopharmaceutical Co. Ltd. Series C (d)(e) | 236,142 | 3,265,844 | |
| Health Care Technology - 0.1% | |||
| Health Care Technology - 0.1% | |||
| Aledade, Inc. Series B1 (d)(e) | 130,618 | 5,001,455 | |
| Wugen, Inc. Series B (d)(e) | 300,054 | 2,326,889 | |
| 7,328,344 | |||
| Pharmaceuticals - 0.1% | |||
| Pharmaceuticals - 0.1% | |||
| Aristea Therapeutics, Inc. Series B (d)(e) | 638,900 | 5,890,658 | |
| TOTAL CONVERTIBLE PREFERRED STOCKS | 49,078,926 | ||
| Nonconvertible Preferred Stocks - 0.1% | |||
| Diversified Financial Services - 0.1% | |||
| Other Diversified Financial Services - 0.1% | |||
| Thriveworks TopCo LLC Series B (d)(e)(f) | 195,000 | 5,597,126 | |
| TOTAL PREFERRED STOCKS | |||
| (Cost $52,396,100) | 54,676,052 | ||
| Money Market Funds - 1.6% | |||
| Fidelity Cash Central Fund 0.06% (g) | 26,768,281 | 26,773,635 | |
| Fidelity Securities Lending Cash Central Fund 0.06% (g)(h) | 90,887,664 | 90,896,753 | |
| TOTAL MONEY MARKET FUNDS | |||
| (Cost $117,670,388) | 117,670,388 | ||
| TOTAL INVESTMENT IN SECURITIES - 101.3% | |||
| (Cost $4,856,083,990) | 7,292,495,965 | ||
| NET OTHER ASSETS (LIABILITIES) - (1.3)% | (94,212,487) | ||
| NET ASSETS - 100% | $7,198,283,478 |
Legend
(a) Non-income producing
(b) Security or a portion of the security is on loan at period end.
(c) Security exempt from registration under Rule 144A of the Securities Act of 1933. These securities may be resold in transactions exempt from registration, normally to qualified institutional buyers. At the end of the period, the value of these securities amounted to $92,994,065 or 1.3% of net assets.
(d) Restricted securities (including private placements) - Investment in securities not registered under the Securities Act of 1933 (excluding 144A issues). At the end of the period, the value of restricted securities (excluding 144A issues) amounted to $107,725,086 or 1.5% of net assets.
(e) Level 3 security
(f) Investment is owned by a wholly-owned subsidiary (Subsidiary) that is treated as a corporation for U.S. tax purposes.
(g) Affiliated fund that is generally available only to investment companies and other accounts managed by Fidelity Investments. The rate quoted is the annualized seven-day yield of the fund at period end. A complete unaudited listing of the fund's holdings as of its most recent quarter end is available upon request. In addition, each Fidelity Central Fund's financial statements, which are not covered by the Fund's Report of Independent Registered Public Accounting Firm, are available on the SEC's website or upon request.
(h) Investment made with cash collateral received from securities on loan.
Additional information on each restricted holding is as follows:
| Security | Acquisition Date | Acquisition Cost |
| Aledade, Inc. Series B1 | 5/7/21 | $5,001,455 |
| Aristea Therapeutics, Inc. Series B | 10/6/20 | $3,522,703 |
| Cano Health, Inc. | 11/11/20 | $24,874,000 |
| Caris Life Sciences, Inc. Series D | 5/11/21 | $16,868,096 |
| dMed Biopharmaceutical Co. Ltd. Series C | 12/1/20 | $3,353,960 |
| Element Biosciences, Inc. Series C | 6/21/21 | $7,743,503 |
| ElevateBio LLC Series C | 3/9/21 | $685,044 |
| Inscripta, Inc. Series E | 3/30/21 | $7,297,324 |
| Seer, Inc. Class A | 12/8/20 | $5,204,765 |
| The Beauty Health Co. | 12/8/20 | $10,000,000 |
| Thriveworks TopCo LLC Series B | 7/23/21 | $5,597,126 |
| Wugen, Inc. Series B | 7/9/21 | $2,326,889 |
Affiliated Central Funds
Information regarding fiscal year to date income earned by the Fund from investments in Fidelity Central Funds is as follows:
| Fund | Income earned |
| Fidelity Cash Central Fund | $28,137 |
| Fidelity Securities Lending Cash Central Fund | 298,787 |
| Total | $326,924 |
Amounts in the income column in the above table include any capital gain distributions from underlying funds, which are presented in the corresponding line-item in the Statement of Operations, if applicable. Amount for Fidelity Securities Lending Cash Central Fund represents the income earned on investing cash collateral, less rebates paid to borrowers and any lending agent fees associated with the loan, plus any premium payments received for lending certain types of securities.
Fiscal year to date information regarding the Fund's investments in Fidelity Central Funds, including the ownership percentage, is presented below.
| Fund | Value, beginning of period | Purchases | Sales Proceeds | Realized Gain/Loss | Change in Unrealized appreciation (depreciation) | Value, end of period | % ownership, end of period |
| Fidelity Cash Central Fund 0.06% | $52,065,526 | $1,184,317,919 | $1,209,606,660 | $1,260 | $(4,410) | $26,773,635 | 0.0% |
| Fidelity Securities Lending Cash Central Fund 0.06% | 110,137,303 | 763,607,787 | 782,848,337 | -- | -- | 90,896,753 | 0.3% |
| Total | $162,202,829 | $1,947,925,706 | $1,992,454,997 | $1,260 | $(4,410) | $117,670,388 |
Investment Valuation
The following is a summary of the inputs used, as of July 31, 2021, involving the Fund's assets and liabilities carried at fair value. The inputs or methodology used for valuing securities may not be an indication of the risk associated with investing in those securities. For more information on valuation inputs, and their aggregation into the levels used below, please refer to the Investment Valuation section in the accompanying Notes to Financial Statements.
| Valuation Inputs at Reporting Date: | ||||
| Description | Total | Level 1 | Level 2 | Level 3 |
| Investments in Securities: | ||||
| Common Stocks | $7,120,149,525 | $6,648,545,240 | $471,604,285 | $-- |
| Preferred Stocks | 54,676,052 | -- | -- | 54,676,052 |
| Money Market Funds | 117,670,388 | 117,670,388 | -- | -- |
| Total Investments in Securities: | $7,292,495,965 | $6,766,215,628 | $471,604,285 | $54,676,052 |
| Net unrealized depreciation on unfunded commitments | $(1,565,567) | $ | $(1,565,567) | $ |
Other Information
Distribution of investments by country or territory of incorporation, as a percentage of Total Net Assets, is as follows (Unaudited):
| United States of America | 88.2% |
| Switzerland | 4.0% |
| Netherlands | 2.3% |
| United Kingdom | 2.2% |
| Cayman Islands | 1.0% |
| Others (Individually Less Than 1%) | 2.3% |
| 100.0% |
See accompanying notes which are an integral part of the financial statements.
Fidelity Advisor® Health Care Fund
Financial Statements
Statement of Assets and Liabilities
| July 31, 2021 | ||
| Assets | ||
| Investment in securities, at value (including securities loaned of $88,448,883) — See accompanying schedule: Unaffiliated issuers (cost $4,738,413,602) | $7,174,825,577 | |
| Fidelity Central Funds (cost $117,670,388) | 117,670,388 | |
| Total Investment in Securities (cost $4,856,083,990) | $7,292,495,965 | |
| Cash | 72,125 | |
| Receivable for investments sold | 12,320,788 | |
| Receivable for fund shares sold | 5,294,199 | |
| Dividends receivable | 5,809,574 | |
| Interest receivable | 151 | |
| Distributions receivable from Fidelity Central Funds | 59,101 | |
| Prepaid expenses | 17,390 | |
| Other receivables | 129,946 | |
| Total assets | 7,316,199,239 | |
| Liabilities | ||
| Payable to custodian bank | $2,440,375 | |
| Payable for investments purchased | 14,101,352 | |
| Payable for fund shares redeemed | 3,452,336 | |
| Accrued management fee | 3,141,060 | |
| Distribution and service plan fees payable | 1,113,782 | |
| Other affiliated payables | 1,010,426 | |
| Unrealized depreciation on unfunded commitments | 1,565,567 | |
| Other payables and accrued expenses | 195,988 | |
| Collateral on securities loaned | 90,894,875 | |
| Total liabilities | 117,915,761 | |
| Net Assets | $7,198,283,478 | |
| Net Assets consist of: | ||
| Paid in capital | $4,452,282,548 | |
| Total accumulated earnings (loss) | 2,746,000,930 | |
| Net Assets | $7,198,283,478 | |
| Net Asset Value and Maximum Offering Price | ||
| Class A: | ||
| Net Asset Value and redemption price per share ($1,735,235,413 ÷ 24,939,594 shares)(a) | $69.58 | |
| Maximum offering price per share (100/94.25 of $69.58) | $73.82 | |
| Class M: | ||
| Net Asset Value and redemption price per share ($402,174,971 ÷ 6,259,552 shares)(a) | $64.25 | |
| Maximum offering price per share (100/96.50 of $64.25) | $66.58 | |
| Class C: | ||
| Net Asset Value and offering price per share ($697,625,858 ÷ 13,064,120 shares)(a) | $53.40 | |
| Class I: | ||
| Net Asset Value, offering price and redemption price per share ($3,410,787,455 ÷ 44,599,481 shares) | $76.48 | |
| Class Z: | ||
| Net Asset Value, offering price and redemption price per share ($952,459,781 ÷ 12,441,586 shares) | $76.55 |
(a) Redemption price per share is equal to net asset value less any applicable contingent deferred sales charge.
See accompanying notes which are an integral part of the financial statements.
Statement of Operations
| Year ended July 31, 2021 | ||
| Investment Income | ||
| Dividends | $37,264,796 | |
| Income from Fidelity Central Funds (including $298,787 from security lending) | 326,924 | |
| Total income | 37,591,720 | |
| Expenses | ||
| Management fee | $34,018,441 | |
| Transfer agent fees | 10,195,255 | |
| Distribution and service plan fees | 12,732,222 | |
| Accounting fees | 1,140,628 | |
| Custodian fees and expenses | 133,627 | |
| Independent trustees' fees and expenses | 27,059 | |
| Registration fees | 307,539 | |
| Audit | 54,391 | |
| Legal | 14,413 | |
| Interest | 1,127 | |
| Miscellaneous | 30,680 | |
| Total expenses before reductions | 58,655,382 | |
| Expense reductions | (400,860) | |
| Total expenses after reductions | 58,254,522 | |
| Net investment income (loss) | (20,662,802) | |
| Realized and Unrealized Gain (Loss) | ||
| Net realized gain (loss) on: | ||
| Investment securities: | ||
| Unaffiliated issuers | 545,965,330 | |
| Fidelity Central Funds | 1,260 | |
| Foreign currency transactions | (545,640) | |
| Total net realized gain (loss) | 545,420,950 | |
| Change in net unrealized appreciation (depreciation) on: | ||
| Investment securities: | ||
| Unaffiliated issuers | 674,757,896 | |
| Fidelity Central Funds | (4,410) | |
| Unfunded commitments | (1,565,567) | |
| Assets and liabilities in foreign currencies | 62,739 | |
| Total change in net unrealized appreciation (depreciation) | 673,250,658 | |
| Net gain (loss) | 1,218,671,608 | |
| Net increase (decrease) in net assets resulting from operations | $1,198,008,806 |
See accompanying notes which are an integral part of the financial statements.
Statement of Changes in Net Assets
| Year ended July 31, 2021 | Year ended July 31, 2020 | |
| Increase (Decrease) in Net Assets | ||
| Operations | ||
| Net investment income (loss) | $(20,662,802) | $(1,532,281) |
| Net realized gain (loss) | 545,420,950 | 204,524,782 |
| Change in net unrealized appreciation (depreciation) | 673,250,658 | 806,862,491 |
| Net increase (decrease) in net assets resulting from operations | 1,198,008,806 | 1,009,854,992 |
| Distributions to shareholders | (356,031,852) | (19,320,902) |
| Share transactions - net increase (decrease) | 823,653,502 | 506,568,084 |
| Total increase (decrease) in net assets | 1,665,630,456 | 1,497,102,174 |
| Net Assets | ||
| Beginning of period | 5,532,653,022 | 4,035,550,848 |
| End of period | $7,198,283,478 | $5,532,653,022 |
See accompanying notes which are an integral part of the financial statements.
Financial Highlights
Fidelity Advisor Health Care Fund Class A
| Years ended July 31, | 2021 | 2020 | 2019 | 2018 | 2017 |
| Selected Per–Share Data | |||||
| Net asset value, beginning of period | $61.07 | $49.21 | $50.14 | $41.85 | $38.23 |
| Income from Investment Operations | |||||
| Net investment income (loss)A | (.26) | (.04) | (.07) | (.07) | (.04) |
| Net realized and unrealized gain (loss) | 12.55 | 12.08 | 1.36 | 8.36 | 3.66 |
| Total from investment operations | 12.29 | 12.04 | 1.29 | 8.29 | 3.62 |
| Distributions from net investment income | (.16) | – | – | – | – |
| Distributions from net realized gain | (3.62) | (.18) | (2.22) | – | – |
| Total distributions | (3.78) | (.18) | (2.22) | – | – |
| Redemption fees added to paid in capitalA | – | – | – | – | –B |
| Net asset value, end of period | $69.58 | $61.07 | $49.21 | $50.14 | $41.85 |
| Total ReturnC,D | 20.70% | 24.50% | 2.87% | 19.81% | 9.47% |
| Ratios to Average Net AssetsE,F | |||||
| Expenses before reductions | .98% | 1.01% | 1.02% | 1.05% | 1.04% |
| Expenses net of fee waivers, if any | .98% | 1.00% | 1.02% | 1.05% | 1.04% |
| Expenses net of all reductions | .98% | 1.00% | 1.02% | 1.04% | 1.04% |
| Net investment income (loss) | (.39)% | (.07)% | (.14)% | (.16)% | (.10)% |
| Supplemental Data | |||||
| Net assets, end of period (000 omitted) | $1,735,235 | $1,372,082 | $1,121,411 | $1,003,430 | $875,176 |
| Portfolio turnover rateG | 38% | 53%H | 45% | 81% | 64% |
A Calculated based on average shares outstanding during the period.
B Amount represents less than $.005 per share.
C Total returns would have been lower if certain expenses had not been reduced during the applicable periods shown.
D Total returns do not include the effect of the sales charges.
E Fees and expenses of any underlying mutual funds or exchange-traded funds (ETFs) are not included in the Fund's expense ratio. The Fund indirectly bears its proportionate share of these expenses. For additional expense information related to investments in Fidelity Central Funds, please refer to the "Investments in Fidelity Central Funds" note found in the Notes to Financial Statements section of the most recent Annual or Semi-Annual report.
F Expense ratios reflect operating expenses of the class. Expenses before reductions do not reflect amounts reimbursed, waived, or reduced through arrangements with the investment adviser, brokerage services, or other offset arrangements, if applicable, and do not represent the amount paid by the class during periods when reimbursements, waivers or reductions occur.
G Amount does not include the portfolio activity of any underlying mutual funds or exchange-traded funds (ETFs).
H Portfolio turnover rate excludes securities received or delivered in-kind.
See accompanying notes which are an integral part of the financial statements.
Fidelity Advisor Health Care Fund Class M
| Years ended July 31, | 2021 | 2020 | 2019 | 2018 | 2017 |
| Selected Per–Share Data | |||||
| Net asset value, beginning of period | $56.62 | $45.75 | $46.89 | $39.25 | $35.95 |
| Income from Investment Operations | |||||
| Net investment income (loss)A | (.39) | (.16) | (.18) | (.18) | (.13) |
| Net realized and unrealized gain (loss) | 11.61 | 11.21 | 1.26 | 7.82 | 3.43 |
| Total from investment operations | 11.22 | 11.05 | 1.08 | 7.64 | 3.30 |
| Distributions from net investment income | (.02) | – | – | – | – |
| Distributions from net realized gain | (3.57) | (.18) | (2.22) | – | – |
| Total distributions | (3.59) | (.18) | (2.22) | – | – |
| Redemption fees added to paid in capitalA | – | – | – | – | –B |
| Net asset value, end of period | $64.25 | $56.62 | $45.75 | $46.89 | $39.25 |
| Total ReturnC,D | 20.39% | 24.19% | 2.61% | 19.46% | 9.18% |
| Ratios to Average Net AssetsE,F | |||||
| Expenses before reductions | 1.23% | 1.26% | 1.28% | 1.32% | 1.31% |
| Expenses net of fee waivers, if any | 1.23% | 1.26% | 1.28% | 1.32% | 1.31% |
| Expenses net of all reductions | 1.23% | 1.26% | 1.28% | 1.31% | 1.31% |
| Net investment income (loss) | (.65)% | (.33)% | (.40)% | (.43)% | (.37)% |
| Supplemental Data | |||||
| Net assets, end of period (000 omitted) | $402,175 | $349,280 | $306,758 | $298,061 | $269,332 |
| Portfolio turnover rateG | 38% | 53%H | 45% | 81% | 64% |
A Calculated based on average shares outstanding during the period.
B Amount represents less than $.005 per share.
C Total returns would have been lower if certain expenses had not been reduced during the applicable periods shown.
D Total returns do not include the effect of the sales charges.
E Fees and expenses of any underlying mutual funds or exchange-traded funds (ETFs) are not included in the Fund's expense ratio. The Fund indirectly bears its proportionate share of these expenses. For additional expense information related to investments in Fidelity Central Funds, please refer to the "Investments in Fidelity Central Funds" note found in the Notes to Financial Statements section of the most recent Annual or Semi-Annual report.
F Expense ratios reflect operating expenses of the class. Expenses before reductions do not reflect amounts reimbursed, waived, or reduced through arrangements with the investment adviser, brokerage services, or other offset arrangements, if applicable, and do not represent the amount paid by the class during periods when reimbursements, waivers or reductions occur.
G Amount does not include the portfolio activity of any underlying mutual funds or exchange-traded funds (ETFs).
H Portfolio turnover rate excludes securities received or delivered in-kind.
See accompanying notes which are an integral part of the financial statements.
Fidelity Advisor Health Care Fund Class C
| Years ended July 31, | 2021 | 2020 | 2019 | 2018 | 2017 |
| Selected Per–Share Data | |||||
| Net asset value, beginning of period | $47.63 | $38.70 | $40.21 | $33.82 | $31.12 |
| Income from Investment Operations | |||||
| Net investment income (loss)A | (.58) | (.34) | (.34) | (.33) | (.26) |
| Net realized and unrealized gain (loss) | 9.71 | 9.45 | 1.05 | 6.72 | 2.96 |
| Total from investment operations | 9.13 | 9.11 | .71 | 6.39 | 2.70 |
| Distributions from net investment income | – | – | – | – | – |
| Distributions from net realized gain | (3.36) | (.18) | (2.22) | – | – |
| Total distributions | (3.36) | (.18) | (2.22) | – | – |
| Redemption fees added to paid in capitalA | – | – | – | – | –B |
| Net asset value, end of period | $53.40 | $47.63 | $38.70 | $40.21 | $33.82 |
| Total ReturnC,D | 19.78% | 23.58% | 2.10% | 18.89% | 8.68% |
| Ratios to Average Net AssetsE,F | |||||
| Expenses before reductions | 1.73% | 1.76% | 1.77% | 1.80% | 1.79% |
| Expenses net of fee waivers, if any | 1.73% | 1.76% | 1.77% | 1.80% | 1.79% |
| Expenses net of all reductions | 1.73% | 1.75% | 1.77% | 1.79% | 1.79% |
| Net investment income (loss) | (1.15)% | (.82)% | (.88)% | (.91)% | (.85)% |
| Supplemental Data | |||||
| Net assets, end of period (000 omitted) | $697,626 | $654,487 | $585,093 | $669,639 | $619,991 |
| Portfolio turnover rateG | 38% | 53%H | 45% | 81% | 64% |
A Calculated based on average shares outstanding during the period.
B Amount represents less than $.005 per share.
C Total returns would have been lower if certain expenses had not been reduced during the applicable periods shown.
D Total returns do not include the effect of the contingent deferred sales charge.
E Fees and expenses of any underlying mutual funds or exchange-traded funds (ETFs) are not included in the Fund's expense ratio. The Fund indirectly bears its proportionate share of these expenses. For additional expense information related to investments in Fidelity Central Funds, please refer to the "Investments in Fidelity Central Funds" note found in the Notes to Financial Statements section of the most recent Annual or Semi-Annual report.
F Expense ratios reflect operating expenses of the class. Expenses before reductions do not reflect amounts reimbursed, waived, or reduced through arrangements with the investment adviser, brokerage services, or other offset arrangements, if applicable, and do not represent the amount paid by the class during periods when reimbursements, waivers or reductions occur.
G Amount does not include the portfolio activity of any underlying mutual funds or exchange-traded funds (ETFs).
H Portfolio turnover rate excludes securities received or delivered in-kind.
See accompanying notes which are an integral part of the financial statements.
Fidelity Advisor Health Care Fund Class I
| Years ended July 31, | 2021 | 2020 | 2019 | 2018 | 2017 |
| Selected Per–Share Data | |||||
| Net asset value, beginning of period | $66.81 | $53.77 | $54.43 | $45.35 | $41.31 |
| Income from Investment Operations | |||||
| Net investment income (loss)A | (.10) | .11 | .07 | .05 | .07 |
| Net realized and unrealized gain (loss) | 13.76 | 13.22 | 1.49 | 9.06 | 3.97 |
| Total from investment operations | 13.66 | 13.33 | 1.56 | 9.11 | 4.04 |
| Distributions from net investment income | (.30) | – | – | – | – |
| Distributions from net realized gain | (3.69) | (.29) | (2.22) | (.03) | – |
| Total distributions | (3.99) | (.29) | (2.22) | (.03) | – |
| Redemption fees added to paid in capitalA | – | – | – | – | –B |
| Net asset value, end of period | $76.48 | $66.81 | $53.77 | $54.43 | $45.35 |
| Total ReturnC | 21.01% | 24.84% | 3.14% | 20.09% | 9.78% |
| Ratios to Average Net AssetsD,E | |||||
| Expenses before reductions | .72% | .74% | .76% | .79% | .78% |
| Expenses net of fee waivers, if any | .72% | .74% | .76% | .79% | .78% |
| Expenses net of all reductions | .72% | .74% | .76% | .78% | .78% |
| Net investment income (loss) | (.13)% | .19% | .13% | .10% | .16% |
| Supplemental Data | |||||
| Net assets, end of period (000 omitted) | $3,410,787 | $2,546,323 | $1,783,417 | $1,316,804 | $911,005 |
| Portfolio turnover rateF | 38% | 53%G | 45% | 81% | 64% |
A Calculated based on average shares outstanding during the period.
B Amount represents less than $.005 per share.
C Total returns would have been lower if certain expenses had not been reduced during the applicable periods shown.
D Fees and expenses of any underlying mutual funds or exchange-traded funds (ETFs) are not included in the Fund's expense ratio. The Fund indirectly bears its proportionate share of these expenses. For additional expense information related to investments in Fidelity Central Funds, please refer to the "Investments in Fidelity Central Funds" note found in the Notes to Financial Statements section of the most recent Annual or Semi-Annual report.
E Expense ratios reflect operating expenses of the class. Expenses before reductions do not reflect amounts reimbursed, waived, or reduced through arrangements with the investment adviser, brokerage services, or other offset arrangements, if applicable, and do not represent the amount paid by the class during periods when reimbursements, waivers or reductions occur.
F Amount does not include the portfolio activity of any underlying mutual funds or exchange-traded funds (ETFs).
G Portfolio turnover rate excludes securities received or delivered in-kind.
See accompanying notes which are an integral part of the financial statements.
Fidelity Advisor Health Care Fund Class Z
| Years ended July 31, | 2021 | 2020 | 2019 A |
| Selected Per–Share Data | |||
| Net asset value, beginning of period | $66.88 | $53.84 | $57.87 |
| Income from Investment Operations | |||
| Net investment income (loss)B | (.01) | .19 | .13 |
| Net realized and unrealized gain (loss) | 13.77 | 13.22 | (1.94) |
| Total from investment operations | 13.76 | 13.41 | (1.81) |
| Distributions from net investment income | (.37) | – | – |
| Distributions from net realized gain | (3.73) | (.37) | (2.22) |
| Total distributions | (4.09)C | (.37) | (2.22) |
| Redemption fees added to paid in capitalB | – | – | – |
| Net asset value, end of period | $76.55 | $66.88 | $53.84 |
| Total ReturnD,E | 21.15% | 24.98% | (2.86)% |
| Ratios to Average Net AssetsF,G | |||
| Expenses before reductions | .60% | .61% | .62%H |
| Expenses net of fee waivers, if any | .60% | .61% | .62%H |
| Expenses net of all reductions | .59% | .61% | .62%H |
| Net investment income (loss) | (.01)% | .32% | .30%H |
| Supplemental Data | |||
| Net assets, end of period (000 omitted) | $952,460 | $610,481 | $238,873 |
| Portfolio turnover rateI | 38% | 53%J | 45%H |
A For the period October 2, 2018 (commencement of sale of shares) to July 31, 2019.
B Calculated based on average shares outstanding during the period.
C Total distributions per share do not sum due to rounding.
D Total returns for periods of less than one year are not annualized.
E Total returns would have been lower if certain expenses had not been reduced during the applicable periods shown.
F Fees and expenses of any underlying mutual funds or exchange-traded funds (ETFs) are not included in the Fund's expense ratio. The Fund indirectly bears its proportionate share of these expenses. For additional expense information related to investments in Fidelity Central Funds, please refer to the "Investments in Fidelity Central Funds" note found in the Notes to Financial Statements section of the most recent Annual or Semi-Annual report.
G Expense ratios reflect operating expenses of the class. Expenses before reductions do not reflect amounts reimbursed, waived, or reduced through arrangements with the investment adviser, brokerage services, or other offset arrangements, if applicable, and do not represent the amount paid by the class during periods when reimbursements, waivers or reductions occur.
H Annualized
I Amount does not include the portfolio activity of any underlying mutual funds or exchange-traded funds (ETFs).
J Portfolio turnover rate excludes securities received or delivered in-kind.
See accompanying notes which are an integral part of the financial statements.
Fidelity Advisor® Industrials Fund
Performance: The Bottom Line
Average annual total return reflects the change in the value of an investment, assuming reinvestment of distributions from dividend income and capital gains (the profits earned upon the sale of securities that have grown in value, if any) and assuming a constant rate of performance each year. The hypothetical investment and the average annual total returns do not reflect the deduction of taxes that a shareholder would pay on fund distributions or the redemption of fund shares. During periods of reimbursement by Fidelity, a fund’s total return will be greater than it would be had the reimbursement not occurred. How a fund did yesterday is no guarantee of how it will do tomorrow.
Average Annual Total Returns
| For the periods ended July 31, 2021 | Past 1 year | Past 5 years | Past 10 years |
| Class A (incl. 5.75% sales charge) | 27.83% | 9.74% | 10.83% |
| Class M (incl. 3.50% sales charge) | 30.52% | 9.98% | 10.81% |
| Class C (incl. contingent deferred sales charge) | 33.58% | 10.21% | 10.83% |
| Class I | 35.98% | 11.35% | 11.79% |
| Class Z | 36.16% | 11.43% | 11.83% |
Class C shares' contingent deferred sales charges included in the past one year, past five years and past ten years total return figures are 1%, 0% and 0%, respectively.
The initial offering of Class Z shares took place on October 2, 2018. Returns prior to October 2, 2018, are those of Class I.
$10,000 Over 10 Years
Let's say hypothetically that $10,000 was invested in Fidelity Advisor® Industrials Fund - Class A on July 31, 2011, and the current 5.75% sales charge was paid.
The chart shows how the value of your investment would have changed, and also shows how the S&P 500® Index performed over the same period.
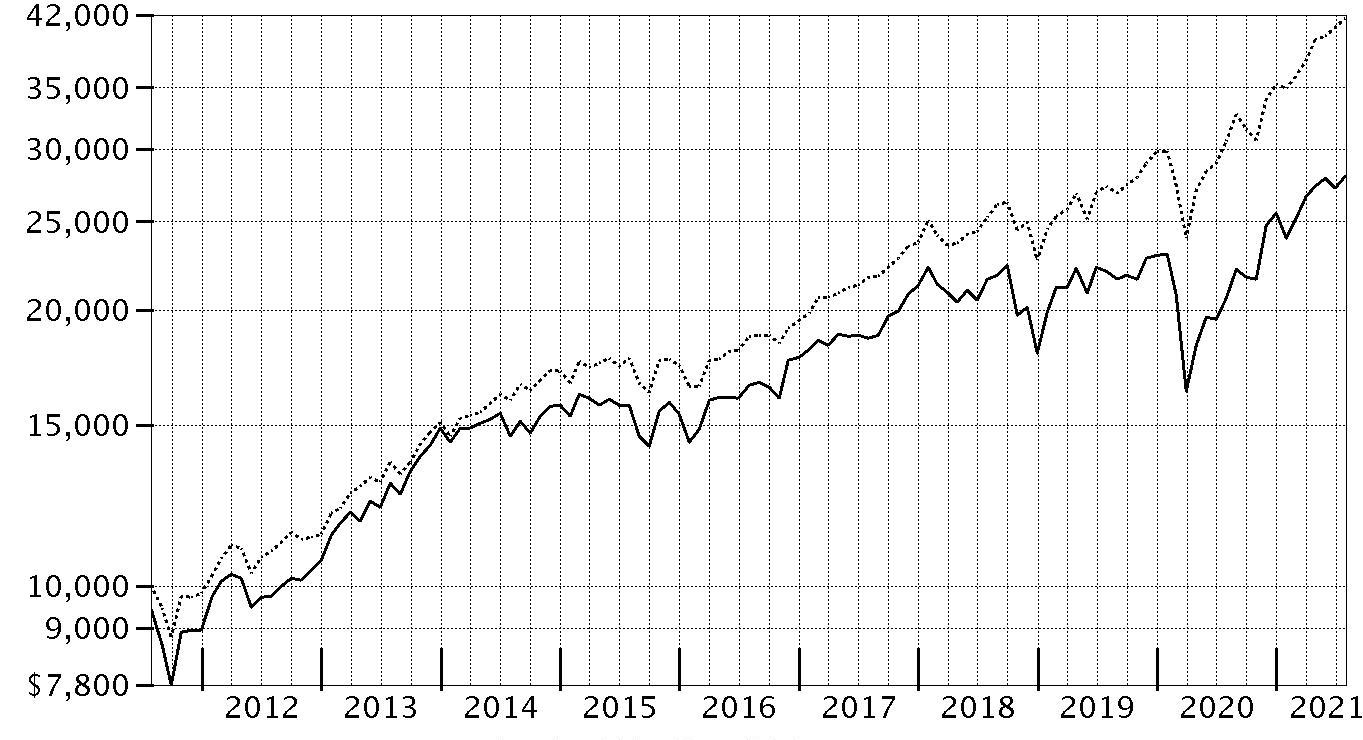
| Period Ending Values | ||
|
| $27,975 | Fidelity Advisor® Industrials Fund - Class A |
|
| $41,689 | S&P 500® Index |
Fidelity Advisor® Industrials Fund
Management's Discussion of Fund Performance
Market Recap: The S&P 500® index gained 36.45% for the 12 months ending July 31, 2021, as U.S. equities continued a historic rebound following a steep but brief decline due to the early-2020 outbreak and spread of COVID-19. A confluence of powerful forces propelled risk assets, returning the stock market to pre-pandemic highs by late August 2020. The rally slowed in September, when stocks began a two-month retreat amid Congress’s inability to reach a deal on additional fiscal stimulus, as well as uncertainty about the election. But as the calendar turned, investors grew hopeful. The rollout of three COVID-19 vaccines was underway, the U.S. Federal Reserve pledged to hold interest rates near zero until the economy recovered, and the federal government planned to deploy trillions of dollars to boost consumers and the economy. This backdrop fueled a sharp rotation, with small-cap value usurping leadership from large growth. As part of the “reopening” theme, investors moved out of tech-driven mega-caps that had thrived due to the work-from-home trend in favor of cheap smaller companies that stood to benefit from a broad cyclical recovery. A flattish May reflected concerns about inflation and jobs, but the uptrend resumed through July, driven by corporate earnings. Notably, this leg saw momentum shift back to large growth, as easing rates and a hawkish Fed stymied the reflation trade. By sector, financials (+55%) led, driven by banks (+63%), whereas utilities (+12%) and consumer staples (+18%) notably lagged. Comments from Portfolio Manager Janet Glazer: For the fiscal year ending July 31, 2021, the fund's share classes (excluding sales charges, if applicable) gained roughly 35% to 36%, underperforming the 47.48% gain of the MSCI US IMI Industrials 25/50 Linked Index, as well as the broad-based S&P 500® index. Versus the sector index, security selection was the primary detractor, especially in the industrial conglomerates industry. We also had weak stock picks in industrial machinery and electrical components & equipment. The biggest individual relative detractor was an overweight position in Roper Technologies (+14%), the fund's largest holding. Also hampering performance was our overweighting in General Electric, which gained 26%. General Electric was one of our largest holdings. Also holding back performance was our lighter-than-index stake in Deere, which gained about 107%. Deere was not held at period end. Conversely, the top contributor to performance versus the sector index was our stock selection in air freight & logistics. Also bolstering the fund's relative performance was an overweighting in electrical components & equipment and human resource & employment services. Not owning Lockheed Martin, an index component that gained 1%, was the biggest individual relative contributor. Also adding value was our outsized stake in XPO Logistics, which gained 85%. XPO Logistics was among our biggest holdings. Avoiding Northrop Grumman, an index component that gained roughly 14%, also aided relative performance. Notable changes in positioning include a higher allocation to the aerospace & defense and industrial conglomerates subindustries.The views expressed above reflect those of the portfolio manager(s) only through the end of the period as stated on the cover of this report and do not necessarily represent the views of Fidelity or any other person in the Fidelity organization. Any such views are subject to change at any time based upon market or other conditions and Fidelity disclaims any responsibility to update such views. These views may not be relied on as investment advice and, because investment decisions for a Fidelity fund are based on numerous factors, may not be relied on as an indication of trading intent on behalf of any Fidelity fund.
Fidelity Advisor® Industrials Fund
Investment Summary (Unaudited)
Top Ten Stocks as of July 31, 2021
| % of fund's net assets | |
| Roper Technologies, Inc. | 9.1 |
| Honeywell International, Inc. | 6.3 |
| AMETEK, Inc. | 6.0 |
| The Boeing Co. | 4.0 |
| Teledyne Technologies, Inc. | 3.9 |
| Copart, Inc. | 3.6 |
| United Rentals, Inc. | 3.6 |
| XPO Logistics, Inc. | 3.3 |
| Ingersoll Rand, Inc. | 3.3 |
| General Electric Co. | 3.3 |
| 46.4 |
Top Industries (% of fund's net assets)
| As of July 31, 2021 | ||
| Industrial Conglomerates | 18.7% | |
| Aerospace & Defense | 16.8% | |
| Machinery | 14.9% | |
| Electrical Equipment | 10.6% | |
| Road & Rail | 9.6% | |
| All Others* | 29.4% | |

* Includes short-term investments and net other assets (liabilities).
Fidelity Advisor® Industrials Fund
Schedule of Investments July 31, 2021
Showing Percentage of Net Assets
| Common Stocks - 99.1% | |||
| Shares | Value | ||
| Aerospace & Defense - 16.8% | |||
| Aerospace & Defense - 16.8% | |||
| Airbus Group NV (a) | 88,700 | $12,166,873 | |
| General Dynamics Corp. | 18,400 | 3,606,952 | |
| HEICO Corp. Class A | 21,600 | 2,619,864 | |
| Howmet Aerospace, Inc. | 637,600 | 20,926,032 | |
| Raytheon Technologies Corp. | 65,400 | 5,686,530 | |
| Teledyne Technologies, Inc. (a) | 57,700 | 26,124,829 | |
| The Boeing Co. (a) | 120,200 | 27,222,896 | |
| TransDigm Group, Inc. (a) | 19,114 | 12,253,794 | |
| Triumph Group, Inc. (a) | 151,551 | 2,887,047 | |
| 113,494,817 | |||
| Air Freight & Logistics - 3.9% | |||
| Air Freight & Logistics - 3.9% | |||
| FedEx Corp. | 100 | 27,995 | |
| Hub Group, Inc. Class A (a) | 8,500 | 563,380 | |
| United Parcel Service, Inc. Class B | 16,200 | 3,100,032 | |
| XPO Logistics, Inc. (a) | 162,238 | 22,500,788 | |
| 26,192,195 | |||
| Building Products - 5.5% | |||
| Building Products - 5.5% | |||
| Advanced Drain Systems, Inc. | 10,700 | 1,306,363 | |
| Allegion PLC | 29,400 | 4,016,040 | |
| Johnson Controls International PLC | 288,700 | 20,618,954 | |
| Trane Technologies PLC | 56,035 | 11,409,286 | |
| 37,350,643 | |||
| Commercial Services & Supplies - 5.9% | |||
| Diversified Support Services - 3.6% | |||
| Copart, Inc. (a) | 165,400 | 24,313,800 | |
| Environmental & Facility Services - 2.3% | |||
| GFL Environmental, Inc. | 143,500 | 5,003,845 | |
| Waste Connection, Inc. (United States) | 83,800 | 10,616,622 | |
| 15,620,467 | |||
| TOTAL COMMERCIAL SERVICES & SUPPLIES | 39,934,267 | ||
| Construction & Engineering - 0.2% | |||
| Construction & Engineering - 0.2% | |||
| AECOM (a) | 15,600 | 982,176 | |
| Electrical Equipment - 10.6% | |||
| Electrical Components & Equipment - 10.6% | |||
| Acuity Brands, Inc. | 71,900 | 12,609,822 | |
| AMETEK, Inc. | 288,934 | 40,176,273 | |
| Generac Holdings, Inc. (a) | 26,300 | 11,029,168 | |
| Regal Beloit Corp. | 18,999 | 2,797,223 | |
| Vertiv Holdings Co. | 171,500 | 4,808,860 | |
| 71,421,346 | |||
| Industrial Conglomerates - 18.7% | |||
| Industrial Conglomerates - 18.7% | |||
| General Electric Co. | 1,701,700 | 22,037,015 | |
| Honeywell International, Inc. | 183,194 | 42,828,925 | |
| Roper Technologies, Inc. | 124,932 | 61,384,089 | |
| 126,250,029 | |||
| Machinery - 14.9% | |||
| Industrial Machinery - 14.9% | |||
| Chart Industries, Inc. (a) | 5,500 | 854,975 | |
| Crane Co. | 65,339 | 6,352,911 | |
| Dover Corp. | 51,100 | 8,539,832 | |
| Fortive Corp. | 259,775 | 18,875,252 | |
| Graco, Inc. | 26,100 | 2,037,888 | |
| IDEX Corp. | 56,600 | 12,830,654 | |
| Ingersoll Rand, Inc. (a) | 459,200 | 22,441,104 | |
| ITT, Inc. | 101,451 | 9,933,067 | |
| Middleby Corp. (a) | 35,200 | 6,740,448 | |
| Otis Worldwide Corp. | 76,000 | 6,805,800 | |
| Pentair PLC | 24,500 | 1,804,915 | |
| Woodward, Inc. | 24,148 | 2,935,431 | |
| 100,152,277 | |||
| Professional Services - 6.1% | |||
| Human Resource & Employment Services - 3.2% | |||
| TriNet Group, Inc. (a) | 261,131 | 21,668,650 | |
| Research & Consulting Services - 2.9% | |||
| Clarivate Analytics PLC (a) | 135,500 | 3,089,400 | |
| CoStar Group, Inc. (a) | 184,800 | 16,419,480 | |
| 19,508,880 | |||
| TOTAL PROFESSIONAL SERVICES | 41,177,530 | ||
| Road & Rail - 9.6% | |||
| Railroads - 5.5% | |||
| CSX Corp. | 386,000 | 12,475,520 | |
| Norfolk Southern Corp. | 37,991 | 9,795,220 | |
| Union Pacific Corp. | 67,679 | 14,805,458 | |
| 37,076,198 | |||
| Trucking - 4.1% | |||
| J.B. Hunt Transport Services, Inc. | 17,500 | 2,947,875 | |
| Old Dominion Freight Lines, Inc. | 75,600 | 20,347,740 | |
| Saia, Inc. (a) | 20,200 | 4,565,200 | |
| 27,860,815 | |||
| TOTAL ROAD & RAIL | 64,937,013 | ||
| Software - 1.0% | |||
| Application Software - 1.0% | |||
| Descartes Systems Group, Inc. (a) | 94,900 | 6,895,434 | |
| Trading Companies & Distributors - 5.9% | |||
| Trading Companies & Distributors - 5.9% | |||
| Herc Holdings, Inc. (a) | 126,480 | 15,688,579 | |
| United Rentals, Inc. (a) | 73,000 | 24,057,150 | |
| 39,745,729 | |||
| TOTAL COMMON STOCKS | |||
| (Cost $535,227,282) | 668,533,456 | ||
| Money Market Funds - 1.1% | |||
| Fidelity Cash Central Fund 0.06% (b) | |||
| (Cost $7,140,324) | 7,138,896 | 7,140,324 | |
| TOTAL INVESTMENT IN SECURITIES - 100.2% | |||
| (Cost $542,367,606) | 675,673,780 | ||
| NET OTHER ASSETS (LIABILITIES) - (0.2)% | (1,030,549) | ||
| NET ASSETS - 100% | $674,643,231 |
Legend
(a) Non-income producing
(b) Affiliated fund that is generally available only to investment companies and other accounts managed by Fidelity Investments. The rate quoted is the annualized seven-day yield of the fund at period end. A complete unaudited listing of the fund's holdings as of its most recent quarter end is available upon request. In addition, each Fidelity Central Fund's financial statements, which are not covered by the Fund's Report of Independent Registered Public Accounting Firm, are available on the SEC's website or upon request.
Affiliated Central Funds
Information regarding fiscal year to date income earned by the Fund from investments in Fidelity Central Funds is as follows:
| Fund | Income earned |
| Fidelity Cash Central Fund | $3,674 |
| Fidelity Securities Lending Cash Central Fund | 1,202 |
| Total | $4,876 |
Amounts in the income column in the above table include any capital gain distributions from underlying funds, which are presented in the corresponding line-item in the Statement of Operations, if applicable. Amount for Fidelity Securities Lending Cash Central Fund represents the income earned on investing cash collateral, less rebates paid to borrowers and any lending agent fees associated with the loan, plus any premium payments received for lending certain types of securities.
Fiscal year to date information regarding the Fund's investments in Fidelity Central Funds, including the ownership percentage, is presented below.
| Fund | Value, beginning of period | Purchases | Sales Proceeds | Realized Gain/Loss | Change in Unrealized appreciation (depreciation) | Value, end of period | % ownership, end of period |
| Fidelity Cash Central Fund 0.06% | $783,830 | $211,857,811 | $205,501,331 | $14 | $-- | $7,140,324 | 0.0% |
| Fidelity Securities Lending Cash Central Fund 0.06% | 5,544,201 | 87,662,696 | 93,206,897 | -- | -- | -- | 0.0% |
| Total | $6,328,031 | $299,520,507 | $298,708,228 | $14 | $-- | $7,140,324 |
Investment Valuation
The following is a summary of the inputs used, as of July 31, 2021, involving the Fund's assets and liabilities carried at fair value. The inputs or methodology used for valuing securities may not be an indication of the risk associated with investing in those securities. For more information on valuation inputs, and their aggregation into the levels used below, please refer to the Investment Valuation section in the accompanying Notes to Financial Statements.
| Valuation Inputs at Reporting Date: | ||||
| Description | Total | Level 1 | Level 2 | Level 3 |
| Investments in Securities: | ||||
| Common Stocks | $668,533,456 | $656,366,583 | $12,166,873 | $-- |
| Money Market Funds | 7,140,324 | 7,140,324 | -- | -- |
| Total Investments in Securities: | $675,673,780 | $663,506,907 | $12,166,873 | $-- |
Other Information
Distribution of investments by country or territory of incorporation, as a percentage of Total Net Assets, is as follows (Unaudited):
| United States of America | 88.8% |
| Ireland | 5.6% |
| Canada | 3.3% |
| Netherlands | 1.8% |
| Others (Individually Less Than 1%) | 0.5% |
| 100.0% |
See accompanying notes which are an integral part of the financial statements.
Fidelity Advisor® Industrials Fund
Financial Statements
Statement of Assets and Liabilities
| July 31, 2021 | ||
| Assets | ||
| Investment in securities, at value — See accompanying schedule: Unaffiliated issuers (cost $535,227,282) | $668,533,456 | |
| Fidelity Central Funds (cost $7,140,324) | 7,140,324 | |
| Total Investment in Securities (cost $542,367,606) | $675,673,780 | |
| Receivable for investments sold | 9,262,021 | |
| Receivable for fund shares sold | 239,875 | |
| Dividends receivable | 37,209 | |
| Distributions receivable from Fidelity Central Funds | 348 | |
| Prepaid expenses | 4,448 | |
| Other receivables | 52,425 | |
| Total assets | 685,270,106 | |
| Liabilities | ||
| Payable for investments purchased | $9,469,426 | |
| Payable for fund shares redeemed | 581,762 | |
| Accrued management fee | 290,158 | |
| Distribution and service plan fees payable | 123,277 | |
| Other affiliated payables | 114,345 | |
| Other payables and accrued expenses | 47,907 | |
| Total liabilities | 10,626,875 | |
| Net Assets | $674,643,231 | |
| Net Assets consist of: | ||
| Paid in capital | $444,960,387 | |
| Total accumulated earnings (loss) | 229,682,844 | |
| Net Assets | $674,643,231 | |
| Net Asset Value and Maximum Offering Price | ||
| Class A: | ||
| Net Asset Value and redemption price per share ($264,130,475 ÷ 5,787,061 shares)(a) | $45.64 | |
| Maximum offering price per share (100/94.25 of $45.64) | $48.42 | |
| Class M: | ||
| Net Asset Value and redemption price per share ($56,679,972 ÷ 1,279,063 shares)(a) | $44.31 | |
| Maximum offering price per share (100/96.50 of $44.31) | $45.92 | |
| Class C: | ||
| Net Asset Value and offering price per share ($55,575,600 ÷ 1,408,247 shares)(a) | $39.46 | |
| Class I: | ||
| Net Asset Value, offering price and redemption price per share ($248,089,787 ÷ 5,100,299 shares) | $48.64 | |
| Class Z: | ||
| Net Asset Value, offering price and redemption price per share ($50,167,397 ÷ 1,032,086 shares) | $48.61 |
(a) Redemption price per share is equal to net asset value less any applicable contingent deferred sales charge.
See accompanying notes which are an integral part of the financial statements.
Statement of Operations
| Year ended July 31, 2021 | ||
| Investment Income | ||
| Dividends | $3,586,033 | |
| Income from Fidelity Central Funds (including $1,202 from security lending) | 4,876 | |
| Total income | 3,590,909 | |
| Expenses | ||
| Management fee | $3,108,771 | |
| Transfer agent fees | 1,025,158 | |
| Distribution and service plan fees | 1,433,917 | |
| Accounting fees | 219,001 | |
| Custodian fees and expenses | 17,902 | |
| Independent trustees' fees and expenses | 2,428 | |
| Registration fees | 97,352 | |
| Audit | 50,200 | |
| Legal | 2,642 | |
| Interest | 304 | |
| Miscellaneous | 3,692 | |
| Total expenses before reductions | 5,961,367 | |
| Expense reductions | (116,637) | |
| Total expenses after reductions | 5,844,730 | |
| Net investment income (loss) | (2,253,821) | |
| Realized and Unrealized Gain (Loss) | ||
| Net realized gain (loss) on: | ||
| Investment securities: | ||
| Unaffiliated issuers | 131,396,308 | |
| Fidelity Central Funds | 14 | |
| Foreign currency transactions | (5,224) | |
| Total net realized gain (loss) | 131,391,098 | |
| Change in net unrealized appreciation (depreciation) on: | ||
| Investment securities: | ||
| Unaffiliated issuers | 39,130,938 | |
| Assets and liabilities in foreign currencies | 6 | |
| Total change in net unrealized appreciation (depreciation) | 39,130,944 | |
| Net gain (loss) | 170,522,042 | |
| Net increase (decrease) in net assets resulting from operations | $168,268,221 |
See accompanying notes which are an integral part of the financial statements.
Statement of Changes in Net Assets
| Year ended July 31, 2021 | Year ended July 31, 2020 | |
| Increase (Decrease) in Net Assets | ||
| Operations | ||
| Net investment income (loss) | $(2,253,821) | $2,527,790 |
| Net realized gain (loss) | 131,391,098 | 953,381 |
| Change in net unrealized appreciation (depreciation) | 39,130,944 | (55,718,333) |
| Net increase (decrease) in net assets resulting from operations | 168,268,221 | (52,237,162) |
| Distributions to shareholders | (3,415,748) | (43,927,430) |
| Share transactions - net increase (decrease) | 58,057,679 | (102,963,693) |
| Total increase (decrease) in net assets | 222,910,152 | (199,128,285) |
| Net Assets | ||
| Beginning of period | 451,733,079 | 650,861,364 |
| End of period | $674,643,231 | $451,733,079 |
See accompanying notes which are an integral part of the financial statements.
Financial Highlights
Fidelity Advisor Industrials Fund Class A
| Years ended July 31, | 2021 | 2020 | 2019 | 2018 | 2017 |
| Selected Per–Share Data | |||||
| Net asset value, beginning of period | $33.85 | $38.95 | $42.62 | $37.89 | $35.52 |
| Income from Investment Operations | |||||
| Net investment income (loss)A | (.17) | .18B | .24 | .13 | .19 |
| Net realized and unrealized gain (loss) | 12.20 | (2.46) | (.02) | 5.87 | 4.24 |
| Total from investment operations | 12.03 | (2.28) | .22 | 6.00 | 4.43 |
| Distributions from net investment income | – | (.25) | (.19) | (.10) | (.16) |
| Distributions from net realized gain | (.24) | (2.57) | (3.70) | (1.17) | (1.90) |
| Total distributions | (.24) | (2.82) | (3.89) | (1.27) | (2.06) |
| Redemption fees added to paid in capitalA | – | – | – | – | –C |
| Net asset value, end of period | $45.64 | $33.85 | $38.95 | $42.62 | $37.89 |
| Total ReturnD,E | 35.63% | (6.58)% | 2.06% | 15.97% | 12.62% |
| Ratios to Average Net AssetsF,G | |||||
| Expenses before reductions | 1.03% | 1.05% | 1.04% | 1.06% | 1.06% |
| Expenses net of fee waivers, if any | 1.03% | 1.05% | 1.04% | 1.06% | 1.06% |
| Expenses net of all reductions | 1.01% | 1.03% | 1.03% | 1.05% | 1.06% |
| Net investment income (loss) | (.40)% | .49%B | .63% | .32% | .53% |
| Supplemental Data | |||||
| Net assets, end of period (000 omitted) | $264,130 | $199,835 | $268,483 | $303,201 | $309,204 |
| Portfolio turnover rateH | 205% | 219%I | 125% | 61% | 57% |
A Calculated based on average shares outstanding during the period.
B Net investment income per share reflects one or more large, non-recurring dividend(s) which amounted to $.07 per share. Excluding such non-recurring dividend(s), the ratio of net investment income (loss) to average net assets would have been .29%.
C Amount represents less than $.005 per share.
D Total returns would have been lower if certain expenses had not been reduced during the applicable periods shown.
E Total returns do not include the effect of the sales charges.
F Fees and expenses of any underlying mutual funds or exchange-traded funds (ETFs) are not included in the Fund's expense ratio. The Fund indirectly bears its proportionate share of these expenses. For additional expense information related to investments in Fidelity Central Funds, please refer to the "Investments in Fidelity Central Funds" note found in the Notes to Financial Statements section of the most recent Annual or Semi-Annual report.
G Expense ratios reflect operating expenses of the class. Expenses before reductions do not reflect amounts reimbursed, waived, or reduced through arrangements with the investment adviser, brokerage services, or other offset arrangements, if applicable, and do not represent the amount paid by the class during periods when reimbursements, waivers or reductions occur.
H Amount does not include the portfolio activity of any underlying mutual funds or exchange-traded funds (ETFs).
I Portfolio turnover rate excludes securities received or delivered in-kind.
See accompanying notes which are an integral part of the financial statements.
Fidelity Advisor Industrials Fund Class M
| Years ended July 31, | 2021 | 2020 | 2019 | 2018 | 2017 |
| Selected Per–Share Data | |||||
| Net asset value, beginning of period | $32.96 | $37.99 | $41.65 | $37.03 | $34.77 |
| Income from Investment Operations | |||||
| Net investment income (loss)A | (.27) | .08B | .14 | .03 | .10 |
| Net realized and unrealized gain (loss) | 11.86 | (2.39) | (.03) | 5.74 | 4.14 |
| Total from investment operations | 11.59 | (2.31) | .11 | 5.77 | 4.24 |
| Distributions from net investment income | – | (.15) | (.07) | – | (.08) |
| Distributions from net realized gain | (.24) | (2.57) | (3.70) | (1.15) | (1.90) |
| Total distributions | (.24) | (2.72) | (3.77) | (1.15) | (1.98) |
| Redemption fees added to paid in capitalA | – | – | – | – | –C |
| Net asset value, end of period | $44.31 | $32.96 | $37.99 | $41.65 | $37.03 |
| Total ReturnD,E | 35.25% | (6.82)% | 1.78% | 15.70% | 12.33% |
| Ratios to Average Net AssetsF,G | |||||
| Expenses before reductions | 1.29% | 1.31% | 1.31% | 1.32% | 1.32% |
| Expenses net of fee waivers, if any | 1.29% | 1.31% | 1.30% | 1.32% | 1.32% |
| Expenses net of all reductions | 1.27% | 1.30% | 1.30% | 1.31% | 1.32% |
| Net investment income (loss) | (.66)% | .23%B | .37% | .07% | .27% |
| Supplemental Data | |||||
| Net assets, end of period (000 omitted) | $56,680 | $45,157 | $61,570 | $72,143 | $87,253 |
| Portfolio turnover rateH | 205% | 219%I | 125% | 61% | 57% |
A Calculated based on average shares outstanding during the period.
B Net investment income per share reflects one or more large, non-recurring dividend(s) which amounted to $.07 per share. Excluding such non-recurring dividend(s), the ratio of net investment income (loss) to average net assets would have been .03%.
C Amount represents less than $.005 per share.
D Total returns would have been lower if certain expenses had not been reduced during the applicable periods shown.
E Total returns do not include the effect of the sales charges.
F Fees and expenses of any underlying mutual funds or exchange-traded funds (ETFs) are not included in the Fund's expense ratio. The Fund indirectly bears its proportionate share of these expenses. For additional expense information related to investments in Fidelity Central Funds, please refer to the "Investments in Fidelity Central Funds" note found in the Notes to Financial Statements section of the most recent Annual or Semi-Annual report.
G Expense ratios reflect operating expenses of the class. Expenses before reductions do not reflect amounts reimbursed, waived, or reduced through arrangements with the investment adviser, brokerage services, or other offset arrangements, if applicable, and do not represent the amount paid by the class during periods when reimbursements, waivers or reductions occur.
H Amount does not include the portfolio activity of any underlying mutual funds or exchange-traded funds (ETFs).
I Portfolio turnover rate excludes securities received or delivered in-kind.
See accompanying notes which are an integral part of the financial statements.
Fidelity Advisor Industrials Fund Class C
| Years ended July 31, | 2021 | 2020 | 2019 | 2018 | 2017 |
| Selected Per–Share Data | |||||
| Net asset value, beginning of period | $29.52 | $34.27 | $38.09 | $34.09 | $32.24 |
| Income from Investment Operations | |||||
| Net investment income (loss)A | (.41) | (.08)B | (.04) | (.16) | (.08) |
| Net realized and unrealized gain (loss) | 10.59 | (2.15) | (.08) | 5.28 | 3.83 |
| Total from investment operations | 10.18 | (2.23) | (.12) | 5.12 | 3.75 |
| Distributions from net investment income | – | (.03) | – | – | – |
| Distributions from net realized gain | (.24) | (2.49) | (3.70) | (1.12) | (1.90) |
| Total distributions | (.24) | (2.52) | (3.70) | (1.12) | (1.90) |
| Redemption fees added to paid in capitalA | – | – | – | – | –C |
| Net asset value, end of period | $39.46 | $29.52 | $34.27 | $38.09 | $34.09 |
| Total ReturnD,E | 34.58% | (7.27)% | 1.28% | 15.13% | 11.76% |
| Ratios to Average Net AssetsF,G | |||||
| Expenses before reductions | 1.79% | 1.81% | 1.80% | 1.82% | 1.82% |
| Expenses net of fee waivers, if any | 1.79% | 1.81% | 1.80% | 1.82% | 1.82% |
| Expenses net of all reductions | 1.77% | 1.79% | 1.79% | 1.81% | 1.81% |
| Net investment income (loss) | (1.16)% | (.26)%B | (.12)% | (.43)% | (.23)% |
| Supplemental Data | |||||
| Net assets, end of period (000 omitted) | $55,576 | $53,969 | $90,512 | $138,249 | $134,505 |
| Portfolio turnover rateH | 205% | 219%I | 125% | 61% | 57% |
A Calculated based on average shares outstanding during the period.
B Net investment income per share reflects one or more large, non-recurring dividend(s) which amounted to $.06 per share. Excluding such non-recurring dividend(s), the ratio of net investment income (loss) to average net assets would have been (.46) %.
C Amount represents less than $.005 per share.
D Total returns would have been lower if certain expenses had not been reduced during the applicable periods shown.
E Total returns do not include the effect of the contingent deferred sales charge.
F Fees and expenses of any underlying mutual funds or exchange-traded funds (ETFs) are not included in the Fund's expense ratio. The Fund indirectly bears its proportionate share of these expenses. For additional expense information related to investments in Fidelity Central Funds, please refer to the "Investments in Fidelity Central Funds" note found in the Notes to Financial Statements section of the most recent Annual or Semi-Annual report.
G Expense ratios reflect operating expenses of the class. Expenses before reductions do not reflect amounts reimbursed, waived, or reduced through arrangements with the investment adviser, brokerage services, or other offset arrangements, if applicable, and do not represent the amount paid by the class during periods when reimbursements, waivers or reductions occur.
H Amount does not include the portfolio activity of any underlying mutual funds or exchange-traded funds (ETFs).
I Portfolio turnover rate excludes securities received or delivered in-kind.
See accompanying notes which are an integral part of the financial statements.
Fidelity Advisor Industrials Fund Class I
| Years ended July 31, | 2021 | 2020 | 2019 | 2018 | 2017 |
| Selected Per–Share Data | |||||
| Net asset value, beginning of period | $35.97 | $41.20 | $44.85 | $39.80 | $37.21 |
| Income from Investment Operations | |||||
| Net investment income (loss)A | (.06) | .29B | .37 | .25 | .31 |
| Net realized and unrealized gain (loss) | 12.97 | (2.60) | (.02) | 6.18 | 4.44 |
| Total from investment operations | 12.91 | (2.31) | .35 | 6.43 | 4.75 |
| Distributions from net investment income | – | (.35) | (.30) | (.21) | (.25) |
| Distributions from net realized gain | (.24) | (2.57) | (3.70) | (1.17) | (1.90) |
| Total distributions | (.24) | (2.92) | (4.00) | (1.38) | (2.16)C |
| Redemption fees added to paid in capitalA | – | – | – | – | –D |
| Net asset value, end of period | $48.64 | $35.97 | $41.20 | $44.85 | $39.80 |
| Total ReturnE | 35.98% | (6.32)% | 2.31% | 16.30% | 12.91% |
| Ratios to Average Net AssetsF,G | |||||
| Expenses before reductions | .76% | .78% | .78% | .80% | .80% |
| Expenses net of fee waivers, if any | .76% | .78% | .77% | .80% | .80% |
| Expenses net of all reductions | .74% | .76% | .77% | .79% | .80% |
| Net investment income (loss) | (.14)% | .76%B | .90% | .59% | .79% |
| Supplemental Data | |||||
| Net assets, end of period (000 omitted) | $248,090 | $123,603 | $219,218 | $320,902 | $284,727 |
| Portfolio turnover rateH | 205% | 219%I | 125% | 61% | 57% |
A Calculated based on average shares outstanding during the period.
B Net investment income per share reflects one or more large, non-recurring dividend(s) which amounted to $.08 per share. Excluding such non-recurring dividend(s), the ratio of net investment income (loss) to average net assets would have been .56%.
C Total distributions per share do not sum due to rounding.
D Amount represents less than $.005 per share.
E Total returns would have been lower if certain expenses had not been reduced during the applicable periods shown.
F Fees and expenses of any underlying mutual funds or exchange-traded funds (ETFs) are not included in the Fund's expense ratio. The Fund indirectly bears its proportionate share of these expenses. For additional expense information related to investments in Fidelity Central Funds, please refer to the "Investments in Fidelity Central Funds" note found in the Notes to Financial Statements section of the most recent Annual or Semi-Annual report.
G Expense ratios reflect operating expenses of the class. Expenses before reductions do not reflect amounts reimbursed, waived, or reduced through arrangements with the investment adviser, brokerage services, or other offset arrangements, if applicable, and do not represent the amount paid by the class during periods when reimbursements, waivers or reductions occur.
H Amount does not include the portfolio activity of any underlying mutual funds or exchange-traded funds (ETFs).
I Portfolio turnover rate excludes securities received or delivered in-kind.
See accompanying notes which are an integral part of the financial statements.
Fidelity Advisor Industrials Fund Class Z
| Years ended July 31, | 2021 | 2020 | 2019 A |
| Selected Per–Share Data | |||
| Net asset value, beginning of period | $35.90 | $41.15 | $46.84 |
| Income from Investment Operations | |||
| Net investment income (loss)B | – | .34C,D | .34 |
| Net realized and unrealized gain (loss) | 12.95 | (2.60) | (1.94) |
| Total from investment operations | 12.95 | (2.26) | (1.60) |
| Distributions from net investment income | – | (.42) | (.39) |
| Distributions from net realized gain | (.24) | (2.57) | (3.70) |
| Total distributions | (.24) | (2.99) | (4.09) |
| Redemption fees added to paid in capitalB | – | – | – |
| Net asset value, end of period | $48.61 | $35.90 | $41.15 |
| Total ReturnE,F | 36.16% | (6.21)% | (1.92)% |
| Ratios to Average Net AssetsG,H | |||
| Expenses before reductions | .64% | .65% | .64%I |
| Expenses net of fee waivers, if any | .64% | .65% | .64%I |
| Expenses net of all reductions | .62% | .63% | .64%I |
| Net investment income (loss) | (.01)% | .89%C | 1.04%I |
| Supplemental Data | |||
| Net assets, end of period (000 omitted) | $50,167 | $29,168 | $11,077 |
| Portfolio turnover rateJ | 205% | 219% | 125%I,K |
A For the period October 2, 2018 (commencement of sale of shares) to July 31, 2019.
B Calculated based on average shares outstanding during the period.
C Net investment income per share reflects one or more large, non-recurring dividend(s) which amounted to $.08 per share. Excluding such non-recurring dividend(s), the ratio of net investment income (loss) to average net assets would have been .69%.
D Amount represents less than $.005 per share.
E Total returns for periods of less than one year are not annualized.
F Total returns would have been lower if certain expenses had not been reduced during the applicable periods shown.
G Fees and expenses of any underlying mutual funds or exchange-traded funds (ETFs) are not included in the Fund's expense ratio. The Fund indirectly bears its proportionate share of these expenses. For additional expense information related to investments in Fidelity Central Funds, please refer to the "Investments in Fidelity Central Funds" note found in the Notes to Financial Statements section of the most recent Annual or Semi-Annual report.
H Expense ratios reflect operating expenses of the class. Expenses before reductions do not reflect amounts reimbursed, waived, or reduced through arrangements with the investment adviser, brokerage services, or other offset arrangements, if applicable, and do not represent the amount paid by the class during periods when reimbursements, waivers or reductions occur.
I Annualized
J Amount does not include the portfolio activity of any underlying mutual funds or exchange-traded funds (ETFs).
K Portfolio turnover rate excludes securities received or delivered in-kind.
See accompanying notes which are an integral part of the financial statements.
Fidelity Advisor® Semiconductors Fund
Performance: The Bottom Line
Average annual total return reflects the change in the value of an investment, assuming reinvestment of distributions from dividend income and capital gains (the profits earned upon the sale of securities that have grown in value, if any) and assuming a constant rate of performance each year. The hypothetical investment and the average annual total returns do not reflect the deduction of taxes that a shareholder would pay on fund distributions or the redemption of fund shares. During periods of reimbursement by Fidelity, a fund’s total return will be greater than it would be had the reimbursement not occurred. How a fund did yesterday is no guarantee of how it will do tomorrow.
Average Annual Total Returns
| For the periods ended July 31, 2021 | Past 1 year | Past 5 years | Past 10 years |
| Class A (incl. 5.75% sales charge) | 53.11% | 29.79% | 22.54% |
| Class M (incl. 3.50% sales charge) | 56.32% | 29.99% | 22.46% |
| Class C (incl. contingent deferred sales charge) | 60.17% | 30.34% | 22.51% |
| Class I | 62.86% | 31.71% | 23.61% |
| Class Z | 63.06% | 31.82% | 23.66% |
Class C shares' contingent deferred sales charges included in the past one year, past five years and past ten years total return figures are 1%, 0% and 0%, respectively.
The initial offering of Class Z shares took place on October 2, 2018. Returns prior to October 2, 2018, are those of Class I.
$10,000 Over 10 Years
Let's say hypothetically that $10,000 was invested in Fidelity Advisor® Semiconductors Fund - Class A on July 31, 2011, and the current 5.75% sales charge was paid.
The chart shows how the value of your investment would have changed, and also shows how the S&P 500® Index performed over the same period.
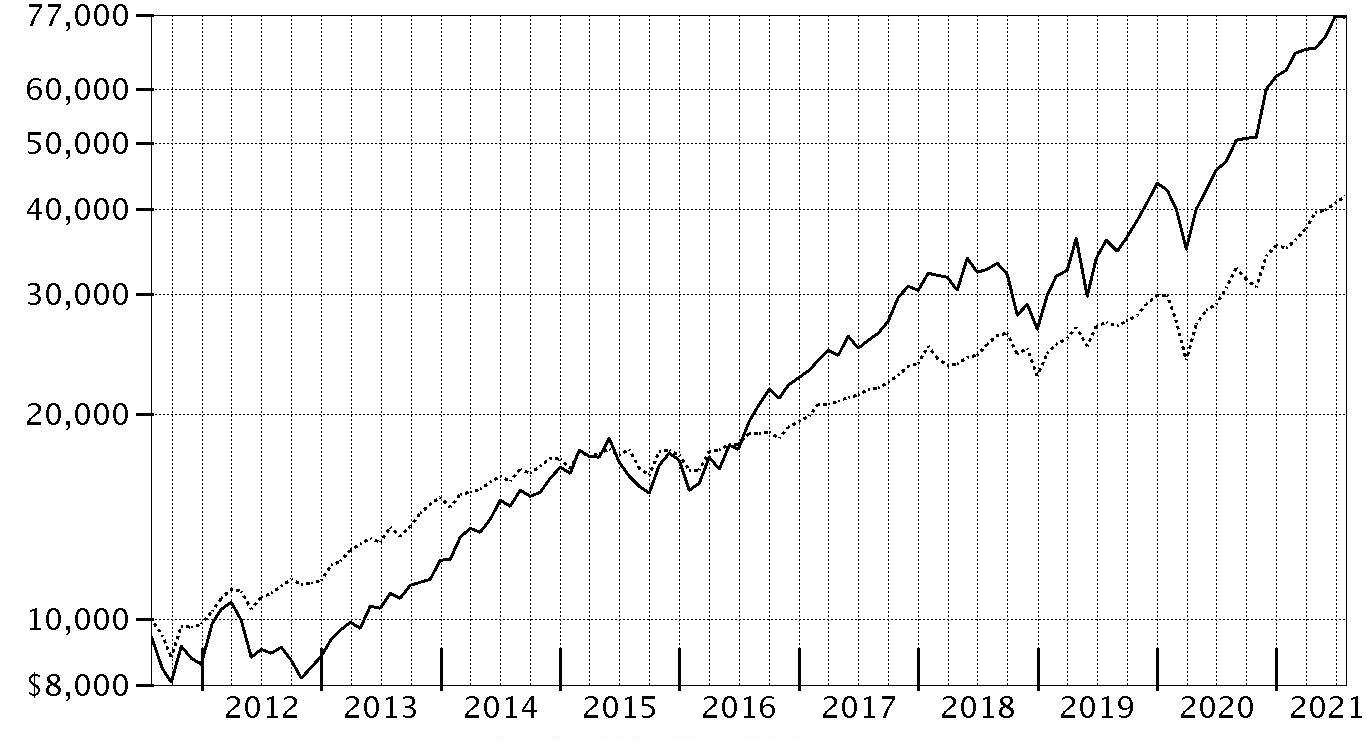
| Period Ending Values | ||
|
| $76,330 | Fidelity Advisor® Semiconductors Fund - Class A |
|
| $41,689 | S&P 500® Index |
Fidelity Advisor® Semiconductors Fund
Management's Discussion of Fund Performance
Market Recap: The S&P 500® index gained 36.45% for the 12 months ending July 31, 2021, as U.S. equities continued a historic rebound following a steep but brief decline due to the early-2020 outbreak and spread of COVID-19. A confluence of powerful forces propelled risk assets, returning the stock market to pre-pandemic highs by late August 2020. The rally slowed in September, when stocks began a two-month retreat amid Congress’s inability to reach a deal on additional fiscal stimulus, as well as uncertainty about the election. But as the calendar turned, investors grew hopeful. The rollout of three COVID-19 vaccines was underway, the U.S. Federal Reserve pledged to hold interest rates near zero until the economy recovered, and the federal government planned to deploy trillions of dollars to boost consumers and the economy. This backdrop fueled a sharp rotation, with small-cap value usurping leadership from large growth. As part of the “reopening” theme, investors moved out of tech-driven mega-caps that had thrived due to the work-from-home trend in favor of cheap smaller companies that stood to benefit from a broad cyclical recovery. A flattish May reflected concerns about inflation and jobs, but the uptrend resumed through July, driven by corporate earnings. Notably, this leg saw momentum shift back to large growth, as easing rates and a hawkish Fed stymied the reflation trade. By sector, financials (+55%) led, driven by banks (+63%), whereas utilities (+12%) and consumer staples (+18%) notably lagged. Comments from Portfolio Manager Adam Benjamin: For the fiscal year ending July 31, 2021, the fund's share classes (excluding sales charges, if applicable) gained about 61% to 63%, outperforming the 58.21% advance of the MSCI US IMI Semiconductors & Semiconductor Equipment 25/50 Index, as well as the broad-based S&P 500® index. Versus the industry index, security selection was the primary contributor, especially in the semiconductors industry. Security selection in semiconductor equipment and electronic components also bolstered the fund's relative result. The fund's top individual relative contributor was our lighter-than-index stake in Intel, which gained roughly 16% the past 12 months. The company was among our largest holdings. Another notable relative contributor was an outsized stake in Enphase Energy (+231%). This period we decreased our stake. Conversely, the largest detractor from performance versus the industry index was an underweighting in semiconductor equipment. Non-index exposure to electrical components & equipment and a slight overweighting in semiconductors also hampered the fund's relative performance. The fund's largest individual relative detractor was an underweighting in Applied Materials, which gained roughly 120% the past year. Also hurting performance was our outsized stake in Cirrus Logic, which gained about 21%. Notable changes in positioning include increased exposure to the semiconductor equipment subindustry and a lower non-index stake in electronic manufacturing services.The views expressed above reflect those of the portfolio manager(s) only through the end of the period as stated on the cover of this report and do not necessarily represent the views of Fidelity or any other person in the Fidelity organization. Any such views are subject to change at any time based upon market or other conditions and Fidelity disclaims any responsibility to update such views. These views may not be relied on as investment advice and, because investment decisions for a Fidelity fund are based on numerous factors, may not be relied on as an indication of trading intent on behalf of any Fidelity fund.
Fidelity Advisor® Semiconductors Fund
Investment Summary (Unaudited)
Top Ten Stocks as of July 31, 2021
| % of fund's net assets | |
| NVIDIA Corp. | 22.9 |
| Marvell Technology, Inc. | 8.0 |
| NXP Semiconductors NV | 7.7 |
| Lam Research Corp. | 5.4 |
| Microchip Technology, Inc. | 4.6 |
| ON Semiconductor Corp. | 4.4 |
| Texas Instruments, Inc. | 4.0 |
| Intel Corp. | 3.9 |
| Broadcom, Inc. | 3.4 |
| Qualcomm, Inc. | 3.3 |
| 67.6 |
Top Industries (% of fund's net assets)
| As of July 31, 2021 | ||
| Semiconductors & Semiconductor Equipment | 91.6% | |
| Software | 2.2% | |
| Electronic Equipment & Components | 2.0% | |
| Technology Hardware, Storage & Peripherals | 0.6% | |
| Electrical Equipment | 0.2% | |
| All Others* | 3.4% | |

* Includes short-term investments and net other assets (liabilities).
Fidelity Advisor® Semiconductors Fund
Schedule of Investments July 31, 2021
Showing Percentage of Net Assets
| Preferred Securities- 0.0% | |||
| Shares | Value | ||
| Semiconductors & Semiconductors Equipment - 0.0% | |||
| Semiconductors - 0.0% | |||
| Tenstorrent, Inc. 0% (a)(b)(c) | |||
| (Cost $50,000) | 50,000 | 50,000 | |
| Common Stocks - 96.6% | |||
| Electrical Equipment - 0.2% | |||
| Electrical Components & Equipment - 0.2% | |||
| Array Technologies, Inc. | 94,900 | 1,284,946 | |
| Electronic Equipment & Components - 2.0% | |||
| Electronic Equipment & Instruments - 0.3% | |||
| Advanced Energy Industries, Inc. | 20,164 | 2,092,015 | |
| Electronic Manufacturing Services - 1.7% | |||
| Flex Ltd. (d) | 175,827 | 3,159,611 | |
| Jabil, Inc. | 144,576 | 8,608,055 | |
| 11,767,666 | |||
| TOTAL ELECTRONIC EQUIPMENT & COMPONENTS | 13,859,681 | ||
| Semiconductors & Semiconductor Equipment - 91.6% | |||
| Semiconductor Equipment - 13.4% | |||
| Applied Materials, Inc. | 108,100 | 15,126,433 | |
| Enphase Energy, Inc. (d) | 11,800 | 2,237,280 | |
| KLA Corp. | 24,300 | 8,460,288 | |
| Lam Research Corp. | 59,546 | 37,955,216 | |
| Nova Ltd. (d) | 92,700 | 9,066,060 | |
| Teradyne, Inc. | 163,100 | 20,713,700 | |
| 93,558,977 | |||
| Semiconductors - 78.2% | |||
| Advanced Micro Devices, Inc. (d) | 144,500 | 15,344,455 | |
| Alpha & Omega Semiconductor Ltd. (d) | 63,000 | 1,637,370 | |
| Analog Devices, Inc. | 90,770 | 15,196,713 | |
| ASE Technology Holding Co. Ltd. ADR (e) | 119,500 | 1,059,965 | |
| Broadcom, Inc. | 48,725 | 23,651,115 | |
| Cirrus Logic, Inc. (d) | 115,928 | 9,574,494 | |
| Diodes, Inc. (d) | 82,200 | 6,740,400 | |
| Intel Corp. | 511,464 | 27,475,846 | |
| MACOM Technology Solutions Holdings, Inc. (d) | 139,500 | 8,609,940 | |
| Marvell Technology, Inc. | 929,333 | 56,233,940 | |
| MaxLinear, Inc. Class A (d) | 70,349 | 3,392,932 | |
| Microchip Technology, Inc. | 226,801 | 32,459,759 | |
| Micron Technology, Inc. | 270,112 | 20,955,289 | |
| Monolithic Power Systems, Inc. | 15,100 | 6,783,826 | |
| NVIDIA Corp. | 823,692 | 160,611,703 | |
| NXP Semiconductors NV | 261,312 | 53,932,184 | |
| ON Semiconductor Corp. (d) | 792,736 | 30,964,268 | |
| Qualcomm, Inc. | 152,726 | 22,878,355 | |
| Silicon Motion Tech Corp. sponsored ADR | 45,900 | 3,442,041 | |
| SMART Global Holdings, Inc. (d) | 43,400 | 2,032,856 | |
| Synaptics, Inc. (d) | 22,300 | 3,387,816 | |
| Taiwan Semiconductor Manufacturing Co. Ltd. sponsored ADR | 75,100 | 8,759,664 | |
| Texas Instruments, Inc. | 145,200 | 27,678,024 | |
| Xilinx, Inc. | 33,950 | 5,087,068 | |
| 547,890,023 | |||
| TOTAL SEMICONDUCTORS & SEMICONDUCTOR EQUIPMENT | 641,449,000 | ||
| Software - 2.2% | |||
| Application Software - 2.2% | |||
| Cadence Design Systems, Inc. (d) | 104,400 | 15,414,660 | |
| Technology Hardware, Storage & Peripherals - 0.6% | |||
| Technology Hardware, Storage & Peripherals - 0.6% | |||
| Samsung Electronics Co. Ltd. | 64,340 | 4,381,389 | |
| TOTAL COMMON STOCKS | |||
| (Cost $380,721,168) | 676,389,676 | ||
| Convertible Preferred Stocks - 0.1% | |||
| Metals & Mining - 0.1% | |||
| Precious Metals & Minerals - 0.1% | |||
| Diamond Foundry, Inc. Series C (a)(c) | 18,335 | 440,040 | |
| Semiconductors & Semiconductor Equipment - 0.0% | |||
| Semiconductors - 0.0% | |||
| SiMa.ai Series B (a)(c) | 30,638 | 157,093 | |
| Tenstorrent, Inc. Series C1 (a)(c) | 900 | 53,509 | |
| 210,602 | |||
| TOTAL CONVERTIBLE PREFERRED STOCKS | |||
| (Cost $650,642) | 650,642 | ||
| Principal Amount | Value | ||
| Convertible Bonds - 0.0% | |||
| Semiconductors & Semiconductor Equipment - 0.0% | |||
| Semiconductors - 0.0% | |||
| SMART Global Holdings, Inc. 2.25% 2/15/26 (Cost $310,000) | 310,000 | 422,375 | |
| Shares | Value | ||
| Money Market Funds - 2.6% | |||
| Fidelity Cash Central Fund 0.06% (f) | 17,927,713 | 17,931,298 | |
| Fidelity Securities Lending Cash Central Fund 0.06% (f)(g) | 159,284 | 159,300 | |
| TOTAL MONEY MARKET FUNDS | |||
| (Cost $18,090,598) | 18,090,598 | ||
| TOTAL INVESTMENT IN SECURITIES - 99.3% | |||
| (Cost $399,822,408) | 695,603,291 | ||
| NET OTHER ASSETS (LIABILITIES) - 0.7% | 4,689,346 | ||
| NET ASSETS - 100% | $700,292,637 |
Legend
(a) Level 3 security
(b) Security is perpetual in nature with no stated maturity date.
(c) Restricted securities (including private placements) - Investment in securities not registered under the Securities Act of 1933 (excluding 144A issues). At the end of the period, the value of restricted securities (excluding 144A issues) amounted to $700,642 or 0.1% of net assets.
(d) Non-income producing
(e) Security or a portion of the security is on loan at period end.
(f) Affiliated fund that is generally available only to investment companies and other accounts managed by Fidelity Investments. The rate quoted is the annualized seven-day yield of the fund at period end. A complete unaudited listing of the fund's holdings as of its most recent quarter end is available upon request. In addition, each Fidelity Central Fund's financial statements, which are not covered by the Fund's Report of Independent Registered Public Accounting Firm, are available on the SEC's website or upon request.
(g) Investment made with cash collateral received from securities on loan.
Additional information on each restricted holding is as follows:
| Security | Acquisition Date | Acquisition Cost |
| Diamond Foundry, Inc. Series C | 3/15/21 | $440,040 |
| SiMa.ai Series B | 5/10/21 | $157,093 |
| Tenstorrent, Inc. Series C1 | 4/23/21 | $53,509 |
| Tenstorrent, Inc. 0% | 4/23/21 | $50,000 |
Affiliated Central Funds
Information regarding fiscal year to date income earned by the Fund from investments in Fidelity Central Funds is as follows:
| Fund | Income earned |
| Fidelity Cash Central Fund | $7,638 |
| Fidelity Securities Lending Cash Central Fund | 2,109 |
| Total | $9,747 |
Amounts in the income column in the above table include any capital gain distributions from underlying funds, which are presented in the corresponding line-item in the Statement of Operations, if applicable. Amount for Fidelity Securities Lending Cash Central Fund represents the income earned on investing cash collateral, less rebates paid to borrowers and any lending agent fees associated with the loan, plus any premium payments received for lending certain types of securities.
Fiscal year to date information regarding the Fund's investments in Fidelity Central Funds, including the ownership percentage, is presented below.
| Fund | Value, beginning of period | Purchases | Sales Proceeds | Realized Gain/Loss | Change in Unrealized appreciation (depreciation) | Value, end of period | % ownership, end of period |
| Fidelity Cash Central Fund 0.06% | $16,185,713 | $198,667,238 | $196,920,033 | $(239) | $(1,381) | $17,931,298 | 0.0% |
| Fidelity Securities Lending Cash Central Fund 0.06% | -- | 24,920,748 | 24,761,448 | -- | -- | 159,300 | 0.0% |
| Total | $16,185,713 | $223,587,986 | $221,681,481 | $(239) | $(1,381) | $18,090,598 |
Investment Valuation
The following is a summary of the inputs used, as of July 31, 2021, involving the Fund's assets and liabilities carried at fair value. The inputs or methodology used for valuing securities may not be an indication of the risk associated with investing in those securities. For more information on valuation inputs, and their aggregation into the levels used below, please refer to the Investment Valuation section in the accompanying Notes to Financial Statements.
| Valuation Inputs at Reporting Date: | ||||
| Description | Total | Level 1 | Level 2 | Level 3 |
| Investments in Securities: | ||||
| Common Stocks | $676,389,676 | $676,389,676 | $-- | $-- |
| Convertible Preferred Stocks | 650,642 | -- | -- | 650,642 |
| Convertible Bonds | 422,375 | -- | 422,375 | -- |
| Money Market Funds | 18,090,598 | 18,090,598 | -- | -- |
| Preferred Securities | 50,000 | -- | -- | 50,000 |
| Total Investments in Securities: | $695,603,291 | $694,480,274 | $422,375 | $700,642 |
| Net unrealized depreciation on unfunded committments | $(16,080) | $ | $(16,080) | $ |
Other Information
Distribution of investments by country or territory of incorporation, as a percentage of Total Net Assets, is as follows (Unaudited):
| United States of America | 87.9% |
| Netherlands | 7.7% |
| Taiwan | 1.3% |
| Israel | 1.3% |
| Others (Individually Less Than 1%) | 1.8% |
| 100.0% |
See accompanying notes which are an integral part of the financial statements.
Fidelity Advisor® Semiconductors Fund
Financial Statements
Statement of Assets and Liabilities
| July 31, 2021 | ||
| Assets | ||
| Investment in securities, at value (including securities loaned of $156,999) — See accompanying schedule: Unaffiliated issuers (cost $381,731,810) | $677,512,693 | |
| Fidelity Central Funds (cost $18,090,598) | 18,090,598 | |
| Total Investment in Securities (cost $399,822,408) | $695,603,291 | |
| Foreign currency held at value (cost $40,405) | 39,241 | |
| Receivable for investments sold | 5,519,123 | |
| Receivable for fund shares sold | 953,041 | |
| Dividends receivable | 164,928 | |
| Interest receivable | 3,216 | |
| Distributions receivable from Fidelity Central Funds | 1,076 | |
| Prepaid expenses | 1,793 | |
| Other receivables | 8,083 | |
| Total assets | 702,293,792 | |
| Liabilities | ||
| Payable for investments purchased | $710,658 | |
| Payable for fund shares redeemed | 505,658 | |
| Accrued management fee | 294,838 | |
| Distribution and service plan fees payable | 146,424 | |
| Other affiliated payables | 112,271 | |
| Unrealized depreciation on unfunded commitments | 16,080 | |
| Other payables and accrued expenses | 55,926 | |
| Collateral on securities loaned | 159,300 | |
| Total liabilities | 2,001,155 | |
| Net Assets | $700,292,637 | |
| Net Assets consist of: | ||
| Paid in capital | $371,103,829 | |
| Total accumulated earnings (loss) | 329,188,808 | |
| Net Assets | $700,292,637 | |
| Net Asset Value and Maximum Offering Price | ||
| Class A: | ||
| Net Asset Value and redemption price per share ($279,755,305 ÷ 6,044,091 shares)(a) | $46.29 | |
| Maximum offering price per share (100/94.25 of $46.29) | $49.11 | |
| Class M: | ||
| Net Asset Value and redemption price per share ($49,962,599 ÷ 1,141,876 shares)(a) | $43.75 | |
| Maximum offering price per share (100/96.50 of $43.75) | $45.34 | |
| Class C: | ||
| Net Asset Value and offering price per share ($86,216,800 ÷ 2,234,177 shares)(a) | $38.59 | |
| Class I: | ||
| Net Asset Value, offering price and redemption price per share ($257,501,885 ÷ 5,213,974 shares) | $49.39 | |
| Class Z: | ||
| Net Asset Value, offering price and redemption price per share ($26,856,048 ÷ 544,245 shares) | $49.35 |
(a) Redemption price per share is equal to net asset value less any applicable contingent deferred sales charge.
See accompanying notes which are an integral part of the financial statements.
Statement of Operations
| Year ended July 31, 2021 | ||
| Investment Income | ||
| Dividends | $4,247,398 | |
| Interest | 6,975 | |
| Income from Fidelity Central Funds (including $2,109 from security lending) | 9,747 | |
| Total income | 4,264,120 | |
| Expenses | ||
| Management fee | $2,718,396 | |
| Transfer agent fees | 908,687 | |
| Distribution and service plan fees | 1,431,421 | |
| Accounting fees | 194,774 | |
| Custodian fees and expenses | 10,223 | |
| Independent trustees' fees and expenses | 2,040 | |
| Registration fees | 120,695 | |
| Audit | 46,883 | |
| Legal | 3,052 | |
| Interest | 100 | |
| Miscellaneous | 4,281 | |
| Total expenses before reductions | 5,440,552 | |
| Expense reductions | (12,852) | |
| Total expenses after reductions | 5,427,700 | |
| Net investment income (loss) | (1,163,580) | |
| Realized and Unrealized Gain (Loss) | ||
| Net realized gain (loss) on: | ||
| Investment securities: | ||
| Unaffiliated issuers | 48,437,582 | |
| Fidelity Central Funds | (239) | |
| Foreign currency transactions | (1,016) | |
| Total net realized gain (loss) | 48,436,327 | |
| Change in net unrealized appreciation (depreciation) on: | ||
| Investment securities: | ||
| Unaffiliated issuers | 185,064,724 | |
| Fidelity Central Funds | (1,381) | |
| Unfunded commitments | (16,080) | |
| Assets and liabilities in foreign currencies | (1,493) | |
| Total change in net unrealized appreciation (depreciation) | 185,045,770 | |
| Net gain (loss) | 233,482,097 | |
| Net increase (decrease) in net assets resulting from operations | $232,318,517 |
See accompanying notes which are an integral part of the financial statements.
Statement of Changes in Net Assets
| Year ended July 31, 2021 | Year ended July 31, 2020 | |
| Increase (Decrease) in Net Assets | ||
| Operations | ||
| Net investment income (loss) | $(1,163,580) | $1,525,542 |
| Net realized gain (loss) | 48,436,327 | 25,181,646 |
| Change in net unrealized appreciation (depreciation) | 185,045,770 | 51,353,113 |
| Net increase (decrease) in net assets resulting from operations | 232,318,517 | 78,060,301 |
| Distributions to shareholders | (20,932,303) | (3,496,901) |
| Share transactions - net increase (decrease) | 127,672,949 | 18,884,510 |
| Total increase (decrease) in net assets | 339,059,163 | 93,447,910 |
| Net Assets | ||
| Beginning of period | 361,233,474 | 267,785,564 |
| End of period | $700,292,637 | $361,233,474 |
See accompanying notes which are an integral part of the financial statements.
Financial Highlights
Fidelity Advisor Semiconductors Fund Class A
| Years ended July 31, | 2021 | 2020 | 2019 | 2018 | 2017 |
| Selected Per–Share Data | |||||
| Net asset value, beginning of period | $29.79 | $23.03 | $25.06 | $21.57 | $16.50 |
| Income from Investment Operations | |||||
| Net investment income (loss)A | (.08) | .14 | .15 | .02 | .11 |
| Net realized and unrealized gain (loss) | 18.29 | 6.90 | 1.25 | 5.73 | 5.03 |
| Total from investment operations | 18.21 | 7.04 | 1.40 | 5.75 | 5.14 |
| Distributions from net investment income | (.04) | (.07) | (.10) | (.05)B | (.05) |
| Distributions from net realized gain | (1.67) | (.20) | (3.33) | (2.21)B | (.02) |
| Total distributions | (1.71) | (.28)C | (3.43) | (2.26) | (.07) |
| Redemption fees added to paid in capitalA | – | – | – | –D | –D |
| Net asset value, end of period | $46.29 | $29.79 | $23.03 | $25.06 | $21.57 |
| Total ReturnE,F | 62.45% | 30.65% | 10.18% | 27.35% | 31.21% |
| Ratios to Average Net AssetsG,H | |||||
| Expenses before reductions | 1.04% | 1.10% | 1.12% | 1.15% | 1.17% |
| Expenses net of fee waivers, if any | 1.04% | 1.09% | 1.11% | 1.15% | 1.17% |
| Expenses net of all reductions | 1.03% | 1.08% | 1.11% | 1.13% | 1.16% |
| Net investment income (loss) | (.21)% | .53% | .70% | .09% | .55% |
| Supplemental Data | |||||
| Net assets, end of period (000 omitted) | $279,755 | $140,072 | $98,459 | $97,883 | $72,040 |
| Portfolio turnover rateI | 41% | 136% | 110% | 133% | 99% |
A Calculated based on average shares outstanding during the period.
B The amounts shown reflect certain reclassifications related to book to tax differences that were made in the year shown.
C Total distributions per share do not sum due to rounding.
D Amount represents less than $.005 per share.
E Total returns would have been lower if certain expenses had not been reduced during the applicable periods shown.
F Total returns do not include the effect of the sales charges.
G Fees and expenses of any underlying mutual funds or exchange-traded funds (ETFs) are not included in the Fund's expense ratio. The Fund indirectly bears its proportionate share of these expenses. For additional expense information related to investments in Fidelity Central Funds, please refer to the "Investments in Fidelity Central Funds" note found in the Notes to Financial Statements section of the most recent Annual or Semi-Annual report.
H Expense ratios reflect operating expenses of the class. Expenses before reductions do not reflect amounts reimbursed, waived, or reduced through arrangements with the investment adviser, brokerage services, or other offset arrangements, if applicable, and do not represent the amount paid by the class during periods when reimbursements, waivers or reductions occur.
I Amount does not include the portfolio activity of any underlying mutual funds or exchange-traded funds (ETFs).
See accompanying notes which are an integral part of the financial statements.
Fidelity Advisor Semiconductors Fund Class M
| Years ended July 31, | 2021 | 2020 | 2019 | 2018 | 2017 |
| Selected Per–Share Data | |||||
| Net asset value, beginning of period | $28.25 | $21.89 | $24.04 | $20.77 | $15.91 |
| Income from Investment Operations | |||||
| Net investment income (loss)A | (.17) | .06 | .08 | (.05) | .04 |
| Net realized and unrealized gain (loss) | 17.31 | 6.55 | 1.16 | 5.50 | 4.84 |
| Total from investment operations | 17.14 | 6.61 | 1.24 | 5.45 | 4.88 |
| Distributions from net investment income | – | (.05) | (.06) | –B | – |
| Distributions from net realized gain | (1.64) | (.20) | (3.33) | (2.18)B | (.02) |
| Total distributions | (1.64) | (.25) | (3.39) | (2.18) | (.02) |
| Redemption fees added to paid in capitalA | – | – | – | –C | –C |
| Net asset value, end of period | $43.75 | $28.25 | $21.89 | $24.04 | $20.77 |
| Total ReturnD,E | 61.98% | 30.28% | 9.84% | 26.95% | 30.72% |
| Ratios to Average Net AssetsF,G | |||||
| Expenses before reductions | 1.30% | 1.38% | 1.44% | 1.48% | 1.53% |
| Expenses net of fee waivers, if any | 1.30% | 1.38% | 1.43% | 1.47% | 1.53% |
| Expenses net of all reductions | 1.29% | 1.37% | 1.43% | 1.46% | 1.52% |
| Net investment income (loss) | (.47)% | .24% | .38% | (.23)% | .20% |
| Supplemental Data | |||||
| Net assets, end of period (000 omitted) | $49,963 | $29,262 | $22,587 | $21,830 | $16,127 |
| Portfolio turnover rateH | 41% | 136% | 110% | 133% | 99% |
A Calculated based on average shares outstanding during the period.
B The amounts shown reflect certain reclassifications related to book to tax differences that were made in the year shown.
C Amount represents less than $.005 per share.
D Total returns would have been lower if certain expenses had not been reduced during the applicable periods shown.
E Total returns do not include the effect of the sales charges.
F Fees and expenses of any underlying mutual funds or exchange-traded funds (ETFs) are not included in the Fund's expense ratio. The Fund indirectly bears its proportionate share of these expenses. For additional expense information related to investments in Fidelity Central Funds, please refer to the "Investments in Fidelity Central Funds" note found in the Notes to Financial Statements section of the most recent Annual or Semi-Annual report.
G Expense ratios reflect operating expenses of the class. Expenses before reductions do not reflect amounts reimbursed, waived, or reduced through arrangements with the investment adviser, brokerage services, or other offset arrangements, if applicable, and do not represent the amount paid by the class during periods when reimbursements, waivers or reductions occur.
H Amount does not include the portfolio activity of any underlying mutual funds or exchange-traded funds (ETFs).
See accompanying notes which are an integral part of the financial statements.
Fidelity Advisor Semiconductors Fund Class C
| Years ended July 31, | 2021 | 2020 | 2019 | 2018 | 2017 |
| Selected Per–Share Data | |||||
| Net asset value, beginning of period | $25.18 | $19.59 | $21.88 | $19.10 | $14.69 |
| Income from Investment Operations | |||||
| Net investment income (loss)A | (.31) | (.05) | (.01) | (.14) | (.04) |
| Net realized and unrealized gain (loss) | 15.35 | 5.86 | .98 | 5.05 | 4.47 |
| Total from investment operations | 15.04 | 5.81 | .97 | 4.91 | 4.43 |
| Distributions from net investment income | – | (.01) | – | – | – |
| Distributions from net realized gain | (1.63) | (.20) | (3.26) | (2.13) | (.02) |
| Total distributions | (1.63) | (.22)B | (3.26) | (2.13) | (.02) |
| Redemption fees added to paid in capitalA | – | – | – | –C | –C |
| Net asset value, end of period | $38.59 | $25.18 | $19.59 | $21.88 | $19.10 |
| Total ReturnD,E | 61.17% | 29.73% | 9.33% | 26.38% | 30.21% |
| Ratios to Average Net AssetsF,G | |||||
| Expenses before reductions | 1.79% | 1.85% | 1.87% | 1.91% | 1.95% |
| Expenses net of fee waivers, if any | 1.79% | 1.85% | 1.87% | 1.91% | 1.95% |
| Expenses net of all reductions | 1.79% | 1.83% | 1.87% | 1.89% | 1.94% |
| Net investment income (loss) | (.97)% | (.23)% | (.06)% | (.67)% | (.23)% |
| Supplemental Data | |||||
| Net assets, end of period (000 omitted) | $86,217 | $57,320 | $45,659 | $57,915 | $42,684 |
| Portfolio turnover rateH | 41% | 136% | 110% | 133% | 99% |
A Calculated based on average shares outstanding during the period.
B Total distributions per share do not sum due to rounding.
C Amount represents less than $.005 per share.
D Total returns would have been lower if certain expenses had not been reduced during the applicable periods shown.
E Total returns do not include the effect of the contingent deferred sales charge.
F Fees and expenses of any underlying mutual funds or exchange-traded funds (ETFs) are not included in the Fund's expense ratio. The Fund indirectly bears its proportionate share of these expenses. For additional expense information related to investments in Fidelity Central Funds, please refer to the "Investments in Fidelity Central Funds" note found in the Notes to Financial Statements section of the most recent Annual or Semi-Annual report.
G Expense ratios reflect operating expenses of the class. Expenses before reductions do not reflect amounts reimbursed, waived, or reduced through arrangements with the investment adviser, brokerage services, or other offset arrangements, if applicable, and do not represent the amount paid by the class during periods when reimbursements, waivers or reductions occur.
H Amount does not include the portfolio activity of any underlying mutual funds or exchange-traded funds (ETFs).
See accompanying notes which are an integral part of the financial statements.
Fidelity Advisor Semiconductors Fund Class I
| Years ended July 31, | 2021 | 2020 | 2019 | 2018 | 2017 |
| Selected Per–Share Data | |||||
| Net asset value, beginning of period | $31.68 | $24.42 | $26.33 | $22.56 | $17.24 |
| Income from Investment Operations | |||||
| Net investment income (loss)A | .03 | .22 | .23 | .10 | .17 |
| Net realized and unrealized gain (loss) | 19.47 | 7.34 | 1.35 | 5.99 | 5.26 |
| Total from investment operations | 19.50 | 7.56 | 1.58 | 6.09 | 5.43 |
| Distributions from net investment income | (.12) | (.10) | (.16) | (.11)B | (.09) |
| Distributions from net realized gain | (1.67) | (.20) | (3.33) | (2.21)B | (.02) |
| Total distributions | (1.79) | (.30) | (3.49) | (2.32) | (.11) |
| Redemption fees added to paid in capitalA | – | – | – | –C | –C |
| Net asset value, end of period | $49.39 | $31.68 | $24.42 | $26.33 | $22.56 |
| Total ReturnD | 62.86% | 31.08% | 10.46% | 27.74% | 31.62% |
| Ratios to Average Net AssetsE,F | |||||
| Expenses before reductions | .77% | .81% | .83% | .86% | .88% |
| Expenses net of fee waivers, if any | .77% | .81% | .82% | .86% | .88% |
| Expenses net of all reductions | .76% | .79% | .82% | .84% | .87% |
| Net investment income (loss) | .06% | .81% | .98% | .38% | .84% |
| Supplemental Data | |||||
| Net assets, end of period (000 omitted) | $257,502 | $126,660 | $98,451 | $140,362 | $91,052 |
| Portfolio turnover rateG | 41% | 136% | 110% | 133% | 99% |
A Calculated based on average shares outstanding during the period.
B The amounts shown reflect certain reclassifications related to book to tax differences that were made in the year shown.
C Amount represents less than $.005 per share.
D Total returns would have been lower if certain expenses had not been reduced during the applicable periods shown.
E Fees and expenses of any underlying mutual funds or exchange-traded funds (ETFs) are not included in the Fund's expense ratio. The Fund indirectly bears its proportionate share of these expenses. For additional expense information related to investments in Fidelity Central Funds, please refer to the "Investments in Fidelity Central Funds" note found in the Notes to Financial Statements section of the most recent Annual or Semi-Annual report.
F Expense ratios reflect operating expenses of the class. Expenses before reductions do not reflect amounts reimbursed, waived, or reduced through arrangements with the investment adviser, brokerage services, or other offset arrangements, if applicable, and do not represent the amount paid by the class during periods when reimbursements, waivers or reductions occur.
G Amount does not include the portfolio activity of any underlying mutual funds or exchange-traded funds (ETFs).
See accompanying notes which are an integral part of the financial statements.
Fidelity Advisor Semiconductors Fund Class Z
| Years ended July 31, | 2021 | 2020 | 2019 A |
| Selected Per–Share Data | |||
| Net asset value, beginning of period | $31.65 | $24.38 | $26.00 |
| Income from Investment Operations | |||
| Net investment income (loss)B | .08 | .26 | .17 |
| Net realized and unrealized gain (loss) | 19.45 | 7.33 | 1.76 |
| Total from investment operations | 19.53 | 7.59 | 1.93 |
| Distributions from net investment income | (.16) | (.11) | (.22) |
| Distributions from net realized gain | (1.67) | (.20) | (3.33) |
| Total distributions | (1.83) | (.32)C | (3.55) |
| Redemption fees added to paid in capitalB | – | – | – |
| Net asset value, end of period | $49.35 | $31.65 | $24.38 |
| Total ReturnD,E | 63.06% | 31.22% | 12.03% |
| Ratios to Average Net AssetsF,G | |||
| Expenses before reductions | .64% | .68% | .69%H |
| Expenses net of fee waivers, if any | .64% | .68% | .69%H |
| Expenses net of all reductions | .64% | .66% | .68%H |
| Net investment income (loss) | .18% | .94% | .91%H |
| Supplemental Data | |||
| Net assets, end of period (000 omitted) | $26,856 | $7,920 | $2,629 |
| Portfolio turnover rateI | 41% | 136% | 110%H |
A For the period October 2, 2018 (commencement of sale of shares) to July 31, 2019.
B Calculated based on average shares outstanding during the period.
C Total distributions per share do not sum due to rounding.
D Total returns for periods of less than one year are not annualized.
E Total returns would have been lower if certain expenses had not been reduced during the applicable periods shown.
F Fees and expenses of any underlying mutual funds or exchange-traded funds (ETFs) are not included in the Fund's expense ratio. The Fund indirectly bears its proportionate share of these expenses. For additional expense information related to investments in Fidelity Central Funds, please refer to the "Investments in Fidelity Central Funds" note found in the Notes to Financial Statements section of the most recent Annual or Semi-Annual report.
G Expense ratios reflect operating expenses of the class. Expenses before reductions do not reflect amounts reimbursed, waived, or reduced through arrangements with the investment adviser, brokerage services, or other offset arrangements, if applicable, and do not represent the amount paid by the class during periods when reimbursements, waivers or reductions occur.
H Annualized
I Amount does not include the portfolio activity of any underlying mutual funds or exchange-traded funds (ETFs).
See accompanying notes which are an integral part of the financial statements.
Fidelity Advisor® Technology Fund
Performance: The Bottom Line
Average annual total return reflects the change in the value of an investment, assuming reinvestment of distributions from dividend income and capital gains (the profits earned upon the sale of securities that have grown in value, if any) and assuming a constant rate of performance each year. The hypothetical investment and the average annual total returns do not reflect the deduction of taxes that a shareholder would pay on fund distributions or the redemption of fund shares. During periods of reimbursement by Fidelity, a fund’s total return will be greater than it would be had the reimbursement not occurred. How a fund did yesterday is no guarantee of how it will do tomorrow.
Average Annual Total Returns
| For the periods ended July 31, 2021 | Past 1 year | Past 5 years | Past 10 years |
| Class A (incl. 5.75% sales charge) | 36.48% | 30.75% | 20.85% |
| Class M (incl. 3.50% sales charge) | 39.41% | 31.04% | 20.83% |
| Class C (incl. contingent deferred sales charge) | 42.73% | 31.31% | 20.84% |
| Class I | 45.18% | 32.67% | 21.93% |
| Class Z | 45.37% | 32.76% | 21.97% |
Class C shares' contingent deferred sales charges included in the past one year, past five years and past ten years total return figures are 1%, 0% and 0%, respectively.
The initial offering of Class Z shares took place on October 2, 2018. Returns prior to October 2, 2018, are those of Class I.
$10,000 Over 10 Years
Let's say hypothetically that $10,000 was invested in Fidelity Advisor® Technology Fund - Class A on July 31, 2011, and the current 5.75% sales charge was paid.
The chart shows how the value of your investment would have changed, and also shows how the S&P 500® Index performed over the same period.
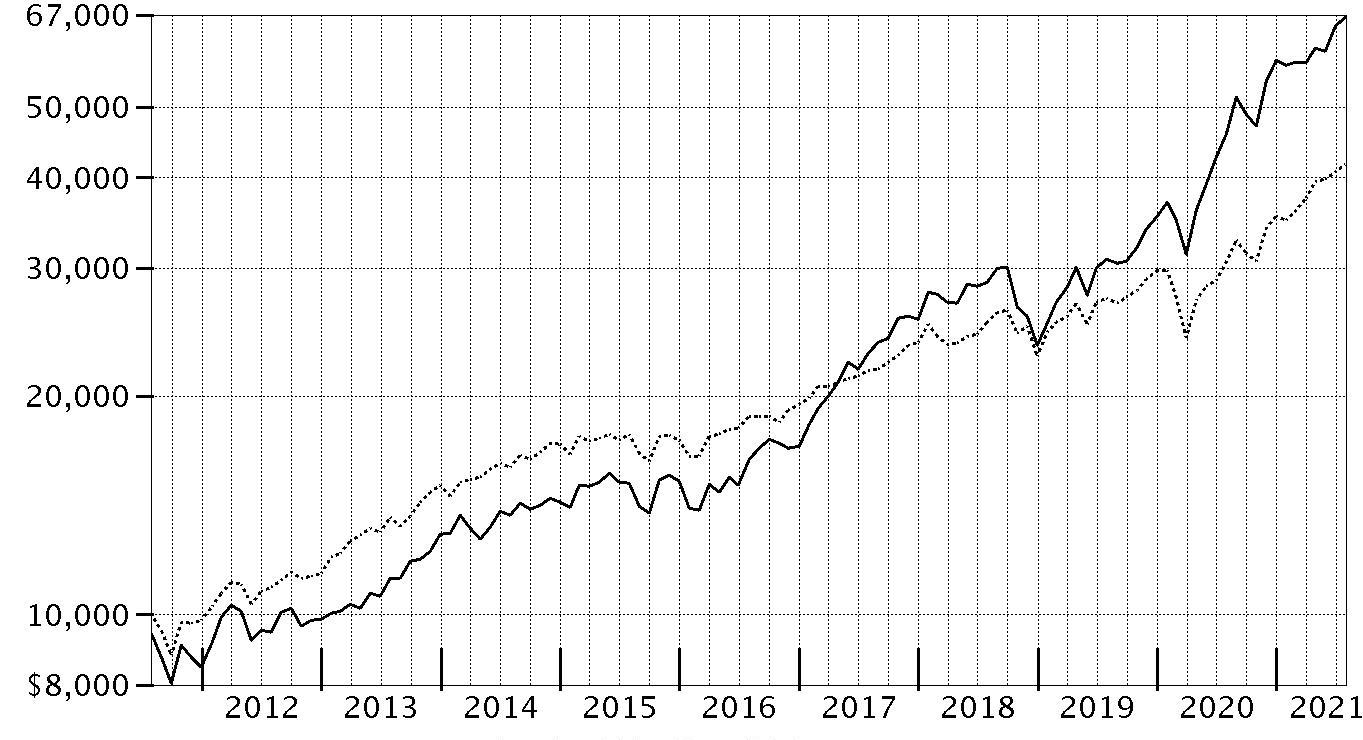
| Period Ending Values | ||
|
| $66,437 | Fidelity Advisor® Technology Fund - Class A |
|
| $41,689 | S&P 500® Index |
Fidelity Advisor® Technology Fund
Management's Discussion of Fund Performance
Market Recap: The S&P 500® index gained 36.45% for the 12 months ending July 31, 2021, as U.S. equities continued a historic rebound following a steep but brief decline due to the early-2020 outbreak and spread of COVID-19. A confluence of powerful forces propelled risk assets, returning the stock market to pre-pandemic highs by late August 2020. The rally slowed in September, when stocks began a two-month retreat amid Congress’s inability to reach a deal on additional fiscal stimulus, as well as uncertainty about the election. But as the calendar turned, investors grew hopeful. The rollout of three COVID-19 vaccines was underway, the U.S. Federal Reserve pledged to hold interest rates near zero until the economy recovered, and the federal government planned to deploy trillions of dollars to boost consumers and the economy. This backdrop fueled a sharp rotation, with small-cap value usurping leadership from large growth. As part of the “reopening” theme, investors moved out of tech-driven mega-caps that had thrived due to the work-from-home trend in favor of cheap smaller companies that stood to benefit from a broad cyclical recovery. A flattish May reflected concerns about inflation and jobs, but the uptrend resumed through July, driven by corporate earnings. Notably, this leg saw momentum shift back to large growth, as easing rates and a hawkish Fed stymied the reflation trade. By sector, financials (+55%) led, driven by banks (+63%), whereas utilities (+12%) and consumer staples (+18%) notably lagged. Comments from Portfolio Manager Adam Benjamin: For the fiscal year ending July 31, 2021, the fund's share classes (excluding sales charges, if applicable) gained roughly 44% to 45%, outperforming the 40.76% gain of the MSCI US IMI Information Technology 25/50 Index, as well as the broad-based S&P 500® index. Versus the sector index, security selection was the primary contributor, especially in the semiconductors industry. Security selection in auto parts & equipment and internet services & infrastructure also boosted the fund's relative result. Our top individual relative contributor was an out-of-index stake and timely positioning in QuantumScape (+328%). The company was not held at period end. Also adding value was our outsized stake in Marvell Technology, a new position this period that gained about 27%. Marvell Technology was among the biggest holdings as of July 31. Another notable relative contributor was an overweighting in Hubspot (+152%). In contrast, the largest detractor from performance versus the sector index was our stock picks in the other diversified financial services category. Also detracting from the fund's relative result was an overweighting in internet services & infrastructure and an underweighting in semiconductor equipment. The fund's largest individual relative detractor was our lighter-than-index stake in Applied Materials, which gained about 120% the past year. Applied Materials was not held at period end. Another notable relative detractor was an outsized stake in Zoom Video Communications (-10%), which was among the biggest holdings at period end. In the other financial services industry, another notable relative detractor was an out-of-index stake in Ant Intl (-76%). Notable changes in positioning include increased exposure to the semiconductors subindustry and a lower allocation to data processing & outsourced services.The views expressed above reflect those of the portfolio manager(s) only through the end of the period as stated on the cover of this report and do not necessarily represent the views of Fidelity or any other person in the Fidelity organization. Any such views are subject to change at any time based upon market or other conditions and Fidelity disclaims any responsibility to update such views. These views may not be relied on as investment advice and, because investment decisions for a Fidelity fund are based on numerous factors, may not be relied on as an indication of trading intent on behalf of any Fidelity fund.
Note to shareholders: On January 1, 2021, Nidhi Gupta came off the fund, leaving Adam Benjamin as sole portfolio manager.Fidelity Advisor® Technology Fund
Investment Summary (Unaudited)
Top Ten Stocks as of July 31, 2021
| % of fund's net assets | |
| Apple, Inc. | 22.4 |
| Microsoft Corp. | 18.1 |
| NVIDIA Corp. | 6.0 |
| Salesforce.com, Inc. | 3.8 |
| Marvell Technology, Inc. | 3.7 |
| Cisco Systems, Inc. | 3.4 |
| Adobe, Inc. | 3.2 |
| PayPal Holdings, Inc. | 2.7 |
| Zoom Video Communications, Inc. Class A | 2.6 |
| NXP Semiconductors NV | 2.3 |
| 68.2 |
Top Industries (% of fund's net assets)
| As of July 31, 2021 | ||
| Software | 34.7% | |
| Technology Hardware, Storage & Peripherals | 22.9% | |
| Semiconductors & Semiconductor Equipment | 16.8% | |
| IT Services | 13.0% | |
| Communications Equipment | 4.6% | |
| All Others* | 8.0% | |

* Includes short-term investments and net other assets (liabilities).
Fidelity Advisor® Technology Fund
Schedule of Investments July 31, 2021
Showing Percentage of Net Assets
| Preferred Securities - 0.1% | |||
| Shares | Value | ||
| Enevate Corp. 0% 1/29/23 (a)(b) | 4,035,056 | $4,035,056 | |
| Tenstorrent, Inc. 0% (a)(b)(c) | 370,000 | 370,000 | |
| TOTAL PREFERRED SECURITIES | |||
| (Cost $4,405,056) | 4,405,056 | ||
| Common Stocks - 98.7% | |||
| Automobiles - 0.1% | |||
| Automobile Manufacturers - 0.1% | |||
| Lucid Motors, Inc. (b) | 211,400 | 4,512,967 | |
| Capital Markets - 0.0% | |||
| Financial Exchanges & Data - 0.0% | |||
| Coinbase Global, Inc. (d)(e) | 3,600 | 851,688 | |
| Chemicals - 0.2% | |||
| Commodity Chemicals - 0.2% | |||
| LG Chemical Ltd. | 16,570 | 12,103,074 | |
| Communications Equipment - 4.6% | |||
| Communications Equipment - 4.6% | |||
| Cisco Systems, Inc. | 3,045,300 | 168,618,261 | |
| F5 Networks, Inc. (d) | 276,500 | 57,100,015 | |
| 225,718,276 | |||
| Diversified Financial Services - 0.1% | |||
| Other Diversified Financial Services - 0.1% | |||
| Ant International Co. Ltd. Class C (a)(b)(d) | 1,469,829 | 3,674,573 | |
| Electronic Equipment & Components - 0.9% | |||
| Electronic Manufacturing Services - 0.9% | |||
| Flex Ltd. (d) | 2,390,300 | 42,953,691 | |
| Entertainment - 1.0% | |||
| Movies & Entertainment - 1.0% | |||
| Netflix, Inc. (d) | 94,666 | 48,996,282 | |
| Hotels, Restaurants & Leisure - 0.7% | |||
| Hotels, Resorts & Cruise Lines - 0.7% | |||
| Airbnb, Inc. Class A | 239,400 | 34,475,994 | |
| Interactive Media & Services - 1.2% | |||
| Interactive Media & Services - 1.2% | |||
| Kuaishou Technology Class B (f) | 40,900 | 579,463 | |
| Snap, Inc. Class A (d) | 789,700 | 58,769,474 | |
| 59,348,937 | |||
| Internet & Direct Marketing Retail - 0.0% | |||
| Internet & Direct Marketing Retail - 0.0% | |||
| Deliveroo PLC Class A (d)(e)(f) | 307,100 | 1,408,668 | |
| IT Services - 12.9% | |||
| Data Processing & Outsourced Services - 8.8% | |||
| Genpact Ltd. | 862,800 | 42,976,068 | |
| MasterCard, Inc. Class A | 239,500 | 92,432,630 | |
| PayPal Holdings, Inc. (d) | 478,100 | 131,730,893 | |
| Square, Inc. (d) | 294,200 | 72,743,892 | |
| Visa, Inc. Class A | 358,916 | 88,433,313 | |
| 428,316,796 | |||
| Internet Services & Infrastructure - 3.5% | |||
| Okta, Inc. (d) | 89,200 | 22,102,868 | |
| Shopify, Inc. (d) | 23,700 | 35,548,341 | |
| Snowflake Computing, Inc. | 1,993 | 529,580 | |
| Twilio, Inc. Class A (d) | 300,000 | 112,077,000 | |
| 170,257,789 | |||
| IT Consulting & Other Services - 0.6% | |||
| Capgemini SA | 143,500 | 31,023,848 | |
| TOTAL IT SERVICES | 629,598,433 | ||
| Life Sciences Tools & Services - 0.0% | |||
| Life Sciences Tools & Services - 0.0% | |||
| JHL Biotech, Inc. (a)(d) | 387,462 | 0 | |
| Oil, Gas & Consumable Fuels - 0.7% | |||
| Oil & Gas Refining & Marketing - 0.7% | |||
| Reliance Industries Ltd. | 1,218,700 | 33,364,317 | |
| Reliance Industries Ltd. | 80,346 | 1,524,222 | |
| 34,888,539 | |||
| Pharmaceuticals - 0.0% | |||
| Pharmaceuticals - 0.0% | |||
| Chime Biologics Ltd. (a)(d) | 387,462 | 201,802 | |
| Road & Rail - 2.2% | |||
| Trucking - 2.2% | |||
| DiDi Global, Inc. ADR (e) | 113,900 | 1,174,309 | |
| Lyft, Inc. (d) | 713,642 | 39,478,675 | |
| TuSimple Holdings, Inc. (d) | 86,300 | 3,175,840 | |
| Uber Technologies, Inc. (d) | 1,409,664 | 61,263,997 | |
| 105,092,821 | |||
| Semiconductors & Semiconductor Equipment - 16.8% | |||
| Semiconductor Equipment - 2.2% | |||
| ASML Holding NV (Netherlands) | 41,400 | 31,645,527 | |
| Lam Research Corp. | 61,200 | 39,009,492 | |
| Teradyne, Inc. | 300,900 | 38,214,300 | |
| 108,869,319 | |||
| Semiconductors - 14.6% | |||
| Marvell Technology, Inc. | 2,939,760 | 177,884,878 | |
| Microchip Technology, Inc. | 348,800 | 49,920,256 | |
| NVIDIA Corp. | 1,506,600 | 293,771,934 | |
| NXP Semiconductors NV | 554,400 | 114,422,616 | |
| ON Semiconductor Corp. (d) | 1,324,500 | 51,734,970 | |
| Taiwan Semiconductor Manufacturing Co. Ltd. | 1,145,000 | 23,953,054 | |
| 711,687,708 | |||
| TOTAL SEMICONDUCTORS & SEMICONDUCTOR EQUIPMENT | 820,557,027 | ||
| Software - 34.4% | |||
| Application Software - 15.0% | |||
| Adobe, Inc. (d) | 247,216 | 153,676,882 | |
| Autodesk, Inc. (d) | 203,900 | 65,478,407 | |
| Confluent, Inc. (e) | 11,500 | 450,685 | |
| HubSpot, Inc. (d) | 92,600 | 55,191,452 | |
| Intuit, Inc. | 143,200 | 75,891,704 | |
| Pine Labs Private Ltd. (a)(b) | 3,660 | 1,364,668 | |
| Procore Technologies, Inc. (d) | 4,400 | 454,432 | |
| Salesforce.com, Inc. (d) | 772,839 | 186,972,939 | |
| Workday, Inc. Class A (d) | 282,300 | 66,171,120 | |
| Zoom Video Communications, Inc. Class A (d) | 339,264 | 128,275,718 | |
| 733,928,007 | |||
| Systems Software - 19.4% | |||
| Microsoft Corp. | 3,106,700 | 885,129,897 | |
| Rapid7, Inc. (d) | 275,900 | 31,383,625 | |
| Tenable Holdings, Inc. (d) | 580,400 | 24,841,120 | |
| UiPath, Inc. | 37,500 | 2,228,700 | |
| UiPath, Inc. Class A (d) | 8,600 | 538,016 | |
| 944,121,358 | |||
| TOTAL SOFTWARE | 1,678,049,365 | ||
| Technology Hardware, Storage & Peripherals - 22.9% | |||
| Technology Hardware, Storage & Peripherals - 22.9% | |||
| Apple, Inc. | 7,474,616 | 1,090,247,491 | |
| Samsung Electronics Co. Ltd. | 367,700 | 25,039,427 | |
| 1,115,286,918 | |||
| TOTAL COMMON STOCKS | |||
| (Cost $2,472,357,217) | 4,817,719,055 | ||
| Preferred Stocks - 1.2% | |||
| Convertible Preferred Stocks - 1.0% | |||
| Aerospace & Defense - 0.2% | |||
| Aerospace & Defense - 0.2% | |||
| Relativity Space, Inc. Series E (a)(b) | 482,616 | 11,020,585 | |
| Communications Equipment - 0.0% | |||
| Communications Equipment - 0.0% | |||
| Xsight Labs Ltd. Series D (a)(b) | 101,300 | 809,995 | |
| Electronic Equipment & Components - 0.2% | |||
| Electronic Equipment & Instruments - 0.2% | |||
| Enevate Corp. Series E (a)(b) | 9,477,386 | 10,507,426 | |
| Internet & Direct Marketing Retail - 0.3% | |||
| Internet & Direct Marketing Retail - 0.3% | |||
| GoBrands, Inc. Series G (a)(b) | 14,100 | 5,477,709 | |
| Instacart, Inc. Series I (a)(b) | 29,110 | 3,638,750 | |
| Reddit, Inc.: | |||
| Series D (a)(b)(d) | 94,300 | 5,827,174 | |
| Series E (a)(b) | 5,300 | 327,508 | |
| 15,271,141 | |||
| IT Services - 0.1% | |||
| Internet Services & Infrastructure - 0.1% | |||
| ByteDance Ltd. Series E1 (a)(b) | 26,036 | 3,025,123 | |
| Metals & Mining - 0.1% | |||
| Precious Metals & Minerals - 0.1% | |||
| Diamond Foundry, Inc. Series C (a)(b) | 151,757 | 3,642,168 | |
| Road & Rail - 0.0% | |||
| Trucking - 0.0% | |||
| Convoy, Inc. Series D (a)(b)(d) | 81,762 | 1,095,611 | |
| Semiconductors & Semiconductor Equipment - 0.0% | |||
| Semiconductors - 0.0% | |||
| SiMa.ai Series B (a)(b) | 231,000 | 1,184,429 | |
| Tenstorrent, Inc. Series C1 (a)(b) | 6,600 | 392,398 | |
| 1,576,827 | |||
| Software - 0.1% | |||
| Application Software - 0.1% | |||
| Databricks, Inc. Series G (a)(b) | 12,600 | 2,234,836 | |
| Systems Software - 0.0% | |||
| Nuvia, Inc. Series B (b) | 678,052 | 554,118 | |
| TOTAL SOFTWARE | 2,788,954 | ||
| TOTAL CONVERTIBLE PREFERRED STOCKS | 49,737,830 | ||
| Nonconvertible Preferred Stocks - 0.2% | |||
| Software - 0.2% | |||
| Application Software - 0.2% | |||
| Pine Labs Private Ltd.: | |||
| Series 1 0.00% (a)(b) | 8,747 | 3,261,406 | |
| Series A 0.00% (a)(b) | 2,186 | 815,072 | |
| Series B 0.00% (a)(b) | 2,378 | 886,661 | |
| Series B2 0.00% (a)(b) | 1,923 | 717,010 | |
| Series C 0.00% (a)(b) | 3,578 | 1,334,093 | |
| Series C1 0.00% (a)(b) | 754 | 281,136 | |
| Series D 0.00% (a)(b) | 806 | 300,525 | |
| 7,595,903 | |||
| TOTAL PREFERRED STOCKS | |||
| (Cost $51,331,690) | 57,333,733 | ||
| Money Market Funds - 0.6% | |||
| Fidelity Cash Central Fund 0.06% (g) | 24,900,055 | 24,905,035 | |
| Fidelity Securities Lending Cash Central Fund 0.06% (g)(h) | 3,619,023 | 3,619,384 | |
| TOTAL MONEY MARKET FUNDS | |||
| (Cost $28,524,419) | 28,524,419 | ||
| TOTAL INVESTMENT IN SECURITIES - 100.6% | |||
| (Cost $2,556,618,382) | 4,907,982,263 | ||
| NET OTHER ASSETS (LIABILITIES) - (0.6)% | (28,931,382) | ||
| NET ASSETS - 100% | $4,879,050,881 |
Legend
(a) Level 3 security
(b) Restricted securities (including private placements) - Investment in securities not registered under the Securities Act of 1933 (excluding 144A issues). At the end of the period, the value of restricted securities (excluding 144A issues) amounted to $71,290,997 or 1.5% of net assets.
(c) Security is perpetual in nature with no stated maturity date.
(d) Non-income producing
(e) Security or a portion of the security is on loan at period end.
(f) Security exempt from registration under Rule 144A of the Securities Act of 1933. These securities may be resold in transactions exempt from registration, normally to qualified institutional buyers. At the end of the period, the value of these securities amounted to $1,988,131 or 0.0% of net assets.
(g) Affiliated fund that is generally available only to investment companies and other accounts managed by Fidelity Investments. The rate quoted is the annualized seven-day yield of the fund at period end. A complete unaudited listing of the fund's holdings as of its most recent quarter end is available upon request. In addition, each Fidelity Central Fund's financial statements, which are not covered by the Fund's Report of Independent Registered Public Accounting Firm, are available on the SEC's website or upon request.
(h) Investment made with cash collateral received from securities on loan.
Additional information on each restricted holding is as follows:
| Security | Acquisition Date | Acquisition Cost |
| Ant International Co. Ltd. Class C | 5/16/18 | $8,245,741 |
| ByteDance Ltd. Series E1 | 11/18/20 | $2,852,873 |
| Convoy, Inc. Series D | 10/30/19 | $1,107,057 |
| Databricks, Inc. Series G | 2/1/21 | $2,234,836 |
| Diamond Foundry, Inc. Series C | 3/15/21 | $3,642,168 |
| Enevate Corp. Series E | 1/29/21 | $10,507,436 |
| Enevate Corp. 0% 1/29/23 | 1/29/21 | $4,035,056 |
| GoBrands, Inc. Series G | 3/2/21 | $3,521,014 |
| Instacart, Inc. Series I | 2/26/21 | $3,638,750 |
| Lucid Motors, Inc. | 2/22/21 | $3,171,000 |
| Nuvia, Inc. Series B | 3/16/21 | $554,115 |
| Pine Labs Private Ltd. | 6/30/21 | $1,364,668 |
| Pine Labs Private Ltd. Series 1 0.00% | 6/30/21 | $3,261,406 |
| Pine Labs Private Ltd. Series A 0.00% | 6/30/21 | $815,072 |
| Pine Labs Private Ltd. Series B 0.00% | 6/30/21 | $886,661 |
| Pine Labs Private Ltd. Series B2 0.00% | 6/30/21 | $717,010 |
| Pine Labs Private Ltd. Series C 0.00% | 6/30/21 | $1,334,093 |
| Pine Labs Private Ltd. Series C1 0.00% | 6/30/21 | $281,136 |
| Pine Labs Private Ltd. Series D 0.00% | 6/30/21 | $300,525 |
| Reddit, Inc. Series D | 2/4/19 | $2,045,018 |
| Reddit, Inc. Series E | 5/18/21 | $225,113 |
| Relativity Space, Inc. Series E | 5/27/21 | $11,020,585 |
| SiMa.ai Series B | 5/10/21 | $1,184,429 |
| Tenstorrent, Inc. Series C1 | 4/23/21 | $392,398 |
| Tenstorrent, Inc. 0% | 4/23/21 | $370,000 |
| Xsight Labs Ltd. Series D | 2/16/21 | $809,995 |
Affiliated Central Funds
Information regarding fiscal year to date income earned by the Fund from investments in Fidelity Central Funds is as follows:
| Fund | Income earned |
| Fidelity Cash Central Fund | $32,141 |
| Fidelity Securities Lending Cash Central Fund | 61,338 |
| Total | $93,479 |
Amounts in the income column in the above table include any capital gain distributions from underlying funds, which are presented in the corresponding line-item in the Statement of Operations, if applicable. Amount for Fidelity Securities Lending Cash Central Fund represents the income earned on investing cash collateral, less rebates paid to borrowers and any lending agent fees associated with the loan, plus any premium payments received for lending certain types of securities.
Fiscal year to date information regarding the Fund's investments in Fidelity Central Funds, including the ownership percentage, is presented below.
| Fund | Value, beginning of period | Purchases | Sales Proceeds | Realized Gain/Loss | Change in Unrealized appreciation (depreciation) | Value, end of period | % ownership, end of period |
| Fidelity Cash Central Fund 0.06% | $44,289,708 | $810,973,295 | $830,348,834 | $(6,373) | $(2,761) | $24,905,035 | 0.0% |
| Fidelity Securities Lending Cash Central Fund 0.06% | 4,660,234 | 470,724,776 | 471,765,626 | -- | -- | 3,619,384 | 0.0% |
| Total | $48,949,942 | $1,281,698,071 | $1,302,114,460 | $(6,373) | $(2,761) | $28,524,419 |
Investment Valuation
The following is a summary of the inputs used, as of July 31, 2021, involving the Fund's assets and liabilities carried at fair value. The inputs or methodology used for valuing securities may not be an indication of the risk associated with investing in those securities. For more information on valuation inputs, and their aggregation into the levels used below, please refer to the Investment Valuation section in the accompanying Notes to Financial Statements.
| Valuation Inputs at Reporting Date: | ||||
| Description | Total | Level 1 | Level 2 | Level 3 |
| Investments in Securities: | ||||
| Common Stocks | $4,817,719,055 | $4,750,137,764 | $62,340,248 | $5,241,043 |
| Preferred Stocks | 57,333,733 | 554,118 | -- | 56,779,615 |
| Money Market Funds | 28,524,419 | 28,524,419 | -- | -- |
| Preferred Securities | 4,405,056 | -- | -- | 4,405,056 |
| Total Investments in Securities: | $4,907,982,263 | $4,779,216,301 | $62,340,248 | $66,425,714 |
| Net unrealized depreciation on unfunded commitments | $(127,890) | $ | $(127,890) | $ |
The following is a reconciliation of Investments in Securities for which Level 3 inputs were used in determining value:
| Investments in Securities: | |
| Preferred Stocks | |
| Beginning Balance | $ 6,488,128 |
| Total Realized Gain (Loss) | -- |
| Total Unrealized Gain (Loss) | 3,363,241 |
| Cost of Purchases | 47,625,501 |
| Proceeds of Sales | -- |
| Amortization/Accretion | -- |
| Transfers in to Level 3 | -- |
| Transfers out of Level 3 | (697,255) |
| Ending Balance | $56,779,615 |
| The change in unrealized gain (loss) for the period attributable to Level 3 securities held at July 31, 2021 | $ 3,363,241 |
| Investment in Securities | |
| Beginning Balance | $15,653,482 |
| Total Realized Gain (Loss) | (10,626) |
| Total Unrealized Gain (Loss) | (11,689,212) |
| Cost of Purchases | 5,769,724 |
| Proceeds of Sales | -- |
| Amortization/Accretion | -- |
| Transfers in to Level 3 | -- |
| Transfers out of Level 3 | (77,269) |
| Ending Balance | $9,646,099 |
| The change in unrealized gain (loss) for the period attributable to Level 3 securities held at July 31, 2021 | $(11,699,839) |
The information used in the above reconciliation represents fiscal year to date activity for any Investments in Securities identified as using Level 3 inputs at either the beginning or the end of the current fiscal period. Cost of purchases and proceeds of sales may include securities received and/or delivered through in-kind transactions. Transfers in or out of Level 3 represent the beginning value of any Security or Instrument where a change in the pricing level occurred from the beginning to the end of the period. The cost of purchases and the proceeds of sales may include securities received or delivered through corporate actions or exchanges. Realized and unrealized gain (losses) disclosed in the reconciliation are included in Net Gain (Loss) on the Fund’s Statement of Operations.
See accompanying notes which are an integral part of the financial statements.
Fidelity Advisor® Technology Fund
Financial Statements
Statement of Assets and Liabilities
| July 31, 2021 | ||
| Assets | ||
| Investment in securities, at value (including securities loaned of $3,458,671) — See accompanying schedule: Unaffiliated issuers (cost $2,528,093,963) | $4,879,457,844 | |
| Fidelity Central Funds (cost $28,524,419) | 28,524,419 | |
| Total Investment in Securities (cost $2,556,618,382) | $4,907,982,263 | |
| Receivable for fund shares sold | 2,382,648 | |
| Dividends receivable | 202,317 | |
| Distributions receivable from Fidelity Central Funds | 10,779 | |
| Prepaid expenses | 12,077 | |
| Other receivables | 208,622 | |
| Total assets | 4,910,798,706 | |
| Liabilities | ||
| Payable for investments purchased | $19,938,112 | |
| Payable for fund shares redeemed | 2,256,718 | |
| Accrued management fee | 2,112,082 | |
| Distribution and service plan fees payable | 985,975 | |
| Other affiliated payables | 672,679 | |
| Unrealized depreciation on unfunded commitments | 127,890 | |
| Other payables and accrued expenses | 2,050,819 | |
| Collateral on securities loaned | 3,603,550 | |
| Total liabilities | 31,747,825 | |
| Net Assets | $4,879,050,881 | |
| Net Assets consist of: | ||
| Paid in capital | $2,030,169,271 | |
| Total accumulated earnings (loss) | 2,848,881,610 | |
| Net Assets | $4,879,050,881 | |
| Net Asset Value and Maximum Offering Price | ||
| Class A: | ||
| Net Asset Value and redemption price per share ($1,848,643,337 ÷ 18,047,520 shares)(a) | $102.43 | |
| Maximum offering price per share (100/94.25 of $102.43) | $108.68 | |
| Class M: | ||
| Net Asset Value and redemption price per share ($624,533,707 ÷ 6,563,994 shares)(a) | $95.15 | |
| Maximum offering price per share (100/96.50 of $95.15) | $98.60 | |
| Class C: | ||
| Net Asset Value and offering price per share ($410,660,894 ÷ 5,071,330 shares)(a) | $80.98 | |
| Class I: | ||
| Net Asset Value, offering price and redemption price per share ($1,470,829,982 ÷ 13,021,685 shares) | $112.95 | |
| Class Z: | ||
| Net Asset Value, offering price and redemption price per share ($524,382,961 ÷ 4,648,207 shares) | $112.81 |
(a) Redemption price per share is equal to net asset value less any applicable contingent deferred sales charge.
See accompanying notes which are an integral part of the financial statements.
Statement of Operations
| Year ended July 31, 2021 | ||
| Investment Income | ||
| Dividends | $22,750,971 | |
| Income from Fidelity Central Funds (including $61,338 from security lending) | 93,479 | |
| Total income | 22,844,450 | |
| Expenses | ||
| Management fee | $22,203,099 | |
| Transfer agent fees | 6,562,777 | |
| Distribution and service plan fees | 10,730,297 | |
| Accounting fees | 1,048,842 | |
| Custodian fees and expenses | 76,018 | |
| Independent trustees' fees and expenses | 17,413 | |
| Registration fees | 199,135 | |
| Audit | 65,394 | |
| Legal | 12,061 | |
| Interest | 1,691 | |
| Miscellaneous | 23,549 | |
| Total expenses before reductions | 40,940,276 | |
| Expense reductions | (170,605) | |
| Total expenses after reductions | 40,769,671 | |
| Net investment income (loss) | (17,925,221) | |
| Realized and Unrealized Gain (Loss) | ||
| Net realized gain (loss) on: | ||
| Investment securities: | ||
| Unaffiliated issuers | 676,792,615 | |
| Fidelity Central Funds | (6,373) | |
| Foreign currency transactions | (15,454) | |
| Total net realized gain (loss) | 676,770,788 | |
| Change in net unrealized appreciation (depreciation) on: | ||
| Investment securities: | ||
| Unaffiliated issuers (net of decrease in deferred foreign taxes of $912,152) | 874,879,886 | |
| Fidelity Central Funds | (2,761) | |
| Unfunded commitments | (127,890) | |
| Assets and liabilities in foreign currencies | 2,963 | |
| Total change in net unrealized appreciation (depreciation) | 874,752,198 | |
| Net gain (loss) | 1,551,522,986 | |
| Net increase (decrease) in net assets resulting from operations | $1,533,597,765 |
See accompanying notes which are an integral part of the financial statements.
Statement of Changes in Net Assets
| Year ended July 31, 2021 | Year ended July 31, 2020 | |
| Increase (Decrease) in Net Assets | ||
| Operations | ||
| Net investment income (loss) | $(17,925,221) | $(5,301,466) |
| Net realized gain (loss) | 676,770,788 | 215,447,351 |
| Change in net unrealized appreciation (depreciation) | 874,752,198 | 892,209,504 |
| Net increase (decrease) in net assets resulting from operations | 1,533,597,765 | 1,102,355,389 |
| Distributions to shareholders | (319,176,570) | (62,368,648) |
| Share transactions - net increase (decrease) | 184,546,176 | 286,541,904 |
| Total increase (decrease) in net assets | 1,398,967,371 | 1,326,528,645 |
| Net Assets | ||
| Beginning of period | 3,480,083,510 | 2,153,554,865 |
| End of period | $4,879,050,881 | $3,480,083,510 |
See accompanying notes which are an integral part of the financial statements.
Financial Highlights
Fidelity Advisor Technology Fund Class A
| Years ended July 31, | 2021 | 2020 | 2019 | 2018 | 2017 |
| Selected Per–Share Data | |||||
| Net asset value, beginning of period | $76.36 | $52.61 | $60.37 | $52.11 | $37.86 |
| Income from Investment Operations | |||||
| Net investment income (loss)A | (.39) | (.12) | .02 | (.13) | (.07) |
| Net realized and unrealized gain (loss) | 33.48 | 25.35 | 1.84 | 12.80 | 14.95 |
| Total from investment operations | 33.09 | 25.23 | 1.86 | 12.67 | 14.88 |
| Distributions from net investment income | – | – | – | – | – |
| Distributions from net realized gain | (7.02) | (1.48) | (9.62) | (4.41) | (.63) |
| Total distributions | (7.02) | (1.48) | (9.62) | (4.41) | (.63) |
| Redemption fees added to paid in capitalA | – | – | – | – | –B |
| Net asset value, end of period | $102.43 | $76.36 | $52.61 | $60.37 | $52.11 |
| Total ReturnC,D | 44.80% | 48.83% | 7.26% | 25.43% | 39.85% |
| Ratios to Average Net AssetsE,F | |||||
| Expenses before reductions | .98% | 1.01% | 1.03% | 1.05% | 1.07% |
| Expenses net of fee waivers, if any | .98% | 1.01% | 1.03% | 1.05% | 1.07% |
| Expenses net of all reductions | .98% | 1.01% | 1.02% | 1.04% | 1.07% |
| Net investment income (loss) | (.43)% | (.20)% | .04% | (.23)% | (.17)% |
| Supplemental Data | |||||
| Net assets, end of period (000 omitted) | $1,848,643 | $1,339,059 | $884,749 | $825,118 | $637,315 |
| Portfolio turnover rateG | 44% | 40%H | 88% | 84% | 73%H |
A Calculated based on average shares outstanding during the period.
B Amount represents less than $.005 per share.
C Total returns would have been lower if certain expenses had not been reduced during the applicable periods shown.
D Total returns do not include the effect of the sales charges.
E Fees and expenses of any underlying mutual funds or exchange-traded funds (ETFs) are not included in the Fund's expense ratio. The Fund indirectly bears its proportionate share of these expenses. For additional expense information related to investments in Fidelity Central Funds, please refer to the "Investments in Fidelity Central Funds" note found in the Notes to Financial Statements section of the most recent Annual or Semi-Annual report.
F Expense ratios reflect operating expenses of the class. Expenses before reductions do not reflect amounts reimbursed, waived, or reduced through arrangements with the investment adviser, brokerage services, or other offset arrangements, if applicable, and do not represent the amount paid by the class during periods when reimbursements, waivers or reductions occur.
G Amount does not include the portfolio activity of any underlying mutual funds or exchange-traded funds (ETFs).
H Portfolio turnover rate excludes securities received or delivered in-kind.
See accompanying notes which are an integral part of the financial statements.
Fidelity Advisor Technology Fund Class M
| Years ended July 31, | 2021 | 2020 | 2019 | 2018 | 2017 |
| Selected Per–Share Data | |||||
| Net asset value, beginning of period | $71.37 | $49.28 | $57.23 | $49.63 | $36.14 |
| Income from Investment Operations | |||||
| Net investment income (loss)A | (.57) | (.25) | (.10) | (.27) | (.18) |
| Net realized and unrealized gain (loss) | 31.22 | 23.71 | 1.63 | 12.16 | 14.26 |
| Total from investment operations | 30.65 | 23.46 | 1.53 | 11.89 | 14.08 |
| Distributions from net investment income | – | – | – | – | – |
| Distributions from net realized gain | (6.87) | (1.37) | (9.48) | (4.29) | (.59) |
| Total distributions | (6.87) | (1.37) | (9.48) | (4.29) | (.59) |
| Redemption fees added to paid in capitalA | – | – | – | – | –B |
| Net asset value, end of period | $95.15 | $71.37 | $49.28 | $57.23 | $49.63 |
| Total ReturnC,D | 44.47% | 48.44% | 7.00% | 25.09% | 39.50% |
| Ratios to Average Net AssetsE,F | |||||
| Expenses before reductions | 1.23% | 1.26% | 1.28% | 1.31% | 1.33% |
| Expenses net of fee waivers, if any | 1.23% | 1.26% | 1.28% | 1.31% | 1.33% |
| Expenses net of all reductions | 1.22% | 1.26% | 1.28% | 1.30% | 1.33% |
| Net investment income (loss) | (.68)% | (.45)% | (.22)% | (.49)% | (.43)% |
| Supplemental Data | |||||
| Net assets, end of period (000 omitted) | $624,534 | $464,093 | $321,915 | $328,709 | $274,918 |
| Portfolio turnover rateG | 44% | 40%H | 88% | 84% | 73% |
A Calculated based on average shares outstanding during the period.
B Amount represents less than $.005 per share.
C Total returns would have been lower if certain expenses had not been reduced during the applicable periods shown.
D Total returns do not include the effect of the sales charges.
E Fees and expenses of any underlying mutual funds or exchange-traded funds (ETFs) are not included in the Fund's expense ratio. The Fund indirectly bears its proportionate share of these expenses. For additional expense information related to investments in Fidelity Central Funds, please refer to the "Investments in Fidelity Central Funds" note found in the Notes to Financial Statements section of the most recent Annual or Semi-Annual report.
F Expense ratios reflect operating expenses of the class. Expenses before reductions do not reflect amounts reimbursed, waived, or reduced through arrangements with the investment adviser, brokerage services, or other offset arrangements, if applicable, and do not represent the amount paid by the class during periods when reimbursements, waivers or reductions occur.
G Amount does not include the portfolio activity of any underlying mutual funds or exchange-traded funds (ETFs).
H Portfolio turnover rate excludes securities received or delivered in-kind.
See accompanying notes which are an integral part of the financial statements.
Fidelity Advisor Technology Fund Class C
| Years ended July 31, | 2021 | 2020 | 2019 | 2018 | 2017 |
| Selected Per–Share Data | |||||
| Net asset value, beginning of period | $61.67 | $42.81 | $51.18 | $44.86 | $32.83 |
| Income from Investment Operations | |||||
| Net investment income (loss)A | (.85) | (.46) | (.30) | (.49) | (.35) |
| Net realized and unrealized gain (loss) | 26.79 | 20.52 | 1.22 | 10.95 | 12.92 |
| Total from investment operations | 25.94 | 20.06 | .92 | 10.46 | 12.57 |
| Distributions from net investment income | – | – | – | – | – |
| Distributions from net realized gain | (6.63) | (1.20) | (9.29) | (4.14) | (.54) |
| Total distributions | (6.63) | (1.20) | (9.29) | (4.14) | (.54) |
| Redemption fees added to paid in capitalA | – | – | – | – | –B |
| Net asset value, end of period | $80.98 | $61.67 | $42.81 | $51.18 | $44.86 |
| Total ReturnC,D | 43.73% | 47.69% | 6.44% | 24.48% | 38.79% |
| Ratios to Average Net AssetsE,F | |||||
| Expenses before reductions | 1.75% | 1.77% | 1.79% | 1.81% | 1.83% |
| Expenses net of fee waivers, if any | 1.74% | 1.77% | 1.79% | 1.81% | 1.83% |
| Expenses net of all reductions | 1.74% | 1.77% | 1.78% | 1.80% | 1.82% |
| Net investment income (loss) | (1.20)% | (.96)% | (.72)% | (.99)% | (.93)% |
| Supplemental Data | |||||
| Net assets, end of period (000 omitted) | $410,661 | $343,585 | $240,358 | $321,616 | $237,583 |
| Portfolio turnover rateG | 44% | 40%H | 88% | 84% | 73%H |
A Calculated based on average shares outstanding during the period.
B Amount represents less than $.005 per share.
C Total returns would have been lower if certain expenses had not been reduced during the applicable periods shown.
D Total returns do not include the effect of the contingent deferred sales charge.
E Fees and expenses of any underlying mutual funds or exchange-traded funds (ETFs) are not included in the Fund's expense ratio. The Fund indirectly bears its proportionate share of these expenses. For additional expense information related to investments in Fidelity Central Funds, please refer to the "Investments in Fidelity Central Funds" note found in the Notes to Financial Statements section of the most recent Annual or Semi-Annual report.
F Expense ratios reflect operating expenses of the class. Expenses before reductions do not reflect amounts reimbursed, waived, or reduced through arrangements with the investment adviser, brokerage services, or other offset arrangements, if applicable, and do not represent the amount paid by the class during periods when reimbursements, waivers or reductions occur.
G Amount does not include the portfolio activity of any underlying mutual funds or exchange-traded funds (ETFs).
H Portfolio turnover rate excludes securities received or delivered in-kind.
See accompanying notes which are an integral part of the financial statements.
Fidelity Advisor Technology Fund Class I
| Years ended July 31, | 2021 | 2020 | 2019 | 2018 | 2017 |
| Selected Per–Share Data | |||||
| Net asset value, beginning of period | $83.56 | $57.41 | $64.86 | $55.69 | $40.30 |
| Income from Investment Operations | |||||
| Net investment income (loss)A | (.17) | .04 | .17 | .02 | .06 |
| Net realized and unrealized gain (loss) | 36.76 | 27.72 | 2.15 | 13.71 | 15.96 |
| Total from investment operations | 36.59 | 27.76 | 2.32 | 13.73 | 16.02 |
| Distributions from net investment income | – | – | (.01) | – | – |
| Distributions from net realized gain | (7.20) | (1.61) | (9.76) | (4.56) | (.63) |
| Total distributions | (7.20) | (1.61) | (9.77) | (4.56) | (.63) |
| Redemption fees added to paid in capitalA | – | – | – | – | –B |
| Net asset value, end of period | $112.95 | $83.56 | $57.41 | $64.86 | $55.69 |
| Total ReturnC | 45.18% | 49.22% | 7.56% | 25.75% | 40.26% |
| Ratios to Average Net AssetsD,E | |||||
| Expenses before reductions | .72% | .74% | .76% | .78% | .77% |
| Expenses net of fee waivers, if any | .72% | .74% | .76% | .78% | .77% |
| Expenses net of all reductions | .72% | .74% | .76% | .77% | .77% |
| Net investment income (loss) | (.18)% | .07% | .30% | .03% | .13% |
| Supplemental Data | |||||
| Net assets, end of period (000 omitted) | $1,470,830 | $1,035,091 | $674,914 | $734,661 | $403,024 |
| Portfolio turnover rateF | 44% | 40%G | 88% | 84% | 73% |
A Calculated based on average shares outstanding during the period.
B Amount represents less than $.005 per share.
C Total returns would have been lower if certain expenses had not been reduced during the applicable periods shown.
D Fees and expenses of any underlying mutual funds or exchange-traded funds (ETFs) are not included in the Fund's expense ratio. The Fund indirectly bears its proportionate share of these expenses. For additional expense information related to investments in Fidelity Central Funds, please refer to the "Investments in Fidelity Central Funds" note found in the Notes to Financial Statements section of the most recent Annual or Semi-Annual report.
E Expense ratios reflect operating expenses of the class. Expenses before reductions do not reflect amounts reimbursed, waived, or reduced through arrangements with the investment adviser, brokerage services, or other offset arrangements, if applicable, and do not represent the amount paid by the class during periods when reimbursements, waivers or reductions occur.
F Amount does not include the portfolio activity of any underlying mutual funds or exchange-traded funds (ETFs).
G Portfolio turnover rate excludes securities received or delivered in-kind.
See accompanying notes which are an integral part of the financial statements.
Fidelity Advisor Technology Fund Class Z
| Years ended July 31, | 2021 | 2020 | 2019 A |
| Selected Per–Share Data | |||
| Net asset value, beginning of period | $83.44 | $57.34 | $67.88 |
| Income from Investment Operations | |||
| Net investment income (loss)B | (.06) | .12 | .23 |
| Net realized and unrealized gain (loss) | 36.72 | 27.68 | (.90) |
| Total from investment operations | 36.66 | 27.80 | (.67) |
| Distributions from net investment income | – | – | (.11) |
| Distributions from net realized gain | (7.29) | (1.70) | (9.76) |
| Total distributions | (7.29) | (1.70) | (9.87) |
| Redemption fees added to paid in capitalB | – | – | – |
| Net asset value, end of period | $112.81 | $83.44 | $57.34 |
| Total ReturnC,D | 45.37% | 49.39% | 2.88% |
| Ratios to Average Net AssetsE,F | |||
| Expenses before reductions | .60% | .62% | .63%G |
| Expenses net of fee waivers, if any | .60% | .62% | .63%G |
| Expenses net of all reductions | .60% | .62% | .62%G |
| Net investment income (loss) | (.06)% | .19% | .53%G |
| Supplemental Data | |||
| Net assets, end of period (000 omitted) | $524,383 | $298,255 | $31,619 |
| Portfolio turnover rateH | 44% | 40%I | 88%G |
A For the period October 2, 2018 (commencement of sale of shares) to July 31, 2019.
B Calculated based on average shares outstanding during the period.
C Total returns for periods of less than one year are not annualized.
D Total returns would have been lower if certain expenses had not been reduced during the applicable periods shown.
E Fees and expenses of any underlying mutual funds or exchange-traded funds (ETFs) are not included in the Fund's expense ratio. The Fund indirectly bears its proportionate share of these expenses. For additional expense information related to investments in Fidelity Central Funds, please refer to the "Investments in Fidelity Central Funds" note found in the Notes to Financial Statements section of the most recent Annual or Semi-Annual report.
F Expense ratios reflect operating expenses of the class. Expenses before reductions do not reflect amounts reimbursed, waived, or reduced through arrangements with the investment adviser, brokerage services, or other offset arrangements, if applicable, and do not represent the amount paid by the class during periods when reimbursements, waivers or reductions occur.
G Annualized
H Amount does not include the portfolio activity of any underlying mutual funds or exchange-traded funds (ETFs).
I Portfolio turnover rate excludes securities received or delivered in-kind.
See accompanying notes which are an integral part of the financial statements.
Fidelity Advisor® Utilities Fund
Performance: The Bottom Line
Average annual total return reflects the change in the value of an investment, assuming reinvestment of distributions from dividend income and capital gains (the profits earned upon the sale of securities that have grown in value, if any) and assuming a constant rate of performance each year. The hypothetical investment and the average annual total returns do not reflect the deduction of taxes that a shareholder would pay on fund distributions or the redemption of fund shares. During periods of reimbursement by Fidelity, a fund’s total return will be greater than it would be had the reimbursement not occurred. How a fund did yesterday is no guarantee of how it will do tomorrow.
Average Annual Total Returns
| For the periods ended July 31, 2021 | Past 1 year | Past 5 years | Past 10 years |
| Class A (incl. 5.75% sales charge) | 8.34% | 7.54% | 9.53% |
| Class M (incl. 3.50% sales charge) | 10.62% | 7.73% | 9.48% |
| Class C (incl. contingent deferred sales charge) | 13.10% | 8.00% | 9.52% |
| Class I | 15.30% | 9.12% | 10.50% |
| Class Z | 15.41% | 9.20% | 10.54% |
Class C shares' contingent deferred sales charges included in the past one year, past five years and past ten years total return figures are 1%, 0% and 0%, respectively.
The initial offering of Class Z shares took place on October 2, 2018. Returns prior to October 2, 2018, are those of Class I.
$10,000 Over 10 Years
Let's say hypothetically that $10,000 was invested in Fidelity Advisor® Utilities Fund - Class A on July 31, 2011, and the current 5.75% sales charge was paid.
The chart shows how the value of your investment would have changed, and also shows how the S&P 500® Index performed over the same period.

| Period Ending Values | ||
|
| $24,851 | Fidelity Advisor® Utilities Fund - Class A |
|
| $41,689 | S&P 500® Index |
Fidelity Advisor® Utilities Fund
Management's Discussion of Fund Performance
Market Recap: The S&P 500® index gained 36.45% for the 12 months ending July 31, 2021, as U.S. equities continued a historic rebound following a steep but brief decline due to the early-2020 outbreak and spread of COVID-19. A confluence of powerful forces propelled risk assets, returning the stock market to pre-pandemic highs by late August 2020. The rally slowed in September, when stocks began a two-month retreat amid Congress’s inability to reach a deal on additional fiscal stimulus, as well as uncertainty about the election. But as the calendar turned, investors grew hopeful. The rollout of three COVID-19 vaccines was underway, the U.S. Federal Reserve pledged to hold interest rates near zero until the economy recovered, and the federal government planned to deploy trillions of dollars to boost consumers and the economy. This backdrop fueled a sharp rotation, with small-cap value usurping leadership from large growth. As part of the “reopening” theme, investors moved out of tech-driven mega-caps that had thrived due to the work-from-home trend in favor of cheap smaller companies that stood to benefit from a broad cyclical recovery. A flattish May reflected concerns about inflation and jobs, but the uptrend resumed through July, driven by corporate earnings. Notably, this leg saw momentum shift back to large growth, as easing rates and a hawkish Fed stymied the reflation trade. By sector, financials (+55%) led, driven by banks (+63%), whereas utilities (+12%) and consumer staples (+18%) notably lagged. Comments from Portfolio Manager Douglas Simmons: For the fiscal year ending July 31, 2021, the fund's share classes (excluding sales charges, if applicable) gained about 14% to 15%, outperforming the 12.21% advance of the MSCI US IMI Utilities 25/50 Index, but underperforming the broad-based S&P 500® index. The top contributor to performance versus the sector index was an overweighting in independent power producers & energy traders. Security selection and an underweighting in multi-utilities and an overweighting in renewable electricity also bolstered the fund's relative result. The fund's biggest individual relative contributor was an overweighting in AES, which gained about 63% the past year. This company was among the fund's largest holdings this period. Also helping performance were our outsized stakes in CenterPoint Energy and FirstEnergy, each of which gained about 38%. Conversely, the biggest detractor from performance versus the sector index was an underweighting in water utilities. Stock selection in renewable electricity and an underweighting in gas utilities also hampered the fund’s relative performance. The fund's biggest individual relative detractor was an outsized stake in Evergy, which gained about 6% the past 12 months. The company was among the largest fund holdings as of July 31. Also holding back performance was our overweighting in PG&E, which returned -2%. Notable changes in positioning included reduced exposure to the independent power producers & energy traders subindustry.The views expressed above reflect those of the portfolio manager(s) only through the end of the period as stated on the cover of this report and do not necessarily represent the views of Fidelity or any other person in the Fidelity organization. Any such views are subject to change at any time based upon market or other conditions and Fidelity disclaims any responsibility to update such views. These views may not be relied on as investment advice and, because investment decisions for a Fidelity fund are based on numerous factors, may not be relied on as an indication of trading intent on behalf of any Fidelity fund.
Fidelity Advisor® Utilities Fund
Investment Summary (Unaudited)
Top Ten Stocks as of July 31, 2021
| % of fund's net assets | |
| NextEra Energy, Inc. | 13.5 |
| Exelon Corp. | 9.0 |
| Southern Co. | 8.5 |
| Sempra Energy | 6.8 |
| FirstEnergy Corp. | 5.5 |
| Evergy, Inc. | 4.9 |
| American Electric Power Co., Inc. | 4.9 |
| Public Service Enterprise Group, Inc. | 4.9 |
| CenterPoint Energy, Inc. | 4.8 |
| Dominion Energy, Inc. | 4.7 |
| 67.5 |
Top Industries (% of fund's net assets)
| As of July 31, 2021 | ||
| Electric Utilities | 64.5% | |
| Multi-Utilities | 24.7% | |
| Independent Power and Renewable Electricity Producers | 8.5% | |
| All Others* | 2.3% | |

* Includes short-term investments and net other assets (liabilities).
Fidelity Advisor® Utilities Fund
Schedule of Investments July 31, 2021
Showing Percentage of Net Assets
| Common Stocks - 97.7% | |||
| Shares | Value | ||
| Electric Utilities - 64.5% | |||
| Electric Utilities - 64.5% | |||
| American Electric Power Co., Inc. | 309,717 | $27,292,262 | |
| Duke Energy Corp. | 226,140 | 23,769,575 | |
| Edison International | 450,390 | 24,546,255 | |
| Entergy Corp. | 139,100 | 14,316,172 | |
| Evergy, Inc. | 423,724 | 27,635,279 | |
| Exelon Corp. | 1,080,672 | 50,575,450 | |
| FirstEnergy Corp. | 802,116 | 30,737,085 | |
| NextEra Energy, Inc. | 969,348 | 75,512,208 | |
| NRG Energy, Inc. (a) | 285,115 | 11,758,143 | |
| OGE Energy Corp. | 179,100 | 6,044,625 | |
| PG&E Corp. (b) | 2,445,289 | 21,494,090 | |
| Southern Co. | 747,087 | 47,716,447 | |
| 361,397,591 | |||
| Independent Power and Renewable Electricity Producers - 8.5% | |||
| Independent Power Producers & Energy Traders - 6.2% | |||
| Clearway Energy, Inc.: | |||
| Class A | 66,926 | 1,803,656 | |
| Class C | 42,898 | 1,230,315 | |
| The AES Corp. | 1,047,320 | 24,821,484 | |
| Vistra Corp. | 363,027 | 6,951,967 | |
| 34,807,422 | |||
| Renewable Electricity - 2.3% | |||
| NextEra Energy Partners LP (a) | 118,717 | 9,204,129 | |
| Sunnova Energy International, Inc. (b) | 95,295 | 3,630,740 | |
| 12,834,869 | |||
| TOTAL INDEPENDENT POWER AND RENEWABLE ELECTRICITY PRODUCERS | 47,642,291 | ||
| Multi-Utilities - 24.7% | |||
| Multi-Utilities - 24.7% | |||
| CenterPoint Energy, Inc. | 1,055,769 | 26,879,879 | |
| Dominion Energy, Inc. | 355,376 | 26,607,001 | |
| NiSource, Inc. | 782,452 | 19,381,336 | |
| Public Service Enterprise Group, Inc. | 438,405 | 27,281,943 | |
| Sempra Energy | 289,500 | 37,823,175 | |
| 137,973,334 | |||
| TOTAL COMMON STOCKS | |||
| (Cost $430,150,353) | 547,013,216 | ||
| Money Market Funds - 5.5% | |||
| Fidelity Cash Central Fund 0.06% (c) | 9,594,660 | 9,596,579 | |
| Fidelity Securities Lending Cash Central Fund 0.06% (c)(d) | 21,563,169 | 21,565,325 | |
| TOTAL MONEY MARKET FUNDS | |||
| (Cost $31,161,904) | 31,161,904 | ||
| TOTAL INVESTMENT IN SECURITIES - 103.2% | |||
| (Cost $461,312,257) | 578,175,120 | ||
| NET OTHER ASSETS (LIABILITIES) - (3.2)% | (18,081,456) | ||
| NET ASSETS - 100% | $560,093,664 |
Legend
(a) Security or a portion of the security is on loan at period end.
(b) Non-income producing
(c) Affiliated fund that is generally available only to investment companies and other accounts managed by Fidelity Investments. The rate quoted is the annualized seven-day yield of the fund at period end. A complete unaudited listing of the fund's holdings as of its most recent quarter end is available upon request. In addition, each Fidelity Central Fund's financial statements, which are not covered by the Fund's Report of Independent Registered Public Accounting Firm, are available on the SEC's website or upon request.
(d) Investment made with cash collateral received from securities on loan.
Affiliated Central Funds
Information regarding fiscal year to date income earned by the Fund from investments in Fidelity Central Funds is as follows:
| Fund | Income earned |
| Fidelity Cash Central Fund | $2,638 |
| Fidelity Securities Lending Cash Central Fund | 3,274 |
| Total | $5,912 |
Amounts in the income column in the above table include any capital gain distributions from underlying funds, which are presented in the corresponding line-item in the Statement of Operations, if applicable. Amount for Fidelity Securities Lending Cash Central Fund represents the income earned on investing cash collateral, less rebates paid to borrowers and any lending agent fees associated with the loan, plus any premium payments received for lending certain types of securities.
Fiscal year to date information regarding the Fund's investments in Fidelity Central Funds, including the ownership percentage, is presented below.
| Fund | Value, beginning of period | Purchases | Sales Proceeds | Realized Gain/Loss | Change in Unrealized appreciation (depreciation) | Value, end of period | % ownership, end of period |
| Fidelity Cash Central Fund 0.06% | $10,855,679 | $116,966,038 | $118,225,176 | $428 | $(390) | $9,596,579 | 0.0% |
| Fidelity Securities Lending Cash Central Fund 0.06% | 781,275 | 90,302,627 | 69,518,577 | -- | -- | 21,565,325 | 0.1% |
| Total | $11,636,954 | $207,268,665 | $187,743,753 | $428 | $(390) | $31,161,904 |
Investment Valuation
The following is a summary of the inputs used, as of July 31, 2021, involving the Fund's assets and liabilities carried at fair value. The inputs or methodology used for valuing securities may not be an indication of the risk associated with investing in those securities. For more information on valuation inputs, and their aggregation into the levels used below, please refer to the Investment Valuation section in the accompanying Notes to Financial Statements.
| Valuation Inputs at Reporting Date: | ||||
| Description | Total | Level 1 | Level 2 | Level 3 |
| Investments in Securities: | ||||
| Common Stocks | $547,013,216 | $547,013,216 | $-- | $-- |
| Money Market Funds | 31,161,904 | 31,161,904 | -- | -- |
| Total Investments in Securities: | $578,175,120 | $578,175,120 | $-- | $-- |
See accompanying notes which are an integral part of the financial statements.
Fidelity Advisor® Utilities Fund
Financial Statements
Statement of Assets and Liabilities
| July 31, 2021 | ||
| Assets | ||
| Investment in securities, at value (including securities loaned of $20,960,335) — See accompanying schedule: Unaffiliated issuers (cost $430,150,353) | $547,013,216 | |
| Fidelity Central Funds (cost $31,161,904) | 31,161,904 | |
| Total Investment in Securities (cost $461,312,257) | $578,175,120 | |
| Receivable for investments sold | 3,092,367 | |
| Receivable for fund shares sold | 472,033 | |
| Dividends receivable | 956,414 | |
| Distributions receivable from Fidelity Central Funds | 765 | |
| Prepaid expenses | 1,601 | |
| Other receivables | 19,726 | |
| Total assets | 582,718,026 | |
| Liabilities | ||
| Payable for fund shares redeemed | $555,761 | |
| Accrued management fee | 244,217 | |
| Distribution and service plan fees payable | 118,922 | |
| Other affiliated payables | 101,015 | |
| Other payables and accrued expenses | 39,122 | |
| Collateral on securities loaned | 21,565,325 | |
| Total liabilities | 22,624,362 | |
| Net Assets | $560,093,664 | |
| Net Assets consist of: | ||
| Paid in capital | $436,481,298 | |
| Total accumulated earnings (loss) | 123,612,366 | |
| Net Assets | $560,093,664 | |
| Net Asset Value and Maximum Offering Price | ||
| Class A: | ||
| Net Asset Value and redemption price per share ($254,388,173 ÷ 7,366,297 shares)(a) | $34.53 | |
| Maximum offering price per share (100/94.25 of $34.53) | $36.64 | |
| Class M: | ||
| Net Asset Value and redemption price per share ($58,065,285 ÷ 1,679,473 shares)(a) | $34.57 | |
| Maximum offering price per share (100/96.50 of $34.57) | $35.82 | |
| Class C: | ||
| Net Asset Value and offering price per share ($49,312,167 ÷ 1,467,772 shares)(a) | $33.60 | |
| Class I: | ||
| Net Asset Value, offering price and redemption price per share ($143,581,954 ÷ 4,057,533 shares) | $35.39 | |
| Class Z: | ||
| Net Asset Value, offering price and redemption price per share ($54,746,085 ÷ 1,547,286 shares) | $35.38 |
(a) Redemption price per share is equal to net asset value less any applicable contingent deferred sales charge.
See accompanying notes which are an integral part of the financial statements.
Statement of Operations
| Year ended July 31, 2021 | ||
| Investment Income | ||
| Dividends | $15,706,623 | |
| Income from Fidelity Central Funds (including $3,274 from security lending) | 5,912 | |
| Total income | 15,712,535 | |
| Expenses | ||
| Management fee | $3,034,909 | |
| Transfer agent fees | 1,041,895 | |
| Distribution and service plan fees | 1,485,532 | |
| Accounting fees | 215,302 | |
| Custodian fees and expenses | 7,527 | |
| Independent trustees' fees and expenses | 2,562 | |
| Registration fees | 86,304 | |
| Audit | 49,284 | |
| Legal | 29,147 | |
| Interest | 391 | |
| Miscellaneous | 3,731 | |
| Total expenses before reductions | 5,956,584 | |
| Expense reductions | (61,605) | |
| Total expenses after reductions | 5,894,979 | |
| Net investment income (loss) | 9,817,556 | |
| Realized and Unrealized Gain (Loss) | ||
| Net realized gain (loss) on: | ||
| Investment securities: | ||
| Unaffiliated issuers | 25,295,580 | |
| Fidelity Central Funds | 428 | |
| Total net realized gain (loss) | 25,296,008 | |
| Change in net unrealized appreciation (depreciation) on: | ||
| Investment securities: | ||
| Unaffiliated issuers | 44,044,251 | |
| Fidelity Central Funds | (390) | |
| Assets and liabilities in foreign currencies | 62 | |
| Total change in net unrealized appreciation (depreciation) | 44,043,923 | |
| Net gain (loss) | 69,339,931 | |
| Net increase (decrease) in net assets resulting from operations | $79,157,487 |
See accompanying notes which are an integral part of the financial statements.
Statement of Changes in Net Assets
| Year ended July 31, 2021 | Year ended July 31, 2020 | |
| Increase (Decrease) in Net Assets | ||
| Operations | ||
| Net investment income (loss) | $9,817,556 | $13,100,736 |
| Net realized gain (loss) | 25,296,008 | (12,378,282) |
| Change in net unrealized appreciation (depreciation) | 44,043,923 | (24,427,855) |
| Net increase (decrease) in net assets resulting from operations | 79,157,487 | (23,705,401) |
| Distributions to shareholders | (12,048,409) | (13,931,390) |
| Share transactions - net increase (decrease) | (118,271,345) | 5,532,255 |
| Total increase (decrease) in net assets | (51,162,267) | (32,104,536) |
| Net Assets | ||
| Beginning of period | 611,255,931 | 643,360,467 |
| End of period | $560,093,664 | $611,255,931 |
See accompanying notes which are an integral part of the financial statements.
Financial Highlights
Fidelity Advisor Utilities Fund Class A
| Years ended July 31, | 2021 | 2020 | 2019 | 2018 | 2017 |
| Selected Per–Share Data | |||||
| Net asset value, beginning of period | $30.67 | $31.73 | $31.54 | $29.74 | $27.59 |
| Income from Investment Operations | |||||
| Net investment income (loss)A | .56 | .60 | .67 | .49 | .50 |
| Net realized and unrealized gain (loss) | 3.98 | (1.03) | 2.81 | 2.38 | 2.14 |
| Total from investment operations | 4.54 | (.43) | 3.48 | 2.87 | 2.64 |
| Distributions from net investment income | (.68) | (.62) | (.48) | (.49) | (.49) |
| Distributions from net realized gain | – | –B | (2.81) | (.58) | – |
| Total distributions | (.68) | (.63)C | (3.29) | (1.07) | (.49) |
| Redemption fees added to paid in capitalA | – | – | – | – | –B |
| Net asset value, end of period | $34.53 | $30.67 | $31.73 | $31.54 | $29.74 |
| Total ReturnD,E | 14.95% | (1.56)% | 11.73% | 9.84% | 9.87% |
| Ratios to Average Net AssetsF,G | |||||
| Expenses before reductions | 1.05% | 1.06% | 1.08% | 1.12% | 1.12% |
| Expenses net of fee waivers, if any | 1.04% | 1.06% | 1.07% | 1.11% | 1.12% |
| Expenses net of all reductions | 1.03% | 1.05% | 1.06% | 1.09% | 1.11% |
| Net investment income (loss) | 1.70% | 1.88% | 2.14% | 1.66% | 1.87% |
| Supplemental Data | |||||
| Net assets, end of period (000 omitted) | $254,388 | $249,158 | $268,246 | $173,999 | $160,040 |
| Portfolio turnover rateH | 45% | 80%I | 56% | 106% | 37% |
A Calculated based on average shares outstanding during the period.
B Amount represents less than $.005 per share.
C Total distributions per share do not sum due to rounding.
D Total returns would have been lower if certain expenses had not been reduced during the applicable periods shown.
E Total returns do not include the effect of the sales charges.
F Fees and expenses of any underlying mutual funds or exchange-traded funds (ETFs) are not included in the Fund's expense ratio. The Fund indirectly bears its proportionate share of these expenses. For additional expense information related to investments in Fidelity Central Funds, please refer to the "Investments in Fidelity Central Funds" note found in the Notes to Financial Statements section of the most recent Annual or Semi-Annual report.
G Expense ratios reflect operating expenses of the class. Expenses before reductions do not reflect amounts reimbursed, waived, or reduced through arrangements with the investment adviser, brokerage services, or other offset arrangements, if applicable, and do not represent the amount paid by the class during periods when reimbursements, waivers or reductions occur.
H Amount does not include the portfolio activity of any underlying mutual funds or exchange-traded funds (ETFs).
I Portfolio turnover rate excludes securities received or delivered in-kind.
See accompanying notes which are an integral part of the financial statements.
Fidelity Advisor Utilities Fund Class M
| Years ended July 31, | 2021 | 2020 | 2019 | 2018 | 2017 |
| Selected Per–Share Data | |||||
| Net asset value, beginning of period | $30.71 | $31.77 | $31.58 | $29.77 | $27.62 |
| Income from Investment Operations | |||||
| Net investment income (loss)A | .47 | .51 | .58 | .41 | .42 |
| Net realized and unrealized gain (loss) | 3.99 | (1.03) | 2.81 | 2.38 | 2.14 |
| Total from investment operations | 4.46 | (.52) | 3.39 | 2.79 | 2.56 |
| Distributions from net investment income | (.60) | (.53) | (.39) | (.40) | (.41) |
| Distributions from net realized gain | – | –B | (2.81) | (.58) | – |
| Total distributions | (.60) | (.54)C | (3.20) | (.98) | (.41) |
| Redemption fees added to paid in capitalA | – | – | – | – | –B |
| Net asset value, end of period | $34.57 | $30.71 | $31.77 | $31.58 | $29.77 |
| Total ReturnD,E | 14.63% | (1.82)% | 11.38% | 9.53% | 9.51% |
| Ratios to Average Net AssetsF,G | |||||
| Expenses before reductions | 1.32% | 1.33% | 1.36% | 1.41% | 1.41% |
| Expenses net of fee waivers, if any | 1.32% | 1.33% | 1.36% | 1.41% | 1.41% |
| Expenses net of all reductions | 1.31% | 1.33% | 1.35% | 1.39% | 1.41% |
| Net investment income (loss) | 1.42% | 1.60% | 1.86% | 1.36% | 1.57% |
| Supplemental Data | |||||
| Net assets, end of period (000 omitted) | $58,065 | $58,773 | $61,741 | $46,669 | $48,152 |
| Portfolio turnover rateH | 45% | 80%I | 56% | 106% | 37% |
A Calculated based on average shares outstanding during the period.
B Amount represents less than $.005 per share.
C Total distributions per share do not sum due to rounding.
D Total returns would have been lower if certain expenses had not been reduced during the applicable periods shown.
E Total returns do not include the effect of the sales charges.
F Fees and expenses of any underlying mutual funds or exchange-traded funds (ETFs) are not included in the Fund's expense ratio. The Fund indirectly bears its proportionate share of these expenses. For additional expense information related to investments in Fidelity Central Funds, please refer to the "Investments in Fidelity Central Funds" note found in the Notes to Financial Statements section of the most recent Annual or Semi-Annual report.
G Expense ratios reflect operating expenses of the class. Expenses before reductions do not reflect amounts reimbursed, waived, or reduced through arrangements with the investment adviser, brokerage services, or other offset arrangements, if applicable, and do not represent the amount paid by the class during periods when reimbursements, waivers or reductions occur.
H Amount does not include the portfolio activity of any underlying mutual funds or exchange-traded funds (ETFs).
I Portfolio turnover rate excludes securities received or delivered in-kind.
See accompanying notes which are an integral part of the financial statements.
Fidelity Advisor Utilities Fund Class C
| Years ended July 31, | 2021 | 2020 | 2019 | 2018 | 2017 |
| Selected Per–Share Data | |||||
| Net asset value, beginning of period | $29.83 | $30.90 | $30.81 | $29.07 | $26.98 |
| Income from Investment Operations | |||||
| Net investment income (loss)A | .30 | .35 | .42 | .26 | .29 |
| Net realized and unrealized gain (loss) | 3.88 | (1.01) | 2.74 | 2.33 | 2.09 |
| Total from investment operations | 4.18 | (.66) | 3.16 | 2.59 | 2.38 |
| Distributions from net investment income | (.41) | (.40) | (.26) | (.27) | (.29) |
| Distributions from net realized gain | – | –B | (2.81) | (.58) | – |
| Total distributions | (.41) | (.41)C | (3.07) | (.85) | (.29) |
| Redemption fees added to paid in capitalA | – | – | – | – | –B |
| Net asset value, end of period | $33.60 | $29.83 | $30.90 | $30.81 | $29.07 |
| Total ReturnD,E | 14.10% | (2.28)% | 10.87% | 9.04% | 9.01% |
| Ratios to Average Net AssetsF,G | |||||
| Expenses before reductions | 1.80% | 1.81% | 1.83% | 1.87% | 1.87% |
| Expenses net of fee waivers, if any | 1.80% | 1.81% | 1.83% | 1.87% | 1.87% |
| Expenses net of all reductions | 1.79% | 1.80% | 1.82% | 1.85% | 1.86% |
| Net investment income (loss) | .94% | 1.12% | 1.39% | .90% | 1.11% |
| Supplemental Data | |||||
| Net assets, end of period (000 omitted) | $49,312 | $63,458 | $66,525 | $53,099 | $56,964 |
| Portfolio turnover rateH | 45% | 80%I | 56% | 106% | 37% |
A Calculated based on average shares outstanding during the period.
B Amount represents less than $.005 per share.
C Total distributions per share do not sum due to rounding.
D Total returns would have been lower if certain expenses had not been reduced during the applicable periods shown.
E Total returns do not include the effect of the contingent deferred sales charge.
F Fees and expenses of any underlying mutual funds or exchange-traded funds (ETFs) are not included in the Fund's expense ratio. The Fund indirectly bears its proportionate share of these expenses. For additional expense information related to investments in Fidelity Central Funds, please refer to the "Investments in Fidelity Central Funds" note found in the Notes to Financial Statements section of the most recent Annual or Semi-Annual report.
G Expense ratios reflect operating expenses of the class. Expenses before reductions do not reflect amounts reimbursed, waived, or reduced through arrangements with the investment adviser, brokerage services, or other offset arrangements, if applicable, and do not represent the amount paid by the class during periods when reimbursements, waivers or reductions occur.
H Amount does not include the portfolio activity of any underlying mutual funds or exchange-traded funds (ETFs).
I Portfolio turnover rate excludes securities received or delivered in-kind.
See accompanying notes which are an integral part of the financial statements.
Fidelity Advisor Utilities Fund Class I
| Years ended July 31, | 2021 | 2020 | 2019 | 2018 | 2017 |
| Selected Per–Share Data | |||||
| Net asset value, beginning of period | $31.40 | $32.47 | $32.21 | $30.35 | $28.14 |
| Income from Investment Operations | |||||
| Net investment income (loss)A | .66 | .71 | .76 | .59 | .59 |
| Net realized and unrealized gain (loss) | 4.10 | (1.07) | 2.88 | 2.43 | 2.17 |
| Total from investment operations | 4.76 | (.36) | 3.64 | 3.02 | 2.76 |
| Distributions from net investment income | (.77) | (.71) | (.58) | (.58) | (.55) |
| Distributions from net realized gain | – | –B | (2.81) | (.58) | – |
| Total distributions | (.77) | (.71) | (3.38)C | (1.16) | (.55) |
| Redemption fees added to paid in capitalA | – | – | – | – | –B |
| Net asset value, end of period | $35.39 | $31.40 | $32.47 | $32.21 | $30.35 |
| Total ReturnD | 15.30% | (1.30)% | 12.04% | 10.14% | 10.17% |
| Ratios to Average Net AssetsE,F | |||||
| Expenses before reductions | .77% | .79% | .81% | .84% | .85% |
| Expenses net of fee waivers, if any | .77% | .78% | .80% | .84% | .85% |
| Expenses net of all reductions | .76% | .78% | .79% | .82% | .84% |
| Net investment income (loss) | 1.97% | 2.15% | 2.41% | 1.93% | 2.14% |
| Supplemental Data | |||||
| Net assets, end of period (000 omitted) | $143,582 | $187,833 | $229,777 | $55,462 | $46,943 |
| Portfolio turnover rateG | 45% | 80%H | 56% | 106% | 37% |
A Calculated based on average shares outstanding during the period.
B Amount represents less than $.005 per share.
C Total distributions per share do not sum due to rounding.
D Total returns would have been lower if certain expenses had not been reduced during the applicable periods shown.
E Fees and expenses of any underlying mutual funds or exchange-traded funds (ETFs) are not included in the Fund's expense ratio. The Fund indirectly bears its proportionate share of these expenses. For additional expense information related to investments in Fidelity Central Funds, please refer to the "Investments in Fidelity Central Funds" note found in the Notes to Financial Statements section of the most recent Annual or Semi-Annual report.
F Expense ratios reflect operating expenses of the class. Expenses before reductions do not reflect amounts reimbursed, waived, or reduced through arrangements with the investment adviser, brokerage services, or other offset arrangements, if applicable, and do not represent the amount paid by the class during periods when reimbursements, waivers or reductions occur.
G Amount does not include the portfolio activity of any underlying mutual funds or exchange-traded funds (ETFs).
H Portfolio turnover rate excludes securities received or delivered in-kind.
See accompanying notes which are an integral part of the financial statements.
Fidelity Advisor Utilities Fund Class Z
| Years ended July 31, | 2021 | 2020 | 2019 A |
| Selected Per–Share Data | |||
| Net asset value, beginning of period | $31.42 | $32.48 | $33.14 |
| Income from Investment Operations | |||
| Net investment income (loss)B | .71 | .74 | .63 |
| Net realized and unrealized gain (loss) | 4.08 | (1.04) | 2.13 |
| Total from investment operations | 4.79 | (.30) | 2.76 |
| Distributions from net investment income | (.83) | (.75) | (.61) |
| Distributions from net realized gain | – | –C | (2.81) |
| Total distributions | (.83) | (.76)D | (3.42) |
| Redemption fees added to paid in capitalB | – | – | – |
| Net asset value, end of period | $35.38 | $31.42 | $32.48 |
| Total ReturnE,F | 15.41% | (1.15)% | 9.04% |
| Ratios to Average Net AssetsG,H | |||
| Expenses before reductions | .64% | .65% | .66%I |
| Expenses net of fee waivers, if any | .64% | .65% | .66%I |
| Expenses net of all reductions | .63% | .64% | .64%I |
| Net investment income (loss) | 2.10% | 2.29% | 2.41%I |
| Supplemental Data | |||
| Net assets, end of period (000 omitted) | $54,746 | $52,034 | $17,071 |
| Portfolio turnover rateJ | 45% | 80%K | 56%I |
A For the period October 2, 2018 (commencement of sale of shares) to July 31, 2019.
B Calculated based on average shares outstanding during the period.
C Amount represents less than $.005 per share.
D Total distributions per share do not sum due to rounding.
E Total returns for periods of less than one year are not annualized.
F Total returns would have been lower if certain expenses had not been reduced during the applicable periods shown.
G Fees and expenses of any underlying mutual funds or exchange-traded funds (ETFs) are not included in the Fund's expense ratio. The Fund indirectly bears its proportionate share of these expenses. For additional expense information related to investments in Fidelity Central Funds, please refer to the "Investments in Fidelity Central Funds" note found in the Notes to Financial Statements section of the most recent Annual or Semi-Annual report.
H Expense ratios reflect operating expenses of the class. Expenses before reductions do not reflect amounts reimbursed, waived, or reduced through arrangements with the investment adviser, brokerage services, or other offset arrangements, if applicable, and do not represent the amount paid by the class during periods when reimbursements, waivers or reductions occur.
I Annualized
J Amount does not include the portfolio activity of any underlying mutual funds or exchange-traded funds (ETFs).
K Portfolio turnover rate excludes securities received or delivered in-kind.
See accompanying notes which are an integral part of the financial statements.
Notes to Financial Statements
For the period ended July 31, 2021
1. Organization.
Fidelity Advisor Biotechnology Fund, Fidelity Advisor Communications Equipment Fund, Fidelity Advisor Consumer Discretionary Fund, Fidelity Advisor Energy Fund, Fidelity Advisor Financial Services Fund, Fidelity Advisor Health Care Fund, Fidelity Advisor Industrials Fund, Fidelity Advisor Semiconductors Fund, Fidelity Advisor Technology Fund and Fidelity Advisor Utilities Fund (the Funds) are funds of Fidelity Advisor Series VII (the Trust) and are authorized to issue an unlimited number of shares. The Trust is registered under the Investment Company Act of 1940, as amended (the 1940 Act), as an open-end management investment company organized as a Massachusetts business trust. The Funds are non-diversified with the exception of Fidelity Advisor Financial Services Fund and Fidelity Advisor Health Care Fund. Each class has exclusive voting rights with respect to matters that affect that class. Effective June 21, 2021, Class C shares will automatically convert to Class A shares after a holding period of eight years from the initial date of purchase, with certain exceptions. Prior to June 21, 2021, Class C shares automatically converted to Class A shares after a holding period of ten years from the initial date of purchase, with certain exceptions.
Effective July 2, 2021, Fidelity Advisor Communications Equipment Fund was closed to new accounts.
2. Investments in Fidelity Central Funds.
Funds may invest in Fidelity Central Funds, which are open-end investment companies generally available only to other investment companies and accounts managed by the investment adviser and its affiliates. The Schedule of Investments lists any Fidelity Central Funds held as an investment as of period end, but does not include the underlying holdings of each Fidelity Central Fund. An investing fund indirectly bears its proportionate share of the expenses of the underlying Fidelity Central Funds.
Based on its investment objective, each Fidelity Central Fund may invest or participate in various investment vehicles or strategies that are similar to those of the investing fund. These strategies are consistent with the investment objectives of the investing fund and may involve certain economic risks which may cause a decline in value of each of the Fidelity Central Funds and thus a decline in the value of the investing fund.
| Fidelity Central Fund | Investment Manager | Investment Objective | Investment Practices | Expense Ratio(a) |
| Fidelity Money Market Central Funds | Fidelity Management & Research Company LLC (FMR) | Each fund seeks to obtain a high level of current income consistent with the preservation of capital and liquidity. | Short-term Investments | Less than .005% to .01% |
(a) Expenses expressed as a percentage of average net assets and are as of each underlying Central Fund's most recent annual or semi-annual shareholder report.
A complete unaudited list of holdings for each Fidelity Central Fund is available upon request or at the Securities and Exchange Commission website at www.sec.gov. In addition, the financial statements of the Fidelity Central Funds which contain the significant accounting policies (including investment valuation policies) of those funds, and are not covered by the Report of Independent Registered Public Accounting Firm, are available on the Securities and Exchange Commission website or upon request.
3. Significant Accounting Policies.
Each Fund is an investment company and applies the accounting and reporting guidance of the Financial Accounting Standards Board (FASB) Accounting Standards Codification Topic 946 Financial Services - Investment Companies. The financial statements have been prepared in conformity with accounting principles generally accepted in the United States of America (GAAP), which require management to make certain estimates and assumptions at the date of the financial statements. Actual results could differ from those estimates. Subsequent events, if any, through the date that the financial statements were issued have been evaluated in the preparation of the financial statements. Each Fund's Schedule of Investments lists any underlying mutual funds or exchange-traded funds (ETFs) but does not include the underlying holdings of these funds. The following summarizes the significant accounting policies of each Fund:
Investment Valuation. Investments are valued as of 4:00 p.m. Eastern time on the last calendar day of the period. The Board of Trustees (the Board) has delegated the day to day responsibility for the valuation of each Fund's investments to the Fair Value Committee (the Committee) established by each Fund's investment adviser. In accordance with valuation policies and procedures approved by the Board, each Fund attempts to obtain prices from one or more third party pricing vendors or brokers to value its investments. When current market prices, quotations or currency exchange rates are not readily available or reliable, investments will be fair valued in good faith by the Committee, in accordance with procedures adopted by the Board. Factors used in determining fair value vary by investment type and may include market or investment specific events, changes in interest rates and credit quality. The frequency with which these procedures are used cannot be predicted and they may be utilized to a significant extent. The Committee oversees each Fund's valuation policies and procedures and reports to the Board on the Committee's activities and fair value determinations. The Board monitors the appropriateness of the procedures used in valuing each Fund's investments and ratifies the fair value determinations of the Committee.
Each Fund categorizes the inputs to valuation techniques used to value its investments into a disclosure hierarchy consisting of three levels as shown below:
- Level 1 – quoted prices in active markets for identical investments
- Level 2 – other significant observable inputs (including quoted prices for similar investments, interest rates, prepayment speeds, etc.)
- Level 3 – unobservable inputs (including the Fund's own assumptions based on the best information available)
Valuation techniques used to value each Fund's investments by major category are as follows:
Equity securities, including restricted securities, for which market quotations are readily available, are valued at the last reported sale price or official closing price as reported by a third party pricing vendor on the primary market or exchange on which they are traded and are categorized as Level 1 in the hierarchy. In the event there were no sales during the day or closing prices are not available, securities are valued at the last quoted bid price or may be valued using the last available price and are generally categorized as Level 2 in the hierarchy. For foreign equity securities, when market or security specific events arise, comparisons to the valuation of American Depositary Receipts (ADRs), futures contracts, Exchange-Traded Funds (ETFs) and certain indexes as well as quoted prices for similar securities may be used and would be categorized as Level 2 in the hierarchy. For equity securities, including restricted securities, where observable inputs are limited, assumptions about market activity and risk are used and these securities may be categorized as Level 3 in the hierarchy. Securities, including private placements or other restricted securities, for which observable inputs are not available are valued using alternate valuation approaches, including the market approach, the income approach and cost approach, and are categorized as Level 3 in the hierarchy. The market approach considers factors including the price of recent investments in the same or a similar security or financial metrics of comparable securities. The income approach considers factors including expected future cash flows, security specific risks and corresponding discount rates. The cost approach considers factors including the value of the security's underlying assets and liabilities.
Debt securities, including restricted securities, are valued based on evaluated prices received from third party pricing vendors or from brokers who make markets in such securities. Corporate bonds are valued by pricing vendors who utilize matrix pricing which considers yield or price of bonds of comparable quality, coupon, maturity and type or by broker-supplied prices. When independent prices are unavailable or unreliable, debt securities may be valued utilizing pricing methodologies which consider similar factors that would be used by third party pricing vendors. Debt securities are generally categorized as Level 2 in the hierarchy but may be Level 3 depending on the circumstances.
Investments in open-end mutual funds, including the Fidelity Central Funds, are valued at their closing net asset value (NAV) each business day and are categorized as Level 1 in the hierarchy.
The following provides information on Level 3 securities held by the Fund that were valued at period end based on unobservable inputs. These amounts exclude valuations provided by a broker.
Fidelity Advisor Biotechnology Fund:
| Asset Type | Fair Value | Valuation Technique(s) | Unobservable Input | Amount or Range/Weighted Average | Impact to Valuation from an Increase in Input(a) |
| Equities | $49,713,190 | Recovery Value | Recovery value | 0.0% | Increase |
| Market approach | Transaction price | $1.35 - $8.90 / $5.17 | Increase | ||
| Discounted cash flow | Discount rate | 8.0% - 10.0% / 9.3% | Decrease | ||
| Discount for lack of marketability | 10.0% | Decrease |
(a) Represents the directional change in the fair value of the Level 3 investments that could have resulted from an increase in the corresponding input as of period end. A decrease to the unobservable input would have had the opposite effect. Significant changes in these inputs may have resulted in a significantly higher or lower fair value measurement at period end.
Fidelity Advisor Technology Fund:
| Asset Type | Fair Value | Valuation Technique(s) | Unobservable Input | Amount or Range/Weighted Average | Impact to Valuation from an Increase in Input(a) |
| Equities | $62,020,658 | Market comparable | Enterprise value/Sales multiple (EVS) | 2.3 – 2.6 / 2.5 | Increase |
| Discount rate | 32.5% - 57.1% / 50.6% | Decrease | |||
| Price/Earnings multiple (P/E) | 9.2 | Increase | |||
| Discount for lack of marketability | 75.0% | Decrease | |||
| Recovery value | Recovery value | 0.0% | Increase | ||
| Market approach | Transaction price | $1.11 - $388.49 / $131.19 | Increase | ||
| Discount rate | 75.0% | Decrease | |||
| Preferred Securities | $4,405,056 | Market approach | Transaction price | $100.0 | Increase |
(a) Represents the directional change in the fair value of the Level 3 investments that could have resulted from an increase in the corresponding input as of period end. A decrease to the unobservable input would have had the opposite effect. Significant changes in these inputs may have resulted in a significantly higher or lower fair value measurement at period end.
Changes in valuation techniques may result in transfers in or out of an assigned level within the disclosure hierarchy. The aggregate value of investments by input level as of July 31, 2021, as well as a roll forward of Level 3 investments, is included at the end of each Fund's Schedule of Investments.
Foreign Currency. Certain Funds may use foreign currency contracts to facilitate transactions in foreign-denominated securities. Gains and losses from these transactions may arise from changes in the value of the foreign currency or if the counterparties do not perform under the contracts' terms.
Foreign-denominated assets, including investment securities, and liabilities are translated into U.S. dollars at the exchange rates at period end. Purchases and sales of investment securities, income and dividends received, and expenses denominated in foreign currencies are translated into U.S. dollars at the exchange rate in effect on the transaction date.
The effects of exchange rate fluctuations on investments are included with the net realized and unrealized gain (loss) on investment securities. Other foreign currency transactions resulting in realized and unrealized gain (loss) are disclosed separately.
Investment Transactions and Income. For financial reporting purposes, the Funds' investment holdings and NAV include trades executed through the end of the last business day of the period. The NAV per share for processing shareholder transactions is calculated as of the close of business of the New York Stock Exchange (NYSE), normally 4:00 p.m. Eastern time and includes trades executed through the end of the prior business day. Gains and losses on securities sold are determined on the basis of identified cost and for certain Funds include proceeds received from litigation. Dividend income is recorded on the ex-dividend date, except for certain dividends from foreign securities where the ex-dividend date may have passed, which are recorded as soon as the Funds are informed of the ex-dividend date. Non-cash dividends included in dividend income, if any, are recorded at the fair market value of the securities received. Income and capital gain distributions from Fidelity Central Funds, if any, are recorded on the ex-dividend date. Certain distributions received by the Funds represent a return of capital or capital gain. The Funds determine the components of these distributions subsequent to the ex-dividend date, based upon receipt of tax filings or other correspondence relating to the underlying investment. These distributions are recorded as a reduction of cost of investments and/or as a realized gain. Interest income is accrued as earned and includes coupon interest and amortization of premium and accretion of discount on debt securities as applicable. Large, non-recurring dividends recognized by the Funds are presented separately on the Statement of Operations in "Non-cash dividends" and the impact of these dividends is presented in the Financial Highlights. Investment income is recorded net of foreign taxes withheld where recovery of such taxes is uncertain.
Class Allocations and Expenses. Investment income, realized and unrealized capital gains and losses, common expenses of a fund, and certain fund-level expense reductions, if any, are allocated daily on a pro-rata basis to each class based on the relative net assets of each class to the total net assets of a fund. Each class differs with respect to transfer agent and distribution and service plan fees incurred, as applicable. Certain expense reductions may also differ by class, if applicable. For the reporting period, the allocated portion of income and expenses to each class as a percent of its average net assets may vary due to the timing of recording these transactions in relation to fluctuating net assets of the classes. Expenses directly attributable to a fund are charged to that fund. Expenses attributable to more than one fund are allocated among the respective funds on the basis of relative net assets or other appropriate methods. Expenses included in the accompanying financial statements reflect the expenses of that fund and do not include any expenses associated with any underlying mutual funds or exchange-traded funds. Although not included in a fund's expenses, a fund indirectly bears its proportionate share of these expenses through the net asset value of each underlying mutual fund or exchange-traded fund. Expense estimates are accrued in the period to which they relate and adjustments are made when actual amounts are known.
Deferred Trustee Compensation. Under a Deferred Compensation Plan (the Plan) for certain Funds, certain independent Trustees have elected to defer receipt of a portion of their annual compensation. Deferred amounts are invested in affiliated mutual funds, are marked-to-market and remain in a fund until distributed in accordance with the Plan. The investment of deferred amounts and the offsetting payable to the Trustees presented below are included in the accompanying Statement of Assets and Liabilities in other receivables and other payables and accrued expenses, as applicable.
| Fidelity Advisor Energy Fund | $96,792 |
| Fidelity Advisor Technology Fund | 155,001 |
Income Tax Information and Distributions to Shareholders. Each year, each Fund intends to qualify as a regulated investment company under Subchapter M of the Internal Revenue Code, including distributing substantially all of its taxable income and realized gains. As a result, no provision for U.S. Federal income taxes is required. As of July 31, 2021, each Fund did not have any unrecognized tax benefits in the financial statements; nor is each Fund aware of any tax positions for which it is reasonably possible that the total amounts of unrecognized tax benefits will significantly change in the next twelve months. Each Fund files a U.S. federal tax return, in addition to state and local tax returns as required. Each Fund's federal income tax returns are subject to examination by the Internal Revenue Service (IRS) for a period of three fiscal years after they are filed. State and local tax returns may be subject to examination for an additional fiscal year depending on the jurisdiction. Foreign taxes are provided for based on each Fund's understanding of the tax rules and rates that exist in the foreign markets in which it invests. An estimated deferred tax liability for net unrealized appreciation on the applicable securities is included in Other payables and accrued expenses on each applicable Fund's Statement of Assets & Liabilities.
Distributions are declared and recorded on the ex-dividend date. Income and capital gain distributions are declared separately for each class. Income and capital gain distributions are determined in accordance with income tax regulations, which may differ from GAAP. In addition, certain Funds claimed a portion of the payment made to redeeming shareholders as a distribution for income tax purposes.
Capital accounts within the financial statements are adjusted for permanent book-tax differences. These adjustments have no impact on net assets or the results of operations. Capital accounts are not adjusted for temporary book-tax differences which will reverse in a subsequent period.
Book-tax differences are primarily due to foreign currency transactions, passive foreign investment companies (PFIC), deferred Trustees compensation, net operating losses, capital loss carryforwards, partnerships, losses deferred due to wash sales and excise tax regulations.
As of period end, the cost and unrealized appreciation (depreciation) in securities, and derivatives if applicable, for federal income tax purposes were as follows for each Fund:
| Tax cost | Gross unrealized appreciation | Gross unrealized depreciation | Net unrealized appreciation (depreciation) | |
| Fidelity Advisor Biotechnology Fund | $2,149,946,654 | $786,854,229 | $(185,407,973) | $601,446,256 |
| Fidelity Advisor Communications Equipment Fund | 11,687,134 | 8,390,430 | (278,126) | 8,112,304 |
| Fidelity Advisor Consumer Discretionary Fund | 449,738,347 | 314,373,908 | (9,227,701) | 305,146,207 |
| Fidelity Advisor Energy Fund | 485,009,710 | 105,049,651 | (36,396,088) | 68,653,563 |
| Fidelity Advisor Financial Services Fund | 348,364,632 | 126,552,901 | (8,211,204) | 118,341,697 |
| Fidelity Advisor Health Care Fund | 4,870,580,050 | 2,620,970,507 | (200,620,159) | 2,420,350,348 |
| Fidelity Advisor Industrials Fund | 545,555,296 | 133,879,443 | (3,760,959) | 130,118,484 |
| Fidelity Advisor Semiconductors Fund | 401,226,165 | 297,996,575 | (3,635,529) | 294,361,046 |
| Fidelity Advisor Technology Fund | 2,558,649,093 | 2,379,275,320 | (30,070,040) | 2,349,205,280 |
| Fidelity Advisor Utilities Fund | 462,573,496 | 121,585,130 | (5,983,506) | 115,601,624 |
The tax-based components of distributable earnings as of period end were as follows for each Fund:
| Undistributed ordinary income | Undistributed long-term capital gain | Capital loss carryforward | Net unrealized appreciation (depreciation) on securities and other investments | |
| Fidelity Advisor Biotechnology Fund | $52,320,816 | $243,051,231 | $– | $601,446,256 |
| Fidelity Advisor Communications Equipment Fund | 113,249 | 777,331 | – | 8,112,303 |
| Fidelity Advisor Consumer Discretionary Fund | 2,851,298 | 25,919,900 | – | 305,146,203 |
| Fidelity Advisor Energy Fund | 6,117,083 | – | (330,230,476) | 68,590,091 |
| Fidelity Advisor Financial Services Fund | 3,620,542 | 4,683,844 | – | 118,341,697 |
| Fidelity Advisor Health Care Fund | 736,837 | 324,607,454 | – | 2,420,656,639 |
| Fidelity Advisor Industrials Fund | 16,701,640 | 82,862,714 | – | 130,118,490 |
| Fidelity Advisor Semiconductors Fund | 16,695,953 | 18,133,281 | – | 294,359,575 |
| Fidelity Advisor Technology Fund | 224,687,175 | 276,926,765 | – | 2,349,203,565 |
| Fidelity Advisor Utilities Fund | 2,667,943 | 5,342,295 | – | 115,602,128 |
Capital loss carryforwards are only available to offset future capital gains of the Funds to the extent provided by regulations and may be limited. The capital loss carryforward information presented below, including any applicable limitation, is estimated as of fiscal period end and is subject to adjustment.
| No expiration | |||
| Short-term | Long-term | Total capital loss carryfoward | |
| Fidelity Advisor Energy Fund | (174,302,264) | (155,928,212) | (330,230,476) |
The tax character of distributions paid was as follows:
| July 31, 2021 | |||
| Ordinary Income | Long-term Capital Gains | Total | |
| Fidelity Advisor Biotechnology Fund | $145,927,671 | $82,262,615 | $228,190,286 |
| Fidelity Advisor Consumer Discretionary Fund | – | 7,826,027 | 7,826,027 |
| Fidelity Advisor Energy Fund | 13,506,451 | – | 13,506,451 |
| Fidelity Advisor Financial Services Fund | 5,718,993 | 1,513,784 | 7,232,777 |
| Fidelity Advisor Health Care Fund | 69,368,556 | 286,663,296 | 356,031,852 |
| Fidelity Advisor Industrials Fund | – | 3,415,748 | 3,415,748 |
| Fidelity Advisor Semiconductors Fund | 1,098,272 | 19,834,031 | 20,932,303 |
| Fidelity Advisor Technology Fund | 79,550,664 | 239,625,906 | 319,176,570 |
| Fidelity Advisor Utilities Fund | 12,048,409 | – | 12,048,409 |
| July 31, 2020 | |||
| Ordinary Income | Long-term Capital Gains | Total | |
| Fidelity Advisor Biotechnology Fund | $2,747,812 | $140,189,867 | $142,937,680 |
| Fidelity Advisor Consumer Discretionary Fund | – | 11,256,995 | 11,256,995 |
| Fidelity Advisor Energy Fund | 8,780,599 | – | 8,780,599 |
| Fidelity Advisor Financial Services Fund | 4,735,011 | – | 4,735,011 |
| Fidelity Advisor Health Care Fund | 4,785,422 | 14,535,480 | 19,320,902 |
| Fidelity Advisor Industrials Fund | 9,468,033 | 34,459,397 | 43,927,430 |
| Fidelity Advisor Semiconductors Fund | 892,431 | 2,604,470 | 3,496,901 |
| Fidelity Advisor Technology Fund | 11,738,124 | 50,630,525 | 62,368,648 |
| Fidelity Advisor Utilities Fund | 13,887,432 | 43,958 | 13,931,390 |
Restricted Securities (including Private Placements). Funds may invest in securities that are subject to legal or contractual restrictions on resale. These securities generally may be resold in transactions exempt from registration or to the public if the securities are registered. Disposal of these securities may involve time-consuming negotiations and expense, and prompt sale at an acceptable price may be difficult. Information regarding restricted securities held at period end is included at the end of the Schedule of Investments, if applicable.
Special Purpose Acquisition Companies. Funds may invest in stock, warrants, and other securities of special purpose acquisition companies (SPACs) or similar special purpose entities. A SPAC is a publicly traded company that raises investment capital via an initial public offering (IPO) for the purpose of acquiring the equity securities of one or more existing companies via merger, business combination, acquisition or other similar transactions within a designated time frame.
Private Investment in Public Equity. Funds may acquire equity securities of an issuer through a private investment in a public equity (PIPE) transaction, including through commitments to purchase securities on a when-issued basis. A PIPE typically involves the purchase of securities directly from a publicly traded company in a private placement transaction. Securities purchased through PIPE transactions will be restricted from trading and considered illiquid until a resale registration statement for the shares is filed and declared effective.
At period end, Fidelity Advisor Biotechnology Fund, Fidelity Advisor Health Care Fund, Fidelity Advisor Semiconductors Fund and Fidelity Advisor Technology Fund had commitments to purchase when-issued securities through PIPE transactions with SPACs. The commitments are contingent upon the SPACs acquiring the securities of target companies. Unrealized appreciation (depreciation) on these commitments is separately presented in the Statements of Assets and Liabilities as Unrealized appreciation (depreciation) on unfunded commitments, and in the Statement of Operations as Change in unrealized appreciation (depreciation) on unfunded commitments.
Consolidated Subsidiary. The Funds included in the table below hold certain investments through a wholly-owned subsidiary ("Subsidiary"), which may be subject to federal and state taxes upon disposition.
As of period end, investments in Subsidiaries were as follows:
| $ Amount | % of Net Assets | |
| Fidelity Advisor Health Care Fund | 5,597,126 | .08 |
The financial statements have been consolidated to include the Subsidiary accounts where applicable. Accordingly, all inter-company transactions and balances have been eliminated.
At period end, any estimated tax liability for these investments is presented as "Deferred taxes" in the Statement of Assets and Liabilities and included in "Change in net unrealized appreciation (depreciation) on investment securities" in the Statement of Operations. The tax liability incurred may differ materially depending on conditions when these investments are disposed. Any cash held by a Subsidiary is restricted as to its use and is presented as "Restricted cash" in the Statement of Assets and Liabilities, if applicable.
4. Purchases and Sales of Investments.
Purchases and sales of securities, other than short-term securities and in-kind transactions, as applicable, are noted in the table below.
| Purchases ($) | Sales ($) | |
| Fidelity Advisor Biotechnology Fund | 1,854,016,795 | 2,049,434,221 |
| Fidelity Advisor Communications Equipment Fund | 12,304,184 | 15,128,362 |
| Fidelity Advisor Consumer Discretionary Fund | 332,453,227 | 209,160,592 |
| Fidelity Advisor Energy Fund | 208,974,371 | 209,454,510 |
| Fidelity Advisor Financial Services Fund | 200,650,347 | 180,750,762 |
| Fidelity Advisor Health Care Fund | 2,868,879,701 | 2,392,091,362 |
| Fidelity Advisor Industrials Fund | 1,228,152,324 | 1,180,448,264 |
| Fidelity Advisor Semiconductors Fund | 308,373,963 | 205,672,012 |
| Fidelity Advisor Technology Fund | 1,844,476,052 | 1,952,649,156 |
| Fidelity Advisor Utilities Fund | 252,405,485 | 371,265,061 |
5. Fees and Other Transactions with Affiliates.
Management Fee. Fidelity Management & Research Company LLC (the investment adviser) and its affiliates provide the Funds with investment management related services for which the Funds pay a monthly management fee. The management fee is the sum of an individual fund fee rate and an annualized group fee rate. The individual fund fee rate is applied to each Fund's average net assets. The group fee rate is based upon the monthly average net assets of a group of registered investment companies with which the investment adviser has management contracts. The group fee rate decreases as assets under management increase and increases as assets under management decrease. For the reporting period, each Fund's annual management fee rate expressed as a percentage of each Fund's average net assets was as follows:
| Individual Rate | Group Rate | Total | |
| Fidelity Advisor Biotechnology Fund | .30% | .23% | .53% |
| Fidelity Advisor Communications Equipment Fund | .30% | .23% | .53% |
| Fidelity Advisor Consumer Discretionary Fund | .30% | .23% | .53% |
| Fidelity Advisor Energy Fund | .30% | .23% | .53% |
| Fidelity Advisor Financial Services Fund | .30% | .23% | .53% |
| Fidelity Advisor Health Care Fund | .30% | .23% | .53% |
| Fidelity Advisor Industrials Fund | .30% | .23% | .53% |
| Fidelity Advisor Semiconductors Fund | .30% | .23% | .53% |
| Fidelity Advisor Technology Fund | .30% | .23% | .53% |
| Fidelity Advisor Utilities Fund | .30% | .23% | .53% |
Distribution and Service Plan Fees. In accordance with Rule 12b-1 of the 1940 Act, each Fund has adopted separate Distribution and Service Plans for each class of shares. Certain classes pay Fidelity Distributors Company LLC (FDC), an affiliate of the investment adviser, separate Distribution and Service Fees, each of which is based on an annual percentage of each class' average net assets. In addition, FDC may pay financial intermediaries for selling shares of each Fund and providing shareholder support services. For the period, the Distribution and Service Fee rates, total fees and amounts retained by FDC were as follows:
| Distribution Fee | Service Fee | Total Fees | Retained by FDC | |
| Fidelity Advisor Biotechnology Fund | ||||
| Class A | -% | .25% | $1,995,349 | $37,199 |
| Class M | .25% | .25% | 811,572 | 7,018 |
| Class C | .75% | .25% | 3,887,135 | 302,238 |
| $6,694,056 | $346,455 | |||
| Fidelity Advisor Communications Equipment Fund | ||||
| Class A | -% | .25% | $27,517 | $1,996 |
| Class M | .25% | .25% | 21,998 | 18 |
| Class C | .75% | .25% | 25,813 | 4,306 |
| $75,328 | $6,320 | |||
| Fidelity Advisor Consumer Discretionary Fund | ||||
| Class A | -% | .25% | $526,884 | $18,171 |
| Class M | .25% | .25% | 213,052 | 466 |
| Class C | .75% | .25% | 804,220 | 96,586 |
| $1,544,156 | $115,223 | |||
| Fidelity Advisor Energy Fund | ||||
| Class A | -% | .25% | $359,850 | $19,198 |
| Class M | .25% | .25% | 267,250 | 3,178 |
| Class C | .75% | .25% | 510,877 | 90,869 |
| $1,137,977 | $113,245 | |||
| Fidelity Advisor Financial Services Fund | ||||
| Class A | -% | .25% | $348,162 | $10,566 |
| Class M | .25% | .25% | 232,150 | 638 |
| Class C | .75% | .25% | 500,849 | 53,549 |
| $1,081,161 | $64,753 | |||
| Fidelity Advisor Health Care Fund | ||||
| Class A | -% | .25% | $3,875,483 | $113,324 |
| Class M | .25% | .25% | 1,885,622 | 17,298 |
| Class C | .75% | .25% | 6,971,117 | 956,262 |
| $12,732,222 | $1,086,884 | |||
| Fidelity Advisor Industrials Fund | ||||
| Class A | -% | .25% | $587,900 | $7,652 |
| Class M | .25% | .25% | 266,214 | 1,732 |
| Class C | .75% | .25% | 579,803 | 42,673 |
| $1,433,917 | $52,057 | |||
| Fidelity Advisor Semiconductors Fund | ||||
| Class A | -% | .25% | $503,717 | $19,394 |
| Class M | .25% | .25% | 198,185 | 2,804 |
| Class C | .75% | .25% | 729,519 | 100,729 |
| $1,431,421 | $122,927 | |||
| Fidelity Advisor Technology Fund | ||||
| Class A | -% | .25% | $4,024,284 | $117,415 |
| Class M | .25% | .25% | 2,770,352 | 42,766 |
| Class C | .75% | .25% | 3,935,661 | 630,641 |
| $10,730,297 | $790,822 | |||
| Fidelity Advisor Utilities Fund | ||||
| Class A | -% | .25% | $619,356 | $15,108 |
| Class M | .25% | .25% | 297,860 | 3,138 |
| Class C | .75% | .25% | 568,316 | 90,780 |
| $1,485,532 | $109,026 |
Sales Load. FDC may receive a front-end sales charge of up to 5.75% for selling Class A shares and 3.50% for selling Class M shares, some of which is paid to financial intermediaries for selling shares of each Fund. Depending on the holding period, FDC may receive contingent deferred sales charges levied on Class A, Class M and Class C redemptions. The deferred sales charges are 1.00% for Class C shares, 1.00% for certain purchases of Class A shares and .25% for certain purchases of Class M shares.
For the period, sales charge amounts retained by FDC were as follows:
| Retained by FDC | |
| Fidelity Advisor Biotechnology Fund | |
| Class A | $280,233 |
| Class M | 23,749 |
| Class C(a) | 16,552 |
| $320,534 | |
| Fidelity Advisor Communications Equipment Fund | |
| Class A | $4,002 |
| Class M | 690 |
| Class C(a) | 163 |
| $4,855 | |
| Fidelity Advisor Consumer Discretionary Fund | |
| Class A | $157,315 |
| Class M | 12,601 |
| Class C(a) | 3,959 |
| $173,875 | |
| Fidelity Advisor Energy Fund | |
| Class A | $76,851 |
| Class M | 11,882 |
| Class C(a) | 12,270 |
| $101,003 | |
| Fidelity Advisor Financial Services Fund | |
| Class A | $60,079 |
| Class M | 4,745 |
| Class C(a) | 4,406 |
| $69,230 | |
| Fidelity Advisor Health Care Fund | |
| Class A | $680,749 |
| Class M | 57,839 |
| Class C(a) | 46,975 |
| $785,563 | |
| Fidelity Advisor Industrials Fund | |
| Class A | $68,810 |
| Class M | 7,082 |
| Class C(a) | 1,454 |
| $77,346 | |
| Fidelity Advisor Semiconductors Fund | |
| Class A | $203,095 |
| Class M | 10,978 |
| Class C(a) | 5,358 |
| $219,431 | |
| Fidelity Advisor Technology Fund | |
| Class A | $625,432 |
| Class M | 54,159 |
| Class C(a) | 38,371 |
| $717,962 | |
| Fidelity Advisor Utilities Fund | |
| Class A | $78,198 |
| Class M | 10,799 |
| Class C(a) | 4,993 |
| $93,990 |
(a) When Class C shares are initially sold, FDC pays commissions from its own resources to financial intermediaries through which the sales are made.
Transfer Agent Fees. Fidelity Investments Institutional Operations Company LLC (FIIOC), an affiliate of the investment adviser, is the transfer, dividend disbursing and shareholder servicing agent for each class of the Funds. FIIOC receives account fees and asset-based fees that vary according to the account size and type of account of the shareholders of the respective classes of each Fund, except for Class Z. FIIOC receives an asset-based fee of Class Z's average net assets. FIIOC pays for typesetting, printing and mailing of shareholder reports, except proxy statements. For the period, transfer agent fees for each class were as follows:
| Amount | % of Class-Level Average Net Assets | |
| Fidelity Advisor Biotechnology Fund | ||
| Class A | $1,490,308 | .19 |
| Class M | 344,403 | .21 |
| Class C | 720,209 | .19 |
| Class I | 2,086,188 | .17 |
| Class Z | 34,569 | .04 |
| $4,675,677 | ||
| Fidelity Advisor Communications Equipment Fund | ||
| Class A | $30,673 | .28 |
| Class M | 12,644 | .29 |
| Class C | 7,377 | .29 |
| Class I | 2,970 | .14 |
| $53,664 | ||
| Fidelity Advisor Consumer Discretionary Fund | ||
| Class A | $389,543 | .18 |
| Class M | 83,880 | .20 |
| Class C | 153,108 | .19 |
| Class I | 331,095 | .17 |
| Class Z | 28,923 | .04 |
| $986,549 | ||
| Fidelity Advisor Energy Fund | ||
| Class A | $378,228 | .26 |
| Class M | 147,887 | .28 |
| Class C | 122,778 | .24 |
| Class I | 318,375 | .19 |
| Class Z | 25,491 | .04 |
| $992,759 | ||
| Fidelity Advisor Financial Services Fund | ||
| Class A | $288,666 | .21 |
| Class M | 96,821 | .21 |
| Class C | 106,799 | .21 |
| Class I | 155,377 | .17 |
| Class Z | 15,303 | .04 |
| $662,966 | ||
| Fidelity Advisor Health Care Fund | ||
| Class A | $2,753,169 | .18 |
| Class M | 678,115 | .18 |
| Class C | 1,255,058 | .18 |
| Class I | 5,177,498 | .17 |
| Class Z | 331,415 | .04 |
| $10,195,255 | ||
| Fidelity Advisor Industrials Fund | ||
| Class A | $443,925 | .19 |
| Class M | 105,571 | .20 |
| Class C | 114,129 | .20 |
| Class I | 343,381 | .17 |
| Class Z | 18,152 | .04 |
| $1,025,158 | ||
| Fidelity Advisor Semiconductors Fund | ||
| Class A | $375,309 | .19 |
| Class M | 77,659 | .20 |
| Class C | 140,666 | .19 |
| Class I | 308,028 | .17 |
| Class Z | 7,025 | .04 |
| $908,687 | ||
| Fidelity Advisor Technology Fund | ||
| Class A | $2,731,911 | .17 |
| Class M | 916,161 | .17 |
| Class C | 718,818 | .18 |
| Class I | 2,023,315 | .16 |
| Class Z | 172,572 | .04 |
| $6,562,777 | ||
| Fidelity Advisor Utilities Fund | ||
| Class A | $493,131 | .20 |
| Class M | 135,370 | .23 |
| Class C | 116,618 | .21 |
| Class I | 273,138 | .17 |
| Class Z | 23,638 | .04 |
| $1,041,895 |
Accounting Fees. Fidelity Service Company, Inc. (FSC), an affiliate of the investment adviser, maintains each Fund's accounting records. The accounting fee is based on the level of average net assets for each month. For the period, the fees were equivalent to the following annual rates:
| % of Average Net Assets | |
| Fidelity Advisor Biotechnology Fund | .03 |
| Fidelity Advisor Communications Equipment Fund | .04 |
| Fidelity Advisor Consumer Discretionary Fund | .04 |
| Fidelity Advisor Energy Fund | .04 |
| Fidelity Advisor Financial Services Fund | .04 |
| Fidelity Advisor Health Care Fund | .02 |
| Fidelity Advisor Industrials Fund | .04 |
| Fidelity Advisor Semiconductors Fund | .04 |
| Fidelity Advisor Technology Fund | .02 |
| Fidelity Advisor Utilities Fund | .04 |
Brokerage Commissions. A portion of portfolio transactions were placed with brokerage firms which are affiliates of the investment adviser. Brokerage commissions are included in net realized gain (loss) and change in net unrealized appreciation (depreciation) in the Statement of Operations. The commissions paid to these affiliated firms were as follows:
| Amount | |
| Fidelity Advisor Biotechnology Fund | $65,580 |
| Fidelity Advisor Communications Equipment Fund | 645 |
| Fidelity Advisor Consumer Discretionary Fund | 1,784 |
| Fidelity Advisor Energy Fund | 11,907 |
| Fidelity Advisor Financial Services Fund | 4,581 |
| Fidelity Advisor Health Care Fund | 49,199 |
| Fidelity Advisor Industrials Fund | 21,681 |
| Fidelity Advisor Semiconductors Fund | 4,393 |
| Fidelity Advisor Technology Fund | 25,414 |
| Fidelity Advisor Utilities Fund | 6,884 |
Interfund Lending Program. Pursuant to an Exemptive Order issued by the Securities and Exchange Commission (the SEC), each Fund, along with other registered investment companies having management contracts with Fidelity Management & Research Company LLC (FMR), or other affiliated entities of FMR, may participate in an interfund lending program. This program provides an alternative credit facility allowing each Fund to borrow from, or lend money to, other participating affiliated funds. At period end, there were no interfund loans outstanding. Activity in this program during the period for which loans were outstanding was as follows:
| Borrower or Lender | Average Loan Balance | Weighted Average Interest Rate | Interest Expense | |
| Fidelity Advisor Biotechnology Fund | Borrower | $9,440,286 | .31% | $570 |
| Fidelity Advisor Consumer Discretionary Fund | Borrower | $5,437,000 | .31% | $426 |
| Fidelity Advisor Energy Fund | Borrower | $10,027,000 | .34% | $189 |
| Fidelity Advisor Financial Services Fund | Borrower | $11,991,714 | .33% | $763 |
| Fidelity Advisor Health Care Fund | Borrower | $12,319,600 | .33% | $1,127 |
| Fidelity Advisor Industrials Fund | Borrower | $7,614,200 | .29% | $304 |
| Fidelity Advisor Semiconductors Fund | Borrower | $12,624,000 | .29% | $100 |
| Fidelity Advisor Technology Fund | Borrower | $10,818,824 | .33% | $1,691 |
| Fidelity Advisor Utilities Fund | Borrower | $8,564,600 | .33% | $391 |
Interfund Trades. Funds may purchase from or sell securities to other Fidelity Funds under procedures adopted by the Board. The procedures have been designed to ensure these interfund trades are executed in accordance with Rule 17a-7 of the 1940 Act. Any interfund trades are included within the respective purchases and sales amounts shown in the Purchases and Sales of Investments note and are noted in the table below.
| Purchases ($) | Sales ($) | |
| Fidelity Advisor Biotechnology Fund | 195,277,094 | 168,408,237 |
| Fidelity Advisor Communications Equipment Fund | 962,227 | 97,527 |
| Fidelity Advisor Consumer Discretionary Fund | 32,530,506 | 10,379,393 |
| Fidelity Advisor Energy Fund | 11,648,731 | 7,427,652 |
| Fidelity Advisor Financial Services Fund | 8,631,472 | 11,371,252 |
| Fidelity Advisor Health Care Fund | 362,080,831 | 125,424,808 |
| Fidelity Advisor Industrials Fund | 64,361,848 | 81,424,285 |
| Fidelity Advisor Semiconductors Fund | 23,714,210 | 23,026,377 |
| Fidelity Advisor Technology Fund | 163,158,309 | 145,187,649 |
| Fidelity Advisor Utilities Fund | 4,972,543 | 15,280,279 |
Prior Fiscal Year Affiliated Exchanges In-Kind. Shares that were exchanged for investments, including accrued interest and cash, if any, are shown in the table below. The amount of in-kind exchanges is included in share transactions in the accompanying Statement of Changes in Net Assets.
| Shares | Total Proceeds ($) | Participating classes | |
| Fidelity Advisor Consumer Discretionary Fund | 340,887 | 10,509,560 | Class Z |
| Fidelity Advisor Energy Fund | 1,418,542 | 37,704,833 | Class Z |
| Fidelity Advisor Financial Services Fund | 1,072,326 | 22,465,229 | Class Z |
| Fidelity Advisor Health Care Fund | 2,311,335 | 122,939,907 | Class Z |
| Fidelity Advisor Industrials Fund | 331,589 | 13,207,212 | Class Z |
| Fidelity Advisor Technology Fund | 1,742,932 | 97,220,739 | Class Z |
| Fidelity Advisor Utilities Fund | 757,866 | 24,994,414 | Class Z |
6. Committed Line of Credit.
Certain Funds participate with other funds managed by the investment adviser or an affiliate in a $4.25 billion credit facility (the "line of credit") to be utilized for temporary or emergency purposes to fund shareholder redemptions or for other short-term liquidity purposes. The participating funds have agreed to pay commitment fees on their pro-rata portion of the line of credit, which are reflected in Miscellaneous expenses on the Statement of Operations, and are listed below. During the period, there were no borrowings on this line of credit.
| Amount | |
| Fidelity Advisor Biotechnology Fund | $5,104 |
| Fidelity Advisor Communications Equipment Fund | 38 |
| Fidelity Advisor Consumer Discretionary Fund | 1,093 |
| Fidelity Advisor Energy Fund | 889 |
| Fidelity Advisor Financial Services Fund | 659 |
| Fidelity Advisor Health Care Fund | 12,174 |
| Fidelity Advisor Industrials Fund | 1,097 |
| Fidelity Advisor Semiconductors Fund | 934 |
| Fidelity Advisor Technology Fund | 7,892 |
| Fidelity Advisor Utilities Fund | 1,125 |
7. Security Lending.
Funds lend portfolio securities from time to time in order to earn additional income. Lending agents are used, including National Financial Services (NFS), an affiliate of the investment adviser. Pursuant to a securities lending agreement, NFS will receive a fee, which is capped at 9.9% of a fund's daily lending revenue, for its services as lending agent. A fund may lend securities to certain qualified borrowers, including NFS. On the settlement date of the loan, a fund receives collateral (in the form of U.S. Treasury obligations, letters of credit and/or cash) against the loaned securities and maintains collateral in an amount not less than 100% of the market value of the loaned securities during the period of the loan. The market value of the loaned securities is determined at the close of business of a fund and any additional required collateral is delivered to a fund on the next business day. A fund or borrower may terminate the loan at any time, and if the borrower defaults on its obligation to return the securities loaned because of insolvency or other reasons, a fund may apply collateral received from the borrower against the obligation. A fund may experience delays and costs in recovering the securities loaned. Any cash collateral received is invested in the Fidelity Securities Lending Cash Central Fund. Any loaned securities are identified as such in the Schedule of Investments, and the value of loaned securities and cash collateral at period end, as applicable, are presented in the Statement of Assets and Liabilities. Security lending income represents the income earned on investing cash collateral, less rebates paid to borrowers and any lending agent fees associated with the loan, plus any premium payments received for lending certain types of securities. Security lending income is presented in the Statement of Operations as a component of income from Fidelity Central Funds. Affiliated security lending activity, if any, was as follows:
| Total Security Lending Fees Paid to NFS | Security Lending Income From Securities Loaned to NFS | Value of Securities Loaned to NFS at Period End | |
| Fidelity Advisor Biotechnology Fund | $85,720 | $101,078 | $2,004,793 |
| Fidelity Advisor Communications Equipment Fund | $899 | $496 | $– |
| Fidelity Advisor Consumer Discretionary Fund | $969 | $273 | $– |
| Fidelity Advisor Energy Fund | $2,586 | $– | $– |
| Fidelity Advisor Financial Services Fund | $67 | $– | $– |
| Fidelity Advisor Health Care Fund | $32,570 | $39,244 | $– |
| Fidelity Advisor Industrials Fund | $280 | $– | $– |
| Fidelity Advisor Semiconductors Fund | $226 | $– | $– |
| Fidelity Advisor Technology Fund | $6,798 | $1,159 | $– |
| Fidelity Advisor Utilities Fund | $363 | $– | $– |
8. Bank Borrowings.
Each Fund is permitted to have bank borrowings for temporary or emergency purposes to fund shareholder redemptions or for other short-term liquidity requirements. Each Fund has established borrowing arrangements with certain banks. The interest rate on the borrowings is the bank's base rate, as revised from time to time. Any open loans, including accrued interest, at period end are presented under the caption "Notes payable" in the Statement of Assets and Liabilities, if applicable. Activity in this program during the period for which loans were outstanding was as follows:
| Average Loan Balance | Weighted Average Interest Rate | Interest Expense | |
| Fidelity Advisor Financial Services Fund | $30,656,000 | .60% | $511 |
9. Expense Reductions.
The investment adviser contractually agreed to reimburse expenses of each class of each Fund to the extent annual operating expenses exceeded certain levels of class-level average net assets as noted in the table below. This reimbursement will remain in place through November 30, 2021. Some expenses, for example the compensation of the independent Trustees, and certain other expenses such as interest expense, are excluded from this reimbursement.
The following classes of each applicable Fund were in reimbursement during the period:
| Expense Limitations | Reimbursement | |
| Fidelity Advisor Communications Equipment Fund | ||
| Class A | 1.40% | $24,699 |
| Class M | 1.65% | 10,781 |
| Class C | 2.15% | 7,017 |
| Class I | 1.15% | 938 |
Commissions paid to certain brokers with whom the investment adviser, or its affiliates, places trades on behalf of certain Funds include an amount in addition to trade execution, which may be rebated back to the Funds to offset expenses. In addition, through arrangements with each applicable Fund's custodian, credits realized as a result of certain uninvested cash balances were used to reduce each applicable Fund's or class' expenses. All of the applicable expense reductions are noted in the table below.
| Brokerage service rebates | Custodian credits | |
| Fidelity Advisor Biotechnology Fund | $137,965 | $– |
| Fidelity Advisor Communications Equipment Fund | 968 | – |
| Fidelity Advisor Consumer Discretionary Fund | 21,333 | – |
| Fidelity Advisor Energy Fund | 3,670 | – |
| Fidelity Advisor Financial Services Fund | 22,239 | – |
| Fidelity Advisor Health Care Fund | 339,644 | 157 |
| Fidelity Advisor Industrials Fund | 110,927 | – |
| Fidelity Advisor Semiconductors Fund | 7,604 | – |
| Fidelity Advisor Technology Fund | 130,651 | – |
| Fidelity Advisor Utilities Fund | 56,490 | – |
In addition, during the period the investment adviser or an affiliate reimbursed and/or waived a portion of fund-level operating expenses as follows:
| Fund-Level Amount | |
| Fidelity Advisor Biotechnology Fund | $23,908 |
| Fidelity Advisor Communications Equipment Fund | 192 |
| Fidelity Advisor Consumer Discretionary Fund | 5,931 |
| Fidelity Advisor Energy Fund | 4,934 |
| Fidelity Advisor Financial Services Fund | 3,904 |
| Fidelity Advisor Health Care Fund | 61,059 |
| Fidelity Advisor Industrials Fund | 5,710 |
| Fidelity Advisor Semiconductors Fund | 5,248 |
| Fidelity Advisor Technology Fund | 39,954 |
| Fidelity Advisor Utilities Fund | 5,115 |
10. Distributions to Shareholders.
Distributions to shareholders of each class were as follows:
| Year ended July 31, 2021 | Year ended July 31, 2020 |
|
| Fidelity Advisor Biotechnology Fund | ||
| Distributions to shareholders | ||
| Class A | $67,637,073 | $40,863,434 |
| Class M | 14,175,139 | 8,608,302 |
| Class C | 38,418,019 | 29,571,463 |
| Class I | 101,042,657 | 61,591,087 |
| Class Z | 6,917,398 | 2,303,394 |
| Total | $228,190,286 | $142,937,680 |
| Fidelity Advisor Consumer Discretionary Fund | ||
| Distributions to shareholders | ||
| Class A | $2,799,807 | $4,116,798 |
| Class M | 644,893 | 929,194 |
| Class C | 1,412,829 | 2,338,201 |
| Class I | 2,190,120 | 3,149,331 |
| Class Z | 778,378 | 723,471 |
| Total | $7,826,027 | $11,256,995 |
| Fidelity Advisor Energy Fund | ||
| Distributions to shareholders | ||
| Class A | $3,957,441 | $2,688,540 |
| Class M | 1,322,704 | 985,221 |
| Class C | 1,232,239 | 659,426 |
| Class I | 5,542,085 | 3,336,904 |
| Class Z | 1,451,982 | 1,110,508 |
| Total | $13,506,451 | $8,780,599 |
| Fidelity Advisor Financial Services Fund | ||
| Distributions to shareholders | ||
| Class A | $3,032,802 | $1,824,086 |
| Class M | 897,549 | 493,589 |
| Class C | 858,669 | 317,172 |
| Class I | 1,637,605 | 1,626,928 |
| Class Z | 806,152 | 473,236 |
| Total | $7,232,777 | $4,735,011 |
| Fidelity Advisor Health Care Fund | ||
| Distributions to shareholders | ||
| Class A | $85,254,822 | $3,927,602 |
| Class M | 21,586,340 | 1,147,016 |
| Class C | 45,636,281 | 2,538,507 |
| Class I | 163,297,556 | 9,099,909 |
| Class Z | 40,256,853 | 2,607,868 |
| Total | $356,031,852 | $19,320,902 |
| Fidelity Advisor Industrials Fund | ||
| Distributions to shareholders | ||
| Class A | $1,360,586 | $18,388,918 |
| Class M | 326,687 | 4,119,707 |
| Class C | 410,014 | 5,971,134 |
| Class I | 1,091,334 | 13,357,871 |
| Class Z | 227,127 | 2,089,800 |
| Total | $3,415,748 | $43,927,430 |
| Fidelity Advisor Semiconductors Fund | ||
| Distributions to shareholders | ||
| Class A | $8,071,050 | $1,274,755 |
| Class M | 1,689,234 | 264,058 |
| Class C | 3,556,245 | 523,732 |
| Class I | 7,098,112 | 1,293,451 |
| Class Z | 517,662 | 140,905 |
| Total | $20,932,303 | $3,496,901 |
| Fidelity Advisor Technology Fund | ||
| Distributions to shareholders | ||
| Class A | $121,011,582 | $24,794,599 |
| Class M | 44,308,653 | 8,680,589 |
| Class C | 36,326,601 | 6,376,707 |
| Class I | 89,512,609 | 18,523,848 |
| Class Z | 28,017,125 | 3,992,905 |
| Total | $319,176,570 | $62,368,648 |
| Fidelity Advisor Utilities Fund | ||
| Distributions to shareholders | ||
| Class A | $5,044,520 | $5,344,171 |
| Class M | 1,092,413 | 1,063,561 |
| Class C | 758,565 | 924,262 |
| Class I | 3,725,913 | 5,554,769 |
| Class Z | 1,426,998 | 1,044,627 |
| Total | $12,048,409 | $13,931,390 |
11. Share Transactions.
Share transactions for each class were as follows and may contain in-kind transactions, automatic conversions between classes or exchanges between affiliated funds:
| Shares | Shares | Dollars | Dollars | |
| Year ended July 31, 2021 | Year ended July 31, 2020 | Year ended July 31, 2021 | Year ended July 31, 2020 | |
| Fidelity Advisor Biotechnology Fund | ||||
| Class A | ||||
| Shares sold | 4,988,031 | 4,476,939 | $167,392,479 | $129,852,578 |
| Reinvestment of distributions | 1,799,881 | 1,386,979 | 61,715,324 | 38,627,357 |
| Shares redeemed | (5,261,146) | (6,779,279) | (174,179,391) | (181,633,714) |
| Net increase (decrease) | 1,526,766 | (915,361) | $54,928,412 | $(13,153,779) |
| Class M | ||||
| Shares sold | 995,337 | 875,738 | $30,881,501 | $23,191,732 |
| Reinvestment of distributions | 439,075 | 326,946 | 14,041,249 | 8,546,370 |
| Shares redeemed | (1,081,193) | (1,197,844) | (33,432,255) | (30,411,303) |
| Net increase (decrease) | 353,219 | 4,840 | $11,490,495 | $1,326,799 |
| Class C | ||||
| Shares sold | 1,153,351 | 1,316,924 | $31,874,274 | $31,385,640 |
| Reinvestment of distributions | 1,317,196 | 1,155,478 | 37,235,282 | 27,049,731 |
| Shares redeemed | (5,015,655) | (6,033,882) | (138,031,651) | (140,899,467) |
| Net increase (decrease) | (2,545,108) | (3,561,480) | $(68,922,095) | $(82,464,096) |
| Class I | ||||
| Shares sold | 7,356,978 | 8,470,953 | $261,275,855 | $257,423,341 |
| Reinvestment of distributions | 2,327,200 | 1,716,365 | 85,623,933 | 50,993,195 |
| Shares redeemed | (10,342,724) | (14,414,703) | (368,212,581) | (407,260,427) |
| Net increase (decrease) | (658,546) | (4,227,385) | $(21,312,793) | $(98,843,891) |
| Class Z | ||||
| Shares sold | 1,700,116 | 1,769,931 | $60,995,095 | $54,979,279 |
| Reinvestment of distributions | 154,329 | 65,751 | 5,683,821 | 1,955,433 |
| Shares redeemed | (1,185,293) | (1,058,458) | (41,706,292) | (31,746,874) |
| Net increase (decrease) | 669,152 | 777,224 | $24,972,624 | $25,187,838 |
| Fidelity Advisor Communications Equipment Fund | ||||
| Class A | ||||
| Shares sold | 297,440 | 217,044 | $5,011,944 | $2,771,341 |
| Shares redeemed | (466,192) | (445,959) | (7,895,001) | (6,207,767) |
| Net increase (decrease) | (168,752) | (228,915) | $(2,883,057) | $(3,436,426) |
| Class M | ||||
| Shares sold | 38,172 | 36,130 | $614,830 | $462,021 |
| Shares redeemed | (73,038) | (85,605) | (1,149,052) | (1,118,547) |
| Net increase (decrease) | (34,866) | (49,475) | $(534,222) | $(656,526) |
| Class C | ||||
| Shares sold | 40,669 | 84,351 | $600,097 | $980,333 |
| Shares redeemed | (138,275) | (256,986) | (2,083,297) | (3,133,279) |
| Net increase (decrease) | (97,606) | (172,635) | $(1,483,200) | $(2,152,946) |
| Class I | ||||
| Shares sold | 95,940 | 33,038 | $1,643,573 | $466,923 |
| Shares redeemed | (73,677) | (217,484) | (1,279,941) | (3,137,525) |
| Net increase (decrease) | 22,263 | (184,446) | $363,632 | $(2,670,602) |
| Fidelity Advisor Consumer Discretionary Fund | ||||
| Class A | ||||
| Shares sold | 1,888,408 | 987,448 | $80,090,408 | $29,191,888 |
| Reinvestment of distributions | 66,769 | 132,999 | 2,706,144 | 4,013,924 |
| Shares redeemed | (1,018,441) | (1,723,422) | (42,259,203) | (49,014,820) |
| Net increase (decrease) | 936,736 | (602,975) | $40,537,349 | $(15,809,008) |
| Class M | ||||
| Shares sold | 259,712 | 155,773 | $9,990,943 | $4,255,414 |
| Reinvestment of distributions | 17,054 | 33,065 | 639,182 | 926,158 |
| Shares redeemed | (218,708) | (283,850) | (8,336,487) | (7,619,627) |
| Net increase (decrease) | 58,058 | (95,012) | $2,293,638 | $(2,438,055) |
| Class C | ||||
| Shares sold | 655,073 | 330,132 | $21,563,514 | $7,749,039 |
| Reinvestment of distributions | 43,840 | 94,530 | 1,398,073 | 2,269,668 |
| Shares redeemed | (754,233) | (938,311) | (24,941,149) | (21,317,477) |
| Net increase (decrease) | (55,320) | (513,649) | $(1,979,562) | $(11,298,770) |
| Class I | ||||
| Shares sold | 3,455,093 | 1,960,114 | $157,028,268 | $61,846,005 |
| Reinvestment of distributions | 44,468 | 86,481 | 1,963,243 | 2,831,372 |
| Shares redeemed | (1,976,394) | (3,309,001) | (87,428,646) | (100,848,947) |
| Net increase (decrease) | 1,523,167 | (1,262,406) | $71,562,865 | $(36,171,570) |
| Class Z | ||||
| Shares sold | 1,465,692 | 1,633,004 | $66,408,699 | $53,010,630 |
| Reinvestment of distributions | 14,813 | 21,250 | 656,091 | 697,006 |
| Shares redeemed | (1,056,481) | (538,980) | (46,924,459) | (15,367,644) |
| Net increase (decrease) | 424,024 | 1,115,274 | $20,140,331 | $38,339,992 |
| Fidelity Advisor Energy Fund | ||||
| Class A | ||||
| Shares sold | 2,907,447 | 2,921,562 | $61,561,652 | $51,419,972 |
| Reinvestment of distributions | 210,429 | 95,010 | 3,850,848 | 2,593,762 |
| Shares redeemed | (2,580,719) | (2,978,037) | (51,778,100) | (63,901,347) |
| Net increase (decrease) | 537,157 | 38,535 | $13,634,400 | $(9,887,613) |
| Class M | ||||
| Shares sold | 839,687 | 536,631 | $18,722,946 | $10,688,495 |
| Reinvestment of distributions | 68,479 | 34,199 | 1,287,399 | 957,921 |
| Shares redeemed | (899,666) | (1,050,158) | (19,016,017) | (23,326,366) |
| Net increase (decrease) | 8,500 | (479,328) | $994,328 | $(11,679,950) |
| Class C | ||||
| Shares sold | 660,725 | 952,342 | $13,081,023 | $14,926,711 |
| Reinvestment of distributions | 71,624 | 25,382 | 1,205,425 | 638,866 |
| Shares redeemed | (1,105,766) | (1,543,989) | (20,525,961) | (30,880,652) |
| Net increase (decrease) | (373,417) | (566,265) | $(6,239,513) | $(15,315,075) |
| Class I | ||||
| Shares sold | 5,149,259 | 7,515,819 | $116,152,508 | $141,901,116 |
| Reinvestment of distributions | 263,571 | 107,684 | 5,089,551 | 3,095,929 |
| Shares redeemed | (7,136,273) | (6,438,806) | (156,749,306) | (143,255,421) |
| Net increase (decrease) | (1,723,443) | 1,184,697 | $(35,507,247) | $1,741,624 |
| Class Z | ||||
| Shares sold | 2,898,214 | 3,592,181 | $64,509,553 | $80,138,784 |
| Reinvestment of distributions | 73,062 | 37,631 | 1,407,175 | 1,079,250 |
| Shares redeemed | (2,014,101) | (1,614,597) | (43,525,755) | (34,040,181) |
| Net increase (decrease) | 957,175 | 2,015,215 | $22,390,973 | $47,177,853 |
| Fidelity Advisor Financial Services Fund | ||||
| Class A | ||||
| Shares sold | 1,796,629 | 1,136,964 | $47,892,115 | $22,282,321 |
| Reinvestment of distributions | 129,951 | 74,672 | 2,873,224 | 1,748,061 |
| Shares redeemed | (1,368,007) | (2,181,699) | (31,660,283) | (41,948,958) |
| Net increase (decrease) | 558,573 | (970,063) | $19,105,056 | $(17,918,576) |
| Class M | ||||
| Shares sold | 723,923 | 410,506 | $18,609,730 | $8,117,860 |
| Reinvestment of distributions | 40,416 | 21,004 | 884,297 | 486,870 |
| Shares redeemed | (566,967) | (744,724) | (12,817,995) | (14,078,849) |
| Net increase (decrease) | 197,372 | (313,214) | $6,676,032 | $(5,474,119) |
| Class C | ||||
| Shares sold | 492,379 | 294,424 | $11,952,885 | $5,246,784 |
| Reinvestment of distributions | 41,102 | 13,952 | 850,822 | 306,244 |
| Shares redeemed | (845,925) | (1,385,106) | (18,090,556) | (24,631,507) |
| Net increase (decrease) | (312,444) | (1,076,730) | $(5,286,849) | $(19,078,479) |
| Class I | ||||
| Shares sold | 3,715,913 | 3,650,938 | $99,892,222 | $69,558,772 |
| Reinvestment of distributions | 67,057 | 65,088 | 1,527,568 | 1,567,314 |
| Shares redeemed | (4,342,939) | (3,960,034) | (100,735,420) | (78,384,078) |
| Net increase (decrease) | (559,969) | (244,008) | $684,370 | $(7,257,992) |
| Class Z | ||||
| Shares sold | 1,013,230 | 2,376,630 | $26,606,909 | $46,381,804 |
| Reinvestment of distributions | 34,717 | 19,154 | 789,123 | 460,276 |
| Shares redeemed | (1,028,965) | (1,052,466) | (23,032,643) | (21,123,539) |
| Net increase (decrease) | 18,982 | 1,343,318 | $4,363,389 | $25,718,541 |
| Fidelity Advisor Health Care Fund | ||||
| Class A | ||||
| Shares sold | 5,308,631 | 4,416,062 | $348,242,413 | $241,671,523 |
| Reinvestment of distributions | 1,258,713 | 67,108 | 80,205,218 | 3,732,529 |
| Shares redeemed | (4,096,600) | (4,802,715) | (266,221,815) | (249,141,197) |
| Net increase (decrease) | 2,470,744 | (319,545) | $162,225,816 | $(3,737,145) |
| Class M | ||||
| Shares sold | 673,573 | 725,698 | $40,682,436 | $36,630,755 |
| Reinvestment of distributions | 359,459 | 21,832 | 21,182,904 | 1,127,617 |
| Shares redeemed | (942,777) | (1,282,976) | (56,902,516) | (62,338,333) |
| Net increase (decrease) | 90,255 | (535,446) | $4,962,824 | $(24,579,961) |
| Class C | ||||
| Shares sold | 2,054,175 | 2,329,497 | $103,378,959 | $99,233,205 |
| Reinvestment of distributions | 903,363 | 55,297 | 44,382,226 | 2,409,588 |
| Shares redeemed | (3,635,928) | (3,760,176) | (184,781,965) | (154,683,543) |
| Net increase (decrease) | (678,390) | (1,375,382) | $(37,020,780) | $(53,040,750) |
| Class I | ||||
| Shares sold | 16,464,289 | 17,332,018 | $1,172,808,851 | $1,021,555,878 |
| Reinvestment of distributions | 2,063,590 | 131,180 | 144,306,867 | 7,969,368 |
| Shares redeemed | (12,044,029) | (12,512,534) | (860,852,926) | (710,787,677) |
| Net increase (decrease) | 6,483,850 | 4,950,664 | $456,262,792 | $318,737,569 |
| Class Z | ||||
| Shares sold | 5,525,911 | 6,860,756 | $396,687,588 | $395,026,855 |
| Reinvestment of distributions | 465,787 | 36,769 | 32,581,809 | 2,234,471 |
| Shares redeemed | (2,678,428) | (2,206,058) | (192,046,547) | (128,072,955) |
| Net increase (decrease) | 3,313,270 | 4,691,467 | $237,222,850 | $269,188,371 |
| Fidelity Advisor Industrials Fund | ||||
| Class A | ||||
| Shares sold | 1,076,584 | 800,781 | $45,468,071 | $27,338,916 |
| Reinvestment of distributions | 31,089 | 468,175 | 1,282,422 | 17,640,658 |
| Shares redeemed | (1,224,035) | (2,258,552) | (49,828,306) | (74,625,361) |
| Net increase (decrease) | (116,362) | (989,596) | $(3,077,813) | $(29,645,787) |
| Class M | ||||
| Shares sold | 206,166 | 131,299 | $8,359,636 | $4,482,960 |
| Reinvestment of distributions | 8,025 | 110,476 | 321,903 | 4,059,928 |
| Shares redeemed | (305,322) | (492,314) | (12,251,726) | (16,081,940) |
| Net increase (decrease) | (91,131) | (250,539) | $(3,570,187) | $(7,539,052) |
| Class C | ||||
| Shares sold | 294,036 | 141,731 | $10,618,840 | $4,356,577 |
| Reinvestment of distributions | 11,359 | 169,191 | 407,004 | 5,586,569 |
| Shares redeemed | (725,513) | (1,123,620) | (25,842,698) | (33,504,075) |
| Net increase (decrease) | (420,118) | (812,698) | $(14,816,854) | $(23,560,929) |
| Class I | ||||
| Shares sold | 3,168,353 | 1,036,149 | $136,049,117 | $39,146,978 |
| Reinvestment of distributions | 19,975 | 300,144 | 876,709 | 11,996,658 |
| Shares redeemed | (1,524,607) | (3,220,419) | (66,684,423) | (116,057,356) |
| Net increase (decrease) | 1,663,721 | (1,884,126) | $70,241,403 | $(64,913,720) |
| Class Z | ||||
| Shares sold | 750,481 | 1,106,449 | $33,098,948 | $41,438,832 |
| Reinvestment of distributions | 3,549 | 50,287 | 155,552 | 2,004,432 |
| Shares redeemed | (534,468) | (613,430) | (23,973,370) | (20,747,469) |
| Net increase (decrease) | 219,562 | 543,306 | $9,281,130 | $22,695,795 |
| Fidelity Advisor Semiconductors Fund | ||||
| Class A | ||||
| Shares sold | 2,272,508 | 1,918,310 | $92,361,798 | $49,422,318 |
| Reinvestment of distributions | 209,688 | 45,175 | 7,894,748 | 1,246,388 |
| Shares redeemed | (1,139,468) | (1,538,083) | (44,250,742) | (37,609,605) |
| Net increase (decrease) | 1,342,728 | 425,402 | $56,005,804 | $13,059,101 |
| Class M | ||||
| Shares sold | 264,285 | 307,639 | $10,045,601 | $7,466,667 |
| Reinvestment of distributions | 46,894 | 9,966 | 1,671,302 | 261,204 |
| Shares redeemed | (205,061) | (313,869) | (7,535,130) | (7,526,473) |
| Net increase (decrease) | 106,118 | 3,736 | $4,181,773 | $201,398 |
| Class C | ||||
| Shares sold | 603,785 | 708,636 | $20,475,892 | $15,319,387 |
| Reinvestment of distributions | 112,361 | 21,740 | 3,542,734 | 509,143 |
| Shares redeemed | (758,704) | (784,252) | (24,960,249) | (16,605,105) |
| Net increase (decrease) | (42,558) | (53,876) | $(941,623) | $(776,575) |
| Class I | ||||
| Shares sold | 3,218,643 | 2,212,446 | $138,779,272 | $59,935,860 |
| Reinvestment of distributions | 170,390 | 43,044 | 6,832,623 | 1,260,337 |
| Shares redeemed | (2,173,312) | (2,288,478) | (89,960,875) | (59,322,282) |
| Net increase (decrease) | 1,215,721 | (32,988) | $55,651,020 | $1,873,915 |
| Class Z | ||||
| Shares sold | 440,987 | 581,503 | $19,153,328 | $15,181,099 |
| Reinvestment of distributions | 11,859 | 4,479 | 474,851 | 130,911 |
| Shares redeemed | (158,845) | (443,607) | (6,852,204) | (10,785,339) |
| Net increase (decrease) | 294,001 | 142,375 | $12,775,975 | $4,526,671 |
| Fidelity Advisor Technology Fund | ||||
| Class A | ||||
| Shares sold | 3,227,692 | 4,045,407 | $287,807,384 | $244,306,097 |
| Reinvestment of distributions | 1,308,684 | 405,797 | 115,478,310 | 23,718,843 |
| Shares redeemed | (4,026,118) | (3,730,933) | (359,897,290) | (216,583,380) |
| Net increase (decrease) | 510,258 | 720,271 | $43,388,404 | $51,441,560 |
| Class M | ||||
| Shares sold | 1,097,418 | 1,410,824 | $90,166,670 | $79,216,290 |
| Reinvestment of distributions | 530,803 | 156,168 | 43,573,593 | 8,545,526 |
| Shares redeemed | (1,566,784) | (1,596,821) | (129,813,793) | (88,333,760) |
| Net increase (decrease) | 61,437 | (29,829) | $3,926,470 | $(571,944) |
| Class C | ||||
| Shares sold | 926,376 | 1,534,539 | $65,390,790 | $74,482,342 |
| Reinvestment of distributions | 509,178 | 129,222 | 35,688,322 | 6,128,996 |
| Shares redeemed | (1,935,386) | (1,706,549) | (138,574,238) | (80,576,120) |
| Net increase (decrease) | (499,832) | (42,788) | $(37,495,126) | $35,218 |
| Class I | ||||
| Shares sold | 4,485,105 | 6,639,669 | $437,609,448 | $434,536,634 |
| Reinvestment of distributions | 859,806 | 269,988 | 83,530,124 | 17,244,124 |
| Shares redeemed | (4,711,105) | (6,277,501) | (453,488,874) | (401,652,852) |
| Net increase (decrease) | 633,806 | 632,156 | $67,650,698 | $50,127,906 |
| Class Z | ||||
| Shares sold | 2,665,827 | 4,274,206 | $261,760,082 | $266,397,357 |
| Reinvestment of distributions | 257,979 | 60,687 | 25,013,683 | 3,867,591 |
| Shares redeemed | (1,849,927) | (1,311,989) | (179,698,035) | (84,755,784) |
| Net increase (decrease) | 1,073,879 | 3,022,904 | $107,075,730 | $185,509,164 |
| Fidelity Advisor Utilities Fund | ||||
| Class A | ||||
| Shares sold | 1,125,170 | 2,392,457 | $37,451,800 | $77,895,527 |
| Reinvestment of distributions | 150,513 | 152,614 | 4,887,151 | 5,172,093 |
| Shares redeemed | (2,032,740) | (2,875,150) | (65,836,825) | (88,551,028) |
| Net increase (decrease) | (757,057) | (330,079) | $(23,497,874) | $(5,483,408) |
| Class M | ||||
| Shares sold | 192,689 | 475,312 | $6,319,115 | $15,397,803 |
| Reinvestment of distributions | 33,030 | 30,852 | 1,075,800 | 1,048,650 |
| Shares redeemed | (460,032) | (535,502) | (15,128,321) | (16,771,407) |
| Net increase (decrease) | (234,313) | (29,338) | $(7,733,406) | $(324,954) |
| Class C | ||||
| Shares sold | 244,717 | 843,228 | $7,862,719 | $26,750,146 |
| Reinvestment of distributions | 23,775 | 27,506 | 754,630 | 910,715 |
| Shares redeemed | (928,065) | (896,060) | (29,528,468) | (27,330,917) |
| Net increase (decrease) | (659,573) | (25,326) | $(20,911,119) | $329,944 |
| Class I | ||||
| Shares sold | 1,291,889 | 4,228,842 | $43,574,208 | $139,366,410 |
| Reinvestment of distributions | 110,504 | 156,807 | 3,670,947 | 5,431,804 |
| Shares redeemed | (3,326,028) | (5,481,417) | (109,800,472) | (172,916,612) |
| Net increase (decrease) | (1,923,635) | (1,095,768) | $(62,555,317) | $(28,118,398) |
| Class Z | ||||
| Shares sold | 776,806 | 2,355,739 | $25,983,383 | $77,042,807 |
| Reinvestment of distributions | 32,015 | 28,120 | 1,062,593 | 973,507 |
| Shares redeemed | (917,828) | (1,253,225) | (30,619,605) | (38,887,243) |
| Net increase (decrease) | (109,007) | 1,130,634 | $(3,573,629) | $39,129,071 |
12. Other.
Fund's organizational documents provide former and current trustees and officers with a limited indemnification against liabilities arising in connection with the performance of their duties to the fund. In the normal course of business, the fund may also enter into contracts that provide general indemnifications. The fund's maximum exposure under these arrangements is unknown as this would be dependent on future claims that may be made against the fund. The risk of material loss from such claims is considered remote.
In May 2021, Fidelity Advisor Communications Equipment Fund's Board of Trustees approved a Plan of Liquidation and Dissolution whereby the Fund distributed all of its net assets to its shareholders on August 6, 2021.
13. Coronavirus (COVID-19) Pandemic.
An outbreak of COVID-19 first detected in China during December 2019 has since spread globally and was declared a pandemic by the World Health Organization during March 2020. Developments that disrupt global economies and financial markets, such as the COVID-19 pandemic, may magnify factors that affect the Funds' performance.
Report of Independent Registered Public Accounting Firm
To the Board of Trustees of Fidelity Advisor Series VII and the Shareholders of Fidelity Advisor Biotechnology Fund, Fidelity Advisor Communications Equipment Fund, Fidelity Advisor Consumer Discretionary Fund, Fidelity Advisor Energy Fund, Fidelity Advisor Financial Services Fund, Fidelity Advisor Health Care Fund, Fidelity Advisor Industrials Fund, Fidelity Advisor Semiconductors Fund, Fidelity Advisor Technology Fund and Fidelity Advisor Utilities Fund.
Opinion on the Financial Statements and Financial Highlights
We have audited the accompanying statements of assets and liabilities of Fidelity Advisor Biotechnology Fund, Fidelity Advisor Communications Equipment Fund, Fidelity Advisor Consumer Discretionary Fund, Fidelity Advisor Energy Fund, Fidelity Advisor Financial Services Fund, Fidelity Advisor Health Care Fund, Fidelity Advisor Industrials Fund, Fidelity Advisor Semiconductors Fund, Fidelity Advisor Technology Fund and Fidelity Advisor Utilities Fund (the "Funds"), each a fund of Fidelity Advisor Series VII, including the schedules of investments, as of July 31, 2021, the related statements of operations for the year then ended, the statements of changes in net assets for each of the two years in the period then ended, the financial highlights for each of the five years in the period then ended, and the related notes. In our opinion, the financial statements and financial highlights present fairly, in all material respects, the financial position of the Funds as of July 31, 2021, and the results of their operations for the year then ended, the changes in their net assets for each of the two years in the period then ended, and the financial highlights for each of the five years in the period then ended in conformity with accounting principles generally accepted in the United States of America.
Basis for Opinion
These financial statements and financial highlights are the responsibility of the Funds’ management. Our responsibility is to express an opinion on the Funds’ financial statements and financial highlights based on our audits. We are a public accounting firm registered with the Public Company Accounting Oversight Board (United States) (PCAOB) and are required to be independent with respect to the Funds in accordance with the U.S. federal securities laws and the applicable rules and regulations of the Securities and Exchange Commission and the PCAOB.
We conducted our audits in accordance with the standards of the PCAOB. Those standards require that we plan and perform the audit to obtain reasonable assurance about whether the financial statements and financial highlights are free of material misstatement, whether due to error or fraud. The Funds are not required to have, nor were we engaged to perform, an audit of their internal control over financial reporting. As part of our audits we are required to obtain an understanding of internal control over financial reporting but not for the purpose of expressing an opinion on the effectiveness of the Funds’ internal control over financial reporting. Accordingly, we express no such opinion.
Our audits included performing procedures to assess the risks of material misstatement of the financial statements and financial highlights, whether due to error or fraud, and performing procedures that respond to those risks. Such procedures included examining, on a test basis, evidence regarding the amounts and disclosures in the financial statements and financial highlights. Our audits also included evaluating the accounting principles used and significant estimates made by management, as well as evaluating the overall presentation of the financial statements and financial highlights. Our procedures included confirmation of securities owned as of July 31, 2021, by correspondence with the custodian and brokers; when replies were not received from brokers, we performed other auditing procedures. We believe that our audits provide a reasonable basis for our opinion.
/s/ Deloitte & Touche LLP
Boston, Massachusetts
September 14, 2021
We have served as the auditor of one or more of the Fidelity investment companies since 1999.
Trustees and Officers
The Trustees, Members of the Advisory Board (if any), and officers of the trust and funds, as applicable, are listed below. The Board of Trustees governs each fund and is responsible for protecting the interests of shareholders. The Trustees are experienced executives who meet periodically throughout the year to oversee each fund's activities, review contractual arrangements with companies that provide services to each fund, oversee management of the risks associated with such activities and contractual arrangements, and review each fund's performance. Each of the Trustees oversees 314 funds.
The Trustees hold office without limit in time except that (a) any Trustee may resign; (b) any Trustee may be removed by written instrument, signed by at least two-thirds of the number of Trustees prior to such removal; (c) any Trustee who requests to be retired or who has become incapacitated by illness or injury may be retired by written instrument signed by a majority of the other Trustees; and (d) any Trustee may be removed at any special meeting of shareholders by a two-thirds vote of the outstanding voting securities of the trust. Each Trustee who is not an interested person (as defined in the 1940 Act) of the trust and the funds is referred to herein as an Independent Trustee. Each Independent Trustee shall retire not later than the last day of the calendar year in which his or her 75th birthday occurs. The Independent Trustees may waive this mandatory retirement age policy with respect to individual Trustees. Officers and Advisory Board Members hold office without limit in time, except that any officer or Advisory Board Member may resign or may be removed by a vote of a majority of the Trustees at any regular meeting or any special meeting of the Trustees. Except as indicated, each individual has held the office shown or other offices in the same company for the past five years.
Each fund’s Statement of Additional Information (SAI) includes more information about the Trustees. To request a free copy, call Fidelity at 1-877-208-0098.
Experience, Skills, Attributes, and Qualifications of the Trustees. The Governance and Nominating Committee has adopted a statement of policy that describes the experience, qualifications, attributes, and skills that are necessary and desirable for potential Independent Trustee candidates (Statement of Policy). The Board believes that each Trustee satisfied at the time he or she was initially elected or appointed a Trustee, and continues to satisfy, the standards contemplated by the Statement of Policy. The Governance and Nominating Committee also engages professional search firms to help identify potential Independent Trustee candidates who have the experience, qualifications, attributes, and skills consistent with the Statement of Policy. From time to time, additional criteria based on the composition and skills of the current Independent Trustees, as well as experience or skills that may be appropriate in light of future changes to board composition, business conditions, and regulatory or other developments, have also been considered by the professional search firms and the Governance and Nominating Committee. In addition, the Board takes into account the Trustees' commitment and participation in Board and committee meetings, as well as their leadership of standing and ad hoc committees throughout their tenure.
In determining that a particular Trustee was and continues to be qualified to serve as a Trustee, the Board has considered a variety of criteria, none of which, in isolation, was controlling. The Board believes that, collectively, the Trustees have balanced and diverse experience, qualifications, attributes, and skills, which allow the Board to operate effectively in governing each fund and protecting the interests of shareholders. Information about the specific experience, skills, attributes, and qualifications of each Trustee, which in each case led to the Board's conclusion that the Trustee should serve (or continue to serve) as a trustee of the funds, is provided below.
Board Structure and Oversight Function. Robert A. Lawrence is an interested person and currently serves as Acting Chairman. The Trustees have determined that an interested Chairman is appropriate and benefits shareholders because an interested Chairman has a personal and professional stake in the quality and continuity of services provided to the funds. Independent Trustees exercise their informed business judgment to appoint an individual of their choosing to serve as Chairman, regardless of whether the Trustee happens to be independent or a member of management. The Independent Trustees have determined that they can act independently and effectively without having an Independent Trustee serve as Chairman and that a key structural component for assuring that they are in a position to do so is for the Independent Trustees to constitute a substantial majority for the Board. The Independent Trustees also regularly meet in executive session. David M. Thomas serves as Lead Independent Trustee and as such (i) acts as a liaison between the Independent Trustees and management with respect to matters important to the Independent Trustees and (ii) with management prepares agendas for Board meetings.
Fidelity® funds are overseen by different Boards of Trustees. The funds' Board oversees Fidelity's high income and certain equity funds, and other Boards oversee Fidelity's investment-grade bond, money market, asset allocation, and other equity funds. The asset allocation funds may invest in Fidelity® funds overseen by the funds' Board. The use of separate Boards, each with its own committee structure, allows the Trustees of each group of Fidelity® funds to focus on the unique issues of the funds they oversee, including common research, investment, and operational issues. On occasion, the separate Boards establish joint committees to address issues of overlapping consequences for the Fidelity® funds overseen by each Board.
The Trustees operate using a system of committees to facilitate the timely and efficient consideration of all matters of importance to the Trustees, each fund, and fund shareholders and to facilitate compliance with legal and regulatory requirements and oversight of the funds' activities and associated risks. The Board, acting through its committees, has charged FMR and its affiliates with (i) identifying events or circumstances the occurrence of which could have demonstrably adverse effects on the funds' business and/or reputation; (ii) implementing processes and controls to lessen the possibility that such events or circumstances occur or to mitigate the effects of such events or circumstances if they do occur; and (iii) creating and maintaining a system designed to evaluate continuously business and market conditions in order to facilitate the identification and implementation processes described in (i) and (ii) above. Because the day-to-day operations and activities of the funds are carried out by or through FMR, its affiliates, and other service providers, the funds' exposure to risks is mitigated but not eliminated by the processes overseen by the Trustees. While each of the Board's committees has responsibility for overseeing different aspects of the funds' activities, oversight is exercised primarily through the Operations, Audit, and Compliance Committees. Appropriate personnel, including but not limited to the funds' Chief Compliance Officer (CCO), FMR's internal auditor, the independent accountants, the funds' Treasurer and portfolio management personnel, make periodic reports to the Board's committees, as appropriate, including an annual review of Fidelity's risk management program for the Fidelity® funds. The responsibilities of each standing committee, including their oversight responsibilities, are described further under "Standing Committees of the Trustees."
Interested Trustees*:
Correspondence intended for a Trustee who is an interested person may be sent to Fidelity Investments, 245 Summer Street, Boston, Massachusetts 02210.
Name, Year of Birth; Principal Occupations and Other Relevant Experience+
Bettina Doulton (1964)
Year of Election or Appointment: 2020
Trustee
Ms. Doulton also serves as Trustee of other Fidelity® funds. Prior to her retirement, Ms. Doulton served in a variety of positions at Fidelity Investments, including as a managing director of research (2006-2007), portfolio manager to certain Fidelity® funds (1993-2005), equity analyst and portfolio assistant (1990-1993), and research assistant (1987-1990). Ms. Doulton currently owns and operates Phi Builders + Architects and Cellardoor Winery. Previously, Ms. Doulton served as a member of the Board of Brown Capital Management, LLC (2014-2018).
Robert A. Lawrence (1952)
Year of Election or Appointment: 2020
Trustee
Acting Chairman of the Board of Trustees
Mr. Lawrence also serves as Trustee of other funds. Previously, Mr. Lawrence served as a Member of the Advisory Board of certain funds. Prior to his retirement in 2008, Mr. Lawrence served as Vice President of certain Fidelity® funds (2006-2008), Senior Vice President, Head of High Income Division of Fidelity Management & Research Company (investment adviser firm, 2006-2008), and President of Fidelity Strategic Investments (investment adviser firm, 2002-2005).
* Determined to be an “Interested Trustee” by virtue of, among other things, his or her affiliation with the trust or various entities under common control with FMR.
+ The information includes the Trustee's principal occupation during the last five years and other information relating to the experience, attributes, and skills relevant to the Trustee's qualifications to serve as a Trustee, which led to the conclusion that the Trustee should serve as a Trustee for each fund.
Independent Trustees:
Correspondence intended for an Independent Trustee may be sent to Fidelity Investments, P.O. Box 55235, Boston, Massachusetts 02205-5235.
Name, Year of Birth; Principal Occupations and Other Relevant Experience+
Thomas P. Bostick (1956)
Year of Election or Appointment: 2021
Trustee
Lieutenant General Bostick also serves as Trustee of other Fidelity® funds. Prior to his retirement, General Bostick (United States Army, Retired) held a variety of positions within the U.S. Army, including Commanding General and Chief of Engineers, U.S. Army Corps of Engineers (2012-2016) and Deputy Chief of Staff and Director of Human Resources, U.S. Army (2009-2012). General Bostick currently serves as a member of the Board and Finance and Governance Committees of CSX Corporation (transportation, 2020-present) and a member of the Board and Corporate Governance and Nominating Committee of Perma-Fix Environmental Services, Inc. (nuclear waste management, 2020-present). General Bostick serves as Chief Executive Officer of Bostick Global Strategies, LLC (consulting, 2016-present) and Managing Partner, Sustainability, of Ridge-Lane Limited Partners (strategic advisory and venture development, 2016-present). Previously, General Bostick served as a Member of the Advisory Board of certain Fidelity® funds (2021), President, Intrexon Bioengineering (2018-2020) and Chief Operating Officer (2017-2020) and Senior Vice President of the Environment Sector (2016-2017) of Intrexon Corporation (biopharmaceutical company).
Dennis J. Dirks (1948)
Year of Election or Appointment: 2018
Trustee
Mr. Dirks also serves as Trustee of other Fidelity® funds. Prior to his retirement in May 2003, Mr. Dirks served as Chief Operating Officer and as a member of the Board of The Depository Trust & Clearing Corporation (financial markets infrastructure), President, Chief Operating Officer and a member of the Board of The Depository Trust Company (DTC), President and a member of the Board of the National Securities Clearing Corporation (NSCC), Chief Executive Officer and a member of the Board of the Government Securities Clearing Corporation and Chief Executive Officer and a member of the Board of the Mortgage-Backed Securities Clearing Corporation. Mr. Dirks currently serves as a member of the Finance Committee (2016-present) and Board (2017-present) and is Treasurer (2018-present) of the Asolo Repertory Theatre.
Donald F. Donahue (1950)
Year of Election or Appointment: 2018
Trustee
Mr. Donahue also serves as Trustee of other Fidelity® funds. Mr. Donahue serves as President and Chief Executive Officer of Miranda Partners, LLC (risk consulting for the financial services industry, 2012-present). Previously, Mr. Donahue served as Chief Executive Officer (2006-2012), Chief Operating Officer (2003-2006) and Managing Director, Customer Marketing and Development (1999-2003) of The Depository Trust & Clearing Corporation (financial markets infrastructure). Mr. Donahue currently serves as a member (2007-present) and Co-Chairman (2016-present) of the Board of United Way of New York and a member of the Board of NYC Leadership Academy (2012-present). Mr. Donahue previously served as a member of the Advisory Board of certain Fidelity® funds (2015-2018).
Vicki L. Fuller (1957)
Year of Election or Appointment: 2020
Trustee
Ms. Fuller also serves as Trustee of other Fidelity® funds. Previously, Ms. Fuller served as a member of the Advisory Board of certain Fidelity® funds (2018-2020), Chief Investment Officer of the New York State Common Retirement Fund (2012-2018) and held a variety of positions at AllianceBernstein L.P. (global asset management, 1985-2012), including Managing Director (2006-2012) and Senior Vice President and Senior Portfolio Manager (2001-2006). Ms. Fuller currently serves as a member of the Board, Audit Committee and Nominating and Governance Committee of The Williams Companies, Inc. (natural gas infrastructure, 2018-present), as a member of the Board, Audit Committee and Nominating and Governance Committee of two Blackstone business development companies (2020-present) and as a member of the Board of Treliant, LLC (consulting, 2019-present).
Patricia L. Kampling (1959)
Year of Election or Appointment: 2020
Trustee
Ms. Kampling also serves as Trustee of other Fidelity® funds. Prior to her retirement, Ms. Kampling served as Chairman of the Board and Chief Executive Officer (2012-2019), President and Chief Operating Officer (2011-2012) and Executive Vice President and Chief Financial Officer (2010-2011) of Alliant Energy Corporation. Ms. Kampling currently serves as a member of the Board, Finance Committee and Governance, Compensation and Nominating Committee of Xcel Energy Inc. (utilities company, 2020-present) and as a member of the Board, Audit, Finance and Risk Committee and Safety, Environmental, Technology and Operations Committee of American Water Works Company, Inc. (utilities company, 2019-present). In addition, Ms. Kampling currently serves as a member of the Board of the Nature Conservancy, Wisconsin Chapter (2019-present). Previously, Ms. Kampling served as a Member of the Advisory Board of certain Fidelity® funds (2020), a member of the Board, Compensation Committee and Executive Committee and Chair of the Audit Committee of Briggs & Stratton Corporation (manufacturing, 2011-2021), a member of the Board of Interstate Power and Light Company (2012-2019) and Wisconsin Power and Light Company (2012-2019) (each a subsidiary of Alliant Energy Corporation) and as a member of the Board and Workforce Development Committee of the Business Roundtable (2018-2019).
Thomas A. Kennedy (1955)
Year of Election or Appointment: 2021
Trustee
Mr. Kennedy also serves as Trustee of other Fidelity® funds. Previously, Mr. Kennedy served as a Member of the Advisory Board of certain Fidelity® funds (2020) and held a variety of positions at Raytheon Company (aerospace and defense, 1983-2020), including Chairman and Chief Executive Officer (2014-2020) and Executive Vice President and Chief Operating Officer (2013-2014). Mr. Kennedy currently serves as Executive Chairman of the Board of Directors of Raytheon Technologies Corporation (aerospace and defense, 2020-present). He is also a member of the Rutgers School of Engineering Industry Advisory Board (2011-present) and a member of the UCLA Engineering Dean’s Executive Board (2016-present).
Oscar Munoz (1959)
Year of Election or Appointment: 2021
Trustee
Mr. Munoz also serves as Trustee of other Fidelity® funds. Prior to his retirement, Mr. Munoz served as Executive Chairman (2020-2021), Chief Executive Officer (2015-2020), President (2015-2016) and a member of the Board (2010-2021) of United Airlines Holdings, Inc. Mr. Munoz currently serves as a member of the Board of CBRE Group, Inc. (commercial real estate, 2020-present), a member of the Board of Univision Communications, Inc. (Hispanic media, 2020-present) and a member of the Advisory Board of Salesforce.com, Inc. (cloud-based software, 2020-present). Previously, Mr. Munoz served as a Member of the Advisory Board of certain Fidelity® funds (2021).
Garnett A. Smith (1947)
Year of Election or Appointment: 2013
Trustee
Mr. Smith also serves as Trustee of other Fidelity® funds. Prior to his retirement, Mr. Smith served as Chairman and Chief Executive Officer (1990-1997) and President (1986-1990) of Inbrand Corp. (manufacturer of personal absorbent products). Prior to his employment with Inbrand Corp., he was employed by a retail fabric chain and North Carolina National Bank (now Bank of America). Mr. Smith previously served as a member of the Advisory Board of certain Fidelity® funds (2012-2013).
David M. Thomas (1949)
Year of Election or Appointment: 2018
Trustee
Lead Independent Trustee
Mr. Thomas also serves as Trustee of other Fidelity® funds. Previously, Mr. Thomas served as Executive Chairman (2005-2006) and Chairman and Chief Executive Officer (2000-2005) of IMS Health, Inc. (pharmaceutical and healthcare information solutions). Mr. Thomas currently serves as a member of the Board of Fortune Brands Home and Security (home and security products, 2004-present) and Presiding Director (2013-present) of Interpublic Group of Companies, Inc. (marketing communication).
Susan Tomasky (1953)
Year of Election or Appointment: 2020
Trustee
Ms. Tomasky also serves as Trustee of other Fidelity® funds. Prior to her retirement, Ms. Tomasky served in various executive officer positions at American Electric Power Company, Inc. (1998-2011), including most recently as President of AEP Transmission (2007-2011). Ms. Tomasky currently serves as a member of the Board and Sustainability Committee and as Chair of the Audit Committee of Marathon Petroleum Corporation (2018-present) and as a member of the Board, Corporate Governance Committee and Organization and Compensation Committee and as Chair of the Audit Committee of Public Service Enterprise Group, Inc. (utilities company, 2012-present). In addition, Ms. Tomasky currently serves as a member (2009-present) and President (2020-present) of the Board of the Royal Shakespeare Company – America (2009-present), as a member of the Board of the Columbus Association for the Performing Arts (2011-present) and as a member of the Board and Investment Committee of Kenyon College (2016-present). Previously, Ms. Tomasky served as a Member of the Advisory Board of certain Fidelity® funds (2020), as a member of the Board of the Columbus Regional Airport Authority (2007-2020), as a member of the Board (2011-2018) and Lead Independent Director (2015-2018) of Andeavor Corporation (previously Tesoro Corporation) (independent oil refiner and marketer) and as a member of the Board of Summit Midstream Partners LP (energy, 2012-2018).
Michael E. Wiley (1950)
Year of Election or Appointment: 2008
Trustee
Mr. Wiley also serves as Trustee of other Fidelity® funds. Previously, Mr. Wiley served as a member of the Advisory Board of certain Fidelity® funds (2018-2020), Chairman, President and CEO of Baker Hughes, Inc. (oilfield services, 2000-2004). Mr. Wiley also previously served as a member of the Board of Andeavor Corporation (independent oil refiner and marketer, 2005-2018), a member of the Board of Andeavor Logistics LP (natural resources logistics, 2015-2018) and a member of the Board of High Point Resources (exploration and production, 2005-2020).
+ The information includes the Trustee's principal occupation during the last five years and other information relating to the experience, attributes, and skills relevant to the Trustee's qualifications to serve as a Trustee, which led to the conclusion that the Trustee should serve as a Trustee for each fund.
Advisory Board Members and Officers:
Correspondence intended for a Member of the Advisory Board (if any) may be sent to Fidelity Investments, P.O. Box 55235, Boston, Massachusetts 02205-5235. Correspondence intended for an officer or Peter S. Lynch may be sent to Fidelity Investments, 245 Summer Street, Boston, Massachusetts 02210. Officers appear below in alphabetical order.
Name, Year of Birth; Principal Occupation
Peter S. Lynch (1944)
Year of Election or Appointment: 2018
Member of the Advisory Board
Mr. Lynch also serves as a Member of the Advisory Board of other Fidelity® funds. Mr. Lynch is Vice Chairman and a Director of Fidelity Management & Research Company LLC (investment adviser firm). In addition, Mr. Lynch serves as a Trustee of Boston College and as the Chairman of the Inner-City Scholarship Fund. Previously, Mr. Lynch served as Vice Chairman and a Director of FMR Co., Inc. (investment adviser firm) and on the Special Olympics International Board of Directors (1997-2006).
Craig S. Brown (1977)
Year of Election or Appointment: 2019
Assistant Treasurer
Mr. Brown also serves as an officer of other funds. Mr. Brown serves as Assistant Treasurer of FIMM, LLC (2021-present) and is an employee of Fidelity Investments (2013-present).
John J. Burke III (1964)
Year of Election or Appointment: 2018
Chief Financial Officer
Mr. Burke also serves as Chief Financial Officer of other funds. Mr. Burke serves as Head of Investment Operations for Fidelity Fund and Investment Operations (2018-present) and is an employee of Fidelity Investments (1998-present). Previously Mr. Burke served as head of Asset Management Investment Operations (2012-2018).
William C. Coffey (1969)
Year of Election or Appointment: 2019
Assistant Secretary
Mr. Coffey also serves as Assistant Secretary of other funds. He is Senior Vice President and Deputy General Counsel of FMR LLC (diversified financial services company, 2010-present), and is an employee of Fidelity Investments. Previously, Mr. Coffey served as Secretary and CLO of certain funds (2018-2019); CLO, Secretary, and Senior Vice President of Fidelity Management & Research Company and FMR Co., Inc. (investment adviser firms, 2018-2019); Secretary of Fidelity SelectCo, LLC and Fidelity Investments Money Management, Inc. (investment adviser firms, 2018-2019); CLO of Fidelity Management & Research (Hong Kong) Limited, FMR Investment Management (UK) Limited, and Fidelity Management & Research (Japan) Limited (investment adviser firms, 2018-2019); and Assistant Secretary of certain funds (2009-2018).
Timothy M. Cohen (1969)
Year of Election or Appointment: 2018
Vice President
Mr. Cohen also serves as Vice President of other funds. Mr. Cohen serves as Co-Head of Equity (2018-present), a Director of Fidelity Management & Research (Japan) Limited (investment adviser firm, 2016-present), and is an employee of Fidelity Investments. Previously, Mr. Cohen served as Executive Vice President of Fidelity SelectCo, LLC (2019), Head of Global Equity Research (2016-2018), Chief Investment Officer - Equity and a Director of Fidelity Management & Research (U.K.) Inc. (investment adviser firm, 2013-2015) and as a Director of Fidelity Management & Research (Hong Kong) Limited (investment adviser firm, 2017).
Jonathan Davis (1968)
Year of Election or Appointment: 2010
Assistant Treasurer
Mr. Davis also serves as an officer of other funds. Mr. Davis serves as Assistant Treasurer of FIMM, LLC (2021-present) and FMR Capital, Inc. (2017-present) and is an employee of Fidelity Investments. Previously, Mr. Davis served as Vice President and Associate General Counsel of FMR LLC (diversified financial services company, 2003-2010).
Laura M. Del Prato (1964)
Year of Election or Appointment: 2018
Assistant Treasurer
Ms. Del Prato also serves as an officer of other funds. Ms. Del Prato serves as Assistant Treasurer of FIMM, LLC (2021-present) and is an employee of Fidelity Investments (2017-present). Previously, Ms. Del Prato served as President and Treasurer of The North Carolina Capital Management Trust: Cash Portfolio and Term Portfolio (2018-2020). Prior to joining Fidelity Investments, Ms. Del Prato served as a Managing Director and Treasurer of the JPMorgan Mutual Funds (2014-2017). Prior to JPMorgan, Ms. Del Prato served as a partner at Cohen Fund Audit Services (accounting firm, 2012-2013) and KPMG LLP (accounting firm, 2004-2012).
Colm A. Hogan (1973)
Year of Election or Appointment: 2020
Assistant Treasurer
Mr. Hogan also serves as an officer of other funds. Mr. Hogan serves as Assistant Treasurer of FIMM, LLC (2021-present) and FMR Capital, Inc. (2017-present) and is an employee of Fidelity Investments (2005-present). Previously, Mr. Hogan served as Deputy Treasurer of certain Fidelity® funds (2016-2020) and Assistant Treasurer of certain Fidelity® funds (2016-2018).
Pamela R. Holding (1964)
Year of Election or Appointment: 2018
Vice President
Ms. Holding also serves as Vice President of other funds. Ms. Holding serves as Co-Head of Equity (2018-present) and is an employee of Fidelity Investments (2013-present). Previously, Ms. Holding served as Executive Vice President of Fidelity SelectCo, LLC (2019) and as Chief Investment Officer of Fidelity Institutional Asset Management (2013-2018).
Cynthia Lo Bessette (1969)
Year of Election or Appointment: 2019
Secretary and Chief Legal Officer (CLO)
Ms. Lo Bessette also serves as an officer of other funds. Ms. Lo Bessette serves as CLO, Secretary, and Senior Vice President of Fidelity Management & Research Company LLC (investment adviser firm, 2019-present); and CLO of Fidelity Management & Research (Hong Kong) Limited, FMR Investment Management (UK) Limited, and Fidelity Management & Research (Japan) Limited (investment adviser firms, 2019-present). She is a Senior Vice President and Deputy General Counsel of FMR LLC (diversified financial services company, 2019-present), and is an employee of Fidelity Investments. Previously, Ms. Lo Bessette served as CLO, Secretary, and Senior Vice President of FMR Co., Inc. (investment adviser firm, 2019); Secretary of Fidelity SelectCo, LLC and Fidelity Investments Money Management, Inc. (investment adviser firms, 2019). Prior to joining Fidelity Investments, Ms. Lo Bessette was Executive Vice President, General Counsel (2016-2019) and Senior Vice President, Deputy General Counsel (2015-2016) of OppenheimerFunds (investment management company) and Deputy Chief Legal Officer (2013-2015) of Jennison Associates LLC (investment adviser firm).
Chris Maher (1972)
Year of Election or Appointment: 2020
Deputy Treasurer
Mr. Maher also serves as an officer of other funds. Mr. Maher serves as Assistant Treasurer of FIMM, LLC (2021-present) and FMR Capital, Inc. (2017-present), and is an employee of Fidelity Investments (2008-present). Previously, Mr. Maher served as Assistant Treasurer of certain funds (2013-2020); Vice President of Asset Management Compliance (2013), Vice President of the Program Management Group of FMR (investment adviser firm, 2010-2013), and Vice President of Valuation Oversight (2008-2010).
Jason P. Pogorelec (1975)
Year of Election or Appointment: 2020
Chief Compliance Officer
Mr. Pogorelec also serves as Chief Compliance Officer of other funds. Mr. Pogorelec is a senior Vice President of Asset Management Compliance for Fidelity Investments and is an employee of Fidelity Investments (2006-present). Previously, Mr. Pogorelec served as Vice President, Associate General Counsel for Fidelity Investments (2010-2020) and Assistant Secretary of certain Fidelity funds (2015-2020).
Brett Segaloff (1972)
Year of Election or Appointment: 2021
Anti-Money Laundering (AML) Officer
Mr. Segaloff also serves as an AML Officer of other funds and other related entities. He is Director, Anti-Money Laundering (2007-present) of FMR LLC (diversified financial services company) and is an employee of Fidelity Investments (1996-present).
Stacie M. Smith (1974)
Year of Election or Appointment: 2018
President and Treasurer
Ms. Smith also serves as an officer of other funds. Ms. Smith serves as Assistant Treasurer of FIMM, LLC (2021-present) and FMR Capital, Inc. (2017-present), is an employee of Fidelity Investments (2009-present), and has served in other fund officer roles. Prior to joining Fidelity Investments, Ms. Smith served as Senior Audit Manager of Ernst & Young LLP (accounting firm, 1996-2009). Previously, Ms. Smith served as Assistant Treasurer (2013-2019) and Deputy Treasurer (2013-2016) of certain Fidelity® funds.
Marc L. Spector (1972)
Year of Election or Appointment: 2017
Assistant Treasurer
Mr. Spector also serves as an officer of other funds. Mr. Spector serves as Assistant Treasurer of FIMM, LLC (2021-present) and FMR Capital, Inc. (2017-present) and is an employee of Fidelity Investments (2016-present). Prior to joining Fidelity Investments, Mr. Spector served as Director at the Siegfried Group (accounting firm, 2013-2016), and prior to Siegfried Group as audit senior manager at Deloitte & Touche LLP (accounting firm, 2005-2013).
Jim Wegmann (1979)
Year of Election or Appointment: 2019
Assistant Treasurer
Mr. Wegmann also serves as an officer of other funds. Mr. Wegmann serves as Assistant Treasurer of FIMM, LLC (2021-present) and is an employee of Fidelity Investments (2011-present).
Shareholder Expense Example
As a shareholder, you incur two types of costs: (1) transaction costs, which may include sales charges (loads) on purchase payments or redemption proceeds, as applicable and (2) ongoing costs, which generally include management fees, distribution and/or service (12b-1) fees and other Fund expenses. This Example is intended to help you understand your ongoing costs (in dollars) of investing in a fund and to compare these costs with the ongoing costs of investing in other mutual funds.
The Example is based on an investment of $1,000 invested at the beginning of the period and held for the entire period (February 1, 2021 to July 31, 2021).
Actual Expenses
The first line of the accompanying table provides information about actual account values and actual expenses. You may use the information in this line, together with the amount you invested, to estimate the expenses that you paid over the period. Simply divide your account value by $1,000.00 (for example, an $8,600 account value divided by $1,000.00 = 8.6), then multiply the result by the number in the first line for a class/Fund under the heading entitled "Expenses Paid During Period" to estimate the expenses you paid on your account during this period. If any fund is a shareholder of any underlying mutual funds or exchange-traded funds (ETFs) (the Underlying Funds), such fund indirectly bears its proportional share of the expenses of the Underlying Funds in addition to the direct expenses incurred presented in the table. These fees and expenses are not included in the annualized expense ratio used to calculate the expense estimate in the table below.
Hypothetical Example for Comparison Purposes
The second line of the accompanying table provides information about hypothetical account values and hypothetical expenses based on the actual expense ratio and an assumed rate of return of 5% per year before expenses, which is not the actual return. The hypothetical account values and expenses may not be used to estimate the actual ending account balance or expenses you paid for the period. You may use this information to compare the ongoing costs of investing in the Fund and other funds. To do so, compare this 5% hypothetical example with the 5% hypothetical examples that appear in the shareholder reports of the other funds. If any fund is a shareholder of any Underlying Funds, such fund indirectly bears its proportional share of the expenses of the Underlying Funds in addition to the direct expenses as presented in the table. These fees and expenses are not included in the annualized expense ratio used to calculate the expense estimate in the table below.
Please note that the expenses shown in the table are meant to highlight your ongoing costs only and do not reflect any transaction costs. Therefore, the second line of the table is useful in comparing ongoing costs only, and will not help you determine the relative total costs of owning different funds. In addition, if these transactional costs were included, your costs would have been higher.
| Annualized Expense Ratio-A | Beginning Account Value February 1, 2021 | Ending Account Value July 31, 2021 | Expenses Paid During Period-B February 1, 2021 to July 31, 2021 |
|
| Fidelity Advisor Biotechnology Fund | ||||
| Class A | 1.00% | |||
| Actual | $1,000.00 | $958.10 | $4.86 | |
| Hypothetical-C | $1,000.00 | $1,019.84 | $5.01 | |
| Class M | 1.27% | |||
| Actual | $1,000.00 | $956.50 | $6.16 | |
| Hypothetical-C | $1,000.00 | $1,018.50 | $6.36 | |
| Class C | 1.75% | |||
| Actual | $1,000.00 | $954.30 | $8.48 | |
| Hypothetical-C | $1,000.00 | $1,016.12 | $8.75 | |
| Class I | .74% | |||
| Actual | $1,000.00 | $959.10 | $3.59 | |
| Hypothetical-C | $1,000.00 | $1,021.12 | $3.71 | |
| Class Z | .61% | |||
| Actual | $1,000.00 | $959.70 | $2.96 | |
| Hypothetical-C | $1,000.00 | $1,021.77 | $3.06 | |
| Fidelity Advisor Communications Equipment Fund | ||||
| Class A | 1.40% | |||
| Actual | $1,000.00 | $1,149.30 | $7.46 | |
| Hypothetical-C | $1,000.00 | $1,017.85 | $7.00 | |
| Class M | 1.65% | |||
| Actual | $1,000.00 | $1,148.20 | $8.79 | |
| Hypothetical-C | $1,000.00 | $1,016.61 | $8.25 | |
| Class C | 2.16% | |||
| Actual | $1,000.00 | $1,145.60 | $11.49 | |
| Hypothetical-C | $1,000.00 | $1,014.08 | $10.79 | |
| Class I | 1.15% | |||
| Actual | $1,000.00 | $1,151.00 | $6.13 | |
| Hypothetical-C | $1,000.00 | $1,019.09 | $5.76 | |
| Fidelity Advisor Consumer Discretionary Fund | ||||
| Class A | 1.01% | |||
| Actual | $1,000.00 | $1,122.50 | $5.32 | |
| Hypothetical-C | $1,000.00 | $1,019.79 | $5.06 | |
| Class M | 1.27% | |||
| Actual | $1,000.00 | $1,121.10 | $6.68 | |
| Hypothetical-C | $1,000.00 | $1,018.50 | $6.36 | |
| Class C | 1.77% | |||
| Actual | $1,000.00 | $1,118.00 | $9.30 | |
| Hypothetical-C | $1,000.00 | $1,016.02 | $8.85 | |
| Class I | .75% | |||
| Actual | $1,000.00 | $1,123.80 | $3.95 | |
| Hypothetical-C | $1,000.00 | $1,021.08 | $3.76 | |
| Class Z | .63% | |||
| Actual | $1,000.00 | $1,124.60 | $3.32 | |
| Hypothetical-C | $1,000.00 | $1,021.67 | $3.16 | |
| Fidelity Advisor Energy Fund | ||||
| Class A | 1.08% | |||
| Actual | $1,000.00 | $1,258.80 | $6.05 | |
| Hypothetical-C | $1,000.00 | $1,019.44 | $5.41 | |
| Class M | 1.35% | |||
| Actual | $1,000.00 | $1,257.10 | $7.56 | |
| Hypothetical-C | $1,000.00 | $1,018.10 | $6.76 | |
| Class C | 1.80% | |||
| Actual | $1,000.00 | $1,254.40 | $10.06 | |
| Hypothetical-C | $1,000.00 | $1,015.87 | $9.00 | |
| Class I | .76% | |||
| Actual | $1,000.00 | $1,260.70 | $4.26 | |
| Hypothetical-C | $1,000.00 | $1,021.03 | $3.81 | |
| Class Z | .63% | |||
| Actual | $1,000.00 | $1,261.90 | $3.53 | |
| Hypothetical-C | $1,000.00 | $1,021.67 | $3.16 | |
| Fidelity Advisor Financial Services Fund | ||||
| Class A | 1.04% | |||
| Actual | $1,000.00 | $1,262.10 | $5.83 | |
| Hypothetical-C | $1,000.00 | $1,019.64 | $5.21 | |
| Class M | 1.29% | |||
| Actual | $1,000.00 | $1,260.90 | $7.23 | |
| Hypothetical-C | $1,000.00 | $1,018.40 | $6.46 | |
| Class C | 1.79% | |||
| Actual | $1,000.00 | $1,257.40 | $10.02 | |
| Hypothetical-C | $1,000.00 | $1,015.92 | $8.95 | |
| Class I | .77% | |||
| Actual | $1,000.00 | $1,263.80 | $4.32 | |
| Hypothetical-C | $1,000.00 | $1,020.98 | $3.86 | |
| Class Z | .63% | |||
| Actual | $1,000.00 | $1,264.80 | $3.54 | |
| Hypothetical-C | $1,000.00 | $1,021.67 | $3.16 | |
| Fidelity Advisor Health Care Fund | ||||
| Class A | .97% | |||
| Actual | $1,000.00 | $1,073.40 | $4.99 | |
| Hypothetical-C | $1,000.00 | $1,019.98 | $4.86 | |
| Class M | 1.22% | |||
| Actual | $1,000.00 | $1,072.10 | $6.27 | |
| Hypothetical-C | $1,000.00 | $1,018.74 | $6.11 | |
| Class C | 1.73% | |||
| Actual | $1,000.00 | $1,069.30 | $8.88 | |
| Hypothetical-C | $1,000.00 | $1,016.22 | $8.65 | |
| Class I | .72% | |||
| Actual | $1,000.00 | $1,074.80 | $3.70 | |
| Hypothetical-C | $1,000.00 | $1,021.22 | $3.61 | |
| Class Z | .59% | |||
| Actual | $1,000.00 | $1,075.30 | $3.04 | |
| Hypothetical-C | $1,000.00 | $1,021.87 | $2.96 | |
| Fidelity Advisor Industrials Fund | ||||
| Class A | 1.02% | |||
| Actual | $1,000.00 | $1,167.60 | $5.48 | |
| Hypothetical-C | $1,000.00 | $1,019.74 | $5.11 | |
| Class M | 1.27% | |||
| Actual | $1,000.00 | $1,166.10 | $6.82 | |
| Hypothetical-C | $1,000.00 | $1,018.50 | $6.36 | |
| Class C | 1.77% | |||
| Actual | $1,000.00 | $1,163.00 | $9.49 | |
| Hypothetical-C | $1,000.00 | $1,016.02 | $8.85 | |
| Class I | .75% | |||
| Actual | $1,000.00 | $1,168.90 | $4.03 | |
| Hypothetical-C | $1,000.00 | $1,021.08 | $3.76 | |
| Class Z | .62% | |||
| Actual | $1,000.00 | $1,169.90 | $3.34 | |
| Hypothetical-C | $1,000.00 | $1,021.72 | $3.11 | |
| Fidelity Advisor Semiconductors Fund | ||||
| Class A | 1.02% | |||
| Actual | $1,000.00 | $1,195.80 | $5.55 | |
| Hypothetical-C | $1,000.00 | $1,019.74 | $5.11 | |
| Class M | 1.27% | |||
| Actual | $1,000.00 | $1,194.10 | $6.91 | |
| Hypothetical-C | $1,000.00 | $1,018.50 | $6.36 | |
| Class C | 1.77% | |||
| Actual | $1,000.00 | $1,191.00 | $9.62 | |
| Hypothetical-C | $1,000.00 | $1,016.02 | $8.85 | |
| Class I | .75% | |||
| Actual | $1,000.00 | $1,197.30 | $4.09 | |
| Hypothetical-C | $1,000.00 | $1,021.08 | $3.76 | |
| Class Z | .63% | |||
| Actual | $1,000.00 | $1,198.10 | $3.43 | |
| Hypothetical-C | $1,000.00 | $1,021.67 | $3.16 | |
| Fidelity Advisor Technology Fund | ||||
| Class A | .97% | |||
| Actual | $1,000.00 | $1,161.90 | $5.20 | |
| Hypothetical-C | $1,000.00 | $1,019.98 | $4.86 | |
| Class M | 1.22% | |||
| Actual | $1,000.00 | $1,160.50 | $6.54 | |
| Hypothetical-C | $1,000.00 | $1,018.74 | $6.11 | |
| Class C | 1.74% | |||
| Actual | $1,000.00 | $1,157.50 | $9.31 | |
| Hypothetical-C | $1,000.00 | $1,016.17 | $8.70 | |
| Class I | .71% | |||
| Actual | $1,000.00 | $1,163.40 | $3.81 | |
| Hypothetical-C | $1,000.00 | $1,021.27 | $3.56 | |
| Class Z | .60% | |||
| Actual | $1,000.00 | $1,164.10 | $3.22 | |
| Hypothetical-C | $1,000.00 | $1,021.82 | $3.01 | |
| Fidelity Advisor Utilities Fund | ||||
| Class A | 1.03% | |||
| Actual | $1,000.00 | $1,053.10 | $5.24 | |
| Hypothetical-C | $1,000.00 | $1,019.69 | $5.16 | |
| Class M | 1.31% | |||
| Actual | $1,000.00 | $1,051.40 | $6.66 | |
| Hypothetical-C | $1,000.00 | $1,018.30 | $6.56 | |
| Class C | 1.78% | |||
| Actual | $1,000.00 | $1,049.30 | $9.04 | |
| Hypothetical-C | $1,000.00 | $1,015.97 | $8.90 | |
| Class I | .75% | |||
| Actual | $1,000.00 | $1,054.50 | $3.82 | |
| Hypothetical-C | $1,000.00 | $1,021.08 | $3.76 | |
| Class Z | .62% | |||
| Actual | $1,000.00 | $1,055.20 | $3.16 | |
| Hypothetical-C | $1,000.00 | $1,021.72 | $3.11 |
A Annualized expense ratio reflects expenses net of applicable fee waivers.
B Expenses are equal to the annualized expense ratio, multiplied by the average account value over the period, multiplied by 181/ 365 (to reflect the one-half year period). The fees and expenses of any Underlying Funds are not included in each annualized expense ratio.
C 5% return per year before expenses
Distributions (Unaudited)
The Board of Trustees of the following fund voted to pay to shareholders of record at the opening of business on record date, the following distributions per share derived from capital gains realized from sales of portfolio:
| Pay Date | Record Date | Capital Gains | |
| Fidelity Advisor Communications Equipment Fund | |||
| Class A | 08/05/21 | 08/04/21 | $0.920 |
| Class M | 08/05/21 | 08/04/21 | $0.893 |
| Class C | 08/05/21 | 08/04/21 | $0.787 |
| Class I | 08/05/21 | 08/04/21 | $0.961 |
The funds hereby designate as capital gain dividend the amounts noted below for the taxable year ended July 31, 2021, or, if subsequently determined to be different, the net capital gain of such year.
| Fidelity Advisor Biotechnology Fund | $325,313,845 |
| Fidelity Advisor Communications Equipment Fund | $777,331 |
| Fidelity Advisor Consumer Discretionary Fund | $25,934,007 |
| Fidelity Advisor Financial Services Fund | $4,693,924 |
| Fidelity Advisor Health Care Fund | $467,740,434 |
| Fidelity Advisor Industrials Fund | $86,278,461 |
| Fidelity Advisor Semiconductors Fund | $24,841,758 |
| Fidelity Advisor Technology Fund | $389,583,195 |
| Fidelity Advisor Utilities Fund | $5,342,294 |
A percentage of the dividends distributed during the fiscal year for the following funds qualify for the dividends–received deduction for corporate shareholders:
| Class A | Class M | Class C | Class I | Class Z | |
| Fidelity Advisor Biotechnology Fund | |||||
| December 2020 | 8% | 8% | 8% | 8% | 7% |
| Fidelity Advisor Communications Equipment Fund | |||||
| December 2020 | – | – | – | – | – |
| Fidelity Advisor Consumer Discretionary Fund | |||||
| December 2020 | – | – | – | – | – |
| Fidelity Advisor Energy Fund | |||||
| December 2020 | 100% | 100% | 100% | 100% | 98% |
| Fidelity Advisor Financial Services Fund | |||||
| December 2020 | 100% | 100% | 100% | 100% | 100% |
| Fidelity Advisor Health Care Fund | |||||
| December 2020 | 47% | 65% | 100% | 36% | 33% |
| Fidelity Advisor Industrials Fund | |||||
| December 2020 | – | – | – | – | – |
| Fidelity Advisor Semiconductors Fund | |||||
| December 2020 | 100% | 100% | – | 100% | 100% |
| Fidelity Advisor Technology Fund | |||||
| December 2020 | 24% | 27% | 31% | 22% | 21% |
| Fidelity Advisor Utilities Fund | |||||
| December 2020 | 100% | 100% | 100% | 100% | 100% |
A percentage of the dividends distributed during the fiscal year for the following funds may be taken into account as a dividend for purposes of the maximum rate under section 1(h)(11) of the Internal Revenue Code.
| Class A | Class M | Class C | Class I | Class Z | |
| Fidelity Advisor Biotechnology Fund | |||||
| December 2020 | 8% | 9% | 9% | 8% | 8% |
| Fidelity Advisor Communications Equipment Fund | |||||
| December 2020 | – | – | – | – | – |
| Fidelity Advisor Consumer Discretionary Fund | |||||
| December 2020 | – | – | – | – | – |
| Fidelity Advisor Energy Fund | |||||
| December 2020 | 100% | 100% | 100% | 100% | 100% |
| Fidelity Advisor Financial Services Fund | |||||
| December 2020 | 100% | 100% | 100% | 100% | 100% |
| Fidelity Advisor Health Care Fund | |||||
| December 2020 | 78% | 100% | 100% | 60% | 54% |
| Fidelity Advisor Industrials Fund | |||||
| December 2020 | – | – | – | – | – |
| Fidelity Advisor Semiconductors Fund | |||||
| December 2020 | 100% | 100% | – | 100% | 100% |
| Fidelity Advisor Technology Fund | |||||
| December 2020 | 28% | 30% | 35% | 25% | 24% |
| Fidelity Advisor Utilities Fund | |||||
| December 2020 | 100% | 100% | 100% | 100% | 100% |
The funds hereby designate the percentages noted below of the short-term capital gain dividends distributed during the fiscal year as qualifying to be taxed as short-term capital gain dividends for nonresident alien shareholders:
| December, 2020 | |
| Fidelity Advisor Biotechnology Fund | 100% |
| Fidelity Advisor Health Care Fund | 100% |
| Fidelity Advisor Semiconductors Fund | 100% |
| Fidelity Advisor Technology Fund | 99.98% |
The funds will notify shareholders in January 2022 of amounts for use in preparing 2021 income tax returns.
Board Approval of Investment Advisory Contracts and Management Fees
Fidelity Advisor Focus Funds
Each year, the Board of Trustees, including the Independent Trustees (together, the Board), votes on the renewal of the management contract with Fidelity Management & Research Company LLC (FMR) and the sub-advisory agreements (together, the Advisory Contracts) for each fund. FMR and the sub-advisers are referred to herein as the Investment Advisers. The Board, assisted by the advice of fund counsel and Independent Trustees' counsel, requests and considers a broad range of information relevant to the renewal of the Advisory Contracts throughout the year.The Board meets regularly and, at each of its meetings, covers an extensive agenda of topics and materials and considers factors that are relevant to its annual consideration of the renewal of each fund's Advisory Contracts, including the services and support provided to each fund and its shareholders. The Board has established various standing committees (Committees), each composed of and chaired by Independent Trustees with varying backgrounds, to which the Board has assigned specific subject matter responsibilities in order to enhance effective decision-making by the Board. The Board, acting directly and through its Committees, requests and receives information concerning the annual consideration of the renewal of each fund's Advisory Contracts. The Board also meets as needed to review matters specifically related to the Board's annual consideration of the renewal of the Advisory Contracts. Members of the Board may also meet with trustees of other Fidelity funds through joint ad hoc committees to discuss certain matters relevant to all of the Fidelity funds.At its May 2021 meeting, the Board unanimously determined to renew each fund's Advisory Contracts. In reaching its determination, the Board considered all factors it believed relevant, including (i) the nature, extent, and quality of the services provided to each fund and its shareholders (including the investment performance of each fund); (ii) the competitiveness of each fund's management fee and total expense ratio relative to peer funds; (iii) the total costs of the services provided by and the profits realized by Fidelity from its relationships with each fund; and (iv) the extent to which, if any, economies of scale exist and are realized as each fund grows, and whether any economies of scale are appropriately shared with fund shareholders.In considering whether to renew the Advisory Contracts for each fund, the Board reached a determination, with the assistance of fund counsel and Independent Trustees' counsel and through the exercise of its business judgment, that the renewal of the Advisory Contracts was in the best interests of each fund and its shareholders and that the compensation payable under the Advisory Contracts was fair and reasonable. The Board's decision to renew the Advisory Contracts was not based on any single factor, but rather was based on a comprehensive consideration of all the information provided to the Board at its meetings throughout the year. The Board, in reaching its determination to renew the Advisory Contracts, was aware that shareholders of each fund have a broad range of investment choices available to them, including a wide choice among funds offered by Fidelity's competitors, and that each fund's shareholders, who have the opportunity to review and weigh the disclosure provided by the fund in its prospectus and other public disclosures, have chosen to invest in that fund, which is part of the Fidelity family of funds. Nature, Extent, and Quality of Services Provided. The Board considered Fidelity's staffing as it relates to the funds, including the backgrounds of investment personnel of Fidelity, and also considered the funds' investment objectives, strategies, and related investment philosophies. The Independent Trustees also had discussions with senior management of Fidelity's investment operations and investment groups. The Board considered the structure of the investment personnel compensation program and whether this structure provides appropriate incentives to act in the best interests of each fund. Additionally, the Board considered the portfolio managers' investments, if any, in the funds that they manage. Resources Dedicated to Investment Management and Support Services. The Board and the Fund Oversight and Research Committees reviewed the general qualifications and capabilities of Fidelity's investment staff, including its size, education, experience, and resources, as well as Fidelity's approach to recruiting, training, managing, and compensating investment personnel. The Board noted that Fidelity has continued to increase the resources devoted to non-U.S. offices, including expansion of Fidelity's global investment organization. The Board also noted that Fidelity's analysts have extensive resources, tools and capabilities that allow them to conduct sophisticated quantitative and fundamental analysis, as well as credit analysis of issuers, counterparties and guarantors. Further, the Board considered that Fidelity's investment professionals have sufficient access to global information and data so as to provide competitive investment results over time, and that those professionals also have access to sophisticated tools that permit them to assess portfolio construction and risk and performance attribution characteristics continuously, as well as to transmit new information and research conclusions rapidly around the world. Additionally, in its deliberations, the Board considered Fidelity's trading, risk management, compliance, and technology and operations capabilities and resources, which are integral parts of the investment management process. The Board also considered Fidelity's investments in business continuity planning, and its success in continuously providing services to the fund notwithstanding the severe disruptions caused by the COVID-19 pandemic. Shareholder and Administrative Services. The Board considered (i) the nature, extent, quality, and cost of advisory, administrative, and shareholder services performed by the Investment Advisers and their affiliates under the Advisory Contracts and under separate agreements covering transfer agency, pricing and bookkeeping, and securities lending services for each fund; (ii) the nature and extent of the supervision of third party service providers, principally custodians, subcustodians, and pricing vendors; and (iii) the resources devoted to, and the record of compliance with, each fund's compliance policies and procedures. The Board also reviewed the allocation of fund brokerage, including allocations to brokers affiliated with the Investment Advisers, the use of brokerage commissions to pay fund expenses, and the use of "soft" commission dollars to pay for research services.The Board noted that the growth of fund assets over time across the complex allows Fidelity to reinvest in the development of services designed to enhance the value and convenience of the Fidelity funds as investment vehicles. These services include 24-hour access to account information and market information over the Internet and through telephone representatives, investor education materials and asset allocation tools, and the expanded availability of Fidelity Investor Centers.The Board noted that, in the past, it and the boards of certain other Fidelity funds had formed an ad hoc Committee on Transfer Agency Fees to review the variety of transfer agency fee structures throughout the industry and Fidelity's competitive positioning with respect to industry participants. Investment in a Large Fund Family. The Board considered the benefits to shareholders of investing in a Fidelity fund, including the benefits of investing in a fund that is part of a large family of funds offering a variety of investment disciplines and providing a large variety of mutual fund investor services. The Board noted that Fidelity had taken, or had made recommendations that resulted in the Fidelity funds taking, a number of actions over the previous year that benefited particular funds, including: (i) continuing to dedicate additional resources to Fidelity's investment research process, which includes meetings with management of issuers of securities in which the funds invest, and to the support of the senior management team that oversees asset management; (ii) continuing efforts to enhance Fidelity's global research capabilities; (iii) launching new funds and ETFs with innovative structures, strategies and pricing and making other enhancements to meet client needs; (iv) launching new share classes of existing funds; (v) eliminating purchase minimums and broadening eligibility requirements for certain funds and share classes; (vi) approving the reduction in the holding period for the Class C to Class A conversion policy; (vii) reducing management fees and total expenses for certain target date funds and classes and index funds; (viii) lowering expenses for certain existing funds and classes by implementing or lowering expense caps; (ix) rationalizing product lines and gaining increased efficiencies from fund mergers, liquidations, and share class consolidations; (x) continuing to develop, acquire and implement systems and technology to improve services to the funds and shareholders, strengthen information security, and increase efficiency; and (xi) continuing to implement enhancements to further strengthen Fidelity's product line to increase investors' probability of success in achieving their investment goals, including retirement income goals. Investment Performance. The Board considered whether each fund has operated in accordance with its investment objective, as well as its record of compliance with its investment restrictions and its performance history. The Board noted that there were portfolio management changes for each of the following: (i) Fidelity Advisor Biotechnology Fund in October 2018; (ii) Fidelity Advisor Communications Equipment Fund in July 2018 and January 2019; (iii) Fidelity Advisor Energy Fund in January 2020; (iv) Fidelity Advisor Industrials Fund in November 2018 and December 2018; (v) Fidelity Advisor Semi-Conductors Fund in July 2020; and (vi) Fidelity Advisor Technology Fund in July 2018, December 2018, July 2020, and January 2021. The Board will continue to monitor closely each applicable fund's performance, taking into account the portfolio management changes.The Board took into account discussions that occur at Board meetings throughout the year with representatives of the Investment Advisers about fund investment performance. In this regard the Board noted that as part of regularly scheduled fund reviews and other reports to the Board on fund performance, the Board considers annualized return information for each fund for different time periods, measured against an appropriate securities market index (benchmark index). In its evaluation of fund investment performance, the Board gave particular attention to information indicating changes in performance of certain Fidelity funds for specific time periods and discussed with the Investment Advisers the reasons for any overperformance or underperformance.In addition to reviewing absolute and relative fund performance, the Independent Trustees periodically consider the appropriateness of fund performance metrics in evaluating the results achieved. In general, the Independent Trustees believe that fund performance should be evaluated based on net performance (after fees and expenses) of both the highest performing and lowest performing fund share classes, where applicable, compared to appropriate benchmark indices, over appropriate time periods that may include full market cycles, taking into account relevant factors including the following: general market conditions; issuer-specific information; and fund cash flows and other factors.The Independent Trustees recognize that shareholders evaluate performance on a net basis over their own holding periods, for which one-, three-, and five-year periods are often used as a proxy. For this reason, the performance information reviewed by the Board also included net cumulative total return information for each fund and an appropriate benchmark index for the most recent one-, three-, and five-year periods ended September 30, 2020, as shown below. Peer groups are not shown below because each fund does not generally utilize a peer group for performance comparison purposes.Fidelity Advisor Biotechnology Fund
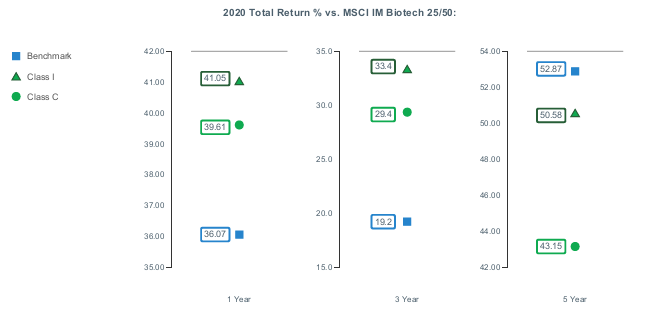
Fidelity Advisor Communications Equipment Fund

Fidelity Advisor Consumer Discretionary Fund

Fidelity Advisor Energy Fund

Fidelity Advisor Financial Services Fund
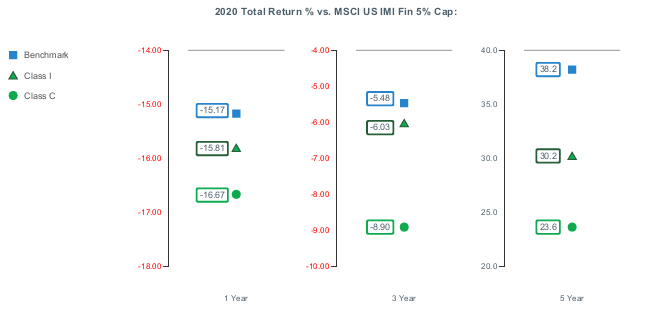
Fidelity Advisor Health Care Fund

Fidelity Advisor Industrials Fund

Fidelity Advisor Semiconductors Fund
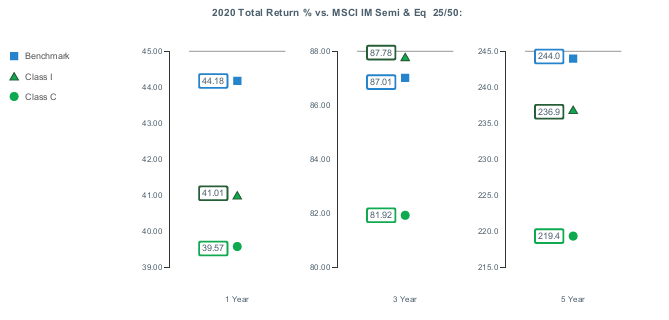
Fidelity Advisor Technology Fund

Fidelity Advisor Utilities Fund

Fidelity Advisor Biotechnology Fund

Fidelity Advisor Communications Equipment Fund

Fidelity Advisor Consumer Discretionary Fund

Fidelity Advisor Energy Fund

Fidelity Advisor Financial Services Fund
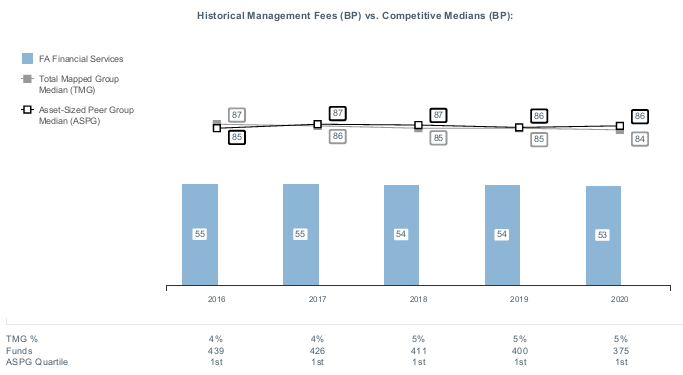
Fidelity Advisor Health Care Fund
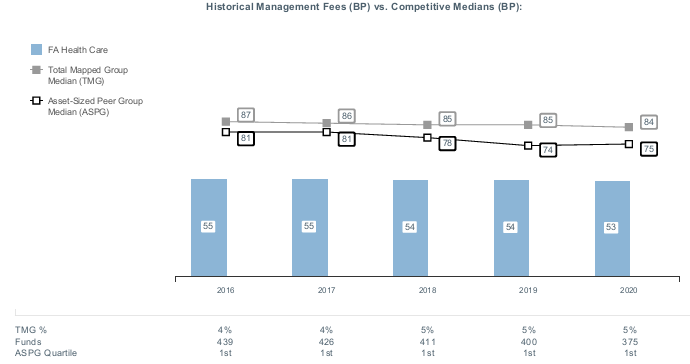
Fidelity Advisor Industrials Fund

Fidelity Advisor Semiconductors Fund

Fidelity Advisor Technology Fund
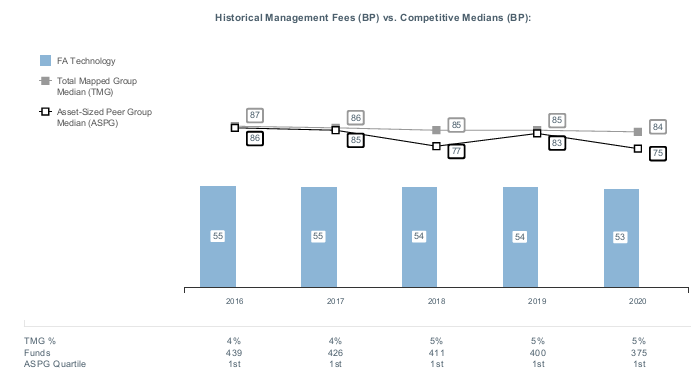
Fidelity Advisor Utilities Fund
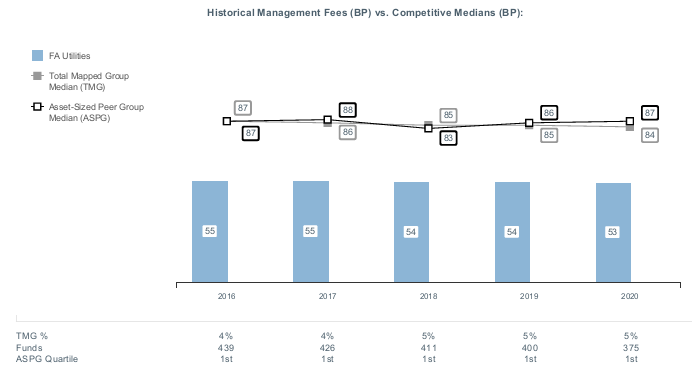
Liquidity Risk Management Program
The Securities and Exchange Commission adopted Rule 22e-4 under the Investment Company Act of 1940 (the Liquidity Rule) to promote effective liquidity risk management throughout the open-end investment company industry, thereby reducing the risk that funds will be unable to meet their redemption obligations and mitigating dilution of the interests of fund shareholders.
The Funds have adopted and implemented a liquidity risk management program pursuant to the Liquidity Rule (the Program) effective December 1, 2018. The Program is reasonably designed to assess and manage each Fund’s liquidity risk and to comply with the requirements of the Liquidity Rule. Each Fund’s Board of Trustees (the Board) has designated each Fund’s investment adviser as administrator of the Program. The Fidelity advisers have established a Liquidity Risk Management Committee (the LRM Committee) to manage the Program for each of the Fidelity Funds. The LRM Committee monitors the adequacy and effectiveness of implementation of the Program and on a periodic basis assesses each Fund’s liquidity risk based on a variety of factors including (1) the Fund’s investment strategy, (2) portfolio liquidity and cash flow projections during normal and reasonably foreseeable stressed conditions, (3) shareholder redemptions, (4) borrowings and other funding sources and (5) in the case of exchange-traded funds, certain additional factors including the effect of the Fund’s prices and spreads, market participants, and basket compositions on the overall liquidity of the Fund’s portfolio, as applicable.
In accordance with the Program, each of the Fund’s portfolio investments is classified into one of four liquidity categories described below based on a determination of a reasonable expectation for how long it would take to convert the investment to cash (or sell or dispose of the investment) without significantly changing its market value.
- Highly liquid investments – cash or convertible to cash within three business days or less
- Moderately liquid investments – convertible to cash in three to seven calendar days
- Less liquid investments – can be sold or disposed of, but not settled, within seven calendar days
- Illiquid investments – cannot be sold or disposed of within seven calendar days
Liquidity classification determinations take into account a variety of factors including various market, trading and investment-specific considerations, as well as market depth, and generally utilize analysis from a third-party liquidity metrics service.
The Liquidity Rule places a 15% limit on a fund’s illiquid investments and requires funds that do not primarily hold assets that are highly liquid investments to determine and maintain a minimum percentage of the fund’s net assets to be invested in highly liquid investments (highly liquid investment minimum or HLIM). The Program includes provisions reasonably designed to comply with the 15% limit on illiquid investments and for determining, periodically reviewing and complying with the HLIM requirement as applicable.
At a recent meeting of the Fund’s Board of Trustees, the LRM Committee provided a written report to the Board pertaining to the operation, adequacy, and effectiveness of implementation of the Program for the annual period from December 1, 2019 through November 30, 2020. The report concluded that the Program has been implemented and is operating effectively and is reasonably designed to assess and manage the Fund’s liquidity risk.
![]()
AFOC-ANN-0921
1.762411.120
Fidelity Advisor® Global Real Estate Fund
July 31, 2021
Contents
|
Board Approval of Investment Advisory Contracts and Management Fees | |
To view a fund's proxy voting guidelines and proxy voting record for the 12-month period ended June 30, visit http://www.fidelity.com/proxyvotingresults or visit the Securities and Exchange Commission's (SEC) web site at http://www.sec.gov.
You may also call 1-877-208-0098 to request a free copy of the proxy voting guidelines.
Standard & Poor's, S&P and S&P 500 are registered service marks of The McGraw-Hill Companies, Inc. and have been licensed for use by Fidelity Distributors Corporation.
Other third-party marks appearing herein are the property of their respective owners.
All other marks appearing herein are registered or unregistered trademarks or service marks of FMR LLC or an affiliated company. © 2021 FMR LLC. All rights reserved.
This report and the financial statements contained herein are submitted for the general information of the shareholders of the Fund. This report is not authorized for distribution to prospective investors in the Fund unless preceded or accompanied by an effective prospectus.
A fund files its complete schedule of portfolio holdings with the SEC for the first and third quarters of each fiscal year on Form N-PORT. Forms N-PORT are available on the SEC’s web site at http://www.sec.gov. A fund's Forms N-PORT may be reviewed and copied at the SEC’s Public Reference Room in Washington, DC. Information regarding the operation of the SEC's Public Reference Room may be obtained by calling 1-800-SEC-0330.
For a complete list of a fund's portfolio holdings, view the most recent holdings listing, semiannual report, or annual report on Fidelity's web site at http://www.fidelity.com, http://www.institutional.fidelity.com, or http://www.401k.com, as applicable.
NOT FDIC INSURED •MAY LOSE VALUE •NO BANK GUARANTEE
Neither the Fund nor Fidelity Distributors Corporation is a bank.
Note to Shareholders:
Early in 2020, the outbreak and spread of a new coronavirus emerged as a public health emergency that had a major influence on financial markets, primarily based on its impact on the global economy and the outlook for corporate earnings. The virus causes a respiratory disease known as COVID-19. On March 11, 2020 the World Health Organization declared the COVID-19 outbreak a pandemic, citing sustained risk of further global spread.
In the weeks following, as the crisis worsened, we witnessed an escalating human tragedy with wide-scale social and economic consequences from coronavirus-containment measures. The outbreak of COVID-19 prompted a number of measures to limit the spread, including travel and border restrictions, quarantines, and restrictions on large gatherings. In turn, these resulted in lower consumer activity, diminished demand for a wide range of products and services, disruption in manufacturing and supply chains, and – given the wide variability in outcomes regarding the outbreak – significant market uncertainty and volatility. Amid the turmoil, global governments and central banks took unprecedented action to help support consumers, businesses, and the broader economies, and to limit disruption to financial systems.
The situation continues to unfold, and the extent and duration of its impact on financial markets and the economy remain highly uncertain. Extreme events such as the coronavirus crisis are “exogenous shocks” that can have significant adverse effects on mutual funds and their investments. Although multiple asset classes may be affected by market disruption, the duration and impact may not be the same for all types of assets.
Fidelity is committed to helping you stay informed amid news about COVID-19 and during increased market volatility, and we’re taking extra steps to be responsive to customer needs. We encourage you to visit our websites, where we offer ongoing updates, commentary, and analysis on the markets and our funds.
Performance: The Bottom Line
Average annual total return reflects the change in the value of an investment, assuming reinvestment of distributions from dividend income and capital gains (the profits earned upon the sale of securities that have grown in value, if any) and assuming a constant rate of performance each year. The hypothetical investment and the average annual total returns do not reflect the deduction of taxes that a shareholder would pay on fund distributions or the redemption of fund shares. During periods of reimbursement by Fidelity, a fund’s total return will be greater than it would be had the reimbursement not occurred. How a fund did yesterday is no guarantee of how it will do tomorrow.
Average Annual Total Returns
| For the periods ended July 31, 2021 | Past 1 year | Life of fundA |
| Class A (incl. 5.75% sales charge) | 23.08% | 5.99% |
| Class M (incl. 3.50% sales charge) | 25.64% | 6.22% |
| Class C (incl. contingent deferred sales charge) | 28.49% | 6.45% |
| Class I | 30.82% | 7.52% |
| Class Z | 31.07% | 7.60% |
A From August 11, 2016
Class C shares' contingent deferred sales charges included in the past one year and life of fund total return figures are 1% and 0%, respectively.
The initial offering of Class Z shares took place on October 2, 2018. Returns prior to October 2, 2018, are those of Class I.
$10,000 Over Life of Fund
Let's say hypothetically that $10,000 was invested in Fidelity Advisor® Global Real Estate Fund - Class A on August 11, 2016, when the fund started, and the current 5.75% sales charge was paid.
The chart shows how the value of your investment would have changed, and also shows how the FTSE EPRA/NAREIT Developed Index performed over the same period.

| Period Ending Values | ||
|
| $13,356 | Fidelity Advisor® Global Real Estate Fund - Class A |
|
| $13,420 | FTSE EPRA/NAREIT Developed Index |
Management's Discussion of Fund Performance
Market Recap: For the 12 months ending July 31, 2021, global real estate stocks gained 36.17%, as measured by the FTSE® EPRA/NAREIT® Developed Index. As this period progressed, the fundamental backdrop improved for most commercial property types, reflecting investors’ mounting optimism that new vaccines for COVID-19 would help resolve the pandemic and bring about a return to normal life – even as late-period uncertainty mounted with the rapid spread of the delta variant of the coronavirus. Real estate industries such as retail and lodging, among the hardest hit early in the pandemic, benefited from stronger demand as shopping and travel activity recovered. Especially in the U.S., though, demand for office properties remained uncertain, reflecting more people working from home and employers’ decision to delay employees’ return to the office amid the spread of the delta variant. In what was a robust market environment for REITs, every country’s market produced a positive return, with nearly all producing a double-digit gain. The U.S., which makes up more than half of the index, gained 41%. The Japanese market, at roughly 11% of the benchmark its second-largest weighting, rose 30%. Meanwhile, the German property market was up 18%, while Hong Kong and the U.K. advanced 26% and 37%, respectively. The Australian market rose roughly 33%, compared with an approximately 12% gain for Singapore. Comments from Portfolio Manager Steve Buller: For the fiscal year ending July 31, 2021, the fund's share classes (excluding sales charges, if applicable) gained roughly 29% to 31%, underperforming the 36.17% increase in the benchmark FTSE EPRA/NAREIT Developed Index. From a regional standpoint, stock picks in the U.S. hurt the most by far, followed by an overweighting and security selection in Europe ex U.K. By industry, the primary detractors from performance versus the benchmark were an underweighting and investment choices in retail REITs. Weak picks among residential REITs hurt as well. Further hampering performance was security selection in the specialized REITs segment. Not owning Simon Property Group, a benchmark component that gained about 115%, was the largest individual relative detractor. Further weighing on the portfolio’s relative return was an outsized stake in Digital Realty Trust (-1%), which was among our biggest holdings. Avoiding Public Storage, a benchmark component that gained roughly 62%, also hampered relative performance. Conversely, picks in Singapore and Canada in particular contributed most to the fund's relative result. By industry, the primary contributor to performance versus the benchmark was our security selection in industrial REITs. Favorable investment choices in health care REITs also bolstered the fund's relative performance. Further lifting the portfolio's relative result was an underweighting in office REITs. The biggest individual relative contributor was an overweight position in Sirius Real Estate (+77%). Also adding value was our outsized stake in Apartment Investment and Management, which gained about 6% and was longer held at period end. Another notable relative contributor was an overweighting in Dream Industrial (+64%). Notable changes in positioning include reduced exposure to Germany and Singapore. By industry, meaningful changes in positioning include increased exposure to retail REITs and a lower allocation to office REITs.The views expressed above reflect those of the portfolio manager(s) only through the end of the period as stated on the cover of this report and do not necessarily represent the views of Fidelity or any other person in the Fidelity organization. Any such views are subject to change at any time based upon market or other conditions and Fidelity disclaims any responsibility to update such views. These views may not be relied on as investment advice and, because investment decisions for a Fidelity fund are based on numerous factors, may not be relied on as an indication of trading intent on behalf of any Fidelity fund.
Investment Summary (Unaudited)
Top Ten Stocks as of July 31, 2021
| % of fund's net assets | |
| Prologis (REIT), Inc. | 6.1 |
| Digital Realty Trust, Inc. | 4.4 |
| Duke Realty Corp. | 3.8 |
| Welltower, Inc. | 3.5 |
| Mitsui Fudosan Co. Ltd. | 2.9 |
| Equity Lifestyle Properties, Inc. | 2.5 |
| UDR, Inc. | 2.5 |
| Ventas, Inc. | 2.4 |
| Mitsubishi Estate Co. Ltd. | 2.3 |
| Instone Real Estate Group BV | 2.2 |
| 32.6 |
Top Five Countries as of July 31, 2021
| (excluding cash equivalents) | % of fund's net assets |
| United States of America | 55.4 |
| Japan | 9.4 |
| Australia | 4.4 |
| Germany | 4.2 |
| Canada | 4.2 |
Top Five REIT Sectors as of July 31, 2021
| % of fund's net assets | |
| REITs - Diversified | 23.3 |
| REITs - Apartments | 12.1 |
| REITs - Health Care | 7.7 |
| REITs - Warehouse/Industrial | 6.8 |
| REITs - Shopping Centers | 5.2 |
Asset Allocation (% of fund's net assets)
| As of July 31, 2021 * | ||
| Stocks | 99.2% | |
| Short-Term Investments and Net Other Assets (Liabilities) | 0.8% | |

* Foreign investments - 43.8%
Schedule of Investments July 31, 2021
Showing Percentage of Net Assets
| Common Stocks - 99.2% | |||
| Shares | Value | ||
| Australia - 4.4% | |||
| Abacus Property Group unit | 25,153 | $58,514 | |
| Arena (REIT) unit | 20,634 | 53,604 | |
| Charter Hall Retail REIT | 16,162 | 44,002 | |
| Ingenia Communities Group unit | 8,983 | 38,169 | |
| National Storage REIT unit | 60,960 | 95,287 | |
| TOTAL AUSTRALIA | 289,576 | ||
| Bailiwick of Guernsey - 1.4% | |||
| Sirius Real Estate Ltd. | 56,737 | 94,006 | |
| Belgium - 1.2% | |||
| Aedifica SA | 392 | 56,173 | |
| Inclusio SA | 775 | 19,674 | |
| TOTAL BELGIUM | 75,847 | ||
| Canada - 4.2% | |||
| Boardwalk (REIT) | 2,674 | 97,907 | |
| Dream Industrial (REIT) | 10,574 | 136,031 | |
| Flagship Communities (REIT) | 2,190 | 38,675 | |
| TOTAL CANADA | 272,613 | ||
| France - 3.4% | |||
| ARGAN SA | 578 | 75,422 | |
| Covivio | 488 | 45,871 | |
| Gecina SA | 609 | 96,697 | |
| TOTAL FRANCE | 217,990 | ||
| Germany - 4.2% | |||
| Instone Real Estate Group BV (a) | 4,620 | 143,040 | |
| Vonovia SE | 1,956 | 130,355 | |
| TOTAL GERMANY | 273,395 | ||
| Hong Kong - 3.6% | |||
| Hysan Development Co. Ltd. | 12,702 | 50,016 | |
| Link (REIT) | 6,158 | 58,877 | |
| Sino Land Ltd. | 80,191 | 122,797 | |
| TOTAL HONG KONG | 231,690 | ||
| Ireland - 2.0% | |||
| Hibernia (REIT) PLC | 85,470 | 132,414 | |
| Italy - 0.6% | |||
| COIMA RES SpA (a) | 4,966 | 39,528 | |
| Japan - 9.4% | |||
| Advance Residence Investment Corp. | 11 | 37,450 | |
| Kenedix Residential Investment Corp. | 33 | 71,381 | |
| LaSalle Logiport REIT | 43 | 78,784 | |
| Mitsubishi Estate Co. Ltd. | 9,766 | 153,199 | |
| Mitsui Fudosan Co. Ltd. | 8,093 | 189,273 | |
| Mitsui Fudosan Logistics Park, Inc. | 8 | 44,775 | |
| SRE Holdings Corp. (b) | 620 | 36,904 | |
| TOTAL JAPAN | 611,766 | ||
| Luxembourg - 1.3% | |||
| Aroundtown SA | 10,954 | 85,840 | |
| Singapore - 3.6% | |||
| CapitaMall Trust | 48,447 | 76,874 | |
| Mapletree Commercial Trust | 22,726 | 36,229 | |
| UOL Group Ltd. | 23,032 | 124,088 | |
| TOTAL SINGAPORE | 237,191 | ||
| Sweden - 0.9% | |||
| Catena AB | 958 | 57,535 | |
| United Kingdom - 3.6% | |||
| Assura PLC | 45,196 | 49,190 | |
| Grainger Trust PLC | 22,754 | 95,960 | |
| Segro PLC | 2,812 | 47,588 | |
| U & I Group PLC (b) | 30,543 | 38,804 | |
| TOTAL UNITED KINGDOM | 231,542 | ||
| United States of America - 55.4% | |||
| American Assets Trust, Inc. | 955 | 35,268 | |
| American Homes 4 Rent Class A | 2,639 | 110,838 | |
| Apartment Income (REIT) Corp. | 1,172 | 61,694 | |
| Crown Castle International Corp. | 505 | 97,510 | |
| CubeSmart | 2,466 | 122,462 | |
| DiamondRock Hospitality Co. (b) | 3,460 | 29,791 | |
| Digital Realty Trust, Inc. | 1,865 | 287,508 | |
| Duke Realty Corp. | 4,805 | 244,478 | |
| Equinix, Inc. | 159 | 130,445 | |
| Equity Lifestyle Properties, Inc. | 1,930 | 161,734 | |
| Extra Space Storage, Inc. | 747 | 130,083 | |
| Gaming & Leisure Properties | 2,237 | 105,900 | |
| Highwoods Properties, Inc. (SBI) | 879 | 41,920 | |
| Invitation Homes, Inc. | 2,860 | 116,345 | |
| Kimco Realty Corp. | 2,922 | 62,326 | |
| Lexington Corporate Properties Trust | 3,364 | 44,237 | |
| Mack-Cali Realty Corp. | 1,294 | 23,292 | |
| Medical Properties Trust, Inc. | 3,154 | 66,329 | |
| Mid-America Apartment Communities, Inc. | 693 | 133,818 | |
| National Retail Properties, Inc. | 1,835 | 89,676 | |
| Phillips Edison & Co., Inc. | 700 | 19,600 | |
| Piedmont Office Realty Trust, Inc. Class A | 1,509 | 28,701 | |
| Prologis (REIT), Inc. | 3,107 | 397,818 | |
| Regency Centers Corp. | 1,053 | 68,877 | |
| RLJ Lodging Trust | 2,200 | 31,570 | |
| Ryman Hospitality Properties, Inc. (b) | 250 | 19,175 | |
| Spirit Realty Capital, Inc. | 1,185 | 59,511 | |
| Sun Communities, Inc. | 600 | 117,666 | |
| UDR, Inc. | 2,941 | 161,726 | |
| Ventas, Inc. | 2,674 | 159,852 | |
| VEREIT, Inc. | 1,967 | 96,324 | |
| VICI Properties, Inc. | 2,754 | 85,897 | |
| Washington REIT (SBI) | 1,513 | 36,751 | |
| Welltower, Inc. | 2,610 | 226,705 | |
| TOTAL UNITED STATES OF AMERICA | 3,605,827 | ||
| TOTAL COMMON STOCKS | |||
| (Cost $4,962,685) | 6,456,760 | ||
| Money Market Funds - 1.0% | |||
| Fidelity Cash Central Fund 0.06% (c) | |||
| (Cost $64,844) | 64,831 | 64,844 | |
| TOTAL INVESTMENT IN SECURITIES - 100.2% | |||
| (Cost $5,027,529) | 6,521,604 | ||
| NET OTHER ASSETS (LIABILITIES) - (0.2)% | (12,857) | ||
| NET ASSETS - 100% | $6,508,747 |
Categorizations in the Schedule of Investments are based on country or territory of incorporation.
Legend
(a) Security exempt from registration under Rule 144A of the Securities Act of 1933. These securities may be resold in transactions exempt from registration, normally to qualified institutional buyers. At the end of the period, the value of these securities amounted to $182,568 or 2.8% of net assets.
(b) Non-income producing
(c) Affiliated fund that is generally available only to investment companies and other accounts managed by Fidelity Investments. The rate quoted is the annualized seven-day yield of the fund at period end. A complete unaudited listing of the fund's holdings as of its most recent quarter end is available upon request. In addition, each Fidelity Central Fund's financial statements, which are not covered by the Fund's Report of Independent Registered Public Accounting Firm, are available on the SEC's website or upon request.
Affiliated Central Funds
Information regarding fiscal year to date income earned by the Fund from investments in Fidelity Central Funds is as follows:
| Fund | Income earned |
| Fidelity Cash Central Fund | $22 |
| Total | $22 |
Amounts in the income column in the above table include any capital gain distributions from underlying funds, which are presented in the corresponding line-item in the Statement of Operations, if applicable.
Fiscal year to date information regarding the Fund's investments in Fidelity Central Funds, including the ownership percentage, is presented below.
| Fund | Value, beginning of period | Purchases | Sales Proceeds | Realized Gain/Loss | Change in Unrealized appreciation (depreciation) | Value, end of period | % ownership, end of period |
| Fidelity Cash Central Fund 0.06% | $13,292 | $1,728,958 | $1,677,405 | $(1) | $-- | $64,844 | 0.0% |
| Total | $13,292 | $1,728,958 | $1,677,405 | $(1) | $-- | $64,844 |
Investment Valuation
The following is a summary of the inputs used, as of July 31, 2021, involving the Fund's assets and liabilities carried at fair value. The inputs or methodology used for valuing securities may not be an indication of the risk associated with investing in those securities. For more information on valuation inputs, and their aggregation into the levels used below, please refer to the Investment Valuation section in the accompanying Notes to Financial Statements.
| Valuation Inputs at Reporting Date: | ||||
| Description | Total | Level 1 | Level 2 | Level 3 |
| Investments in Securities: | ||||
| Equities: | ||||
| Real Estate | $6,456,760 | $6,114,288 | $342,472 | $-- |
| Money Market Funds | 64,844 | 64,844 | -- | -- |
| Total Investments in Securities: | $6,521,604 | $6,179,132 | $342,472 | $-- |
See accompanying notes which are an integral part of the financial statements.
Financial Statements
Statement of Assets and Liabilities
| July 31, 2021 | ||
| Assets | ||
| Investment in securities, at value — See accompanying schedule: Unaffiliated issuers (cost $4,962,685) | $6,456,760 | |
| Fidelity Central Funds (cost $64,844) | 64,844 | |
| Total Investment in Securities (cost $5,027,529) | $6,521,604 | |
| Cash | 2,526 | |
| Receivable for investments sold | 2,814 | |
| Receivable for fund shares sold | 220 | |
| Dividends receivable | 14,182 | |
| Distributions receivable from Fidelity Central Funds | 2 | |
| Prepaid expenses | 17 | |
| Receivable from investment adviser for expense reductions | 34,400 | |
| Other receivables | 154 | |
| Total assets | 6,575,919 | |
| Liabilities | ||
| Audit fee | $45,597 | |
| Custody fee | 8,781 | |
| Payable for investments purchased | 6,785 | |
| Accrued management fee | 3,583 | |
| Distribution and service plan fees payable | 1,097 | |
| Other affiliated payables | 1,085 | |
| Other payables and accrued expenses | 244 | |
| Total liabilities | 67,172 | |
| Net Assets | $6,508,747 | |
| Net Assets consist of: | ||
| Paid in capital | $5,180,018 | |
| Total accumulated earnings (loss) | 1,328,729 | |
| Net Assets | $6,508,747 | |
| Net Asset Value and Maximum Offering Price | ||
| Class A: | ||
| Net Asset Value and redemption price per share ($2,746,924 ÷ 219,995 shares)(a) | $12.49 | |
| Maximum offering price per share (100/94.25 of $12.49) | $13.25 | |
| Class M: | ||
| Net Asset Value and redemption price per share ($876,349 ÷ 70,328 shares)(a) | $12.46 | |
| Maximum offering price per share (100/96.50 of $12.46) | $12.91 | |
| Class C: | ||
| Net Asset Value and offering price per share ($223,234 ÷ 17,898 shares)(a) | $12.47 | |
| Class I: | ||
| Net Asset Value, offering price and redemption price per share ($1,482,656 ÷ 118,497 shares) | $12.51 | |
| Class Z: | ||
| Net Asset Value, offering price and redemption price per share ($1,179,584 ÷ 93,887 shares) | $12.56 |
(a) Redemption price per share is equal to net asset value less any applicable contingent deferred sales charge.
See accompanying notes which are an integral part of the financial statements.
Statement of Operations
| Year ended July 31, 2021 | ||
| Investment Income | ||
| Dividends | $154,267 | |
| Income from Fidelity Central Funds | 22 | |
| Income before foreign taxes withheld | 154,289 | |
| Less foreign taxes withheld | (7,087) | |
| Total income | 147,202 | |
| Expenses | ||
| Management fee | $33,483 | |
| Transfer agent fees | 9,443 | |
| Distribution and service plan fees | 11,034 | |
| Accounting fees and expenses | 1,924 | |
| Custodian fees and expenses | 20,786 | |
| Independent trustees' fees and expenses | 20 | |
| Registration fees | 65,716 | |
| Audit | 60,125 | |
| Legal | 6 | |
| Miscellaneous | 290 | |
| Total expenses before reductions | 202,827 | |
| Expense reductions | (137,096) | |
| Total expenses after reductions | 65,731 | |
| Net investment income (loss) | 81,471 | |
| Realized and Unrealized Gain (Loss) | ||
| Net realized gain (loss) on: | ||
| Investment securities: | ||
| Unaffiliated issuers (net of foreign taxes of $100) | 134,942 | |
| Fidelity Central Funds | (1) | |
| Foreign currency transactions | (43) | |
| Total net realized gain (loss) | 134,898 | |
| Change in net unrealized appreciation (depreciation) on: | ||
| Investment securities: | ||
| Unaffiliated issuers | 1,193,146 | |
| Assets and liabilities in foreign currencies | (262) | |
| Total change in net unrealized appreciation (depreciation) | 1,192,884 | |
| Net gain (loss) | 1,327,782 | |
| Net increase (decrease) in net assets resulting from operations | $1,409,253 |
See accompanying notes which are an integral part of the financial statements.
Statement of Changes in Net Assets
| Year ended July 31, 2021 | Year ended July 31, 2020 | |
| Increase (Decrease) in Net Assets | ||
| Operations | ||
| Net investment income (loss) | $81,471 | $73,270 |
| Net realized gain (loss) | 134,898 | (39,415) |
| Change in net unrealized appreciation (depreciation) | 1,192,884 | (288,457) |
| Net increase (decrease) in net assets resulting from operations | 1,409,253 | (254,602) |
| Distributions to shareholders | (55,566) | (292,523) |
| Share transactions - net increase (decrease) | 1,280,270 | (2,100,606) |
| Total increase (decrease) in net assets | 2,633,957 | (2,647,731) |
| Net Assets | ||
| Beginning of period | 3,874,790 | 6,522,521 |
| End of period | $6,508,747 | $3,874,790 |
See accompanying notes which are an integral part of the financial statements.
Financial Highlights
Fidelity Advisor Global Real Estate Fund Class A
| Years ended July 31, | 2021 | 2020 | 2019 | 2018 | 2017 A |
| Selected Per–Share Data | |||||
| Net asset value, beginning of period | $9.69 | $10.72 | $10.13 | $9.81 | $10.00 |
| Income from Investment Operations | |||||
| Net investment income (loss)B | .17 | .15 | .22 | .18 | .15 |
| Net realized and unrealized gain (loss) | 2.76 | (.58) | .58 | .42 | (.26) |
| Total from investment operations | 2.93 | (.43) | .80 | .60 | (.11) |
| Distributions from net investment income | (.13) | (.23) | (.15) | (.13) | (.07) |
| Distributions from net realized gain | – | (.37) | (.06) | (.14) | (.01) |
| Total distributions | (.13) | (.60) | (.21) | (.28)C | (.08) |
| Net asset value, end of period | $12.49 | $9.69 | $10.72 | $10.13 | $9.81 |
| Total ReturnD,E,F | 30.59% | (4.61)% | 8.25% | 6.16% | (1.00)% |
| Ratios to Average Net AssetsG,H | |||||
| Expenses before reductions | 4.19% | 4.22% | 4.56% | 5.86% | 8.94%I |
| Expenses net of fee waivers, if any | 1.38% | 1.40% | 1.40% | 1.40% | 1.40%I |
| Expenses net of all reductions | 1.37% | 1.39% | 1.39% | 1.38% | 1.39%I |
| Net investment income (loss) | 1.60% | 1.47% | 2.09% | 1.80% | 1.65%I |
| Supplemental Data | |||||
| Net assets, end of period (000 omitted) | $2,747 | $1,732 | $3,290 | $1,001 | $657 |
| Portfolio turnover rateJ | 32% | 52% | 60% | 46% | 59%I |
A For the period August 11, 2016 (commencement of operations) to July 31, 2017.
B Calculated based on average shares outstanding during the period.
C Total distributions per share do not sum due to rounding.
D Total returns for periods of less than one year are not annualized.
E Total returns would have been lower if certain expenses had not been reduced during the applicable periods shown.
F Total returns do not include the effect of the sales charges.
G Fees and expenses of any underlying mutual funds or exchange-traded funds (ETFs) are not included in the Fund's expense ratio. The Fund indirectly bears its proportionate share of these expenses. For additional expense information related to investments in Fidelity Central Funds, please refer to the "Investments in Fidelity Central Funds" note found in the Notes to Financial Statements section of the most recent Annual or Semi-Annual report.
H Expense ratios reflect operating expenses of the class. Expenses before reductions do not reflect amounts reimbursed, waived, or reduced through arrangements with the investment adviser, brokerage services, or other offset arrangements, if applicable, and do not represent the amount paid by the class during periods when reimbursements, waivers or reductions occur.
I Annualized
J Amount does not include the portfolio activity of any underlying mutual funds or exchange-traded funds (ETFs).
See accompanying notes which are an integral part of the financial statements.
Fidelity Advisor Global Real Estate Fund Class M
| Years ended July 31, | 2021 | 2020 | 2019 | 2018 | 2017 A |
| Selected Per–Share Data | |||||
| Net asset value, beginning of period | $9.67 | $10.71 | $10.11 | $9.79 | $10.00 |
| Income from Investment Operations | |||||
| Net investment income (loss)B | .14 | .12 | .19 | .15 | .13 |
| Net realized and unrealized gain (loss) | 2.76 | (.58) | .60 | .42 | (.27) |
| Total from investment operations | 2.90 | (.46) | .79 | .57 | (.14) |
| Distributions from net investment income | (.11) | (.21) | (.13) | (.11) | (.06) |
| Distributions from net realized gain | – | (.37) | (.06) | (.14) | (.01) |
| Total distributions | (.11) | (.58) | (.19) | (.25) | (.07) |
| Net asset value, end of period | $12.46 | $9.67 | $10.71 | $10.11 | $9.79 |
| Total ReturnC,D,E | 30.20% | (4.87)% | 8.06% | 5.90% | (1.30)% |
| Ratios to Average Net AssetsF,G | |||||
| Expenses before reductions | 4.41% | 4.46% | 4.79% | 5.90% | 9.20%H |
| Expenses net of fee waivers, if any | 1.63% | 1.66% | 1.65% | 1.65% | 1.65%H |
| Expenses net of all reductions | 1.62% | 1.64% | 1.64% | 1.63% | 1.64%H |
| Net investment income (loss) | 1.35% | 1.22% | 1.84% | 1.54% | 1.40%H |
| Supplemental Data | |||||
| Net assets, end of period (000 omitted) | $876 | $658 | $810 | $570 | $550 |
| Portfolio turnover rateI | 32% | 52% | 60% | 46% | 59%H |
A For the period August 11, 2016 (commencement of operations) to July 31, 2017.
B Calculated based on average shares outstanding during the period.
C Total returns for periods of less than one year are not annualized.
D Total returns would have been lower if certain expenses had not been reduced during the applicable periods shown.
E Total returns do not include the effect of the sales charges.
F Fees and expenses of any underlying mutual funds or exchange-traded funds (ETFs) are not included in the Fund's expense ratio. The Fund indirectly bears its proportionate share of these expenses. For additional expense information related to investments in Fidelity Central Funds, please refer to the "Investments in Fidelity Central Funds" note found in the Notes to Financial Statements section of the most recent Annual or Semi-Annual report.
G Expense ratios reflect operating expenses of the class. Expenses before reductions do not reflect amounts reimbursed, waived, or reduced through arrangements with the investment adviser, brokerage services, or other offset arrangements, if applicable, and do not represent the amount paid by the class during periods when reimbursements, waivers or reductions occur.
H Annualized
I Amount does not include the portfolio activity of any underlying mutual funds or exchange-traded funds (ETFs).
See accompanying notes which are an integral part of the financial statements.
Fidelity Advisor Global Real Estate Fund Class C
| Years ended July 31, | 2021 | 2020 | 2019 | 2018 | 2017 A |
| Selected Per–Share Data | |||||
| Net asset value, beginning of period | $9.63 | $10.63 | $10.08 | $9.76 | $10.00 |
| Income from Investment Operations | |||||
| Net investment income (loss)B | .09 | .07 | .14 | .10 | .08 |
| Net realized and unrealized gain (loss) | 2.75 | (.58) | .59 | .42 | (.26) |
| Total from investment operations | 2.84 | (.51) | .73 | .52 | (.18) |
| Distributions from net investment income | – | (.12) | (.12) | (.06) | (.05) |
| Distributions from net realized gain | – | (.37) | (.06) | (.14) | (.01) |
| Total distributions | – | (.49) | (.18) | (.20) | (.06) |
| Net asset value, end of period | $12.47 | $9.63 | $10.63 | $10.08 | $9.76 |
| Total ReturnC,D,E | 29.49% | (5.31)% | 7.52% | 5.38% | (1.77)% |
| Ratios to Average Net AssetsF,G | |||||
| Expenses before reductions | 5.02% | 4.46% | 5.04% | 6.26% | 9.75%H |
| Expenses net of fee waivers, if any | 2.14% | 2.16% | 2.15% | 2.15% | 2.15%H |
| Expenses net of all reductions | 2.13% | 2.15% | 2.14% | 2.13% | 2.14%H |
| Net investment income (loss) | .85% | .71% | 1.34% | 1.04% | .90%H |
| Supplemental Data | |||||
| Net assets, end of period (000 omitted) | $223 | $185 | $1,060 | $614 | $737 |
| Portfolio turnover rateI | 32% | 52% | 60% | 46% | 59%H |
A For the period August 11, 2016 (commencement of operations) to July 31, 2017.
B Calculated based on average shares outstanding during the period.
C Total returns for periods of less than one year are not annualized.
D Total returns would have been lower if certain expenses had not been reduced during the applicable periods shown.
E Total returns do not include the effect of the contingent deferred sales charge.
F Fees and expenses of any underlying mutual funds or exchange-traded funds (ETFs) are not included in the Fund's expense ratio. The Fund indirectly bears its proportionate share of these expenses. For additional expense information related to investments in Fidelity Central Funds, please refer to the "Investments in Fidelity Central Funds" note found in the Notes to Financial Statements section of the most recent Annual or Semi-Annual report.
G Expense ratios reflect operating expenses of the class. Expenses before reductions do not reflect amounts reimbursed, waived, or reduced through arrangements with the investment adviser, brokerage services, or other offset arrangements, if applicable, and do not represent the amount paid by the class during periods when reimbursements, waivers or reductions occur.
H Annualized
I Amount does not include the portfolio activity of any underlying mutual funds or exchange-traded funds (ETFs).
See accompanying notes which are an integral part of the financial statements.
Fidelity Advisor Global Real Estate Fund Class I
| Years ended July 31, | 2021 | 2020 | 2019 | 2018 | 2017 A |
| Selected Per–Share Data | |||||
| Net asset value, beginning of period | $9.71 | $10.75 | $10.15 | $9.82 | $10.00 |
| Income from Investment Operations | |||||
| Net investment income (loss)B | .20 | .17 | .24 | .20 | .17 |
| Net realized and unrealized gain (loss) | 2.76 | (.58) | .59 | .43 | (.26) |
| Total from investment operations | 2.96 | (.41) | .83 | .63 | (.09) |
| Distributions from net investment income | (.16) | (.26) | (.17) | (.16) | (.08) |
| Distributions from net realized gain | – | (.37) | (.06) | (.14) | (.01) |
| Total distributions | (.16) | (.63) | (.23) | (.30) | (.09) |
| Net asset value, end of period | $12.51 | $9.71 | $10.75 | $10.15 | $9.82 |
| Total ReturnC,D | 30.82% | (4.40)% | 8.55% | 6.48% | (.80)% |
| Ratios to Average Net AssetsE,F | |||||
| Expenses before reductions | 3.81% | 3.97% | 4.20% | 5.41% | 8.74%G |
| Expenses net of fee waivers, if any | 1.13% | 1.16% | 1.15% | 1.15% | 1.15%G |
| Expenses net of all reductions | 1.12% | 1.14% | 1.14% | 1.13% | 1.14%G |
| Net investment income (loss) | 1.85% | 1.71% | 2.34% | 2.04% | 1.90%G |
| Supplemental Data | |||||
| Net assets, end of period (000 omitted) | $1,483 | $1,066 | $1,056 | $986 | $863 |
| Portfolio turnover rateH | 32% | 52% | 60% | 46% | 59%G |
A For the period August 11, 2016 (commencement of operations) to July 31, 2017.
B Calculated based on average shares outstanding during the period.
C Total returns for periods of less than one year are not annualized.
D Total returns would have been lower if certain expenses had not been reduced during the applicable periods shown.
E Fees and expenses of any underlying mutual funds or exchange-traded funds (ETFs) are not included in the Fund's expense ratio. The Fund indirectly bears its proportionate share of these expenses. For additional expense information related to investments in Fidelity Central Funds, please refer to the "Investments in Fidelity Central Funds" note found in the Notes to Financial Statements section of the most recent Annual or Semi-Annual report.
F Expense ratios reflect operating expenses of the class. Expenses before reductions do not reflect amounts reimbursed, waived, or reduced through arrangements with the investment adviser, brokerage services, or other offset arrangements, if applicable, and do not represent the amount paid by the class during periods when reimbursements, waivers or reductions occur.
G Annualized
H Amount does not include the portfolio activity of any underlying mutual funds or exchange-traded funds (ETFs).
See accompanying notes which are an integral part of the financial statements.
Fidelity Advisor Global Real Estate Fund Class Z
| Years ended July 31, | 2021 | 2020 | 2019 A |
| Selected Per–Share Data | |||
| Net asset value, beginning of period | $9.73 | $10.76 | $10.01 |
| Income from Investment Operations | |||
| Net investment income (loss)B | .22 | .19 | .22 |
| Net realized and unrealized gain (loss) | 2.77 | (.59) | .76 |
| Total from investment operations | 2.99 | (.40) | .98 |
| Distributions from net investment income | (.16) | (.26) | (.17) |
| Distributions from net realized gain | – | (.37) | (.06) |
| Total distributions | (.16) | (.63) | (.23) |
| Net asset value, end of period | $12.56 | $9.73 | $10.76 |
| Total ReturnC,D | 31.07% | (4.29)% | 10.17% |
| Ratios to Average Net AssetsE,F | |||
| Expenses before reductions | 3.72% | 3.54% | 3.87%G |
| Expenses net of fee waivers, if any | .97% | 1.02% | 1.00%G |
| Expenses net of all reductions | .96% | 1.00% | 1.00%G |
| Net investment income (loss) | 2.01% | 1.86% | 2.50%G |
| Supplemental Data | |||
| Net assets, end of period (000 omitted) | $1,180 | $233 | $306 |
| Portfolio turnover rateH | 32% | 52% | 60% |
A For the period October 2, 2018 (commencement of sale of shares) to July 31, 2019.
B Calculated based on average shares outstanding during the period.
C Total returns for periods of less than one year are not annualized.
D Total returns would have been lower if certain expenses had not been reduced during the applicable periods shown.
E Fees and expenses of any underlying mutual funds or exchange-traded funds (ETFs) are not included in the Fund's expense ratio. The Fund indirectly bears its proportionate share of these expenses. For additional expense information related to investments in Fidelity Central Funds, please refer to the "Investments in Fidelity Central Funds" note found in the Notes to Financial Statements section of the most recent Annual or Semi-Annual report.
F Expense ratios reflect operating expenses of the class. Expenses before reductions do not reflect amounts reimbursed, waived, or reduced through arrangements with the investment adviser, brokerage services, or other offset arrangements, if applicable, and do not represent the amount paid by the class during periods when reimbursements, waivers or reductions occur.
G Annualized
H Amount does not include the portfolio activity of any underlying mutual funds or exchange-traded funds (ETFs).
See accompanying notes which are an integral part of the financial statements.
Notes to Financial Statements
For the period ended July 31, 2021
1. Organization.
Fidelity Advisor Global Real Estate Fund (the Fund) is a fund of Fidelity Advisor Series VII (the Trust) and is authorized to issue an unlimited number of shares. The Trust is registered under the Investment Company Act of 1940, as amended (the 1940 Act), as an open-end management investment company organized as a Massachusetts business trust. The Fund offers Class A, Class M, Class C, Class I and Class Z shares, each of which has equal rights as to assets and voting privileges. Each class has exclusive voting rights with respect to matters that affect that class. Effective June 21, 2021, Class C shares will automatically convert to Class A shares after a holding period of eight years from the initial date of purchase, with certain exceptions. Prior to June 21, 2021, Class C shares automatically converted to Class A shares after a holding period of ten years from the initial date of purchase, with certain exceptions.
2. Investments in Fidelity Central Funds.
Funds may invest in Fidelity Central Funds, which are open-end investment companies generally available only to other investment companies and accounts managed by the investment adviser and its affiliates. The Schedule of Investments lists any Fidelity Central Funds held as an investment as of period end, but does not include the underlying holdings of each Fidelity Central Fund. An investing fund indirectly bears its proportionate share of the expenses of the underlying Fidelity Central Funds.
Based on its investment objective, each Fidelity Central Fund may invest or participate in various investment vehicles or strategies that are similar to those of the investing fund. These strategies are consistent with the investment objectives of the investing fund and may involve certain economic risks which may cause a decline in value of each of the Fidelity Central Funds and thus a decline in the value of the investing fund.
| Fidelity Central Fund | Investment Manager | Investment Objective | Investment Practices | Expense Ratio(a) |
| Fidelity Money Market Central Funds | Fidelity Management & Research Company LLC (FMR) | Each fund seeks to obtain a high level of current income consistent with the preservation of capital and liquidity. | Short-term Investments | Less than .005% to .01% |
(a) Expenses expressed as a percentage of average net assets and are as of each underlying Central Fund's most recent annual or semi-annual shareholder report.
A complete unaudited list of holdings for each Fidelity Central Fund is available upon request or at the Securities and Exchange Commission website at www.sec.gov. In addition, the financial statements of the Fidelity Central Funds which contain the significant accounting policies (including investment valuation policies) of those funds, and are not covered by the Report of Independent Registered Public Accounting Firm, are available on the Securities and Exchange Commission website or upon request.
3. Significant Accounting Policies.
The Fund is an investment company and applies the accounting and reporting guidance of the Financial Accounting Standards Board (FASB) Accounting Standards Codification Topic 946 Financial Services - Investment Companies. The financial statements have been prepared in conformity with accounting principles generally accepted in the United States of America (GAAP), which require management to make certain estimates and assumptions at the date of the financial statements. Actual results could differ from those estimates. Subsequent events, if any, through the date that the financial statements were issued have been evaluated in the preparation of the financial statements. The Fund's Schedule of Investments lists any underlying mutual funds or exchange-traded funds (ETFs) but does not include the underlying holdings of these funds. The following summarizes the significant accounting policies of the Fund:
Investment Valuation. Investments are valued as of 4:00 p.m. Eastern time on the last calendar day of the period. The Board of Trustees (the Board) has delegated the day to day responsibility for the valuation of the Fund's investments to the Fair Value Committee (the Committee) established by the Fund's investment adviser. In accordance with valuation policies and procedures approved by the Board, the Fund attempts to obtain prices from one or more third party pricing vendors or brokers to value its investments. When current market prices, quotations or currency exchange rates are not readily available or reliable, investments will be fair valued in good faith by the Committee, in accordance with procedures adopted by the Board. Factors used in determining fair value vary by investment type and may include market or investment specific events. The frequency with which these procedures are used cannot be predicted and they may be utilized to a significant extent. The Committee oversees the Fund's valuation policies and procedures and reports to the Board on the Committee's activities and fair value determinations. The Board monitors the appropriateness of the procedures used in valuing the Fund's investments and ratifies the fair value determinations of the Committee.
The Fund categorizes the inputs to valuation techniques used to value its investments into a disclosure hierarchy consisting of three levels as shown below:
- Level 1 – quoted prices in active markets for identical investments
- Level 2 – other significant observable inputs (including quoted prices for similar investments, interest rates, prepayment speeds, etc.)
- Level 3 – unobservable inputs (including the Fund's own assumptions based on the best information available)
Valuation techniques used to value the Fund's investments by major category are as follows:
Equity securities, including restricted securities, for which market quotations are readily available, are valued at the last reported sale price or official closing price as reported by a third party pricing vendor on the primary market or exchange on which they are traded and are categorized as Level 1 in the hierarchy. In the event there were no sales during the day or closing prices are not available, securities are valued at the last quoted bid price or may be valued using the last available price and are generally categorized as Level 2 in the hierarchy. For foreign equity securities, when market or security specific events arise, comparisons to the valuation of American Depositary Receipts (ADRs), futures contracts, ETFs and certain indexes as well as quoted prices for similar securities may be used and would be categorized as Level 2 in the hierarchy. For equity securities, including restricted securities, where observable inputs are limited, assumptions about market activity and risk are used and these securities may be categorized as Level 3 in the hierarchy.
Investments in open-end mutual funds, including the Fidelity Central Funds, are valued at their closing net asset value (NAV) each business day and are categorized as Level 1 in the hierarchy.
Changes in valuation techniques may result in transfers in or out of an assigned level within the disclosure hierarchy. The aggregate value of investments by input level as of July 31, 2021 is included at the end of the Fund's Schedule of Investments.
Foreign Currency. Certain Funds may use foreign currency contracts to facilitate transactions in foreign-denominated securities. Gains and losses from these transactions may arise from changes in the value of the foreign currency or if the counterparties do not perform under the contracts' terms.
Foreign-denominated assets, including investment securities, and liabilities are translated into U.S. dollars at the exchange rates at period end. Purchases and sales of investment securities, income and dividends received, and expenses denominated in foreign currencies are translated into U.S. dollars at the exchange rate in effect on the transaction date.
The effects of exchange rate fluctuations on investments are included with the net realized and unrealized gain (loss) on investment securities. Other foreign currency transactions resulting in realized and unrealized gain (loss) are disclosed separately.
Investment Transactions and Income. For financial reporting purposes, the Fund's investment holdings and NAV include trades executed through the end of the last business day of the period. The NAV per share for processing shareholder transactions is calculated as of the close of business of the New York Stock Exchange (NYSE), normally 4:00 p.m. Eastern time and includes trades executed through the end of the prior business day. Gains and losses on securities sold are determined on the basis of identified cost. Dividend income is recorded on the ex-dividend date, except for certain dividends from foreign securities where the ex-dividend date may have passed, which are recorded as soon as the Fund is informed of the ex-dividend date. Non-cash dividends included in dividend income, if any, are recorded at the fair market value of the securities received. Income and capital gain distributions from Fidelity Central Funds, if any, are recorded on the ex-dividend date. Certain distributions received by the Fund represent a return of capital or capital gain. The Fund determines the components of these distributions subsequent to the ex-dividend date, based upon receipt of tax filings or other correspondence relating to the underlying investment. These distributions are recorded as a reduction of cost of investments and/or as a realized gain. Investment income is recorded net of foreign taxes withheld where recovery of such taxes is uncertain.
Class Allocations and Expenses. Investment income, realized and unrealized capital gains and losses, common expenses of a fund, and certain fund-level expense reductions, if any, are allocated daily on a pro-rata basis to each class based on the relative net assets of each class to the total net assets of a fund. Each class differs with respect to transfer agent and distribution and service plan fees incurred, as applicable. Certain expense reductions may also differ by class, if applicable. For the reporting period, the allocated portion of income and expenses to each class as a percent of its average net assets may vary due to the timing of recording these transactions in relation to fluctuating net assets of the classes. Expenses directly attributable to a fund are charged to that fund. Expenses attributable to more than one fund are allocated among the respective funds on the basis of relative net assets or other appropriate methods. Expenses included in the accompanying financial statements reflect the expenses of that fund and do not include any expenses associated with any underlying mutual funds or exchange-traded funds. Although not included in a fund's expenses, a fund indirectly bears its proportionate share of these expenses through the net asset value of each underlying mutual fund or exchange-traded fund. Expense estimates are accrued in the period to which they relate and adjustments are made when actual amounts are known.
Income Tax Information and Distributions to Shareholders. Each year, the Fund intends to qualify as a regulated investment company under Subchapter M of the Internal Revenue Code, including distributing substantially all of its taxable income and realized gains. As a result, no provision for U.S. Federal income taxes is required. As of July 31, 2021, the Fund did not have any unrecognized tax benefits in the financial statements; nor is the Fund aware of any tax positions for which it is reasonably possible that the total amounts of unrecognized tax benefits will significantly change in the next twelve months. The Fund files a U.S. federal tax return, in addition to state and local tax returns as required. The Fund's federal income tax returns are subject to examination by the Internal Revenue Service (IRS) for a period of three fiscal years after they are filed. State and local tax returns may be subject to examination for an additional fiscal year depending on the jurisdiction. Foreign taxes are provided for based on the Fund's understanding of the tax rules and rates that exist in the foreign markets in which it invests. The Fund is subject to a tax imposed on capital gains by certain countries in which it invests.
Distributions are declared and recorded on the ex-dividend date. Income and capital gain distributions are declared separately for each class. Income and capital gain distributions are determined in accordance with income tax regulations, which may differ from GAAP.
Capital accounts within the financial statements are adjusted for permanent book-tax differences. These adjustments have no impact on net assets or the results of operations. Capital accounts are not adjusted for temporary book-tax differences which will reverse in a subsequent period.
Book-tax differences are primarily due to foreign currency transactions, passive foreign investment companies (PFIC), capital loss carryforwards and losses deferred due to wash sales and excise tax regulations.
As of period end, the cost and unrealized appreciation (depreciation) in securities, and derivatives if applicable, for federal income tax purposes were as follows:
| Gross unrealized appreciation | $1,486,452 |
| Gross unrealized depreciation | (86,224) |
| Net unrealized appreciation (depreciation) | $1,400,228 |
| Tax Cost | $5,121,376 |
The tax-based components of distributable earnings as of period end were as follows:
| Undistributed ordinary income | $49,367 |
| Capital loss carryforward | $(120,705) |
| Net unrealized appreciation (depreciation) on securities and other investments | $1,400,067 |
Capital loss carryforwards are only available to offset future capital gains of the Fund to the extent provided by regulations and may be limited. The capital loss carryforward information presented below, including any applicable limitation, is estimated as of fiscal period end and is subject to adjustment.
| No expiration | |
| Short-term | $(120,705) |
| Total capital loss carryforward | $(120,705) |
The tax character of distributions paid was as follows:
| July 31, 2021 | July 31, 2020 | |
| Ordinary Income | $55,566 | $ 292,523 |
Restricted Securities (including Private Placements). Funds may invest in securities that are subject to legal or contractual restrictions on resale. These securities generally may be resold in transactions exempt from registration or to the public if the securities are registered. Disposal of these securities may involve time-consuming negotiations and expense, and prompt sale at an acceptable price may be difficult. Information regarding restricted securities held at period end is included at the end of the Schedule of Investments, if applicable.
4. Purchases and Sales of Investments.
Purchases and sales of securities, other than short-term securities and in-kind transactions, as applicable, are noted in the table below.
| Purchases ($) | Sales ($) | |
| Fidelity Advisor Global Real Estate Fund | 2,956,613 | 1,551,941 |
5. Fees and Other Transactions with Affiliates.
Management Fee. Fidelity Management & Research Company LLC (the investment adviser) and its affiliates provide the Fund with investment management related services for which the Fund pays a monthly management fee. The management fee is the sum of an individual fund fee rate that is based on an annual rate of .45% of the Fund's average net assets and an annualized group fee rate that averaged .23% during the period. The group fee rate is based upon the monthly average net assets of a group of registered investment companies with which the investment adviser has management contracts. The group fee rate decreases as assets under management increase and increases as assets under management decrease. For the reporting period, the total annual management fee rate was .68% of the Fund's average net assets.
Distribution and Service Plan Fees. In accordance with Rule 12b-1 of the 1940 Act, the Fund has adopted separate Distribution and Service Plans for each class of shares. Certain classes pay Fidelity Distributors Company LLC (FDC), an affiliate of the investment adviser, separate Distribution and Service Fees, each of which is based on an annual percentage of each class' average net assets. In addition, FDC may pay financial intermediaries for selling shares of the Fund and providing shareholder support services. For the period, the Distribution and Service Fee rates, total fees and amounts retained by FDC were as follows:
| Distribution Fee | Service Fee | Total Fees | Retained by FDC | |
| Class A | -% | .25% | $5,377 | $3,091 |
| Class M | .25% | .25% | 3,646 | 2,804 |
| Class C | .75% | .25% | 2,011 | 425 |
| $11,034 | $6,320 |
Sales Load. FDC may receive a front-end sales charge of up to 5.75% for selling Class A shares and 3.50% for selling Class M shares, some of which is paid to financial intermediaries for selling shares of the Fund. Depending on the holding period, FDC may receive contingent deferred sales charges levied on Class A, Class M and Class C redemptions. The deferred sales charges are 1.00% for Class C shares, 1.00% for certain purchases of Class A shares and .25% for certain purchases of Class M shares.
For the period, sales charge amounts retained by FDC were as follows:
| Retained by FDC | |
| Class A | $800 |
| Class M | 76 |
| Class C(a) | 57 |
| $933 |
(a) When Class C shares are initially sold, FDC pays commissions from its own resources to financial intermediaries through which the sales are made.
Transfer Agent Fees. Fidelity Investments Institutional Operations Company LLC (FIIOC), an affiliate of the investment adviser, is the transfer, dividend disbursing and shareholder servicing agent for each class of the Fund. FIIOC receives account fees and asset-based fees that vary according to the account size and type of account of the shareholders of the respective classes of the Fund, except for Class Z. FIIOC receives an asset-based fee of Class Z's average net assets. FIIOC pays for typesetting, printing and mailing of shareholder reports, except proxy statements.
For the period, transfer agent fees for each class were as follows:
| Amount | % of Class-Level Average Net Assets | |
| Class A | $5,498 | .26 |
| Class M | 1,468 | .20 |
| Class C | 579 | .29 |
| Class I | 1,645 | .13 |
| Class Z | 253 | .04 |
| $9,443 |
Accounting Fees. Fidelity Service Company, Inc. (FSC), an affiliate of the investment adviser, maintains the Fund's accounting records. The accounting fee is based on the level of average net assets for each month. For the period, the fees were equivalent to the following annual rates:
| % of Average Net Assets | |
| Fidelity Advisor Global Real Estate Fund | .04 |
Brokerage Commissions. A portion of portfolio transactions were placed with brokerage firms which are affiliates of the investment adviser. Brokerage commissions are included in net realized gain (loss) and change in net unrealized appreciation (depreciation) in the Statement of Operations. The commissions paid to these affiliated firms were as follows:
| Amount | |
| Fidelity Advisor Global Real Estate Fund | $41 |
Interfund Trades. Funds may purchase from or sell securities to other Fidelity Funds under procedures adopted by the Board. The procedures have been designed to ensure these interfund trades are executed in accordance with Rule 17a-7 of the 1940 Act. Any interfund trades are included within the respective purchases and sales amounts shown in the Purchases and Sales of Investments note and are noted in the table below.
| Purchases ($) | Sales ($) | |
| Fidelity Advisor Global Real Estate Fund | 45,284 | 94,430 |
6. Committed Line of Credit.
Certain Funds participate with other funds managed by the investment adviser or an affiliate in a $4.25 billion credit facility (the "line of credit") to be utilized for temporary or emergency purposes to fund shareholder redemptions or for other short-term liquidity purposes. The participating funds have agreed to pay commitment fees on their pro-rata portion of the line of credit, which are reflected in Miscellaneous expenses on the Statement of Operations, and are listed below. During the period, there were no borrowings on this line of credit.
| Amount | |
| Fidelity Advisor Global Real Estate Fund | $9 |
7. Expense Reductions.
The investment adviser contractually agreed to reimburse expenses of each class to the extent annual operating expenses exceeded certain levels of class-level average net assets as noted in the table below. This reimbursement will remain in place through November 30, 2022. Some expenses, for example the compensation of the independent Trustees, and certain miscellaneous expenses such as proxy and shareholder meeting expenses, are excluded from this reimbursement.
The following classes were in reimbursement during the period:
| Expense Limitations | Reimbursement | |
| Class A | 1.40%/1.30%(a) | $60,337 |
| Class M | 1.65%/1.55%(a) | 20,236 |
| Class C | 2.15%/2.05%(a) | 5,797 |
| Class I | 1.15%/1.05%(a) | 34,097 |
| Class Z | 1.00%/.90%(a) | 16,137 |
| $136,604 |
(a) Expense limitation effective June 1, 2021.
Commissions paid to certain brokers with whom the investment adviser, or its affiliates, places trades on behalf of the Fund include an amount in addition to trade execution, which may be rebated back to the Fund to offset expenses. This amount totaled $432 for the period. In addition, through arrangements with the Fund's custodian, credits realized as a result of certain uninvested cash balances were used to reduce the Fund's expenses. During the period, custodian credits reduced the Fund's expenses by $9.
In addition, during the period the investment adviser or an affiliate reimbursed and/or waived a portion of fund-level operating expenses in the amount of $51.
8. Distributions to Shareholders.
Distributions to shareholders of each class were as follows:
| Year ended July 31, 2021 | Year ended July 31, 2020 |
|
| Fidelity Advisor Global Real Estate Fund | ||
| Distributions to shareholders | ||
| Class A | $26,351 | $122,644 |
| Class M | 7,125 | 42,186 |
| Class C | – | 39,171 |
| Class I | 19,213 | 62,776 |
| Class Z | 2,877 | 25,746 |
| Total | $55,566 | $292,523 |
9. Share Transactions.
Share transactions for each class were as follows and may contain in-kind transactions, automatic conversions between classes or exchanges between affiliated funds:
| Shares | Shares | Dollars | Dollars | |
| Year ended July 31, 2021 | Year ended July 31, 2020 | Year ended July 31, 2021 | Year ended July 31, 2020 | |
| Fidelity Advisor Global Real Estate Fund | ||||
| Class A | ||||
| Shares sold | 56,801 | 67,738 | $613,618 | $745,778 |
| Reinvestment of distributions | 2,601 | 11,335 | 26,348 | 122,644 |
| Shares redeemed | (18,190) | (207,100) | (206,199) | (2,288,710) |
| Net increase (decrease) | 41,212 | (128,027) | $433,767 | $(1,420,288) |
| Class M | ||||
| Shares sold | 9,736 | 6,383 | $100,374 | $70,605 |
| Reinvestment of distributions | 704 | 3,899 | 7,125 | 42,186 |
| Shares redeemed | (8,197) | (17,790) | (82,487) | (189,680) |
| Net increase (decrease) | 2,243 | (7,508) | $25,012 | $(76,889) |
| Class C | ||||
| Shares sold | 6,163 | 4,308 | $63,461 | $45,165 |
| Reinvestment of distributions | – | 3,627 | – | 39,171 |
| Shares redeemed | (7,478) | (88,473) | (76,707) | (826,012) |
| Net increase (decrease) | (1,315) | (80,538) | $(13,246) | $(741,676) |
| Class I | ||||
| Shares sold | 25,794 | 19,620 | $266,297 | $193,070 |
| Reinvestment of distributions | 1,513 | 5,477 | 15,327 | 59,313 |
| Shares redeemed | (18,638) | (13,550) | (203,528) | (124,872) |
| Net increase (decrease) | 8,669 | 11,547 | $78,096 | $127,511 |
| Class Z | ||||
| Shares sold | 80,366 | 33,783 | $868,084 | $378,938 |
| Reinvestment of distributions | 281 | 2,125 | 2,850 | 23,031 |
| Shares redeemed | (10,753) | (40,352) | (114,293) | (391,233) |
| Net increase (decrease) | 69,894 | (4,444) | $756,641 | $10,736 |
10. Other.
Fund's organizational documents provide former and current trustees and officers with a limited indemnification against liabilities arising in connection with the performance of their duties to the fund. In the normal course of business, the fund may also enter into contracts that provide general indemnifications. The fund's maximum exposure under these arrangements is unknown as this would be dependent on future claims that may be made against the fund. The risk of material loss from such claims is considered remote.
At the end of the period, the investment adviser or its affiliates were owners of record of more than 10% of the outstanding shares as follows:
| Fund | Affiliated % |
| Fidelity Advisor Global Real Estate Fund | 44% |
11. Coronavirus (COVID-19) Pandemic.
An outbreak of COVID-19 first detected in China during December 2019 has since spread globally and was declared a pandemic by the World Health Organization during March 2020. Developments that disrupt global economies and financial markets, such as the COVID-19 pandemic, may magnify factors that affect the Fund's performance.
Report of Independent Registered Public Accounting Firm
To the Board of Trustees of Fidelity Advisor Series VII and Shareholders of Fidelity Advisor Global Real Estate Fund
Opinion on the Financial Statements and Financial Highlights
We have audited the accompanying statement of assets and liabilities of Fidelity Advisor Global Real Estate Fund (the "Fund"), a fund of Fidelity Advisor Series VII, including the schedule of investments, as of July 31, 2021, the related statement of operations for the year then ended, the statement of changes in net assets for each of the two years in the period then ended, the financial highlights for each of the four years in the period then ended and for the period from August 11, 2016 (commencement of operations) through July 31, 2017, and the related notes. In our opinion, the financial statements and financial highlights present fairly, in all material respects, the financial position of the Fund as of July 31, 2021, and the results of its operations for the year then ended, the changes in its net assets for each of the two years in the period then ended, and the financial highlights for each of the four years in the period then ended and for the period from August 11, 2016 (commencement of operations) through July 31, 2017 in conformity with accounting principles generally accepted in the United States of America.
Basis for Opinion
These financial statements and financial highlights are the responsibility of the Fund's management. Our responsibility is to express an opinion on the Fund's financial statements and financial highlights based on our audits. We are a public accounting firm registered with the Public Company Accounting Oversight Board (United States) (PCAOB) and are required to be independent with respect to the Fund in accordance with the U.S. federal securities laws and the applicable rules and regulations of the Securities and Exchange Commission and the PCAOB.
We conducted our audits in accordance with the standards of the PCAOB. Those standards require that we plan and perform the audit to obtain reasonable assurance about whether the financial statements and financial highlights are free of material misstatement, whether due to error or fraud. The Fund is not required to have, nor were we engaged to perform, an audit of its internal control over financial reporting. As part of our audits we are required to obtain an understanding of internal control over financial reporting but not for the purpose of expressing an opinion on the effectiveness of the Fund’s internal control over financial reporting. Accordingly, we express no such opinion.
Our audits included performing procedures to assess the risks of material misstatement of the financial statements and financial highlights, whether due to error or fraud, and performing procedures that respond to those risks. Such procedures included examining, on a test basis, evidence regarding the amounts and disclosures in the financial statements and financial highlights. Our audits also included evaluating the accounting principles used and significant estimates made by management, as well as evaluating the overall presentation of the financial statements and financial highlights. Our procedures included confirmation of securities owned as of July 31, 2021, by correspondence with the custodian and brokers; when replies were not received from brokers, we performed other auditing procedures. We believe that our audits provide a reasonable basis for our opinion.
/s/ Deloitte & Touche LLP
Boston, Massachusetts
September 14, 2021
We have served as the auditor of one or more of the Fidelity investment companies since 1999.
Trustees and Officers
The Trustees, Members of the Advisory Board (if any), and officers of the trust and fund, as applicable, are listed below. The Board of Trustees governs the fund and is responsible for protecting the interests of shareholders. The Trustees are experienced executives who meet periodically throughout the year to oversee the fund's activities, review contractual arrangements with companies that provide services to the fund, oversee management of the risks associated with such activities and contractual arrangements, and review the fund's performance. Each of the Trustees oversees 314 funds.
The Trustees hold office without limit in time except that (a) any Trustee may resign; (b) any Trustee may be removed by written instrument, signed by at least two-thirds of the number of Trustees prior to such removal; (c) any Trustee who requests to be retired or who has become incapacitated by illness or injury may be retired by written instrument signed by a majority of the other Trustees; and (d) any Trustee may be removed at any special meeting of shareholders by a two-thirds vote of the outstanding voting securities of the trust. Each Trustee who is not an interested person (as defined in the 1940 Act) of the trust and the fund is referred to herein as an Independent Trustee. Each Independent Trustee shall retire not later than the last day of the calendar year in which his or her 75th birthday occurs. The Independent Trustees may waive this mandatory retirement age policy with respect to individual Trustees. Officers and Advisory Board Members hold office without limit in time, except that any officer or Advisory Board Member may resign or may be removed by a vote of a majority of the Trustees at any regular meeting or any special meeting of the Trustees. Except as indicated, each individual has held the office shown or other offices in the same company for the past five years.
The fund’s Statement of Additional Information (SAI) includes more information about the Trustees. To request a free copy, call Fidelity at 1-877-208-0098.
Experience, Skills, Attributes, and Qualifications of the Trustees. The Governance and Nominating Committee has adopted a statement of policy that describes the experience, qualifications, attributes, and skills that are necessary and desirable for potential Independent Trustee candidates (Statement of Policy). The Board believes that each Trustee satisfied at the time he or she was initially elected or appointed a Trustee, and continues to satisfy, the standards contemplated by the Statement of Policy. The Governance and Nominating Committee also engages professional search firms to help identify potential Independent Trustee candidates who have the experience, qualifications, attributes, and skills consistent with the Statement of Policy. From time to time, additional criteria based on the composition and skills of the current Independent Trustees, as well as experience or skills that may be appropriate in light of future changes to board composition, business conditions, and regulatory or other developments, have also been considered by the professional search firms and the Governance and Nominating Committee. In addition, the Board takes into account the Trustees' commitment and participation in Board and committee meetings, as well as their leadership of standing and ad hoc committees throughout their tenure.
In determining that a particular Trustee was and continues to be qualified to serve as a Trustee, the Board has considered a variety of criteria, none of which, in isolation, was controlling. The Board believes that, collectively, the Trustees have balanced and diverse experience, qualifications, attributes, and skills, which allow the Board to operate effectively in governing the fund and protecting the interests of shareholders. Information about the specific experience, skills, attributes, and qualifications of each Trustee, which in each case led to the Board's conclusion that the Trustee should serve (or continue to serve) as a trustee of the fund, is provided below.
Board Structure and Oversight Function. Robert A. Lawrence is an interested person and currently serves as Acting Chairman. The Trustees have determined that an interested Chairman is appropriate and benefits shareholders because an interested Chairman has a personal and professional stake in the quality and continuity of services provided to the fund. Independent Trustees exercise their informed business judgment to appoint an individual of their choosing to serve as Chairman, regardless of whether the Trustee happens to be independent or a member of management. The Independent Trustees have determined that they can act independently and effectively without having an Independent Trustee serve as Chairman and that a key structural component for assuring that they are in a position to do so is for the Independent Trustees to constitute a substantial majority for the Board. The Independent Trustees also regularly meet in executive session. David M. Thomas serves as Lead Independent Trustee and as such (i) acts as a liaison between the Independent Trustees and management with respect to matters important to the Independent Trustees and (ii) with management prepares agendas for Board meetings.
Fidelity® funds are overseen by different Boards of Trustees. The fund's Board oversees Fidelity's high income and certain equity funds, and other Boards oversee Fidelity's investment-grade bond, money market, asset allocation, and other equity funds. The asset allocation funds may invest in Fidelity® funds overseen by the fund's Board. The use of separate Boards, each with its own committee structure, allows the Trustees of each group of Fidelity® funds to focus on the unique issues of the funds they oversee, including common research, investment, and operational issues. On occasion, the separate Boards establish joint committees to address issues of overlapping consequences for the Fidelity® funds overseen by each Board.
The Trustees operate using a system of committees to facilitate the timely and efficient consideration of all matters of importance to the Trustees, the fund, and fund shareholders and to facilitate compliance with legal and regulatory requirements and oversight of the fund's activities and associated risks. The Board, acting through its committees, has charged FMR and its affiliates with (i) identifying events or circumstances the occurrence of which could have demonstrably adverse effects on the fund's business and/or reputation; (ii) implementing processes and controls to lessen the possibility that such events or circumstances occur or to mitigate the effects of such events or circumstances if they do occur; and (iii) creating and maintaining a system designed to evaluate continuously business and market conditions in order to facilitate the identification and implementation processes described in (i) and (ii) above. Because the day-to-day operations and activities of the fund are carried out by or through FMR, its affiliates, and other service providers, the fund's exposure to risks is mitigated but not eliminated by the processes overseen by the Trustees. While each of the Board's committees has responsibility for overseeing different aspects of the fund's activities, oversight is exercised primarily through the Operations, Audit, and Compliance Committees. Appropriate personnel, including but not limited to the fund's Chief Compliance Officer (CCO), FMR's internal auditor, the independent accountants, the fund's Treasurer and portfolio management personnel, make periodic reports to the Board's committees, as appropriate, including an annual review of Fidelity's risk management program for the Fidelity® funds. The responsibilities of each standing committee, including their oversight responsibilities, are described further under "Standing Committees of the Trustees."
Interested Trustees*:
Correspondence intended for a Trustee who is an interested person may be sent to Fidelity Investments, 245 Summer Street, Boston, Massachusetts 02210.
Name, Year of Birth; Principal Occupations and Other Relevant Experience+
Bettina Doulton (1964)
Year of Election or Appointment: 2020
Trustee
Ms. Doulton also serves as Trustee of other Fidelity® funds. Prior to her retirement, Ms. Doulton served in a variety of positions at Fidelity Investments, including as a managing director of research (2006-2007), portfolio manager to certain Fidelity® funds (1993-2005), equity analyst and portfolio assistant (1990-1993), and research assistant (1987-1990). Ms. Doulton currently owns and operates Phi Builders + Architects and Cellardoor Winery. Previously, Ms. Doulton served as a member of the Board of Brown Capital Management, LLC (2014-2018).
Robert A. Lawrence (1952)
Year of Election or Appointment: 2020
Trustee
Acting Chairman of the Board of Trustees
Mr. Lawrence also serves as Trustee of other funds. Previously, Mr. Lawrence served as a Member of the Advisory Board of certain funds. Prior to his retirement in 2008, Mr. Lawrence served as Vice President of certain Fidelity® funds (2006-2008), Senior Vice President, Head of High Income Division of Fidelity Management & Research Company (investment adviser firm, 2006-2008), and President of Fidelity Strategic Investments (investment adviser firm, 2002-2005).
* Determined to be an “Interested Trustee” by virtue of, among other things, his or her affiliation with the trust or various entities under common control with FMR.
+ The information includes the Trustee's principal occupation during the last five years and other information relating to the experience, attributes, and skills relevant to the Trustee's qualifications to serve as a Trustee, which led to the conclusion that the Trustee should serve as a Trustee for the fund.
Independent Trustees:
Correspondence intended for an Independent Trustee may be sent to Fidelity Investments, P.O. Box 55235, Boston, Massachusetts 02205-5235.
Name, Year of Birth; Principal Occupations and Other Relevant Experience+
Thomas P. Bostick (1956)
Year of Election or Appointment: 2021
Trustee
Lieutenant General Bostick also serves as Trustee of other Fidelity® funds. Prior to his retirement, General Bostick (United States Army, Retired) held a variety of positions within the U.S. Army, including Commanding General and Chief of Engineers, U.S. Army Corps of Engineers (2012-2016) and Deputy Chief of Staff and Director of Human Resources, U.S. Army (2009-2012). General Bostick currently serves as a member of the Board and Finance and Governance Committees of CSX Corporation (transportation, 2020-present) and a member of the Board and Corporate Governance and Nominating Committee of Perma-Fix Environmental Services, Inc. (nuclear waste management, 2020-present). General Bostick serves as Chief Executive Officer of Bostick Global Strategies, LLC (consulting, 2016-present) and Managing Partner, Sustainability, of Ridge-Lane Limited Partners (strategic advisory and venture development, 2016-present). Previously, General Bostick served as a Member of the Advisory Board of certain Fidelity® funds (2021), President, Intrexon Bioengineering (2018-2020) and Chief Operating Officer (2017-2020) and Senior Vice President of the Environment Sector (2016-2017) of Intrexon Corporation (biopharmaceutical company).
Dennis J. Dirks (1948)
Year of Election or Appointment: 2018
Trustee
Mr. Dirks also serves as Trustee of other Fidelity® funds. Prior to his retirement in May 2003, Mr. Dirks served as Chief Operating Officer and as a member of the Board of The Depository Trust & Clearing Corporation (financial markets infrastructure), President, Chief Operating Officer and a member of the Board of The Depository Trust Company (DTC), President and a member of the Board of the National Securities Clearing Corporation (NSCC), Chief Executive Officer and a member of the Board of the Government Securities Clearing Corporation and Chief Executive Officer and a member of the Board of the Mortgage-Backed Securities Clearing Corporation. Mr. Dirks currently serves as a member of the Finance Committee (2016-present) and Board (2017-present) and is Treasurer (2018-present) of the Asolo Repertory Theatre.
Donald F. Donahue (1950)
Year of Election or Appointment: 2018
Trustee
Mr. Donahue also serves as Trustee of other Fidelity® funds. Mr. Donahue serves as President and Chief Executive Officer of Miranda Partners, LLC (risk consulting for the financial services industry, 2012-present). Previously, Mr. Donahue served as Chief Executive Officer (2006-2012), Chief Operating Officer (2003-2006) and Managing Director, Customer Marketing and Development (1999-2003) of The Depository Trust & Clearing Corporation (financial markets infrastructure). Mr. Donahue currently serves as a member (2007-present) and Co-Chairman (2016-present) of the Board of United Way of New York and a member of the Board of NYC Leadership Academy (2012-present). Mr. Donahue previously served as a member of the Advisory Board of certain Fidelity® funds (2015-2018).
Vicki L. Fuller (1957)
Year of Election or Appointment: 2020
Trustee
Ms. Fuller also serves as Trustee of other Fidelity® funds. Previously, Ms. Fuller served as a member of the Advisory Board of certain Fidelity® funds (2018-2020), Chief Investment Officer of the New York State Common Retirement Fund (2012-2018) and held a variety of positions at AllianceBernstein L.P. (global asset management, 1985-2012), including Managing Director (2006-2012) and Senior Vice President and Senior Portfolio Manager (2001-2006). Ms. Fuller currently serves as a member of the Board, Audit Committee and Nominating and Governance Committee of The Williams Companies, Inc. (natural gas infrastructure, 2018-present), as a member of the Board, Audit Committee and Nominating and Governance Committee of two Blackstone business development companies (2020-present) and as a member of the Board of Treliant, LLC (consulting, 2019-present).
Patricia L. Kampling (1959)
Year of Election or Appointment: 2020
Trustee
Ms. Kampling also serves as Trustee of other Fidelity® funds. Prior to her retirement, Ms. Kampling served as Chairman of the Board and Chief Executive Officer (2012-2019), President and Chief Operating Officer (2011-2012) and Executive Vice President and Chief Financial Officer (2010-2011) of Alliant Energy Corporation. Ms. Kampling currently serves as a member of the Board, Finance Committee and Governance, Compensation and Nominating Committee of Xcel Energy Inc. (utilities company, 2020-present) and as a member of the Board, Audit, Finance and Risk Committee and Safety, Environmental, Technology and Operations Committee of American Water Works Company, Inc. (utilities company, 2019-present). In addition, Ms. Kampling currently serves as a member of the Board of the Nature Conservancy, Wisconsin Chapter (2019-present). Previously, Ms. Kampling served as a Member of the Advisory Board of certain Fidelity® funds (2020), a member of the Board, Compensation Committee and Executive Committee and Chair of the Audit Committee of Briggs & Stratton Corporation (manufacturing, 2011-2021), a member of the Board of Interstate Power and Light Company (2012-2019) and Wisconsin Power and Light Company (2012-2019) (each a subsidiary of Alliant Energy Corporation) and as a member of the Board and Workforce Development Committee of the Business Roundtable (2018-2019).
Thomas A. Kennedy (1955)
Year of Election or Appointment: 2021
Trustee
Mr. Kennedy also serves as Trustee of other Fidelity® funds. Previously, Mr. Kennedy served as a Member of the Advisory Board of certain Fidelity® funds (2020) and held a variety of positions at Raytheon Company (aerospace and defense, 1983-2020), including Chairman and Chief Executive Officer (2014-2020) and Executive Vice President and Chief Operating Officer (2013-2014). Mr. Kennedy currently serves as Executive Chairman of the Board of Directors of Raytheon Technologies Corporation (aerospace and defense, 2020-present). He is also a member of the Rutgers School of Engineering Industry Advisory Board (2011-present) and a member of the UCLA Engineering Dean’s Executive Board (2016-present).
Oscar Munoz (1959)
Year of Election or Appointment: 2021
Trustee
Mr. Munoz also serves as Trustee of other Fidelity® funds. Prior to his retirement, Mr. Munoz served as Executive Chairman (2020-2021), Chief Executive Officer (2015-2020), President (2015-2016) and a member of the Board (2010-2021) of United Airlines Holdings, Inc. Mr. Munoz currently serves as a member of the Board of CBRE Group, Inc. (commercial real estate, 2020-present), a member of the Board of Univision Communications, Inc. (Hispanic media, 2020-present) and a member of the Advisory Board of Salesforce.com, Inc. (cloud-based software, 2020-present). Previously, Mr. Munoz served as a Member of the Advisory Board of certain Fidelity® funds (2021).
Garnett A. Smith (1947)
Year of Election or Appointment: 2013
Trustee
Mr. Smith also serves as Trustee of other Fidelity® funds. Prior to his retirement, Mr. Smith served as Chairman and Chief Executive Officer (1990-1997) and President (1986-1990) of Inbrand Corp. (manufacturer of personal absorbent products). Prior to his employment with Inbrand Corp., he was employed by a retail fabric chain and North Carolina National Bank (now Bank of America). Mr. Smith previously served as a member of the Advisory Board of certain Fidelity® funds (2012-2013).
David M. Thomas (1949)
Year of Election or Appointment: 2018
Trustee
Lead Independent Trustee
Mr. Thomas also serves as Trustee of other Fidelity® funds. Previously, Mr. Thomas served as Executive Chairman (2005-2006) and Chairman and Chief Executive Officer (2000-2005) of IMS Health, Inc. (pharmaceutical and healthcare information solutions). Mr. Thomas currently serves as a member of the Board of Fortune Brands Home and Security (home and security products, 2004-present) and Presiding Director (2013-present) of Interpublic Group of Companies, Inc. (marketing communication).
Susan Tomasky (1953)
Year of Election or Appointment: 2020
Trustee
Ms. Tomasky also serves as Trustee of other Fidelity® funds. Prior to her retirement, Ms. Tomasky served in various executive officer positions at American Electric Power Company, Inc. (1998-2011), including most recently as President of AEP Transmission (2007-2011). Ms. Tomasky currently serves as a member of the Board and Sustainability Committee and as Chair of the Audit Committee of Marathon Petroleum Corporation (2018-present) and as a member of the Board, Corporate Governance Committee and Organization and Compensation Committee and as Chair of the Audit Committee of Public Service Enterprise Group, Inc. (utilities company, 2012-present). In addition, Ms. Tomasky currently serves as a member (2009-present) and President (2020-present) of the Board of the Royal Shakespeare Company – America (2009-present), as a member of the Board of the Columbus Association for the Performing Arts (2011-present) and as a member of the Board and Investment Committee of Kenyon College (2016-present). Previously, Ms. Tomasky served as a Member of the Advisory Board of certain Fidelity® funds (2020), as a member of the Board of the Columbus Regional Airport Authority (2007-2020), as a member of the Board (2011-2018) and Lead Independent Director (2015-2018) of Andeavor Corporation (previously Tesoro Corporation) (independent oil refiner and marketer) and as a member of the Board of Summit Midstream Partners LP (energy, 2012-2018).
Michael E. Wiley (1950)
Year of Election or Appointment: 2008
Trustee
Mr. Wiley also serves as Trustee of other Fidelity® funds. Previously, Mr. Wiley served as a member of the Advisory Board of certain Fidelity® funds (2018-2020), Chairman, President and CEO of Baker Hughes, Inc. (oilfield services, 2000-2004). Mr. Wiley also previously served as a member of the Board of Andeavor Corporation (independent oil refiner and marketer, 2005-2018), a member of the Board of Andeavor Logistics LP (natural resources logistics, 2015-2018) and a member of the Board of High Point Resources (exploration and production, 2005-2020).
+ The information includes the Trustee's principal occupation during the last five years and other information relating to the experience, attributes, and skills relevant to the Trustee's qualifications to serve as a Trustee, which led to the conclusion that the Trustee should serve as a Trustee for the fund.
Advisory Board Members and Officers:
Correspondence intended for a Member of the Advisory Board (if any) may be sent to Fidelity Investments, P.O. Box 55235, Boston, Massachusetts 02205-5235. Correspondence intended for an officer or Peter S. Lynch may be sent to Fidelity Investments, 245 Summer Street, Boston, Massachusetts 02210. Officers appear below in alphabetical order.
Name, Year of Birth; Principal Occupation
Peter S. Lynch (1944)
Year of Election or Appointment: 2018
Member of the Advisory Board
Mr. Lynch also serves as a Member of the Advisory Board of other Fidelity® funds. Mr. Lynch is Vice Chairman and a Director of Fidelity Management & Research Company LLC (investment adviser firm). In addition, Mr. Lynch serves as a Trustee of Boston College and as the Chairman of the Inner-City Scholarship Fund. Previously, Mr. Lynch served as Vice Chairman and a Director of FMR Co., Inc. (investment adviser firm) and on the Special Olympics International Board of Directors (1997-2006).
Craig S. Brown (1977)
Year of Election or Appointment: 2019
Assistant Treasurer
Mr. Brown also serves as an officer of other funds. Mr. Brown serves as Assistant Treasurer of FIMM, LLC (2021-present) and is an employee of Fidelity Investments (2013-present).
John J. Burke III (1964)
Year of Election or Appointment: 2018
Chief Financial Officer
Mr. Burke also serves as Chief Financial Officer of other funds. Mr. Burke serves as Head of Investment Operations for Fidelity Fund and Investment Operations (2018-present) and is an employee of Fidelity Investments (1998-present). Previously Mr. Burke served as head of Asset Management Investment Operations (2012-2018).
William C. Coffey (1969)
Year of Election or Appointment: 2019
Assistant Secretary
Mr. Coffey also serves as Assistant Secretary of other funds. He is Senior Vice President and Deputy General Counsel of FMR LLC (diversified financial services company, 2010-present), and is an employee of Fidelity Investments. Previously, Mr. Coffey served as Secretary and CLO of certain funds (2018-2019); CLO, Secretary, and Senior Vice President of Fidelity Management & Research Company and FMR Co., Inc. (investment adviser firms, 2018-2019); Secretary of Fidelity SelectCo, LLC and Fidelity Investments Money Management, Inc. (investment adviser firms, 2018-2019); CLO of Fidelity Management & Research (Hong Kong) Limited, FMR Investment Management (UK) Limited, and Fidelity Management & Research (Japan) Limited (investment adviser firms, 2018-2019); and Assistant Secretary of certain funds (2009-2018).
Timothy M. Cohen (1969)
Year of Election or Appointment: 2018
Vice President
Mr. Cohen also serves as Vice President of other funds. Mr. Cohen serves as Co-Head of Equity (2018-present), a Director of Fidelity Management & Research (Japan) Limited (investment adviser firm, 2016-present), and is an employee of Fidelity Investments. Previously, Mr. Cohen served as Executive Vice President of Fidelity SelectCo, LLC (2019), Head of Global Equity Research (2016-2018), Chief Investment Officer - Equity and a Director of Fidelity Management & Research (U.K.) Inc. (investment adviser firm, 2013-2015) and as a Director of Fidelity Management & Research (Hong Kong) Limited (investment adviser firm, 2017).
Jonathan Davis (1968)
Year of Election or Appointment: 2010
Assistant Treasurer
Mr. Davis also serves as an officer of other funds. Mr. Davis serves as Assistant Treasurer of FIMM, LLC (2021-present) and FMR Capital, Inc. (2017-present) and is an employee of Fidelity Investments. Previously, Mr. Davis served as Vice President and Associate General Counsel of FMR LLC (diversified financial services company, 2003-2010).
Laura M. Del Prato (1964)
Year of Election or Appointment: 2018
Assistant Treasurer
Ms. Del Prato also serves as an officer of other funds. Ms. Del Prato serves as Assistant Treasurer of FIMM, LLC (2021-present) and is an employee of Fidelity Investments (2017-present). Previously, Ms. Del Prato served as President and Treasurer of The North Carolina Capital Management Trust: Cash Portfolio and Term Portfolio (2018-2020). Prior to joining Fidelity Investments, Ms. Del Prato served as a Managing Director and Treasurer of the JPMorgan Mutual Funds (2014-2017). Prior to JPMorgan, Ms. Del Prato served as a partner at Cohen Fund Audit Services (accounting firm, 2012-2013) and KPMG LLP (accounting firm, 2004-2012).
Colm A. Hogan (1973)
Year of Election or Appointment: 2020
Assistant Treasurer
Mr. Hogan also serves as an officer of other funds. Mr. Hogan serves as Assistant Treasurer of FIMM, LLC (2021-present) and FMR Capital, Inc. (2017-present) and is an employee of Fidelity Investments (2005-present). Previously, Mr. Hogan served as Deputy Treasurer of certain Fidelity® funds (2016-2020) and Assistant Treasurer of certain Fidelity® funds (2016-2018).
Pamela R. Holding (1964)
Year of Election or Appointment: 2018
Vice President
Ms. Holding also serves as Vice President of other funds. Ms. Holding serves as Co-Head of Equity (2018-present) and is an employee of Fidelity Investments (2013-present). Previously, Ms. Holding served as Executive Vice President of Fidelity SelectCo, LLC (2019) and as Chief Investment Officer of Fidelity Institutional Asset Management (2013-2018).
Cynthia Lo Bessette (1969)
Year of Election or Appointment: 2019
Secretary and Chief Legal Officer (CLO)
Ms. Lo Bessette also serves as an officer of other funds. Ms. Lo Bessette serves as CLO, Secretary, and Senior Vice President of Fidelity Management & Research Company LLC (investment adviser firm, 2019-present); and CLO of Fidelity Management & Research (Hong Kong) Limited, FMR Investment Management (UK) Limited, and Fidelity Management & Research (Japan) Limited (investment adviser firms, 2019-present). She is a Senior Vice President and Deputy General Counsel of FMR LLC (diversified financial services company, 2019-present), and is an employee of Fidelity Investments. Previously, Ms. Lo Bessette served as CLO, Secretary, and Senior Vice President of FMR Co., Inc. (investment adviser firm, 2019); Secretary of Fidelity SelectCo, LLC and Fidelity Investments Money Management, Inc. (investment adviser firms, 2019). Prior to joining Fidelity Investments, Ms. Lo Bessette was Executive Vice President, General Counsel (2016-2019) and Senior Vice President, Deputy General Counsel (2015-2016) of OppenheimerFunds (investment management company) and Deputy Chief Legal Officer (2013-2015) of Jennison Associates LLC (investment adviser firm).
Chris Maher (1972)
Year of Election or Appointment: 2020
Deputy Treasurer
Mr. Maher also serves as an officer of other funds. Mr. Maher serves as Assistant Treasurer of FIMM, LLC (2021-present) and FMR Capital, Inc. (2017-present), and is an employee of Fidelity Investments (2008-present). Previously, Mr. Maher served as Assistant Treasurer of certain funds (2013-2020); Vice President of Asset Management Compliance (2013), Vice President of the Program Management Group of FMR (investment adviser firm, 2010-2013), and Vice President of Valuation Oversight (2008-2010).
Jason P. Pogorelec (1975)
Year of Election or Appointment: 2020
Chief Compliance Officer
Mr. Pogorelec also serves as Chief Compliance Officer of other funds. Mr. Pogorelec is a senior Vice President of Asset Management Compliance for Fidelity Investments and is an employee of Fidelity Investments (2006-present). Previously, Mr. Pogorelec served as Vice President, Associate General Counsel for Fidelity Investments (2010-2020) and Assistant Secretary of certain Fidelity funds (2015-2020).
Brett Segaloff (1972)
Year of Election or Appointment: 2021
Anti-Money Laundering (AML) Officer
Mr. Segaloff also serves as an AML Officer of other funds and other related entities. He is Director, Anti-Money Laundering (2007-present) of FMR LLC (diversified financial services company) and is an employee of Fidelity Investments (1996-present).
Stacie M. Smith (1974)
Year of Election or Appointment: 2018
President and Treasurer
Ms. Smith also serves as an officer of other funds. Ms. Smith serves as Assistant Treasurer of FIMM, LLC (2021-present) and FMR Capital, Inc. (2017-present), is an employee of Fidelity Investments (2009-present), and has served in other fund officer roles. Prior to joining Fidelity Investments, Ms. Smith served as Senior Audit Manager of Ernst & Young LLP (accounting firm, 1996-2009). Previously, Ms. Smith served as Assistant Treasurer (2013-2019) and Deputy Treasurer (2013-2016) of certain Fidelity® funds.
Marc L. Spector (1972)
Year of Election or Appointment: 2017
Assistant Treasurer
Mr. Spector also serves as an officer of other funds. Mr. Spector serves as Assistant Treasurer of FIMM, LLC (2021-present) and FMR Capital, Inc. (2017-present) and is an employee of Fidelity Investments (2016-present). Prior to joining Fidelity Investments, Mr. Spector served as Director at the Siegfried Group (accounting firm, 2013-2016), and prior to Siegfried Group as audit senior manager at Deloitte & Touche LLP (accounting firm, 2005-2013).
Jim Wegmann (1979)
Year of Election or Appointment: 2019
Assistant Treasurer
Mr. Wegmann also serves as an officer of other funds. Mr. Wegmann serves as Assistant Treasurer of FIMM, LLC (2021-present) and is an employee of Fidelity Investments (2011-present).
Shareholder Expense Example
As a shareholder, you incur two types of costs: (1) transaction costs, which may include sales charges (loads) on purchase payments or redemption proceeds, as applicable and (2) ongoing costs, which generally include management fees, distribution and/or service (12b-1) fees and other Fund expenses. This Example is intended to help you understand your ongoing costs (in dollars) of investing in a fund and to compare these costs with the ongoing costs of investing in other mutual funds.
The Example is based on an investment of $1,000 invested at the beginning of the period and held for the entire period (February 1, 2021 to July 31, 2021).
Actual Expenses
The first line of the accompanying table provides information about actual account values and actual expenses. You may use the information in this line, together with the amount you invested, to estimate the expenses that you paid over the period. Simply divide your account value by $1,000.00 (for example, an $8,600 account value divided by $1,000.00 = 8.6), then multiply the result by the number in the first line for a class/Fund under the heading entitled "Expenses Paid During Period" to estimate the expenses you paid on your account during this period. If any fund is a shareholder of any underlying mutual funds or exchange-traded funds (ETFs) (the Underlying Funds), such fund indirectly bears its proportional share of the expenses of the Underlying Funds in addition to the direct expenses incurred presented in the table. These fees and expenses are not included in the annualized expense ratio used to calculate the expense estimate in the table below.
Hypothetical Example for Comparison Purposes
The second line of the accompanying table provides information about hypothetical account values and hypothetical expenses based on the actual expense ratio and an assumed rate of return of 5% per year before expenses, which is not the actual return. The hypothetical account values and expenses may not be used to estimate the actual ending account balance or expenses you paid for the period. You may use this information to compare the ongoing costs of investing in the Fund and other funds. To do so, compare this 5% hypothetical example with the 5% hypothetical examples that appear in the shareholder reports of the other funds. If any fund is a shareholder of any Underlying Funds, such fund indirectly bears its proportional share of the expenses of the Underlying Funds in addition to the direct expenses as presented in the table. These fees and expenses are not included in the annualized expense ratio used to calculate the expense estimate in the table below.
Please note that the expenses shown in the table are meant to highlight your ongoing costs only and do not reflect any transaction costs. Therefore, the second line of the table is useful in comparing ongoing costs only, and will not help you determine the relative total costs of owning different funds. In addition, if these transactional costs were included, your costs would have been higher.
| Annualized Expense Ratio-A | Beginning Account Value February 1, 2021 | Ending Account Value July 31, 2021 | Expenses Paid During Period-B February 1, 2021 to July 31, 2021 |
|
| Fidelity Advisor Global Real Estate Fund | ||||
| Class A | 1.37% | |||
| Actual | $1,000.00 | $1,229.30 | $7.57** | |
| Hypothetical-C | $1,000.00 | $1,018.00 | $6.85** | |
| Class M | 1.62% | |||
| Actual | $1,000.00 | $1,227.60 | $8.95 | |
| Hypothetical-C | $1,000.00 | $1,016.76 | $8.10 | |
| Class C | 2.12% | |||
| Actual | $1,000.00 | $1,225.00 | $11.70 | |
| Hypothetical-C | $1,000.00 | $1,014.28 | $10.59 | |
| Class I | 1.12% | |||
| Actual | $1,000.00 | $1,230.10 | $6.19** | |
| Hypothetical-C | $1,000.00 | $1,019.24 | $5.61** | |
| Class Z | .97% | |||
| Actual | $1,000.00 | $1,231.40 | $5.37** | |
| Hypothetical-C | $1,000.00 | $1,019.98 | $4.86** |
A Annualized expense ratio reflects expenses net of applicable fee waivers.
B Expenses are equal to the annualized expense ratio, multiplied by the average account value over the period, multiplied by 181/ 365 (to reflect the one-half year period). The fees and expenses of any Underlying Funds are not included in each annualized expense ratio.
C 5% return per year before expenses
**If fees and changes to the class level expense contract and/or expense cap, effective June 1, 2021, had been in effect during the entire current period, the restated annualized expense ratio and the expenses paid in the actual and hypothetical examples above would have been as shown in table below:
| Annualized Expense Ratio-(a)
| Expenses Paid |
|
| Fidelity Advisor Global Real Estate Fund | ||
| Class A | 1.30% | |
| Actual | $7.19 | |
| Hypothetical-(b) | $6.51 | |
| Class I | 1.05% | |
| Actual | $5.81 | |
| Hypothetical-(b) | $5.26 | |
| Class Z | .90% | |
| Actual | $4.98 | |
| Hypothetical-(b) | $4.51 |
(a) Annualized expense ratio reflects expenses net of applicable fee waivers.
(b) 5% return per year before expenses
Distributions (Unaudited)
Class A designates 39%; Class M designates 23%; and Class I designates 48%; Class Z designates 48% of the dividend distributed in December 2020 during the fiscal year as a section 199A dividend.
Class A designates 62%; Class M designates 78%; Class I designates 53%; and Class Z designates 53%; of the dividend distributed in December 2020, during the fiscal year as amounts which may be taken into account as a dividend for purposes of the maximum rate under section 1(h)(11) of the Internal Revenue Code.
The fund will notify shareholders in January 2022 of amounts for use in preparing 2021 income tax returns.
Board Approval of Investment Advisory Contracts and Management Fees
Fidelity Advisor Global Real Estate Fund
Each year, the Board of Trustees, including the Independent Trustees (together, the Board), votes on the renewal of the management contract with Fidelity Management & Research Company LLC (FMR) and the sub-advisory agreements (together, the Advisory Contracts) for the fund. FMR and the sub-advisers are referred to herein as the Investment Advisers. The Board, assisted by the advice of fund counsel and Independent Trustees' counsel, requests and considers a broad range of information relevant to the renewal of the Advisory Contracts throughout the year.The Board meets regularly and, at each of its meetings, covers an extensive agenda of topics and materials and considers factors that are relevant to its annual consideration of the renewal of the fund's Advisory Contracts, including the services and support provided to the fund and its shareholders. The Board has established various standing committees (Committees), each composed of and chaired by Independent Trustees with varying backgrounds, to which the Board has assigned specific subject matter responsibilities in order to enhance effective decision-making by the Board. The Board, acting directly and through its Committees, requests and receives information concerning the annual consideration of the renewal of the fund's Advisory Contracts. The Board also meets as needed to review matters specifically related to the Board's annual consideration of the renewal of the Advisory Contracts. Members of the Board may also meet with trustees of other Fidelity funds through joint ad hoc committees to discuss certain matters relevant to all of the Fidelity funds.At its May 2021 meeting, the Board unanimously determined to renew the fund's Advisory Contracts. In reaching its determination, the Board considered all factors it believed relevant, including (i) the nature, extent, and quality of the services provided to the fund and its shareholders (including the investment performance of the fund); (ii) the competitiveness of the fund's management fee and total expense ratio relative to peer funds; (iii) the total costs of the services provided by and the profits realized by Fidelity from its relationships with the fund; and (iv) the extent to which, if any, economies of scale exist and are realized as the fund grows, and whether any economies of scale are appropriately shared with fund shareholders.In considering whether to renew the Advisory Contracts for the fund, the Board reached a determination, with the assistance of fund counsel and Independent Trustees' counsel and through the exercise of its business judgment, that the renewal of the Advisory Contracts was in the best interests of the fund and its shareholders and that the compensation payable under the Advisory Contracts was fair and reasonable. The Board's decision to renew the Advisory Contracts was not based on any single factor, but rather was based on a comprehensive consideration of all the information provided to the Board at its meetings throughout the year. The Board, in reaching its determination to renew the Advisory Contracts, was aware that shareholders of the fund have a broad range of investment choices available to them, including a wide choice among funds offered by Fidelity's competitors, and that the fund's shareholders, who have the opportunity to review and weigh the disclosure provided by the fund in its prospectus and other public disclosures, have chosen to invest in this fund, which is part of the Fidelity family of funds. Nature, Extent, and Quality of Services Provided. The Board considered Fidelity's staffing as it relates to the fund, including the backgrounds of investment personnel of Fidelity, and also considered the fund's investment objective, strategies, and related investment philosophy. The Independent Trustees also had discussions with senior management of Fidelity's investment operations and investment groups. The Board considered the structure of the investment personnel compensation program and whether this structure provides appropriate incentives to act in the best interests of the fund. Additionally, the Board considered the portfolio managers' investments, if any, in the funds that they manage. Resources Dedicated to Investment Management and Support Services. The Board and the Fund Oversight and Research Committees reviewed the general qualifications and capabilities of Fidelity's investment staff, including its size, education, experience, and resources, as well as Fidelity's approach to recruiting, training, managing, and compensating investment personnel. The Board noted that Fidelity has continued to increase the resources devoted to non-U.S. offices, including expansion of Fidelity's global investment organization. The Board also noted that Fidelity's analysts have extensive resources, tools and capabilities that allow them to conduct sophisticated quantitative and fundamental analysis, as well as credit analysis of issuers, counterparties and guarantors. Further, the Board considered that Fidelity's investment professionals have sufficient access to global information and data so as to provide competitive investment results over time, and that those professionals also have access to sophisticated tools that permit them to assess portfolio construction and risk and performance attribution characteristics continuously, as well as to transmit new information and research conclusions rapidly around the world. Additionally, in its deliberations, the Board considered Fidelity's trading, risk management, compliance, and technology and operations capabilities and resources, which are integral parts of the investment management process. The Board also considered Fidelity's investments in business continuity planning, and its success in continuously providing services to the fund notwithstanding the severe disruptions caused by the COVID-19 pandemic. Shareholder and Administrative Services. The Board considered (i) the nature, extent, quality, and cost of advisory, administrative, and shareholder services performed by the Investment Advisers and their affiliates under the Advisory Contracts and under separate agreements covering transfer agency, pricing and bookkeeping, and securities lending services for the fund; (ii) the nature and extent of the supervision of third party service providers, principally custodians, subcustodians, and pricing vendors; and (iii) the resources devoted to, and the record of compliance with, the fund's compliance policies and procedures. The Board also reviewed the allocation of fund brokerage, including allocations to brokers affiliated with the Investment Advisers, the use of brokerage commissions to pay fund expenses, and the use of "soft" commission dollars to pay for research services.The Board noted that the growth of fund assets over time across the complex allows Fidelity to reinvest in the development of services designed to enhance the value and convenience of the Fidelity funds as investment vehicles. These services include 24-hour access to account information and market information over the Internet and through telephone representatives, investor education materials and asset allocation tools, and the expanded availability of Fidelity Investor Centers.The Board noted that, in the past, it and the boards of certain other Fidelity funds had formed an ad hoc Committee on Transfer Agency Fees to review the variety of transfer agency fee structures throughout the industry and Fidelity's competitive positioning with respect to industry participants. Investment in a Large Fund Family. The Board considered the benefits to shareholders of investing in a Fidelity fund, including the benefits of investing in a fund that is part of a large family of funds offering a variety of investment disciplines and providing a large variety of mutual fund investor services. The Board noted that Fidelity had taken, or had made recommendations that resulted in the Fidelity funds taking, a number of actions over the previous year that benefited particular funds, including: (i) continuing to dedicate additional resources to Fidelity's investment research process, which includes meetings with management of issuers of securities in which the funds invest, and to the support of the senior management team that oversees asset management; (ii) continuing efforts to enhance Fidelity's global research capabilities; (iii) launching new funds and ETFs with innovative structures, strategies and pricing and making other enhancements to meet client needs; (iv) launching new share classes of existing funds; (v) eliminating purchase minimums and broadening eligibility requirements for certain funds and share classes; (vi) approving the reduction in the holding period for the Class C to Class A conversion policy; (vii) reducing management fees and total expenses for certain target date funds and classes and index funds; (viii) lowering expenses for certain existing funds and classes by implementing or lowering expense caps; (ix) rationalizing product lines and gaining increased efficiencies from fund mergers, liquidations, and share class consolidations; (x) continuing to develop, acquire and implement systems and technology to improve services to the funds and shareholders, strengthen information security, and increase efficiency; and (xi) continuing to implement enhancements to further strengthen Fidelity's product line to increase investors' probability of success in achieving their investment goals, including retirement income goals. Investment Performance. The Board considered whether the fund has operated in accordance with its investment objective, as well as its record of compliance with its investment restrictions and its performance history.The Board took into account discussions that occur at Board meetings throughout the year with representatives of the Investment Advisers about fund investment performance. In this regard the Board noted that as part of regularly scheduled fund reviews and other reports to the Board on fund performance, the Board considers annualized return information for the fund for different time periods, measured against an appropriate securities market index (benchmark index) and an appropriate peer group of funds with similar objectives (peer group). In its evaluation of fund investment performance, the Board gave particular attention to information indicating changes in performance of certain Fidelity funds for specific time periods and discussed with the Investment Advisers the reasons for any overperformance or underperformance.In addition to reviewing absolute and relative fund performance, the Independent Trustees periodically consider the appropriateness of fund performance metrics in evaluating the results achieved. In general, the Independent Trustees believe that fund performance should be evaluated based on net performance (after fees and expenses) of both the highest performing and lowest performing fund share classes, where applicable, compared to appropriate benchmark indices, over appropriate time periods that may include full market cycles, and compared to peer groups, as applicable, over the same periods, taking into account relevant factors including the following: general market conditions; issuer-specific information; and fund cash flows and other factors.The Independent Trustees recognize that shareholders evaluate performance on a net basis over their own holding periods, for which one-, three-, and five-year periods are often used as a proxy. For this reason, the performance information reviewed by the Board also included net cumulative total return information for the fund and an appropriate benchmark index and peer group for the most recent one- and three-year periods ended September 30, 2020, as shown below. Returns are shown compared to the 25th percentile (top of box, 75% beaten) and 75th percentile (bottom of box, 25% beaten) of the peer universe.Fidelity Advisor Global Real Estate Fund

Fidelity Advisor Global Real Estate Fund

Liquidity Risk Management Program
The Securities and Exchange Commission adopted Rule 22e-4 under the Investment Company Act of 1940 (the Liquidity Rule) to promote effective liquidity risk management throughout the open-end investment company industry, thereby reducing the risk that funds will be unable to meet their redemption obligations and mitigating dilution of the interests of fund shareholders.
The Fund has adopted and implemented a liquidity risk management program pursuant to the Liquidity Rule (the Program) effective December 1, 2018. The Program is reasonably designed to assess and manage the Fund’s liquidity risk and to comply with the requirements of the Liquidity Rule. The Fund’s Board of Trustees (the Board) has designated the Fund’s investment adviser as administrator of the Program. The Fidelity advisers have established a Liquidity Risk Management Committee (the LRM Committee) to manage the Program for each of the Fidelity Funds. The LRM Committee monitors the adequacy and effectiveness of implementation of the Program and on a periodic basis assesses each Fund’s liquidity risk based on a variety of factors including (1) the Fund’s investment strategy, (2) portfolio liquidity and cash flow projections during normal and reasonably foreseeable stressed conditions, (3) shareholder redemptions, (4) borrowings and other funding sources and (5) in the case of exchange-traded funds, certain additional factors including the effect of the Fund’s prices and spreads, market participants, and basket compositions on the overall liquidity of the Fund’s portfolio, as applicable.
In accordance with the Program, each of the Fund’s portfolio investments is classified into one of four liquidity categories described below based on a determination of a reasonable expectation for how long it would take to convert the investment to cash (or sell or dispose of the investment) without significantly changing its market value.
- Highly liquid investments – cash or convertible to cash within three business days or less
- Moderately liquid investments – convertible to cash in three to seven calendar days
- Less liquid investments – can be sold or disposed of, but not settled, within seven calendar days
- Illiquid investments – cannot be sold or disposed of within seven calendar days
Liquidity classification determinations take into account a variety of factors including various market, trading and investment-specific considerations, as well as market depth, and generally utilize analysis from a third-party liquidity metrics service.
The Liquidity Rule places a 15% limit on a fund’s illiquid investments and requires funds that do not primarily hold assets that are highly liquid investments to determine and maintain a minimum percentage of the fund’s net assets to be invested in highly liquid investments (highly liquid investment minimum or HLIM). The Program includes provisions reasonably designed to comply with the 15% limit on illiquid investments and for determining, periodically reviewing and complying with the HLIM requirement as applicable.
At a recent meeting of the Fund’s Board of Trustees, the LRM Committee provided a written report to the Board pertaining to the operation, adequacy, and effectiveness of implementation of the Program for the annual period from December 1, 2019 through November 30, 2020. The report concluded that the Program has been implemented and is operating effectively and is reasonably designed to assess and manage the Fund’s liquidity risk.
![]()
AGRE-ANN-0921
1.9881280.104
Fidelity Advisor® Real Estate Fund
July 31, 2021
Contents
|
Board Approval of Investment Advisory Contracts and Management Fees | |
To view a fund's proxy voting guidelines and proxy voting record for the 12-month period ended June 30, visit http://www.fidelity.com/proxyvotingresults or visit the Securities and Exchange Commission's (SEC) web site at http://www.sec.gov.
You may also call 1-877-208-0098 to request a free copy of the proxy voting guidelines.
Standard & Poor's, S&P and S&P 500 are registered service marks of The McGraw-Hill Companies, Inc. and have been licensed for use by Fidelity Distributors Corporation.
Other third-party marks appearing herein are the property of their respective owners.
All other marks appearing herein are registered or unregistered trademarks or service marks of FMR LLC or an affiliated company. © 2021 FMR LLC. All rights reserved.
This report and the financial statements contained herein are submitted for the general information of the shareholders of the Fund. This report is not authorized for distribution to prospective investors in the Fund unless preceded or accompanied by an effective prospectus.
A fund files its complete schedule of portfolio holdings with the SEC for the first and third quarters of each fiscal year on Form N-PORT. Forms N-PORT are available on the SEC’s web site at http://www.sec.gov. A fund's Forms N-PORT may be reviewed and copied at the SEC’s Public Reference Room in Washington, DC. Information regarding the operation of the SEC's Public Reference Room may be obtained by calling 1-800-SEC-0330.
For a complete list of a fund's portfolio holdings, view the most recent holdings listing, semiannual report, or annual report on Fidelity's web site at http://www.fidelity.com, http://www.institutional.fidelity.com, or http://www.401k.com, as applicable.
NOT FDIC INSURED •MAY LOSE VALUE •NO BANK GUARANTEE
Neither the Fund nor Fidelity Distributors Corporation is a bank.
Note to Shareholders:
Early in 2020, the outbreak and spread of a new coronavirus emerged as a public health emergency that had a major influence on financial markets, primarily based on its impact on the global economy and the outlook for corporate earnings. The virus causes a respiratory disease known as COVID-19. On March 11, 2020 the World Health Organization declared the COVID-19 outbreak a pandemic, citing sustained risk of further global spread.
In the weeks following, as the crisis worsened, we witnessed an escalating human tragedy with wide-scale social and economic consequences from coronavirus-containment measures. The outbreak of COVID-19 prompted a number of measures to limit the spread, including travel and border restrictions, quarantines, and restrictions on large gatherings. In turn, these resulted in lower consumer activity, diminished demand for a wide range of products and services, disruption in manufacturing and supply chains, and – given the wide variability in outcomes regarding the outbreak – significant market uncertainty and volatility. Amid the turmoil, global governments and central banks took unprecedented action to help support consumers, businesses, and the broader economies, and to limit disruption to financial systems.
The situation continues to unfold, and the extent and duration of its impact on financial markets and the economy remain highly uncertain. Extreme events such as the coronavirus crisis are “exogenous shocks” that can have significant adverse effects on mutual funds and their investments. Although multiple asset classes may be affected by market disruption, the duration and impact may not be the same for all types of assets.
Fidelity is committed to helping you stay informed amid news about COVID-19 and during increased market volatility, and we’re taking extra steps to be responsive to customer needs. We encourage you to visit our websites, where we offer ongoing updates, commentary, and analysis on the markets and our funds.
Performance: The Bottom Line
Average annual total return reflects the change in the value of an investment, assuming reinvestment of distributions from dividend income and capital gains (the profits earned upon the sale of securities that have grown in value, if any) and assuming a constant rate of performance each year. The hypothetical investment and the average annual total returns do not reflect the deduction of taxes that a shareholder would pay on fund distributions or the redemption of fund shares. During periods of reimbursement by Fidelity, a fund’s total return will be greater than it would be had the reimbursement not occurred. How a fund did yesterday is no guarantee of how it will do tomorrow.
Average Annual Total Returns
| For the periods ended July 31, 2021 | Past 1 year | Past 5 years | Past 10 years |
| Class A (incl. 5.75% sales charge) | 22.89% | 3.88% | 7.92% |
| Class M (incl. 3.50% sales charge) | 25.58% | 4.15% | 7.93% |
| Class C (incl. contingent deferred sales charge) | 28.36% | 4.30% | 7.89% |
| Class I | 30.65% | 5.39% | 8.84% |
| Class Z | 30.95% | 5.51% | 8.90% |
Class C shares' contingent deferred sales charges included in the past one year, past five years and past ten years total return figures are 1%, 0% and 0%, respectively.
The initial offering of Class Z shares took place on August 13, 2013. Returns prior to August 13, 2013, are those of Class I.
$10,000 Over 10 Years
Let's say hypothetically that $10,000 was invested in Fidelity Advisor® Real Estate Fund - Class A on July 31, 2011, and the current 5.75% sales charge was paid.
The chart shows how the value of your investment would have changed, and also shows how the S&P 500® Index performed over the same period.

| Period Ending Values | ||
|
| $21,426 | Fidelity Advisor® Real Estate Fund - Class A |
|
| $41,689 | S&P 500® Index |
Management's Discussion of Fund Performance
Market Recap: The S&P 500® index gained 36.45% for the 12 months ending July 31, 2021, as U.S. equities continued a historic rebound following a steep but brief decline due to the early-2020 outbreak and spread of COVID-19. A confluence of powerful forces propelled risk assets, returning the stock market to pre-pandemic highs by late August 2020. The rally slowed in September, when stocks began a two-month retreat amid Congress’s inability to reach a deal on additional fiscal stimulus, as well as uncertainty about the election. But as the calendar turned, investors grew hopeful. The rollout of three COVID-19 vaccines was underway, the U.S. Federal Reserve pledged to hold interest rates near zero until the economy recovered, and the federal government planned to deploy trillions of dollars to boost consumers and the economy. This backdrop fueled a sharp rotation, with small-cap value usurping leadership from large growth. As part of the “reopening” theme, investors moved out of tech-driven mega-caps that had thrived due to the work-from-home trend in favor of cheap smaller companies that stood to benefit from a broad cyclical recovery. A flattish May reflected concerns about inflation and jobs, but the uptrend resumed through July, driven by corporate earnings. Notably, this leg saw momentum shift back to large growth, as easing rates and a hawkish Fed stymied the reflation trade. By sector, financials (+55%) led, driven by banks (+63%), whereas utilities (+12%) and consumer staples (+18%) notably lagged. Comments from Portfolio Manager Samuel Wald: For the fiscal year ending July 31, 2021, the fund's share classes (excluding sales charges, if applicable) gained about 29% to 31%, trailing the 35.29% advance of the MSCI US IMI Real Estate 25/50 Linked Index, as well as the broad-based S&P 500® index. The largest detractor from performance versus the sector index was a sizable underweighting in retail REITs. Security selection and an overweighting in industrial REITs, along with picks among residential REITs, also hurt. The fund's biggest individual relative detractor was an outsized stake in Digital Realty Trust, which returned -1% the past 12 months and was among our largest holdings. Also holding back performance was our overweighting in American Tower, which gained about 10%. We increased our position during the period. Also hindering performance was our near-total lack of ownership in benchmark component Simon Property Group, which gained roughly 115%. Simon Property Group was not held at period end. In contrast, among the largest contributors to performance versus the sector index was security selection in specialized REITs. Investment choices and an overweighting in real estate services, as well as a larger-than-index exposure to residential REITs, also helped the fund's relative result. The biggest individual relative contributor was an overweight position in CBRE Group (+120%). On July 31 CBRE Group was among our biggest holdings. Further aiding performance was our outsized stake in CubeSmart, which gained about 74% and also was among the fund's largest holdings. Another notable relative contributor was an underweighting in Equinix (+9%), a position not held at period end. Notable changes in positioning include increased exposure to the specialized REITs category and a lower allocation to office REITs.The views expressed above reflect those of the portfolio manager(s) only through the end of the period as stated on the cover of this report and do not necessarily represent the views of Fidelity or any other person in the Fidelity organization. Any such views are subject to change at any time based upon market or other conditions and Fidelity disclaims any responsibility to update such views. These views may not be relied on as investment advice and, because investment decisions for a Fidelity fund are based on numerous factors, may not be relied on as an indication of trading intent on behalf of any Fidelity fund.
Investment Summary (Unaudited)
Top Ten Stocks as of July 31, 2021
| % of fund's net assets | |
| American Tower Corp. | 13.8 |
| Prologis (REIT), Inc. | 10.2 |
| Digital Realty Trust, Inc. | 9.2 |
| CubeSmart | 7.0 |
| CBRE Group, Inc. | 5.3 |
| Mid-America Apartment Communities, Inc. | 4.9 |
| Ventas, Inc. | 4.9 |
| Essex Property Trust, Inc. | 4.8 |
| SBA Communications Corp. Class A | 3.9 |
| VICI Properties, Inc. | 3.5 |
| 67.5 |
Top Five REIT Sectors as of July 31, 2021
| % of fund's net assets | |
| REITs - Diversified | 20.4 |
| REITs - Management/Investment | 13.8 |
| REITs - Warehouse/Industrial | 13.5 |
| REITs - Apartments | 12.7 |
| REITs - Health Care | 7.6 |
Asset Allocation (% of fund's net assets)
| As of July 31, 2021 | ||
| Stocks | 99.5% | |
| Short-Term Investments and Net Other Assets (Liabilities) | 0.5% | |

Schedule of Investments July 31, 2021
Showing Percentage of Net Assets
| Common Stocks - 99.5% | |||
| Shares | Value | ||
| Commercial Services & Supplies - 0.4% | |||
| REITs - Diversified - 0.4% | |||
| CoreCivic, Inc. (a) | 198,200 | $2,037,496 | |
| Diversified Financial Services - 0.3% | |||
| Other Diversified Financial Services - 0.3% | |||
| Cyxtera Technologies, Inc. (b) | 180,025 | 1,537,594 | |
| Equity Real Estate Investment Trusts (REITs) - 91.9% | |||
| REITs - Apartments - 12.7% | |||
| Essex Property Trust, Inc. | 70,947 | 23,277,711 | |
| Invitation Homes, Inc. | 360,800 | 14,677,344 | |
| Mid-America Apartment Communities, Inc. | 123,800 | 23,905,780 | |
| 61,860,835 | |||
| REITs - Diversified - 20.0% | |||
| Digital Realty Trust, Inc. | 291,500 | 44,937,640 | |
| Lamar Advertising Co. Class A | 123,200 | 13,133,120 | |
| SBA Communications Corp. Class A | 55,100 | 18,788,549 | |
| VICI Properties, Inc. | 542,500 | 16,920,575 | |
| Washington REIT (SBI) | 144,800 | 3,517,192 | |
| 97,297,076 | |||
| REITs - Health Care - 7.6% | |||
| Healthcare Realty Trust, Inc. | 418,900 | 13,354,532 | |
| Ventas, Inc. | 399,505 | 23,882,409 | |
| 37,236,941 | |||
| REITs - Hotels - 3.4% | |||
| RLJ Lodging Trust | 1,163,126 | 16,690,858 | |
| REITs - Management/Investment - 13.8% | |||
| American Tower Corp. | 238,400 | 67,419,520 | |
| REITs - Manufactured Homes - 3.1% | |||
| Equity Lifestyle Properties, Inc. | 181,206 | 15,185,063 | |
| REITs - Office Property - 4.2% | |||
| Alexandria Real Estate Equities, Inc. | 67,100 | 13,509,914 | |
| Douglas Emmett, Inc. | 203,200 | 6,786,880 | |
| 20,296,794 | |||
| REITs - Shopping Centers - 2.1% | |||
| Phillips Edison & Co., Inc. (c) | 64,700 | 1,811,600 | |
| SITE Centers Corp. | 527,400 | 8,364,564 | |
| 10,176,164 | |||
| REITs - Single Tenant - 4.5% | |||
| Four Corners Property Trust, Inc. | 552,000 | 15,847,920 | |
| Spirit Realty Capital, Inc. | 118,700 | 5,961,114 | |
| 21,809,034 | |||
| REITs - Storage - 7.0% | |||
| CubeSmart | 685,900 | 34,061,794 | |
| REITs - Warehouse/Industrial - 13.5% | |||
| Americold Realty Trust | 305,100 | 11,853,135 | |
| Prologis (REIT), Inc. | 386,954 | 49,545,590 | |
| Terreno Realty Corp. | 62,900 | 4,299,844 | |
| 65,698,569 | |||
| TOTAL EQUITY REAL ESTATE INVESTMENT TRUSTS (REITS) | 447,732,648 | ||
| Hotels, Restaurants & Leisure - 0.8% | |||
| Casinos & Gaming - 0.8% | |||
| Caesars Entertainment, Inc. (a) | 45,390 | 3,965,270 | |
| Real Estate Management & Development - 6.1% | |||
| Real Estate Services - 6.1% | |||
| CBRE Group, Inc. (a) | 268,500 | 25,899,510 | |
| Realogy Holdings Corp. (a) | 218,000 | 3,862,960 | |
| 29,762,470 | |||
| TOTAL COMMON STOCKS | |||
| (Cost $308,712,049) | 485,035,478 | ||
| Money Market Funds - 0.3% | |||
| Fidelity Securities Lending Cash Central Fund 0.06% (d)(e) | |||
| (Cost $1,593,150) | 1,592,991 | 1,593,150 | |
| TOTAL INVESTMENT IN SECURITIES - 99.8% | |||
| (Cost $310,305,199) | 486,628,628 | ||
| NET OTHER ASSETS (LIABILITIES) - 0.2% | 797,038 | ||
| NET ASSETS - 100% | $487,425,666 |
Legend
(a) Non-income producing
(b) Restricted securities (including private placements) - Investment in securities not registered under the Securities Act of 1933 (excluding 144A issues). At the end of the period, the value of restricted securities (excluding 144A issues) amounted to $1,537,594 or 0.3% of net assets.
(c) Security or a portion of the security is on loan at period end.
(d) Affiliated fund that is generally available only to investment companies and other accounts managed by Fidelity Investments. The rate quoted is the annualized seven-day yield of the fund at period end. A complete unaudited listing of the fund's holdings as of its most recent quarter end is available upon request. In addition, each Fidelity Central Fund's financial statements, which are not covered by the Fund's Report of Independent Registered Public Accounting Firm, are available on the SEC's website or upon request.
(e) Investment made with cash collateral received from securities on loan.
Additional information on each restricted holding is as follows:
| Security | Acquisition Date | Acquisition Cost |
| Cyxtera Technologies, Inc. | 2/21/21 | $1,800,250 |
Affiliated Central Funds
Information regarding fiscal year to date income earned by the Fund from investments in Fidelity Central Funds is as follows:
| Fund | Income earned |
| Fidelity Cash Central Fund | $1,425 |
| Fidelity Securities Lending Cash Central Fund | 7,343 |
| Total | $8,768 |
Amounts in the income column in the above table include any capital gain distributions from underlying funds, which are presented in the corresponding line-item in the Statement of Operations, if applicable. Amount for Fidelity Securities Lending Cash Central Fund represents the income earned on investing cash collateral, less rebates paid to borrowers and any lending agent fees associated with the loan, plus any premium payments received for lending certain types of securities.
Fiscal year to date information regarding the Fund's investments in Fidelity Central Funds, including the ownership percentage, is presented below.
| Fund | Value, beginning of period | Purchases | Sales Proceeds | Realized Gain/Loss | Change in Unrealized appreciation (depreciation) | Value, end of period | % ownership, end of period |
| Fidelity Cash Central Fund 0.06% | $1,261,748 | $63,672,375 | $64,933,870 | $(163) | $(90) | $-- | 0.0% |
| Fidelity Securities Lending Cash Central Fund 0.06% | -- | 44,594,545 | 43,001,395 | -- | -- | 1,593,150 | 0.0% |
| Total | $1,261,748 | $108,266,920 | $107,935,265 | $(163) | $(90) | $1,593,150 |
Investment Valuation
The following is a summary of the inputs used, as of July 31, 2021, involving the Fund's assets and liabilities carried at fair value. The inputs or methodology used for valuing securities may not be an indication of the risk associated with investing in those securities. For more information on valuation inputs, and their aggregation into the levels used below, please refer to the Investment Valuation section in the accompanying Notes to Financial Statements.
| Valuation Inputs at Reporting Date: | ||||
| Description | Total | Level 1 | Level 2 | Level 3 |
| Investments in Securities: | ||||
| Common Stocks | $485,035,478 | $483,497,884 | $1,537,594 | $-- |
| Money Market Funds | 1,593,150 | 1,593,150 | -- | -- |
| Total Investments in Securities: | $486,628,628 | $485,091,034 | $1,537,594 | $-- |
See accompanying notes which are an integral part of the financial statements.
Financial Statements
Statement of Assets and Liabilities
| July 31, 2021 | ||
| Assets | ||
| Investment in securities, at value (including securities loaned of $1,565,200) — See accompanying schedule: Unaffiliated issuers (cost $308,712,049) | $485,035,478 | |
| Fidelity Central Funds (cost $1,593,150) | 1,593,150 | |
| Total Investment in Securities (cost $310,305,199) | $486,628,628 | |
| Receivable for investments sold | 3,777,982 | |
| Receivable for fund shares sold | 377,330 | |
| Distributions receivable from Fidelity Central Funds | 841 | |
| Prepaid expenses | 3,327 | |
| Other receivables | 106,325 | |
| Total assets | 490,894,433 | |
| Liabilities | ||
| Payable to custodian bank | $23,865 | |
| Payable for investments purchased | 904,834 | |
| Payable for fund shares redeemed | 395,452 | |
| Accrued management fee | 210,907 | |
| Distribution and service plan fees payable | 90,361 | |
| Other affiliated payables | 107,660 | |
| Other payables and accrued expenses | 142,538 | |
| Collateral on securities loaned | 1,593,150 | |
| Total liabilities | 3,468,767 | |
| Net Assets | $487,425,666 | |
| Net Assets consist of: | ||
| Paid in capital | $294,939,880 | |
| Total accumulated earnings (loss) | 192,485,786 | |
| Net Assets | $487,425,666 | |
| Net Asset Value and Maximum Offering Price | ||
| Class A: | ||
| Net Asset Value and redemption price per share ($138,133,575 ÷ 5,602,526 shares)(a) | $24.66 | |
| Maximum offering price per share (100/94.25 of $24.66) | $26.16 | |
| Class M: | ||
| Net Asset Value and redemption price per share ($118,777,906 ÷ 4,831,017 shares)(a) | $24.59 | |
| Maximum offering price per share (100/96.50 of $24.59) | $25.48 | |
| Class C: | ||
| Net Asset Value and offering price per share ($16,068,918 ÷ 676,781 shares)(a) | $23.74 | |
| Class I: | ||
| Net Asset Value, offering price and redemption price per share ($197,872,581 ÷ 7,927,660 shares) | $24.96 | |
| Class Z: | ||
| Net Asset Value, offering price and redemption price per share ($16,572,686 ÷ 663,713 shares) | $24.97 |
(a) Redemption price per share is equal to net asset value less any applicable contingent deferred sales charge.
See accompanying notes which are an integral part of the financial statements.
Statement of Operations
| Year ended July 31, 2021 | ||
| Investment Income | ||
| Dividends | $9,987,142 | |
| Income from Fidelity Central Funds (including $7,343 from security lending) | 8,768 | |
| Total income | 9,995,910 | |
| Expenses | ||
| Management fee | $2,261,125 | |
| Transfer agent fees | 1,035,867 | |
| Distribution and service plan fees | 991,931 | |
| Accounting fees | 166,866 | |
| Custodian fees and expenses | 9,696 | |
| Independent trustees' fees and expenses | 1,843 | |
| Registration fees | 79,774 | |
| Audit | 51,277 | |
| Legal | 616 | |
| Interest | 259 | |
| Miscellaneous | 8,561 | |
| Total expenses before reductions | 4,607,815 | |
| Expense reductions | (29,615) | |
| Total expenses after reductions | 4,578,200 | |
| Net investment income (loss) | 5,417,710 | |
| Realized and Unrealized Gain (Loss) | ||
| Net realized gain (loss) on: | ||
| Investment securities: | ||
| Unaffiliated issuers | 17,595,798 | |
| Fidelity Central Funds | (163) | |
| Total net realized gain (loss) | 17,595,635 | |
| Change in net unrealized appreciation (depreciation) on: | ||
| Investment securities: | ||
| Unaffiliated issuers | 93,330,419 | |
| Fidelity Central Funds | (90) | |
| Total change in net unrealized appreciation (depreciation) | 93,330,329 | |
| Net gain (loss) | 110,925,964 | |
| Net increase (decrease) in net assets resulting from operations | $116,343,674 |
See accompanying notes which are an integral part of the financial statements.
Statement of Changes in Net Assets
| Year ended July 31, 2021 | Year ended July 31, 2020 | |
| Increase (Decrease) in Net Assets | ||
| Operations | ||
| Net investment income (loss) | $5,417,710 | $9,437,114 |
| Net realized gain (loss) | 17,595,635 | 16,496,833 |
| Change in net unrealized appreciation (depreciation) | 93,330,329 | (61,855,882) |
| Net increase (decrease) in net assets resulting from operations | 116,343,674 | (35,921,935) |
| Distributions to shareholders | (14,644,950) | (41,051,862) |
| Share transactions - net increase (decrease) | (39,011,402) | (39,601,264) |
| Total increase (decrease) in net assets | 62,687,322 | (116,575,061) |
| Net Assets | ||
| Beginning of period | 424,738,344 | 541,313,405 |
| End of period | $487,425,666 | $424,738,344 |
See accompanying notes which are an integral part of the financial statements.
Financial Highlights
Fidelity Advisor Real Estate Fund Class A
| Years ended July 31, | 2021 | 2020 | 2019 | 2018 | 2017 |
| Selected Per–Share Data | |||||
| Net asset value, beginning of period | $19.62 | $22.91 | $22.07 | $22.96 | $25.93 |
| Income from Investment Operations | |||||
| Net investment income (loss)A | .26 | .41 | .37 | .37 | .33 |
| Net realized and unrealized gain (loss) | 5.50 | (1.91) | 1.63 | .21 | (1.82) |
| Total from investment operations | 5.76 | (1.50) | 2.00 | .58 | (1.49) |
| Distributions from net investment income | (.24) | (.38) | (.43) | (.36) | (.30) |
| Distributions from net realized gain | (.48) | (1.41) | (.73) | (1.11) | (1.18) |
| Total distributions | (.72) | (1.79) | (1.16) | (1.47) | (1.48) |
| Net asset value, end of period | $24.66 | $19.62 | $22.91 | $22.07 | $22.96 |
| Total ReturnB,C | 30.38% | (7.21)% | 9.62% | 2.55% | (5.63)% |
| Ratios to Average Net AssetsD,E | |||||
| Expenses before reductions | 1.09% | 1.10% | 1.10% | 1.10% | 1.09% |
| Expenses net of fee waivers, if any | 1.09% | 1.10% | 1.09% | 1.10% | 1.09% |
| Expenses net of all reductions | 1.08% | 1.09% | 1.09% | 1.10% | 1.08% |
| Net investment income (loss) | 1.24% | 1.93% | 1.68% | 1.70% | 1.42% |
| Supplemental Data | |||||
| Net assets, end of period (000 omitted) | $138,134 | $115,736 | $151,536 | $161,570 | $249,442 |
| Portfolio turnover rateF | 53% | 56% | 49% | 41% | 69% |
A Calculated based on average shares outstanding during the period.
B Total returns would have been lower if certain expenses had not been reduced during the applicable periods shown.
C Total returns do not include the effect of the sales charges.
D Fees and expenses of any underlying mutual funds or exchange-traded funds (ETFs) are not included in the Fund's expense ratio. The Fund indirectly bears its proportionate share of these expenses. For additional expense information related to investments in Fidelity Central Funds, please refer to the "Investments in Fidelity Central Funds" note found in the Notes to Financial Statements section of the most recent Annual or Semi-Annual report.
E Expense ratios reflect operating expenses of the class. Expenses before reductions do not reflect amounts reimbursed, waived, or reduced through arrangements with the investment adviser, brokerage services, or other offset arrangements, if applicable, and do not represent the amount paid by the class during periods when reimbursements, waivers or reductions occur.
F Amount does not include the portfolio activity of any underlying mutual funds or exchange-traded funds (ETFs).
See accompanying notes which are an integral part of the financial statements.
Fidelity Advisor Real Estate Fund Class M
| Years ended July 31, | 2021 | 2020 | 2019 | 2018 | 2017 |
| Selected Per–Share Data | |||||
| Net asset value, beginning of period | $19.58 | $22.87 | $22.05 | $22.94 | $25.90 |
| Income from Investment Operations | |||||
| Net investment income (loss)A | .21 | .36 | .32 | .32 | .27 |
| Net realized and unrealized gain (loss) | 5.49 | (1.90) | 1.62 | .21 | (1.81) |
| Total from investment operations | 5.70 | (1.54) | 1.94 | .53 | (1.54) |
| Distributions from net investment income | (.22) | (.34) | (.39) | (.31) | (.24) |
| Distributions from net realized gain | (.48) | (1.41) | (.73) | (1.11) | (1.18) |
| Total distributions | (.69)B | (1.75) | (1.12) | (1.42) | (1.42) |
| Net asset value, end of period | $24.59 | $19.58 | $22.87 | $22.05 | $22.94 |
| Total ReturnC,D | 30.14% | (7.42)% | 9.35% | 2.34% | (5.83)% |
| Ratios to Average Net AssetsE,F | |||||
| Expenses before reductions | 1.31% | 1.31% | 1.32% | 1.33% | 1.33% |
| Expenses net of fee waivers, if any | 1.31% | 1.31% | 1.31% | 1.33% | 1.33% |
| Expenses net of all reductions | 1.30% | 1.30% | 1.31% | 1.32% | 1.32% |
| Net investment income (loss) | 1.03% | 1.71% | 1.46% | 1.47% | 1.18% |
| Supplemental Data | |||||
| Net assets, end of period (000 omitted) | $118,778 | $98,724 | $128,754 | $127,038 | $153,285 |
| Portfolio turnover rateG | 53% | 56% | 49% | 41% | 69% |
A Calculated based on average shares outstanding during the period.
B Total distributions per share do not sum due to rounding.
C Total returns would have been lower if certain expenses had not been reduced during the applicable periods shown.
D Total returns do not include the effect of the sales charges.
E Fees and expenses of any underlying mutual funds or exchange-traded funds (ETFs) are not included in the Fund's expense ratio. The Fund indirectly bears its proportionate share of these expenses. For additional expense information related to investments in Fidelity Central Funds, please refer to the "Investments in Fidelity Central Funds" note found in the Notes to Financial Statements section of the most recent Annual or Semi-Annual report.
F Expense ratios reflect operating expenses of the class. Expenses before reductions do not reflect amounts reimbursed, waived, or reduced through arrangements with the investment adviser, brokerage services, or other offset arrangements, if applicable, and do not represent the amount paid by the class during periods when reimbursements, waivers or reductions occur.
G Amount does not include the portfolio activity of any underlying mutual funds or exchange-traded funds (ETFs).
See accompanying notes which are an integral part of the financial statements.
Fidelity Advisor Real Estate Fund Class C
| Years ended July 31, | 2021 | 2020 | 2019 | 2018 | 2017 |
| Selected Per–Share Data | |||||
| Net asset value, beginning of period | $18.97 | $22.26 | $21.54 | $22.46 | $25.43 |
| Income from Investment Operations | |||||
| Net investment income (loss)A | .09 | .23 | .19 | .20 | .15 |
| Net realized and unrealized gain (loss) | 5.30 | (1.85) | 1.58 | .20 | (1.78) |
| Total from investment operations | 5.39 | (1.62) | 1.77 | .40 | (1.63) |
| Distributions from net investment income | (.15) | (.26) | (.32) | (.21) | (.16) |
| Distributions from net realized gain | (.48) | (1.41) | (.73) | (1.11) | (1.18) |
| Total distributions | (.62)B | (1.67) | (1.05) | (1.32) | (1.34) |
| Net asset value, end of period | $23.74 | $18.97 | $22.26 | $21.54 | $22.46 |
| Total ReturnC,D | 29.36% | (7.95)% | 8.72% | 1.77% | (6.34)% |
| Ratios to Average Net AssetsE,F | |||||
| Expenses before reductions | 1.88% | 1.89% | 1.88% | 1.88% | 1.86% |
| Expenses net of fee waivers, if any | 1.88% | 1.89% | 1.88% | 1.88% | 1.86% |
| Expenses net of all reductions | 1.87% | 1.88% | 1.88% | 1.87% | 1.86% |
| Net investment income (loss) | .46% | 1.14% | .89% | .92% | .65% |
| Supplemental Data | |||||
| Net assets, end of period (000 omitted) | $16,069 | $20,774 | $28,982 | $43,690 | $62,551 |
| Portfolio turnover rateG | 53% | 56% | 49% | 41% | 69% |
A Calculated based on average shares outstanding during the period.
B Total distributions per share do not sum due to rounding.
C Total returns would have been lower if certain expenses had not been reduced during the applicable periods shown.
D Total returns do not include the effect of the contingent deferred sales charge.
E Fees and expenses of any underlying mutual funds or exchange-traded funds (ETFs) are not included in the Fund's expense ratio. The Fund indirectly bears its proportionate share of these expenses. For additional expense information related to investments in Fidelity Central Funds, please refer to the "Investments in Fidelity Central Funds" note found in the Notes to Financial Statements section of the most recent Annual or Semi-Annual report.
F Expense ratios reflect operating expenses of the class. Expenses before reductions do not reflect amounts reimbursed, waived, or reduced through arrangements with the investment adviser, brokerage services, or other offset arrangements, if applicable, and do not represent the amount paid by the class during periods when reimbursements, waivers or reductions occur.
G Amount does not include the portfolio activity of any underlying mutual funds or exchange-traded funds (ETFs).
See accompanying notes which are an integral part of the financial statements.
Fidelity Advisor Real Estate Fund Class I
| Years ended July 31, | 2021 | 2020 | 2019 | 2018 | 2017 |
| Selected Per–Share Data | |||||
| Net asset value, beginning of period | $19.84 | $23.15 | $22.28 | $23.17 | $26.15 |
| Income from Investment Operations | |||||
| Net investment income (loss)A | .31 | .46 | .43 | .43 | .39 |
| Net realized and unrealized gain (loss) | 5.56 | (1.92) | 1.65 | .21 | (1.83) |
| Total from investment operations | 5.87 | (1.46) | 2.08 | .64 | (1.44) |
| Distributions from net investment income | (.27) | (.44) | (.48) | (.42) | (.36) |
| Distributions from net realized gain | (.48) | (1.41) | (.73) | (1.11) | (1.18) |
| Total distributions | (.75) | (1.85) | (1.21) | (1.53) | (1.54) |
| Net asset value, end of period | $24.96 | $19.84 | $23.15 | $22.28 | $23.17 |
| Total ReturnB | 30.65% | (6.99)% | 9.93% | 2.84% | (5.36)% |
| Ratios to Average Net AssetsC,D | |||||
| Expenses before reductions | .88% | .86% | .81% | .82% | .82% |
| Expenses net of fee waivers, if any | .87% | .86% | .81% | .82% | .82% |
| Expenses net of all reductions | .87% | .85% | .81% | .81% | .81% |
| Net investment income (loss) | 1.46% | 2.17% | 1.96% | 1.98% | 1.69% |
| Supplemental Data | |||||
| Net assets, end of period (000 omitted) | $197,873 | $180,346 | $225,407 | $284,857 | $399,578 |
| Portfolio turnover rateE | 53% | 56% | 49% | 41% | 69% |
A Calculated based on average shares outstanding during the period.
B Total returns would have been lower if certain expenses had not been reduced during the applicable periods shown.
C Fees and expenses of any underlying mutual funds or exchange-traded funds (ETFs) are not included in the Fund's expense ratio. The Fund indirectly bears its proportionate share of these expenses. For additional expense information related to investments in Fidelity Central Funds, please refer to the "Investments in Fidelity Central Funds" note found in the Notes to Financial Statements section of the most recent Annual or Semi-Annual report.
D Expense ratios reflect operating expenses of the class. Expenses before reductions do not reflect amounts reimbursed, waived, or reduced through arrangements with the investment adviser, brokerage services, or other offset arrangements, if applicable, and do not represent the amount paid by the class during periods when reimbursements, waivers or reductions occur.
E Amount does not include the portfolio activity of any underlying mutual funds or exchange-traded funds (ETFs).
See accompanying notes which are an integral part of the financial statements.
Fidelity Advisor Real Estate Fund Class Z
| Years ended July 31, | 2021 | 2020 | 2019 A |
| Selected Per–Share Data | |||
| Net asset value, beginning of period | $19.85 | $23.16 | $21.91 |
| Income from Investment Operations | |||
| Net investment income (loss)B | .36 | .50 | .40 |
| Net realized and unrealized gain (loss) | 5.56 | (1.92) | 1.94 |
| Total from investment operations | 5.92 | (1.42) | 2.34 |
| Distributions from net investment income | (.32) | (.48) | (.36) |
| Distributions from net realized gain | (.48) | (1.41) | (.73) |
| Total distributions | (.80) | (1.89) | (1.09) |
| Net asset value, end of period | $24.97 | $19.85 | $23.16 |
| Total ReturnC,D | 30.95% | (6.80)% | 11.22% |
| Ratios to Average Net AssetsE,F | |||
| Expenses before reductions | .64% | .65% | .65%G |
| Expenses net of fee waivers, if any | .64% | .65% | .64%G |
| Expenses net of all reductions | .64% | .64% | .64%G |
| Net investment income (loss) | 1.69% | 2.38% | 2.20%G |
| Supplemental Data | |||
| Net assets, end of period (000 omitted) | $16,573 | $9,157 | $6,634 |
| Portfolio turnover rateH | 53% | 56% | 49% |
A For the period October 2, 2018 (commencement of sale of shares) to July 31, 2019.
B Calculated based on average shares outstanding during the period.
C Total returns for periods of less than one year are not annualized.
D Total returns would have been lower if certain expenses had not been reduced during the applicable periods shown.
E Fees and expenses of any underlying mutual funds or exchange-traded funds (ETFs) are not included in the Fund's expense ratio. The Fund indirectly bears its proportionate share of these expenses. For additional expense information related to investments in Fidelity Central Funds, please refer to the "Investments in Fidelity Central Funds" note found in the Notes to Financial Statements section of the most recent Annual or Semi-Annual report.
F Expense ratios reflect operating expenses of the class. Expenses before reductions do not reflect amounts reimbursed, waived, or reduced through arrangements with the investment adviser, brokerage services, or other offset arrangements, if applicable, and do not represent the amount paid by the class during periods when reimbursements, waivers or reductions occur.
G Annualized
H Amount does not include the portfolio activity of any underlying mutual funds or exchange-traded funds (ETFs).
See accompanying notes which are an integral part of the financial statements.
Notes to Financial Statements
For the period ended July 31, 2021
1. Organization.
Fidelity Advisor Real Estate Fund (the Fund) is a non-diversified fund of Fidelity Advisor Series VII (the Trust) and is authorized to issue an unlimited number of shares. The Trust is registered under the Investment Company Act of 1940, as amended (the 1940 Act), as an open-end management investment company organized as a Massachusetts business trust. The Fund offers Class A, Class M, Class C, Class I and Class Z shares, each of which has equal rights as to assets and voting privileges. Each class has exclusive voting rights with respect to matters that affect that class. Effective June 21, 2021, Class C shares will automatically convert to Class A shares after a holding period of eight years from the initial date of purchase, with certain exceptions. Prior to June 21, 2021, Class C shares automatically converted to Class A shares after a holding period of ten years from the initial date of purchase, with certain exceptions.
2. Investments in Fidelity Central Funds.
Funds may invest in Fidelity Central Funds, which are open-end investment companies generally available only to other investment companies and accounts managed by the investment adviser and its affiliates. The Schedule of Investments lists any Fidelity Central Funds held as an investment as of period end, but does not include the underlying holdings of each Fidelity Central Fund. An investing fund indirectly bears its proportionate share of the expenses of the underlying Fidelity Central Funds.
Based on its investment objective, each Fidelity Central Fund may invest or participate in various investment vehicles or strategies that are similar to those of the investing fund. These strategies are consistent with the investment objectives of the investing fund and may involve certain economic risks which may cause a decline in value of each of the Fidelity Central Funds and thus a decline in the value of the investing fund.
| Fidelity Central Fund | Investment Manager | Investment Objective | Investment Practices | Expense Ratio(a) |
| Fidelity Money Market Central Funds | Fidelity Management & Research Company LLC (FMR) | Each fund seeks to obtain a high level of current income consistent with the preservation of capital and liquidity. | Short-term Investments | Less than .005% to .01% |
(a) Expenses expressed as a percentage of average net assets and are as of each underlying Central Fund's most recent annual or semi-annual shareholder report.
A complete unaudited list of holdings for each Fidelity Central Fund is available upon request or at the Securities and Exchange Commission website at www.sec.gov. In addition, the financial statements of the Fidelity Central Funds which contain the significant accounting policies (including investment valuation policies) of those funds, and are not covered by the Report of Independent Registered Public Accounting Firm, are available on the Securities and Exchange Commission website or upon request.
3. Significant Accounting Policies.
The Fund is an investment company and applies the accounting and reporting guidance of the Financial Accounting Standards Board (FASB) Accounting Standards Codification Topic 946 Financial Services - Investment Companies. The financial statements have been prepared in conformity with accounting principles generally accepted in the United States of America (GAAP), which require management to make certain estimates and assumptions at the date of the financial statements. Actual results could differ from those estimates. Subsequent events, if any, through the date that the financial statements were issued have been evaluated in the preparation of the financial statements. The Fund's Schedule of Investments lists any underlying mutual funds or exchange-traded funds (ETFs) but does not include the underlying holdings of these funds. The following summarizes the significant accounting policies of the Fund:
Investment Valuation. Investments are valued as of 4:00 p.m. Eastern time on the last calendar day of the period. The Board of Trustees (the Board) has delegated the day to day responsibility for the valuation of the Fund's investments to the Fair Value Committee (the Committee) established by the Fund's investment adviser. In accordance with valuation policies and procedures approved by the Board, the Fund attempts to obtain prices from one or more third party pricing vendors or brokers to value its investments. When current market prices, quotations or currency exchange rates are not readily available or reliable, investments will be fair valued in good faith by the Committee, in accordance with procedures adopted by the Board. Factors used in determining fair value vary by investment type and may include market or investment specific events. The frequency with which these procedures are used cannot be predicted and they may be utilized to a significant extent. The Committee oversees the Fund's valuation policies and procedures and reports to the Board on the Committee's activities and fair value determinations. The Board monitors the appropriateness of the procedures used in valuing the Fund's investments and ratifies the fair value determinations of the Committee.
The Fund categorizes the inputs to valuation techniques used to value its investments into a disclosure hierarchy consisting of three levels as shown below:
- Level 1 – quoted prices in active markets for identical investments
- Level 2 – other significant observable inputs (including quoted prices for similar investments, interest rates, prepayment speeds, etc.)
- Level 3 – unobservable inputs (including the Fund's own assumptions based on the best information available)
Valuation techniques used to value the Fund's investments by major category are as follows:
Equity securities, including restricted securities, for which market quotations are readily available, are valued at the last reported sale price or official closing price as reported by a third party pricing vendor on the primary market or exchange on which they are traded and are categorized as Level 1 in the hierarchy. In the event there were no sales during the day or closing prices are not available, securities are valued at the last quoted bid price or may be valued using the last available price and are generally categorized as Level 2 in the hierarchy. For foreign equity securities, when market or security specific events arise, comparisons to the valuation of American Depositary Receipts (ADRs), futures contracts, Exchange-Traded Funds (ETFs) and certain indexes as well as quoted prices for similar securities may be used and would be categorized as Level 2 in the hierarchy. For equity securities, including restricted securities, where observable inputs are limited, assumptions about market activity and risk are used and these securities may be categorized as Level 3 in the hierarchy.
Investments in open-end mutual funds, including the Fidelity Central Funds, are valued at their closing net asset value (NAV) each business day and are categorized as Level 1 in the hierarchy.
Changes in valuation techniques may result in transfers in or out of an assigned level within the disclosure hierarchy. The aggregate value of investments by input level as of July 31, 2021 is included at the end of the Fund's Schedule of Investments.
Investment Transactions and Income. For financial reporting purposes, the Fund's investment holdings and NAV include trades executed through the end of the last business day of the period. The NAV per share for processing shareholder transactions is calculated as of the close of business of the New York Stock Exchange (NYSE), normally 4:00 p.m. Eastern time and includes trades executed through the end of the prior business day. Gains and losses on securities sold are determined on the basis of identified cost. Dividend income is recorded on the ex-dividend date, except for certain dividends from foreign securities where the ex-dividend date may have passed, which are recorded as soon as the Fund is informed of the ex-dividend date. Non-cash dividends included in dividend income, if any, are recorded at the fair market value of the securities received. Income and capital gain distributions from Fidelity Central Funds, if any, are recorded on the ex-dividend date. Certain distributions received by the Fund represent a return of capital or capital gain. The Fund determines the components of these distributions subsequent to the ex-dividend date, based upon receipt of tax filings or other correspondence relating to the underlying investment. These distributions are recorded as a reduction of cost of investments and/or as a realized gain.
Class Allocations and Expenses. Investment income, realized and unrealized capital gains and losses, common expenses of a fund, and certain fund-level expense reductions, if any, are allocated daily on a pro-rata basis to each class based on the relative net assets of each class to the total net assets of a fund. Each class differs with respect to transfer agent and distribution and service plan fees incurred, as applicable. Certain expense reductions may also differ by class, if applicable. For the reporting period, the allocated portion of income and expenses to each class as a percent of its average net assets may vary due to the timing of recording these transactions in relation to fluctuating net assets of the classes. Expenses directly attributable to a fund are charged to that fund. Expenses attributable to more than one fund are allocated among the respective funds on the basis of relative net assets or other appropriate methods. Expenses included in the accompanying financial statements reflect the expenses of that fund and do not include any expenses associated with any underlying mutual funds or exchange-traded funds. Although not included in a fund's expenses, a fund indirectly bears its proportionate share of these expenses through the net asset value of each underlying mutual fund or exchange-traded fund. Expense estimates are accrued in the period to which they relate and adjustments are made when actual amounts are known.
Deferred Trustee Compensation. Under a Deferred Compensation Plan (the Plan) for certain Funds, certain independent Trustees have elected to defer receipt of a portion of their annual compensation. Deferred amounts are invested in affiliated mutual funds, are marked-to-market and remain in a fund until distributed in accordance with the Plan. The investment of deferred amounts and the offsetting payable to the Trustees presented below are included in the accompanying Statement of Assets and Liabilities in other receivables and other payables and accrued expenses, as applicable.
| Fidelity Advisor Real Estate Fund | $98,517 |
Income Tax Information and Distributions to Shareholders. Each year, the Fund intends to qualify as a regulated investment company under Subchapter M of the Internal Revenue Code, including distributing substantially all of its taxable income and realized gains. As a result, no provision for U.S. Federal income taxes is required. As of July 31, 2021, the Fund did not have any unrecognized tax benefits in the financial statements; nor is the Fund aware of any tax positions for which it is reasonably possible that the total amounts of unrecognized tax benefits will significantly change in the next twelve months. The Fund files a U.S. federal tax return, in addition to state and local tax returns as required. The Fund's federal income tax returns are subject to examination by the Internal Revenue Service (IRS) for a period of three fiscal years after they are filed. State and local tax returns may be subject to examination for an additional fiscal year depending on the jurisdiction.
Distributions are declared and recorded on the ex-dividend date. Income and capital gain distributions are declared separately for each class. Income and capital gain distributions are determined in accordance with income tax regulations, which may differ from GAAP. In addition, the Fund claimed a portion of the payment made to redeeming shareholders as a distribution for income tax purposes.
Capital accounts within the financial statements are adjusted for permanent book-tax differences. These adjustments have no impact on net assets or the results of operations. Capital accounts are not adjusted for temporary book-tax differences which will reverse in a subsequent period.
Book-tax differences are primarily due to foreign currency transactions, deferred trustees compensation and losses deferred due to wash sales.
As of period end, the cost and unrealized appreciation (depreciation) in securities, and derivatives if applicable, for federal income tax purposes were as follows:
| Gross unrealized appreciation | $177,692,466 |
| Gross unrealized depreciation | (2,164,793) |
| Net unrealized appreciation (depreciation) | $175,527,673 |
| Tax Cost | $311,100,955 |
The tax-based components of distributable earnings as of period end were as follows:
| Undistributed ordinary income | $454,344 |
| Undistributed long-term capital gain | $16,574,517 |
| Net unrealized appreciation (depreciation) on securities and other investments | $175,527,673 |
The tax character of distributions paid was as follows:
| July 31, 2021 | July 31, 2020 | |
| Ordinary Income | $5,035,427 | $ 8,901,801 |
| Long-term Capital Gains | 9,609,523 | 32,150,061 |
| Total | $14,644,950 | $ 41,051,862 |
Restricted Securities (including Private Placements). Funds may invest in securities that are subject to legal or contractual restrictions on resale. These securities generally may be resold in transactions exempt from registration or to the public if the securities are registered. Disposal of these securities may involve time-consuming negotiations and expense, and prompt sale at an acceptable price may be difficult. Information regarding restricted securities held at period end is included at the end of the Schedule of Investments, if applicable.
4. Purchases and Sales of Investments.
Purchases and sales of securities, other than short-term securities and in-kind transactions, as applicable, are noted in the table below.
| Purchases ($) | Sales ($) | |
| Fidelity Advisor Real Estate Fund | 224,905,057 | 272,546,605 |
5. Fees and Other Transactions with Affiliates.
Management Fee. Fidelity Management & Research Company LLC (the investment adviser) and its affiliates provide the Fund with investment management related services for which the Fund pays a monthly management fee. The management fee is the sum of an individual fund fee rate that is based on an annual rate of .30% of the Fund's average net assets and an annualized group fee rate that averaged .23% during the period. The group fee rate is based upon the monthly average net assets of a group of registered investment companies with which the investment adviser has management contracts. The group fee rate decreases as assets under management increase and increases as assets under management decrease. For the reporting period, the total annual management fee rate was .53% of the Fund's average net assets.
Distribution and Service Plan Fees. In accordance with Rule 12b-1 of the 1940 Act, the Fund has adopted separate Distribution and Service Plans for each class of shares. Certain classes pay Fidelity Distributors Company LLC (FDC), an affiliate of the investment adviser, separate Distribution and Service Fees, each of which is based on an annual percentage of each class' average net assets. In addition, FDC may pay financial intermediaries for selling shares of the Fund and providing shareholder support services. For the period, the Distribution and Service Fee rates, total fees and amounts retained by FDC were as follows:
| Distribution Fee | Service Fee | Total Fees | Retained by FDC | |
| Class A | -% | .25% | $293,096 | $4,222 |
| Class M | .25% | .25% | 515,620 | 1,824 |
| Class C | .75% | .25% | 183,215 | 16,763 |
| $991,931 | $22,809 |
Sales Load. FDC may receive a front-end sales charge of up to 5.75% for selling Class A shares and 3.50% for selling Class M shares, some of which is paid to financial intermediaries for selling shares of the Fund. Depending on the holding period, FDC may receive contingent deferred sales charges levied on Class A, Class M and Class C redemptions. The deferred sales charges are 1.00% for Class C shares, 1.00% for certain purchases of Class A shares and .25% for certain purchases of Class M shares.
For the period, sales charge amounts retained by FDC were as follows:
| Retained by FDC | |
| Class A | $20,912 |
| Class M | 3,576 |
| Class C(a) | 1,794 |
| $26,282 |
(a) When Class C shares are initially sold, FDC pays commissions from its own resources to financial intermediaries through which the sales are made.
Transfer Agent Fees. Fidelity Investments Institutional Operations Company LLC (FIIOC), an affiliate of the investment adviser, is the transfer, dividend disbursing and shareholder servicing agent for each class of the Fund. FIIOC receives account fees and asset-based fees that vary according to the account size and type of account of the shareholders of the respective classes of the Fund, except for Class Z. FIIOC receives an asset-based fee of Class Z's average net assets. FIIOC pays for typesetting, printing and mailing of shareholder reports, except proxy statements.
For the period, transfer agent fees for each class were as follows:
| Amount | % of Class-Level Average Net Assets | |
| Class A | $282,233 | .24 |
| Class M | 212,085 | .21 |
| Class C | 50,912 | .28 |
| Class I | 484,888 | .27 |
| Class Z | 5,749 | .04 |
| $1,035,867 |
Accounting Fees. Fidelity Service Company, Inc. (FSC), an affiliate of the investment adviser, maintains the Fund's accounting records. The accounting fee is based on the level of average net assets for each month. For the period, the fees were equivalent to the following annual rates:
| % of Average Net Assets | |
| Fidelity Advisor Real Estate Fund | .04 |
Brokerage Commissions. A portion of portfolio transactions were placed with brokerage firms which are affiliates of the investment adviser. Brokerage commissions are included in net realized gain (loss) and change in net unrealized appreciation (depreciation) in the Statement of Operations. The commissions paid to these affiliated firms were as follows:
| Amount | |
| Fidelity Advisor Real Estate Fund | $3,446 |
Interfund Lending Program. Pursuant to an Exemptive Order issued by the Securities and Exchange Commission (the SEC), the Fund, along with other registered investment companies having management contracts with Fidelity Management & Research Company LLC (FMR), or other affiliated entities of FMR, may participate in an interfund lending program. This program provides an alternative credit facility allowing the Fund to borrow from, or lend money to, other participating affiliated funds. At period end, there were no interfund loans outstanding. Activity in this program during the period for which loans were outstanding was as follows:
| Borrower or Lender | Average Loan Balance | Weighted Average Interest Rate | Interest Expense | |
| Fidelity Advisor Real Estate Fund | Borrower | $4,674,500 | .33% | $259 |
Interfund Trades. Funds may purchase from or sell securities to other Fidelity Funds under procedures adopted by the Board. The procedures have been designed to ensure these interfund trades are executed in accordance with Rule 17a-7 of the 1940 Act. Any interfund trades are included within the respective purchases and sales amounts shown in the Purchases and Sales of Investments note and are noted in the table below.
| Purchases ($) | Sales ($) | |
| Fidelity Advisor Real Estate Fund | 60,960,984 | 27,317,818 |
6. Committed Line of Credit.
Certain Funds participate with other funds managed by the investment adviser or an affiliate in a $4.25 billion credit facility (the "line of credit") to be utilized for temporary or emergency purposes to fund shareholder redemptions or for other short-term liquidity purposes. The participating funds have agreed to pay commitment fees on their pro-rata portion of the line of credit, which are reflected in Miscellaneous expenses on the Statement of Operations, and are listed below. During the period, there were no borrowings on this line of credit.
| Amount | |
| Fidelity Advisor Real Estate Fund | $816 |
7. Security Lending.
Funds lend portfolio securities from time to time in order to earn additional income. Lending agents are used, including National Financial Services (NFS), an affiliate of the investment adviser. Pursuant to a securities lending agreement, NFS will receive a fee, which is capped at 9.9% of a fund's daily lending revenue, for its services as lending agent. A fund may lend securities to certain qualified borrowers, including NFS. On the settlement date of the loan, a fund receives collateral (in the form of U.S. Treasury obligations, letters of credit and/or cash) against the loaned securities and maintains collateral in an amount not less than 100% of the market value of the loaned securities during the period of the loan. The market value of the loaned securities is determined at the close of business of a fund and any additional required collateral is delivered to a fund on the next business day. A fund or borrower may terminate the loan at any time, and if the borrower defaults on its obligation to return the securities loaned because of insolvency or other reasons, a fund may apply collateral received from the borrower against the obligation. A fund may experience delays and costs in recovering the securities loaned. Any cash collateral received is invested in the Fidelity Securities Lending Cash Central Fund. Any loaned securities are identified as such in the Schedule of Investments, and the value of loaned securities and cash collateral at period end, as applicable, are presented in the Statement of Assets and Liabilities. Security lending income represents the income earned on investing cash collateral, less rebates paid to borrowers and any lending agent fees associated with the loan, plus any premium payments received for lending certain types of securities. Security lending income is presented in the Statement of Operations as a component of income from Fidelity Central Funds. Affiliated security lending activity, if any, was as follows:
| Total Security Lending Fees Paid to NFS | Security Lending Income From Securities Loaned to NFS | Value of Securities Loaned to NFS at Period End | |
| Fidelity Advisor Real Estate Fund | $836 | $– | $– |
8. Expense Reductions.
Commissions paid to certain brokers with whom the investment adviser, or its affiliates, places trades on behalf of the Fund include an amount in addition to trade execution, which may be rebated back to the Fund to offset expenses. This amount totaled $25,564 for the period.
In addition, during the period the investment adviser or an affiliate reimbursed and/or waived a portion of fund-level operating expenses in the amount of $4,051.
9. Distributions to Shareholders.
Distributions to shareholders of each class were as follows:
| Year ended July 31, 2021 | Year ended July 31, 2020 |
|
| Fidelity Advisor Real Estate Fund | ||
| Distributions to shareholders | ||
| Class A | $3,943,668 | $11,351,149 |
| Class M | 3,401,100 | 9,900,861 |
| Class C | 608,843 | 2,212,295 |
| Class I | 6,121,163 | 16,797,330 |
| Class Z | 570,176 | 790,227 |
| Total | $14,644,950 | $41,051,862 |
10. Share Transactions.
Share transactions for each class were as follows and may contain in-kind transactions, automatic conversions between classes or exchanges between affiliated funds:
| Shares | Shares | Dollars | Dollars | |
| Year ended July 31, 2021 | Year ended July 31, 2020 | Year ended July 31, 2021 | Year ended July 31, 2020 | |
| Fidelity Advisor Real Estate Fund | ||||
| Class A | ||||
| Shares sold | 1,114,030 | 1,177,605 | $23,635,557 | $24,680,361 |
| Reinvestment of distributions | 201,989 | 518,941 | 3,878,210 | 11,204,406 |
| Shares redeemed | (1,613,289) | (2,412,107) | (33,263,379) | (50,221,247) |
| Net increase (decrease) | (297,270) | (715,561) | $(5,749,612) | $(14,336,480) |
| Class M | ||||
| Shares sold | 567,797 | 950,286 | $11,739,646 | $20,331,432 |
| Reinvestment of distributions | 176,839 | 456,913 | 3,389,165 | 9,847,117 |
| Shares redeemed | (955,077) | (1,995,286) | (19,872,105) | (42,434,132) |
| Net increase (decrease) | (210,441) | (588,087) | $(4,743,294) | $(12,255,583) |
| Class C | ||||
| Shares sold | 105,065 | 220,320 | $2,128,502 | $4,724,593 |
| Reinvestment of distributions | 32,588 | 101,651 | 604,904 | 2,127,235 |
| Shares redeemed | (555,809) | (528,900) | (11,351,257) | (10,184,069) |
| Net increase (decrease) | (418,156) | (206,929) | $(8,617,851) | $(3,332,241) |
| Class I | ||||
| Shares sold | 2,357,850 | 3,925,859 | $48,485,384 | $80,680,448 |
| Reinvestment of distributions | 299,336 | 746,499 | 5,816,838 | 16,292,429 |
| Shares redeemed | (3,820,307) | (5,319,374) | (78,503,211) | (110,572,461) |
| Net increase (decrease) | (1,163,121) | (647,016) | $(24,200,989) | $(13,599,584) |
| Class Z | ||||
| Shares sold | 717,966 | 430,251 | $14,541,293 | $9,103,828 |
| Reinvestment of distributions | 15,167 | 33,911 | 296,100 | 738,465 |
| Shares redeemed | (530,812) | (289,280) | (10,537,049) | (5,919,669) |
| Net increase (decrease) | 202,321 | 174,882 | $4,300,344 | $3,922,624 |
11. Other.
Fund's organizational documents provide former and current trustees and officers with a limited indemnification against liabilities arising in connection with the performance of their duties to the fund. In the normal course of business, the fund may also enter into contracts that provide general indemnifications. The fund's maximum exposure under these arrangements is unknown as this would be dependent on future claims that may be made against the fund. The risk of material loss from such claims is considered remote.
12. Coronavirus (COVID-19) Pandemic.
An outbreak of COVID-19 first detected in China during December 2019 has since spread globally and was declared a pandemic by the World Health Organization during March 2020. Developments that disrupt global economies and financial markets, such as the COVID-19 pandemic, may magnify factors that affect the Fund's performance.
Report of Independent Registered Public Accounting Firm
To the Board of Trustees of Fidelity Advisor Series VII and Shareholders of Fidelity Advisor Real Estate Fund
Opinion on the Financial Statements and Financial Highlights
We have audited the accompanying statement of assets and liabilities of Fidelity Advisor Real Estate Fund (the "Fund"), a fund of Fidelity Advisor Series VII, including the schedule of investments, as of July 31, 2021, the related statement of operations for the year then ended, the statement of changes in net assets for each of the two years in the period then ended, the financial highlights for each of the five years in the period then ended, and the related notes. In our opinion, the financial statements and financial highlights present fairly, in all material respects, the financial position of the Fund as of July 31, 2021, and the results of its operations for the year then ended, the changes in its net assets for each of the two years in the period then ended, and the financial highlights for each of the five years in the period then ended in conformity with accounting principles generally accepted in the United States of America.
Basis for Opinion
These financial statements and financial highlights are the responsibility of the Fund's management. Our responsibility is to express an opinion on the Fund's financial statements and financial highlights based on our audits. We are a public accounting firm registered with the Public Company Accounting Oversight Board (United States) (PCAOB) and are required to be independent with respect to the Fund in accordance with the U.S. federal securities laws and the applicable rules and regulations of the Securities and Exchange Commission and the PCAOB.
We conducted our audits in accordance with the standards of the PCAOB. Those standards require that we plan and perform the audit to obtain reasonable assurance about whether the financial statements and financial highlights are free of material misstatement, whether due to error or fraud. The Fund is not required to have, nor were we engaged to perform, an audit of its internal control over financial reporting. As part of our audits we are required to obtain an understanding of internal control over financial reporting but not for the purpose of expressing an opinion on the effectiveness of the Fund’s internal control over financial reporting. Accordingly, we express no such opinion.
Our audits included performing procedures to assess the risks of material misstatement of the financial statements and financial highlights, whether due to error or fraud, and performing procedures that respond to those risks. Such procedures included examining, on a test basis, evidence regarding the amounts and disclosures in the financial statements and financial highlights. Our audits also included evaluating the accounting principles used and significant estimates made by management, as well as evaluating the overall presentation of the financial statements and financial highlights. Our procedures included confirmation of securities owned as of July 31, 2021, by correspondence with the custodian and brokers; when replies were not received from brokers, we performed other auditing procedures. We believe that our audits provide a reasonable basis for our opinion.
/s/ Deloitte & Touche LLP
Boston, Massachusetts
September 14, 2021
We have served as the auditor of one or more of the Fidelity investment companies since 1999.
Trustees and Officers
The Trustees, Members of the Advisory Board (if any), and officers of the trust and fund, as applicable, are listed below. The Board of Trustees governs the fund and is responsible for protecting the interests of shareholders. The Trustees are experienced executives who meet periodically throughout the year to oversee the fund's activities, review contractual arrangements with companies that provide services to the fund, oversee management of the risks associated with such activities and contractual arrangements, and review the fund's performance. Each of the Trustees oversees 314 funds.
The Trustees hold office without limit in time except that (a) any Trustee may resign; (b) any Trustee may be removed by written instrument, signed by at least two-thirds of the number of Trustees prior to such removal; (c) any Trustee who requests to be retired or who has become incapacitated by illness or injury may be retired by written instrument signed by a majority of the other Trustees; and (d) any Trustee may be removed at any special meeting of shareholders by a two-thirds vote of the outstanding voting securities of the trust. Each Trustee who is not an interested person (as defined in the 1940 Act) of the trust and the fund is referred to herein as an Independent Trustee. Each Independent Trustee shall retire not later than the last day of the calendar year in which his or her 75th birthday occurs. The Independent Trustees may waive this mandatory retirement age policy with respect to individual Trustees. Officers and Advisory Board Members hold office without limit in time, except that any officer or Advisory Board Member may resign or may be removed by a vote of a majority of the Trustees at any regular meeting or any special meeting of the Trustees. Except as indicated, each individual has held the office shown or other offices in the same company for the past five years.
The fund’s Statement of Additional Information (SAI) includes more information about the Trustees. To request a free copy, call Fidelity at 1-877-208-0098.
Experience, Skills, Attributes, and Qualifications of the Trustees. The Governance and Nominating Committee has adopted a statement of policy that describes the experience, qualifications, attributes, and skills that are necessary and desirable for potential Independent Trustee candidates (Statement of Policy). The Board believes that each Trustee satisfied at the time he or she was initially elected or appointed a Trustee, and continues to satisfy, the standards contemplated by the Statement of Policy. The Governance and Nominating Committee also engages professional search firms to help identify potential Independent Trustee candidates who have the experience, qualifications, attributes, and skills consistent with the Statement of Policy. From time to time, additional criteria based on the composition and skills of the current Independent Trustees, as well as experience or skills that may be appropriate in light of future changes to board composition, business conditions, and regulatory or other developments, have also been considered by the professional search firms and the Governance and Nominating Committee. In addition, the Board takes into account the Trustees' commitment and participation in Board and committee meetings, as well as their leadership of standing and ad hoc committees throughout their tenure.
In determining that a particular Trustee was and continues to be qualified to serve as a Trustee, the Board has considered a variety of criteria, none of which, in isolation, was controlling. The Board believes that, collectively, the Trustees have balanced and diverse experience, qualifications, attributes, and skills, which allow the Board to operate effectively in governing the fund and protecting the interests of shareholders. Information about the specific experience, skills, attributes, and qualifications of each Trustee, which in each case led to the Board's conclusion that the Trustee should serve (or continue to serve) as a trustee of the fund, is provided below.
Board Structure and Oversight Function. Robert A. Lawrence is an interested person and currently serves as Acting Chairman. The Trustees have determined that an interested Chairman is appropriate and benefits shareholders because an interested Chairman has a personal and professional stake in the quality and continuity of services provided to the fund. Independent Trustees exercise their informed business judgment to appoint an individual of their choosing to serve as Chairman, regardless of whether the Trustee happens to be independent or a member of management. The Independent Trustees have determined that they can act independently and effectively without having an Independent Trustee serve as Chairman and that a key structural component for assuring that they are in a position to do so is for the Independent Trustees to constitute a substantial majority for the Board. The Independent Trustees also regularly meet in executive session. David M. Thomas serves as Lead Independent Trustee and as such (i) acts as a liaison between the Independent Trustees and management with respect to matters important to the Independent Trustees and (ii) with management prepares agendas for Board meetings.
Fidelity® funds are overseen by different Boards of Trustees. The fund's Board oversees Fidelity's high income and certain equity funds, and other Boards oversee Fidelity's investment-grade bond, money market, asset allocation, and other equity funds. The asset allocation funds may invest in Fidelity® funds overseen by the fund's Board. The use of separate Boards, each with its own committee structure, allows the Trustees of each group of Fidelity® funds to focus on the unique issues of the funds they oversee, including common research, investment, and operational issues. On occasion, the separate Boards establish joint committees to address issues of overlapping consequences for the Fidelity® funds overseen by each Board.
The Trustees operate using a system of committees to facilitate the timely and efficient consideration of all matters of importance to the Trustees, the fund, and fund shareholders and to facilitate compliance with legal and regulatory requirements and oversight of the fund's activities and associated risks. The Board, acting through its committees, has charged FMR and its affiliates with (i) identifying events or circumstances the occurrence of which could have demonstrably adverse effects on the fund's business and/or reputation; (ii) implementing processes and controls to lessen the possibility that such events or circumstances occur or to mitigate the effects of such events or circumstances if they do occur; and (iii) creating and maintaining a system designed to evaluate continuously business and market conditions in order to facilitate the identification and implementation processes described in (i) and (ii) above. Because the day-to-day operations and activities of the fund are carried out by or through FMR, its affiliates, and other service providers, the fund's exposure to risks is mitigated but not eliminated by the processes overseen by the Trustees. While each of the Board's committees has responsibility for overseeing different aspects of the fund's activities, oversight is exercised primarily through the Operations, Audit, and Compliance Committees. Appropriate personnel, including but not limited to the fund's Chief Compliance Officer (CCO), FMR's internal auditor, the independent accountants, the fund's Treasurer and portfolio management personnel, make periodic reports to the Board's committees, as appropriate, including an annual review of Fidelity's risk management program for the Fidelity® funds. The responsibilities of each standing committee, including their oversight responsibilities, are described further under "Standing Committees of the Trustees."
Interested Trustees*:
Correspondence intended for a Trustee who is an interested person may be sent to Fidelity Investments, 245 Summer Street, Boston, Massachusetts 02210.
Name, Year of Birth; Principal Occupations and Other Relevant Experience+
Bettina Doulton (1964)
Year of Election or Appointment: 2020
Trustee
Ms. Doulton also serves as Trustee of other Fidelity® funds. Prior to her retirement, Ms. Doulton served in a variety of positions at Fidelity Investments, including as a managing director of research (2006-2007), portfolio manager to certain Fidelity® funds (1993-2005), equity analyst and portfolio assistant (1990-1993), and research assistant (1987-1990). Ms. Doulton currently owns and operates Phi Builders + Architects and Cellardoor Winery. Previously, Ms. Doulton served as a member of the Board of Brown Capital Management, LLC (2014-2018).
Robert A. Lawrence (1952)
Year of Election or Appointment: 2020
Trustee
Acting Chairman of the Board of Trustees
Mr. Lawrence also serves as Trustee of other funds. Previously, Mr. Lawrence served as a Member of the Advisory Board of certain funds. Prior to his retirement in 2008, Mr. Lawrence served as Vice President of certain Fidelity® funds (2006-2008), Senior Vice President, Head of High Income Division of Fidelity Management & Research Company (investment adviser firm, 2006-2008), and President of Fidelity Strategic Investments (investment adviser firm, 2002-2005).
* Determined to be an “Interested Trustee” by virtue of, among other things, his or her affiliation with the trust or various entities under common control with FMR.
+ The information includes the Trustee's principal occupation during the last five years and other information relating to the experience, attributes, and skills relevant to the Trustee's qualifications to serve as a Trustee, which led to the conclusion that the Trustee should serve as a Trustee for the fund.
Independent Trustees:
Correspondence intended for an Independent Trustee may be sent to Fidelity Investments, P.O. Box 55235, Boston, Massachusetts 02205-5235.
Name, Year of Birth; Principal Occupations and Other Relevant Experience+
Thomas P. Bostick (1956)
Year of Election or Appointment: 2021
Trustee
Lieutenant General Bostick also serves as Trustee of other Fidelity® funds. Prior to his retirement, General Bostick (United States Army, Retired) held a variety of positions within the U.S. Army, including Commanding General and Chief of Engineers, U.S. Army Corps of Engineers (2012-2016) and Deputy Chief of Staff and Director of Human Resources, U.S. Army (2009-2012). General Bostick currently serves as a member of the Board and Finance and Governance Committees of CSX Corporation (transportation, 2020-present) and a member of the Board and Corporate Governance and Nominating Committee of Perma-Fix Environmental Services, Inc. (nuclear waste management, 2020-present). General Bostick serves as Chief Executive Officer of Bostick Global Strategies, LLC (consulting, 2016-present) and Managing Partner, Sustainability, of Ridge-Lane Limited Partners (strategic advisory and venture development, 2016-present). Previously, General Bostick served as a Member of the Advisory Board of certain Fidelity® funds (2021), President, Intrexon Bioengineering (2018-2020) and Chief Operating Officer (2017-2020) and Senior Vice President of the Environment Sector (2016-2017) of Intrexon Corporation (biopharmaceutical company).
Dennis J. Dirks (1948)
Year of Election or Appointment: 2018
Trustee
Mr. Dirks also serves as Trustee of other Fidelity® funds. Prior to his retirement in May 2003, Mr. Dirks served as Chief Operating Officer and as a member of the Board of The Depository Trust & Clearing Corporation (financial markets infrastructure), President, Chief Operating Officer and a member of the Board of The Depository Trust Company (DTC), President and a member of the Board of the National Securities Clearing Corporation (NSCC), Chief Executive Officer and a member of the Board of the Government Securities Clearing Corporation and Chief Executive Officer and a member of the Board of the Mortgage-Backed Securities Clearing Corporation. Mr. Dirks currently serves as a member of the Finance Committee (2016-present) and Board (2017-present) and is Treasurer (2018-present) of the Asolo Repertory Theatre.
Donald F. Donahue (1950)
Year of Election or Appointment: 2018
Trustee
Mr. Donahue also serves as Trustee of other Fidelity® funds. Mr. Donahue serves as President and Chief Executive Officer of Miranda Partners, LLC (risk consulting for the financial services industry, 2012-present). Previously, Mr. Donahue served as Chief Executive Officer (2006-2012), Chief Operating Officer (2003-2006) and Managing Director, Customer Marketing and Development (1999-2003) of The Depository Trust & Clearing Corporation (financial markets infrastructure). Mr. Donahue currently serves as a member (2007-present) and Co-Chairman (2016-present) of the Board of United Way of New York and a member of the Board of NYC Leadership Academy (2012-present). Mr. Donahue previously served as a member of the Advisory Board of certain Fidelity® funds (2015-2018).
Vicki L. Fuller (1957)
Year of Election or Appointment: 2020
Trustee
Ms. Fuller also serves as Trustee of other Fidelity® funds. Previously, Ms. Fuller served as a member of the Advisory Board of certain Fidelity® funds (2018-2020), Chief Investment Officer of the New York State Common Retirement Fund (2012-2018) and held a variety of positions at AllianceBernstein L.P. (global asset management, 1985-2012), including Managing Director (2006-2012) and Senior Vice President and Senior Portfolio Manager (2001-2006). Ms. Fuller currently serves as a member of the Board, Audit Committee and Nominating and Governance Committee of The Williams Companies, Inc. (natural gas infrastructure, 2018-present), as a member of the Board, Audit Committee and Nominating and Governance Committee of two Blackstone business development companies (2020-present) and as a member of the Board of Treliant, LLC (consulting, 2019-present).
Patricia L. Kampling (1959)
Year of Election or Appointment: 2020
Trustee
Ms. Kampling also serves as Trustee of other Fidelity® funds. Prior to her retirement, Ms. Kampling served as Chairman of the Board and Chief Executive Officer (2012-2019), President and Chief Operating Officer (2011-2012) and Executive Vice President and Chief Financial Officer (2010-2011) of Alliant Energy Corporation. Ms. Kampling currently serves as a member of the Board, Finance Committee and Governance, Compensation and Nominating Committee of Xcel Energy Inc. (utilities company, 2020-present) and as a member of the Board, Audit, Finance and Risk Committee and Safety, Environmental, Technology and Operations Committee of American Water Works Company, Inc. (utilities company, 2019-present). In addition, Ms. Kampling currently serves as a member of the Board of the Nature Conservancy, Wisconsin Chapter (2019-present). Previously, Ms. Kampling served as a Member of the Advisory Board of certain Fidelity® funds (2020), a member of the Board, Compensation Committee and Executive Committee and Chair of the Audit Committee of Briggs & Stratton Corporation (manufacturing, 2011-2021), a member of the Board of Interstate Power and Light Company (2012-2019) and Wisconsin Power and Light Company (2012-2019) (each a subsidiary of Alliant Energy Corporation) and as a member of the Board and Workforce Development Committee of the Business Roundtable (2018-2019).
Thomas A. Kennedy (1955)
Year of Election or Appointment: 2021
Trustee
Mr. Kennedy also serves as Trustee of other Fidelity® funds. Previously, Mr. Kennedy served as a Member of the Advisory Board of certain Fidelity® funds (2020) and held a variety of positions at Raytheon Company (aerospace and defense, 1983-2020), including Chairman and Chief Executive Officer (2014-2020) and Executive Vice President and Chief Operating Officer (2013-2014). Mr. Kennedy currently serves as Executive Chairman of the Board of Directors of Raytheon Technologies Corporation (aerospace and defense, 2020-present). He is also a member of the Rutgers School of Engineering Industry Advisory Board (2011-present) and a member of the UCLA Engineering Dean’s Executive Board (2016-present).
Oscar Munoz (1959)
Year of Election or Appointment: 2021
Trustee
Mr. Munoz also serves as Trustee of other Fidelity® funds. Prior to his retirement, Mr. Munoz served as Executive Chairman (2020-2021), Chief Executive Officer (2015-2020), President (2015-2016) and a member of the Board (2010-2021) of United Airlines Holdings, Inc. Mr. Munoz currently serves as a member of the Board of CBRE Group, Inc. (commercial real estate, 2020-present), a member of the Board of Univision Communications, Inc. (Hispanic media, 2020-present) and a member of the Advisory Board of Salesforce.com, Inc. (cloud-based software, 2020-present). Previously, Mr. Munoz served as a Member of the Advisory Board of certain Fidelity® funds (2021).
Garnett A. Smith (1947)
Year of Election or Appointment: 2013
Trustee
Mr. Smith also serves as Trustee of other Fidelity® funds. Prior to his retirement, Mr. Smith served as Chairman and Chief Executive Officer (1990-1997) and President (1986-1990) of Inbrand Corp. (manufacturer of personal absorbent products). Prior to his employment with Inbrand Corp., he was employed by a retail fabric chain and North Carolina National Bank (now Bank of America). Mr. Smith previously served as a member of the Advisory Board of certain Fidelity® funds (2012-2013).
David M. Thomas (1949)
Year of Election or Appointment: 2018
Trustee
Lead Independent Trustee
Mr. Thomas also serves as Trustee of other Fidelity® funds. Previously, Mr. Thomas served as Executive Chairman (2005-2006) and Chairman and Chief Executive Officer (2000-2005) of IMS Health, Inc. (pharmaceutical and healthcare information solutions). Mr. Thomas currently serves as a member of the Board of Fortune Brands Home and Security (home and security products, 2004-present) and Presiding Director (2013-present) of Interpublic Group of Companies, Inc. (marketing communication).
Susan Tomasky (1953)
Year of Election or Appointment: 2020
Trustee
Ms. Tomasky also serves as Trustee of other Fidelity® funds. Prior to her retirement, Ms. Tomasky served in various executive officer positions at American Electric Power Company, Inc. (1998-2011), including most recently as President of AEP Transmission (2007-2011). Ms. Tomasky currently serves as a member of the Board and Sustainability Committee and as Chair of the Audit Committee of Marathon Petroleum Corporation (2018-present) and as a member of the Board, Corporate Governance Committee and Organization and Compensation Committee and as Chair of the Audit Committee of Public Service Enterprise Group, Inc. (utilities company, 2012-present). In addition, Ms. Tomasky currently serves as a member (2009-present) and President (2020-present) of the Board of the Royal Shakespeare Company – America (2009-present), as a member of the Board of the Columbus Association for the Performing Arts (2011-present) and as a member of the Board and Investment Committee of Kenyon College (2016-present). Previously, Ms. Tomasky served as a Member of the Advisory Board of certain Fidelity® funds (2020), as a member of the Board of the Columbus Regional Airport Authority (2007-2020), as a member of the Board (2011-2018) and Lead Independent Director (2015-2018) of Andeavor Corporation (previously Tesoro Corporation) (independent oil refiner and marketer) and as a member of the Board of Summit Midstream Partners LP (energy, 2012-2018).
Michael E. Wiley (1950)
Year of Election or Appointment: 2008
Trustee
Mr. Wiley also serves as Trustee of other Fidelity® funds. Previously, Mr. Wiley served as a member of the Advisory Board of certain Fidelity® funds (2018-2020), Chairman, President and CEO of Baker Hughes, Inc. (oilfield services, 2000-2004). Mr. Wiley also previously served as a member of the Board of Andeavor Corporation (independent oil refiner and marketer, 2005-2018), a member of the Board of Andeavor Logistics LP (natural resources logistics, 2015-2018) and a member of the Board of High Point Resources (exploration and production, 2005-2020).
+ The information includes the Trustee's principal occupation during the last five years and other information relating to the experience, attributes, and skills relevant to the Trustee's qualifications to serve as a Trustee, which led to the conclusion that the Trustee should serve as a Trustee for the fund.
Advisory Board Members and Officers:
Correspondence intended for a Member of the Advisory Board (if any) may be sent to Fidelity Investments, P.O. Box 55235, Boston, Massachusetts 02205-5235. Correspondence intended for an officer or Peter S. Lynch may be sent to Fidelity Investments, 245 Summer Street, Boston, Massachusetts 02210. Officers appear below in alphabetical order.
Name, Year of Birth; Principal Occupation
Peter S. Lynch (1944)
Year of Election or Appointment: 2018
Member of the Advisory Board
Mr. Lynch also serves as a Member of the Advisory Board of other Fidelity® funds. Mr. Lynch is Vice Chairman and a Director of Fidelity Management & Research Company LLC (investment adviser firm). In addition, Mr. Lynch serves as a Trustee of Boston College and as the Chairman of the Inner-City Scholarship Fund. Previously, Mr. Lynch served as Vice Chairman and a Director of FMR Co., Inc. (investment adviser firm) and on the Special Olympics International Board of Directors (1997-2006).
Craig S. Brown (1977)
Year of Election or Appointment: 2019
Assistant Treasurer
Mr. Brown also serves as an officer of other funds. Mr. Brown serves as Assistant Treasurer of FIMM, LLC (2021-present) and is an employee of Fidelity Investments (2013-present).
John J. Burke III (1964)
Year of Election or Appointment: 2018
Chief Financial Officer
Mr. Burke also serves as Chief Financial Officer of other funds. Mr. Burke serves as Head of Investment Operations for Fidelity Fund and Investment Operations (2018-present) and is an employee of Fidelity Investments (1998-present). Previously Mr. Burke served as head of Asset Management Investment Operations (2012-2018).
William C. Coffey (1969)
Year of Election or Appointment: 2019
Assistant Secretary
Mr. Coffey also serves as Assistant Secretary of other funds. He is Senior Vice President and Deputy General Counsel of FMR LLC (diversified financial services company, 2010-present), and is an employee of Fidelity Investments. Previously, Mr. Coffey served as Secretary and CLO of certain funds (2018-2019); CLO, Secretary, and Senior Vice President of Fidelity Management & Research Company and FMR Co., Inc. (investment adviser firms, 2018-2019); Secretary of Fidelity SelectCo, LLC and Fidelity Investments Money Management, Inc. (investment adviser firms, 2018-2019); CLO of Fidelity Management & Research (Hong Kong) Limited, FMR Investment Management (UK) Limited, and Fidelity Management & Research (Japan) Limited (investment adviser firms, 2018-2019); and Assistant Secretary of certain funds (2009-2018).
Timothy M. Cohen (1969)
Year of Election or Appointment: 2018
Vice President
Mr. Cohen also serves as Vice President of other funds. Mr. Cohen serves as Co-Head of Equity (2018-present), a Director of Fidelity Management & Research (Japan) Limited (investment adviser firm, 2016-present), and is an employee of Fidelity Investments. Previously, Mr. Cohen served as Executive Vice President of Fidelity SelectCo, LLC (2019), Head of Global Equity Research (2016-2018), Chief Investment Officer - Equity and a Director of Fidelity Management & Research (U.K.) Inc. (investment adviser firm, 2013-2015) and as a Director of Fidelity Management & Research (Hong Kong) Limited (investment adviser firm, 2017).
Jonathan Davis (1968)
Year of Election or Appointment: 2010
Assistant Treasurer
Mr. Davis also serves as an officer of other funds. Mr. Davis serves as Assistant Treasurer of FIMM, LLC (2021-present) and FMR Capital, Inc. (2017-present) and is an employee of Fidelity Investments. Previously, Mr. Davis served as Vice President and Associate General Counsel of FMR LLC (diversified financial services company, 2003-2010).
Laura M. Del Prato (1964)
Year of Election or Appointment: 2018
Assistant Treasurer
Ms. Del Prato also serves as an officer of other funds. Ms. Del Prato serves as Assistant Treasurer of FIMM, LLC (2021-present) and is an employee of Fidelity Investments (2017-present). Previously, Ms. Del Prato served as President and Treasurer of The North Carolina Capital Management Trust: Cash Portfolio and Term Portfolio (2018-2020). Prior to joining Fidelity Investments, Ms. Del Prato served as a Managing Director and Treasurer of the JPMorgan Mutual Funds (2014-2017). Prior to JPMorgan, Ms. Del Prato served as a partner at Cohen Fund Audit Services (accounting firm, 2012-2013) and KPMG LLP (accounting firm, 2004-2012).
Colm A. Hogan (1973)
Year of Election or Appointment: 2020
Assistant Treasurer
Mr. Hogan also serves as an officer of other funds. Mr. Hogan serves as Assistant Treasurer of FIMM, LLC (2021-present) and FMR Capital, Inc. (2017-present) and is an employee of Fidelity Investments (2005-present). Previously, Mr. Hogan served as Deputy Treasurer of certain Fidelity® funds (2016-2020) and Assistant Treasurer of certain Fidelity® funds (2016-2018).
Pamela R. Holding (1964)
Year of Election or Appointment: 2018
Vice President
Ms. Holding also serves as Vice President of other funds. Ms. Holding serves as Co-Head of Equity (2018-present) and is an employee of Fidelity Investments (2013-present). Previously, Ms. Holding served as Executive Vice President of Fidelity SelectCo, LLC (2019) and as Chief Investment Officer of Fidelity Institutional Asset Management (2013-2018).
Cynthia Lo Bessette (1969)
Year of Election or Appointment: 2019
Secretary and Chief Legal Officer (CLO)
Ms. Lo Bessette also serves as an officer of other funds. Ms. Lo Bessette serves as CLO, Secretary, and Senior Vice President of Fidelity Management & Research Company LLC (investment adviser firm, 2019-present); and CLO of Fidelity Management & Research (Hong Kong) Limited, FMR Investment Management (UK) Limited, and Fidelity Management & Research (Japan) Limited (investment adviser firms, 2019-present). She is a Senior Vice President and Deputy General Counsel of FMR LLC (diversified financial services company, 2019-present), and is an employee of Fidelity Investments. Previously, Ms. Lo Bessette served as CLO, Secretary, and Senior Vice President of FMR Co., Inc. (investment adviser firm, 2019); Secretary of Fidelity SelectCo, LLC and Fidelity Investments Money Management, Inc. (investment adviser firms, 2019). Prior to joining Fidelity Investments, Ms. Lo Bessette was Executive Vice President, General Counsel (2016-2019) and Senior Vice President, Deputy General Counsel (2015-2016) of OppenheimerFunds (investment management company) and Deputy Chief Legal Officer (2013-2015) of Jennison Associates LLC (investment adviser firm).
Chris Maher (1972)
Year of Election or Appointment: 2020
Deputy Treasurer
Mr. Maher also serves as an officer of other funds. Mr. Maher serves as Assistant Treasurer of FIMM, LLC (2021-present) and FMR Capital, Inc. (2017-present), and is an employee of Fidelity Investments (2008-present). Previously, Mr. Maher served as Assistant Treasurer of certain funds (2013-2020); Vice President of Asset Management Compliance (2013), Vice President of the Program Management Group of FMR (investment adviser firm, 2010-2013), and Vice President of Valuation Oversight (2008-2010).
Jason P. Pogorelec (1975)
Year of Election or Appointment: 2020
Chief Compliance Officer
Mr. Pogorelec also serves as Chief Compliance Officer of other funds. Mr. Pogorelec is a senior Vice President of Asset Management Compliance for Fidelity Investments and is an employee of Fidelity Investments (2006-present). Previously, Mr. Pogorelec served as Vice President, Associate General Counsel for Fidelity Investments (2010-2020) and Assistant Secretary of certain Fidelity funds (2015-2020).
Brett Segaloff (1972)
Year of Election or Appointment: 2021
Anti-Money Laundering (AML) Officer
Mr. Segaloff also serves as an AML Officer of other funds and other related entities. He is Director, Anti-Money Laundering (2007-present) of FMR LLC (diversified financial services company) and is an employee of Fidelity Investments (1996-present).
Stacie M. Smith (1974)
Year of Election or Appointment: 2018
President and Treasurer
Ms. Smith also serves as an officer of other funds. Ms. Smith serves as Assistant Treasurer of FIMM, LLC (2021-present) and FMR Capital, Inc. (2017-present), is an employee of Fidelity Investments (2009-present), and has served in other fund officer roles. Prior to joining Fidelity Investments, Ms. Smith served as Senior Audit Manager of Ernst & Young LLP (accounting firm, 1996-2009). Previously, Ms. Smith served as Assistant Treasurer (2013-2019) and Deputy Treasurer (2013-2016) of certain Fidelity® funds.
Marc L. Spector (1972)
Year of Election or Appointment: 2017
Assistant Treasurer
Mr. Spector also serves as an officer of other funds. Mr. Spector serves as Assistant Treasurer of FIMM, LLC (2021-present) and FMR Capital, Inc. (2017-present) and is an employee of Fidelity Investments (2016-present). Prior to joining Fidelity Investments, Mr. Spector served as Director at the Siegfried Group (accounting firm, 2013-2016), and prior to Siegfried Group as audit senior manager at Deloitte & Touche LLP (accounting firm, 2005-2013).
Jim Wegmann (1979)
Year of Election or Appointment: 2019
Assistant Treasurer
Mr. Wegmann also serves as an officer of other funds. Mr. Wegmann serves as Assistant Treasurer of FIMM, LLC (2021-present) and is an employee of Fidelity Investments (2011-present).
Shareholder Expense Example
As a shareholder, you incur two types of costs: (1) transaction costs, which may include sales charges (loads) on purchase payments or redemption proceeds, as applicable and (2) ongoing costs, which generally include management fees, distribution and/or service (12b-1) fees and other Fund expenses. This Example is intended to help you understand your ongoing costs (in dollars) of investing in a fund and to compare these costs with the ongoing costs of investing in other mutual funds.
The Example is based on an investment of $1,000 invested at the beginning of the period and held for the entire period (February 1, 2021 to July 31, 2021).
Actual Expenses
The first line of the accompanying table provides information about actual account values and actual expenses. You may use the information in this line, together with the amount you invested, to estimate the expenses that you paid over the period. Simply divide your account value by $1,000.00 (for example, an $8,600 account value divided by $1,000.00 = 8.6), then multiply the result by the number in the first line for a class/Fund under the heading entitled "Expenses Paid During Period" to estimate the expenses you paid on your account during this period. If any fund is a shareholder of any underlying mutual funds or exchange-traded funds (ETFs) (the Underlying Funds), such fund indirectly bears its proportional share of the expenses of the Underlying Funds in addition to the direct expenses incurred presented in the table. These fees and expenses are not included in the annualized expense ratio used to calculate the expense estimate in the table below.
Hypothetical Example for Comparison Purposes
The second line of the accompanying table provides information about hypothetical account values and hypothetical expenses based on the actual expense ratio and an assumed rate of return of 5% per year before expenses, which is not the actual return. The hypothetical account values and expenses may not be used to estimate the actual ending account balance or expenses you paid for the period. You may use this information to compare the ongoing costs of investing in the Fund and other funds. To do so, compare this 5% hypothetical example with the 5% hypothetical examples that appear in the shareholder reports of the other funds. If any fund is a shareholder of any Underlying Funds, such fund indirectly bears its proportional share of the expenses of the Underlying Funds in addition to the direct expenses as presented in the table. These fees and expenses are not included in the annualized expense ratio used to calculate the expense estimate in the table below.
Please note that the expenses shown in the table are meant to highlight your ongoing costs only and do not reflect any transaction costs. Therefore, the second line of the table is useful in comparing ongoing costs only, and will not help you determine the relative total costs of owning different funds. In addition, if these transactional costs were included, your costs would have been higher.
| Annualized Expense Ratio-A | Beginning Account Value February 1, 2021 | Ending Account Value July 31, 2021 | Expenses Paid During Period-B February 1, 2021 to July 31, 2021 |
|
| Fidelity Advisor Real Estate Fund | ||||
| Class A | 1.07% | |||
| Actual | $1,000.00 | $1,270.50 | $6.02 | |
| Hypothetical-C | $1,000.00 | $1,019.49 | $5.36 | |
| Class M | 1.29% | |||
| Actual | $1,000.00 | $1,269.50 | $7.26 | |
| Hypothetical-C | $1,000.00 | $1,018.40 | $6.46 | |
| Class C | 1.86% | |||
| Actual | $1,000.00 | $1,265.50 | $10.45 | |
| Hypothetical-C | $1,000.00 | $1,015.57 | $9.30 | |
| Class I | .86% | |||
| Actual | $1,000.00 | $1,271.80 | $4.84 | |
| Hypothetical-C | $1,000.00 | $1,020.53 | $4.31 | |
| Class Z | .63% | |||
| Actual | $1,000.00 | $1,273.40 | $3.55 | |
| Hypothetical-C | $1,000.00 | $1,021.67 | $3.16 |
A Annualized expense ratio reflects expenses net of applicable fee waivers.
B Expenses are equal to the annualized expense ratio, multiplied by the average account value over the period, multiplied by 181/ 365 (to reflect the one-half year period). The fees and expenses of any Underlying Funds are not included in each annualized expense ratio.
C 5% return per year before expenses
Distributions (Unaudited)
The fund hereby designates as a capital gain dividend with respect to the taxable year ended July 31, 2021, $17,914,687, or, if subsequently determined to be different, the net capital gain of such year.
A total of 0.01% of the dividends distributed during the fiscal year was derived from interest on U.S. Government securities which is generally exempt from state income tax.
Class A designates 21%, 100%, 0% and 0%; Class C designates 45%, 100%, 0% and 0%; Class M designates 25%, 100%, 0% and 0%; Class I designates 19%, 100%, 100% and 100%; Class Z designates 16%, 100%, 100% and 100%; of the dividends distributed in, September, December, March and June, respectively during the fiscal year as a section 199A dividend.
The fund will notify shareholders in January 2022 of amounts for use in preparing 2021 income tax returns.
Board Approval of Investment Advisory Contracts and Management Fees
Fidelity Advisor Real Estate Fund
Each year, the Board of Trustees, including the Independent Trustees (together, the Board), votes on the renewal of the management contract with Fidelity Management & Research Company LLC (FMR) and the sub-advisory agreements (together, the Advisory Contracts) for the fund. FMR and the sub-advisers are referred to herein as the Investment Advisers. The Board, assisted by the advice of fund counsel and Independent Trustees' counsel, requests and considers a broad range of information relevant to the renewal of the Advisory Contracts throughout the year.The Board meets regularly and, at each of its meetings, covers an extensive agenda of topics and materials and considers factors that are relevant to its annual consideration of the renewal of the fund's Advisory Contracts, including the services and support provided to the fund and its shareholders. The Board has established various standing committees (Committees), each composed of and chaired by Independent Trustees with varying backgrounds, to which the Board has assigned specific subject matter responsibilities in order to enhance effective decision-making by the Board. The Board, acting directly and through its Committees, requests and receives information concerning the annual consideration of the renewal of the fund's Advisory Contracts. The Board also meets as needed to review matters specifically related to the Board's annual consideration of the renewal of the Advisory Contracts. Members of the Board may also meet with trustees of other Fidelity funds through joint ad hoc committees to discuss certain matters relevant to all of the Fidelity funds.At its May 2021 meeting, the Board unanimously determined to renew the fund's Advisory Contracts. In reaching its determination, the Board considered all factors it believed relevant, including (i) the nature, extent, and quality of the services provided to the fund and its shareholders (including the investment performance of the fund); (ii) the competitiveness of the fund's management fee and total expense ratio relative to peer funds; (iii) the total costs of the services provided by and the profits realized by Fidelity from its relationships with the fund; and (iv) the extent to which, if any, economies of scale exist and are realized as the fund grows, and whether any economies of scale are appropriately shared with fund shareholders.In considering whether to renew the Advisory Contracts for the fund, the Board reached a determination, with the assistance of fund counsel and Independent Trustees' counsel and through the exercise of its business judgment, that the renewal of the Advisory Contracts was in the best interests of the fund and its shareholders and that the compensation payable under the Advisory Contracts was fair and reasonable. The Board's decision to renew the Advisory Contracts was not based on any single factor, but rather was based on a comprehensive consideration of all the information provided to the Board at its meetings throughout the year. The Board, in reaching its determination to renew the Advisory Contracts, was aware that shareholders of the fund have a broad range of investment choices available to them, including a wide choice among funds offered by Fidelity's competitors, and that the fund's shareholders, who have the opportunity to review and weigh the disclosure provided by the fund in its prospectus and other public disclosures, have chosen to invest in this fund, which is part of the Fidelity family of funds. Nature, Extent, and Quality of Services Provided. The Board considered Fidelity's staffing as it relates to the fund, including the backgrounds of investment personnel of Fidelity, and also considered the fund's investment objective, strategies, and related investment philosophy. The Independent Trustees also had discussions with senior management of Fidelity's investment operations and investment groups. The Board considered the structure of the investment personnel compensation program and whether this structure provides appropriate incentives to act in the best interests of the fund. Additionally, the Board considered the portfolio managers' investments, if any, in the funds that they manage. Resources Dedicated to Investment Management and Support Services. The Board and the Fund Oversight and Research Committees reviewed the general qualifications and capabilities of Fidelity's investment staff, including its size, education, experience, and resources, as well as Fidelity's approach to recruiting, training, managing, and compensating investment personnel. The Board noted that Fidelity has continued to increase the resources devoted to non-U.S. offices, including expansion of Fidelity's global investment organization. The Board also noted that Fidelity's analysts have extensive resources, tools and capabilities that allow them to conduct sophisticated quantitative and fundamental analysis, as well as credit analysis of issuers, counterparties and guarantors. Further, the Board considered that Fidelity's investment professionals have sufficient access to global information and data so as to provide competitive investment results over time, and that those professionals also have access to sophisticated tools that permit them to assess portfolio construction and risk and performance attribution characteristics continuously, as well as to transmit new information and research conclusions rapidly around the world. Additionally, in its deliberations, the Board considered Fidelity's trading, risk management, compliance, and technology and operations capabilities and resources, which are integral parts of the investment management process. The Board also considered Fidelity's investments in business continuity planning, and its success in continuously providing services to the fund notwithstanding the severe disruptions caused by the COVID-19 pandemic. Shareholder and Administrative Services. The Board considered (i) the nature, extent, quality, and cost of advisory, administrative, and shareholder services performed by the Investment Advisers and their affiliates under the Advisory Contracts and under separate agreements covering transfer agency, pricing and bookkeeping, and securities lending services for the fund; (ii) the nature and extent of the supervision of third party service providers, principally custodians, subcustodians, and pricing vendors; and (iii) the resources devoted to, and the record of compliance with, the fund's compliance policies and procedures. The Board also reviewed the allocation of fund brokerage, including allocations to brokers affiliated with the Investment Advisers, the use of brokerage commissions to pay fund expenses, and the use of "soft" commission dollars to pay for research services.The Board noted that the growth of fund assets over time across the complex allows Fidelity to reinvest in the development of services designed to enhance the value and convenience of the Fidelity funds as investment vehicles. These services include 24-hour access to account information and market information over the Internet and through telephone representatives, investor education materials and asset allocation tools, and the expanded availability of Fidelity Investor Centers.The Board noted that, in the past, it and the boards of certain other Fidelity funds had formed an ad hoc Committee on Transfer Agency Fees to review the variety of transfer agency fee structures throughout the industry and Fidelity's competitive positioning with respect to industry participants. Investment in a Large Fund Family. The Board considered the benefits to shareholders of investing in a Fidelity fund, including the benefits of investing in a fund that is part of a large family of funds offering a variety of investment disciplines and providing a large variety of mutual fund investor services. The Board noted that Fidelity had taken, or had made recommendations that resulted in the Fidelity funds taking, a number of actions over the previous year that benefited particular funds, including: (i) continuing to dedicate additional resources to Fidelity's investment research process, which includes meetings with management of issuers of securities in which the funds invest, and to the support of the senior management team that oversees asset management; (ii) continuing efforts to enhance Fidelity's global research capabilities; (iii) launching new funds and ETFs with innovative structures, strategies and pricing and making other enhancements to meet client needs; (iv) launching new share classes of existing funds; (v) eliminating purchase minimums and broadening eligibility requirements for certain funds and share classes; (vi) approving the reduction in the holding period for the Class C to Class A conversion policy; (vii) reducing management fees and total expenses for certain target date funds and classes and index funds; (viii) lowering expenses for certain existing funds and classes by implementing or lowering expense caps; (ix) rationalizing product lines and gaining increased efficiencies from fund mergers, liquidations, and share class consolidations; (x) continuing to develop, acquire and implement systems and technology to improve services to the funds and shareholders, strengthen information security, and increase efficiency; and (xi) continuing to implement enhancements to further strengthen Fidelity's product line to increase investors' probability of success in achieving their investment goals, including retirement income goals. Investment Performance. The Board considered whether the fund has operated in accordance with its investment objective, as well as its record of compliance with its investment restrictions and its performance history.The Board took into account discussions that occur at Board meetings throughout the year with representatives of the Investment Advisers about fund investment performance. In this regard the Board noted that as part of regularly scheduled fund reviews and other reports to the Board on fund performance, the Board considers annualized return information for the fund for different time periods, measured against an appropriate securities market index (benchmark index). In its evaluation of fund investment performance, the Board gave particular attention to information indicating changes in performance of certain Fidelity funds for specific time periods and discussed with the Investment Advisers the reasons for any overperformance or underperformance.In addition to reviewing absolute and relative fund performance, the Independent Trustees periodically consider the appropriateness of fund performance metrics in evaluating the results achieved. In general, the Independent Trustees believe that fund performance should be evaluated based on net performance (after fees and expenses) of both the highest performing and lowest performing fund share classes, where applicable, compared to appropriate benchmark indices, over appropriate time periods that may include full market cycles, taking into account relevant factors including the following: general market conditions; issuer-specific information; and fund cash flows and other factors.The Independent Trustees recognize that shareholders evaluate performance on a net basis over their own holding periods, for which one-, three-, and five-year periods are often used as a proxy. For this reason, the performance information reviewed by the Board also included net cumulative total return information for the fund and an appropriate benchmark index for the most recent one-, three-, and five-year periods ended September 30, 2020, as shown below.Fidelity Advisor Real Estate Fund

Fidelity Advisor Real Estate Fund

Liquidity Risk Management Program
The Securities and Exchange Commission adopted Rule 22e-4 under the Investment Company Act of 1940 (the Liquidity Rule) to promote effective liquidity risk management throughout the open-end investment company industry, thereby reducing the risk that funds will be unable to meet their redemption obligations and mitigating dilution of the interests of fund shareholders.
The Fund has adopted and implemented a liquidity risk management program pursuant to the Liquidity Rule (the Program) effective December 1, 2018. The Program is reasonably designed to assess and manage the Fund’s liquidity risk and to comply with the requirements of the Liquidity Rule. The Fund’s Board of Trustees (the Board) has designated the Fund’s investment adviser as administrator of the Program. The Fidelity advisers have established a Liquidity Risk Management Committee (the LRM Committee) to manage the Program for each of the Fidelity Funds. The LRM Committee monitors the adequacy and effectiveness of implementation of the Program and on a periodic basis assesses each Fund’s liquidity risk based on a variety of factors including (1) the Fund’s investment strategy, (2) portfolio liquidity and cash flow projections during normal and reasonably foreseeable stressed conditions, (3) shareholder redemptions, (4) borrowings and other funding sources and (5) in the case of exchange-traded funds, certain additional factors including the effect of the Fund’s prices and spreads, market participants, and basket compositions on the overall liquidity of the Fund’s portfolio, as applicable.
In accordance with the Program, each of the Fund’s portfolio investments is classified into one of four liquidity categories described below based on a determination of a reasonable expectation for how long it would take to convert the investment to cash (or sell or dispose of the investment) without significantly changing its market value.
- Highly liquid investments – cash or convertible to cash within three business days or less
- Moderately liquid investments – convertible to cash in three to seven calendar days
- Less liquid investments – can be sold or disposed of, but not settled, within seven calendar days
- Illiquid investments – cannot be sold or disposed of within seven calendar days
Liquidity classification determinations take into account a variety of factors including various market, trading and investment-specific considerations, as well as market depth, and generally utilize analysis from a third-party liquidity metrics service.
The Liquidity Rule places a 15% limit on a fund’s illiquid investments and requires funds that do not primarily hold assets that are highly liquid investments to determine and maintain a minimum percentage of the fund’s net assets to be invested in highly liquid investments (highly liquid investment minimum or HLIM). The Program includes provisions reasonably designed to comply with the 15% limit on illiquid investments and for determining, periodically reviewing and complying with the HLIM requirement as applicable.
At a recent meeting of the Fund’s Board of Trustees, the LRM Committee provided a written report to the Board pertaining to the operation, adequacy, and effectiveness of implementation of the Program for the annual period from December 1, 2019 through November 30, 2020. The report concluded that the Program has been implemented and is operating effectively and is reasonably designed to assess and manage the Fund’s liquidity risk.
![]()
ARE-ANN-0921
1.789690.118
Item 2.
Code of Ethics
As of the end of the period, July 31, 2021, Fidelity Advisor Series VII (the trust) has adopted a code of ethics, as defined in Item 2 of Form N-CSR, that applies to its President and Treasurer and its Chief Financial Officer. A copy of the code of ethics is filed as an exhibit to this Form N-CSR.
Item 3.
Audit Committee Financial Expert
The Board of Trustees of the trust has determined that Donald F. Donahue is an audit committee financial expert, as defined in Item 3 of Form N-CSR. Mr. Donahue is independent for purposes of Item 3 of Form N-CSR.
Item 4.
Principal Accountant Fees and Services
Fees and Services
The following table presents fees billed by Deloitte & Touche LLP, the member firms of Deloitte Touche Tohmatsu, and their respective affiliates (collectively, “Deloitte Entities”) in each of the last two fiscal years for services rendered to Fidelity Advisor Biotechnology Fund, Fidelity Advisor Consumer Discretionary Fund, Fidelity Advisor Energy Fund, Fidelity Advisor Financial Services Fund, Fidelity Advisor Global Real Estate Fund, Fidelity Advisor Health Care Fund, Fidelity Advisor Industrials Fund, Fidelity Advisor Real Estate Fund, Fidelity Advisor Semiconductors Fund, Fidelity Advisor Technology Fund and Fidelity Advisor Utilities Fund (the “Funds”):
Services Billed by Deloitte Entities
July 31, 2021 FeesA
| | Audit Fees | Audit-Related Fees | Tax Fees | All Other Fees |
| Fidelity Advisor Biotechnology Fund | $50,500 | $- | $6,700 | $1,200 |
| Fidelity Advisor Consumer Discretionary Fund | $33,200 | $- | $10,400 | $900 |
| Fidelity Advisor Energy Fund | $35,500 | $- | $11,500 | $900 |
| Fidelity Advisor Financial Services Fund | $35,400 | $- | $11,300 | $900 |
| Fidelity Advisor Global Real Estate Fund | $42,500 | $- | $8,300 | $1,100 |
| Fidelity Advisor Health Care Fund | $35,400 | $- | $10,600 | $900 |
| Fidelity Advisor Industrials Fund | $34,200 | $- | $10,400 | $900 |
| Fidelity Advisor Real Estate Fund | $37,200 | $- | $8,100 | $1,000 |
| Fidelity Advisor Semiconductors Fund | $33,200 | $- | $6,700 | $800 |
| Fidelity Advisor Technology Fund | $36,600 | $- | $10,600 | $900 |
| Fidelity Advisor Utilities Fund | $33,200 | $- | $10,600 | $900 |
| | | | | |
July 31, 2020 FeesA
| | Audit Fees | Audit-Related Fees | Tax Fees | All Other Fees |
| Fidelity Advisor Biotechnology Fund | $51,600 | $- | $6,900 | $1,100 |
| Fidelity Advisor Consumer Discretionary Fund | $34,300 | $- | $8,700 | $800 |
| Fidelity Advisor Energy Fund | $36,200 | $- | $9,900 | $800 |
| Fidelity Advisor Financial Services Fund | $36,100 | $- | $9,200 | $800 |
| Fidelity Advisor Global Real Estate Fund | $43,500 | $- | $8,700 | $900 |
| Fidelity Advisor Health Care Fund | $36,000 | $- | $8,800 | $800 |
| Fidelity Advisor Industrials Fund | $35,100 | $- | $8,300 | $800 |
| Fidelity Advisor Real Estate Fund | $38,100 | $- | $8,300 | $800 |
| Fidelity Advisor Semiconductors Fund | $34,000 | $- | $6,900 | $700 |
| Fidelity Advisor Technology Fund | $37,400 | $- | $8,500 | $800 |
| Fidelity Advisor Utilities Fund | $33,900 | $- | $8,700 | $800 |
A Amounts may reflect rounding.
The following table(s) present(s) fees billed by Deloitte Entities that were required to be approved by the Audit Committee for services that relate directly to the operations and financial reporting of the Fund(s) and that are rendered on behalf of Fidelity Management & Research Company LLC ("FMR") and entities controlling, controlled by, or under
common control with FMR (not including any sub-adviser whose role is primarily portfolio management and is subcontracted with or overseen by another investment adviser) that provide ongoing services to the Fund(s) (“Fund Service Providers”):
Services Billed by Deloitte Entities
| | July 31, 2021A | July 31, 2020A |
| Audit-Related Fees | $- | $- |
| Tax Fees | $- | $3,000 |
| All Other Fees | $- | $- |
A Amounts may reflect rounding.
“Audit-Related Fees” represent fees billed for assurance and related services that are reasonably related to the performance of the fund audit or the review of the fund's financial statements and that are not reported under Audit Fees.
“Tax Fees” represent fees billed for tax compliance, tax advice or tax planning that relate directly to the operations and financial reporting of the fund.
“All Other Fees” represent fees billed for services provided to the fund or Fund Service Provider, a significant portion of which are assurance related, that relate directly to the operations and financial reporting of the fund, excluding those services that are reported under Audit Fees, Audit-Related Fees or Tax Fees.
Assurance services must be performed by an independent public accountant.
* * *
The aggregate non-audit fees billed by Deloitte Entities for services rendered to the Fund(s), FMR (not including any sub-adviser whose role is primarily portfolio management and is subcontracted with or overseen by another investment adviser), and any Fund Service Provider for each of the last two fiscal years of the Fund(s) are as follows:
| Billed By | July 31, 2021A | July 31, 2020A |
| Deloitte Entities | $638,300 | $614,300 |
A Amounts may reflect rounding.
The trust's Audit Committee has considered non-audit services that were not pre-approved that were provided by Deloitte Entities to Fund Service Providers to be compatible with maintaining the independence of Deloitte Entities in its(their) audit of the Fund(s), taking into account representations from Deloitte Entities, in accordance with Public Company Accounting Oversight Board rules, regarding its independence
from the Fund(s) and its(their) related entities and FMR’s review of the appropriateness and permissibility under applicable law of such non-audit services prior to their provision to the Fund(s) Service Providers.
Audit Committee Pre-Approval Policies and Procedures
The trust’s Audit Committee must pre-approve all audit and non-audit services provided by a fund’s independent registered public accounting firm relating to the operations or financial reporting of the fund. Prior to the commencement of any audit or non-audit services to a fund, the Audit Committee reviews the services to determine whether they are appropriate and permissible under applicable law.
The Audit Committee has adopted policies and procedures to, among other purposes, provide a framework for the Committee’s consideration of non-audit services by the audit firms that audit the Fidelity funds. The policies and procedures require that any non-audit service provided by a fund audit firm to a Fidelity fund and any non-audit service provided by a fund auditor to a Fund Service Provider that relates directly to the operations and financial reporting of a Fidelity fund (“Covered Service”) are subject to approval by the Audit Committee before such service is provided.
All Covered Services must be approved in advance of provision of the service either: (i) by formal resolution of the Audit Committee, or (ii) by oral or written approval of the service by the Chair of the Audit Committee (or if the Chair is unavailable, such other member of the Audit Committee as may be designated by the Chair to act in the Chair’s absence). The approval contemplated by (ii) above is permitted where the Treasurer determines that action on such an engagement is necessary before the next meeting of the Audit Committee.
Non-audit services provided by a fund audit firm to a Fund Service Provider that do not relate directly to the operations and financial reporting of a Fidelity fund are reported to the Audit Committee periodically.
Non-Audit Services Approved Pursuant to Rule 2-01(c)(7)(i)(C) and (ii) of Regulation S-X (“De Minimis Exception”)
There were no non-audit services approved or required to be approved by the Audit Committee pursuant to the De Minimis Exception during the Fund’s(s’) last two fiscal years relating to services provided to (i) the Fund(s) or (ii) any Fund Service Provider that relate directly to the operations and financial reporting of the Fund(s).
Item 5.
Audit Committee of Listed Registrants
Not applicable.
Item 6.
Investments
(a)
Not applicable.
(b)
Not applicable.
Item 7.
Disclosure of Proxy Voting Policies and Procedures for Closed-End Management Investment Companies
Not applicable.
Item 8.
Portfolio Managers of Closed-End Management Investment Companies
Not applicable.
Item 9.
Purchase of Equity Securities by Closed-End Management Investment Company and Affiliated Purchasers
Not applicable.
Item 10.
Submission of Matters to a Vote of Security Holders
There were no material changes to the procedures by which shareholders may recommend nominees to the trust’s Board of Trustees.
Item 11.
Controls and Procedures
(a)(i) The President and Treasurer and the Chief Financial Officer have concluded that the trust’s disclosure controls and procedures (as defined in Rule 30a-3(c) under the Investment Company Act) provide reasonable assurances that material information relating to the trust is made known to them by the appropriate persons, based on their evaluation of these controls and procedures as of a date within 90 days of the filing date of this report.
(a)(ii) There was no change in the trust’s internal control over financial reporting (as defined in Rule 30a-3(d) under the Investment Company Act) that occurred during the period covered by this report that has materially affected, or is reasonably likely to materially affect, the trust’s internal control over financial reporting.
Item 12.
Disclosure of Securities Lending Activities for Closed-End Management
Investment Companies
Not applicable.
Item 13.
Exhibits
| (a) | (1) | Code of Ethics pursuant to Item 2 of Form N-CSR is filed and attached hereto as EX-99.CODE ETH. |
| (a) | (2) | |
| (a) | (3) | Not applicable. |
| (b) | |
SIGNATURES
Pursuant to the requirements of the Securities Exchange Act of 1934 and the Investment Company Act of 1940, the registrant has duly caused this report to be signed on its behalf by the undersigned, thereunto duly authorized.
Fidelity Advisor Series VII
| By: | /s/Stacie M. Smith |
| | Stacie M. Smith |
| | President and Treasurer |
| | |
| Date: | September 21, 2021 |
Pursuant to the requirements of the Securities Exchange Act of 1934 and the Investment Company Act of 1940, this report has been signed below by the following persons on behalf of the registrant and in the capacities and on the dates indicated.
| By: | /s/Stacie M. Smith |
| | Stacie M. Smith |
| | President and Treasurer |
| | |
| Date: | September 21, 2021 |
| By: | /s/John J. Burke III |
| | John J. Burke III |
| | Chief Financial Officer |
| | |
| Date: | September 21, 2021 |
Exhibit EX-99.CERT
I, Stacie M. Smith, certify that:
1.
I have reviewed this report on Form N-CSR of Fidelity Advisor Series VII;
2.
Based on my knowledge, this report does not contain any untrue statement of a material fact or omit to state a material fact necessary to make the statements made, in light of the circumstances under which such statements were made, not misleading with respect to the period covered by this report;
3.
Based on my knowledge, the financial statements, and other financial information included in this report, fairly present in all material respects the financial condition, results of operations, changes in net assets, and cash flows (if the financial statements are required to include a statement of cash flows) of the registrant as of, and for, the periods presented in this report;
4.
The registrant's other certifying officer(s) and I are responsible for establishing and maintaining disclosure controls and procedures (as defined in Rule 30a-3(c) under the Investment Company Act of 1940) and internal control over financial reporting (as defined in Rule 30a-3(d) under the Investment Company Act of 1940) for the registrant and have:
a.
Designed such disclosure controls and procedures, or caused such disclosure controls and procedures to be designed under our supervision, to ensure that material information relating to the registrant, including its consolidated subsidiaries, is made known to us by others within those entities, particularly during the period in which this report is being prepared;
b.
Designed such internal control over financial reporting, or caused such internal control over financial reporting to be designed under our supervision, to provide reasonable assurance regarding the reliability of financial reporting and the preparation of financial statements for external purposes in accordance with generally accepted accounting principles;
c.
Evaluated the effectiveness of the registrant's disclosure controls and procedures and presented in this report our conclusions about the effectiveness of the disclosure controls and procedures, as of a date within 90 days prior to the filing date of this report based upon such evaluation; and
d.
Disclosed in this report any change in the registrant’s internal control over financial reporting that occurred during the period covered by this report that has materially affected, or is reasonably likely to materially affect, the registrant’s internal control over financial reporting; and
5.
The registrant's other certifying officer(s) and I have disclosed to the registrant's auditors and the audit committee of the registrant's board of directors (or persons performing the equivalent functions):
a.
All significant deficiencies and material weaknesses in the design or operation of internal control over financial reporting which are reasonably likely to adversely affect the registrant's ability to record, process, summarize, and report financial information; and
b.
Any fraud, whether or not material, that involves management or other employees who have a significant role in the registrant's internal control over financial reporting.
Date:
September 21, 2021
/s/Stacie M. Smith |
Stacie M. Smith |
President and Treasurer |
I, John J. Burke III, certify that:
1.
I have reviewed this report on Form N-CSR of Fidelity Advisor Series VII;
2.
Based on my knowledge, this report does not contain any untrue statement of a material fact or omit to state a material fact necessary to make the statements made, in light of the circumstances under which such statements were made, not misleading with respect to the period covered by this report;
3.
Based on my knowledge, the financial statements, and other financial information included in this report, fairly present in all material respects the financial condition, results of operations, changes in net assets, and cash flows (if the financial statements are required to include a statement of cash flows) of the registrant as of, and for, the periods presented in this report;
4.
The registrant's other certifying officer(s) and I are responsible for establishing and maintaining disclosure controls and procedures (as defined in Rule 30a-3(c) under the Investment Company Act of 1940) and internal control over financial reporting (as defined in Rule 30a-3(d) under the Investment Company Act of 1940) for the registrant and have:
a.
Designed such disclosure controls and procedures, or caused such disclosure controls and procedures to be designed under our supervision, to ensure that material information relating to the registrant, including its consolidated subsidiaries, is made known to us by others within those entities, particularly during the period in which this report is being prepared;
b.
Designed such internal control over financial reporting, or caused such internal control over financial reporting to be designed under our supervision, to provide reasonable assurance regarding the reliability of financial reporting and the preparation of financial statements for external purposes in accordance with generally accepted accounting principles;
c.
Evaluated the effectiveness of the registrant's disclosure controls and procedures and presented in this report our conclusions about the effectiveness of the disclosure controls and procedures, as of a date within 90 days prior to the filing date of this report based upon such evaluation; and
d.
Disclosed in this report any change in the registrant’s internal control over financial reporting that occurred during the period covered by this report that has materially affected, or is reasonably likely to materially affect, the registrant’s internal control over financial reporting; and
5.
The registrant's other certifying officer(s) and I have disclosed to the registrant's auditors and the audit committee of the registrant's board of directors (or persons performing the equivalent functions):
a.
All significant deficiencies and material weaknesses in the design or operation of internal control over financial reporting which are reasonably likely to adversely affect the registrant's ability to record, process, summarize, and report financial information; and
b.
Any fraud, whether or not material, that involves management or other employees who have a significant role in the registrant's internal control over financial reporting.
Date:
September 21, 2021
/s/John J. Burke III |
John J. Burke III |
Chief Financial Officer |
Exhibit EX-99.906CERT
Certification Pursuant to Section 906 of the Sarbanes-Oxley Act of 2002 (subsections (a) and (b) of section 1350, chapter 63 of title 18, United States Code)
In connection with the attached Report of Fidelity Advisor Series VII (the “Trust”) on Form N-CSR to be filed with the Securities and Exchange Commission (the “Report”), each of the undersigned officers of the Trust does hereby certify that, to the best of such officer’s knowledge:
1.
The Report fully complies with the requirements of 13(a) or 15(d) of the Securities Exchange Act of 1934; and
2.
The information contained in the Report fairly presents, in all material respects, the financial condition and results of operations of the Trust as of, and for, the periods presented in the Report.
Dated: September 21, 2021
/s/Stacie M. Smith |
Stacie M. Smith |
President and Treasurer |
Dated: September 21, 2021
/s/John J. Burke III |
John J. Burke III |
Chief Financial Officer |
A signed original of this written statement required by Section 906, or other document authenticating, acknowledging, or otherwise adopting the signature that appears in typed form within the electronic version of this written statement required by Section 906, has been provided to the Trust and will be retained by the Trust and furnished to the Securities and Exchange Commission or its staff upon request.
EXHIBIT EX-99.CODE ETH
FIDELITY FUNDS’ CODE OF ETHICS FOR
PRESIDENT, TREASURER AND PRINCIPAL ACCOUNTING OFFICER
I. Purposes of the Code/Covered Officers
This document constitutes the Code of Ethics (Code) adopted by the Fidelity Funds (Funds) pursuant to the provisions of Rule 30b2-1(a) under the Investment Company Act of 1940), which Rule implements Sections 406 of the Sarbanes-Oxley Act of 2002 with respect to registered investment companies. The Code applies to the Fidelity Funds’ President and Treasurer, and Chief Financial Officer (Covered Officers). Fidelity’s Ethics Office, a part of Corporate Compliance Group within Core Compliance, administers the Code.
The purposes of the Code are to deter wrongdoing and to promote, on the part of the Covered Officers:
·
honest and ethical conduct, including the ethical handling of actual or apparent conflicts of interest between personal and professional relationships;
·
full, fair, accurate, timely and understandable disclosure in reports and documents that the Fidelity Funds submit to the Securities and Exchange Commission (SEC), and in other public communications by a Fidelity Fund;
·
compliance with applicable laws and governmental rules and regulations;
·
the prompt internal reporting to an appropriate person or persons identified in the Code of violations of the Code; and
·
accountability for adherence to the Code.
Each Covered Officer should adhere to a high standard of business ethics and should be sensitive to situations that may give rise to actual as well as apparent conflicts of interest.
II.
Covered Officers Should Handle Ethically
Actual and Apparent Conflicts of Interest
Overview. A “conflict of interest” occurs when a Covered Officer’s private interest interferes with the interests of, or his service to, the Fidelity Funds. For example, a conflict of interest would arise if a Covered Officer, or a member of his family, receives improper personal benefits as a result of his position with the Fidelity Funds.
Certain conflicts of interest arise out of the relationships between Covered Officers and the Fidelity Funds and already are subject to conflict of interest provisions in the Investment Company Act of 1940 (Investment Company Act) and the Investment Advisers Act of 1940 (Investment Advisers Act). For example, Covered Officers may not individually engage in certain transactions (such as the purchase or sale of securities or other property) with a Fidelity Fund because of their status as “affiliated persons” of the Fund. Separate compliance programs and procedures of the Fidelity Funds, Fidelity Management & Research Company (FMR) and the other Fidelity companies are designed to prevent, or identify and correct, violations of these provisions. This Code does not, and is not intended to, repeat or replace these programs and procedures, and such conflicts fall outside of the parameters of this Code.
Although typically not presenting an opportunity for improper personal benefit, conflicts arise from, or as a result of, the contractual relationship between the Fidelity Funds and FMR (or another Fidelity company) of which the Covered Officers are also officers or employees. As a result, this Code recognizes that the Covered Officers will, in the normal course of their duties (whether formally for the Fidelity Funds, FMR or another Fidelity company), be involved in establishing policies and implementing decisions that have different effects on the Fidelity Funds, FMR and other Fidelity companies. The participation of the Covered Officers in such activities is inherent in the contractual relationship between the Fidelity Funds and FMR (or another Fidelity company), and is consistent with the performance by the Covered Officers of their duties as officers of the Fidelity Funds. Thus, if performed in conformity with the provisions of the Investment Company Act and the Investment Advisers Act, such activities will be deemed to have been handled ethically. In addition, it is recognized by the Funds’ Board of Trustees (Board) that the Covered Officers also may be officers or employees of one or more other Fidelity Funds covered by this Code.
Other conflicts of interest are covered by the Code, even if such conflicts of interest are not subject to provisions in the Investment Company Act and the Investment Advisers Act. The following list provides examples of conflicts of interest under the Code, but Covered Officers should keep in mind that these examples are not exhaustive. The overarching principle is that the personal interest of a Covered Officer should not be placed improperly before the interest of a Fidelity Fund.
* * *
Each Covered Officer must:
·
not use his or her personal influence or personal relationships improperly to influence investment decisions or financial reporting by any Fidelity Fund whereby the Covered Officer would benefit personally to the detriment of any Fidelity Fund;
·
not cause a Fidelity Fund to take action, or fail to take action, for the individual personal benefit of the Covered Officer rather than the benefit of the Fidelity Fund;
·
not engage in any outside business activity, including serving as a director or trustee, that prevents the Covered Officer from devoting appropriate time and attention to the Covered Officer’s responsibilities with the Fidelity Funds;
·
not have a consulting or employment relationship with any of the Fidelity Funds’ service providers that are not affiliated with Fidelity; and
·
not retaliate against any employee or Covered Officer for reports of actual or potential misconduct, which are made in good faith.
With respect to other fact patterns, if a Covered Officer is in doubt, other potential conflict of interest situations should be described immediately to the Fidelity Ethics Office for resolution. Similarly, any questions a Covered Officer has generally regarding the application or interpretation of the Code should be directed to the Fidelity Ethics Office immediately.
III. Disclosure and Compliance
·
Each Covered Officer should familiarize himself with the disclosure requirements generally applicable to the Fidelity Funds.
·
Each Covered Officer should not knowingly misrepresent, or cause others to misrepresent, facts about any Fidelity Fund to others, whether within or outside Fidelity, including to the Board and auditors, and to governmental regulators and self-regulatory organizations;
·
Each Covered Officer should, to the extent appropriate within his area of responsibility, consult with other officers and employees of the Fidelity Funds, FMR and the Fidelity service providers, and with the Board’s Compliance Committee, with the goal of promoting full, fair, accurate, timely and understandable disclosure in the reports and documents the Fidelity Funds file with, or submit to, the SEC and in other public communications made by the Fidelity Funds; and
·
It is the responsibility of each Covered Officer to promote compliance with the standards and restrictions imposed by applicable laws, rules and regulations.
IV. Reporting and Accountability
Each Covered Officer must:
·
upon receipt of the Code, and annually thereafter, submit to the Fidelity Ethics Office an acknowledgement stating that he or she has received, read, and understands the Code; and
·
notify the Fidelity Ethics Office promptly if he or she knows of any violation of the Code. Failure to do so is itself a violation of this Code.
The Fidelity Ethics Office shall take all action it considers appropriate to investigate any actual or potential violations reported to it. Upon completion of the investigation, if necessary, the matter will be reviewed with senior management or other appropriate parties, and a determination will be made as to whether any action should be taken as detailed below. The Covered Officer will be informed of any action determined to be appropriate. The Fidelity Ethics Office will inform the Personal Trading Committee of all Code violations and actions taken in response. Without implied limitation, appropriate remedial, disciplinary or preventive action may include a written warning, a letter of censure, suspension, dismissal or, in the event of criminal or other serious violations of law, notification of the SEC or other appropriate law enforcement authorities. Additionally, other legal remedies may be pursued.
The policies and procedures described in the Code do not create any obligations to any person or entity other than the Fidelity Funds. The Code is intended solely for the internal use by the Fidelity Funds and does not constitute a promise, contract or an admission by or on behalf of any Fidelity Fund as to any fact, circumstance, or legal conclusion. The Fidelity Funds, the Fidelity companies and the Fidelity Chief Ethics Officer retain the discretion to decide whether the Code applies to a specific situation, and how it should be interpreted.
V. Oversight
Material violations of this Code will be reported promptly by FMR to the Board’s Compliance Committee. In addition, at least once each year, FMR will provide a written report to the Board, which describes any issues arising under the Code since the last report to the Board, including, but not limited to, information about material violations of the Code and action taken in response to the material violations.
VI. Other Policies and Procedures
This Code shall be the sole code of ethics adopted by the Fidelity Funds for purposes of Section 406 of the Sarbanes-Oxley Act and the rules and forms applicable to registered investment companies thereunder. Other Fidelity policies or procedures that cover the behavior or activities of Covered Officers are separate requirements applying to the Covered Officers (and others), and are not part of this Code.
VII. Amendments
Any material amendments or changes to this Code must be approved or ratified by a majority vote of the Board, including a majority of the Trustees who are not interested persons of the Fidelity Funds.
VIII. Records and Confidentiality
Records of any violation of the Code and of the actions taken as a result of such violations will be kept by the Fidelity Ethics Office. All reports and records prepared or maintained pursuant to this Code will be considered confidential and shall be maintained and protected accordingly. Except as otherwise required by law or this Code, such matters shall not be disclosed to anyone other than the Fidelity Ethics Office, the Personal Trading Committee, the Board, appropriate personnel at the relevant Fidelity company or companies and the legal counsel of any or all of the foregoing.
Serious News for Serious Traders! Try StreetInsider.com Premium Free!
You May Also Be Interested In
- Sparta Updates Delay in Filing Annual Financial Statements
- Vistin Pharma ASA: Annual Report 2023
- Bombardier Unveils Bold New Brand Identity Worldwide as Company Soars Toward an Ambitious Future
Create E-mail Alert Related Categories
SEC FilingsSign up for StreetInsider Free!
Receive full access to all new and archived articles, unlimited portfolio tracking, e-mail alerts, custom newswires and RSS feeds - and more!
