

Form N-CSR FAIRHOLME FUNDS INC For: Nov 30
 Tweet
Tweet Share
ShareUNITED STATES
SECURITIES AND EXCHANGE COMMISSION
Washington, D.C. 20549
FORM N-CSR
CERTIFIED SHAREHOLDER REPORT OF REGISTERED MANAGEMENT
INVESTMENT COMPANIES
Investment Company Act file number 811-09607
Fairholme Funds, Inc.
(Exact name of registrant as specified in charter)
2601 NE 2nd Avenue
Miami, FL 33137
(Address of principal executive offices) (Zip code)
Bruce R. Berkowitz
2601 NE 2nd Avenue
Miami, FL 33137
(Name and address of agent for service)
Registrant’s telephone number, including area code: 1-866-202-2263
Date of fiscal year end: November 30
Date of reporting period: November 30, 2019
Form N-CSR is to be used by management investment companies to file reports with the Commission not later than 10 days after the transmission to stockholders of any report that is required to be transmitted to stockholders under Rule 30e-1 under the Investment Company Act of 1940 (17 CFR 270.30e-1). The Commission may use the information provided on Form N-CSR in its regulatory, disclosure review, inspection, and policymaking roles.
A registrant is required to disclose the information specified by Form N-CSR, and the Commission will make this information public. A registrant is not required to respond to the collection of information contained in Form N-CSR unless the Form displays a currently valid Office of Management and Budget (“OMB”) control number. Please direct comments concerning the accuracy of the information collection burden estimate and any suggestions for reducing the burden to Secretary, Securities and Exchange Commission, 450 Fifth Street, NW, Washington, DC 20549-0609. The OMB has reviewed this collection of information under the clearance requirements of 44 U.S.C. § 3507.
Item 1. Reports to Stockholders.
The Reports to Shareholders of each Fund are attached herewith.

FAIRHOLME FUNDS, INC.
The Fairholme Fund (FAIRX)
Seeking long-term growth of capital
The Fairholme Focused Income Fund (FOCIX)
Seeking current income
The Fairholme Allocation Fund (FAAFX)
Seeking long-term total return
Annual Report
November 30, 2019
Managed by Fairholme Capital Management
(866) 202-2263 • fairholmefunds.com
FAIRHOLME FUNDS, INC.
November 30, 2019
| Page | ||||
| MANAGEMENT DISCUSSION & ANALYSIS FUND PERFORMANCE: |
||||
| 3 | ||||
| 4 | ||||
| 5 | ||||
| 6 | ||||
| 11 | ||||
| THE FAIRHOLME FUND: |
||||
| 12 | ||||
| 15 | ||||
| 16 | ||||
| 17 | ||||
| 18 | ||||
| THE FAIRHOLME FOCUSED INCOME FUND: |
||||
| 19 | ||||
| 22 | ||||
| 23 | ||||
| 24 | ||||
| 25 | ||||
| THE FAIRHOLME ALLOCATION FUND: |
||||
| 26 | ||||
| 28 | ||||
| 29 | ||||
| 30 | ||||
| 31 | ||||
| 32 | ||||
| 42 | ||||
| 43 | ||||
2
FAIRHOLME FUNDS, INC.
FUND PERFORMANCE (unaudited)
November 30, 2009 — November 30, 2019
THE FAIRHOLME FUND VS. THE S&P 500 INDEX
INITIAL INVESTMENT OF $10,000
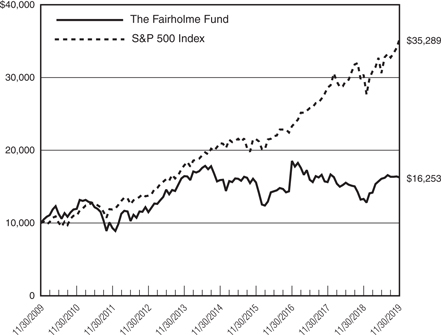
The Fairholme Fund (“The Fairholme Fund”) commenced operations on December 29, 1999. The chart above presents the performance of a $10,000 investment for up to ten years to the latest annual period ending November 30, 2019.
The following notes pertain to the chart above as well as to the performance table included in the Management Discussion & Analysis Report. Performance information in this report represents past performance and is not a guarantee of future results. The investment return and principal value of an investment in The Fairholme Fund will fluctuate, so that an investor’s shares when redeemed may be worth more or less than their original cost. Current performance may be lower or higher than the performance quoted within. The performance information does not reflect the taxes an investor would pay on distributions from The Fairholme Fund or upon redemption of shares of The Fairholme Fund. Most recent month-end performance and answers to any questions you may have can be obtained by calling Shareholder Services at 1-866-202-2263.
Data for both the S&P 500 Index and The Fairholme Fund are presented assuming all dividends and distributions have been reinvested and do not reflect any taxes that might have been incurred by a shareholder as a result of The Fairholme Fund distributions. The S&P 500 Index is a widely recognized, unmanaged index of 500 of the largest companies in the United States as measured by market capitalization and does not reflect any investment management fees or transaction expenses, nor the effects of taxes, fees or other charges.
3
FAIRHOLME FUNDS, INC.
FUND PERFORMANCE (unaudited)
Inception through November 30, 2019
THE INCOME FUND VS.
The BLOOMBERG BARCLAYS U.S. AGGREGATE BOND INDEX
INITIAL INVESTMENT OF $10,000
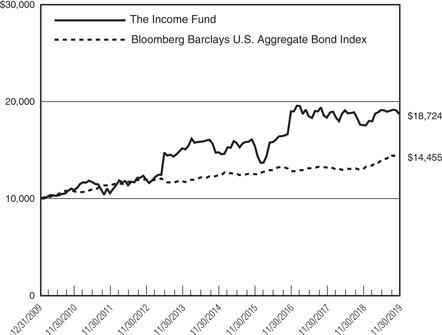
The Fairholme Focused Income Fund (“The Income Fund”) commenced operations on December 31, 2009. The chart above presents the performance of a $10,000 investment from inception to the latest annual period ending November 30, 2019.
The following notes pertain to the chart above as well as to the performance table included in the Management Discussion & Analysis Report. Performance information in this report represents past performance and is not a guarantee of future results. The investment return and principal value of an investment in The Income Fund will fluctuate, so that an investor’s shares when redeemed may be worth more or less than their original cost. Current performance may be lower or higher than the performance quoted within. The performance information does not reflect the taxes an investor would pay on distributions from The Income Fund or upon redemption of shares of The Income Fund. Most recent month-end performance and answers to any questions you may have can be obtained by calling Shareholder Services at 1-866-202-2263.
Data for both the Bloomberg Barclays U.S. Aggregate Bond Index and The Income Fund are presented assuming all dividends and distributions have been reinvested and do not reflect any taxes that might have been incurred by a shareholder as a result of The Income Fund distributions. The Bloomberg Barclays U.S. Aggregate Bond Index is a broad-based flagship benchmark that measures the investment grade, U.S. dollar-denominated, fixed-rate taxable bond market, and includes Treasuries, government-related and corporate securities, mortgage-backed securities (agency fixed-rate and hybrid adjustable-rate mortgage pass-throughs), asset-backed securities and commercial mortgage-backed securities (agency and non-agency). The Bloomberg Barclays U.S. Aggregate Bond Index does not reflect any investment management fees or transaction expenses, nor the effects of taxes, fees, or other charges.
4
FAIRHOLME FUNDS, INC.
FUND PERFORMANCE (unaudited)
Inception through November 30, 2019
THE ALLOCATION FUND VS. The BLOOMBERG BARCLAYS U.S.
AGGREGATE BOND INDEX AND THE S&P 500 INDEX
INITIAL INVESTMENT OF $10,000
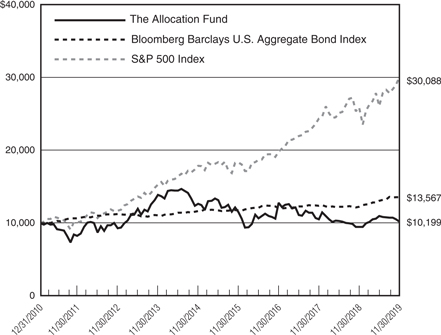
The Fairholme Allocation Fund (“The Allocation Fund”) commenced operations on December 31, 2010. The chart above presents the performance of a $10,000 investment from inception to the latest annual period ending November 30, 2019.
The following notes pertain to the chart above as well as to the performance table included in the Management Discussion & Analysis Report. Performance information in this report represents past performance and is not a guarantee of future results. The investment return and principal value of an investment in The Allocation Fund will fluctuate, so that an investor’s shares when redeemed may be worth more or less than their original cost. Current performance may be lower or higher than the performance quoted within. The performance information does not reflect the taxes an investor would pay on distributions from The Allocation Fund or upon redemption of shares of The Allocation Fund. Most recent month-end performance and answers to any questions you may have can be obtained by calling Shareholder Services at 1-866-202-2263.
Data for the Bloomberg Barclays U.S. Aggregate Bond Index, the S&P 500 Index and The Allocation Fund are presented assuming all dividends and distributions have been reinvested and do not reflect any taxes that might have been incurred by a shareholder as a result of The Allocation Fund distributions. The Bloomberg Barclays U.S. Aggregate Bond Index is a broad-based flagship benchmark that measures the investment grade, U.S. dollar-denominated, fixed-rate taxable bond market, and includes Treasuries, government-related and corporate securities, mortgage-backed securities (agency fixed-rate and hybrid adjustable-rate mortgage pass-throughs), asset-backed securities and commercial mortgage-backed securities (agency and non-agency). The S&P 500 Index is a widely recognized, unmanaged index of 500 of the largest companies in the United States as measured by market capitalization. These index returns do not reflect any investment management fees or transaction expenses, nor the effects of taxes, fees or other charges.
5
FAIRHOLME FUNDS, INC.
MANAGEMENT DISCUSSION & ANALYSIS
For the Fiscal Year Ended November 30, 2019
The Fairholme Fund, The Income Fund, and The Allocation Fund (each a “Fund” and collectively, the “Funds”) shares outstanding and unaudited net asset value per share (“NAV”) at November 30, 2019, the end of the Funds’ fiscal year, and NAVs at other pertinent dates, were as follows:
| 11/30/2019 Shares Outstanding |
11/30/2019 NAV (unaudited) |
05/31/2019 NAV (audited) |
11/30/2018 NAV (unaudited) | |||||||||||||||
| The Fairholme Fund |
55,059,022 | $19.19 | $18.97 | $16.05 | ||||||||||||||
| The Income Fund |
17,529,966 | $10.23 | $10.61 | $ 9.88 | ||||||||||||||
| The Allocation Fund |
8,423,476 | $ 7.00 | $ 7.53 | $ 6.58 | ||||||||||||||
At December 31, 2019, the unaudited NAVs of The Fairholme Fund, The Income Fund, and The Allocation Fund were $19.83, $10.28, and $7.20, respectively.
Performance figures below are shown for the Funds’ fiscal year ended November 30, 2019, and do not match calendar year figures for the period ended December 31, 2019, cited in the Portfolio Manager’s report.
| The Fairholme Fund |
Six Months |
One Year |
Five Years |
Ten Years |
Fifteen Years |
Since Inception 12/29/1999 |
||||||||||||||||||||||||||||||||||||||
| Cumulative: |
||||||||||||||||||||||||||||||||||||||||||||
| The Fairholme Fund |
1.16 | % | 22.20 | % | 2.36 | % | 62.52 | % | 135.62 | % | 446.08% | |||||||||||||||||||||||||||||||||
| S&P 500 Index |
15.26 | % | 16.11 | % | 68.34 | % | 252.90 | % | 265.54 | % | 215.97% | |||||||||||||||||||||||||||||||||
| Annualized: |
||||||||||||||||||||||||||||||||||||||||||||
| The Fairholme Fund |
22.20 | % | 0.47 | % | 4.98 | % | 5.88 | % | 8.89% | |||||||||||||||||||||||||||||||||||
| S&P 500 Index |
16.11 | % | 10.98 | % | 13.44 | % | 9.03 | % | 5.94% | |||||||||||||||||||||||||||||||||||
For the six months ended November 30, 2019, The Fairholme Fund was outperformed by the S&P 500 Index (“S&P 500”) by 14.1 percentage points, while over the last year The Fairholme Fund outperformed the S&P 500 by 6.09 percentage points. From inception, The Fairholme Fund outperformed the S&P 500 by 2.95 percentage points per annum, or on a cumulative basis, 230.11 percentage points over nineteen years and eleven months.
| The Income Fund |
Six Months |
One Year |
Five Year |
Since Inception 12/31/2009 |
||||||||||||||||||||||||
| Cumulative: |
||||||||||||||||||||||||||||
| The Income Fund |
-2.22 | % | 6.49 | % | 26.63 | % | 87.24 | % | ||||||||||||||||||||
| Bloomberg Barclays Bond Index |
3.81 | % | 10.79 | % | 16.40 | % | 44.55 | % | ||||||||||||||||||||
| Annualized: |
||||||||||||||||||||||||||||
| The Income Fund |
6.49 | % | 4.83 | % | 6.53 | % | ||||||||||||||||||||||
| Bloomberg Barclays Bond Index |
10.79 | % | 3.08 | % | 3.79 | % | ||||||||||||||||||||||
6
FAIRHOLME FUNDS, INC.
MANAGEMENT DISCUSSION & ANALYSIS (continued)
For the Fiscal Year Ended November 30, 2019
For the six months ended November 30, 2019, The Income Fund was outperformed by the Bloomberg Barclays U.S. Aggregate Bond Index (“Bloomberg Barclays Bond Index”) by 6.03 percentage points, while over the last year The Income Fund was outperformed by the Bloomberg Barclays Bond Index by 4.30 percentage points. From inception, The Income Fund outperformed the Bloomberg Barclays Bond Index by 2.74 percentage points per annum, or on a cumulative basis, 42.69 percentage points over nine years and eleven months.
| The Allocation Fund Performance to 11/30/2019 (Unaudited) |
Six Months |
One Year |
Five Year |
Since Inception 12/31/2010 |
||||||||||||||||||||||||
| Cumulative: |
||||||||||||||||||||||||||||
| The Allocation Fund |
-7.04 | % | 7.61 | % | -19.39 | % | 1.98 | % | ||||||||||||||||||||
| Bloomberg Barclays Bond Index |
3.81 | % | 10.79 | % | 16.40 | % | 35.67 | % | ||||||||||||||||||||
| S&P 500 Index |
15.26 | % | 16.11 | % | 68.34 | % | 200.88 | % | ||||||||||||||||||||
| Annualized: |
||||||||||||||||||||||||||||
| The Allocation Fund |
7.61 | % | -4.22 | % | 0.22 | % | ||||||||||||||||||||||
| Bloomberg Barclays Bond Index |
10.79 | % | 3.08 | % | 3.48 | % | ||||||||||||||||||||||
| S&P 500 Index |
16.11 | % | 10.98 | % | 13.15 | % | ||||||||||||||||||||||
For the six months ended November 30, 2019, The Allocation Fund was outperformed by the Bloomberg Barclays Bond Index and the S&P 500 by 10.85 and 22.30 percentage points, respectively, while over the last year The Allocation Fund was outperformed by the Bloomberg Barclays Bond Index by 3.18 percentage points and outperformed the S&P 500 by 8.50 percentage points. From inception, The Allocation Fund was outperformed by the Bloomberg Barclays Bond Index and the S&P 500 by 3.26 and 12.93 percentage points per annum, respectively, or on a cumulative basis, 33.69 and 198.90 percentage points over eight years and eleven months.
Fairholme Capital Management, L.L.C. (the “Manager”) believes performance over shorter periods is likely to be less meaningful than performance over longer periods. Investors are cautioned not to rely on short-term results. The fact that securities increase or decline in value does not always indicate that the Manager believes these securities to be more or less attractive — in fact, the Manager believes that some price increases present selling opportunities and some price declines present buying opportunities.
Further, shareholders should note that the S&P 500 and the Bloomberg Barclays Bond Index are unmanaged indices incurring no fees, expenses, or tax effects and are shown solely to compare the Funds’ performance to that of unmanaged and diversified indices of securities. Shareholders are also cautioned that it is possible that some securities mentioned in this discussion may no longer be held by a Fund subsequent to the end of the fiscal period, and that a Fund may have made new investments that are not yet required to be disclosed. It is the Funds’ general policy not to disclose portfolio holdings other than when required by relevant law or regulation. Portfolio holdings are subject to change without notice.
Not all Fund portfolio dispositions or additions are material, and, while the Funds and the Manager have long-term objectives, it is possible that a security sold or purchased in one period will be purchased or sold in a subsequent period. Generally, the Manager determines to buy and sell based on its estimates of the, respectively, relative intrinsic values and the Manager’s assessment of certain attractive characteristics of a company, general market conditions and expected future returns of an investment.
The Manager invests each Fund’s assets in securities to the extent the Manager finds reasonable investment opportunities in accordance with the Fund’s respective investment strategies, policies and restrictions, as stated in the Fund’s Prospectus and may invest a significant portion of each Fund’s assets in cash. The Manager views liquidity as a strategic advantage. At November 30, 2019, cash and cash equivalents (consisting of cash, commercial
7
FAIRHOLME FUNDS, INC.
MANAGEMENT DISCUSSION & ANALYSIS (continued)
For the Fiscal Year Ended November 30, 2019
paper, deposit accounts, U.S. Treasury Bills, and money-market funds) represented 41.3%, 86.9%, and 67.5% of The Fairholme Fund, The Income Fund, and The Allocation Fund total assets, respectively. Since inception, the Funds have held varying levels of cash and cash equivalents for periods without, in the Manager’s view, negatively influencing performance.
Each Fund is considered to be “non-diversified” under the Investment Company Act of 1940. Accordingly, each Fund can invest a greater percentage of its assets in fewer securities than a diversified fund, and can invest a significant portion of cash and liquid assets held by the Fund in one or more higher-risk securities at any time, including periods when a market is weak or a particular security declines sharply. The Funds may also have a greater percentage of assets invested in a particular sector than a diversified fund, exposing the Funds to the risk of an unanticipated event or condition and risks affecting a single company, sector or security.
The commentaries below provide details of each Fund’s portfolio holdings by issuer and sector, as well as reporting the most significant positive and negative performance by investment for the fiscal year ended November 30, 2019.
The most significant gains in each of the Funds’ portfolios related to positive developments in the Real Estate Management and Development, Mortgage Finance, and Metals & Mining sectors. Investments in the Retail Department Stores, Oil & Natural Gas Exploration and Leisure Products sectors saw some losses during the fiscal year.
The Manager made no changes to the core investment strategies and techniques it employed during the fiscal year ended November 30, 2019.
For the fiscal year ended November 30, 2019, The Fairholme Fund investments that were the biggest contributors to positive performance were the St. Joe Co. (“Joe”), Imperial Metals Corp. (“Imperial”), Federal Home Loan Mortgage Corp. (“Freddie”), and Federal National Mortgage Association (“Fannie”). There weren’t any significant contributors to negative performance during the period. The following charts show the top holdings by issuer and sector in descending order of net assets as of November 30, 2019.
| The Fairholme Fund Top Holdings by Issuer* (% of Net Assets) |
The Fairholme Fund Top Sectors (% of Net Assets) |
|||||||||||||
| The St. Joe Co. |
39.9% | Cash and Cash Equivalents** | 41.3% | |||||||||||
| Federal Home Loan Mortgage Corp. |
8.9% | Real Estate Management & Development | 39.9% | |||||||||||
| Federal National Mortgage Association |
8.9% | Mortgage Finance | 17.8% | |||||||||||
| Imperial Metals Corp. |
0.8% | Metals & Mining | 0.8% | |||||||||||
| Vista Outdoor, Inc. |
0.1% | Leisure Products | 0.1% | |||||||||||
| Sears Holdings Corp. |
0.1% | Retail Department Store | 0.1% | |||||||||||
|
|
|
|
|
|||||||||||
| 58.7% | 100.0% | |||||||||||||
|
|
|
|
|
|||||||||||
| * | Excludes cash, U.S. Treasury Bills, commercial paper, and money market funds. |
| ** | Includes cash, U.S. Treasury Bills, commercial paper, and money market funds. |
8
FAIRHOLME FUNDS, INC.
MANAGEMENT DISCUSSION & ANALYSIS (continued)
For the Fiscal Year Ended November 30, 2019
For the fiscal year ended November 30, 2019, The Income Fund investments that were the biggest contributors to positive performance were Imperial and Freddie. The biggest contributor to negative performance during the period was investment in Chesapeake Energy Corp. The following charts show the top holdings by issuer and sector in descending order of net assets as of November 30, 2019.
| The Income Fund Top Holdings by Issuer* (% of Net Assets) |
The Income Fund Top Sectors (% of Net Assets) |
|||||||||||||||
| Federal Home Loan Mortgage Corp. |
4.2% | Cash and Cash Equivalents** | 86.9% | |||||||||||||
| The Goldman Sachs Group, Inc. |
2.7% | Mortgage Finance | 4.2% | |||||||||||||
| GMAC Capital Trust I, Inc. |
1.8% | Diversified Banks | 3.0% | |||||||||||||
| Chesapeake Energy Corp. |
1.3% | Capital Markets | 2.7% | |||||||||||||
| Bank of America Corp. |
1.2% | Consumer Finance | 1.8% | |||||||||||||
| JP Morgan Chase & Co. |
1.1% | Oil & Natural Gas Exploration | 1.3% | |||||||||||||
| Wells Fargo & Co. |
0.7% | Retail Department Stores | 0.1% | |||||||||||||
| Sears Holdings Corp. |
0.1% | |||||||||||||||
|
|
|
|
|
|||||||||||||
| 13.1% | 100.0% | |||||||||||||||
|
|
|
|
|
|||||||||||||
| * | Excludes cash, U.S. Treasury Bills, commercial paper, and money market funds. |
| ** | Includes cash, U.S. Treasury Bills, commercial paper, and money market funds. |
For the fiscal year ended November 30, 2019, The Allocation Fund investments that were the biggest contributors to positive performance were Freddie, Fannie, Joe, and Imperial. The biggest contributor to negative performance during the period was investment in Chesapeake Energy Corp. The following charts show the top holdings by issuer and sector in descending order of net assets as of November 30, 2019.
| The Allocation Fund Top Holdings by Issuer* (% of Net Assets) |
The Allocation Fund Top Sectors (% of Net Assets) |
|||||||||||||||
| The St. Joe Co. |
10.9% | Cash and Cash Equivalents** | 67.5% | |||||||||||||
| Federal Home Loan Mortgage Corp. |
7.9% | Mortgage Finance | 15.7% | |||||||||||||
| Federal National Mortgage Association |
7.8% | Real Estate Management & Development | 10.9% | |||||||||||||
| Imperial Metals Corp. |
4.8% | Metals & Mining | 4.8% | |||||||||||||
| Chesapeake Energy Corp. |
1.2% | Oil & Natural Gas Exploration | 1.2% | |||||||||||||
|
|
|
|
|
|||||||||||||
| 32.6% | 100.1% | |||||||||||||||
|
|
|
|
|
|||||||||||||
| * | Excludes cash, U.S. Treasury Bills, commercial paper, and money market funds. |
| ** | Includes cash, U.S. Treasury Bills, commercial paper, and money market funds. |
The Manager views the ability to focus on fewer investments than a diversified fund as a strategic advantage. However, such a strategy may negatively influence long-term performance.
A more complete discussion and description of the principal risks of investing in the Funds can be found in the Funds’ Prospectus and Statement of Additional Information.
Large cash inflows or outflows may adversely affect the Funds’ performance. Such flows are monitored and actions deemed appropriate by the Manager are contemplated for when such flows could negatively impact performance.
9
FAIRHOLME FUNDS, INC.
MANAGEMENT DISCUSSION & ANALYSIS (continued)
For the Fiscal Year Ended November 30, 2019
Since inception, the Funds have been advised by the Manager. Bruce Berkowitz, both the Chief Investment Officer of the Manager and Chairman of the Funds’ Board of Directors (the “Board” or the “Directors”), and his affiliates beneficially own an aggregate 10,784,408, 6,691,382, and 4,382,931 shares of The Fairholme Fund, The Income Fund, and The Allocation Fund, respectively, at November 30, 2019. While there is no requirement that Mr. Berkowitz own shares of the Funds, such holdings are believed to help align the interests of the Manager with the interests of the shareholders.
The Board, including the Independent Directors, continues to believe that it is in the best interests of the Funds to have Mr. Berkowitz serve as Chairman of the Board given: his long-term relative performance; his experience, commitment, and significant personal investment in the Funds; the present composition of the Board; and current rules and regulations. A Director and Officers of the Funds are also Officers of the Manager. Nevertheless, at November 30, 2019, a majority of Directors were independent of the Manager, no stock option or restricted stock plans exist, Officers received no direct compensation from the Funds, and the Director affiliated with the Manager received no compensation for being a Director.
For more complete information about the Funds, or to obtain a current Prospectus, please visit www.fairholmefunds.com or call Shareholder Services at (866) 202-2263.
10
FAIRHOLME FUNDS, INC.
For the Six Month Period from June 1, 2019
through November 30, 2019 (unaudited)
As a shareholder of a Fund, you incur two types of costs: (1) transaction costs including, but not limited to, transaction fees at some broker-dealers, custodial fees for retirement accounts, redemption fees (on The Fairholme Fund and The Allocation Fund shares redeemed or exchanged within 60 days of purchase), and wire transfer fees; and (2) ongoing costs including, but not limited to, management fees paid to the Manager. The following examples are intended to help you understand your ongoing costs (in dollars) of investing in the Funds and to compare these costs with the ongoing costs of investing in other mutual funds.
These examples are based on an investment of $1,000 invested in the Funds at June 1, 2019, and held for the entire six month period ending November 30, 2019.
Actual Expenses
The first line of the tables below provides information about actual account values and actual expenses. You may use the information in this line, together with the amount you had invested at the beginning of the period, to estimate the expenses that you paid over the period. Simply divide your account value by $1,000 (for example, an $8,600 account value divided by $1,000 = 8.6), then multiply the result by the number in the first line under the heading “Expenses Paid During the Period” to estimate the expenses you paid on your account during this period.
Hypothetical Example for Comparison Purposes
The second line of the tables below provides information about hypothetical account values and hypothetical expenses based on each Fund’s actual expense ratio and an assumed rate of return of 5% per year before expenses, which is not the Fund’s actual return for the period presented. The hypothetical account values and expenses may not be used to estimate the actual ending account balance or expenses that you paid for the period presented. However, you may use this information to compare ongoing costs of investing in the Funds with the ongoing costs of investing in other funds. To do so, compare this 5% hypothetical example with the 5% hypothetical examples that appear in the shareholder reports of other funds.
Please note that the expenses shown in the table are meant to highlight your ongoing costs only and do not reflect any transactional costs, such as redemption fees (if any), or other direct costs. Therefore, the second line of the tables is useful in comparing ongoing costs only, and will not help you determine the relative total costs of owning different funds. In addition, if these transactional costs were included, your total costs would be higher.
| Beginning Account Value June 1, 2019 |
Ending Account Value November 30, 2019 |
Annualized Expense Ratio* |
Expenses Paid During the Period June 1, 2019 Through November 30, 2019** | |||||||||||||||||
| The Fairholme Fund |
||||||||||||||||||||
| Actual |
$ | 1,000.00 | $ | 1,011.60 | 0.81 | % | $ | 4.08 | ||||||||||||
| Hypothetical |
$ | 1,000.00 | $ | 1,021.01 | 0.81 | % | $ | 4.10 | ||||||||||||
| The Income Fund |
||||||||||||||||||||
| Actual |
$ | 1,000.00 | $ | 977.80 | 0.82 | % | $ | 4.07 | ||||||||||||
| Hypothetical |
$ | 1,000.00 | $ | 1,020.96 | 0.82 | % | $ | 4.15 | ||||||||||||
| The Allocation Fund |
||||||||||||||||||||
| Actual |
$ | 1,000.00 | $ | 929.60 | 0.82 | % | $ | 3.97 | ||||||||||||
| Hypothetical |
$ | 1,000.00 | $ | 1,020.96 | 0.82 | % | $ | 4.15 | ||||||||||||
| * | Effective January 1, 2018, the Manager has agreed to waive, on a voluntary basis, a portion of the management fee of The Fairholme Fund, The Income Fund and The Allocation Fund to the extent necessary to limit the management fee paid to the Manager by The Fairholme Fund, The Income Fund and The Allocation Fund, respectively, to an annual rate of 0.80% of that Fund’s daily average net asset value. This undertaking may be terminated by the Manager upon 60 days’ written notice to the applicable Fund. |
| ** | Expenses are equal to each Fund’s annualized expense ratio, multiplied by the average account value over the period, multiplied by 183 days/365 days (to reflect the one-half year period). |
11
THE FAIRHOLME FUND
November 30, 2019
The accompanying notes are an integral part of the financial statements.
12
THE FAIRHOLME FUND
SCHEDULE OF INVESTMENTS (continued)
November 30, 2019
The accompanying notes are an integral part of the financial statements.
13
THE FAIRHOLME FUND
SCHEDULE OF INVESTMENTS (continued)
November 30, 2019
| (a) | Non-income producing security. |
| (b) | Affiliated Company. See Note 8. |
| (c) | Variable rate security. Rates shown are the effective rates as of November 30, 2019. |
| (d) | Security in default and no interest was accrued as of November 30, 2019. |
| (e) | Restricted security as set forth in Rule 144(a) under the Securities Act of 1933. The value of these investments totals $376,420,433, which represents 35.63% of The Fairholme Fund’s net assets. |
| (f) | Rates shown are the effective yields based on the purchase price. The calculation assumes the security is held to maturity. |
| (g) | Annualized based on the 1-day yield as of November 30, 2019. |
The accompanying notes are an integral part of the financial statements.
14
THE FAIRHOLME FUND
STATEMENT OF ASSETS & LIABILITIES
November 30, 2019
| Assets |
||||
| Investments, at Fair Value: |
||||
| Unaffiliated Issuers (Cost — $611,526,290) |
$ | 626,659,090 | ||
| Affiliated Issuers (Cost — $657,834,109) |
430,739,480 | |||
| Interest Receivable |
181,235 | |||
| Receivable for Capital Shares Sold |
10,388 | |||
|
|
|
|||
| Total Assets |
1,057,590,193 | |||
|
|
|
|||
| Liabilities |
||||
| Accrued Management Fees |
689,013 | |||
| Payable for Capital Shares Redeemed |
360,640 | |||
|
|
|
|||
| Total Liabilities |
1,049,653 | |||
|
|
|
|||
| NET ASSETS |
$ | 1,056,540,540 | ||
|
|
|
|||
| Net Assets Consist of: |
||||
| Paid-In Capital |
$ | 2,008,134,487 | ||
| Total Accumulated Losses |
(951,593,947 | ) | ||
|
|
|
|||
| NET ASSETS |
$ | 1,056,540,540 | ||
|
|
|
|||
| Shares of Common Stock Outstanding* ($0.0001 par value) |
55,059,022 | |||
|
|
|
|||
| Net Asset Value, Offering and Redemption Price Per Share ($1,056,540,540 / 55,059,022 shares) |
$ | 19.19 | ||
|
|
|
|||
* 700,000,000 shares authorized in total.
The accompanying notes are an integral part of the financial statements.
15
THE FAIRHOLME FUND
| For the Fiscal Year Ended November 30, 2019 |
||||||||||||||||||||||||
| Investment Income |
||||||||||||||||||||||||
| Interest — Unaffiliated Issuers |
$ | 10,120,431 | ||||||||||||||||||||||
| Interest — Affiliated Issuers |
7,897,101 | |||||||||||||||||||||||
| Dividends — Unaffiliated Issuers |
158,400 | |||||||||||||||||||||||
|
|
|
|||||||||||||||||||||||
| Total Investment Income |
18,175,932 | |||||||||||||||||||||||
|
|
|
|||||||||||||||||||||||
| Expenses |
||||||||||||||||||||||||
| Management Fees |
10,940,735 | |||||||||||||||||||||||
| Legal Expenses |
44,395 | |||||||||||||||||||||||
|
|
|
|||||||||||||||||||||||
| Total Expenses |
10,985,130 | |||||||||||||||||||||||
|
|
|
|||||||||||||||||||||||
| Less: Voluntary Reduction of Management Fees |
(2,188,147 | ) | ||||||||||||||||||||||
|
|
|
|||||||||||||||||||||||
| Net Expenses |
8,796,983 | |||||||||||||||||||||||
|
|
|
|||||||||||||||||||||||
| Net Investment Income |
9,378,949 | |||||||||||||||||||||||
|
|
|
|||||||||||||||||||||||
| Realized and Unrealized Gain on Investments, Foreign |
||||||||||||||||||||||||
| Currency Related Transactions and Redemption In-Kind |
||||||||||||||||||||||||
| Net Realized Gain on Investments and Foreign Currency |
||||||||||||||||||||||||
| Related Transactions* |
||||||||||||||||||||||||
| Unaffiliated Issuers |
3,272,103 | |||||||||||||||||||||||
| Affiliated Issuers |
1,335 | |||||||||||||||||||||||
| Net Realized Gain on Redemption In-Kind |
||||||||||||||||||||||||
| Unaffiliated Issuers |
1,021,307 | |||||||||||||||||||||||
| Affiliated Issuers |
313,156 | |||||||||||||||||||||||
| Net Change in Unrealized Appreciation (Depreciation) on Investments and Foreign Currency Related Translations |
202,650,238 | |||||||||||||||||||||||
|
|
|
|||||||||||||||||||||||
| Net Realized and Unrealized Gain on Investments, Foreign Currency Related Transactions and Redemption In-Kind |
207,258,139 | |||||||||||||||||||||||
|
|
|
|||||||||||||||||||||||
| NET INCREASE IN NET ASSETS FROM OPERATIONS |
$ | 216,637,088 | ||||||||||||||||||||||
|
|
|
|||||||||||||||||||||||
* Realized gain includes $5,666,801 related to amounts received from a class action settlement for a security previously held by the Fund.
The accompanying notes are an integral part of the financial statements.
16
THE FAIRHOLME FUND
STATEMENTS OF CHANGES IN NET ASSETS
| For the Fiscal Year Ended November 30, 2019 |
For the Fiscal Year Ended November 30, 2018 |
|||||||||||||||||||||||||||||||||||||||
| CHANGES IN NET ASSETS |
||||||||||||||||||||||||||||||||||||||||
| From Operations |
||||||||||||||||||||||||||||||||||||||||
| Net Investment Income |
$ | 9,378,949 | $ | 23,034,554 | ||||||||||||||||||||||||||||||||||||
| Net Realized Gain (Loss) on Investments, Redemption In-Kind and Foreign Currency Related Transactions |
4,607,901 | (745,845,681 | ) | |||||||||||||||||||||||||||||||||||||
| Net Change in Unrealized Appreciation (Depreciation) on Investments and Foreign Currency Related Translations |
202,650,238 | 524,777,058 | ||||||||||||||||||||||||||||||||||||||
|
|
|
|
|
|||||||||||||||||||||||||||||||||||||
| Net Increase (Decrease) in Net Assets from Operations |
216,637,088 | (198,034,069 | ) | |||||||||||||||||||||||||||||||||||||
|
|
|
|
|
|||||||||||||||||||||||||||||||||||||
| From Dividends and Distributions to Shareholders |
||||||||||||||||||||||||||||||||||||||||
| Net Decrease in Net Assets from Dividends and Distributions |
(22,052,477 | ) | (24,854,774 | ) | ||||||||||||||||||||||||||||||||||||
|
|
|
|
|
|||||||||||||||||||||||||||||||||||||
| From Capital Share Transactions |
||||||||||||||||||||||||||||||||||||||||
| Proceeds from Sale of Shares |
27,873,325 | 90,282,215 | ||||||||||||||||||||||||||||||||||||||
| Shares Issued in Reinvestment of Dividends and Distributions |
20,660,229 | 23,181,634 | ||||||||||||||||||||||||||||||||||||||
| Redemption Fees |
37,027 | 33,620 | ||||||||||||||||||||||||||||||||||||||
| Cost of Shares Redeemed |
(238,279,392 | ) | (697,223,062 | ) | ||||||||||||||||||||||||||||||||||||
| Cost of Shares Redeemed In-Kind |
(13,200,907 | ) | — | |||||||||||||||||||||||||||||||||||||
|
|
|
|
|
|||||||||||||||||||||||||||||||||||||
| Net Decrease in Net Assets from Shareholder Activity |
(202,909,718 | ) | (583,725,593 | ) | ||||||||||||||||||||||||||||||||||||
|
|
|
|
|
|||||||||||||||||||||||||||||||||||||
| NET ASSETS |
||||||||||||||||||||||||||||||||||||||||
| Net Decrease in Net Assets |
(8,325,107 | ) | (806,614,436 | ) | ||||||||||||||||||||||||||||||||||||
| Net Assets at Beginning of Year |
1,064,865,647 | 1,871,480,083 | ||||||||||||||||||||||||||||||||||||||
|
|
|
|
|
|||||||||||||||||||||||||||||||||||||
| Net Assets at End of Year |
$ | 1,056,540,540 | $ | 1,064,865,647 | ||||||||||||||||||||||||||||||||||||
|
|
|
|
|
|||||||||||||||||||||||||||||||||||||
| SHARES TRANSACTIONS |
||||||||||||||||||||||||||||||||||||||||
| Issued |
1,583,280 | 4,864,645 | ||||||||||||||||||||||||||||||||||||||
| Reinvested |
1,352,111 | 1,184,549 | ||||||||||||||||||||||||||||||||||||||
| Redeemed |
(13,466,927 | ) | (37,685,937 | ) | ||||||||||||||||||||||||||||||||||||
| Redeemed In-Kind |
(761,812 | ) | — | |||||||||||||||||||||||||||||||||||||
|
|
|
|
|
|||||||||||||||||||||||||||||||||||||
| Net Decrease in Shares |
(11,293,348 | ) | (31,636,743 | ) | ||||||||||||||||||||||||||||||||||||
| Shares Outstanding at Beginning of Year |
66,352,370 | 97,989,113 | ||||||||||||||||||||||||||||||||||||||
|
|
|
|
|
|||||||||||||||||||||||||||||||||||||
| Shares Outstanding at End of Year |
55,059,022 | 66,352,370 | ||||||||||||||||||||||||||||||||||||||
|
|
|
|
|
|||||||||||||||||||||||||||||||||||||
The accompanying notes are an integral part of the financial statements.
17
THE FAIRHOLME FUND
| For the Fiscal Year Ended November 30, | ||||||||||||||||||||
| 2019 | 2018 | 2017 | 2016 | 2015 | ||||||||||||||||
| PER SHARE OPERATING PERFORMANCE |
||||||||||||||||||||
| NET ASSET VALUE, BEGINNING OF YEAR |
$16.05 | $19.10 | $24.26 | $34.24 | $37.96 | |||||||||||||||
|
|
|
|
|
|
|
|
|
|
|
|||||||||||
| Investment Operations |
||||||||||||||||||||
| Net Investment Income(1) |
0.16 | 0.29 | 0.23 | 0.33 | 0.46 | |||||||||||||||
| Net Realized and Unrealized Gain (Loss) on Investments |
3.32 | (3.08 | ) | (3.81 | ) | 2.60 | (1.10 | ) | ||||||||||||
|
|
|
|
|
|
|
|
|
|
|
|||||||||||
| Total from Investment Operations |
3.48 | (2.79 | ) | (3.58 | ) | 2.93 | (0.64 | ) | ||||||||||||
|
|
|
|
|
|
|
|
|
|
|
|||||||||||
| Dividends and Distributions |
||||||||||||||||||||
| From Net Investment Income |
(0.34 | ) | (0.26 | ) | (0.40 | ) | (0.60 | ) | — | |||||||||||
| From Realized Capital Gains |
— | — | (1.18 | ) | (12.31 | ) | (3.08 | ) | ||||||||||||
|
|
|
|
|
|
|
|
|
|
|
|||||||||||
| Total Dividends and Distributions |
(0.34 | ) | (0.26 | ) | (1.58 | ) | (12.91 | ) | (3.08 | ) | ||||||||||
|
|
|
|
|
|
|
|
|
|
|
|||||||||||
| Redemption Fees(1) |
0.00 | (2) | 0.00 | (2) | 0.00 | (2) | 0.00 | (2) | 0.00 | (2) | ||||||||||
|
|
|
|
|
|
|
|
|
|
|
|||||||||||
| NET ASSET VALUE, END OF YEAR |
$19.19 | $16.05 | $19.10 | $24.26 | $34.24 | |||||||||||||||
|
|
|
|
|
|
|
|
|
|
|
|||||||||||
| TOTAL RETURN |
22.20 | % | (14.85 | )% | (15.64 | )% | 18.93 | % | (1.95 | )% | ||||||||||
| Ratio/Supplemental Data |
||||||||||||||||||||
| Net Assets, End of Year (in 000’s) |
$1,056,541 | $1,064,866 | $1,871,480 | $3,155,709 | $4,612,354 | |||||||||||||||
| Ratio of Gross Expenses to Average Net Assets |
1.00 | %(3) | 1.00 | % | 1.02 | %(4) | 1.02 | %(4) | 1.03 | %(5) | ||||||||||
| Ratio of Net Expenses to Average Net Assets |
0.80 | %(3)(6) | 0.82 | %(6) | 1.02 | %(4) | 1.02 | %(4) | 1.03 | %(5) | ||||||||||
| Ratio of Net Investment Income (Loss) to Average Net Assets |
0.86 | % | 1.57 | % | 1.14 | % | 1.79 | % | 1.31 | % | ||||||||||
| Portfolio Turnover Rate |
8.05 | % | 16.29 | % | 6.57 | % | 19.19 | % | 40.46 | % | ||||||||||
| (1) | Based on average shares outstanding. |
| (2) | Redemption fees represent less than $0.01. |
| (3) | Less than 0.01% is attributable to legal expenses incurred outside of the 1.00% management fee. |
| (4) | 0.02% is attributable to legal expenses incurred outside of the 1.00% management fee. |
| (5) | 0.03% is attributable to legal expenses incurred outside of the 1.00% management fee and less than 0.01% is attributable to registration fees and miscellaneous expenses incurred outside of the 1.00% management fee. |
| (6) | Effective January 1, 2018, the Manager has agreed to waive, on a voluntary basis, a portion of the management fee of The Fairholme Fund to the extent necessary to limit the management fee paid to the Manager by The Fairholme Fund to an annual rate of 0.80% of the daily average net asset value of The Fairholme Fund. |
The accompanying notes are an integral part of the financial statements.
18
THE FAIRHOLME FOCUSED INCOME FUND
November 30, 2019
The accompanying notes are an integral part of the financial statements.
19
THE FAIRHOLME FOCUSED INCOME FUND
SCHEDULE OF INVESTMENTS (continued)
November 30, 2019
The accompanying notes are an integral part of the financial statements.
20
THE FAIRHOLME FOCUSED INCOME FUND
SCHEDULE OF INVESTMENTS (continued)
November 30, 2019
| (a) | Variable rate security. Rates shown are the effective rates as of November 30, 2019. |
| (b) | Non-income producing security. |
| (c) | Restricted security as set forth in Rule 144A under the Securities Act of 1933. The value of these investments totals $104,481, which represents 0.06% of The Income Fund’s net assets. |
| (d) | Security is perpetual in nature and has no stated maturity date. |
| (e) | Floating rate security. Rate shown is the effective rate as of November 30, 2019. |
| (f) | Security is a fix-to-float security, which carries a fixed coupon until a certain date, upon which it switches to a floating rate. Rate shown is the fixed rate. |
| (g) | Security in default and no interest was accrued as of November 30, 2019. |
| (h) | Rates shown are the effective yields based on the purchase price. The calculation assumes the security is held to maturity. |
| (i) | Restricted security as set forth in Rule 144(a) under the Securities Act of 1933. The value of these investments totals $144,394,248, which represents 80.51% of The Income Fund’s net assets. |
| (j) | Annualized based on the 1-day yield as of November 30, 2019. |
The accompanying notes are an integral part of the financial statements.
21
THE FAIRHOLME FOCUSED INCOME FUND
STATEMENT OF ASSETS & LIABILITIES
November 30, 2019
| Assets |
||||
| Investments, at Fair Value (Cost — $198,222,008) |
$ | 179,291,247 | ||
| Interest Receivable |
103,784 | |||
| Receivable for Investments Sold |
124,514 | |||
|
|
|
|||
| Total Assets
|
179,519,545 | |||
|
|
|
|||
| Liabilities |
||||
| Accrued Management Fees |
118,476 | |||
| Payable for Capital Shares Redeemed |
50,000 | |||
|
|
|
|||
| Total Liabilities |
168,476 | |||
|
|
|
|||
|
NET ASSETS
|
$ | 179,351,069 | ||
|
|
|
|||
|
Net Assets Consist of: |
||||
| Paid-In Capital |
$ | 203,668,681 | ||
| Total Accumulated Losses |
(24,317,612 | ) | ||
|
|
|
|||
|
NET ASSETS
|
$ | 179,351,069 | ||
|
|
|
|||
| Shares of Common Stock Outstanding* ($0.0001 par value) |
17,529,966 | |||
|
|
|
|||
| Net Asset Value, Offering and Redemption Price Per Share ($179,351,069 / 17,529,966 shares) |
$ | 10.23 | ||
|
|
|
|||
* 200,000,000 shares authorized in total.
The accompanying notes are an integral part of the financial statements.
22
THE FAIRHOLME FOCUSED INCOME FUND
| For the Fiscal Year Ended November 30, 2019 |
||||||||||||||||||||||||
| Investment Income |
||||||||||||||||||||||||
| Interest |
$ | 5,769,326 | ||||||||||||||||||||||
| Dividends |
1,273,406 | |||||||||||||||||||||||
|
|
|
|||||||||||||||||||||||
| Total Investment Income |
7,042,732 | |||||||||||||||||||||||
|
|
|
|||||||||||||||||||||||
| Expenses |
||||||||||||||||||||||||
| Management Fees |
1,874,109 | |||||||||||||||||||||||
| Legal Expenses |
39,410 | |||||||||||||||||||||||
|
|
|
|||||||||||||||||||||||
| Total Expenses |
1,913,519 | |||||||||||||||||||||||
|
|
|
|||||||||||||||||||||||
| Less: Voluntary Reduction of Management Fees |
(374,822 | ) | ||||||||||||||||||||||
|
|
|
|||||||||||||||||||||||
| Net Expenses |
1,538,697 | |||||||||||||||||||||||
|
|
|
|||||||||||||||||||||||
| Net Investment Income |
5,504,035 | |||||||||||||||||||||||
|
|
|
|||||||||||||||||||||||
| Realized and Unrealized Gain on Investments |
||||||||||||||||||||||||
| Net Realized Gain on Investments |
1,878,813 | |||||||||||||||||||||||
| Net Change in Unrealized Appreciation (Depreciation) on Investments |
4,512,746 | |||||||||||||||||||||||
|
|
|
|||||||||||||||||||||||
| Net Realized and Unrealized Gain on Investments |
6,391,559 | |||||||||||||||||||||||
|
|
|
|||||||||||||||||||||||
| NET INCREASE IN NET ASSETS FROM OPERATIONS |
$ |
11,895,594 |
| |||||||||||||||||||||
|
|
|
|||||||||||||||||||||||
The accompanying notes are an integral part of the financial statements.
23
THE FAIRHOLME FOCUSED INCOME FUND
STATEMENTS OF CHANGES IN NET ASSETS
| For the Fiscal Year Ended November 30, 2019 |
For the Fiscal Year Ended November 30, 2018 |
|||||||||||||||||||||||||||||||||||||||||||||||
| CHANGES IN NET ASSETS |
||||||||||||||||||||||||||||||||||||||||||||||||
| From Operations |
||||||||||||||||||||||||||||||||||||||||||||||||
| Net Investment Income |
$ | 5,504,035 | $ | 10,275,115 | ||||||||||||||||||||||||||||||||||||||||||||
| Net Realized Gain (Loss) on Investments |
1,878,813 | (7,956,448 | ) | |||||||||||||||||||||||||||||||||||||||||||||
| Net Change in Unrealized Appreciation (Depreciation) on Investments and |
||||||||||||||||||||||||||||||||||||||||||||||||
| Foreign Currency Related Translations |
4,512,746 | (11,226,394 | ) | |||||||||||||||||||||||||||||||||||||||||||||
|
|
|
|
|
|||||||||||||||||||||||||||||||||||||||||||||
| Net Increase (Decrease) in Net Assets from Operations |
11,895,594 | (8,907,727 | ) | |||||||||||||||||||||||||||||||||||||||||||||
|
|
|
|
|
|||||||||||||||||||||||||||||||||||||||||||||
| From Dividends and Distributions to Shareholders |
||||||||||||||||||||||||||||||||||||||||||||||||
| Net Decrease in Net Assets from Dividends and Distributions |
(5,286,649 | ) | (20,470,612 | ) | ||||||||||||||||||||||||||||||||||||||||||||
|
|
|
|
|
|||||||||||||||||||||||||||||||||||||||||||||
| From Capital Share Transactions |
||||||||||||||||||||||||||||||||||||||||||||||||
| Proceeds from Sale of Shares |
9,617,338 | 82,350,172 | ||||||||||||||||||||||||||||||||||||||||||||||
| Shares Issued in Reinvestment of Dividends and Distributions |
4,659,430 | 18,536,050 | ||||||||||||||||||||||||||||||||||||||||||||||
| Cost of Shares Redeemed |
(30,034,524 | ) | (106,440,303 | ) | ||||||||||||||||||||||||||||||||||||||||||||
|
|
|
|
|
|||||||||||||||||||||||||||||||||||||||||||||
| Net Decrease in Net Assets from Shareholder Activity |
(15,757,756 | ) | (5,554,081 | ) | ||||||||||||||||||||||||||||||||||||||||||||
|
|
|
|
|
|||||||||||||||||||||||||||||||||||||||||||||
| NET ASSETS |
||||||||||||||||||||||||||||||||||||||||||||||||
| Net Decrease in Net Assets |
(9,148,811 | ) | (34,932,420 | ) | ||||||||||||||||||||||||||||||||||||||||||||
| Net Assets at Beginning of Year |
188,499,880 | 223,432,300 | ||||||||||||||||||||||||||||||||||||||||||||||
|
|
|
|
|
|||||||||||||||||||||||||||||||||||||||||||||
| Net Assets at End of Year |
$ | 179,351,069 | $ | 188,499,880 | ||||||||||||||||||||||||||||||||||||||||||||
|
|
|
|
|
|||||||||||||||||||||||||||||||||||||||||||||
| SHARES TRANSACTIONS |
||||||||||||||||||||||||||||||||||||||||||||||||
| Issued |
939,727 | 7,580,742 | ||||||||||||||||||||||||||||||||||||||||||||||
| Reinvested |
451,601 | 1,734,291 | ||||||||||||||||||||||||||||||||||||||||||||||
| Redeemed |
(2,932,519 | ) | (9,968,013 | ) | ||||||||||||||||||||||||||||||||||||||||||||
|
|
|
|
|
|||||||||||||||||||||||||||||||||||||||||||||
| Net Decrease in Shares |
(1,541,191 | ) | (652,980 | ) | ||||||||||||||||||||||||||||||||||||||||||||
| Shares Outstanding at Beginning of Year |
19,071,157 | 19,724,137 | ||||||||||||||||||||||||||||||||||||||||||||||
|
|
|
|
|
|||||||||||||||||||||||||||||||||||||||||||||
| Shares Outstanding at End of Year |
17,529,966 | 19,071,157 | ||||||||||||||||||||||||||||||||||||||||||||||
|
|
|
|
|
|||||||||||||||||||||||||||||||||||||||||||||
The accompanying notes are an integral part of the financial statements.
24
THE FAIRHOLME FOCUSED INCOME FUND
| For the Fiscal Year Ended November 30, | ||||||||||||||||||||
| 2019 | 2018 | 2017 | 2016 | 2015 | ||||||||||||||||
| PER SHARE OPERATING PERFORMANCE |
||||||||||||||||||||
| NET ASSET VALUE, BEGINNING OF YEAR |
$9.88 | $11.33 | $12.38 | $10.72 | $10.82 | |||||||||||||||
|
|
|
|
|
|
|
|
|
|
|
|||||||||||
| Investment Operations |
||||||||||||||||||||
| Net Investment Income(1) |
0.30 | 0.49 | 0.60 | 0.57 | 0.45 | |||||||||||||||
| Net Realized and Unrealized Gain (Loss) on Investments |
0.34 | (0.91 | ) | (0.99 | ) | 1.72 | 0.03 | |||||||||||||
|
|
|
|
|
|
|
|
|
|
|
|||||||||||
| Total from Investment Operations |
0.64 | (0.42 | ) | (0.39 | ) | 2.29 | 0.48 | |||||||||||||
|
|
|
|
|
|
|
|
|
|
|
|||||||||||
| Dividends and Distributions |
||||||||||||||||||||
| From Net Investment Income |
(0.29 | ) | (0.51 | ) | (0.61 | ) | (0.56 | ) | (0.43 | ) | ||||||||||
| From Realized Capital Gains |
— | (0.52 | ) | (0.05 | ) | (0.07 | ) | (0.15 | ) | |||||||||||
|
|
|
|
|
|
|
|
|
|
|
|||||||||||
| Total Dividends and Distributions |
(0.29 | ) | (1.03 | ) | (0.66 | ) | (0.63 | ) | (0.58 | ) | ||||||||||
|
|
|
|
|
|
|
|
|
|
|
|||||||||||
| NET ASSET VALUE, END OF YEAR |
$10.23 | $9.88 | $11.33 | $12.38 | $10.72 | |||||||||||||||
|
|
|
|
|
|
|
|
|
|
|
|||||||||||
| TOTAL RETURN |
6.49 | % | (4.19 | )% | (3.35 | )% | 22.77 | % | 4.60 | % | ||||||||||
| Ratio/Supplemental Data |
||||||||||||||||||||
| Net Assets, End of Year (in 000’s) |
$179,351 | $188,500 | $223,432 | $240,195 | $243,072 | |||||||||||||||
| Ratio of Gross Expenses to Average Net Assets: |
1.02 | %(2) | 1.00 | % | 1.00 | % | 1.00 | % | 1.00 | % | ||||||||||
| Ratio of Net Expenses to Average Net Assets |
0.82 | %(2)(3) | 0.82 | %(3) | 1.00 | % | 1.00 | % | 1.00 | % | ||||||||||
| Ratio of Net Investment Income to Average Net Assets |
2.94 | % | 4.56 | % | 5.02 | % | 5.48 | % | 4.14 | % | ||||||||||
| Portfolio Turnover Rate |
16.70 | % | 45.78 | % | 36.05 | % | 28.81 | % | 67.05 | % | ||||||||||
| (1) | Based on average shares outstanding. |
| (2) | 0.02% is attributable to legal expenses incurred outside the management fee. |
| (3) | Effective January 1, 2018, the Manager has agreed to waive, on a voluntary basis, a portion of the management fee of The Income Fund to the extent necessary to limit the management fee paid to the Manager by The Income Fund to an annual rate of 0.80% of the daily average net asset value of The Income Fund. |
The accompanying notes are an integral part of the financial statements.
25
THE FAIRHOLME ALLOCATION FUND
November 30, 2019
The accompanying notes are an integral part of the financial statements.
26
THE FAIRHOLME ALLOCATION FUND
SCHEDULE OF INVESTMENTS (continued)
November 30, 2019
| (a) | Non-income producing security. |
| (b) | Restricted/controlled security. The value of this security totals $6,404,630, which represents 10.86% of The Allocation Fund’s net assets. Information related to this security is as follows: |
| Shares |
Issuer |
Acquisition Date(s) |
Acquisition Cost |
11/30/2019 Carrying Value Per Unit | ||||||||
| 348,267 |
The St. Joe Co. | 08/09/2017-09/01/2017 | $ | 6,615,792 | $18.39 | |||||||
| (c) | Variable rate security. Rates shown are the effective rates as of November 30, 2019. |
| (d) | Restricted security as set forth in Rule 144(a) under the Securities Act of 1933. The value of these investments totals $34,663,812, which represents 58.77% of The Allocation Fund’s net assets. |
| (e) | Rates shown are the effective yields based on the purchase price. The calculation assumes the security is held to maturity. |
| (f) | Annualized based on the 1-day yield as of November 30, 2019. |
The accompanying notes are an integral part of the financial statements.
27
THE FAIRHOLME ALLOCATION FUND
STATEMENT OF ASSETS & LIABILITIES
November 30, 2019
| Assets |
||||
| Investments, at Fair Value (Cost — $78,817,674) |
$ | 59,004,844 | ||
| Interest Receivable |
17,383 | |||
|
|
|
|||
| Total Assets |
59,022,227 | |||
|
|
|
|||
| Liabilities |
||||
| Accrued Management Fees |
39,100 | |||
|
|
|
|||
| Total Liabilities |
39,100 | |||
|
|
|
|||
| NET ASSETS |
$ | 58,983,127 | ||
|
|
|
|||
| Net Assets Consist of: |
||||
| Paid-In Capital |
$ | 126,234,356 | ||
| Total Accumulated Losses |
(67,251,229 | ) | ||
|
|
|
|||
| NET ASSETS |
$ | 58,983,127 | ||
|
|
|
|||
| Shares of Common Stock Outstanding* ($0.0001 par value) |
8,423,476 | |||
|
|
|
|||
| Net Asset Value, Offering and Redemption Price Per Share ($58,983,127 / 8,423,476 shares) |
$ | 7.00 | ||
|
|
|
* 200,000,000 shares authorized in total.
The accompanying notes are an integral part of the financial statements.
28
THE FAIRHOLME ALLOCATION FUND
| For the Fiscal Year Ended November 30, 2019 |
||||||||||||||||
| Investment Income |
||||||||||||||||
| Interest |
$ | 1,168,430 | ||||||||||||||
| Dividends |
298,741 | |||||||||||||||
|
|
|
|||||||||||||||
| Total Investment Income |
1,467,171 | |||||||||||||||
|
|
|
|||||||||||||||
| Expenses |
||||||||||||||||
| Management Fees |
721,273 | |||||||||||||||
| Legal Expenses |
15,218 | |||||||||||||||
|
|
|
|||||||||||||||
| Total Expenses |
736,491 | |||||||||||||||
|
|
|
|||||||||||||||
| Less: Voluntary Reduction of Management Fees |
(144,255 | ) | ||||||||||||||
|
|
|
|||||||||||||||
| Net Expenses |
592,236 | |||||||||||||||
|
|
|
|||||||||||||||
| Net Investment Income |
874,935 | |||||||||||||||
|
|
|
|||||||||||||||
| Realized and Unrealized Gain on Investments, Redemption In-Kind and Foreign Currency Related Transactions |
||||||||||||||||
| Net Realized Gain on Investments and Foreign Currency Related Transactions |
363,076 | |||||||||||||||
| Net Realized Gain on Redemption In-Kind |
1,061,539 | |||||||||||||||
| Net Change in Unrealized Appreciation (Depreciation) on Investments and Foreign Currency Related Translations |
3,765,875 | |||||||||||||||
|
|
|
|||||||||||||||
| Net Realized and Unrealized Gain on Investments, Redemption In-Kind and Foreign Currency Related Transactions |
5,190,490 | |||||||||||||||
|
|
|
|||||||||||||||
| NET INCREASE IN NET ASSETS FROM OPERATIONS |
$ | 6,065,425 | ||||||||||||||
|
|
|
|||||||||||||||
The accompanying notes are an integral part of the financial statements.
29
THE FAIRHOLME ALLOCATION FUND
STATEMENTS OF CHANGES IN NET ASSETS
| For the Fiscal Year Ended November 30, 2019 |
For the Fiscal Year Ended November 30, 2018 |
|||||||
| CHANGES IN NET ASSETS |
||||||||
| From Operations |
||||||||
| Net Investment Income |
$ | 874,935 | $ | 1,223,907 | ||||
| Net Realized Gain (Loss) on Investments, Redemption In-Kind and Foreign Currency Related Transactions |
1,424,615 | (48,412,833 | ) | |||||
| Net Change in Unrealized Appreciation (Depreciation) on Investments and Foreign Currency Related Translations |
3,765,875 | 38,497,966 | ||||||
|
|
|
|
|
|||||
| Net Increase (Decrease) in Net Assets from Operations |
6,065,425 | (8,690,960 | ) | |||||
|
|
|
|
|
|||||
| From Dividends and Distributions to Shareholders |
||||||||
| Net Decrease in Net Assets from Dividends and Distributions |
(791,785 | ) | (1,817,020 | ) | ||||
|
|
|
|
|
|||||
| From Capital Share Transactions |
||||||||
| Proceeds from Sale of Shares |
1,417,681 | 1,433,796 | ||||||
| Shares Issued in Reinvestment of Dividends and Distributions |
757,745 | 1,779,557 | ||||||
| Redemption Fees |
2,187 | 285 | ||||||
| Cost of Shares Redeemed |
(16,966,140 | ) | (34,508,769 | ) | ||||
| Cost of Shares Redeemed In-Kind |
(3,889,024 | ) | — | |||||
|
|
|
|
|
|||||
| Net Decrease in Net Assets from Shareholder Activity |
(18,677,551 | ) | (31,295,131 | ) | ||||
|
|
|
|
|
|||||
| NET ASSETS |
||||||||
| Net Decrease in Net Assets |
(13,403,911 | ) | (41,803,111 | ) | ||||
| Net Assets at Beginning of Year |
72,387,038 | 114,190,149 | ||||||
|
|
|
|
|
|||||
| Net Assets at End of Year |
$ | 58,983,127 | $ | 72,387,038 | ||||
|
|
|
|
|
|||||
| SHARES TRANSACTIONS |
||||||||
| Issued |
202,579 | 197,013 | ||||||
| Reinvested |
118,029 | 234,152 | ||||||
| Redeemed |
(2,229,510 | ) | (4,778,281 | ) | ||||
| Redeemed In-Kind |
(675,384 | ) | — | |||||
|
|
|
|
|
|||||
| Net Decrease in Shares |
(2,584,286 | ) | (4,347,116 | ) | ||||
| Shares Outstanding at Beginning of Year |
11,007,762 | 15,354,878 | ||||||
|
|
|
|
|
|||||
| Shares Outstanding at End of Year |
8,423,476 | 11,007,762 | ||||||
|
|
|
|
|
|||||
The accompanying notes are an integral part of the financial statements.
30
THE FAIRHOLME ALLOCATION FUND
| For the Fiscal Year Ended November 30, | ||||||||||||||||||||
| 2019 |
2018 |
2017 |
2016 |
2015 |
||||||||||||||||
| PER SHARE OPERATING PERFORMANCE |
||||||||||||||||||||
| NET ASSET VALUE, BEGINNING OF YEAR |
$6.58 | $7.44 | $9.65 | $10.40 | $12.57 | |||||||||||||||
|
|
|
|
|
|
|
|
|
|
|
|||||||||||
| Investment Operations |
||||||||||||||||||||
| Net Investment Income(1) |
0.09 | 0.09 | 0.10 | 0.14 | 0.35 | |||||||||||||||
| Net Realized and Unrealized Gain (Loss) on Investments |
0.40 | (0.83 | ) | (1.71 | ) | 0.75 | (1.38 | ) | ||||||||||||
|
|
|
|
|
|
|
|
|
|
|
|||||||||||
| Total from Investment Operations |
0.49 | (0.74 | ) | (1.61 | ) | 0.89 | (1.03 | ) | ||||||||||||
|
|
|
|
|
|
|
|
|
|
|
|||||||||||
| Dividends and Distributions |
||||||||||||||||||||
| From Net Investment Income |
(0.07 | ) | (0.12 | ) | (0.17 | ) | (0.31 | ) | — | |||||||||||
| From Realized Capital Gains |
— | — | (0.43 | ) | (1.33 | ) | (1.14 | ) | ||||||||||||
|
|
|
|
|
|
|
|
|
|
|
|||||||||||
| Total Dividends and Distributions |
(0.07 | ) | (0.12 | ) | (0.60 | ) | (1.64 | ) | (1.14 | ) | ||||||||||
|
|
|
|
|
|
|
|
|
|
|
|||||||||||
| Redemption Fees(1) |
0.00 | (2) | 0.00 | (2) | 0.00 | (2) | 0.00 | (2) | 0.00 | (2) | ||||||||||
|
|
|
|
|
|
|
|
|
|
|
|||||||||||
| NET ASSET VALUE, END OF YEAR |
$7.00 | $6.58 | $7.44 | $9.65 | $10.40 | |||||||||||||||
|
|
|
|
|
|
|
|
|
|
|
|||||||||||
| TOTAL RETURN |
7.61 | % | (10.18 | )% | (17.59 | )% | 11.06 | % | (8.88 | )% | ||||||||||
| Ratio/Supplemental Data |
||||||||||||||||||||
| Net Assets, End of Year (in 000’s) |
$ | 58,983 | $ | 72,387 | $ | 114,190 | $ | 259,501 | $ | 297,527 | ||||||||||
| Ratio of Gross Expenses to Average Net Assets: |
1.02 | %(3) | 1.00 | % | 1.00 | % | 1.00 | % | 1.00 | % | ||||||||||
| Ratio of Net Expenses to Average Net Assets |
0.82 | %(3)(4) | 0.82 | %(4) | 1.00 | % | 1.00 | % | 1.00 | % | ||||||||||
| Ratio of Net Investment Income (Loss) to Average Net Assets |
1.21 | % | 1.32 | % | 1.19 | % | 1.81 | % | 3.09 | % | ||||||||||
| Portfolio Turnover Rate |
15.58 | % | 23.52 | % | 31.01 | % | 13.65 | % | 39.24 | % | ||||||||||
| (1) | Based on average shares outstanding. |
| (2) | Redemption fees represent less than $0.01. |
| (3) | 0.02% is attributable to legal expenses incurred outside the management fee. |
| (4) | Effective January 1, 2018, the Manager has agreed to waive, on a voluntary basis, a portion of the management fee of The Allocation Fund to the extent necessary to limit the management fee paid to the Manager by The Allocation Fund to an annual rate of 0.80% of the daily average net asset value of The Allocation Fund. |
The accompanying notes are an integral part of the financial statements.
31
FAIRHOLME FUNDS, INC.
November 30, 2019
Note 1. Organization
Fairholme Funds, Inc. (the “Company”), a Maryland corporation, is registered under the Investment Company Act of 1940, as amended (the “1940 Act”), as an open-end management investment company. The Company’s Articles of Incorporation permit the Board of Directors of the Company (the “Board” or the “Directors”) to issue 1,100,000,000 shares of common stock at $.0001 par value. 700,000,000 shares have been allocated to The Fairholme Fund (“The Fairholme Fund”), 200,000,000 shares have been allocated to The Fairholme Focused Income Fund (“The Income Fund”), and 200,000,000 shares have been allocated to The Fairholme Allocation Fund (“The Allocation Fund”). The Fairholme Fund, The Income Fund, and The Allocation Fund (each a “Fund” and collectively the “Funds”) are non-diversified funds. The Funds may have a greater percentage of their assets invested in particular securities than a diversified fund, exposing the Funds to the risk of unanticipated industry conditions as well as risks specific to a single company or the securities of a single company. Each Fund has different objectives, capitalizations, and considerations that may or may not lead to differing compositions of issuers, securities within an issuer, and cash levels within each Fund. The Board has the power to designate one or more separate and distinct series and/or classes of shares of common stock and to classify or reclassify any unissued shares with respect to such series.
The Fairholme Fund’s investment objective is to provide long-term growth of capital. Under normal circumstances, The Fairholme Fund seeks to achieve its investment objective by investing in a focused portfolio of equity and fixed-income securities. The proportion of The Fairholme Fund’s assets invested in each type of asset class will vary from time to time based upon Fairholme Capital Management, L.L.C.’s (the “Manager”) assessment of general market and economic conditions. The Fairholme Fund may invest in, and may shift frequently among, the asset classes and market sectors. The equity securities in which The Fairholme Fund may invest include common and preferred stock (including convertible preferred stock), partnership interests, business trust shares, interests in real estate investment trusts (“REITs”), rights and warrants to subscribe for the purchase of equity securities, and depository receipts. The Fairholme Fund may invest in equity securities without regard to the jurisdictions in which the issuers of the securities are organized or situated and without regard to the market capitalizations or sectors of such issuers. The fixed-income securities in which The Fairholme Fund may invest include U.S. corporate debt securities, non-U.S. corporate debt securities, bank debt (including bank loans and participations), U.S. government and agency debt securities (including U.S. Treasury bills), short-term debt obligations of foreign governments, and foreign money market instruments. Except for its investments in short-term debt obligations of foreign governments, The Fairholme Fund may invest in fixed-income securities regardless of maturity or the rating of the issuer of the security. The Fairholme Fund may also invest in “special situations” to achieve its objective. “Special situation” investments may include equity securities or fixed-income securities, such as corporate debt, which may be in a distressed position as a result of economic or company specific developments. Although The Fairholme Fund normally holds a focused portfolio of equity and fixed-income securities, The Fairholme Fund is not required to be fully invested in such securities and may maintain a significant portion of its total assets in cash and securities generally considered to be cash equivalents. The Manager serves as investment adviser to The Fairholme Fund.
The Income Fund’s investment objective is to seek current income. Under normal circumstances, The Income Fund seeks to achieve its investment objective by investing in a focused portfolio of cash distributing securities. To maintain maximum flexibility, the securities in which The Income Fund may invest include corporate bonds and other corporate debt securities of issuers in the U.S. and foreign countries, bank debt (including bank loans and loan participations), government and agency debt securities of the U.S. and foreign countries (including U.S. Treasury bills), convertible bonds and other convertible securities, and equity securities, including preferred and common stock and interests in REITs. Although The Income Fund normally holds a focused portfolio of securities, The Income Fund is not required to be fully invested in such securities and may maintain a significant portion of its total assets in cash and securities generally considered to be cash equivalents. The Manager serves as investment adviser to The Income Fund.
The Allocation Fund’s investment objective is to seek long-term total return. Under normal circumstances, The Allocation Fund seeks to achieve its investment objective by investing opportunistically in a focused portfolio of investments in the equity, fixed-income and cash, and cash-equivalent asset classes. The proportion of The Allocation Fund’s portfolio invested
32
FAIRHOLME FUNDS, INC.
NOTES TO FINANCIAL STATEMENTS (continued)
November 30, 2019
in each asset class will vary from time to time based on the Manager’s assessment of relative fundamental values of securities and other investments in the asset class, the attractiveness of investment opportunities within each asset class, general market and economic conditions, and expected future returns of other investment opportunities. The Allocation Fund seeks to capitalize on anticipated fluctuations in the financial markets by changing the mix of its holdings in the targeted asset classes. The Allocation Fund may maintain a significant portion of its assets in cash and cash-equivalent securities and investments. The Manager serves as investment adviser to The Allocation Fund.
There is no guarantee that the Funds will meet their respective objectives.
Note 2. Significant Accounting Policies
As investment companies, the Funds follow the investment company accounting and reporting guidance, which is part of U.S. generally accepted accounting principles (“U.S. GAAP”). The Funds’ investments are reported at fair value as defined by U.S. GAAP. The Funds calculate their net asset values as soon as practicable following the close of regular trading on the New York Stock Exchange (currently 4:00 p.m. Eastern Time) on each day the New York Stock Exchange is open.
New Accounting Pronouncements: To improve the effectiveness of fair value disclosure requirements, the Financial Accounting Standards Board issued Accounting Standard Update (ASU) 2018-13, Fair Value Measurement Disclosure Framework –Changes to the Disclosure Requirements for Fair Value Measurement (ASU 2018-13), which adds, removes, and modifies certain aspects relating to fair value disclosure. ASU 2018-13 is effective for interim and annual reporting periods beginning after December 15, 2019; early adoption of the additions relating to ASU 2018-13 is not required, even if early adoption is elected for the removals and modifications under ASU 2018-13. Management has early adopted the removals and modifications set forth in ASU 2018-13 in these financial statements and has not early adopted the additions set forth in ASU 2018-13.
A description of the valuation techniques applied to the Funds’ securities measured at fair value on a recurring basis follows:
Security Valuation:
Equity securities (common and preferred stocks): Securities traded on a national securities exchange or reported on the NASDAQ national market are generally valued at the official closing price, or at the last reported sale price on the exchange or market on which the securities are traded, as of the close of business on the day the securities are being valued or, lacking any sales, at the last available bid price. To the extent these securities are actively traded and valuation adjustments are not applied, they are classified in Level 1 of the fair value hierarchy. If these securities are not actively traded, they are classified in Level 2. Subject to the oversight of the Board, the Manager may determine the fair valuation of a security when market quotations are insufficient or not readily available, when securities are determined to be illiquid or restricted, or when in the judgment of the Manager the prices or values available do not represent the fair value of the instrument. In these situations, if the inputs are observable, the valuation will be classified in Level 2 of the fair value hierarchy, otherwise they would be classified in Level 3.
Fixed-income securities (U.S. government obligations, corporate bonds, convertible bonds, and asset backed securities): The fair value of fixed-income securities is determined using market quotations when readily available, but may also be estimated by various methods when no such market quotations exist and when the Manager believes these other methods reflect the fair value of such securities. These methods may consider recently executed transactions in securities of the issuer or comparable issuers and market price valuations from independent pricing services and/or brokers (where observable). Where the Manager deems it appropriate to do so (such as when independent prices are unavailable or not deemed to be representative of fair value) fixed income securities will be fair valued in good faith following consideration by, and conclusion of, the Manager’s Valuation and Liquidity Risk Management Committee. As of November 30, 2019, fixed-income securities are valued by the Manager utilizing observable market prices on the day of valuation or the average bid of independent broker/dealer quotes and/or the average of valuations from independent pricing services. Although fixed-income securities are classified in Level 2 of the fair value hierarchy at November 30, 2019, in instances where significant unobservable inputs are used, they would be classified in Level 3.
33
FAIRHOLME FUNDS, INC.
NOTES TO FINANCIAL STATEMENTS (continued)
November 30, 2019
Open-end mutual funds: Investments in open-end mutual funds including money market funds are valued at their closing net asset value each business day and are classified in Level 1 of the fair value hierarchy.
Short-term securities: Investments in securities with maturities of less than sixty days when acquired, or which subsequently are within sixty days of maturity, shall be valued at prices supplied by an independent pricing source or by one of the Funds’ pricing agents based on broker or dealer supplied valuations or matrix pricing. To the extent the inputs are observable and timely, the values would be classified in Level 2 of the fair value hierarchy.
Restricted securities: The Manager is deemed to be an affiliate of The St. Joe Co. (“Joe”) for purposes of the Securities Act of 1933 and Rule 144. This determination was made based on a number of factors, including the collective ownership of Joe by certain of the Funds and other advisory clients advised by the Manager. Shares of Joe owned by The Allocation Fund are considered control securities under Rule 144 and are treated as restricted securities for purposes of The Allocation Fund’s valuation procedures. Due to the restrictions on resale, the securities are generally valued at a discount to similar publicly traded securities. Depending on the relative significance of valuation inputs, these instruments may be classified in either Level 2 or Level 3 of the fair value hierarchy. Joe was classified as Level 2 at November 30, 2019.
Warrants: The Funds may invest in warrants, which may be acquired either through a direct purchase, included as part of a private placement, or pursuant to corporate actions. Warrants entitle, but do not obligate, the holder to buy equity securities at a specific price for a specific period of time. Warrants may be considered more speculative than certain other types of investments in that they do not entitle a holder to dividends or voting rights with respect to the underlying securities that may be purchased nor do they represent any rights in the assets of the issuing company. Also, the value of a warrant does not necessarily change with the value of the underlying securities and a warrant ceases to have value if it is not exercised prior to its expiration date. Warrants traded on a security exchange are valued at the official closing price on the valuation date and are classified as Level 1 of the fair value hierarchy. Over the counter (OTC) warrants are valued using simulation models utilizing market value of the underlying security, expiration date of the warrants, volatility of the underlying security, strike price of the warrants, risk-free interest rate at the valuation date, and are classified as Level 2 or Level 3 of the fair value hierarchy depending on the observability of the inputs used.
The Funds use several recognized industry third-party pricing services (TPPS) – approved by the Board and unaffiliated with the Manager – to provide prices for some of the Funds’ securities. The Funds also use other independent market trade data sources (such as TRACE, the FINRA developed mandatory reporting of over-the-counter secondary market transactions), as well as broker quotes provided by market makers. The data within these feeds is ultimately sourced from major stock exchanges and trading systems where these securities trade. If a price obtained from the pricing source is deemed unreliable, it may be discarded and/or challenged. In these cases the pricing decision is made by reference to the reliable market data from the other market data sources.
Subject to the oversight of the Board, the Manager may determine the fair valuation of a security when market quotations are insufficient or not readily available, when securities are determined to be illiquid or restricted, or when in the judgment of the Manager the prices or values available do not represent the fair value of the instrument. Factors which may cause the Manager to make such a judgment include the following: (a) only a bid price or an asked price is available; (b) the spread between bid and asked prices is substantial; (c) the liquidity of the securities; (d) the frequency of sales; (e) the thinness of the market; (f) the size of reported trades; (g) actions of the securities markets, such as the suspension or limitation of trading; and (h) local market closures. Among the factors to be considered to fair value a security are recent prices of comparable securities that are publicly traded, reliable prices of securities not publicly traded, the use of valuation models, current analyst reports, valuing the income or cash flow of the issuer, or cost if the preceding factors do not apply. The circumstances of fair valued securities are frequently monitored to determine if fair valuation measures continue to apply.
The Manager reports quarterly to the Board the results of the application of fair valuation policies and procedures.
34
FAIRHOLME FUNDS, INC.
NOTES TO FINANCIAL STATEMENTS (continued)
November 30, 2019
The inputs and valuation techniques used to measure fair value of the Funds’ investments are summarized into three levels as described in the hierarchy below:
| • Level 1 — |
quoted prices in active markets for identical securities; | |||
| • Level 2 — |
other significant observable inputs (including quoted prices for similar securities, quoted prices in inactive markets for identical securities, interest rates, prepayment speeds, credit risk, etc.); and | |||
| • Level 3 — |
significant unobservable inputs (including the Manager’s determination as to the fair value of investments). | |||
The inputs or methodology used for valuing investments are not necessarily an indication of the level of risk associated with investing in those investments. The summary of the Funds’ investments by inputs used to value the Funds’ investments as of November 30, 2019, is as follows:
| Valuation Inputs | ||||||||||||||||||||
| Level 1 – Quoted Prices |
Level 2 – Other Significant Observable Inputs |
Level 3 - Significant Unobservable Inputs |
Total Fair Value at 11/30/19 | |||||||||||||||||
| THE FAIRHOLME FUND ASSETS: |
||||||||||||||||||||
| INVESTMENTS (Fair Value): |
||||||||||||||||||||
| Domestic Equity Securities* |
$ | 423,217,557 | $ | — | $ | — | $ | 423,217,557 | ||||||||||||
| Foreign Equity Securities* |
8,787,024 | — | — | 8,787,024 | ||||||||||||||||
| Domestic Preferred Equity Securities* |
187,490,216 | — | — | 187,490,216 | ||||||||||||||||
| Domestic Corporate Bonds* |
— | 1,144,860 | — | 1,144,860 | ||||||||||||||||
| Commercial Paper* |
— | 376,420,433 | — | 376,420,433 | ||||||||||||||||
| U.S. Government Obligations |
— | 49,967,109 | — | 49,967,109 | ||||||||||||||||
| Money Market Funds |
10,371,371 | — | — | 10,371,371 | ||||||||||||||||
|
|
|
|
|
|
|
|
|
|||||||||||||
| TOTAL INVESTMENTS |
$ | 629,866,168 | $ | 427,532,402 | $ | — | $ | 1,057,398,570 | ||||||||||||
|
|
|
|
|
|
|
|
|
|||||||||||||
| * Industry classifications for these categories are detailed in the Schedule of Investments. |
|
|||||||||||||||||||
| THE INCOME FUND ASSETS: |
||||||||||||||||||||
| INVESTMENTS (Fair Value): |
||||||||||||||||||||
| Domestic Preferred Equity Securities |
||||||||||||||||||||
| Oil & Natural Gas Exploration |
$ | 752,884 | $ | 1,509,754 | $ | — | $ | 2,262,638 | ||||||||||||
| Other Industries* |
10,721,049 | — | — | 10,721,049 | ||||||||||||||||
| Domestic Corporate Bonds* |
— | 10,502,882 | — | 10,502,882 | ||||||||||||||||
| Commercial Paper* |
— | 144,394,248 | — | 144,394,248 | ||||||||||||||||
| U.S. Government Obligations |
— | 8,996,830 | — | 8,996,830 | ||||||||||||||||
| Money Market Funds |
2,413,600 | — | — | 2,413,600 | ||||||||||||||||
|
|
|
|
|
|
|
|
|
|||||||||||||
| TOTAL INVESTMENTS |
$ | 13,887,533 | $ | 165,403,714 | $ | — | $ | 179,291,247 | ||||||||||||
|
|
|
|
|
|
|
|
|
|||||||||||||
| * Industry classifications for these categories are detailed in the Schedule of Investments. |
|
|||||||||||||||||||
35
FAIRHOLME FUNDS, INC.
NOTES TO FINANCIAL STATEMENTS (continued)
November 30, 2019
| Valuation Inputs | |||||||||||||||||||||||||||||||||||
| Level 1 – Quoted Prices |
Level 2 –Other Significant Observable Inputs |
Level 3 - Significant Unobservable Inputs |
Total Fair Value at 11/30/19 | ||||||||||||||||||||||||||||||||
| THE ALLOCATION FUND ASSETS: |
|||||||||||||||||||||||||||||||||||
| INVESTMENTS (Fair Value): |
|||||||||||||||||||||||||||||||||||
| Domestic Equity Securities |
|||||||||||||||||||||||||||||||||||
| Real Estate Management & Development |
$ | — | $ | 6,404,630 | $ | — | $ | 6,404,630 | |||||||||||||||||||||||||||
| Foreign Equity Securities* |
2,806,467 | — | — | 2,806,467 | |||||||||||||||||||||||||||||||
| Domestic Preferred Equity Securities |
|||||||||||||||||||||||||||||||||||
| Mortgage Finance |
9,264,426 | — | — | 9,264,426 | |||||||||||||||||||||||||||||||
| Oil & Natural Gas Exploration |
— | 714,222 | — | 714,222 | |||||||||||||||||||||||||||||||
| Commercial Paper* |
— | 34,663,812 | — | 34,663,812 | |||||||||||||||||||||||||||||||
| U.S. Government Obligations |
— | 2,998,943 | — | 2,998,943 | |||||||||||||||||||||||||||||||
| Money Market Funds |
2,152,344 | — | — | 2,152,344 | |||||||||||||||||||||||||||||||
|
|
|
|
|
|
|
|
|
||||||||||||||||||||||||||||
| TOTAL INVESTMENTS |
$ | 14,223,237 | $ | 44,781,607 | $ | — | $ | 59,004,844 | |||||||||||||||||||||||||||
|
|
|
|
|
|
|
|
|
||||||||||||||||||||||||||||
* Industry classifications for these categories are detailed in the Schedule of Investments.
There were no Level 3 investments for any of the Funds at November 30, 2019.
Dividends and Distributions: Each Fund records dividends and distributions to its shareholders on the ex-dividend date. The Fairholme Fund and The Allocation Fund intend to distribute substantially all of their net investment income (if any) as dividends to their respective shareholders on an annual basis in December. The Income Fund intends to declare and pay net investment income distributions, if any, quarterly in March, June, September, and December. The Funds intend to distribute any net long-term capital gains and any net short-term capital gains at least once a year. If the total dividends and distributions made in any tax year exceeds net investment income and accumulated realized capital gains, a portion of the total distribution may be treated as a tax return of capital.
Foreign Currency Translation: The books and records of the Funds are maintained in U.S. dollars. Foreign currency amounts are translated into U.S. dollars on the following basis: (i) fair value of investment securities, assets, and liabilities at the current rate of exchange; and (ii) purchases and sales of investment securities, income, and expenses at the relevant rates of exchange prevailing on the respective dates of such transactions. The Funds do not isolate that portion of gains and losses on investment securities which is due to changes in the foreign exchange rates from that which is due to changes in the market prices of such securities.
Estimates: The preparation of financial statements in conformity with U.S. GAAP requires the Funds to make estimates and assumptions that affect the reported amounts of assets and liabilities and disclosure of contingent assets and liabilities at the date of the financial statements and the reported amounts of increases and decreases in net assets from operations during the reported period. Actual results could differ from those estimates.
Redemption Fee: The Fairholme Fund and The Allocation Fund assess a 2% fee on the proceeds of The Fairholme Fund and The Allocation Fund shares that are redeemed or exchanged within 60 days of their purchase. The redemption fee is paid to The Fairholme Fund and The Allocation Fund, as applicable, for the benefit of remaining shareholders and is recorded as paid-in capital. The redemption fees retained by The Fairholme Fund and The Allocation Fund during the fiscal years ended November 30, 2019 and 2018, amounted to $37,027 and $33,620, and $2,187 and $285, respectively.
36
FAIRHOLME FUNDS, INC.
NOTES TO FINANCIAL STATEMENTS (continued)
November 30, 2019
During the year ended November 30, 2019, The Fairholme Fund and The Fairholme Allocation Fund delivered portfolio securities and cash in exchange for shares redeemed by shareholders in in-kind redemptions. For financial reporting purposes, the Fund recognized a net gain on the transfer of securities; however, for tax purposes the transaction was treated as a tax free exchange and the gain has been reclassified from undistributed realized gain (loss) to paid-in capital. The Fairholme Fund and The Fairholme Allocation Fund realized $1,334,463 and $1,061,539 of net gains attributable to the in-kind redemption, respectively.
Other: The Funds account for security transactions on the trade date for financial statement purposes. The specific identification method is used for determining gains or losses for financial statements and income tax purposes. Dividend income is recorded on the ex-dividend date net of foreign taxes withheld where recovery is uncertain and interest income is recorded on an accrual basis. Discounts and premiums on securities purchased are amortized over the life of the respective securities using the effective yield method. Securities denominated in currencies other than U.S. dollars are subject to changes in value due to fluctuation in exchange rates. The Funds may invest in countries that require governmental approval for the repatriation of investment income, capital, or the proceeds of sales of securities by foreign investors. In addition, if there is deterioration in a country’s balance of payments or for other reasons, a country may impose temporary restrictions on foreign capital remittances abroad.
The Funds paid commissions and other brokerage fees during the period. The Funds also paid legal expenses in connection with certain of their investments.
Note 3. Related Party Transactions
The Manager is a Delaware limited liability company and is registered with the SEC as an investment adviser. The Manager’s principal business is to provide investment management and advisory services to individuals, corporations, and other institutions throughout the world. Pursuant to an Investment Management Agreement, each Fund pays a management fee to the Manager for its provision of investment advisory and operating services to the Fund. Subject to applicable waivers or limitations, the management fee is paid at an annual rate equal to 1.00% of the daily average net assets of each Fund. Effective January 1, 2018, the Manager has agreed to waive, on a voluntary basis, a portion of the management fees of The Fairholme Fund, The Income Fund, and The Allocation Fund to the extent necessary to limit the management fee of each Fund to the annual rate of 0.80% of that Fund’s daily average net asset value (“Undertaking”). This Undertaking may be terminated by the Manager upon 60 days’ written notice to the applicable Fund. The Manager is responsible pursuant to the Investment Management Agreement for paying each Fund’s expenses for the following services: transfer agency, fund accounting, fund administration, custody, legal, audit, compliance, directors’ fees, call center, fulfillment, travel, insurance, rent, printing, postage and other office supplies. The Manager is not responsible for paying for the following costs and expenses of each Fund: commissions, brokerage fees, issue and transfer taxes, and other costs chargeable to the Fund in connection with securities transactions or in connection with securities owned by each Fund, taxes, interest, acquired fund fees and related expenses, expenses in connection with litigation by or against each Fund, and any other extraordinary expenses.
The Manager earned, after the voluntary reduction of the management fees, $8,752,588, $1,499,287, and $577,018, from The Fairholme Fund, The Income Fund, and The Allocation Fund, respectively, for its services during the fiscal year ended November 30, 2019.
Bruce Berkowitz, both the Chief Investment Officer of the Manager and Chairman of the Funds’ Board, and his affiliates beneficially own an aggregate 10,784,408 shares, 6,691,382 shares, and 4,382,931 shares of The Fairholme Fund, The Income Fund, and The Allocation Fund, respectively, at November 30, 2019.
A Director and Officers of the Funds are also Officers of the Manager or its affiliates.
Note 4. Investments
For the fiscal year ended November 30, 2019, aggregated purchases and sales of investment securities other than short-term investments, redemptions in-kind of Fund shares and U.S. government obligations were as follows:
37
FAIRHOLME FUNDS, INC.
NOTES TO FINANCIAL STATEMENTS (continued)
November 30, 2019
| Purchases | Sales | |||||||||||
| The Fairholme Fund |
$ | 54,775,873 | $ | 206,839,163 | ||||||||
| The Income Fund |
9,254,225 | 62,819,267 | ||||||||||
| The Allocation Fund |
3,879,690 | 8,562,546 | ||||||||||
Note 5. Tax Matters
Federal Income Taxes: Each Fund intends to qualify each year as a “regulated investment company” under Subchapter M of the Internal Revenue Code of 1986, as amended. By so qualifying, each Fund will not be subject to federal income taxes to the extent that it distributes all of its net investment income and any realized capital gains.
For U.S. federal income tax purposes, the cost of securities owned, gross unrealized appreciation, gross unrealized depreciation, and net unrealized depreciation of investments at November 30, 2019, were as follows:
| Cost | Gross Unrealized Appreciation |
Gross Unrealized Depreciation |
Net Unrealized Depreciation |
|||||||||||||||||||||||||
| The Fairholme Fund |
$ | 1,271,004,168 | $ | 112,207,788 | $ | (325,813,386) | $ | (213,605,598) | ||||||||||||||||||||
| The Income Fund |
198,231,032 | 4,494,780 | (23,434,565) | (18,939,785) | ||||||||||||||||||||||||
| The Allocation Fund |
78,838,838 | 5,537,669 | (25,371,663) | (19,833,994) | ||||||||||||||||||||||||
The difference between book basis and tax basis for The Fairholme Fund’s net unrealized depreciation is attributable to the tax deferral of losses on wash sales and capitalized cost. The difference between book basis and tax basis for The Income Fund’s and The Allocation Fund’s net unrealized depreciation is attributable to capitalized cost.
The Funds’ tax basis capital gains are determined only at the end of each fiscal year. As of November 30, 2019 the components of distributable earnings on a tax basis were as follows:
| The Fairholme Fund | The Income Fund | The Allocation Fund | |||||||||||||||||||||||
| Undistributed Ordinary Income |
$ | 9,052,579 | $ | 619,274 | $ | 796,310 | |||||||||||||||||||
| Capital Loss carryforwards |
(747,040,928) | (5,997,101) | (48,213,545) | ||||||||||||||||||||||
| Net Unrealized Appreciation/(Depreciation) on Investments and Foreign Currency Related Transactions |
(213,605,598) | (18,939,785) | (19,833,994) | ||||||||||||||||||||||
|
|
|
|
|
|
|
||||||||||||||||||||
| Total |
$ | (951,593,947) | $ | (24,317,612) | $ | (67,251,229) | |||||||||||||||||||
|
|
|
|
|
|
|
||||||||||||||||||||
The Funds are permitted to carry forward for an unlimited period capital losses incurred to reduce future required distributions of net capital gains to shareholders. Capital losses that are carried forward will retain their character as either short-term or long-term capital losses. As of November 30, 2019, net short-term and long-term capital loss carryforwards were as follows:
| The Fairholme Fund | The Income Fund | The Allocation Fund | |||||||||||||||||||||||
| Short-term capital loss carryforward |
$ | 771,446 | — | $ | 287,406 | ||||||||||||||||||||
| Long-term capital loss carryforward |
746,269,482 | $ | 5,997,101 | 47,926,139 | |||||||||||||||||||||
|
|
|
|
|
|
|
||||||||||||||||||||
| Total |
$ | 747,040,928 | $ | 5,997,101 | $ | 48,213,545 | |||||||||||||||||||
|
|
|
|
|
|
|
||||||||||||||||||||
For the fiscal year ended November 30, 2019, The Fairholme Fund, The Income Fund, and The Allocation Fund utilized capital loss carryforwards of $4,371,254, $1,965,235, and $450,101, respectively.
The Manager has analyzed the Funds’ tax positions taken on tax returns for all open tax years (current and prior three tax years) and has concluded that there are no uncertain tax positions that require recognition of a tax liability. The Funds’ federal and state income and federal excise tax returns for tax years for which the applicable statutes of limitations have not expired
38
FAIRHOLME FUNDS, INC.
NOTES TO FINANCIAL STATEMENTS (continued)
November 30, 2019
(the current year and prior three years) are subject to examination by the Internal Revenue Service and state departments of revenue. Additionally, the Funds are not aware of any tax position for which it is reasonably possible that the total amounts of unrecognized tax benefits will change materially in the next twelve months.
Note 6. Dividends and Distributions to Shareholders
Ordinary income and capital gain distributions are determined in accordance with federal income tax regulations, which may differ from U.S. GAAP.
The tax character of dividends and distributions paid by each Fund were as follows:
| The Fairholme Fund | |||||||||||||||
| For the Fiscal Year Ended November 30, 2019 |
For the Fiscal Year Ended November 30, 2018 | ||||||||||||||
| Dividends and Distributions paid from: |
|||||||||||||||
| Ordinary Income |
$ | 22,053,111* | $ | 24,854,774 | |||||||||||
|
|
|
|
|
||||||||||||
| * | Total distributions paid differs from the Statement of Changes in Net Assets due to the utilization of equalization. |
| The Income Fund | |||||||||||||||
| For the Fiscal Year Ended November 30, 2019 |
For the Fiscal Year Ended November 30, 2018 | ||||||||||||||
| Dividends and Distributions paid from: |
|||||||||||||||
| Ordinary Income |
$ | 5,286,649 | $ | 11,237,769 | * | ||||||||||
| Long-Term Capital Gain |
— | 9,232,843 | |||||||||||||
|
|
|
|
|
||||||||||||
| $ | 5,286,649 | $ | 20,470,612 | ||||||||||||
|
|
|
|
|
||||||||||||
| * | Inclusive of short-term capital gains. |
| The Allocation Fund | |||||||||||||||
| For the Fiscal Year Ended November 30, 2019 |
For the Fiscal Year Ended November 30, 2018 | ||||||||||||||
| Dividends and Distributions paid from: |
|||||||||||||||
| Ordinary Income |
$ | 791,785 | $ | 1,817,020 | |||||||||||
|
|
|
|
|
||||||||||||
The Funds declared and made payable the following distributions on December 13, 2019.
| The Fairholme Fund | The Income Fund | The Allocation Fund | |||||||||||||||||||||||
| Dividends and Distributions paid from: |
|||||||||||||||||||||||||
| Ordinary Income |
$ | 9,053,098 | $ | 792,040 | $ | 820,275 | |||||||||||||||||||
Note 7. Reclassification in the Capital Accounts
In accordance with U.S. GAAP, each Fund has recorded reclassifications in its capital account. These reclassifications have no impact on the net asset value of each Fund and are designed generally to present undistributed income and realized gains on a tax basis which is considered to be more informative to the shareholder. Permanent differences were primarily due to the
39
FAIRHOLME FUNDS, INC.
NOTES TO FINANCIAL STATEMENTS (continued)
November 30, 2019
disallowance of certain non-tax deductible expenses for the Fund. As of November 30, 2019, each Fund recorded the following reclassifications to increase (decrease) the accounts listed below:
| The Fairholme Fund | The Income Fund | The Allocation Fund | |||||||||||||
| Total accumulated losses |
$ | (1,335,097) | $ | 0 | $ | (1,061,539) | |||||||||
|
Paid-in-Capital |
1,335,097 | 0 | 1,061,539 | ||||||||||||
Note 8. Transactions in Shares of Affiliates
Portfolio companies in which The Fairholme Fund owns 5% or more of the outstanding voting securities of the issuer are considered affiliates of The Fairholme Fund. The aggregate fair value of all securities of affiliates held by The Fairholme Fund as of November 30, 2019 amounted to $430,739,480, representing approximately 40.77% of The Fairholme Fund’s net assets.
Transactions in The Fairholme Fund during the fiscal year ended November 30, 2019, in which the issuer of the security was an affiliate are as follows:
| November 30, 2018 | Gross Additions | Gross Deductions | November 30, 2019 | |||||||||||||||||||||||||||||||||||||
| Shares/ Par Value | Shares/ Par Value |
Shares/ Par Value |
Shares/ Par Value |
Fair Value | Realized Gain (Loss) |
Investment Income |
Change in Unrealized Appreciation | |||||||||||||||||||||||||||||||||
| Imperial Metals Corp. |
7,027,352 | — | 161,585 | 6,865,767 | $ | 8,787,024 | $ | (708,075) | $ | — | $ | 3,374,605 | ||||||||||||||||||||||||||||
| The St. Joe Co. |
22,730,687 | — | 522,663 | 22,208,024 | 421,952,456 | 1,021,231 | — | 89,101,843 | ||||||||||||||||||||||||||||||||
| Imperial Metals Corp. 7.000%, 09/15/2019(a) |
$ | 143,223,000 | $ | — | $ | 143,223,000 | $ | — | — | 1,335 | 7,897,101 | 42,598,704 | ||||||||||||||||||||||||||||
|
|
|
|
|
|
|
|
|
|||||||||||||||||||||||||||||||||
| Total |
$ | 430,739,480 | $ | 314,491 | $ | 7,897,101 | $ | 135,075,152 | ||||||||||||||||||||||||||||||||
|
|
|
|
|
|
|
|
|
|||||||||||||||||||||||||||||||||
| (a) | Security was no longer held in the portfolio at November 30, 2019. |
Note 9. Indemnifications
Under the Company’s organizational documents, its Officers and Directors are indemnified against certain liabilities arising out of the performance of their duties to the Funds. In the normal course of business the Company or the Funds enter into contracts that contain a variety of representations and customary indemnifications. The Funds’ maximum exposure under these arrangements is unknown as this would involve future claims that may be made against the Funds that have not yet occurred. However, based on their experience to date, the Funds expect the risk of loss to be remote.
Note 10. Subsequent Events
Management has evaluated the impact on the Funds of all subsequent events occurring through the date the financial statements were issued and has determined that there were no subsequent events requiring recognition or disclosure in the financial statements.
Note 11. Legal Proceedings
On April 17, 2019, Sears Holdings Corporation, Sears Roebuck and Co., Sears Development Co., Kmart Corporation and Kmart of Washington LLC commenced an adversary proceeding in the United States Bankruptcy Court for the Southern District of New York against Edward Scott “Eddie” Lampert; ESL Investments, Inc.; RBS Partners LP; CRK Partners LLC; SPE Master I L.P.; ESL Partners L.P.; SPE I Partners L.P.; RBS Investment Management LLC; ESL Institutional Partners L.P.; ESL Investors, L.L.C.; JPP LLC; JPP II LLC; Fairholme Capital Management, L.L.C.; Cesar L. Alvarez; Bruce Berkowitz; Alesia Haas; Kunal Kamlani; Steven Mnuchin; Thomas J. Tisch; Seritage Growth Properties, Inc.; Seritage Growth Properties, L.P.; Seritage KMT Mezzanine Finance LLC; Seritage SRC Mezzanine Finance LLC; Seritage KMT Finance LLC; Seritage SRC Finance LLC; Seritage GS Holdings LLC; Seritage SPS Holdings LLC; and Seritage MS Holdings LLC. On November 25, 2019, the plaintiffs filed an amended complaint, adding the Company and other parties not affiliated with the Manager or the Company as additional defendants and asserting new causes of action against the defendants.
40
FAIRHOLME FUNDS, INC.
NOTES TO FINANCIAL STATEMENTS (continued)
November 30, 2019
Plaintiffs assert avoidance and other claims against certain defendants, including the Manager, for participation in two Sears corporate transactions: (i) the Lands’ End spinoff; and (ii) the Seritage rights offering. The avoidance claims against the Manager include claims for the avoidance of consideration received by The Fairholme Fund and The Allocation Fund from Sears Holdings Corp. in connection with the Lands’ End spinoff and Seritage rights offering that were allegedly actual and/or constructive fraudulent transfers. In the amended complaint, plaintiffs also assert avoidance and other claims seeking to recover amounts allegedly received by the Company from alleged related-party transactions with Sears and seek to avoid the release received by certain of the defendants, including the Manager and the Company, in connection with the Seritage derivative action. Plaintiffs also assert claims for breach of fiduciary duty and aiding and abetting breach of fiduciary duty arising out of certain related-party transactions against certain Defendants, including the Manager and Bruce Berkowitz, and seek to subordinate the bankruptcy claims of the Company, the Manager and Bruce Berkowitz.
Although the Manager and the Company believe that they have strong defenses to the foregoing complaint and intend to defend themselves vigorously against the allegations in the complaint, neither the Manager nor the Company is in a position to express an opinion about the ultimate outcome of the litigation or the range of potential loss, if any.
41
REPORT OF INDEPENDENT REGISTERED PUBLIC ACCOUNTING FIRM
To the Board of Directors of Fairholme Funds, Inc. and Shareholders of The Fairholme Fund, The Fairholme Focused Income Fund, and The Fairholme Allocation Fund:
Opinion on the Financial Statements and Financial Highlights
We have audited the accompanying statements of assets and liabilities of Fairholme Funds, Inc. (the “Funds”) comprising The Fairholme Fund, The Fairholme Focused Income Fund, and The Fairholme Allocation Fund, including the schedules of investments as of November 30, 2019, the related statements of operations for the year then ended, the statements of changes in net assets for each of the two years in the period then ended, the financial highlights for each of the five years in the period then ended, and the related notes. In our opinion, the financial statements and financial highlights present fairly, in all material respects, the financial position of each of the funds constituting Fairholme Funds, Inc. as of November 30, 2019, and the results of their operations for the year then ended, the changes in their net assets for each of the two years in the period then ended, and the financial highlights for each of the five years in the period then ended in conformity with accounting principles generally accepted in the United States of America.
Basis for Opinion
These financial statements and financial highlights are the responsibility of the Funds’ management. Our responsibility is to express an opinion on the Funds’ financial statements and financial highlights based on our audits. We are a public accounting firm registered with the Public Company Accounting Oversight Board (United States) (PCAOB) and are required to be independent with respect to the Funds in accordance with the U.S. federal securities laws and the applicable rules and regulations of the Securities and Exchange Commission and the PCAOB.
We conducted our audits in accordance with the standards of the PCAOB. Those standards require that we plan and perform the audit to obtain reasonable assurance about whether the financial statements and financial highlights are free of material misstatement, whether due to error or fraud. The Funds are not required to have, nor were we engaged to perform, an audit of their internal control over financial reporting. As part of our audits we are required to obtain an understanding of internal control over financial reporting but not for the purpose of expressing an opinion on the effectiveness of the Funds’ internal control over financial reporting. Accordingly, we express no such opinion.
Our audits included performing procedures to assess the risks of material misstatement of the financial statements and financial highlights, whether due to error or fraud, and performing procedures that respond to those risks. Such procedures included examining, on a test basis, evidence regarding the amounts and disclosures in the financial statements and financial highlights. Our audits also included evaluating the accounting principles used and significant estimates made by management, as well as evaluating the overall presentation of the financial statements and financial highlights. Our procedures included confirmation of securities owned as of November 30, 2019, by correspondence with the custodian and brokers. We believe that our audits provide a reasonable basis for our opinion.
/s/ DELOITTE & TOUCHE LLP
Boston, Massachusetts
January 29, 2020
We have served as the auditor of one or more Fairholme Funds, Inc. investment companies since 2004.
42
FAIRHOLME FUNDS, INC.
November 30, 2019
Board of Directors (unaudited)
The Board of Directors has overall responsibility for conduct of the Company’s affairs. The day-to-day operations of the Fund are managed by the Manager, subject to the By-Laws of the Company and review by the Company’s Board. The Directors and Officers of the Company, including those Directors who are also officers, are listed below.
| Name, Age & Address† |
Position(s) Held, Term of Office & Length of Time Served** |
Principal Occupation(s) During Past 5 Years§ |
Number of Portfolios in Fund Complex Overseen by Director |
Other Current Directorships Held by Director | ||||||
|
Interested Directors and Officers |
||||||||||
| Bruce R. Berkowitz* Age 61 |
Mr. Berkowitz has served as a Director of the Company since December 15, 1999. | Manager, Fairholme Holdings LLC since January 2015 and Chief Investment Officer, Fairholme Capital Management, L.L.C. since October 1997; Managing Member, Fairholme Capital Management, L.L.C. from October 1997 to December 2014. | 3 | Director and Chairman of the Board of Directors, The St. Joe Co.; Chief Executive Officer, Director and Chairman of the Board of Directors, Fairholme Trust Company, LLC (until September 2019); and Director, Sears Holdings Corporation (until October 2017). | ||||||
| Cesar L. Alvarez, Esq.*†† Age 72 |
Mr. Alvarez has served as a Director of the Company since May 19, 2008. | Senior Chairman of Greenberg Traurig, LLP since January 1, 2016; Executive Chairman and Co-Chairman from 2010 to 2015; and Chief Executive Officer from 1997 to 2010. | 3 | Chairman, Board of Directors, Mednax, Inc.; Director, Intrexon Corp.; Director, The St. Joe Co.; Vice Chairman, Board of Directors, Watsco, Inc.; Director, Fairholme Trust Company, LLC (until September 2019); and Director, Sears Holdings Corporation (until May 2017) | ||||||
| Howard S. Frank*†† Age 78 |
Mr. Frank has served as a Director of the Company since May 7, 2007. | Chairman of the Board of Costa Crociere S.p.A. since 2014; Special Advisor to the CEO and to the Chairman of Carnival Corporation & plc. since 2013; and Special Advisor to the President of Costa Crociere. | 3 | Director, New World Symphony; and Director, The St. Joe Co. | ||||||
|
Independent Directors^ | ||||||||||
| Terry L. Baxter Age 74 |
Mr. Baxter has served as a Director of the Company since May 19, 2008. | Chairman of the Board, CEO, Source One (retired); President of White Mountain Holdings (retired). | 3 | Director, Main Street America Group (until October 2018) | ||||||
| Steven J. Gilbert Age 72 |
Mr. Gilbert has served as a Director of the Company since June 16, 2014 | Chairman, Gilbert Global Equity Partners, L.P. since 1998; Vice Chairman, MidOcean Equity Partners, L.P. since 2005; Co-Chairman, Birch Grove Capital since 2013; Senior Managing Director and Chairman, Sun Group (USA) from 2007 to 2009. | 3 | Chairman, TRI Pointe Homes, Inc.; Lead Independent Director, Empire State Realty Trust; Director, Oaktree Capital Group; Director, MBIA, Inc.; Director, Florida Food Products, Inc.; Director, Waterpik, Inc. (until 2018); Chairman CPM Holdings, Inc. (until December 2018) and Director, Trade Informatics, Inc. (until March 2016) | ||||||
| Avivith Oppenheim, Esq.†† Age 69 |
Ms. Oppenheim has served as a Director of the Company since December 15, 1999. | Attorney-at-Law. | 3 | None. | ||||||
| Leigh Walters, Esq. Age 73 |
Mr. Walters has served as a Director of the Company since December 15, 1999. | Vice-President and Director, Valcor Engineering Corporation. Attorney-at-Law. | 3 | Director, Valcor Engineering Corporation | ||||||
† Unless otherwise indicated, the address of each Director is c/o Fairholme Capital Management, L.L.C., 2601 NE 2nd Avenue, Miami, FL 33137.
^ Independent Directors are not “interested persons” of the Company, as defined in the 1940 Act (“Independent Directors”).
†† Ms. Oppenheim and Messrs. Alvarez and Frank will retire as Directors of the Company effective February 15, 2020.
43
FAIRHOLME FUNDS, INC.
ADDITIONAL INFORMATION (continued)
November 30, 2019
* Each of Mr. Berkowitz and Mr. Alvarez is an “interested person” of the Company (“Interested Director”), as defined in the 1940 Act, because of his affiliation with the Manager. Mr. Frank is deemed to be an Interested Director because of his material relationship with a Portfolio Company of which a Fund currently has “control,” as defined in the 1940 Act.
| ** | Each Director serves for an indefinite term. Each officer serves for an annual term and until his or her successor is elected and qualified. |
| § | The information reported includes the principal occupation during the last five years or longer for each Director and other information relating to the professional experiences, attributes and skills relevant to each Director’s qualifications to serve as Director. |
Officers (unaudited)
| Name, Age & Address† | Position(s) Held with the Company |
Term of Office & Length of Time Served* |
Principal Occupation(s) During Past 5 Years | |||||
| Fernando Font Age 45 |
Vice President | Mr. Font has served as Vice President of the Company since June 2015. | Chief Administrative Officer of Fairholme Capital Management, L.L.C. since August 2009. | |||||
| Wayne Kellner Age 50 |
Treasurer | Mr. Kellner has served as Treasurer of the Company since March 2012. | President, Fairholme Holdings L.L.C since January 2017; Chief Operating Officer, Fairholme Capital Management, L.L.C. since June 2014; and Chief Financial Officer, Fairholme Capital Management, L.L.C. since January 2012. | |||||
| Paul R. Thomson†† Age 63 |
Chief Compliance Officer and Secretary | Mr. Thomson has served as Chief Compliance Officer of the Company since April 2010 and has served as Secretary of the Company since June 2011. | Chief Compliance Officer, Fairholme Capital Management L.L.C. since April 2010; Chief Financial Officer, Fairholme Capital Management L.L.C. from January 2008 to January 2012. |
| † | Unless otherwise indicated, the address of each officer identified above is c/o Fairholme Capital Management, L.L.C., 2601 NE 2nd Avenue, Miami, FL 33137. |
| * | Each officer serves for an annual term and until his or her successor is elected and qualified. |
| †† | Mr. Thomson will resign as Chief Compliance Officer and Secretary of the Company and Chief Compliance Officer of the Manager effective February 1, 2020. |
44
FAIRHOLME FUNDS, INC.
ADDITIONAL INFORMATION (continued)
November 30, 2019
Approval of Investment Management Agreement (unaudited)
At its meeting on October 24, 2019, the Board of Directors (the “Board” or the “Directors”) of Fairholme Funds, Inc. (the “Company”) approved the renewal of each of the investment management agreements (each an “Agreement” and collectively, the “Agreements”) between the Company, on behalf of each of The Fairholme Fund (“The Fairholme Fund”), The Fairholme Focused Income Fund (“The Income Fund”) and The Fairholme Allocation Fund (“The Allocation Fund”) (each a “Fund” and collectively, the “Funds”), and Fairholme Capital Management, L.L.C. (the “Manager”). In determining whether to approve the renewal of the Agreements, the Directors reviewed and considered the factors discussed below, and information made available to them at and in connection with the meeting relating to such factors, and other information the Directors deemed relevant. The Directors did not identify any particular information that was all-important or controlling.
A. Nature, Extent and Quality of Services
The Directors considered information provided to them concerning the services performed by the Manager for each Fund pursuant to the respective Agreement. The Directors reviewed information concerning the nature, extent and quality of investment advisory and operational services provided, or overseen, by the Manager. The Directors reviewed information concerning the personnel responsible for the day-to-day portfolio and administrative management of each Fund, the overall reputation of the Manager and the Manager’s current and planned staffing levels. The Directors considered the Manager’s commitment to each Fund as evidenced by, among other things, the current share ownership of each Fund by management/owners/employees of the Manager. The Directors also considered information describing the Manager’s compliance policies and procedures, including its ongoing reviews of and updates to those policies. They also discussed the Manager’s ongoing reviews of policies designed to address each Fund’s compliance with its respective investment objective, policies and restrictions, applicable regulatory requirements and potential conflicts of interest relating to the Manager’s providing services to the Funds and other advisory clients.
The Directors determined that it would not be appropriate to compare services provided by the Manager to each Fund with the services provided by the Manager to its other advisory accounts because such accounts are not subject to the same regulatory requirements as the Funds, may have different investment restrictions, holdings and goals than the Funds and require different levels of client and back-office servicing than the Funds.
The Directors concluded that the nature, extent and quality of services provided by the Manager to each Fund were appropriate and sufficient to support renewal of the Agreements.
B. Investment Performance
The Directors considered information regarding each Fund’s performance and the Manager’s views on performance. The Directors also considered, with respect to each Fund, the holdings of the Fund that contributed negatively and positively to its performance, and the Manager’s views of the investment rationale and outlook for the Fund’s portfolio. They also discussed the Manager’s long-term, focused investment approach, noting that such an approach exhibits the entrepreneurial nature of the Manager’s efforts and associated rewards.
The Fairholme Fund
The Directors considered information about the short- and long-term investment performance of The Fairholme Fund, including information comparing The Fairholme Fund’s cumulative and annualized performance with the comparable performance of the S&P 500 Index, its benchmark, for the 1-year, 3-year, 5-year, 10-year and since-inception periods ended August 31, 2019. The Directors also reviewed and considered a third-party report (the “third party report”) from Lipper/Broadridge (“Lipper”) comparing The Fairholme Fund’s annualized performance with the annualized performance of its Lipper peer group for the 1-year, 3-year, 5-year, 10-year and since inception periods ended August 31, 2019. They noted that the Fairholme Fund’s annualized performance for the 1-year ended August 31, 2019 exceeded, (a) both the average and median annualized performance of its Lipper peer group, and (b) the performance of the S&P 500 Index. However, the Fairholme Fund’s annualized performance
45
FAIRHOLME FUNDS, INC.
ADDITIONAL INFORMATION (continued)
November 30, 2019
for the 3-year, 5-year and 10-year periods ended August 31, 2019 lagged (a) both the average and median annualized performance of its Lipper peer group, and (b) the performance of the S&P 500 Index. The Fairholme Fund’s annualized performance since inception through August 31, 2019 exceeded both the average performance of its Lipper peer group and the S&P 500 Index, but lagged the median performance of its Lipper peer group for that period.
The Income Fund
The Directors considered information about the short- and long-term investment performance of The Income Fund, including information comparing The Income Fund’s performance to that of the Bloomberg Barclays U.S. Aggregate Bond Index (the “Bloomberg Barclays Bond Index”), its benchmark, for the 1-year, 3-year, 5-year and since inception periods ended August 31, 2019. The Directors also reviewed information reflecting The Income Fund’s performance relative to its Lipper peer group’s average and median annualized performance for the same periods. The Directors noted the Income Fund’s annualized performance exceeded both (a) the average annualized performance of its Lipper peer group, and (b) the performance of the Bloomberg Barclays U.S. Aggregate Bond Index for the 3-year, 5-year and since inception periods ended August 31, 2019. In the same periods the Income Fund’s annualized performance exceeded the median of its Lipper peer group for the 3-year period ended August 31, 2019, lagged the median for the 5-year period, and equally the median for the period since inception. The Income Fund’s annualized performance for the 1-year period ended August 31, 2019 lagged both (a) the average and median annualized performance of its Lipper peer group, and (b) the performance of the Bloomberg Barclays U.S. Aggregate Bond Index.
The Allocation Fund
The Directors considered information about the short- and long-term investment performance of The Allocation Fund, including information reflecting the performance of The Allocation Fund relative to the annualized performance of both the Bloomberg Barclays Bond Index and the S&P 500 Index for the 1-year, 3-year, 5-year and since inception periods ended August 31, 2019. The Directors also reviewed information reflecting The Allocation Fund’s performance relative to the average and median annualized performance of its Lipper peer group for the same periods. The Directors noted the Allocation Fund’s annualized performance for the 3-year, 5-year, and since inception periods ended August 31, 2019 lagged both (a) the average and median annualized performance of its Lipper peer group, and (b) the S&P 500 Index and Bloomberg Barclays U.S. Aggregate Bond Index. It was also noted that the Allocation Fund’s annualized performance for the 1-year ended August 31, 2019 exceeded both (a) the average and median annualized performance of its Lipper peer group, and (b) the S&P 500 Index, however it lagged the performance of the Bloomberg Barclays U.S. Aggregate Bond Index in that same period.
As to each Fund, the Directors considered information provided to them concerning the performance of the Fund in light of market events and industry trends that have continued throughout the last year, the Manager’s views on the availability of investment opportunities, and other factors affecting the Fund’s performance. The Directors also considered information about developments affecting specific issuers of assets held in the Fund portfolios, as well as information about each Fund’s total returns. In considering the performance of the Funds, the Board acknowledged the long-term, focused value-investing strategy employed by the Manager in managing the Funds.
C. Management Fees and Expense Ratios
The Directors considered information about each Fund’s management fees and expense ratios, including information in the third party report comparing each Fund’s management fee and most recent total expense ratio to the management/advisory fees and expense ratios of the Fund’s Lipper peer group.
In evaluating the management fee and expense ratio information, the Directors took into account the demands and complexity of portfolio management for each Fund in light of its investment objective, strategies, current holdings and asset size. The Directors also considered information regarding the Manager’s payment (in some cases from its resources) of certain expenses for the benefit of each Fund, including shareholder account-level expenses associated with certain omnibus accounts. The Directors also reviewed information concerning the fees paid to the Manager by its other advisory accounts.
46
FAIRHOLME FUNDS, INC.
ADDITIONAL INFORMATION (continued)
November 30, 2019
The Directors also considered the Manager’s voluntary undertaking to waive a portion of the investment management fee payable to the Manager by each Fund pursuant to the Fund’s Agreement, and discussed the terms of that undertaking. The Directors concluded that each Fund’s management fee and overall expense ratio were reasonable in light of the services provided by or through the Manager.
D. Profitability
The Directors considered information regarding the estimated profitability of each Fund to the Manager. They considered such profitability in light of each Fund’s assets under management, overall expense ratio and performance, as well as the effect of the Manager’s voluntary fee waiver currently in place and the services provided by or through the Manager. The Directors concluded that the Manager’s estimated profitability was not such as to prevent the Directors from approving the renewal of each Agreement.
E. Economies of Scale
The Directors considered information concerning economies of scale for each Fund, including the current assets of each Fund. The Directors concluded that, for each Fund, no modification to the Fund’s existing arrangements was warranted based on economies of scale.
The Directors, including a majority of the Directors who are not parties to any of the Agreements or interested persons of any such party, concluded, based on their consideration of the foregoing and their evaluation of all of the information they reviewed, that the renewal of the Agreements was in the best interest of the Funds and their shareholders. The Directors noted that their decision was based on an evaluation of the totality of factors and information presented or available to them, and not on any one factor, report, representation or response.
Proxy Voting Policies, Procedures and Records (unaudited)
The Company has adopted policies and procedures that provide guidance and set forth parameters for the voting of proxies relating to securities held in each Fund’s portfolio. A description of these policies and procedures, and records of how each Fund voted proxies relating to its portfolio securities during the most recent twelve month period ended June 30, 2019, are available to you upon request and free of charge by writing to the Fairholme Funds, Inc., c/o BNY Mellon Investment Servicing (US) Inc., P.O. Box 9692, Providence, RI, 02940 or by calling Shareholder Services at (866) 202-2263. They may also be obtained by visiting the SEC website at www.sec.gov. The Company shall respond to all shareholder requests for records within three business days of its receipt of such request by first-class mail or other means designed to ensure prompt delivery.
Quarterly Filing (unaudited)
The Company files a complete schedule of the Funds’ portfolio holdings on Form N-PORT for the fiscal quarters ending February 28 (February 29 during leap year) and August 31. The Forms N-PORT are available on the SEC’s website at www.sec.gov.
47
FAIRHOLME FUNDS, INC.
ADDITIONAL INFORMATION (continued)
November 30, 2019
Shareholder Tax Information (unaudited)
The Fairholme Fund, The Income Fund, and The Allocation Fund reported $22,053,111, $5,286,649, and $791,785 of total distributions paid during the fiscal year ended November 30, 2019.
The information below is reported for the Funds’ fiscal year and not calendar year. Therefore, shareholders should refer to their Form 1099-DIV or other tax information which will be mailed in 2020 to determine the calendar year amounts to be included on their 2019 tax returns. Shareholders should consult their own tax advisors.
Please note that, for the fiscal year ended November 30, 2019, the respective percentages of ordinary income distributions paid by each Fund were reported as follows:
| Distribution Period November 30, 2019 |
The Fairholme Fund | The Income Fund | The Allocation Fund | |||
| Qualified Dividend Income for Individuals |
7.08% | 22.74% | 42.71% | |||
| Dividends Qualifying for the Dividends Received Deduction for Corporations |
7.53% | 22.73% | 43.26% | |||
| Qualifying Interest Income |
39.33% | 54.19% | 78.70% | |||
| U.S. Treasury Securities |
2.64% | 4.43% | 5.63% |
| * | The law varies in each state as to whether and what percentage of dividend income attributable to U.S. Treasury securities is exempt from state and local income tax. It is recommended that you consult your tax advisor to determine if any portion of the dividends you received is exempt from income taxes. |
All information reported is based on financial information available as of the date of this annual report and, accordingly, are subject to change. For each item, it is the intention of the Fund to report the maximum amount permitted under the Internal Revenue Code and the regulations thereunder.
48
This page is not part of the Fairholme Funds, Inc. 2019 Annual Report

| Officers of Fairholme Funds, Inc.
BRUCE R. BERKOWITZ President
FERNANDO M. FONT Vice President
WAYNE KELLNER Treasurer
PAUL R. THOMSON Chief Compliance Officer & Secretary
Board of Directors of Fairholme Funds, Inc.
CESAR L. ALVAREZ, Esq.
TERRY L. BAXTER
BRUCE R. BERKOWITZ
HOWARD S. FRANK
STEVEN J. GILBERT, Esq.
AVIVITH OPPENHEIM, Esq.
LEIGH WALTERS, Esq.
Investment Manager FAIRHOLME CAPITAL MANAGEMENT, L.L.C. 2601 NE 2nd Avenue, Miami, FL 33137
Transfer Agent BNY MELLON INVESTMENT SERVICING (US) INC. 760 Moore Road, King of Prussia, PA 19406
Fund Accountant & Administrator THE BANK OF NEW YORK MELLON 760 Moore Road, King of Prussia, PA 19406
Custodian THE BANK OF NEW YORK MELLON 240 Greenwich Street, New York, NY 10286
Independent Registered Public Accounting Firm DELOITTE & TOUCHE LLP 200 Berkeley Street, Boston, MA 02116
Legal Counsel SEWARD & KISSEL LLP 901 K Street NW, Washington, DC 20001
|
THIS REPORT IS PROVIDED FOR THE GENERAL INFORMATION OF THE SHAREHOLDERS OF FAIRHOLME FUNDS, INC. IT IS NOT INTENDED FOR DISTRIBUTION TO PROSPECTIVE INVESTORS IN THE FUNDS UNLESS PRECEDED OR ACCOMPANIED BY AN EFFECTIVE PROSPECTUS, WHICH CONTAINS MORE INFORMATION ON FEES, CHARGES AND OTHER EXPENSES AND SHOULD BE READ CAREFULLY BEFORE INVESTING OR SENDING MONEY. PAST PERFORMANCE IS NOT A GUARANTEE OF FUTURE RESULTS. SHARES OF THE FUNDS ARE DISTRIBUTED BY FAIRHOLME DISTRIBUTORS, LLC.
Item 2. Code of Ethics.
| (a) | The registrant, as of the end of the period covered by this report, has adopted a code of ethics that applies to the registrant’s principal executive officer, principal financial officer, principal accounting officer or controller, or persons performing similar functions, regardless of whether these individuals are employed by the registrant or a third party. A copy of the registrant’s code of ethics is filed as an Exhibit (a)(1). A copy of the registrant’s code of ethics is filed as Exhibit (a)(1). |
| (b) | Reserved. |
| (c) | Not applicable. |
| (d) | The registrant has not granted any waivers, during the period covered by this report, including an implicit waiver, from a provision of the code of ethics that applies to the registrant’s principal executive officer, principal financial officer, principal accounting officer or controller, or persons performing similar functions, regardless of whether these individuals are employed by the registrant or a third party, that relates to one or more of the items set forth in paragraph (b) of this Item. |
Item 3. Audit Committee Financial Expert.
The registrant’s board of directors has determined that the registrant has at least one audit committee financial expert serving on its audit committee. Steven J. Gilbert is the “audit committee financial expert” and is considered to be “independent” as each term is defined in Item 3 of Form N-CSR.
Item 4. Principal Accountant Fees and Services.
Audit Fees
| (a) | The aggregate fees billed for each of the last two fiscal years for professional services rendered by the principal accountant for the audits of the annual financial statements of each series of the registrant or services that are normally provided by the accountant in connection with statutory and regulatory filings or engagements for those fiscal years were $125,000 in 2018 and $125,000 in 2019. |
Audit-Related Fees
| (b) | The aggregate fees billed in each of the last two fiscal years for assurance and related services by the principal accountant that are reasonably related to the performance of the audit of the |
| financial statements of each series of the registrant and are not reported under paragraph (a) of this Item were $0 in 2018 and $0 in 2019. |
Tax Fees
| (c) | The aggregate fees billed in each of the last two fiscal years for professional services rendered by the principal accountant for tax compliance, tax advice, and tax planning were $42,237 in 2018 and $43,000 in 2019. These fees relate to the preparation and review of the various tax forms of each series of the registrant and also for the review of the dividend and distributions of each series of the registrant. |
All Other Fees
| (d) | The aggregate fees billed in each of the last two fiscal years for products and services provided by the principal accountant, other than the services reported in paragraphs (a) through (c) of this Item were $0 in 2018 and $0 in 2019. |
| (e)(1) | Disclose the audit committee’s pre-approval policies and procedures described in paragraph (c)(7) of Rule 2-01 of Regulation S-X. |
The audit committee has adopted policies and procedures that require the pre-approval by the audit committee of all audit and non-audit services to the registrant by the registrant’s principal accountant, including services provided to any entity affiliated with the registrant to the extent that such services are directly related to the operations or financial reporting of the registrant.
| (e)(2) | The percentage of services described in each of paragraphs (b) through (d) of this Item that were approved by the audit committee pursuant to paragraph (c)(7)(i)(C) of Rule 2-01 of Regulation S-X are as follows: |
(b) 100%
(c) 100%
(d) Not Applicable
| (f) | Not applicable. |
| (g) | The aggregate non-audit fees billed by the registrant’s accountant for services rendered to the registrant, and rendered to the registrant’s investment adviser, and any entity controlling, controlled by, or under common control with the adviser that provides ongoing services to the registrant for each of the last two fiscal years of the registrant were $0 in 2018 and $0 in 2019. |
| (h) | Not applicable. |
Item 5. Audit Committee of Listed Registrants.
Not applicable.
Item 6. Investments.
| (a) | Schedule of investments in securities of unaffiliated issuers as of the close of the reporting period is included as part of the report to shareholders filed under Item 1 of this Form. |
| (b) | Not applicable. |
| Item 7. | Disclosure of Proxy Voting Policies and Procedures for Closed-End Management Investment Companies. |
Not applicable.
Item 8. Portfolio Managers of Closed-End Management Investment Companies.
Not applicable.
| Item 9. | Purchases of Equity Securities by Closed-End Management Investment Company and Affiliated Purchasers. |
Not applicable.
Item 10. Submission of Matters to a Vote of Security Holders.
There have been no material changes to the procedures by which the shareholders may recommend nominees to the registrant’s board of directors, where those changes were implemented after the registrant last provided disclosure in response to the requirements of Item 407(c)(2)(iv) of Regulation S-K (17 CFR 229.407) (as required by Item 22(b)(15) of Schedule 14A (17 CFR 240.14a-101)), or this Item.
Item 11. Controls and Procedures.
| (a) | The registrant’s principal executive and principal financial officers, or persons performing similar functions, have concluded that the registrant’s disclosure controls and procedures (as defined in Rule 30a-3(c) under the Investment Company Act of 1940, as amended (the “1940 Act”) (17 CFR 270.30a-3(c))) are effective, as of a date within 90 days of the filing date of the report that includes the disclosure required by this paragraph, based on the evaluation of these controls and procedures required by Rule 30a-3(b) under the 1940 Act (17 CFR 270.30a-3(b)) and Rules 13a-15(b) or 15d-15(b) under the Securities Exchange Act of 1934, as amended (17 CFR 240.13a-15(b) or 240.15d-15(b)). |
| (b) | There were no changes in the registrant’s internal control over financial reporting (as defined in Rule 30a-3(d) under the 1940 Act (17 CFR 270.30a-3(d))) that occurred during the period covered by this report that have materially affected, or are reasonably likely to materially affect, the registrant’s internal control over financial reporting. |
| Item 12. | Disclosure of Securities Lending Activities for Closed-End Management Investment Companies. |
Not applicable.
Item 13. Exhibits.
| (a)(1) | Code of ethics that is the subject of disclosure required by Item 2 is attached hereto as Exhibit (a)(1). |
| (a)(2) | Certifications pursuant to Rule 30a-2(a) under the 1940 Act and Section 302 of the Sarbanes-Oxley Act of 2002 are attached hereto as Exhibits (a)(2)(i) and (a)(2)(ii). |
| (a)(3) | Not applicable. |
| (a)(4) | Not applicable. |
| (b) | Certifications pursuant to Rule 30a-2(b) under the 1940 Act and Section 906 of the Sarbanes-Oxley Act of 2002 are attached hereto as Exhibit (b). |
SIGNATURES
Pursuant to the requirements of the Securities Exchange Act of 1934 and the Investment Company Act of 1940, the registrant has duly caused this report to be signed on its behalf by the undersigned, thereunto duly authorized.
|
(Registrant) Fairholme Funds, Inc. | ||
| By (Signature and Title)* |
/s/ Bruce R. Berkowitz | |
| Bruce R. Berkowitz, President | ||
| (principal executive officer) | ||
Date February 6, 2020
Pursuant to the requirements of the Securities Exchange Act of 1934 and the Investment Company Act of 1940, this report has been signed below by the following persons on behalf of the registrant and in the capacities and on the dates indicated.
| By (Signature and Title)* |
/s/ Bruce R. Berkowitz | |
| Bruce R. Berkowitz, President | ||
| (principal executive officer) | ||
| Date February 6, 2020 |
||
| By (Signature and Title)* |
/s/ Wayne Kellner | |
| Wayne Kellner, Treasurer | ||
| (principal financial officer) | ||
| Date February 6, 2020 |
||
* Print the name and title of each signing officer under his or her signature.
Exhibit (a)(1)
FAIRHOLME FUNDS, INC.
CODE OF ETHICS FOR PRINCIPAL EXECUTIVE AND
SENIOR FINANCIAL OFFICERS
| I. | Covered Officers/Purpose of the Code |
This code of ethics for Principal Executive and Senior Financial Officers (the “Code”) has been adopted by Fairholme Funds, Inc. (the “Company”), on behalf of its series (individually, a “Fund” and collectively, the “Funds”). This Code applies to the Company’s principal executive officer, principal financial officer, principal accounting officer or controller and other persons serving similar functions (the “Covered Officers”). A list of positions currently within the ambit of Covered Officers is set forth in Exhibit A).
This Code sets forth standards and procedures that are reasonably designed to deter wrongdoing and promote:
| • | honest and ethical conduct, including the ethical handling of actual or apparent conflicts of interest between personal and professional relationships; |
| • | full, fair, accurate, timely and understandable disclosure in reports and documents that the Company files with, or submits to, the U.S. Securities and Exchange Commission (“SEC”) and in other public communications made by the Company; |
| • | compliance with applicable laws and governmental rules and regulations; |
| • | the prompt internal reporting of violations of the Code to an appropriate person or persons identified in the Code; and |
| • | accountability for adherence to the Code. |
Each Covered Officer should adhere to a high standard of business ethics and should be sensitive to situations that may give rise to actual as well as apparent conflicts of interest.
| II. | Covered Officers Should Handle Ethically Actual and Apparent Conflicts of Interest |
Overview. A “conflict of interest” occurs when a Covered Officer’s private interest interferes with the interests of, or his or her service to, the Company.1 For example, a conflict of interest would arise if a Covered Officer, or a member of his or her family, receives improper personal benefits as a result of his or her position with the Company. For the purposes of this Code, members of the Covered Person’s family include his or her spouse, children, stepchildren, financial dependents, parents and stepparents.
Certain conflicts of interest arise out of the relationships between Covered Officers and the Company and already are subject to conflict of interest provisions of the Investment
1 For purposes of this Code of Ethics, “Company” also includes each series of Fairholme Funds, Inc., as applicable.
Company Act of 1940, as amended, (the “1940 Act”) and the Investment Advisers Act of 1940 (“Advisers Act”). For example, Covered Officers may not individually engage in certain transactions (such as the purchase or sale of securities or other property) with the Company because of their status as “affiliated persons” of the Company. The Company’s and the investment adviser’s respective compliance programs and procedures are designed to prevent, or identify and correct, violations of these provisions. This Code does not, and is not intended to, repeat or replace these programs and procedures, and such conflicts fall outside of the parameters of this Code.
Although typically not presenting an opportunity for improper personal benefit, conflicts arise from, or as a result of, the contractual relationship between the Company and the investment adviser of which the Covered Officers are also officers or employees. As a result, this Code recognizes that the Covered Officers will, in the normal course of their duties (whether formally for the Company or for the adviser, or for both), be involved in establishing policies and implementing decisions that will have different effects on the adviser and the Company. The participation of the Covered Officers in such activities is inherent in the contractual relationship between the Company and the adviser and is consistent with the performance by the Covered Officers of their duties as officers of the Company. Thus, if performed in conformity with the provisions of the 1940 Act and the Advisers Act, such activities will be deemed to have been handled ethically. In addition, it is recognized by the Company’s Board of Directors (the “Board”) that the Covered Officers may also be officers or employees of one or more other investment companies covered by this or other codes.
Other conflicts of interest are covered by the Code, even if such conflicts of interest are not subject to provisions in the 1940 Act and the Advisers Act. The following list provides examples of conflicts of interest under the Code, but Covered Officers should keep in mind that these examples are not exhaustive. The overarching principle is that the personal interest of a Covered Officer should not be placed improperly before the interest of the Company.
| • | Each Covered Officer must not use his or her personal influence or personal relationships improperly to influence investment decisions or financial reporting by the Company whereby the Covered Officer would benefit personally to the detriment of the Company. |
| • | Each Covered Officer must not cause the Company to take action, or to fail to take action, for the individual personal benefit of the Covered Officer rather than the benefit the Company. |
| • | Each Covered Officer must not use material non-public knowledge of portfolio transactions made or contemplated for the Company to trade personally or cause others to trade personally in contemplation of the market effect of such transactions. |
| • | Each Covered Officer must report at least annually any ownership interest in the Company or its adviser. |
2
There are some conflict of interest situations, whether involving a Covered Officer directly or a member of his/her family, that should always be discussed with the Company’s Chief Compliance Officer (“Compliance Officer”), if material. Examples of these include:
| • | service as a director on the board of any public or private company; |
| • | the receipt of any gifts other than gifts of de minimis value; |
| • | the receipt of any entertainment from any company with which the Company has current or prospective business dealings unless such entertainment is business-related, reasonable in cost, appropriate as to time and place, and not so frequent as to raise any question of impropriety; |
| • | any ownership interest in, or any consulting or employment relationship with, any of the Company’s service providers, other than its investment adviser, principal underwriter, administrator or any affiliated person thereof; |
| • | a direct or indirect financial interest in commissions, transaction charges or spreads paid by the Company for effecting portfolio transactions or for selling or redeeming shares other than an interest arising from the Covered Officer’s employment, such as compensation or equity ownership. |
| III. | Disclosure and Compliance |
| • | Each Covered Officer should familiarize himself or herself with the disclosure requirements generally applicable to the Company. |
| • | Each Covered Officer should not knowingly misrepresent, or cause others to misrepresent, facts about the Company to others, whether within or outside the Company, including to the Company’s directors and independent auditors, and to governmental regulators and self-regulatory organizations. |
| • | Each Covered Officer should, to the extent appropriate within his or her area of responsibility, consult with other officers and employees of the Company and the adviser with the goal of promoting full, fair, accurate, timely and understandable disclosure in the reports and documents the Company files with, or submits to, the SEC and in other public communications made by the Company. |
| • | It is the responsibility of each Covered Officer to promote compliance with the standards and restrictions imposed by applicable laws, rules and regulations. |
| IV. | Reporting and Accountability |
Each Covered Officer must:
| • | upon adoption of the Code (or thereafter as applicable, upon becoming a Covered Officer), affirm in writing to the Compliance Officer that he or she has received, read, and understands the Code (see Exhibit B); |
| • | annually thereafter affirm to the Compliance Officer that he or she has complied with the requirements of the Code (see Exhibit C); |
3
| • | not retaliate against any other Covered Officer or any employee of the Company or its affiliated persons for reports of potential violations that are made in good faith; and |
| • | notify the Compliance Officer promptly if he or she knows of any violation of this Code. Failure to do so is itself a violation of this Code. |
The Compliance Officer is responsible for applying this Code to specific situations in which questions are presented under it and has the authority to interpret this Code in any particular situation.2 However, any approvals or waivers3 sought by a Covered Officer will be considered by the Board.
The Company will follow these procedures in investigating and enforcing this Code:
| • | The Compliance Officer will take all appropriate action to investigate any potential violations reported to him or her; |
| • | If, after such investigation, the Compliance Officer believes that no violation has occurred, the Compliance Officer is not required to take any further action; |
| • | Any matter that the Compliance Officer believes is a violation will be reported to the Board; |
| • | If the Board concurs that a violation has occurred, it will consider appropriate action, which may include: (i) review of, and appropriate modifications to, applicable policies and procedures; (ii) notification to appropriate personnel of the investment adviser or its board; or (iii) a recommendation to dismiss the Covered Officer; |
| • | The Board will be responsible for granting waivers, as appropriate; and |
| • | Any changes to or waivers of this Code will, to the extent required, be disclosed as provided by SEC rules. |
| V. | Other Policies and Procedures |
This Code shall be the sole code of ethics adopted by the Company for purposes of Section 406 of the Sarbanes-Oxley Act and the rules and forms applicable to registered investment companies thereunder. Insofar as other policies or procedures of the Company, the Company’s adviser or other service providers that govern or purport to govern the behavior or activities of the Covered Officers who are subject to this Code, it is understood that this Code is in all respects separate and apart from, and operates independently of, any such policies and
| 2 | The Compliance Officer is authorized to consult, as appropriate, with the Board and counsel to the Company, and is encouraged to do so. |
| 3 | Item 2 of Form N-CSR defines “waiver” as “the approval by the registrant of a material departure from a provision of the code of ethics” and “implicit waiver,” which must also be disclosed, as “the registrant’s failure to take action within a reasonable period of time regarding a material departure from a provision of the code of ethics that has been made known to an executive officer” of the registrant. |
4
procedures. In particular, the Company’s and its investment adviser’s codes of ethics under Rule 17j-1 under the 1940 Act contain separate requirements applying to the Covered Officers and others, and are not part of this Code.
| VI. | Amendments |
This Code may not be materially amended except by the approval of the Board, including by a majority of the Independent Directors. Non-material, technical, and other administrative revisions to this Code do not have to be approved by the Board. Amendments must be in writing and communicated promptly to the Covered Officers, who shall affirm receipt of this Code, as amended, in accordance with Section IV above.
| VII. | Confidentiality |
All reports and records prepared or maintained pursuant to this Code will be considered confidential and shall be maintained and protected accordingly. Except as otherwise required by law or this Code, such matters shall not be disclosed to anyone other than the Company and its adviser.
| VIII. | Internal Use |
The Code is intended solely for the internal use by the Company and the Funds and does not constitute an admission, by or on behalf of the Company, as to any fact, circumstance, or legal conclusion.
Amended: April 3, 2009, January 27, 2011, January 21, 2015, and January 21, 2016
5
EXHIBIT A
Positions Covered by this Code of Ethics:
Principal Executive Officer
Principal Financial and Accounting Officer
EXHIBIT B
Fairholme Funds, Inc.
Initial Covered Officer Affirmation
I understand that I am a Covered Officer, as defined in the Code of Ethics for Principal Executive and Senior Financial Officers of Fairholme Funds, Inc. (the “Code”). I have read and I understand the Code and will comply with it in all respects.
|
Signature |
Date |
|||||
|
Printed Name |
|
|||||
| Acknowledgement: |
||||||
|
Name: |
||||||
| Title: |
||||||
| Date: |
||||||
EXHIBIT C
Fairholme Funds, Inc.
Annual Covered Officer Affirmation
FOR THE YEAR ENDING [DATE]
By my signature below, I represent, warrant and affirm that:
(1) I am a Principal Executive Officer, Principal Financial Officer or other Covered Officer of Fairholme Funds, Inc.; and
(2) For the annual period ended [Date], I have complied with the Code of Ethics for Principal Executive and Senior Financial Officers.
|
Signature |
Date |
|||||
|
Printed Name |
|
|||||
| Acknowledgement: |
||||||
|
Name: |
||||||
| Title: |
||||||
| Date: |
||||||
Exhibit (a)(2)(i)
Certification Pursuant to Rule 30a-2(a) under the 1940 Act and Section 302 of the
Sarbanes-Oxley Act
I, Bruce R. Berkowitz, certify that:
| 1. | I have reviewed this report on Form N-CSR of Fairholme Funds, Inc.; |
| 2. | Based on my knowledge, this report does not contain any untrue statement of a material fact or omit to state a material fact necessary to make the statements made, in light of the circumstances under which such statements were made, not misleading with respect to the period covered by this report; |
| 3. | Based on my knowledge, the financial statements, and other financial information included in this report, fairly present in all material respects the financial condition, results of operations, changes in net assets, and cash flows (if the financial statements are required to include a statement of cash flows) of the registrant as of, and for, the periods presented in this report; |
| 4. | The registrant’s other certifying officer(s) and I are responsible for establishing and maintaining disclosure controls and procedures (as defined in Rule 30a-3(c) under the Investment Company Act of 1940) and internal control over financial reporting (as defined in Rule 30a-3(d) under the Investment Company Act of 1940) for the registrant and have: |
| (a) | Designed such disclosure controls and procedures, or caused such disclosure controls and procedures to be designed under our supervision, to ensure that material information relating to the registrant, including its consolidated subsidiaries, is made known to us by others within those entities, particularly during the period in which this report is being prepared; |
| (b) | Designed such internal control over financial reporting, or caused such internal control over financial reporting to be designed under our supervision, to provide reasonable assurance regarding the reliability of financial reporting and the preparation of financial statements for external purposes in accordance with generally accepted accounting principles; |
| (c) | Evaluated the effectiveness of the registrant’s disclosure controls and procedures and presented in this report our conclusions about the effectiveness of the disclosure controls and procedures, as of a date within 90 days prior to the filing date of this report based on such evaluation; and |
| (d) | Disclosed in this report any change in the registrant’s internal control over financial reporting that occurred during the period covered by this report that has materially |
| affected, or is reasonably likely to materially affect, the registrant’s internal control over financial reporting; and |
| 5. | The registrant’s other certifying officer(s) and I have disclosed to the registrant’s auditors and the audit committee of the registrant’s board of directors (or persons performing the equivalent functions): |
| (a) | All significant deficiencies and material weaknesses in the design or operation of internal control over financial reporting which are reasonably likely to adversely affect the registrant’s ability to record, process, summarize, and report financial information; and |
| (b) | Any fraud, whether or not material, that involves management or other employees who have a significant role in the registrant’s internal control over financial reporting. |
| Date: February 6, 2020 |
/s/ Bruce R. Berkowitz | |
| Bruce R. Berkowitz, President | ||
| (principal executive officer) |
Exhibit (a)(2)(ii)
Certification Pursuant to Rule 30a-2(a) under the 1940 Act and Section 302 of the
Sarbanes-Oxley Act
I, Wayne Kellner, certify that:
| 1. | I have reviewed this report on Form N-CSR of Fairholme Funds, Inc.; |
| 2. | Based on my knowledge, this report does not contain any untrue statement of a material fact or omit to state a material fact necessary to make the statements made, in light of the circumstances under which such statements were made, not misleading with respect to the period covered by this report; |
| 3. | Based on my knowledge, the financial statements, and other financial information included in this report, fairly present in all material respects the financial condition, results of operations, changes in net assets, and cash flows (if the financial statements are required to include a statement of cash flows) of the registrant as of, and for, the periods presented in this report; |
| 4. | The registrant’s other certifying officer(s) and I are responsible for establishing and maintaining disclosure controls and procedures (as defined in Rule 30a-3(c) under the Investment Company Act of 1940) and internal control over financial reporting (as defined in Rule 30a-3(d) under the Investment Company Act of 1940) for the registrant and have: |
| (a) | Designed such disclosure controls and procedures, or caused such disclosure controls and procedures to be designed under our supervision, to ensure that material information relating to the registrant, including its consolidated subsidiaries, is made known to us by others within those entities, particularly during the period in which this report is being prepared; |
| (b) | Designed such internal control over financial reporting, or caused such internal control over financial reporting to be designed under our supervision, to provide reasonable assurance regarding the reliability of financial reporting and the preparation of financial statements for external purposes in accordance with generally accepted accounting principles; |
| (c) | Evaluated the effectiveness of the registrant’s disclosure controls and procedures and presented in this report our conclusions about the effectiveness of the disclosure controls and procedures, as of a date within 90 days prior to the filing date of this report based on such evaluation; and |
| (d) | Disclosed in this report any change in the registrant’s internal control over financial reporting that occurred during the period covered by this report that has materially affected, or is reasonably likely to materially affect, the registrant’s internal control over financial reporting; and |
| 5. | The registrant’s other certifying officer(s) and I have disclosed to the registrant’s auditors and the audit committee of the registrant’s board of directors (or persons performing the equivalent functions): |
| (a) | All significant deficiencies and material weaknesses in the design or operation of internal control over financial reporting which are reasonably likely to adversely affect the registrant’s ability to record, process, summarize, and report financial information; and |
| (b) | Any fraud, whether or not material, that involves management or other employees who have a significant role in the registrant’s internal control over financial reporting. |
| Date: February 6, 2020 |
/s/ Wayne Kellner | |
| Wayne Kellner, Treasurer | ||
| (principal financial officer) |
Exhibit (b)
Certifications Pursuant to Rule 30a-2(b) under the 1940 Act and Section 906 of the
Sarbanes-Oxley Act
I, Bruce R. Berkowitz, President of Fairholme Funds, Inc. (the “Registrant”), certify that:
| 1. | The Form N-CSR of the Registrant for the period ended November 30, 2019 (the “Report”) fully complies with the requirements of Section 13(a) or 15(d) of the Securities Exchange Act of 1934, as amended; and |
| 2. | The information contained in the Report fairly presents, in all material respects, the financial condition and results of operations of the Registrant. |
| Date: February 6, 2020 |
/s/ Bruce R. Berkowitz | |
| Bruce R. Berkowitz, President | ||
| (principal executive officer) |
I, Wayne Kellner, Treasurer of Fairholme Funds, Inc. (the “Registrant”), certify that:
| 1. | The Form N-CSR of the Registrant for the period ended November 30, 2019 (the “Report”) fully complies with the requirements of Section 13(a) or 15(d) of the Securities Exchange Act of 1934, as amended; and |
| 2. | The information contained in the Report fairly presents, in all material respects, the financial condition and results of operations of the Registrant. |
| Date: February 6, 2020 |
/s/ Wayne Kellner | |
| Wayne Kellner, Treasurer | ||
| (principal financial officer) |
Create E-mail Alert Related Categories
SEC FilingsRelated Entities
Fairholme Capital ManagementSign up for StreetInsider Free!
Receive full access to all new and archived articles, unlimited portfolio tracking, e-mail alerts, custom newswires and RSS feeds - and more!
