Close

Form N-CSR DEUTSCHE DWS INVESTMENT For: Nov 30

February 3, 2023 11:15 AM EST

SUNITED STATES

SECURITIES AND EXCHANGE COMMISSION

WASHINGTON, D. C. 20549


FORM N-CSR


Investment Company Act file number: 811-00043


Deutsche DWS Investment Trust

(Exact Name of Registrant as Specified in Charter)


875 Third Avenue

New York, NY 10022-6225

(Address of Principal Executive Offices) (Zip Code)


Registrant’s Telephone Number, including Area Code: (212) 454-4500


Diane Kenneally

100 Summer Street

Boston, MA 02110

(Name and Address of Agent for Service)


Date of fiscal year end: 11/30
   
Date of reporting period: 11/30/2022


ITEM 1. REPORT TO STOCKHOLDERS
   
  (a)

November 30, 2022
Annual Report
to Shareholders
DWS CROCI® Equity Dividend Fund

This report must be preceded or accompanied by a prospectus. To obtain a summary prospectus, if available, or prospectus for any of our funds, refer to the Account Management Resources information provided in the back of this booklet. We advise you to consider the Fund’s objectives, risks, charges and expenses carefully before investing. The summary prospectus and prospectus contain this and other important information about the Fund. Please read the prospectus carefully before you invest.
The brand DWS represents DWS Group GmbH & Co. KGaA and any of its subsidiaries such as DWS Distributors, Inc. which offers investment products or DWS Investment Management Americas, Inc. and RREEF America L.L.C. which offer advisory services.
NOT FDIC/NCUA INSURED NO BANK GUARANTEE MAY LOSE VALUE
NOT A DEPOSIT NOT INSURED BY ANY FEDERAL GOVERNMENT AGENCY
2
|
DWS CROCI® Equity Dividend Fund

Stocks may decline in value. The Fund will be managed using the CROCI® Investment Process which is based on portfolio management’s belief that, over time, stocks which display more favorable financial metrics (for example, the CROCI® Economic P/E Ratio) as generated by this process may outperform stocks which display less favorable metrics. This premise may not prove to be correct and prospective investors should evaluate this assumption prior to investing in the Fund. Dividends are not guaranteed. If the dividend-paying stocks held by the Fund reduce or stop paying dividends, the Fund’s ability to generate income may be adversely affected. Preferred stocks, a type of dividend-paying stock, present certain additional risks. The Fund may lend securities to approved institutions. Please read the prospectus for details.
War, terrorism, sanctions, economic uncertainty, trade disputes, public health crises and related geopolitical events have led, and, in the future, may lead to significant disruptions in U.S. and world economies and markets, which may lead to increased market volatility and may have significant adverse effects on the Fund and its investments.
DWS CROCI® Equity Dividend Fund
|
3

Letter to Shareholders
Dear Shareholder:
Financial markets experienced several negative impacts which began in late February with the Russia-Ukraine war and continued through the remainder of the year due to volatility in energy, a rise in inflation, pressure on supply chains, and slower corporate earnings growth. Global monetary authorities have moved aggressively to tame inflation which in turn has created a swift decline in equity and fixed income markets. The longer-term effects of these headwinds remain uncertain. De-globalization and a desire for energy independence across Europe and North America may continue to push prices upwards, and we expect inflation will remain higher than average over the next decade.
In periods such as this, real capital preservation becomes more challenging. Our portfolio managers continue to assess risks and form opinions on how these headwinds may impact investment portfolios over multiple time horizons. Yields for bonds can be impacted by economic risks, rising inflation, and slowing monetary support. We expect a moderate rise in government bond yields while short term spread widening may offer potential over the next year. For equities, we expect continued volatility in the short-term, however we do have a favorable view on companies with solid balance sheets and business models over a twelve-month horizon. We believe alternatives such as real estate, infrastructure and commodities may help in preserving capital given pricing power and correlation to inflation. Overall, we believe a diversified and balanced portfolio may help mitigate portfolio volatility during this uncertain economic and market cycle.
In our view, the current environment underscores the value add of active portfolio management. We also believe that the strong partnership between our portfolio managers and our CIO Office which synthesizes the views of more than 900 DWS economists, analysts and investment professionals around the world makes an important difference in making strategic and tactical decisions for the DWS Funds. Thank you for your trust. We welcome the opportunity to help you navigate these unusual times. For ongoing updates to our market and economic outlook, please visit the “Insights”  section of dws.com.
Best regards,
Hepsen Uzcan
President, DWS Funds
Assumptions, estimates and opinions contained in this document constitute our judgment as of the date of the document and are subject to change without notice. Any projections are based on a number of assumptions as to market conditions and there can be no guarantee that any projected results will be achieved. Past performance is not a guarantee of future results.
4
|
DWS CROCI® Equity Dividend Fund

Portfolio Management Review(Unaudited)
Market Overview and Fund Performance
All performance information below is historical and does not guarantee future results. Returns shown are for Class A shares, unadjusted for sales charges. Investment return and principal fluctuate, so your shares may be worth more or less when redeemed. Current performance may differ from performance data shown. Please visit dws.com for the most recent month-end performance of all share classes. Fund performance includes reinvestment of all distributions. Unadjusted returns do not reflect sales charges and would have been lower if they had. Please refer to pages 10through 12for more complete performance information.
Investment Process
Portfolio management selects stocks that it believes offer economic value utilizing the CROCI® strategy as the primary factor, among other factors, and seeks above-average dividend yield. The CROCI® strategy is an investment process based on a proprietary valuation technique that attempts to understand the value of a company by converting financial statement data into a set of economic inputs that are used to calculate a valuation metric called the CROCI® Economic Price Earnings Ratio which is comparable across markets, sectors and stocks. The CROCI® Economic Price Earnings Ratio seeks to measure the “real”  economic value rather than the “accounting”  value of a company’s invested capital, and the economic returns thereof. Portfolio management believes that, over time, companies with more favorable financial metrics, including CROCI® Economic Price Earnings Ratios, will outperform other companies. Portfolio Management employs a U.S.-specific strategy seeking to select approximately the forty best value companies under CROCI® coverage with additional screening on high dividend yield, dividend sustainability and price volatility.
The Fund is reviewed periodically (typically quarterly) and adjusted in accordance with the CROCI® strategy’s rules (re-selecting approximately forty stocks that will make up the fund). Portfolio Management targets low valuation combined with higher dividends and excludes stocks with undesirable characteristics such as, for example, high financial leverage, low cash returns and high volatility. All CROCI® financial metrics may be adjusted from time to time. Portfolio management may also use factors other than the CROCI® strategy in selecting investments. Portfolio management actively manages portfolio changes in an attempt to reduce market impact and transaction costs and to manage the portfolio with tax efficiency in mind.
DWS CROCI® Equity Dividend Fund returned 13.66% in the 12-month period that ended on November 30, 2022, outperforming the 2.42% gain of the Russell 1000 Value® Index. The Fund also outperformed the 4.30% average return for the funds in its Morningstar peer group, Large Value.
DWS CROCI® Equity Dividend Fund
|
5

U.S. equities experienced a meaningful decline and elevated volatility during the annual period. Persistently high inflation prompted the U.S. Federal Reserve (Fed) to end its quantitative easing program and raise interest rates by a total of 3.75 percentage points from March 2022 onward. Further, investors remained prepared for the Fed to continue raising rates through the early part of 2023. The challenging interest rate-outlook, in turn, fueled concerns that the year ahead could feature a sharp slowdown in economic growth and a corresponding decline in corporate earnings.
“The relative strength in the Fund’s three areas of emphasis—value, dividends, and low volatility—was a tailwind for performance.” 
Geopolitical factors also played a role in equities’ poor showing. Russia’s invasion of Ukraine, together with its impact on supply chains and commodity prices, was a key factor weighing on sentiment. China was another source of concern, as the government’s heightened regulatory focus and zero-COVID policy hindered the country’s economy and contributed to slower growth across the globe.
Although these developments weighed on the broader market, the value style posted a positive return and strongly outpaced growth. The Russell 1000 Value Index gained 2.42%, far ahead of the -21.64% return for the Russell 1000 Growth Index. Rising interest rates were a sizable headwind for growth stocks by reducing the value of their future earnings when discounted in today’s dollars. In contrast, value stocks were less affected by this trend since they tend to have higher current profits. Investors’ preference for shorter-dated cash flows, together with their heightened demand for defensive investments, contributed to outperformance for dividend-paying equities, as well. The MSCI USA High Dividend Yield Index returned 5.86% in the annual period. Lower-volatility stocks were a further beneficiary of investors’ demand for defensive companies in a time of elevated uncertainty.
The relative strength in the Fund’s three areas of emphasisvalue, dividends, and low volatilitywas a tailwind for performance. We believe this underscores the potential merits of our approach. The benefits of dividends and the defensive characteristics of the associated companies
6
|
DWS CROCI® Equity Dividend Fund

have been obscured in recent years, during which the Fed’s “easy money”  policies led to outperformance for the growth style, encouraged speculation, and contributed to outsized returns for many lower-quality, higher-risk companies. This tend has now reversed, and the Fund has benefited in kind.
Fund Performance
The Fund’s positioning in the consumer staples sector was the primary driver of its positive relative performance in the past year. We had a large overweight in consumer staples, with 21.7% of the Fund’s assets invested in the category as of November 30, 2022, well in excess of the 14.5% weighting in the benchmark. Given the sector’s outperformance, this aspect of our positioning was a meaningful contributor. This wasn’t an active allocation decision on our part, but rather an indication of where our process has identified the largest number of stocks with compelling combinations of value, dividend yield, and volatility characteristics. Stock selection in the sector also proved beneficial. All but one of the Fund’s investments in consumer staples registered positive returns during the time they were held in the portfolio, and the majority produced double-digit gains. Campbell Soup Co.,* General Mills, Inc., and Conagra Brands, Inc. were the top individual contributors in the sector.
Selection in health care was a further plus. Similar to consumer staples, the Fund benefited from its positions in stocks that logged gains despite the unsteady performance for the market as a whole. Investments in large-cap pharmaceuticals seen as being less vulnerable to economic trends, including AbbVie, Inc., Bristol-Myers Squibb Co., and Merck & Co. Inc., were key contributors. Holdings in biotechnology stocks also added value, led by Amgen, Inc. and Gilead Sciences, Inc.
Selection in the information technology and industrials sectors further contributed. Amdocs Ltd. and International Business Machines Corp. were top contributors in the former. Lockheed Martin Corp.which benefited from the prospect of increased defense spending in the wake of Russia’s invasion of Ukraineled the way in industrials.
In terms of sector allocations, an underweight in the underperforming communication services sector was a key contibutor. On the other hand, a large underweight in energy detracted. Energy stocks far outpaced the
DWS CROCI® Equity Dividend Fund
|
7

broader market thanks to the rising prices of the underlying commodities and the improving capital discipline for many companies in the sector.
Stock selection in the consumer discretionary sector detracted from performance, primarily as a result of the Fund’s position in the GPS-technology producer Garmin Ltd. The stock was hurt by rising competition from Apple, Inc. as well as the larger concerns about the economy. Whirlpool Corp., which declined in sympathy with other housing-related stocks in the rising-rate environment, was an additional detractor of note. Additionally, holdings in several banking stocks were pressured by worries about weaker economic growth and narrowing net interest margins (the gap between the rates at which they borrow and lend). U.S. Bancorp, Bank of New York Mellon Corp.,* and Zions Bancorp* all posted double-digit losses and finished well behind the broader sector. Outside of consumer discretionary and financials, Intel Corp.*which experienced a persistent slowdown in its core businesswas the largest detractor.
Outlook and Positioning
Stocks suffered poor absolute returns and relative underperformance in the first nine months of 2022, and the outlook remained very murky at the close of the period. Still, valuations have fallen considerably this year as a broad range of negative news has been factored into market prices. We think this could set the stage for potential positive surprises in 2023 if central banks begin to slow their pace of monetary tightening or the downturn in economic growth proves smaller than expected. As always, we continue to use a disciplined, systematic approach to stock selection. We believe focusing on individual stock picking, rather than trying to construct a portfolio on the basis of short-term developments, is the most effective way to add value over time.
*
Not held on November 30, 2022.
8
|
DWS CROCI® Equity Dividend Fund

Portfolio Manager
Di Kumble, CFA, Senior Portfolio Manager Equity
Portfolio Manager of the Fund. Began managing the Fund in 2014.
Joined DWS in 2003 with seven years of industry experience. Prior to joining, she served as a Portfolio Manager at Graham Capital Management. Previously, she worked as a Quantitative Strategist at ITG Inc. and Morgan Stanley.
Senior Portfolio Manager, Head of Tax Managed Equities: New York.
BS, Beijing University; PhD in Chemistry, Princeton University.
The views expressed reflect those of the portfolio management team only through the end of the period of the report as stated on the cover. The management team’s views are subject to change at any time based on market and other conditions and should not be construed as a recommendation. Past performance is no guarantee of future results. Current and future portfolio holdings are subject to risk.
Terms to Know
Russell 1000 Value Index is an unmanaged market capitalization-weighted index of value-oriented stocks of the largest U.S. domiciled companies that are included in the Russell 1000® Index. Value-oriented stocks tend to have lower price-to-book ratios and lower forecasted growth values. Russell 1000 Index is an unmanaged price-only index of the 1,000 largest capitalized companies that are domiciled in the U.S. and whose common stocks are traded.
Morningstar Large Value category portfolios invest primarily in big U.S. companies that are less expensive or growing more slowly than other large-cap stocks. Stocks in the top 70% of the capitalization of the U.S. equity market are defined as large cap. The average category returns for the one-, five- and 10-year periods that ended on November 30, 2022 were 4.30%, 8.26% and 10.84%, respectively.
MSCI USA High Dividend Yield Index is based on the MSCI USA Index, its parent index, and includes large- and mid-cap stocks. The index is designed to reflect the performance of equities in the parent index (excluding REITs) with higher dividend income and quality characteristics than average dividend yields that are both sustainable and persistent. The index also applies quality screens and reviews 12-month past performance to omit stocks with potentially deteriorating fundamentals that could force them to cut or reduce dividends.
It is not possible to invest directly in an index or category.
Contribution and detraction incorporate both an investment’s total return and its weighting in the Fund.
Overweight means that a fund holds a higher weighting in a given sector compared with its benchmark index. Underweight means that a fund holds a lower weighting.
DWS CROCI® Equity Dividend Fund
|
9

Performance SummaryNovember 30, 2022 (Unaudited)
Class A
1-Year
5-Year
10-Year
Average Annual Total Returnsas of 11/30/22
Unadjusted for Sales Charge
13.66%
7.21%
10.00%
Adjusted for the Maximum Sales Charge
(max 5.75% load)
7.12%
5.94%
9.35%
Russell 1000® Value Index
2.42%
7.86%
10.97%
Class C
1-Year
5-Year
10-Year
Average Annual Total Returnsas of 11/30/22
Unadjusted for Sales Charge
12.74%
6.39%
9.17%
Adjusted for the Maximum Sales Charge
(max 1.00% CDSC)
12.74%
6.39%
9.17%
Russell 1000® Value Index
2.42%
7.86%
10.97%
Class R
1-Year
5-Year
10-Year
Average Annual Total Returnsas of 11/30/22
No Sales Charges
13.30%
6.87%
9.69%
Russell 1000® Value Index
2.42%
7.86%
10.97%
Class R6
1-Year
5-Year
Life of
Class*
Average Annual Total Returnsas of 11/30/22
No Sales Charges
14.07%
7.58%
8.17%
Russell 1000® Value Index
2.42%
7.86%
8.14%
Class S
1-Year
5-Year
10-Year
Average Annual Total Returnsas of 11/30/22
No Sales Charges
13.90%
7.43%
10.25%
Russell 1000® Value Index
2.42%
7.86%
10.97%
Institutional Class
1-Year
5-Year
10-Year
Average Annual Total Returnsas of 11/30/22
No Sales Charges
14.01%
7.50%
10.30%
Russell 1000® Value Index
2.42%
7.86%
10.97%
Performance in the Average Annual Total Returns table above and the Growth of an Assumed $10,000 Investment line graph that follows is historical and does not guarantee future results. Investment return and principal fluctuate, so your shares may be worth more or less when redeemed. Current performance may differ from
10
|
DWS CROCI® Equity Dividend Fund

performance data shown. Please visit dws.com for the Fund’s most recent month-end performance. Fund performance includes reinvestment of all distributions. Unadjusted returns do not reflect sales charges and would have been lower if they had.
The gross expense ratios of the Fund, as stated in the fee table of the prospectus dated March 1, 2022 are 1.01%, 1.83%, 1.36%, 0.66%, 0.82% and 0.78% for Class A, Class C, Class R, Class R6, Class S and Institutional Class shares, respectively, and may differ from the expense ratios disclosed in the Financial Highlights tables in this report.
Index returns do not reflect any fees or expenses and it is not possible to invest directly into an index.
Performance figures do not reflect the deduction of taxes that a shareholder would pay on fund distributions or the redemption of fund shares.
Prior to April 1, 2014, the Fund had a different investment management team that operated with a different investment strategy. Performance would have been different if the Fund’s current investment strategy had been in effect. Please see the prospectus for details.
Generally accepted accounting principles require adjustments to be made to the net assets of the Fund at period end for financial reporting purposes only, and as such, the total return based on the unadjusted net asset value per share may differ from the total return reported in the financial highlights.
Growth of an Assumed $10,000 Investment
(Adjusted for Maximum Sales Charge)
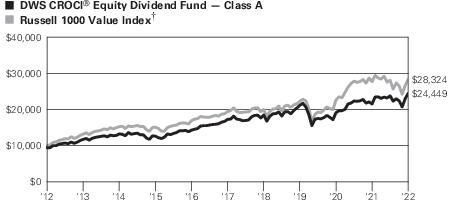
 Yearly periods ended November 30

The Fund’s growth of an assumed $10,000 investment is adjusted for the maximum sales charge of 5.75%. This results in a net initial investment of $9,425.
The growth of $10,000 is cumulative.
DWS CROCI® Equity Dividend Fund
|
11

Performance of other share classes will vary based on the sales charges and the fee structure of those classes.
*
Class R6 shares commenced operations on March 2, 2015.
Russell 1000® Value Index is an unmanaged market capitalization-weighted index of
value-oriented stocks of the largest U.S. domiciled companies that are included in the
Russell 1000 Index. Value-oriented stocks tend to have lower price-to-book ratios and
lower forecasted growth values. Russell 1000 Index is an unmanaged price-only index of
the 1,000 largest capitalized companies that are domiciled in the U.S. and whose
common stocks are traded.
 
Class A
Class C
Class R
Class R6
Class S
Institutional
Class
Net Asset Value
11/30/22
$56.47
$56.26
$56.25
$56.53
$56.46
$56.52
11/30/21
$54.61
$54.41
$54.40
$54.66
$54.59
$54.63
Distribution Information as of 11/30/22
Income Dividends, Twelve Months
$1.30
$.86
$1.12
$1.49
$1.40
$1.44
Capital Gain Distributions
$3.92
$3.92
$3.92
$3.92
$3.92
$3.92
12
|
DWS CROCI® Equity Dividend Fund

Portfolio Summary(Unaudited)
Asset Allocation(As a % of Investment Portfolio excluding
Securities Lending Collateral)
11/30/22
11/30/21
Common Stocks
100%
100%
Cash Equivalents
0%
0%
 
100%
100%
Sector Diversification(As a % of Investment Portfolio
excluding Securities Lending Collateral and Cash Equivalents)
11/30/22
11/30/21
Consumer Staples
22%
38%
Health Care
20%
21%
Industrials
13%
12%
Financials
12%
10%
Information Technology
10%
10%
Consumer Discretionary
8%
2%
Utilities
5%
5%
Energy
5%
Communication Services
3%
Materials
2%
2%
 
100%
100%
DWS CROCI® Equity Dividend Fund
|
13

Ten Largest Equity Holdings at November 30, 2022(26.8% of Net Assets)
 1Gilead Sciences, Inc.
2.9%
Developer of nucleotide pharmaceuticals
 
 2Best Buy Co., Inc.
2.9%
Retailer of consumer electronics and home office equipment
 
 3International Business Machines Corp.
2.7%
Manufacturer of computers and provider of information processing services
 
 4Cisco Systems, Inc.
2.7%
Developer of computer network products
 
 5Lockheed Martin Corp.
2.6%
Developer and manufacturer of advanced technology products and services
 
 6Comcast Corp.
2.6%
Developer, manager, and operator of hybrid fiber-coaxial broadband cable
communications networks
 
 7ManpowerGroup, Inc.
2.6%
Provider of temporary and permanent placement services
 
 8Merck & Co., Inc.
2.6%
Provider of health solutions through its prescription medicines, vaccines, biologic
therapies and animal health products
 
 9PPL Corp.
2.6%
Distributor and seller of electricity and natural gas
 
10JPMorgan Chase & Co.
2.6%
Provider of global financial services
 
Portfolio holdings and characteristics are subject to change.
For more complete details about the Fund’s investment portfolio, see page 15. A quarterly Fact Sheet is available on dws.com or upon request. Please see the Account Management Resources section on page 58for contact information.
14
|
DWS CROCI® Equity Dividend Fund

Investment Portfolioas of November 30, 2022
 
Shares
Value ($)
Common Stocks 99.4%
 
Communication Services 2.6%
 
Media
 
Comcast Corp. “A” 
 
  692,352
25,367,777
Consumer Discretionary 7.6%
 
Household Durables 4.8%
 
Garmin Ltd.
 
  260,900
24,261,091
Whirlpool Corp.
 
  150,069
21,989,611


46,250,702
Specialty Retail 2.8%
 
Best Buy Co., Inc.
 
  325,148
27,735,124
Consumer Staples 21.7%
 
Beverages 2.4%
 
PepsiCo, Inc.
 
  123,521
22,914,381
Food Products 9.5%
 
Conagra Brands, Inc.
 
  625,498
23,756,414
General Mills, Inc.
 
  277,843
23,700,008
The J.M. Smucker Co.
 
  152,726
23,521,331
Tyson Foods, Inc. “A” 
 
  327,008
21,674,090


92,651,843
Household Products 4.9%
 
Colgate-Palmolive Co.
 
  291,384
22,576,432
Procter & Gamble Co.
 
  167,382
24,966,699


47,543,131
Tobacco 4.9%
 
Altria Group, Inc.
 
  479,120
22,317,410
Philip Morris International, Inc.
 
  248,945
24,812,348


47,129,758
Energy 4.7%
 
Oil, Gas & Consumable Fuels
 
Pioneer Natural Resources Co.
 
   88,492
20,883,227
Valero Energy Corp.
 
  185,229
24,750,299


45,633,526
The accompanying notes are an integral part of the financial statements.
DWS CROCI® Equity Dividend Fund
|
15

 
Shares
Value ($)
Financials 12.4%
 
Banks 7.3%
 
JPMorgan Chase & Co.
 
  182,099
25,162,440
Regions Financial Corp.
 
  991,692
23,017,172
U.S. Bancorp.
 
  500,816
22,732,038


70,911,650
Consumer Finance 5.1%
 
Discover Financial Services
 
  226,880
24,584,717
Synchrony Financial
 
  653,032
24,540,942


49,125,659
Health Care 20.1%
 
Biotechnology 8.0%
 
AbbVie, Inc.
 
  150,557
24,266,777
Amgen, Inc.
 
   85,721
24,550,494
Gilead Sciences, Inc.
 
  324,760
28,523,671


77,340,942
Health Care Equipment & Supplies 2.1%
 
Medtronic PLC
 
  257,042
20,316,600
Pharmaceuticals 10.0%
 
Bristol-Myers Squibb Co.
 
  300,864
24,153,362
Johnson & Johnson
 
  131,071
23,330,638
Merck & Co., Inc.
 
  229,322
25,252,938
Pfizer, Inc.
 
  493,145
24,721,359


97,458,297
Industrials 12.4%
 
Aerospace & Defense 2.6%
 
Lockheed Martin Corp.
 
   52,357
25,403,093
Air Freight & Logistics 2.3%
 
C.H. Robinson Worldwide, Inc.
 
  223,912
22,440,461
Building Products 2.4%
 
Masco Corp.
 
  447,732
22,735,831
Machinery 2.5%
 
Cummins, Inc.
 
   97,018
24,367,041
Professional Services 2.6%
 
ManpowerGroup, Inc.
 
  288,656
25,263,173
Information Technology 10.4%
 
Communications Equipment 2.6%
 
Cisco Systems, Inc.
 
  517,450
25,727,614
The accompanying notes are an integral part of the financial statements.
16
|
DWS CROCI® Equity Dividend Fund

 
Shares
Value ($)
IT Services 5.2%
 
Amdocs Ltd.
 
  268,225
23,834,474
International Business Machines Corp.
 
  175,917
26,194,041


50,028,515
Semiconductors & Semiconductor Equipment 2.6%
 
Skyworks Solutions, Inc.
 
  259,621
24,824,960
Materials 2.4%
 
Chemicals
 
LyondellBasell Industries NV “A” 
 
  269,539
22,913,510
Utilities 5.1%
 
Electric Utilities 2.6%
 
PPL Corp.
 
  852,773
25,173,859
Multi-Utilities 2.5%
 
Sempra Energy
 
  147,752
24,554,905
Total Common Stocks (Cost $868,545,160)
963,812,352
Cash Equivalents 0.4%
DWS Central Cash Management Government Fund, 3.7%
(a) (Cost $3,767,952)
 
3,767,952
  3,767,952
 
 
% of
Net Assets
Value ($)
Total Investment Portfolio (Cost $872,313,112)
 
99.8
967,580,304
Other Assets and Liabilities, Net
 
0.2
1,905,875
Net Assets
 
100.0
969,486,179
The accompanying notes are an integral part of the financial statements.
DWS CROCI® Equity Dividend Fund
|
17

A summary of the Fund’s transactions with affiliated investments during the year ended November 30, 2022 are as follows:
Value ($)
at
11/30/2021
Pur-
chases
Cost
($)
Sales
Proceeds
($)
Net
Real-
ized
Gain/
(Loss)
($)
Net
Change
in
Unreal-
ized
Appreci-
ation
(Depreci-
ation)
($)
Income
($)
Capital
Gain
Distri-
butions
($)
Number of
Shares at
11/30/2022
Value ($)
at
11/30/2022
Securities Lending Collateral 0.0%
DWS Government & Agency Securities Portfolio “DWS Government Cash Institutional Shares” ,
3.69% (a) (b)
638,175
638,175 (c)
3,024
Cash Equivalents 0.4%
DWS Central Cash Management Government Fund, 3.7% (a)
4,576,209
76,263,977
77,072,234
56,589
3,767,952
5,214,384
76,263,977
77,710,409
59,613
3,767,952
(a)
Affiliated fund managed by DWS Investment Management Americas, Inc. The rate
shown is the annualized seven-day yield at period end.
(b)
Represents cash collateral held in connection with securities lending. Income earned by
the Fund is net of borrower rebates.
(c)
Represents the net increase (purchase cost) or decrease (sales proceeds) in the amount
invested in cash collateral for the year ended November 30, 2022.
Fair Value Measurements
Various inputs are used in determining the value of the Fund’s investments. These inputs are summarized in three broad levels. Level 1 includes quoted prices in active markets for identical securities. Level 2 includes other significant observable inputs (including quoted prices for similar securities, interest rates, prepayment speeds and credit risk). Level 3 includes significant unobservable inputs (including the Fund’s own assumptions in determining the fair value of investments). The level assigned to the securities valuations may not be an indication of the risk or liquidity associated with investing in those securities.
The following is a summary of the inputs used as of November 30, 2022 in valuing the Fund’s investments. For information on the Fund’s policy regarding the valuation of investments, please refer to the Security Valuation section of Note A in the accompanying Notes to Financial Statements.
Assets
Level 1
Level 2
Level 3
Total
Common Stocks (a)
$963,812,352
$
$
$963,812,352
Short-Term Investments
  3,767,952
  3,767,952
Total
$967,580,304
$
$
$967,580,304
(a)
See Investment Portfolio for additional detailed categorizations.
The accompanying notes are an integral part of the financial statements.
18
|
DWS CROCI® Equity Dividend Fund

Statement of Assets and Liabilities
as of November 30, 2022
Assets
 
Investments in non-affiliated securities, at value (cost $868,545,160)
$963,812,352
Investment in DWS Central Cash Management Government Fund
(cost $3,767,952)
  3,767,952
Foreign currency, at value (cost $62)
          51
Receivable for Fund shares sold
    140,020
Dividends receivable
  3,598,378
Interest receivable
      9,898
Other assets
     47,238
Total assets
971,375,889
Liabilities
 
Payable for Fund shares redeemed
    773,551
Accrued management fee
    471,977
Accrued Trustees' fees
     10,450
Other accrued expenses and payables
    633,732
Total liabilities
1,889,710
Net assets, at value
$969,486,179
Net Assets Consist of
 
Distributable earnings (loss)
145,625,420
Paid-in capital
823,860,759
Net assets, at value
$969,486,179
The accompanying notes are an integral part of the financial statements.
DWS CROCI® Equity Dividend Fund
|
19

Statement of Assets and Liabilities as of November 30, 2022 (continued)
Net Asset Value
 
Class A
 
Net Asset Value and redemption price per share
($803,782,979 ÷ 14,234,169 outstanding shares of beneficial interest,
$.01 par value, unlimited number of shares authorized)
$       56.47
Maximum offering price per share (100 ÷ 94.25 of $56.47)
$       59.92
Class C
 
Net Asset Value, offering and redemption price
(subject to contingent deferred sales charge) per share
($13,803,155 ÷ 245,342 outstanding shares of beneficial interest,
$.01 par value, unlimited number of shares authorized)
$       56.26
Class R
 
Net Asset Value, offering and redemption price per share
($358,249 ÷ 6,369 outstanding shares of beneficial interest,
$.01 par value, unlimited number of shares authorized)
$       56.25
Class R6
 
Net Asset Value, offering and redemption price per share
($1,089,782 ÷ 19,278 outstanding shares of beneficial interest,
$.01 par value, unlimited number of shares authorized)
$       56.53
Class S
 
Net Asset Value, offering and redemption price per share
($45,240,353 ÷ 801,259 outstanding shares of beneficial interest,
$.01 par value, unlimited number of shares authorized)
$       56.46
Institutional Class
 
Net Asset Value, offering and redemption price per share
($105,211,661 ÷ 1,861,533 outstanding shares of beneficial interest,
$.01 par value, unlimited number of shares authorized)
$       56.52
The accompanying notes are an integral part of the financial statements.
20
|
DWS CROCI® Equity Dividend Fund

Statement of Operations
for the year ended November 30, 2022
Investment Income
 
Income:
 
Dividends
$34,033,128
Income distributions DWS Central Cash Management
Government Fund
56,589
Securities lending income, net of borrower rebates
3,024
Total income
34,092,741
Expenses:
 
Management fee
5,768,770
Services to shareholders
1,185,777
Distribution and service fees
2,012,057
Custodian fee
10,080
Professional fees
95,194
Reports to shareholders
81,074
Registration fees
92,708
Trustees' fees and expenses
44,023
Other
50,546
Total expenses before expense reductions
9,340,229
Expense reductions
(1,047)
Total expenses after expense reductions
9,339,182
Net investment income
24,753,559
Realized and Unrealized Gain (Loss)
 
Net realized gain (loss) from investments
38,290,168
Change in net unrealized appreciation (depreciation) on:
 
Investments
59,588,779
Foreign currency
(2)
 
59,588,777
Net gain (loss)
97,878,945
Net increase (decrease) in net assets resulting from operations
$122,632,504
The accompanying notes are an integral part of the financial statements.
DWS CROCI® Equity Dividend Fund
|
21

Statements of Changes in Net Assets
 
Years Ended November 30,
Increase (Decrease) in Net Assets
2022
2021
Operations:
 
 
Net investment income
$24,753,559
$21,191,285
Net realized gain (loss)
38,290,168
150,748,500
Change in net unrealized appreciation
(depreciation)
59,588,777
(46,465,983)
Net increase (decrease) in net assets resulting
from operations
122,632,504
125,473,802
Distributions to shareholders:
 
 
Class A
(74,141,031)
(20,686,512)
Class T
(1,324)
(348)
Class C
(1,188,378)
(301,705)
Class R
(39,639)
(11,529)
Class R6
(376,935)
(119,671)
Class S
(4,025,280)
(1,498,851)
Institutional Class
(10,332,946)
(4,164,749)
Total distributions
(90,105,533)
(26,783,365)
Fund share transactions:
 
 
Proceeds from shares sold
54,321,726
108,087,001
Reinvestment of distributions
85,813,479
25,549,175
Payments for shares redeemed
(144,003,700)
(311,391,394)
Net increase (decrease) in net assets from Fund
share transactions
(3,868,495)
(177,755,218)
Increase (decrease) in net assets
28,658,476
(79,064,781)
Net assets at beginning of period
940,827,703
1,019,892,484
Net assets at end of period
$969,486,179
$940,827,703
The accompanying notes are an integral part of the financial statements.
22
|
DWS CROCI® Equity Dividend Fund

Financial Highlights
DWS CROCI® Equity Dividend Fund Class A
 
Years Ended November 30,
 
2022
2021
2020
2019
2018
Selected Per Share Data
Net asset value, beginning of period
$54.61
$49.82
$60.06
$60.49
$57.53
Income (loss) from investment operations:


Net investment incomea
1.39
1.12
1.23
1.17
1.05
Net realized and unrealized gain (loss)
5.69
5.07
(7.02)
5.99
2.89
Total from investment operations
7.08
6.19
(5.79)
7.16
3.94
Less distributions from:


Net investment income
(1.30)
(1.40)
(1.09)
(1.04)
(.98)
Net realized gains
(3.92)
(3.36)
(6.55)
Total distributions
(5.22)
(1.40)
(4.45)
(7.59)
(.98)
Net asset value, end of period
$56.47
$54.61
$49.82
$60.06
$60.49
Total Return (%)b
13.66
12.49
(9.58)
14.53
6.94
Ratios to Average Net Assets and Supplemental Data
Net assets, end of period ($ millions)
804
774
763
963
931
Ratio of expenses (%)
1.02
1.01
1.02
1.03
1.03
Ratio of net investment income (%)
2.58
2.02
2.47
2.13
1.81
Portfolio turnover rate (%)
55
46
101
40
69
a
Based on average shares outstanding during the period.
b
Total return does not reflect the effect of any sales charges.
The accompanying notes are an integral part of the financial statements.
DWS CROCI® Equity Dividend Fund
|
23

DWS CROCI® Equity Dividend Fund Class C
 
Years Ended November 30,
 
2022
2021
2020
2019
2018
Selected Per Share Data
Net asset value, beginning of period
$54.41
$49.65
$59.90
$60.30
$57.31
Income (loss) from investment operations:


Net investment incomea
.94
.66
.83
.78
.56
Net realized and unrealized gain (loss)
5.69
5.07
(6.98)
5.99
2.97
Total from investment operations
6.63
5.73
(6.15)
6.77
3.53
Less distributions from:


Net investment income
(.86)
(.97)
(.74)
(.62)
(.54)
Net realized gains
(3.92)
(3.36)
(6.55)
Total distributions
(4.78)
(.97)
(4.10)
(7.17)
(.54)
Net asset value, end of period
$56.26
$54.41
$49.65
$59.90
$60.30
Total Return (%)b
12.74c
11.57
(10.28)
13.75c
6.20c
Ratios to Average Net Assets and Supplemental Data
Net assets, end of period ($ millions)
14
14
18
30
32
Ratio of expenses before expense reductions(%)
1.83
1.83
1.80
1.76
1.78
Ratio of expenses after expense reductions(%)
1.83
1.83
1.80
1.73
1.77
Ratio of net investment income (%)
1.76
1.21
1.67
1.44
.98
Portfolio turnover rate (%)
55
46
101
40
69
a
Based on average shares outstanding during the period.
b
Total return does not reflect the effect of any sales charges.
c
Total return would have been lower had certain expenses not been reduced.
The accompanying notes are an integral part of the financial statements.
24
|
DWS CROCI® Equity Dividend Fund

DWS CROCI® Equity Dividend Fund Class R
 
Years Ended November 30,
 
2022
2021
2020
2019
2018
Selected Per Share Data


Net asset value, beginning of period
$54.40
$49.64
$59.86
$60.32
$57.39
Income (loss) from investment operations:


Net investment incomea
1.20
.93
1.07
.99
.88
Net realized and unrealized gain (loss)
5.69
5.05
(6.99)
5.98
2.88
Total from investment operations
6.89
5.98
(5.92)
6.97
3.76
Less distributions from:


Net investment income
(1.12)
(1.22)
(.94)
(.88)
(.83)
Net realized gains
(3.92)
(3.36)
(6.55)
Total distributions
(5.04)
(1.22)
(4.30)
(7.43)
(.83)
Net asset value, end of period
$56.25
$54.40
$49.64
$59.86
$60.32
Total Return (%)b
13.30
12.10
(9.86)
14.19
6.62
Ratios to Average Net Assets and Supplemental Data
Net assets, end of period ($ millions)
.4
.4
1
1
2
Ratio of expenses before expense reductions(%)
1.43
1.36
1.37
1.40
1.38
Ratio of expenses after expense reductions(%)
1.34
1.34
1.35
1.34
1.31
Ratio of net investment income (%)
2.24
1.70
2.15
1.81
1.53
Portfolio turnover rate (%)
55
46
101
40
69
a
Based on average shares outstanding during the period.
b
Total return would have been lower had certain expenses not been reduced.
The accompanying notes are an integral part of the financial statements.
DWS CROCI® Equity Dividend Fund
|
25

DWS CROCI® Equity Dividend Fund Class R6
 
Years Ended November 30,
 
2022
2021
2020
2019
2018
Selected Per Share Data


Net asset value, beginning of period
$54.66
$49.88
$60.12
$60.55
$57.60
Income (loss) from investment operations:


Net investment incomea
1.46
1.32
1.39
1.36
1.48
Net realized and unrealized gain (loss)
5.82
5.06
(7.01)
6.00
2.66
Total from investment operations
7.28
6.38
(5.62)
7.36
4.14
Less distributions from:


Net investment income
(1.49)
(1.60)
(1.26)
(1.24)
(1.19)
Net realized gains
(3.92)
(3.36)
(6.55)
Total distributions
(5.41)
(1.60)
(4.62)
(7.79)
(1.19)
Net asset value, end of period
$56.53
$54.66
$49.88
$60.12
$60.55
Total Return (%)
14.07
12.86
(9.24)
14.95
7.30
Ratios to Average Net Assets and Supplemental Data
Net assets, end of period ($ thousands)
1,090
4,205
3,889
8,701
3,251
Ratio of expenses (%)
.67
.66
.66
.67
.68
Ratio of net investment income (%)
2.69
2.38
2.79
2.47
2.54
Portfolio turnover rate (%)
55
46
101
40
69
a
Based on average shares outstanding during the period.
The accompanying notes are an integral part of the financial statements.
26
|
DWS CROCI® Equity Dividend Fund

DWS CROCI® Equity Dividend Fund Class S
 
Years Ended November 30,
 
2022
2021
2020
2019
2018
Selected Per Share Data
Net asset value, beginning of period
$54.59
$49.80
$60.06
$60.49
$57.55
Income (loss) from investment operations:


Net investment incomea
1.50
1.20
1.31
1.26
1.18
Net realized and unrealized gain (loss)
5.69
5.09
(7.02)
6.03
2.88
Total from investment operations
7.19
6.29
(5.71)
7.29
4.06
Less distributions from:


Net investment income
(1.40)
(1.50)
(1.19)
(1.17)
(1.12)
Net realized gains
(3.92)
(3.36)
(6.55)
Total distributions
(5.32)
(1.50)
(4.55)
(7.72)
(1.12)
Net asset value, end of period
$56.46
$54.59
$49.80
$60.06
$60.49
Total Return (%)
13.90
12.70
(9.42)b
14.81b
7.17b
Ratios to Average Net Assets and Supplemental Data
Net assets, end of period ($ millions)
45
41
80
110
63
Ratio of expenses before expense reductions(%)
.80
.82
.84
.82
.80
Ratio of expenses after expense reductions(%)
.80
.82
.84
.82
.80
Ratio of net investment income (%)
2.79
2.20
2.65
2.29
2.03
Portfolio turnover rate (%)
55
46
101
40
69
a
Based on average shares outstanding during the period.
b
Total return would have been lower had certain expenses not been reduced.
The accompanying notes are an integral part of the financial statements.
DWS CROCI® Equity Dividend Fund
|
27

DWS CROCI® Equity Dividend Fund Institutional Class
 
Years Ended November 30,
 
2022
2021
2020
2019
2018
Selected Per Share Data
Net asset value, beginning of period
$54.63
$49.85
$60.11
$60.53
$57.57
Income (loss) from investment operations:


Net investment incomea
1.55
1.26
1.35
1.31
1.22
Net realized and unrealized gain (loss)
5.70
5.07
(7.02)
6.02
2.87
Total from investment operations
7.25
6.33
(5.67)
7.33
4.09
Less distributions from:


Net investment income
(1.44)
(1.55)
(1.23)
(1.20)
(1.13)
Net realized gains
(3.92)
(3.36)
(6.55)
Total distributions
(5.36)
(1.55)
(4.59)
(7.75)
(1.13)
Net asset value, end of period
$56.52
$54.63
$49.85
$60.11
$60.53
Total Return (%)
14.01
12.76b
(9.35)b
14.88b
7.21
Ratios to Average Net Assets and Supplemental Data
Net assets, end of period ($ millions)
105
107
153
180
48
Ratio of expenses before expense reductions(%)
.72
.78
.77
.77
.76
Ratio of expenses after expense reductions(%)
.72
.76
.76
.75
.76
Ratio of net investment income (%)
2.88
2.28
2.72
2.37
2.09
Portfolio turnover rate (%)
55
46
101
40
69
a
Based on average shares outstanding during the period.
b
Total return would have been lower had certain expenses not been reduced.
The accompanying notes are an integral part of the financial statements.
28
|
DWS CROCI® Equity Dividend Fund

Notes to Financial Statements
A.
Organization and Significant Accounting Policies
DWS CROCI® Equity Dividend Fund (the “Fund” ) is a diversified series of Deutsche DWS Investment Trust (the “Trust”  ), which is registered under the Investment Company Act of 1940, as amended (the “1940 Act”  ), as an open-end management investment company organized as a Massachusetts business trust.
The Fund offers multiple classes of shares which provide investors with different purchase options. Class A shares are subject to an initial sales charge. Class C shares are not subject to an initial sales charge but are subject to higher ongoing expenses than Class A shares and a contingent deferred sales charge payable upon certain redemptions within one year of purchase. Class C shares automatically convert to Class A shares in the same fund after 8 years, provided that the Fund or the financial intermediary through which the shareholder purchased the Class C shares has records verifying that the Class C shares have been held for at least 8 years. Class R shares are not subject to initial or contingent deferred sales charges and are generally available only to certain retirement plans. Class R6 shares are not subject to initial or contingent deferred sales charges and are generally available only to certain qualifying plans and programs. Class S shares are not subject to initial or contingent deferred sales charges and are available through certain intermediary relationships with financial services firms, or can be purchased by establishing an account directly with the Fund’s transfer agent. Institutional Class shares are not subject to initial or contingent deferred sales charges and are generally available only to qualified institutions.
Investment income, realized and unrealized gains and losses, and certain fund-level expenses and expense reductions, if any, are borne pro rata on the basis of relative net assets by the holders of all classes of shares, except that each class bears certain expenses unique to that class such as distribution and service fees, services to shareholders and certain other class-specific expenses. Differences in class-level expenses may result in payment of different per share dividends by class. All shares of the Fund have equal rights with respect to voting subject to class-specific arrangements.
The Fund’s financial statements are prepared in accordance with accounting principles generally accepted in the United States of America (“U.S. GAAP” ) which require the use of management estimates. Actual results could differ from those estimates. The Fund qualifies as an investment company under Topic 946 of Accounting Standards Codification of U.S. GAAP. The policies described below are followed consistently by the Fund in the preparation of its financial statements.
DWS CROCI® Equity Dividend Fund
|
29

Security Valuation.Investments are stated at value determined as of the close of regular trading on the New York Stock Exchange on each day the exchange is open for trading.
The Fund’s Board has designated DWS Investment Management Americas, Inc. (the “Advisor” ) as the valuation designee for the Fund pursuant to Rule 2a-5 under the 1940 Act. The Advisor’s Pricing Committee (the “Pricing Committee” ) typically values securities using readily available market quotations or prices supplied by independent pricing services (which are considered fair values under Rule 2a-5). The Advisor has adopted fair valuation procedures that provide methodologies for fair valuing securities.
Various inputs are used in determining the value of the Fund’s investments. These inputs are summarized in three broad levels. Level 1 includes quoted prices in active markets for identical securities. Level 2 includes other significant observable inputs (including quoted prices for similar securities, interest rates, prepayment speeds and credit risk). Level 3 includes significant unobservable inputs (including the Fund’s own assumptions in determining the fair value of investments). The level assigned to the securities valuations may not be an indication of the risk or liquidity associated with investing in those securities.
Equity securities are valued at the most recent sale price or official closing price reported on the exchange (U.S. or foreign) or over-the-counter market on which they trade. Securities for which no sales are reported are valued at the calculated mean between the most recent bid and asked quotations on the relevant market or, if a mean cannot be determined, at the most recent bid quotation. Equity securities are generally categorized as Level 1. For certain international equity securities, in order to adjust for events which may occur between the close of the foreign exchanges and the close of the New York Stock Exchange, a fair valuation model may be used. This fair valuation model takes into account comparisons to the valuation of American Depository Receipts (ADRs), exchange-traded funds, futures contracts and certain indices and these securities are categorized as Level 2.
Investments in open-end investment companies are valued at their net asset value each business day and are categorized as Level 1.
Securities and other assets for which market quotations are not readily available or for which the above valuation procedures are deemed not to reflect fair value are valued in a manner that is intended to reflect their fair value as determined in accordance with procedures approved by the Pricing Committee and are generally categorized as Level 3. In accordance with the Fund’s valuation procedures, factors considered in determining value may include, but are not limited to, the type of the security; the size of the holding; the initial cost of the security; the existence of any contractual restrictions on the security’s disposition; the price and extent
30
|
DWS CROCI® Equity Dividend Fund

of public trading in similar securities of the issuer or of comparable companies; quotations or evaluated prices from broker-dealers and/or pricing services; information obtained from the issuer, analysts, and/or the appropriate stock exchange (for exchange-traded securities); an analysis of the company’s or issuer’s financial statements; an evaluation of the forces that influence the issuer and the market(s) in which the security is purchased and sold; and with respect to debt securities, the maturity, coupon, creditworthiness, currency denomination and the movement of the market in which the security is normally traded. The value determined under these procedures may differ from published values for the same securities.
Disclosure about the classification of fair value measurements is included in a table following the Fund’s Investment Portfolio.
Foreign Currency Translations.The books and records of the Fund are maintained in U.S. dollars. Investment securities and other assets and liabilities denominated in a foreign currency are translated into U.S. dollars at the prevailing exchange rates at period end. Purchases and sales of investment securities, income and expenses are translated into U.S. dollars at the prevailing exchange rates on the respective dates of the transactions.
Net realized and unrealized gains and losses on foreign currency transactions represent net gains and losses between trade and settlement dates on securities transactions, the acquisition and disposition of foreign currencies, and the difference between the amount of net investment income accrued and the U.S. dollar amount actually received. The portion of both realized and unrealized gains and losses on investments that results from fluctuations in foreign currency exchange rates is not separately disclosed but is included with net realized and unrealized gain/appreciation and loss/depreciation on investments.
Securities Lending.Deutsche Bank AG, as lending agent, lends securities of the Fund to certain financial institutions under the terms of its securities lending agreement. During the term of the loans, the Fund continues to receive interest and dividends generated by the securities and to participate in any changes in their market value. The Fund requires the borrowers of the securities to maintain collateral with the Fund consisting of either cash or liquid, unencumbered assets having a value at least equal to the value of the securities loaned. When the collateral falls below specified amounts, the lending agent will use its best efforts to obtain additional collateral on the next business day to meet required amounts under the securities lending agreement. As of period end, any securities on loan were collateralized by cash. During the year ended November 30, 2022, the Fund invested the cash collateral into a joint trading account in DWS Government & Agency Securities Portfolio, an affiliated money market fund managed by DWS Investment Management
DWS CROCI® Equity Dividend Fund
|
31

Americas, Inc. DWS Investment Management Americas, Inc. receives a management/administration fee (0.07% annualized effective rate as of November 30, 2022) on the cash collateral invested in DWS Government & Agency Securities Portfolio. The Fund receives compensation for lending its securities either in the form of fees or by earning interest on invested cash collateral net of borrower rebates and fees paid to a lending agent. Either the Fund or the borrower may terminate the loan at any time, and the borrower, after notice, is required to return borrowed securities within a standard time period. There may be risks of delay and costs in recovery of securities or even loss of rights in the collateral should the borrower of the securities fail financially. If the Fund is not able to recover securities lent, the Fund may sell the collateral and purchase a replacement investment in the market, incurring the risk that the value of the replacement security is greater than the value of the collateral. The Fund is also subject to all investment risks associated with the reinvestment of any cash collateral received, including, but not limited to, interest rate, credit and liquidity risk associated with such investments.
As of November 30, 2022, the Fund had no securities on loan.
Federal Income Taxes.The Fund’s policy is to comply with the requirements of the Internal Revenue Code, as amended, which are applicable to regulated investment companies, and to distribute all of its taxable income to its shareholders.
The Fund has reviewed the tax positions for the open tax years as of November 30, 2022 and has determined that no provision for income tax and/or uncertain tax positions is required in the Fund’s financial statements. The Fund’s federal tax returns for the prior three fiscal years remain open subject to examination by the Internal Revenue Service.
Distribution of Income and Gains.Distributions from net investment income of the Fund, if any, are declared and distributed to shareholders quarterly. Net realized gains from investment transactions, in excess of available capital loss carryforwards, would be taxable to the Fund if not distributed, and, therefore, will be distributed to shareholders at least annually. The Fund may also make additional distributions for tax purposes if necessary.
The timing and characterization of certain income and capital gain distributions are determined annually in accordance with federal tax regulations which may differ from accounting principles generally accepted in the United States of America. These differences primarily relate to certain securities sold at a loss. The Fund utilized a portion of the proceeds from capital shares redeemed as a distribution from net investment income and realized capital gains. As a result, net investment income (loss) and net realized gain (loss) on investment transactions for a reporting period may differ significantly from distributions during such
32
|
DWS CROCI® Equity Dividend Fund

period. Accordingly, the Fund may periodically make reclassifications among certain of its capital accounts without impacting the net asset value of the Fund.
At November 30, 2022, the Fund’s components of distributable earnings (accumulated losses) on a net tax basis were as follows:
Undistributed ordinary income*
$25,377,827
Undistributed long-term capital gains
$25,190,944
Net unrealized appreciation (depreciation) on investments
$95,056,659
At November 30, 2022, the aggregate cost of investments for federal income tax purposes was $872,523,645. The net unrealized appreciation for all investments based on tax cost was $95,056,659. This consisted of aggregate gross unrealized appreciation for all investments for which there was an excess of value over tax cost of $129,290,134 and aggregate gross unrealized depreciation for all investments for which there was an excess of tax cost over value of $34,233,475.
In addition, the tax character of distributions paid to shareholders by the Fund is summarized as follows:
 
Years Ended November 30,
 
2022
2021
Distributions from ordinary income*
$ 23,466,311
$26,783,365
Distributions from long-term capital gains
$ 66,639,222
$
*
For tax purposes, short-term capital gain distributions are considered ordinary
income distributions.
Expenses.Expenses of the Trust arising in connection with a specific fund are allocated to that fund. Other Trust expenses which cannot be directly attributed to a fund are apportioned among the funds in the Trust based upon the relative net assets or other appropriate measures.
Contingencies.In the normal course of business, the Fund may enter into contracts with service providers that contain general indemnification clauses. The Fund’s maximum exposure under these arrangements is unknown, as this would involve future claims that may be made against the Fund that have not yet been made. However, based on experience, the Fund expects the risk of loss to be remote.
Other.Investment transactions are accounted for on a trade date plus one basis for daily net asset value calculations. However, for financial reporting purposes, investment transactions are reported on trade date. Interest income is recorded on the accrual basis. Dividend income is recorded on the ex-dividend date net of foreign withholding taxes. Realized gains and losses from investment transactions are recorded on an identified cost
DWS CROCI® Equity Dividend Fund
|
33

basis. Proceeds from litigation payments, if any, are included in net realized gain (loss) from investments.
B.
Purchases and Sales of Securities
During the year ended November 30, 2022, purchases and sales of investment securities (excluding short-term investments) aggregated $516,034,535 and $584,707,890, respectively.
C.
Related Parties
Management Agreement.Under the Investment Management Agreement with DWS Investment Management Americas, Inc. (“DIMA”  or the “Advisor” ), an indirect, wholly owned subsidiary of DWS Group GmbH & Co. KGaA (“DWS Group” ), the Advisor directs the investments of the Fund in accordance with its investment objectives, policies and restrictions. The Advisor determines the securities, instruments and other contracts relating to investments to be purchased, sold or entered into by the Fund. In addition to portfolio management services, the Advisor provides certain administrative services in accordance with the Investment Management Agreement.
Under the Investment Management Agreement with the Advisor, the Fund pays a monthly management fee based on the average daily net assets of the Fund, computed and accrued daily and payable monthly, at the following annual rates:
First $250 million of the Fund’s average daily net assets
.63%
Next $750 million of such net assets
.60%
Next $1.5 billion of such net assets
.58%
Next $2.5 billion of such net assets
.56%
Next $2.5 billion of such net assets
.53%
Next $2.5 billion of such net assets
.52%
Next $2.5 billion of such net assets
.51%
Over $12.5 billion of such net assets
.50%
Accordingly, for the year ended November 30, 2022, the fee pursuant to the Investment Management Agreement was equivalent to an annual rate (exclusive of any applicable waivers/reimbursements) of 0.608% of the Fund’s average daily net assets.
For the period from December 1, 2021 through September 30, 2022 (through February 28, 2022 for Class R shares), the Advisor had contractually agreed to waive its fees and/or reimburse certain operating expenses of the Fund to the extent necessary to maintain the total annual operating expenses (excluding certain expenses such as extraordinary
34
|
DWS CROCI® Equity Dividend Fund

expenses, taxes, brokerage and interest expense) of each class as follows:
Class A
1.11%
Class C
1.86%
Class R
1.34%
Class R6
.86%
Class S
.86%
Institutional Class
.86%
For the period from March 1, 2022 through September 30, 2022, the Advisor had contractually agreed to waive its fees and/or reimburse certain operating expenses to the extent necessary to maintain the total annual operating expenses (excluding certain expenses such as extraordinary expenses, taxes, brokerage and interest expense) of Class R shares at 1.36%.
Effective October 1, 2022 through September 30, 2023, the Advisor has contractually agreed to waive its fees and/or reimburse certain operating expenses of the Fund to the extent necessary to maintain the total annual operating expenses (excluding certain expenses such as extraordinary expenses, taxes, brokerage and interest expense) of each class as follows:
Class A
 
1.02%
Class C
 
1.77%
Class R
 
1.27%
Class R6
 
.77%
Class S
 
.82%
Institutional Class
 
.77%
In addition, for the period from December 1, 2021 through November 30, 2022, the Advisor voluntarily agreed to waive its fees and/or reimburse certain operating expenses of Class R6 and Institutional Class shares to the extent necessary to maintain the total annual operating expenses (excluding certain expenses such as extraordinary expenses, taxes, brokerage and interest expense) at 0.76%. This voluntary waiver or reimbursement may be terminated at any time at the option of the Advisor.
DWS CROCI® Equity Dividend Fund
|
35

For the year ended November 30, 2022, fees waived and/or expenses reimbursed for certain classes are as follows:
Class C
$666
Class R
381
 
$1,047
Service Provider Fees.DWS Service Company (“DSC” ), an affiliate of the Advisor, is the transfer agent, dividend-paying agent and shareholder service agent for the Fund. Pursuant to a sub-transfer agency agreement between DSC and DST Systems, Inc. (“DST” ), DSC has delegated certain transfer agent, dividend-paying agent and shareholder service agent functions to DST. DSC compensates DST out of the shareholder servicing fee it receives from the Fund. For the year ended November 30, 2022 (through September 30, 2022 for Class T shares), the amounts charged to the Fund by DSC were as follows:
Services to Shareholders
Total
Aggregated
Unpaid at
November 30, 2022
Class A
$ 315,742
$51,892
Class T
22
2
Class C
5,254
837
Class R
239
31
Class R6
266
45
Class S
8,743
1,456
Institutional Class
1,473
253
 
$331,739
$54,516
Pursuant to a fund accounting agreement, DIMA is responsible for computing the daily net asset value per share and maintaining the portfolio and general accounting records of the Fund. DIMA has delegated certain fund accounting and record-keeping services to State Street Bank and Trust Company. The costs and expenses of such delegation are paid by DIMA. The Fund paid no fee to DIMA for fund accounting and record-keeping services provided under the fund accounting agreement during the period.
In addition, for the year ended November 30, 2022, the amounts charged to the Fund for recordkeeping and other administrative services provided
36
|
DWS CROCI® Equity Dividend Fund

by unaffiliated third parties, included in the Statement of Operations under “Services to shareholders,”  were as follows:
Sub-Recordkeeping
Total
Aggregated
Class A
$613,636
Class C
18,754
Class R
924
Class S
50,786
Institutional Class
57,726
 
$741,826
Distribution and Service Fees.Under the Fund’s Class C and R 12b-1 Plans, DWS Distributors, Inc. (“DDI” ), an affiliate of the Advisor, receives a fee (“Distribution Fee” ) of 0.75% of the average daily net assets of Class C shares and 0.25% of the average daily net assets of Class R shares. In accordance with the Fund’s Underwriting and Distribution Services Agreement, DDI enters into related selling group agreements with various firms at various rates for sales of Class C and R shares. For the year ended November 30, 2022, the Distribution Fee was as follows:
Distribution Fee
Total
Aggregated
Unpaid at
November 30, 2022
Class C
$ 101,017
$7,966
Class R
1,003
71
 
$102,020
$8,037
In addition, DDI provides information and administrative services for a fee (“Service Fee” ) to Class A, T, C and R shareholders at an annual rate of up to 0.25% of the average daily net assets for each such class. DDI in turn has various agreements with financial services firms that provide these services and pays these fees based upon the assets of shareholder accounts the firms service. For the year ended November 30, 2022 (through September 30, 2022 for Class T shares), the Service Fee was as follows:
Service Fee
Total
Aggregated
Unpaid at
November 30, 2022
Annual
Rate
Class A
$ 1,876,224
$ 303,760
.24%
Class T
18
11
.15%
Class C
32,850
6,971
.24%
Class R
945
293
.24%
 
$1,910,037
$311,035
 
DWS CROCI® Equity Dividend Fund
|
37

Underwriting Agreement and Contingent Deferred Sales Charge.DDI is the principal underwriter for the Fund. Underwriting commissions paid in connection with the distribution of Class A shares for the year ended November 30, 2022 aggregated $16,830.
In addition, DDI receives any contingent deferred sales charge (“CDSC” ) from Class C share redemptions occurring within one year of purchase. There is no such charge upon redemption of any share appreciation or reinvested dividends. The CDSC is 1% of the value of the shares redeemed for Class C. For the year ended November 30, 2022, the CDSC for Class C shares aggregated $716. A deferred sales charge of up to 1% is assessed on certain redemptions of Class A shares. For the year ended November 30, 2022, DDI received $162 for Class A shares.
Other Service Fees.Under an agreement with the Fund, DIMA is compensated for providing regulatory filing services to the Fund. For the year ended November 30, 2022, the amount charged to the Fund by DIMA included in the Statement of Operations under “Reports to shareholders”  aggregated $1,299, of which $671 is unpaid.
Trustees’ Fees and Expenses.The Fund paid retainer fees to each Trustee not affiliated with the Advisor, plus specified amounts to the Board Chairperson and to each committee Chairperson.
Affiliated Cash Management Vehicles.The Fund may invest uninvested cash balances in DWS Central Cash Management Government Fund and DWS ESG Liquidity Fund, affiliated money market funds which are managed by the Advisor. Each affiliated money market fund is managed in accordance with Rule 2a-7 under the 1940 Act, which governs the quality, maturity, diversity and liquidity of instruments in which a money market fund may invest. DWS Central Cash Management Government Fund seeks to maintain a stable net asset value, and DWS ESG Liquidity Fund maintains a floating net asset value. The Fund indirectly bears its proportionate share of the expenses of each affiliated money market fund in which it invests. DWS Central Cash Management Government Fund does not pay the Advisor an investment management fee. To the extent that DWS ESG Liquidity Fund pays an investment management fee to the Advisor, the Advisor will waive an amount of the investment management fee payable to the Advisor by the Fund equal to the amount of the investment management fee payable on the Fund’s assets invested in DWS ESG Liquidity Fund.
Securities Lending Agent Fees.Deutsche Bank AG serves as securities lending agent for the Fund. For the year ended November 30, 2022, the Fund incurred securities lending agent fees to Deutsche Bank AG in the amount of $228.
38
|
DWS CROCI® Equity Dividend Fund

D.
Line of Credit
The Fund and other affiliated funds (the “Participants” ) share in a $375 million revolving credit facility provided by a syndication of banks. The Fund may borrow for temporary or emergency purposes, including the meeting of redemption requests that otherwise might require the untimely disposition of securities. The Participants are charged an annual commitment fee, which is allocated based on net assets, among each of the Participants. Interest is calculated at a daily fluctuating rate per annum equal to the sum of 0.10% plus the higher of the Federal Funds Effective Rate and the Overnight Bank Funding Rate, plus 1.25%. The Fund may borrow up to a maximum of 33 percent of its net assets under the agreement. The Fund had no outstanding loans at November 30, 2022.
E.
Fund Share Transactions
The following table summarizes share and dollar activity in the Fund:
 
Year Ended
November 30, 2022
Year Ended
November 30, 2021
 
Shares
Dollars
Shares
Dollars
Shares sold
Class A
  346,315
$18,627,489
  367,806
$20,277,473
Class C
   45,508
  2,467,409
   14,657
    798,548
Class R
      567
     30,042
      655
     36,263
Class R6
   30,204
  1,668,905
   15,069
    833,990
Class S
  194,457
10,244,265
  240,691
13,000,886
Institutional Class
  397,054
21,283,616
1,358,149
73,139,841
 
 
$54,321,726
 
$108,087,001
Shares issued to shareholders in reinvestment of distributions
Class A
1,309,180
$70,077,606
  361,919
$19,522,948
Class T
        25*
      1,324*
         7
         348
Class C
   22,124
  1,184,554
    5,612
    300,670
Class R
      742
     39,639
      216
     11,529
Class R6
    6,997
    376,935
    2,218
    119,671
Class S
   74,963
  4,005,716
   28,031
  1,491,161
Institutional Class
  189,299
10,127,705
   76,311
  4,102,848
 
 
$85,813,479
 
$25,549,175
DWS CROCI® Equity Dividend Fund
|
39

 
Year Ended
November 30, 2022
Year Ended
November 30, 2021
 
Shares
Dollars
Shares
Dollars
Shares redeemed
Class A
(1,595,167)
$(85,583,645)
(1,871,464)
$(102,499,560)
Class T
      (274)*
     (13,082)*
       
         
Class C
   (79,131)
  (4,277,148)
  (133,894)
  (7,352,239)
Class R
    (2,865)
    (151,324)
    (7,589)
    (390,519)
Class R6
   (94,855)
  (5,171,761)
   (18,331)
    (997,492)
Class S
  (221,100)
(11,905,713)
(1,128,002)
(60,039,069)
Institutional Class
  (685,754)
(36,901,027)
(2,552,676)
(140,112,515)
 
 
$(144,003,700)
 
$(311,391,394)
Net increase (decrease)
Class A
   60,328
  $3,121,450
(1,141,739)
$(62,699,139)
Class T
      (249)*
     (11,758)*
         7
         348
Class C
   (11,499)
    (625,185)
  (113,625)
  (6,253,021)
Class R
    (1,556)
     (81,643)
    (6,718)
    (342,727)
Class R6
   (57,654)
  (3,125,921)
    (1,044)
     (43,831)
Class S
   48,320
  2,344,268
  (859,280)
(45,547,022)
Institutional Class
   (99,401)
  (5,489,706)
(1,118,216)
(62,869,826)
 
 
$(3,868,495)
 
$(177,755,218)
*
For the period from December 1, 2021 to September 30, 2022 (Class T liquidation date).
F.
Other COVID-19 Pandemic
A novel coronavirus known as COVID-19, declared a pandemic by the World Health Organization, which at times has caused significant uncertainty, market volatility, decreased economic and other activity, increased government activity, including economic stimulus measures, and supply chain interruptions. The full effects, duration and costs of the COVID-19 pandemic are impossible to predict, and the circumstances surrounding the COVID-19 pandemic will continue to evolve, including the risk of future increased rates of infection due to significant portions of the population remaining unvaccinated and/or the lack of effectiveness of current vaccines against new variants. The pandemic has affected and may continue to affect certain countries, industries, economic sectors, companies and investment products more than others, may exacerbate existing economic, political, or social tensions and may increase the probability of an economic recession or depression. The Fund and its
40
|
DWS CROCI® Equity Dividend Fund

investments may be adversely affected by the effects of the COVID-19 pandemic. Management will continue to monitor the impact COVID-19 has on the Fund and reflect the consequences as appropriate in the Fund’s accounting and financial reporting.
DWS CROCI® Equity Dividend Fund
|
41

Report of Independent Registered Public Accounting Firm
To the Board of Trustees of Deutsche DWS Investment Trust and Shareholders of DWS CROCI® Equity Dividend Fund:
Opinion on the Financial Statements
We have audited the accompanying statement of assets and liabilities of DWS CROCI® Equity Dividend Fund (the “Fund” ) (one of the funds constituting Deutsche DWS Investment Trust) (the “Trust” ), including the investment portfolio, as of November 30, 2022, and the related statement of operations for the year then ended, the statements of changes in net assets for each of the two years in the period then ended, the financial highlights for each of the five years in the period then ended and the related notes (collectively referred to as the “financial statements” ). In our opinion, the financial statements present fairly, in all material respects, the financial position of the Fund (one of the funds constituting Deutsche DWS Investment Trust) at November 30, 2022, the results of its operations for the year then ended, the changes in its net assets for each of the two years in the period then ended and its financial highlights for each of the five years in the period then ended, in conformity with U.S. generally accepted accounting principles.
Basis for Opinion
These financial statements are the responsibility of the Trust’s management. Our responsibility is to express an opinion on the Fund’s financial statements based on our audits. We are a public accounting firm registered with the Public Company Accounting Oversight Board (United States) (“PCAOB” ) and are required to be independent with respect to the Trust in accordance with the U.S. federal securities laws and the applicable rules and regulations of the Securities and Exchange Commission and the PCAOB.
We conducted our audits in accordance with the standards of the PCAOB. Those standards require that we plan and perform the audit to obtain reasonable assurance about whether the financial statements are free of material misstatement, whether due to error or fraud. The Trust is not required to have, nor were we engaged to perform, an audit of the Trust’s internal control over financial reporting. As part of our audits, we are required to obtain an understanding of internal control over financial reporting, but not for the purpose of expressing an opinion on the effectiveness of the Trust’s internal control over financial reporting. Accordingly, we express no such opinion.
42
|
DWS CROCI® Equity Dividend Fund

Our audits included performing procedures to assess the risks of material misstatement of the financial statements, whether due to error or fraud, and performing procedures that respond to those risks. Such procedures included examining, on a test basis, evidence regarding the amounts and disclosures in the financial statements. Our procedures included confirmation of securities owned as of November 30, 2022, by correspondence with the custodian, brokers and others; when replies were not received from brokers and others, we performed other auditing procedures. Our audits also included evaluating the accounting principles used and significant estimates made by management, as well as evaluating the overall presentation of the financial statements. We believe that our audits provide a reasonable basis for our opinion.
We have served as the auditor of one or more investment companies in the DWS family of funds since at least 1979, but we are unable to determine the specific year.
Boston, Massachusetts
January 24, 2023
DWS CROCI® Equity Dividend Fund
|
43

Information About Your Fund’s Expenses
As an investor of the Fund, you incur two types of costs: ongoing expenses and transaction costs. Ongoing expenses include management fees, distribution and service (12b-1) fees and other Fund expenses. Examples of transaction costs include sales charges (loads) and account maintenance fees, which are not shown in this section. The following tables are intended to help you understand your ongoing expenses (in dollars) of investing in the Fund and to help you compare these expenses
with the ongoing expenses of investing in other mutual funds.In the most recent six-month period, the Fund limited these expenses for Class C and
Class R shares; had it not done so, expenses would have been higher.The example in the table is based on an investment of $1,000 invested at the beginning of the six-month period and held for the entire period (June 1, 2022 to November 30, 2022).
The tables illustrate your Fund’s expenses in two ways:
— 
Actual Fund Return. This helps you estimate the actual dollar amount of ongoing expenses (but not transaction costs) paid on a $1,000 investment in the Fund using the Fund’s actual return during the period. To estimate the expenses you paid over the period, simply divide your account value by $1,000 (for example, an $8,600 account value divided by $1,000 = 8.6), then multiply the result by the number in the “Expenses Paid per $1,000”  line under the share class you hold.
— 
Hypothetical 5% Fund Return. This helps you to compare your Fund’s ongoing expenses (but not transaction costs) with those of other mutual funds using the Fund’s actual expense ratio and a hypothetical rate of return of 5% per year before expenses. Examples using a 5% hypothetical fund return may be found in the shareholder reports of other mutual funds. The hypothetical account values and expenses may not be used to estimate the actual ending account balance or expenses you paid for the period.
Please note that the expenses shown in these tables are meant to highlight your ongoing expenses only and do not reflect any transaction costs. The “Expenses Paid per $1,000”  line of the tables is useful in comparing ongoing expenses only and will not help you determine the
relative total expense of owning different funds.Subject to certain exceptions, an account maintenance fee of $20.00 assessed once per calendar year for Classes A, C and S shares may apply for accounts with balances less than $10,000. This fee is not included in these tables. If it was, the estimate of expenses paid for Classes A, C and S shares during the period would be higher, and account value during the period would be lower, by this amount.
44
|
DWS CROCI® Equity Dividend Fund

Expenses and Value of a $1,000 Investment
for the six months ended November 30, 2022 (Unaudited)
Actual Fund Return
Class A
Class C
Class R
Class R6
Class S
Institutional
Class
Beginning Account
Value 6/1/22
$1,000.00
$1,000.00
$1,000.00
$1,000.00
$1,000.00
$1,000.00
Ending Account
Value 11/30/22
$1,029.70
$1,025.60
$1,028.20
$1,031.50
$1,030.90
$1,031.50
Expenses Paid
per $1,000*
$5.19
$9.19
$6.71
$3.46
$3.97
$3.41
Hypothetical 5%
Fund Return
Class A
Class C
Class R
Class R6
Class S
Institutional
Class
Beginning Account
Value 6/1/22
$1,000.00
$1,000.00
$1,000.00
$1,000.00
$1,000.00
$1,000.00
Ending Account
Value 11/30/22
$1,019.95
$1,015.99
$1,018.45
$1,021.66
$1,021.16
$1,021.71
Expenses Paid
per $1,000*
$5.17
$9.15
$6.68
$3.45
$3.95
$3.40
*
Expenses are equal to the Fund’s annualized expense ratio for each share class,
multiplied by the average account value over the period, multiplied by 183 (the number of
days in the most recent six-month period), then divided by 365.
Annualized Expense
Ratios
Class A
Class C
Class R
Class R6
Class S
Institutional
Class
DWS CROCI® Equity
Dividend Fund
   1.02%
   1.81%
   1.32%
   .68%
   .78%
   .67%
For more information, please refer to the Fund’s prospectus.
For an analysis of the fees associated with an investment in the Fund or similar funds, please refer to tools.finra.org/fund_analyzer/.
DWS CROCI® Equity Dividend Fund
|
45

Tax Information (Unaudited)
The Fund paid distributions of $3.89 per share from net long-term capital gains during its year ended November 30, 2022.
Pursuant to Section 852 of the Internal Revenue Code, the Fund designates $31,800,000 as capital gain dividends for its year ended November 30, 2022.
For corporate shareholders, 100% of the ordinary dividends (i.e., income dividends plus short-term capital gains) paid during the Fund’s fiscal year ended November 30, 2022, qualified for the dividends received deduction.
For federal income tax purposes, the Fund designates approximately $37,400,000, or the maximum amount allowable under tax law, as qualified dividend income.
Please consult a tax advisor if you have questions about federal or state income tax laws, or on how to prepare your tax returns. If you have specific questions about your account, please call (800) 728-3337.
46
|
DWS CROCI® Equity Dividend Fund

Advisory Agreement Board Considerations and Fee Evaluation
The Board of Trustees (hereinafter referred to as the “Board”  or “Trustees” ) approved the renewal of DWS CROCI® Equity Dividend Fund’s (the “Fund” ) investment management agreement (the “Agreement” ) with DWS Investment Management Americas, Inc. (“DIMA” ) in September 2022.
In terms of the process that the Board followed prior to approving the Agreement, shareholders should know that:
— 
During the entire process, all of the Fund’s Trustees were independent of DIMA and its affiliates (the “Independent Trustees” ).
— 
The Board met frequently during the past year to discuss fund matters and dedicated a substantial amount of time to contract review matters. Over the course of several months, the Board reviewed extensive materials received from DIMA, independent third parties and independent counsel. These materials included an analysis of the Fund’s performance, fees and expenses, and profitability from a fee consultant retained by the Fund’s Independent Trustees (the “Fee Consultant” ).
— 
The Board also received extensive information throughout the year regarding performance of the Fund.
— 
The Independent Trustees regularly met privately with counsel to discuss contract review and other matters. In addition, the Independent Trustees were advised by the Fee Consultant in the course of their review of the Fund’s contractual arrangements and considered a comprehensive report prepared by the Fee Consultant in connection with their deliberations.
— 
In connection with reviewing the Agreement, the Board also reviewed the terms of the Fund’s Rule 12b-1 plan, distribution agreement, transfer agency agreement and other material service agreements.
In connection with the contract review process, the Board considered the factors discussed below, among others. The Board also considered that DIMA and its predecessors have managed the Fund since its inception, and the Board believes that a long-term relationship with a capable, conscientious advisor is in the best interests of the Fund. The Board considered, generally, that shareholders chose to invest or remain invested in the Fund knowing that DIMA managed the Fund. DIMA is part of DWS Group GmbH & Co. KGaA (“DWS Group” ). DWS Group is a global asset management business that offers a wide range of investing expertise and resources, including research capabilities in many countries throughout the world. In 2018, approximately 20% of DWS Group’s
DWS CROCI® Equity Dividend Fund
|
47

shares were sold in an initial public offering, with Deutsche Bank AG owning the remaining shares.
As part of the contract review process, the Board carefully considered the fees and expenses of each DWS fund overseen by the Board in light of the fund’s performance. In many cases, this led to the negotiation and implementation of expense caps.
While shareholders may focus primarily on fund performance and fees, the Fund’s Board considers these and many other factors, including the quality and integrity of DIMA’s personnel and administrative support services provided by DIMA, such as back-office operations, fund valuations, and compliance policies and procedures.
Nature, Quality and Extent of Services.The Board considered the terms of the Agreement, including the scope of advisory services provided under the Agreement. The Board noted that, under the Agreement, DIMA provides portfolio management services and administrative services to the Fund. The Board considered the experience and skills of senior management and investment personnel and the resources made available to such personnel. The Board also considered the risks to DIMA in sponsoring or managing the Fund, including financial, operational and reputational risks, the potential economic impact to DIMA from such risks and DIMA’s approach to addressing such risks. The Board reviewed the Fund’s performance over short-term and long-term periods and compared those returns to various agreed-upon performance measures, including market index(es) and a peer universe compiled using information supplied by Morningstar Direct (“Morningstar” ), an independent fund data service. The Board also noted that it has put into place a process of identifying “Funds in Review”  (e.g., funds performing poorly relative to a peer universe), and receives additional reporting from DIMA regarding such funds and, where appropriate, DIMA’s plans to address underperformance. The Board believes this process is an effective manner of identifying and addressing underperforming funds. Based on the information provided, the Board noted that, for the one-, three- and five-year periods ended December 31, 2021, the Fund’s performance (Class A shares) was in the 4th quartile, 4th quartile and 3rd quartile, respectively, of the applicable Morningstar universe (the 1st quartile being the best performers and the 4th quartile being the worst performers). The Board also observed that the Fund has underperformed its benchmark in the one-, three- and five-year periods ended December 31, 2021. The Board noted the disappointing investment performance of the Fund in recent periods and continued to discuss with senior management of DIMA the factors contributing to such underperformance and actions being taken to improve performance. The Board observed that the Fund had experienced improved relative performance during the first eight months of 2022. The Board recognized the efforts by DIMA in recent years
48
|
DWS CROCI® Equity Dividend Fund

to enhance its investment platform and improve long-term performance across the DWS fund complex.
Fees and Expenses.The Board considered the Fund’s investment management fee schedule, operating expenses and total expense ratios, and comparative information provided by Broadridge Financial Solutions, Inc. (“Broadridge” ) and the Fee Consultant regarding investment management fee rates paid to other investment advisors by similar funds (1st quartile being the most favorable and 4th quartile being the least favorable). With respect to management fees paid to other investment advisors by similar funds, the Board noted that the contractual fee rates paid by the Fund were lower than the median (1st quartile) of the applicable Broadridge peer group (based on Broadridge data provided as of December 31, 2021). The Board noted that the Fund’s Class A shares total (net) operating expenses (excluding 12b-1 fees) were expected to be lower than the median (2nd quartile) of the applicable Broadridge expense universe (based on Broadridge data provided as of December 31, 2021, and analyzing Broadridge expense universe Class A (net) expenses less any applicable 12b-1 fees) (“Broadridge Universe Expenses” ). The Board also reviewed data comparing each other operational share class’s total (net) operating expenses to the applicable Broadridge Universe Expenses. The Board noted that the expense limitations agreed to by DIMA were expected to help the Fund’s total (net) operating expenses remain competitive. The Board considered the Fund’s management fee rate as compared to fees charged by DIMA to comparable DWS U.S. registered funds (“DWS Funds” ) and considered differences between the Fund and the comparable DWS Funds. The information requested by the Board as part of its review of fees and expenses also included information about institutional accounts (including any sub-advised funds and accounts) and funds offered primarily to European investors (“DWS Europe Funds” ) managed by DWS Group. The Board noted that DIMA indicated that DWS Group does not manage any institutional accounts or DWS Europe Funds comparable to the Fund.
On the basis of the information provided, the Board concluded that management fees were reasonable and appropriate in light of the nature, quality and extent of services provided by DIMA.
Profitability.The Board reviewed detailed information regarding revenues received by DIMA under the Agreement. The Board considered the estimated costs to DIMA, and pre-tax profits realized by DIMA, from advising the DWS Funds, as well as estimates of the pre-tax profits attributable to managing the Fund in particular. The Board also received information regarding the estimated enterprise-wide profitability of DIMA and its affiliates with respect to all fund services in totality and by fund. The Board and the Fee Consultant reviewed DIMA’s methodology in allocating its costs to the management of the Fund. Based on the
DWS CROCI® Equity Dividend Fund
|
49

information provided, the Board concluded that the pre-tax profits realized by DIMA in connection with the management of the Fund were not unreasonable. The Board also reviewed certain publicly available information regarding the profitability of certain similar investment management firms. The Board noted that, while information regarding the profitability of such firms is limited (and in some cases is not necessarily prepared on a comparable basis), DIMA and its affiliates’ overall profitability with respect to the DWS Funds (after taking into account distribution and other services provided to the funds by DIMA and its affiliates) was lower than the overall profitability levels of most comparable firms for which such data was available.
Economies of Scale.The Board considered whether there are economies of scale with respect to the management of the Fund and whether the Fund benefits from any economies of scale. The Board noted that the Fund’s investment management fee schedule includes fee breakpoints. The Board concluded that the Fund’s fee schedule represents an appropriate sharing between the Fund and DIMA of such economies of scale as may exist in the management of the Fund at current asset levels.
Other Benefits to DIMA and Its Affiliates.The Board also considered the character and amount of other incidental or “fall-out”  benefits received by DIMA and its affiliates, including any fees received by an affiliate of DIMA for transfer agency services provided to the Fund and any fees received by an affiliate of DIMA for distribution services. The Board noted that DIMA pays a licensing fee to an affiliate related to the Fund’s use of the CROCI® strategy. The Board also considered benefits to DIMA related to brokerage and soft-dollar allocations, including allocating brokerage to pay for research generated by parties other than the executing broker dealers, which pertain primarily to funds investing in equity securities. In addition, the Board considered the incidental public relations benefits to DIMA related to DWS Funds advertising and cross-selling opportunities among DIMA products and services. The Board considered these benefits in reaching its conclusion that the Fund’s management fees were reasonable.
Compliance.The Board considered the significant attention and resources dedicated by DIMA to its compliance processes in recent years. The Board noted in particular (i) the experience, seniority and time commitment of the individuals serving as DIMA’s and the Fund’s chief compliance officers and (ii) the substantial commitment of resources by DIMA and its affiliates to compliance matters, including the retention of compliance personnel.
Based on all of the information considered and the conclusions reached, the Board determined that the continuation of the Agreement is in the best interests of the Fund. In making this determination, the Board did not give particular weight to any single factor identified above. The Board considered these factors over the course of numerous meetings, certain
50
|
DWS CROCI® Equity Dividend Fund

of which were in executive session with only the Independent Trustees and counsel present. It is possible that individual Independent Trustees may have weighed these factors differently in reaching their individual decisions to approve the continuation of the Agreement.
DWS CROCI® Equity Dividend Fund
|
51

Board Members and Officers
The following table presents certain information regarding the Board Members and Officers of the Trust/Corporation. Each Board Member’s year of birth is set forth in parentheses after his or her name. Unless otherwise noted, (i) each Board Member has engaged in the principal occupation(s) noted in the table for at least the most recent five years, although not necessarily in the same capacity; and (ii) the address of each Independent Board Member is c/o Keith R. Fox, DWS Funds Board Chair, c/o Thomas R. Hiller, Ropes & Gray LLP, Prudential Tower, 800 Boylston
Street, Boston, MA 02199-3600.Except as otherwise noted below, the term of office for each Board Member is until the election and qualification of a successor, or until such Board Member sooner dies, resigns, is removed or as otherwise provided in the governing documents of the Trust/Corporation. Because the Fund does not hold an annual meeting of shareholders, each Board Member will hold office for an indeterminate period.
The Board Members may also serve in similar capacities with other funds in the fund complex. The number of funds in the DWS fund complex shown in the table below includes all registered open- and closed-end funds (including all of their portfolios) advised by the Advisor and any registered funds that have an investment advisor that is an affiliated person of the Advisor.
Independent Board Members/Independent Advisory Board Members
Name, Year of
Birth, Position
with the Trust/
Corporation
and Length of
Time Served1
Business Experience and Directorships
During the Past Five Years
Number of
Funds in
DWS Fund
Complex
Overseen
Other
Directorships
Held by Board
Member
Keith R. Fox,
CFA (1954)
Chairperson
since 2017, and
Board Member
since 1996
Managing General Partner, Exeter Capital
Partners (a series of private investment
funds) (since 1986). Directorships:
Progressive International Corporation (kitchen
goods designer and distributor); former
Chairman, National Association of Small
Business Investment Companies; Former
Directorships: ICI Mutual Insurance
Company; BoxTop Media Inc. (advertising);
Sun Capital Advisers Trust (mutual funds)
69
52
|
DWS CROCI® Equity Dividend Fund

Name, Year of
Birth, Position
with the Trust/
Corporation
and Length of
Time Served1
Business Experience and Directorships
During the Past Five Years
Number of
Funds in
DWS Fund
Complex
Overseen
Other
Directorships
Held by Board
Member
John W.
Ballantine
(1946)
Board Member
since 1999
Retired; formerly, Executive Vice President
and Chief Risk Management Officer, First
Chicago NBD Corporation/The First National
Bank of Chicago (1996–1998); Executive Vice
President and Head of International Banking
(1995–1996); Not-for-Profit Directorships:
Window to the World Communications
(public media); Life Director of Harris Theater
for Music and Dance (Chicago); Life Director
of Hubbard Street Dance Chicago; Former
Directorships: Director and Chairman of the
Board, Healthways, Inc.2 (population
wellbeing and wellness services)
(2003–2014); Stockwell Capital Investments
PLC (private equity); Enron Corporation; FNB
Corporation; Tokheim Corporation; First Oak
Brook Bancshares, Inc.; Oak Brook Bank;
Portland General Electric2 (utility company
(2003–2021); and Prisma Energy
International; Former Not-for-Profit
Directorships: Public Radio International;
Palm Beach Civic Assn.
69
Dawn-Marie
Driscoll (1946)
Board Member
since 1987
Advisory Board and former Executive Fellow,
Hoffman Center for Business Ethics, Bentley
University; formerly: Partner, Palmer & Dodge
(law firm) (1988–1990); Vice President of
Corporate Affairs and General Counsel,
Filene’s (retail) (1978–1988); Directorships:
Trustee and former Chairman of the Board,
Southwest Florida Community Foundation
(charitable organization); Former
Directorships: ICI Mutual Insurance Company
(2007–2015); Sun Capital Advisers Trust
(mutual funds) (2007–2012), Investment
Company Institute (audit, executive,
nominating committees) and Independent
Directors Council (governance,
executive committees)
69
DWS CROCI® Equity Dividend Fund
|
53

Name, Year of
Birth, Position
with the Trust/
Corporation
and Length of
Time Served1
Business Experience and Directorships
During the Past Five Years
Number of
Funds in
DWS Fund
Complex
Overseen
Other
Directorships
Held by Board
Member
Richard J.
Herring (1946)
Board Member
since 1990
Jacob Safra Professor of International
Banking and Professor of Finance, The
Wharton School, University of Pennsylvania
(since July 1972); formerly: Director, The
Wharton Financial Institutions Center
(1994–2020); Vice Dean and Director,
Wharton Undergraduate Division (1995–2000)
and Director, The Lauder Institute of
International Management Studies
(2000–2006); Member FDIC Systemic Risk
Advisory Committee since 2011, member
Systemic Risk Council since 2012 and
member of the Advisory Board at the Yale
Program on Financial Stability since 2013;
Former Directorships: Co-Chair of the
Shadow Financial Regulatory Committee
(2003–2015), Executive Director of The
Financial Economists Roundtable
(2008–2015), Director of The Thai Capital Fund
(2007–2013), Director of The Aberdeen
Singapore Fund (2007–2018), Director, The
Aberdeen Japan Fund (2007-2021) and
Nonexecutive Director of Barclays Bank
DE (2010–2018)
69
William
McClayton
(1944)*
Board Member
since 2004
Private equity investor (since October 2009);
formerly: Managing Director, Diamond
Management & Technology Consultants, Inc.
(global consulting firm) (2001–2009); Senior
Partner, Arthur Andersen LLP (accounting)
(1966–2001); Former Directorships: Board of
Managers, YMCA of Metropolitan Chicago;
Trustee, Ravinia Festival
67
Chad D. Perry
(1972)
Board Member
or Advisory
Board Member
since 20213
Executive Vice President, General Counsel
and Secretary, Tanger Factory Outlet Centers,
Inc.2 (since 2011); formerly Executive Vice
President and Deputy General Counsel, LPL
Financial Holdings Inc.2 (2006–2011); Senior
Corporate Counsel, EMC Corporation
(2005–2006); Associate, Ropes & Gray
LLP (1997–2005)
214
Director - Great
Elm Capital
Corp. (business
development
company)
(since 2022)
54
|
DWS CROCI® Equity Dividend Fund

Name, Year of
Birth, Position
with the Trust/
Corporation
and Length of
Time Served1
Business Experience and Directorships
During the Past Five Years
Number of
Funds in
DWS Fund
Complex
Overseen
Other
Directorships
Held by Board
Member
Rebecca W.
Rimel (1951)
Board Member
since 1995
Director, The Bridgespan Group (nonprofit
organization) (since October 2020); formerly:
Executive Vice President, The Glenmede Trust
Company (investment trust and wealth
management) (1983–2004); Board Member,
Investor Education (charitable organization)
(2004–2005); Former Directorships: Trustee,
Executive Committee, Philadelphia Chamber
of Commerce (2001–2007); Director, Viasys
Health Care2 (January 2007–June 2007);
Trustee, Thomas Jefferson Foundation
(charitable organization) (1994–2012);
President, Chief Executive Officer and
Director (1994–2020) and Senior Advisor
(2020-2021), The Pew Charitable Trusts
(charitable organization); Director,
BioTelemetry Inc.2 (acquired by Royal Philips
in 2021) (healthcare) (2009–2021); Director,
Becton Dickinson and Company2 (medical
technology company) (2012-2022)
69
Catherine
Schrand (1964)
Board Member
or Advisory
Board Member
since 20213
Celia Z. Moh Professor of Accounting (since
2016) and Professor of Accounting (since
1994), The Wharton School, University of
Pennsylvania; formerly Vice Dean, Wharton
Doctoral Programs (2016–2019)
214
William N.
Searcy, Jr.
(1946)
Board Member
since 1993
Private investor since October 2003; formerly:
Pension & Savings Trust Officer, Sprint
Corporation2 (telecommunications)
(November 1989–September 2003); Former
Directorships: Trustee, Sun Capital Advisers
Trust (mutual funds) (1998–2012)
69
DWS CROCI® Equity Dividend Fund
|
55

Officers5
Name, Year of Birth, Position
with the Trust/Corporation
and Length of Time Served6
Business Experience and Directorships During the
Past Five Years
Hepsen Uzcan7 (1974)
President and Chief Executive
Officer, 2017–present
Fund Administration (Head since 2017), DWS; Secretary,
DWS USA Corporation (2018–present); Assistant Secretary,
DWS Distributors, Inc. (2018–present); Director and Vice
President, DWS Service Company (2018–present); Assistant
Secretary, DWS Investment Management Americas, Inc.
(2018–present); Director and President, DB Investment
Managers, Inc. (2018–present); President and Chief
Executive Officer, The European Equity Fund, Inc., The New
Germany Fund, Inc. and The Central and Eastern Europe
Fund, Inc. (2017–present); formerly: Vice President for the
Deutsche funds (2016–2017); Assistant Secretary for the
DWS funds (2013–2019); Assistant Secretary, The European
Equity Fund, Inc., The New Germany Fund, Inc. and The
Central and Eastern Europe Fund, Inc. (2013–2020);
Directorships: Interested Director, The European Equity
Fund, Inc., The New Germany Fund, Inc. and The Central and
Eastern Europe Fund, Inc. (since June 25, 2020); ICI Mutual
Insurance Company (since October 16, 2020); and
Episcopalian Charities of New York (2018–present)
John Millette8 (1962)
Vice President and
Secretary, 1999–present
Legal (Associate General Counsel), DWS; Chief Legal
Officer, DWS Investment Management Americas, Inc.
(2015–present); Director and Vice President, DWS Trust
Company (2016–present); Secretary, DBX ETF Trust
(2020–present); Vice President, DBX Advisors LLC
(2021–present); Secretary, The European Equity Fund, Inc.,
The New Germany Fund, Inc. and The Central and Eastern
Europe Fund, Inc. 2011–present); formerly: Secretary,
Deutsche Investment Management Americas Inc.
(2015–2017); and Assistant Secretary, DBX ETF
Trust (2019–2020)
Ciara Crawford9 (1984)
Assistant
Secretary, 2019–present
Fund Administration (Specialist), DWS (2015–present);
formerly, Legal Assistant at Accelerated Tax Solutions
Diane Kenneally8 (1966)
Chief Financial Officer and
Treasurer, 2018–present
Fund Administration Treasurer’s Office (Co-Head since 2018),
DWS; Treasurer, Chief Financial Officer and Controller, DBX
ETF Trust (2019–present); Treasurer and Chief Financial
Officer, The European Equity Fund, Inc., The New Germany
Fund, Inc. and The Central and Eastern Europe Fund, Inc.
(2018–present); formerly: Assistant Treasurer for the DWS
funds (2007–2018)
Paul Antosca8 (1957)
Assistant
Treasurer, 2007–present
Fund Administration Tax (Head), DWS; and Assistant
Treasurer, DBX ETF Trust (2019–present)
Sheila Cadogan8 (1966)
Assistant
Treasurer, 2017–present
Fund Administration Treasurer’s Office (Co-Head since 2018),
DWS; Director and Vice President, DWS Trust Company
(2018–present); Assistant Treasurer, DBX ETF Trust
(2019–present); Assistant Treasurer, The European Equity
Fund, Inc., The New Germany Fund, Inc. and The Central and
Eastern Europe Fund, Inc. (2018–present)
Scott D. Hogan8 (1970)
Chief Compliance
Officer, 2016–present
Anti-Financial Crime & Compliance US (Senior Team Lead),
DWS; Chief Compliance Officer, The European Equity Fund,
Inc., The New Germany Fund, Inc. and The Central and
Eastern Europe Fund, Inc. (2016–present)
56
|
DWS CROCI® Equity Dividend Fund

Name, Year of Birth, Position
with the Trust/Corporation
and Length of Time Served6
Business Experience and Directorships During the
Past Five Years
Caroline Pearson8 (1962)
Chief Legal
Officer, 2010–present
Legal (Senior Team Lead), DWS; Assistant Secretary, DBX
ETF Trust (2020–present); Chief Legal Officer, DBX Advisors
LLC (2020–present); Chief Legal Officer, The European
Equity Fund, Inc., The New Germany Fund, Inc. and The
Central and Eastern Europe Fund, Inc. (2012–present);
formerly: Secretary, Deutsche AM Distributors, Inc.
(2002–2017); Secretary, Deutsche AM Service Company
(2010–2017); and Chief Legal Officer, DBX Strategic Advisors
LLC (2020–2021)
Christian Rijs7 (1980)
Anti-Money Laundering
Compliance Officer,
since October 6, 2021
Senior Team Lead Anti-Financial Crime and Compliance,
DWS; AML Officer, DWS Trust Company (since November 2,
2021); AML Officer, DBX ETF Trust (since October 21, 2021);
AML Officer, The European Equity Fund, Inc., The New
Germany Fund, Inc. and The Central and Eastern Europe
Fund, Inc. (since November 12, 2021); formerly: DWS UK &
Ireland Head of Anti-Financial Crime and MLRO
*
William McClayton is retiring from the Board effective December 31, 2022.
1
The length of time served represents the year in which the Board Member joined the
board of one or more DWS funds currently overseen by the Board.
2
A publicly held company with securities registered pursuant to Section 12 of the
Securities Exchange Act of 1934.
3
Mr. Perry and Ms. Schrand are Advisory Board Members of Deutsche DWS Asset
Allocation Trust, Deutsche DWS Equity 500 Index Portfolio, Deutsche DWS
Global/International Fund, Inc., Deutsche DWS Income Trust, Deutsche DWS Institutional
Funds, Deutsche DWS International Fund, Inc., Deutsche DWS Investment Trust,
Deutsche DWS Investments VIT Funds, Deutsche DWS Money Market Trust, Deutsche
DWS Municipal Trust, Deutsche DWS Portfolio Trust, Deutsche DWS Securities Trust,
Deutsche DWS Tax Free Trust, Deutsche DWS Variable Series I and Government Cash
Management Portfolio. Mr. Perry and Ms. Schrand are Board Members of each
other Trust.
4
Mr. Perry and Ms. Schrand oversee 21 funds in the DWS Fund Complex as Board
Members of various Trusts. Mr. Perry and Ms. Schrand are Advisory Board Members of
various Trusts/Corporations comprised of 49 funds in the DWS Fund Complex.
5
As a result of their respective positions held with the Advisor or its affiliates, these
individuals are considered “interested persons”  of the Advisor within the meaning of the
1940 Act. Interested persons receive no compensation from the Fund.
6
The length of time served represents the year in which the officer was first elected in
such capacity for one or more DWS funds.
7
Address: 875 Third Avenue, New York, NY 10022.
8
Address: 100 Summer Street, Boston, MA 02110.
9
Address: 5201 Gate Parkway, Jacksonville, FL 32256.
Certain officers hold similar positions for other investment companies for which DIMA or an affiliate serves as the Advisor.
The Fund’s Statement of Additional Information (“SAI” ) includes additional information about the Board Members. The SAI is available, without charge, upon request. If you would like to request a copy of the SAI, you may do so by calling the following toll-free number: (800) 728-3337.
DWS CROCI® Equity Dividend Fund
|
57

Account Management Resources
For More
Information
The automated telephone system allows you to access personalized
account information and obtain information on other DWS funds
using either your voice or your telephone keypad. Certain account
types within Classes A, C and S also have the ability to purchase,
exchange or redeem shares using this system.
For more information, contact your financial representative. You may
also access our automated telephone system or speak with a
Shareholder Service representative by calling:
(800) 728-3337
Web Site
dws.com
View your account transactions and balances, trade shares, monitor
your asset allocation, subscribe to fund and account updates by
e-mail, and change your address, 24 hours a day.
Obtain prospectuses and applications, news about DWS funds,
insight from DWS economists and investment specialists and access
to DWS fund account information.
Written
Correspondence
DWS
PO Box 219151
Kansas City, MO 64121-9151
Proxy Voting
The Fund’s policies and procedures for voting proxies for portfolio
securities and information about how the Fund voted proxies related
to its portfolio securities during the most recent 12-month period
ended June 30 are available on our Web site
dws.com/en-us/resources/proxy-voting or on the SEC’s Web site
sec.gov. To obtain a written copy of the Fund’s policies and
procedures without charge, upon request, call us toll free at
(800) 728-3337.
Portfolio Holdings
Following the Fund’s fiscal first and third quarter-end, a complete
portfolio holdings listing is posted on dws.com, and is available free
of charge by contacting your financial intermediary, or if you are a
direct investor, by calling (800) 728-3337. In addition, the portfolio
holdings listing is filed with SEC on the Fund’s Form N-PORT and will
be available on the SEC’s Web site at sec.gov. Additional portfolio
holdings for the Fund are also posted on dws.com from time to time.
Please see the Fund’s current prospectus for more information.
Principal
Underwriter
If you have questions, comments or complaints, contact:
DWS Distributors, Inc.
222 South Riverside Plaza
Chicago, IL 60606-5808
(800) 621-1148
58
|
DWS CROCI® Equity Dividend Fund

Investment
Management
DWS Investment Management Americas, Inc. (“DIMA”  or the
“Advisor”  ), which is part of the DWS Group GmbH & Co. KGaA
(“DWS Group” ), is the investment advisor for the Fund. DIMA and its
predecessors have more than 90 years of experience managing
mutual funds and DIMA provides a full range of investment advisory
services to both institutional and retail clients. DIMA is an indirect,
wholly owned subsidiary of DWS Group.
 
DWS Group is a global organization that offers a wide range of
investing expertise and resources, including hundreds of portfolio
managers and analysts and an office network that reaches the
world’s major investment centers. This well-resourced global
investment platform brings together a wide variety of experience and
investment insight across industries, regions, asset classes and
investing styles.
 
Class A
Class C
Class S
Institutional
Class
Nasdaq Symbol
KDHAX
KDHCX
KDHSX
KDHIX
CUSIP Number
25159G811
25159G746
25159G761
25159G779
Fund Number
087
387
2387
539
For shareholders of Class R and Class R6
Automated
Information Line
DWS/Ascensus Plan Access (800) 728-3337
24-hour access to your retirement plan account.
Web Site
dws.com
Obtain prospectuses and applications, news about DWS funds,
insight from DWS economists and investment specialists and access
to DWS fund account information.
Log in/register to manage retirement account assets at
https://www.mykplan.com/participantsecure_net/login.aspx.
For More
Information
(800) 728-3337
To speak with a service representative.
Written
Correspondence
DWS Service Company
222 South Riverside Plaza
Chicago, IL 60606-5806
 
Class R
Class R6
Nasdaq Symbol
KDHRX
KDHTX
CUSIP Number
25159G753
25159G696
Fund Number
1506
1602
DWS CROCI® Equity Dividend Fund
|
59

DCEDF-2
(R-025439-12 1/23)

   
  (b) Not applicable
   
ITEM 2. CODE OF ETHICS


As of the end of the period covered by this report, the registrant has adopted a code of ethics, as defined in Item 2 of Form N-CSR that applies to its Principal Executive Officer and Principal Financial Officer.


There have been no amendments to, or waivers from, a provision of the code of ethics during the period covered by this report that would require disclosure under Item 2.


A copy of the code of ethics is filed as an exhibit to this Form N-CSR.

   
ITEM 3. AUDIT COMMITTEE FINANCIAL EXPERT
   
  The fund’s audit committee is comprised solely of trustees who are "independent" (as such term has been defined by the Securities and Exchange Commission ("SEC") in regulations implementing Section 407 of the Sarbanes-Oxley Act (the "Regulations")). The fund’s Board of Trustees has determined that there are several "audit committee financial experts" (as such term has been defined by the Regulations) serving on the fund’s audit committee including Mr. William McClayton, the chair of the fund’s audit committee.  An “audit committee financial expert” is not an “expert” for any purpose, including for purposes of Section 11 of the Securities Act of 1933 and the designation or identification of a person as an “audit committee financial expert” does not impose on such person any duties, obligations or liability that are greater than the duties, obligations and liability imposed on such person as a member of the audit committee and board of directors in the absence of such designation or identification.
   
ITEM 4. PRINCIPAL ACCOUNTANT FEES AND SERVICES
   

DWS CROCI Equity DIvidend Fund

form n-csr disclosure re: AUDIT FEES

The following table shows the amount of fees that Ernst & Young LLP (“EY”), the Fund’s Independent Registered Public Accounting Firm, billed to the Fund during the Fund’s last two fiscal years. The Audit Committee approved in advance all audit services and non-audit services that EY provided to the Fund.

Services that the Fund’s Independent Registered Public Accounting Firm Billed to the Fund

Fiscal Year
Ended
November 30,
Audit Fees Billed to Fund Audit-Related
Fees Billed to Fund
Tax Fees Billed to Fund All
Other Fees Billed to Fund
2022 $51,236 $0 $7,880 $0
2021 $53,933 $0 $7,880 $0


The above “Tax Fees” were billed for professional services rendered for tax preparation.

Services that the Fund’s Independent Registered Public Accounting Firm Billed to the Adviser and Affiliated Fund Service Providers

The following table shows the amount of fees billed by EY to DWS Investment Management Americas, Inc. (“DIMA” or the “Adviser”), and any entity controlling, controlled by or under common control with DIMA (“Control Affiliate”) that provides ongoing services to the Fund (“Affiliated Fund Service Provider”), for engagements directly related to the Fund’s operations and financial reporting, during the Fund’s last two fiscal years.

Fiscal Year
Ended
November 30,
Audit-Related
Fees Billed to Adviser and Affiliated Fund Service Providers
Tax Fees Billed to Adviser and Affiliated Fund Service Providers All
Other Fees Billed to Adviser and Affiliated Fund Service Providers
2022 $0 $32,448 $0
2021 $0 $461,717 $0

The above “Tax Fees” were billed in connection with tax compliance services and agreed upon procedures.

Non-Audit Services

The following table shows the amount of fees that EY billed during the Fund’s last two fiscal years for non-audit services. The Audit Committee pre-approved all non-audit services that EY provided to the Adviser and any Affiliated Fund Service Provider that related directly to the Fund’s operations and financial reporting. The Audit Committee requested and received information from EY about any non-audit services that EY rendered during the Fund’s last fiscal year to the Adviser and any Affiliated Fund Service Provider. The Committee considered this information in evaluating EY’s independence.

Fiscal Year
Ended
November 30,
Total
Non-Audit Fees Billed to Fund
(A)
Total Non-Audit Fees billed to Adviser and Affiliated Fund Service Providers (engagements related directly to the operations and financial reporting of the Fund)
(B)
Total Non-Audit Fees billed to Adviser and Affiliated Fund Service Providers (all other engagements)
(C)
Total of
(A), (B) and (C)
2022 $7,880 $32,448 $0 $40,328
2021 $7,880 $461,717 $0 $469,597

All other engagement fees were billed for services in connection with agreed upon procedures and tax compliance for DIMA and other related entities.

Audit Committee Pre-Approval Policies and Procedures. Generally, each Fund’s Audit Committee must pre approve (i) all services to be performed for a Fund by a Fund’s Independent Registered Public Accounting Firm and (ii) all non-audit services to be performed by a Fund’s Independent Registered Public Accounting Firm for the DIMA Entities with respect to operations and financial reporting of the Fund, except that the Chairperson or Vice Chairperson of each Fund’s Audit Committee may grant the pre-approval for non-audit services described in items (i) and (ii) above for non-prohibited services for engagements of less than $100,000. All such delegated pre approvals shall be presented to each Fund’s Audit Committee no later than the next Audit Committee meeting.

There were no amounts that were approved by the Audit Committee pursuant to the de minimis exception under Rule 2-01 of Regulation S-X.

According to the registrant’s principal Independent Registered Public Accounting Firm, substantially all of the principal Independent Registered Public Accounting Firm's hours spent on auditing the registrant's financial statements were attributed to work performed by full-time permanent employees of the principal Independent Registered Public Accounting Firm.

***

In connection with the audit of the 2021 and 2022 financial statements, the Fund entered into an engagement letter with EY. The terms of the engagement letter required by EY, and agreed to by the Audit Committee, include a provision mandating the use of mediation and arbitration to resolve any controversy or claim between the parties arising out of or relating to the engagement letter or services provided thereunder.

***

Pursuant to PCAOB Rule 3526, EY is required to describe in writing to the Fund’s Audit Committee, on at least an annual basis, all relationships between EY, or any of its affiliates, and the DWS Funds, including the Fund, or persons in financial reporting oversight roles at the DWS Funds that, as of the date of the communication, may reasonably be thought to bear on EY’s independence. Pursuant to PCAOB Rule 3526, EY has reported the matters set forth below that may reasonably be thought to bear on EY’s independence. With respect to each reported matter in the aggregate, EY advised the Audit Committee that, after careful consideration of the facts and circumstances and the applicable independence rules, it concluded that the matters do not and will not impair EY’s ability to exercise objective and impartial judgement in connection with the audits of the financial statements for the Fund and a reasonable investor with knowledge of all relevant facts and circumstances would conclude that EY has been and is capable of exercising objective and impartial judgment on all issues encompassed within EY’s audit engagements. EY also confirmed to the Audit Committee that it can continue to act as the Independent Registered Public Accounting Firm for the Fund.

·EY advised the Fund’s Audit Committee that various covered persons within EY and EY’s affiliates held investments in, or had other financial relationships with, entities within the DWS Funds “investment company complex” (as defined in Regulation S-X) (the “DWS Funds Complex”). EY informed the Audit Committee that these investments and financial relationships were inconsistent with Rule 2-01(c)(1) of Regulation S-X. EY reported that all breaches have been resolved and that none of the breaches involved any professionals who were part of the audit engagement team for the Fund or in the position to influence the audit engagement team for the Fund.


ITEM 5. AUDIT COMMITTEE OF LISTED REGISTRANTS
   
  Not applicable
   
ITEM 6. SCHEDULE OF INVESTMENTS
   
  Not applicable
   
ITEM 7. DISCLOSURE OF PROXY VOTING POLICIES AND PROCEDURES FOR CLOSED-END MANAGEMENT INVESTMENT COMPANIES
   
  Not applicable
   
ITEM 8. PORTFOLIO MANAGERS OF CLOSED-END MANAGEMENT INVESTMENT COMPANIES
   
  Not applicable
   
ITEM 9. PURCHASES OF EQUITY SECURITIES BY CLOSED-END MANAGEMENT INVESTMENT COMPANY AND AFFILIATED PURCHASERS
   
  Not applicable
   
ITEM 10. SUBMISSION OF MATTERS TO A VOTE OF SECURITY HOLDERS
   
  There were no material changes to the procedures by which shareholders may recommend nominees to the Fund’s Board. The primary function of the Nominating and Governance Committee is to identify and recommend individuals for membership on the Board and oversee the administration of the Board Governance Guidelines. Shareholders may recommend candidates for Board positions by forwarding their correspondence by U.S. mail or courier service to Keith R. Fox, DWS Funds Board Chair, c/o Thomas R. Hiller, Ropes & Gray LLP, Prudential Tower, 800 Boylston Street, Boston, MA 02199-3600.
   
ITEM 11. CONTROLS AND PROCEDURES
   
  (a) The Chief Executive and Financial Officers concluded that the Registrant’s Disclosure Controls and Procedures are effective based on the evaluation of the Disclosure Controls and Procedures as of a date within 90 days of the filing date of this report.
   
  (b) There have been no changes in the registrant’s internal control over financial reporting that occurred during the period covered by this report that has materially affected, or is reasonably likely to materially affect, the registrant’s internal controls over financial reporting.
   
ITEM 12. Disclosure of Securities Lending Activities for Closed-End Management Investment Companies
   
  Not applicable
   
ITEM 13. EXHIBITS
   
  (a)(1) Code of Ethics pursuant to Item 2 of Form N-CSR is filed and attached hereto as EX-99.CODE ETH.
   
  (a)(2) Certification pursuant to Rule 30a-2(a) under the Investment Company Act of 1940 (17 CFR 270.30a-2(a)) is filed and attached hereto as Exhibit 99.CERT.
   
  (b) Certification pursuant to Rule 30a-2(b) under the Investment Company Act of 1940 (17 CFR 270.30a-2(b)) is furnished and attached hereto as Exhibit 99.906CERT.


SIGNATURES


Pursuant to the requirements of the Securities Exchange Act of 1934 and the Investment Company Act of 1940, the registrant has duly caused this report to be signed on its behalf by the undersigned, thereunto duly authorized.


Registrant: DWS CROCI® Equity Dividend Fund, a series of Deutsche DWS Investment Trust
   
   
By:

/s/Hepsen Uzcan

Hepsen Uzcan

President

   
Date: 1/27/2023


Pursuant to the requirements of the Securities Exchange Act of 1934 and the Investment Company Act of 1940, this report has been signed below by the following persons on behalf of the registrant and in the capacities and on the dates indicated.


By:

/s/Hepsen Uzcan

Hepsen Uzcan

President

   
Date: 1/27/2023


By:

/s/Diane Kenneally

Diane Kenneally

Chief Financial Officer and Treasurer

   
Date: 1/27/2023


ATTACHMENTS / EXHIBITS

CODE OF ETHICS

CERTIFICATIONS

906 CERTIFICATION


Serious News for Serious Traders! Try StreetInsider.com Premium Free!

You May Also Be Interested In


Related Categories

SEC Filings