

Form N-CSR Cohen & Steers Low Durat For: Apr 30
 Tweet
Tweet Share
ShareUNITED STATES
SECURITIES AND EXCHANGE COMMISSION
Washington, D.C. 20549
FORM N-CSR
CERTIFIED SHAREHOLDER REPORT OF REGISTERED
MANAGEMENT INVESTMENT COMPANIES
Investment Company Act File Number: 811-23097
Cohen & Steers Low Duration Preferred and Income Fund, Inc.
(Exact name of registrant as specified in charter)
280 Park Avenue, New York, NY 10017
(Address of principal executive offices) (Zip code)
Dana A. DeVivo
Cohen & Steers Capital Management, Inc.
280 Park Avenue
New York, New York 10017
(Name and address of agent for service)
Registrant’s telephone number, including area code: (212) 832-3232
Date of fiscal year end: April 30
Date of reporting period: April 30, 2022
Item 1. Reports to Stockholders.
COHEN & STEERS LOW DURATION PREFERRED AND INCOME FUND, INC.
To Our Shareholders:
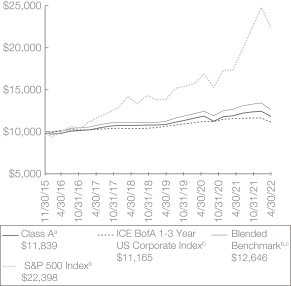
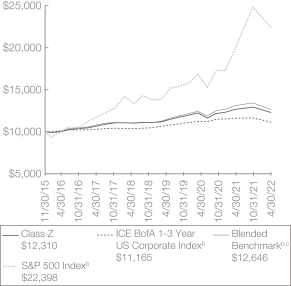
We would like to share with you our report for the year ended April 30, 2022. The total returns for the Cohen & Steers Low Duration Preferred and Income Fund, Inc. (the Fund) and its comparative benchmarks were:
| Six Months Ended April 30, 2022 |
Year Ended April 30, 2022 |
|||||||
| Cohen & Steers Low Duration Preferred and Income Fund: |
||||||||
| Class A |
–4.91 | % | –4.14 | % | ||||
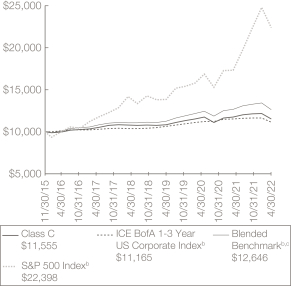
| Class C |
–5.25 | % | –4.82 | % | ||||
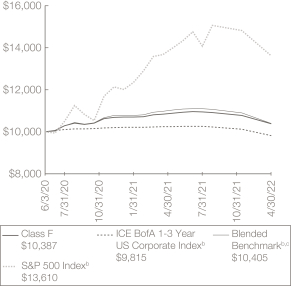
| Class F |
–4.85 | % | –3.91 | % | ||||
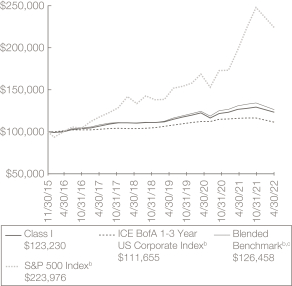
| Class I |
–4.75 | % | –3.81 | % | ||||
| Class R |
–4.99 | % | –4.34 | % | ||||
| Class Z |
–4.85 | % | –3.91 | % | ||||
| ICE BofA 1-3 Year US Corporate Indexa |
–4.07 | % | –4.09 | % | ||||
| Blended Benchmark—65% ICE BofA 8% Constrained Developed |
–5.98 | % | –4.78 | % | ||||
| S&P 500 Indexa |
–9.65 | % | 0.21 | % | ||||
The performance data quoted represent past performance. Past performance is no guarantee of future results. The investment return and the principal value of an investment will fluctuate and shares, if redeemed, may be worth more or less than their original cost. Current performance may be lower or higher than the performance data quoted. Current total returns of the Fund can be obtained by visiting our website at cohenandsteers.com. All share class returns assume the reinvestment of all dividends and distributions at NAV. Fund performance figures reflect fee waivers and/or expense reimbursements, without which the performance would have been lower. Performance quoted does not reflect the deduction of the maximum 2.00% initial sales charge on Class A shares or the 1.00% maximum contingent deferred sales charge on Class C shares. The 1.00% maximum contingent deferred sales charge on Class C shares applies if redemption occurs on or before the one year anniversary date of their purchase. If such charges were included, returns would have been lower. Index performance does not reflect the deduction of any fees, taxes or expenses. An investor cannot invest directly in an index. Performance figures for periods shorter than one year are not annualized.
| a | The ICE BofA 1-3 Year US Corporate Index tracks the performance of U.S. dollar-denominated investment-grade corporate debt publicly issued in the U.S. domestic market, with a remaining term to final maturity of less than three years. The ICE BofA 8% Constrained Developed Markets Low Duration Capital Securities Custom Index tracks the performance of select U.S. dollar-denominated fixed and floating-rate preferred, corporate and contingent capital securities, with issuer exposure capped at 8%, and with a remaining term to final maturity of one year or more, but less than five years. The ICE BofA 1-5 Year US Corporate Index tracks the performance of U.S. dollar denominated investment-grade corporate debt publicly issued in the U.S. domestic market with a remaining term to final maturity of less than five years. The S&P 500 Index is an unmanaged index of 500 large-capitalization stocks that is frequently used as a general measure of U.S. stock market performance. |
1
COHEN & STEERS LOW DURATION PREFERRED AND INCOME FUND, INC.
The Fund seeks to declare and pay dividends monthly at a level rate (the Policy). Distributions paid by the Fund are subject to recharacterization for tax purposes and are taxable up to the amount of the Fund’s investment company taxable income and net realized gains. As a result of the Policy, the Fund may pay distributions in excess of the Fund’s investment company taxable income and net realized gains. This excess would be a return of capital distributed from the Fund’s assets. Distributions of capital decrease the Fund’s total assets and, therefore, could have the effect of increasing the Fund’s expense ratio. In addition, in order to make these distributions, the Fund may have to sell portfolio securities at a less than opportune time.
Market Review
Low-duration preferred securities struggled along with broader financial markets in the 12-month period ended April 30, 2022, hindered by late-period concerns about inflation and interest rates. As the global economy continued to recover from pandemic-related weakness, a combination of tight labor markets, strong consumer demand and supply chain bottlenecks pushed inflation to a 40-year high by early 2022. The yield on the 10-year U.S. Treasury note, which was relatively stable and well below 2% for most of the period, rose sharply higher in March-April 2022, ending the period at 2.9%.
In March 2022, the U.S. Federal Reserve raised its fed funds rate for the first time since December 2018 and affirmed its commitment to reining in inflation. The European Central Bank indicated it would begin to tighten policy in 2022 as well, but signaled it would remain flexible in light of the potential impact of the war in Ukraine on Europe’s economy.
In this environment, low-duration preferreds declined but held up better than more interest rate sensitive securities such as Treasuries and investment-grade corporate bonds. Low-duration preferred securities modestly outperformed high-yield debt.
Fund Performance
The Fund had a negative total return in the period and its Class A shares performed in line with the ICE BofA 1-3 Year U.S. Corporate Index (the Fund’s Class F, I and Z shares outperformed the index, while its Class C and R shares underperformed). This benchmark focuses on investment-grade corporate bonds with maturities of one to three years. The Fund’s primary objective is to provide high current income; its secondary objective is to provide capital preservation, which we believe is consistent with this benchmark over time. However, to meet its objectives, the Fund invests in low-duration preferred securities as well as shorter-term corporate bonds.
The macro headwinds rattling financial markets notwithstanding, fundamentals for issuers of preferreds remained generally solid. Banks, which are a substantial issuer of preferreds, reported earnings that continued to be encouraging from a credit perspective. Positive factors reported by banks included continued strong credit quality, loan growth, expanding net interest margins and better-than-expected trading activity revenues. And despite increased economic uncertainty, loan credit quality remained strong and bank management teams sounded upbeat on consumer and corporate balance sheets. Capital ratios declined modestly as excess capital was returned to shareholders in the form of large stock buybacks. Overall, however, banks’ capital ratios remained at high levels and well above regulatory minimums in the U.S. as well as Europe. The Fund’s allocation to bank preferreds had a negative return but outperformed the overall index.
2
COHEN & STEERS LOW DURATION PREFERRED AND INCOME FUND, INC.
In the insurance sector, property & casualty insurance companies saw significant premium growth with the recovering economy and life insurers benefited from a declining overall COVID impact and from solid results in their investment portfolios. The Fund’s insurance company securities fell, but also held up better than the index.
Pipeline company cash flows continued to improve on higher crude oil prices, driven by recovering demand and geopolitical supply disruptions. The Fund’s pipeline holdings outperformed the index with a relatively modest decline, although the Fund’s energy and utilities securities underperformed the index.
Real estate sector fundamentals generally remained solid, with healthy demand in most property types and relatively limited new supply. The Fund’s allocations to real estate preferreds performed in line with the index.
Impact of Derivatives on Fund Performance
The Fund used derivatives in the form of forward foreign currency exchange contracts for managing currency risk on certain Fund positions denominated in foreign currencies. The currency exchange contracts contributed to the Fund’s total return during the 12-month period ended April 30, 2022.
Sincerely,

|

| |
| WILLIAM F. SCAPELL Portfolio Manager |
ELAINE ZAHARIS-NIKAS Portfolio Manager |
The views and opinions in the preceding commentary are subject to change without notice and are as of the date of the report. There is no guarantee that any market forecast set forth in the commentary will be realized. This material represents an assessment of the market environment at a specific point in time, should not be relied upon as investment advice and is not intended to predict or depict performance of any investment.
Visit Cohen & Steers online at cohenandsteers.com
For more information about the Cohen & Steers family of mutual funds, visit cohenandsteers.com. Here you will find fund net asset values, fund fact sheets and portfolio highlights, as well as educational resources and timely market updates.
Our website also provides comprehensive information about Cohen & Steers, including our most recent press releases, profiles of our senior investment professionals and their investment approach to each asset class. The Cohen & Steers family of mutual funds specializes in liquid real assets, including real estate securities, listed infrastructure and natural resource equities, as well as preferred securities and other income solutions.
3
COHEN & STEERS LOW DURATION PREFERRED AND INCOME FUND, INC.
Performance Review (Unaudited)
| Class A—Growth of a $10,000 Investment
|
Class C—Growth of a $10,000 Investment
|
| Class F—Growth of a $10,000 Investment
|
Class I—Growth of a $100,000 Investment
|
4
COHEN & STEERS LOW DURATION PREFERRED AND INCOME FUND, INC.
Performance Review (Unaudited)—(Continued)
| Class R—Growth of a $10,000 Investment
|
Class Z—Growth of a $10,000 Investment
|

Average Annual Total Returns—For Periods Ended April 30, 2022
| Class A Shares |
Class C Shares |
Class F Shares |
Class I Shares |
Class R Shares |
Class Z Shares |
|||||||||||||||||||
|
1 Year (with sales charge) |
–6.06 | %a | –5.77 | %d | — | — | — | — | ||||||||||||||||
|
1 Year (without sales charge) |
–4.14 | % | –4.82 | % | –3.91 | % | –3.81 | % | –4.34 | % | –3.91 | % | ||||||||||||
|
5 Years (with sales charge) |
2.12 | %a | 1.81 | % | — | — | — | — | ||||||||||||||||
|
5 Years (without sales charge) |
2.53 | % | 1.81 | % | — | 2.85 | % | 2.31 | % | 2.83 | % | |||||||||||||
|
Since Inception (with sales charge)e |
2.67 | %a | 2.28 | % | — | — | — | — | ||||||||||||||||
|
Since Inception (without sales charge)e |
2.99 | % | 2.28 | % | 2.01 | % | 3.31 | % | 2.78 | % | 3.29 | % | ||||||||||||
The performance data quoted represent past performance. Past performance is no guarantee of future results. The investment return and principal value of an investment will fluctuate and shares, if redeemed, may be worth more or less than their original cost. Current performance may be lower or higher than the performance data quoted. Performance information current to the most recent month end can be obtained by visiting our website at cohenandsteers.com. All share class returns assume the reinvestment of all dividends and distributions at NAV. The performance graphs and table do not reflect the deduction of taxes that a shareholder would pay on Fund distributions or the redemption of Fund shares. During the periods presented above, the investment advisor waived fees and/or reimbursed expenses. Without this arrangement, performance would have been lower.
5
COHEN & STEERS LOW DURATION PREFERRED AND INCOME FUND, INC.
Performance Review (Unaudited)—(Continued)
The annualized gross and net expense ratios, respectively, for each class of shares as disclosed in the September 1, 2021 prospectus, supplemented on March 24, 2022, were as follows: Class A—1.10% and 0.95%; Class C—1.75% and 1.60%; Class F—0.75% and 0.60%; Class I—0.82% and 0.60%; Class R—1.25% and 1.10%; and Class Z—0.75% and 0.60%. The investment advisor has contractually agreed to waive its fee and/or reimburse expenses through June 30, 2023, so that the Fund’s total annual operating expenses (excluding acquired fund fees and expenses, taxes and extraordinary expenses) do not exceed 0.95% for Class A shares, 1.60% for Class C shares, 0.60% for Class F shares, 0.60% for Class I shares, 1.10% for Class R shares and 0.60% for Class Z shares. This contractual agreement can be amended at any time by agreement of the Board of Directors of the Fund and the investment advisor and will terminate automatically in the event of termination of the investment advisory agreement between the Fund and the investment advisor.
| a | Reflects a 2.00% front-end sales charge. |
| b | The comparative indexes are not adjusted to reflect expenses or other fees that the U.S. Securities and Exchange Commission (SEC) requires to be reflected in the Fund’s performance. Index performance does not reflect the deduction of any fees, taxes or expenses. An investor cannot invest directly in an index. The Fund’s performance assumes the reinvestment of all dividends and distributions at NAV. For more information, including charges and expenses, please read the prospectus carefully before you invest. |
| c | The Blended Benchmark consists of 65% ICE BofA 8% Constrained Developed Markets Low Duration Capital Securities Custom Index and 35% ICE BofA 1-5 Year US Corporate Index. |
| d | Reflects a contingent deferred sales charge of 1.00%. |
| e | Inception dates: November 30, 2015 for Class A, C, I, R and Z shares and June 3, 2020 for Class F shares. |
6
COHEN & STEERS LOW DURATION PREFERRED AND INCOME FUND, INC.
Expense Example (Unaudited)
As a shareholder of the Fund, you incur two types of costs: (1) transaction costs, including sales charges (loads) on purchase payments; and (2) ongoing costs including investment advisory fees; distribution and/or service (12b-1) fees; and other Fund expenses. This example is intended to help you understand your ongoing costs (in dollars) of investing in the Fund and to compare these costs with the ongoing costs of investing in other mutual funds.
The example is based on an investment of $1,000 invested at the beginning of the period and held for the entire period November 1, 2021—April 30, 2022.
Actual Expenses
The first line of the following table provides information about actual account values and expenses. You may use the information in this line, together with the amount you invested, to estimate the expenses that you paid over the period. Simply divide your account value by $1,000 (for example, an $8,600 account value divided by $1,000 = 8.6), then multiply the result by the number in the first line under the heading entitled “Expenses Paid During Period” to estimate the expenses you paid on your account during this period.
Hypothetical Example for Comparison Purposes
The second line of the following table provides information about hypothetical account values and hypothetical expenses based on the Fund’s actual expense ratio and an assumed rate of return of 5% per year before expenses, which is not the Fund’s actual return. The hypothetical account values and expenses may not be used to estimate the actual ending account balance or expenses you paid for the period. You may use this information to compare the ongoing cost of investing in the Fund and other funds. To do so, compare this 5% hypothetical example with the 5% hypothetical examples that appear in the shareholder reports of other funds.
Please note that the expenses shown in the table are meant to highlight your ongoing costs only and do not reflect any transaction costs, such as sales charges (loads). Therefore, the second line of the table is useful in comparing ongoing costs only, and will not help you determine the relative total costs of owning different funds. In addition, if these transactional costs were included, your costs would have been higher.
7
COHEN & STEERS LOW DURATION PREFERRED AND INCOME FUND, INC.
Expense Example (Unaudited)—(Continued)
| Beginning Account Value November 1, 2021 |
Ending Account Value April 30, 2022 |
Expenses Paid During Perioda November 1, 2021— April 30, 2022 |
||||||||||
| Class A |
| |||||||||||
| Actual (–4.91% return) |
$ | 1,000.00 | $ | 950.90 | $ | 4.40 | ||||||
| Hypothetical (5% annual return before expenses) |
$ | 1,000.00 | $ | 1,020.28 | $ | 4.56 | ||||||
| Class C |
| |||||||||||
| Actual (–5.25% return) |
$ | 1,000.00 | $ | 947.50 | $ | 7.73 | ||||||
| Hypothetical (5% annual return before expenses) |
$ | 1,000.00 | $ | 1,016.86 | $ | 8.00 | ||||||
| Class F |
| |||||||||||
| Actual (–4.85% return) |
$ | 1,000.00 | $ | 951.50 | $ | 2.90 | ||||||
| Hypothetical (5% annual return before expenses) |
$ | 1,000.00 | $ | 1,021.82 | $ | 3.01 | ||||||
| Class I |
| |||||||||||
| Actual (–4.75% return) |
$ | 1,000.00 | $ | 952.50 | $ | 2.90 | ||||||
| Hypothetical (5% annual return before expenses) |
$ | 1,000.00 | $ | 1,021.82 | $ | 3.01 | ||||||
| Class R |
| |||||||||||
| Actual (–4.99% return) |
$ | 1,000.00 | $ | 950.10 | $ | 5.32 | ||||||
| Hypothetical (5% annual return before expenses) |
$ | 1,000.00 | $ | 1,019.34 | $ | 5.51 | ||||||
| Class Z |
| |||||||||||
| Actual (–4.85% return) |
$ | 1,000.00 | $ | 951.50 | $ | 2.90 | ||||||
| Hypothetical (5% annual return before expenses) |
$ | 1,000.00 | $ | 1,021.82 | $ | 3.01 | ||||||
| a | Expenses are equal to the Fund’s Class A, Class C, Class F, Class I, Class R and Class Z annualized net expense ratios of 0.91%, 1.60%, 0.60%, 0.60%, 1.10% and 0.60%, respectively, multiplied by the average account value over the period, multiplied by 181/365 (to reflect the one-half year period). |
8
COHEN & STEERS LOW DURATION PREFERRED AND INCOME FUND, INC.
April 30, 2022
Top Ten Holdingsa
(Unaudited)
| Security |
Value | % of Net Assets |
||||||
| Charles Schwab Corp./The, 5.375%, Series G |
$ | 57,993,934 | 2.0 | |||||
| Enel SpA, 8.75%, due 9/24/73, 144A (Italy) |
54,899,255 | 1.9 | ||||||
| Prudential Financial, Inc., 5.875%, due 9/15/42 |
49,131,351 | 1.7 | ||||||
| JPMorgan Chase & Co., 6.75%, Series S |
47,754,049 | 1.6 | ||||||
| Prudential Financial, Inc., 5.625%, due 6/15/43 |
44,712,329 | 1.5 | ||||||
| Citigroup, Inc., 5.95% |
42,521,037 | 1.5 | ||||||
| Bank of America Corp., 6.25%, Series X |
41,292,212 | 1.4 | ||||||
| Wells Fargo & Co., 3.90%, Series BB |
40,247,433 | 1.4 | ||||||
| Nippon Life Insurance Co., 5.10%, due 10/16/44, 144A (Japan) |
36,620,584 | 1.3 | ||||||
| Charles Schwab Corp./The, 4.00%, Series I |
36,453,476 | 1.3 | ||||||
| a | Top ten holdings (excluding short-term investments and derivative instruments) are determined on the basis of the value of individual securities held. The Fund may also hold positions in other types of securities issued by the companies listed above. See the Schedule of Investments for additional details on such other positions. |
Sector Breakdownb
(Based on Net Assets)
(Unaudited)
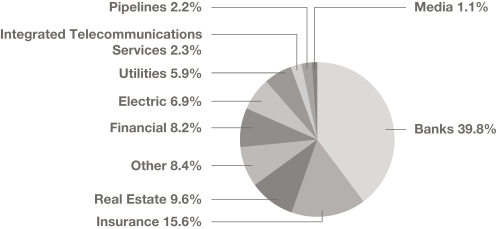
| b | Excludes derivative instruments. |
9
COHEN & STEERS LOW DURATION PREFERRED AND INCOME FUND, INC.
SCHEDULE OF INVESTMENTS
April 30, 2022
| Shares | Value | |||||||||||
| PREFERRED SECURITIES—$25 PAR VALUE |
2.5% | |||||||||||
| BANKS |
0.9% | |||||||||||
| Citigroup, Inc., 7.125% to 9/30/23, Series Ja,b |
|
110,700 | $ | 2,889,270 | ||||||||
| PNC Financial Services Group, Inc., 6.125% to 5/31/22, |
|
750,178 | 18,836,969 | |||||||||
| Western Alliance Bancorp, 4.25% to 9/30/26, Series Aa,b |
|
239,442 | 5,260,541 | |||||||||
|
|
|
|||||||||||
| 26,986,780 | ||||||||||||
|
|
|
|||||||||||
| FINANCIAL—INVESTMENT BANKER/BROKER |
0.3% | |||||||||||
| Morgan Stanley, 6.375% to 10/15/24, Series Ia,b |
|
342,251 | 8,908,793 | |||||||||
|
|
|
|||||||||||
| PIPELINES |
0.4% | |||||||||||
| Energy Transfer LP, 7.625% to 8/15/23, Series Da,b |
|
385,921 | 9,277,541 | |||||||||
| Energy Transfer LP, 7.60% to 5/15/24, Series Ea,b |
|
120,000 | 2,904,000 | |||||||||
|
|
|
|||||||||||
| 12,181,541 | ||||||||||||
|
|
|
|||||||||||
| UTILITIES |
0.9% | |||||||||||
| ELECTRIC—FOREIGN |
0.4% | |||||||||||
| Algonquin Power & Utilities Corp., 6.875% to 10/17/23, due 10/17/78 (Canada)a |
|
134,649 | 3,483,370 | |||||||||
| Algonquin Power & Utilities Corp., 6.20% to 7/1/24, due 7/1/79, Series 19-A (Canada)a |
|
353,487 | 9,049,267 | |||||||||
|
|
|
|||||||||||
| 12,532,637 | ||||||||||||
|
|
|
|||||||||||
| GAS—DISTRIBUTION |
0.5% | |||||||||||
| NiSource, Inc., 6.50% to 3/15/24, Series Ba,b |
|
497,751 | 13,026,144 | |||||||||
|
|
|
|||||||||||
| TOTAL UTILITIES |
|
25,558,781 | ||||||||||
|
|
|
|||||||||||
| TOTAL PREFERRED
SECURITIES—$25 PAR VALUE |
|
73,635,895 | ||||||||||
|
|
|
|||||||||||
| Principal Amount |
||||||||||||
| PREFERRED SECURITIES—CAPITAL SECURITIES |
70.2% | |||||||||||
| BANKS |
22.6% | |||||||||||
| Ally Financial, Inc., 4.70% to 5/15/26, Series Ba,b |
|
$ | 5,235,000 | 4,536,782 | ||||||||
| Bank of America Corp., 6.10% to 3/17/25, Series AAa,b |
|
33,971,000 | 34,353,174 | |||||||||
| Bank of America Corp., 6.125% to 4/27/27, Series TTa,b |
|
13,020,000 | 13,052,550 | |||||||||
| Bank of America Corp., 6.25% to 9/5/24, Series Xa,b |
|
40,690,000 | 41,292,212 | |||||||||
| Bank of America Corp., 6.30% to 3/10/26, Series DDa,b |
|
6,692,000 | 6,876,030 | |||||||||
| Bank of America Corp., 6.50% to 10/23/24, Series Za,b |
|
34,553,000 | 35,309,020 | |||||||||
See accompanying notes to financial statements.
10
COHEN & STEERS LOW DURATION PREFERRED AND INCOME FUND, INC.
SCHEDULE OF INVESTMENTS—(Continued)
April 30, 2022
| Principal Amount |
Value | |||||||||
| Bank of New York Mellon Corp./The, 4.70% to 9/20/25, Series Ga,b |
$ | 7,129,000 | $ | 7,129,000 | ||||||
| Citigroup, Inc., 3.875% to 2/18/26a,b |
21,628,000 | 19,591,075 | ||||||||
| Citigroup, Inc., 4.15% to 11/15/26, Series Ya,b |
5,773,000 | 5,121,228 | ||||||||
| Citigroup, Inc., 5.90% to 2/15/23a,b |
26,388,000 | 26,893,858 | ||||||||
| Citigroup, Inc., 5.95% to 1/30/23a,b |
42,415,000 | 42,521,037 | ||||||||
| Citigroup, Inc., 5.95% to 5/15/25, Series Pa,b |
21,592,000 | 21,133,170 | ||||||||
| Citigroup, Inc., 6.30% to 5/15/24, Series Ma,b |
3,000,000 | 2,977,500 | ||||||||
| Citizens Financial Group, Inc., 4.00% to 10/6/26, Series Ga,b |
7,500,000 | 6,675,000 | ||||||||
| Citizens Financial Group, Inc., 5.65% to 10/6/25, Series Fa,b |
4,250,000 | 4,365,809 | ||||||||
| CoBank ACB, 6.25% to 10/1/22, Series Fa,b |
48,100 | † | 4,858,100 | |||||||
| CoBank ACB, 6.25% to 10/1/26, Series Ia,b |
1,300,000 | 1,309,750 | ||||||||
| Comerica, Inc., 5.625% to 7/1/25a,b |
11,062,000 | 11,283,240 | ||||||||
| Corestates Capital II, 1.694% (3 Month US LIBOR + 0.65%), due 1/15/27, 144A (TruPS) (FRN)c,d |
15,000,000 | 14,403,016 | ||||||||
| Corestates Capital III, 1.076% (3 Month US LIBOR + 0.57%), due 2/15/27, 144A (TruPS) (FRN)c,d |
12,281,000 | 11,777,780 | ||||||||
| Farm Credit Bank of Texas, 5.70% to 9/15/25, Series 4, 144Aa,b,d |
7,425,000 | 7,796,250 | ||||||||
| Farm Credit Bank of Texas, 6.75% to 9/15/23, 144Aa,b,d |
8,000 | † | 830,000 | |||||||
| First Maryland Capital II, 1.167% (3 Month US LIBOR + 0.85%), due 2/1/27, (TruPS) (FRN)c |
10,000,000 | 9,550,279 | ||||||||
| Goldman Sachs Group, Inc./The, 4.125% to 11/10/26, Series Va,b |
9,692,000 | 8,704,104 | ||||||||
| Goldman Sachs Group, Inc./The, 5.50% to 8/10/24, Series Qa,b |
10,279,000 | 10,325,667 | ||||||||
| Huntington Bancshares, Inc., 4.45% to 10/15/27, Series Ga,b |
7,752,000 | 7,442,564 | ||||||||
| JPMorgan Chase & Co., 4.709% (3 Month US LIBOR + 3.47%), Series I (FRN)b,c |
5,482,000 | 5,416,950 | ||||||||
| JPMorgan Chase & Co., 6.00% to 8/1/23, Series Ra,b |
5,766,000 | 5,794,830 | ||||||||
| JPMorgan Chase & Co., 6.10% to 10/1/24, Series Xa,b |
16,170,000 | 16,214,063 | ||||||||
| JPMorgan Chase & Co., 6.75% to 2/1/24, Series Sa,b |
46,900,000 | 47,754,049 | ||||||||
| KeyCorp Capital I, 1.707% (3 Month US LIBOR + 0.74%), due 7/1/28, (TruPS) (FRN)c |
17,390,000 | 16,664,788 | ||||||||
See accompanying notes to financial statements.
11
COHEN & STEERS LOW DURATION PREFERRED AND INCOME FUND, INC.
SCHEDULE OF INVESTMENTS—(Continued)
April 30, 2022
| Principal Amount |
Value | |||||||||||
| Morgan Stanley, 1.435% (SOFR + 1.165%), due 4/17/25 (FRN)c |
|
$ | 17,500,000 | $ | 17,520,960 | |||||||
| PNC Financial Services Group, Inc./The, 3.995% (3 Month US LIBOR + 3.678%), Series O (FRN)b,c |
|
28,671,000 | 28,578,639 | |||||||||
| PNC Financial Services Group, Inc./The, 6.00% to 5/15/27, Series Ua,b |
|
12,660,000 | 12,660,000 | |||||||||
| SVB Financial Group, 4.00% to 5/15/26, Series Ca,b |
|
14,710,000 | 12,811,675 | |||||||||
| SVB Financial Group, 4.25% to 11/15/26, Series Da,b |
|
17,990,000 | 15,606,325 | |||||||||
| Truist Bank, 1.476% (3 Month US LIBOR + 0.65%), due 3/15/28, (TruPS) (FRN)c |
|
20,003,000 | 18,927,772 | |||||||||
| Truist Financial Corp., 4.95% to 9/1/25, Series Pa,b |
|
36,294,000 | 36,339,367 | |||||||||
| Wells Fargo & Co., 1.544% (3 Month US LIBOR + 0.50%), due 1/15/27, (FRN)c |
|
12,920,000 | 12,308,534 | |||||||||
| Wells Fargo & Co., 3.90% to 3/15/26, Series BBa,b |
|
44,079,000 | 40,247,433 | |||||||||
| Wells Fargo & Co., 5.875% to 6/15/25, Series Ua,b |
|
10,900,000 | 11,009,000 | |||||||||
|
|
|
|||||||||||
| 657,962,580 | ||||||||||||
|
|
|
|||||||||||
| BANKS—FOREIGN |
16.3% | |||||||||||
| Banco Mercantil del Norte SA/Grand Cayman, 5.875% to 1/24/27, 144A (Mexico)a,b,d,e |
|
2,200,000 | 1,974,830 | |||||||||
| Banco Mercantil del Norte SA/Grand Cayman, 6.875% to 7/6/22, 144A (Mexico)a,b,d,e |
|
4,000,000 | 3,962,580 | |||||||||
| Banco Santander SA, 7.50% to 2/8/24 (Spain)a,b,e,f |
|
8,400,000 | 8,491,879 | |||||||||
| Bank of Montreal, 4.30% to 10/26/25, due 11/26/80 (Canada)a |
|
7,900,000 | 5,952,442 | |||||||||
| Bank of Montreal, 4.80% to 8/25/24 (Canada)a,b |
|
2,880,000 | 2,772,720 | |||||||||
| Bank of Nova Scotia/The, 4.90% to 6/4/25 (Canada)a,b |
|
11,985,000 | 11,789,165 | |||||||||
| Barclays PLC, 5.875% to 9/15/24 (United Kingdom)a,b,e,f |
|
1,600,000 | 1,973,907 | |||||||||
| Barclays PLC, 6.125% to 12/15/25 (United Kingdom)a,b,e |
|
7,200,000 | 7,069,464 | |||||||||
| Barclays PLC, 6.375% to 12/15/25 (United Kingdom)a,b,e,f |
|
3,200,000 | 4,055,167 | |||||||||
| Barclays PLC, 7.25% to 3/15/23 (United Kingdom)a,b,e,f |
|
7,000,000 | 8,912,180 | |||||||||
| Barclays PLC, 7.875% to 9/15/22 (United Kingdom)a,b,e,f |
|
4,000,000 | 5,062,520 | |||||||||
| Barclays PLC, 8.00% to 6/15/24 (United Kingdom)a,b,e |
|
14,000,000 | 14,463,750 | |||||||||
| BNP Paribas SA, 6.625% to 3/25/24, 144A (France)a,b,d,e |
|
12,700,000 | 12,840,824 | |||||||||
| BNP Paribas SA, 7.375% to 8/19/25, 144A (France)a,b,d,e |
|
13,600,000 | 14,165,828 | |||||||||
| Credit Agricole SA, 6.875% to 9/23/24, 144A (France)a,b,d,e |
|
26,400,000 | 26,578,200 | |||||||||
See accompanying notes to financial statements.
12
COHEN & STEERS LOW DURATION PREFERRED AND INCOME FUND, INC.
SCHEDULE OF INVESTMENTS—(Continued)
April 30, 2022
| Principal Amount |
Value | |||||||||
| Credit Agricole SA, 7.875% to 1/23/24, 144A (France)a,b,d,e |
$ | 32,200,000 | $ | 33,085,500 | ||||||
| Credit Suisse Group AG, 7.125% to 7/29/22 (Switzerland)a,b,e,f |
29,400,000 | 29,405,880 | ||||||||
| Credit Suisse Group AG, 7.50% to 12/11/23, 144A (Switzerland)a,b,d,e |
5,600,000 | 5,622,932 | ||||||||
| Credit Suisse Group AG, 7.50% to 7/17/23, 144A (Switzerland)a,b,d,e |
31,610,000 | 31,382,408 | ||||||||
| ING Groep N.V., 5.75% to 11/16/26 (Netherlands)a,b,e |
11,200,000 | 10,761,352 | ||||||||
| ING Groep N.V., 6.50% to 4/16/25 (Netherlands)a,b,e |
8,600,000 | 8,598,280 | ||||||||
| ING Groep N.V., 6.75% to 4/16/24 (Netherlands)a,b,e,f |
12,600,000 | 12,694,500 | ||||||||
| Intesa Sanpaolo SpA, 7.70% to 9/17/25, 144A (Italy)a,b,d,e |
5,400,000 | 5,454,000 | ||||||||
| Lloyds Banking Group PLC, 7.50% to 6/27/24 (United Kingdom)a,b,e |
14,600,000 | 14,919,302 | ||||||||
| Lloyds Banking Group PLC, 7.50% to 9/27/25 (United Kingdom)a,b,e |
16,700,000 | 17,202,670 | ||||||||
| Natwest Group PLC, 6.00% to 12/29/25 (United Kingdom)a,b,e |
11,600,000 | 11,461,380 | ||||||||
| Natwest Group PLC, 8.00% to 8/10/25 (United Kingdom)a,b,e |
16,551,000 | 17,450,381 | ||||||||
| Nordea Bank Abp, 6.625% to 3/26/26, 144A (Finland)a,b,d,e |
8,200,000 | 8,343,500 | ||||||||
| Royal Bank of Canada, 3.65% to 10/24/26, due 11/24/81 (Canada)a |
2,400,000 | 1,631,511 | ||||||||
| Royal Bank of Canada, 4.50% to 10/24/25, due 11/24/80, Series 1 (Canada)a |
19,150,000 | 14,536,350 | ||||||||
| Societe Generale SA, 7.875% to 12/18/23, 144A (France)a,b,d,e |
29,400,000 | 30,161,621 | ||||||||
| Societe Generale SA, 8.00% to 9/29/25, 144A (France)a,b,d,e |
10,600,000 | 11,055,005 | ||||||||
| Standard Chartered PLC, 7.75% to 4/2/23, 144A (United Kingdom)a,b,d,e |
27,800,000 | 28,516,128 | ||||||||
| Svenska Handelsbanken AB, 6.25% to 3/1/24, Series EMTN (Sweden)a,b,e,f |
4,600,000 | 4,643,235 | ||||||||
| UBS Group AG, 6.875% to 8/7/25 (Switzerland)a,b,e,f |
14,000,000 | 14,220,640 | ||||||||
See accompanying notes to financial statements.
13
COHEN & STEERS LOW DURATION PREFERRED AND INCOME FUND, INC.
SCHEDULE OF INVESTMENTS—(Continued)
April 30, 2022
| Principal Amount |
Value | |||||||||||
| UBS Group AG, 7.00% to 1/31/24, 144A (Switzerland)a,b,d,e |
|
$ | 25,450,000 | $ | 25,927,188 | |||||||
| UBS Group AG, 7.00% to 2/19/25 (Switzerland)a,b,e,f |
|
8,000,000 | 8,180,080 | |||||||||
|
|
|
|||||||||||
| 475,319,299 | ||||||||||||
|
|
|
|||||||||||
| ELECTRIC |
3.0% | |||||||||||
| American Electric Power Co., Inc., 2.031%, due 3/15/24 |
|
20,180,000 | 19,658,042 | |||||||||
| American Electric Power Co., Inc., 3.875% to 11/15/26, due 2/15/62a |
|
7,610,000 | 6,823,261 | |||||||||
| Dominion Energy, Inc., 4.35% to 1/15/27, Series Ca,b |
|
13,039,000 | 11,973,714 | |||||||||
| Dominion Energy, Inc., 4.65% to 12/15/24, Series Ba,b |
|
7,552,000 | 7,249,920 | |||||||||
| Duke Energy Corp., 4.875% to 9/16/24a,b |
|
8,790,000 | 8,724,075 | |||||||||
| NextEra Energy Capital Holdings, Inc., 3.80% to 3/15/27, due 3/15/82a |
|
3,254,000 | 2,837,701 | |||||||||
| Southern Co./The, 3.75% to 6/15/26, due 9/15/51, Series 21-Aa |
|
6,951,000 | 6,273,278 | |||||||||
| Southern Co./The, 4.00% to 10/15/25, due 1/15/51, Series Ba |
|
8,140,000 | 7,754,652 | |||||||||
| Southern Co./The, 4.456% (3 Month US LIBOR + 3.63%), due 3/15/57, Series B (FRN)c |
|
15,433,000 | 15,167,003 | |||||||||
|
|
|
|||||||||||
| 86,461,646 | ||||||||||||
|
|
|
|||||||||||
| ELECTRIC—FOREIGN |
1.2% | |||||||||||
| Electricite de France SA, 4.00% to 7/4/24 (France)a,b,f |
|
5,000,000 | 5,136,289 | |||||||||
| Electricite de France SA, 5.25% to 1/29/23, 144A (France)a,b,d |
|
8,650,000 | 8,574,312 | |||||||||
| Electricite de France SA, 6.00% to 1/29/26, Series EMTN (France)a,b,f |
|
9,000,000 | 11,158,977 | |||||||||
| Emera, Inc., 6.75% to 6/15/26, due 6/15/76, Series 16-A (Canada)a |
|
9,120,000 | 9,279,600 | |||||||||
|
|
|
|||||||||||
| 34,149,178 | ||||||||||||
|
|
|
|||||||||||
| FINANCIAL |
4.0% | |||||||||||
| DIVERSIFIED FINANCIAL SERVICES |
0.2% | |||||||||||
| Apollo Management Holdings LP, 4.95% to 12/17/24, due 1/14/50, 144Aa,d |
|
5,035,000 | 4,679,386 | |||||||||
| Ares Finance Co. III LLC, 4.125% to 6/30/26, due 6/30/51, 144Aa,d |
|
470,000 | 437,590 | |||||||||
|
|
|
|||||||||||
| 5,116,976 | ||||||||||||
|
|
|
|||||||||||
See accompanying notes to financial statements.
14
COHEN & STEERS LOW DURATION PREFERRED AND INCOME FUND, INC.
SCHEDULE OF INVESTMENTS—(Continued)
April 30, 2022
| Principal Amount |
Value | |||||||||||
| INVESTMENT BANKER/BROKER |
3.8% | |||||||||||
| Charles Schwab Corp./The, 4.00% to 6/1/26, Series Ia,b |
|
$ | 40,147,000 | $ | 36,453,476 | |||||||
| Charles Schwab Corp./The, 5.00% to 6/1/27a,b |
|
3,207,000 | 3,097,866 | |||||||||
| Charles Schwab Corp./The, 5.137% (3 Month US LIBOR + 4.82%) (FRN)b,c |
|
13,650,000 | 13,615,875 | |||||||||
| Charles Schwab Corp./The, 5.375% to 6/1/25, Series Ga,b |
|
57,274,000 | 57,993,934 | |||||||||
|
|
|
|||||||||||
| 111,161,151 | ||||||||||||
|
|
|
|||||||||||
| TOTAL FINANCIAL |
|
116,278,127 | ||||||||||
|
|
|
|||||||||||
| INSURANCE |
15.6% | |||||||||||
| FINANCE |
0.2% | |||||||||||
| Liberty Mutual Group, Inc., 4.125% to 9/15/26, due 12/15/51, 144Aa,d |
|
7,004,000 | 6,366,951 | |||||||||
|
|
|
|||||||||||
| LIFE/HEALTH INSURANCE |
5.2% | |||||||||||
| Equitable Holdings, Inc., 4.95% to 9/15/25, Series Ba,b |
|
8,810,000 | 8,814,403 | |||||||||
| Prudential Financial, Inc., 5.20% to 3/15/24, due 3/15/44a |
|
18,477,000 | 18,002,788 | |||||||||
| Prudential Financial, Inc., 5.375% to 5/15/25, due 5/15/45a |
|
9,812,000 | 9,769,808 | |||||||||
| Prudential Financial, Inc., 5.625% to 6/15/23, due 6/15/43a |
|
44,669,000 | 44,712,329 | |||||||||
| Prudential Financial, Inc., 5.875% to 9/15/22, due 9/15/42a |
|
49,199,000 | 49,131,351 | |||||||||
| SBL Holdings, Inc., 6.50% to 11/13/26, 144Aa,b,d |
|
9,770,000 | 8,597,600 | |||||||||
| Voya Financial, Inc., 5.65% to 5/15/23, due 5/15/53a |
|
12,564,000 | 12,516,948 | |||||||||
|
|
|
|||||||||||
| 151,545,227 | ||||||||||||
|
|
|
|||||||||||
| LIFE/HEALTH INSURANCE—FOREIGN |
6.2% | |||||||||||
| AXA SA, 5.125% to 1/17/27, due 1/17/47, Series EMTN (France)a,f |
|
3,000,000 | 3,039,273 | |||||||||
| Dai-ichi Life Insurance Co., Ltd./The, 5.10% to 10/28/24, 144A (Japan)a,b,d |
|
28,850,000 | 29,499,126 | |||||||||
| Fukoku Mutual Life Insurance Co., 6.50% to 9/19/23 (Japan)a,b,f |
|
13,946,000 | 14,351,619 | |||||||||
| Hanwha Life Insurance Co., Ltd., 4.70% to 4/23/23, 144A (South Korea)a,b,d |
|
4,000,000 | 4,025,002 | |||||||||
See accompanying notes to financial statements.
15
COHEN & STEERS LOW DURATION PREFERRED AND INCOME FUND, INC.
SCHEDULE OF INVESTMENTS—(Continued)
April 30, 2022
| Principal Amount |
Value | |||||||||||
| Meiji Yasuda Life Insurance Co., 5.20% to 10/20/25, due 10/20/45, 144A (Japan)a,d |
|
$ | 22,280,000 | $ | 22,601,946 | |||||||
| Nippon Life Insurance Co., 5.00% to 10/18/22, due 10/18/42, 144A (Japan)a,d |
|
35,550,000 | 35,721,351 | |||||||||
| Nippon Life Insurance Co., 5.10% to 10/16/24, due 10/16/44, 144A (Japan)a,d |
|
36,400,000 | 36,620,584 | |||||||||
| Rothesay Life PLC, 4.875% to 4/13/27, Series NC6 (United Kingdom)a,b,e,f |
|
8,200,000 | 7,369,914 | |||||||||
| Sumitomo Life Insurance Co., 6.50% to 9/20/23, due 9/20/73, 144A (Japan)a,d |
|
25,000,000 | 25,709,500 | |||||||||
|
|
|
|||||||||||
| 178,938,315 | ||||||||||||
|
|
|
|||||||||||
| MULTI-LINE |
0.5% | |||||||||||
| Hartford Financial Services Group, Inc./The, 2.631% (3 Month US LIBOR + 2.125%), due 2/12/67, 144A, Series ICON (FRN)c,d |
|
16,381,000 | 14,432,802 | |||||||||
|
|
|
|||||||||||
| PROPERTY CASUALTY |
0.2% | |||||||||||
| Enstar Finance LLC, 5.50% to 1/15/27, due 1/15/42a |
|
7,480,000 | 6,969,527 | |||||||||
|
|
|
|||||||||||
| PROPERTY CASUALTY—FOREIGN |
2.9% | |||||||||||
| Athora Netherlands NV, 6.25% to 11/16/22 (Netherlands)a,b,f |
|
10,900,000 | 10,916,350 | |||||||||
| QBE Insurance Group Ltd., 5.875% to 5/12/25, 144A (Australia)a,b,d |
|
8,700,000 | 8,765,250 | |||||||||
| QBE Insurance Group Ltd., 6.75% to 12/2/24, due 12/2/44 (Australia)a,f |
|
23,561,000 | 24,391,879 | |||||||||
| QBE Insurance Group Ltd., 7.50% to 11/24/23, due 11/24/43, 144A (Australia)a,d |
|
30,995,000 | 32,274,392 | |||||||||
| Sompo Japan Insurance, Inc., 5.325% to 3/28/23, due 3/28/73, 144A (Japan)a,d |
|
8,650,000 | 8,735,159 | |||||||||
|
|
|
|||||||||||
| 85,083,030 | ||||||||||||
|
|
|
|||||||||||
| REINSURANCE |
0.4% | |||||||||||
| Global Atlantic Fin Co., 4.70% to 7/15/26, due 10/15/51, 144Aa,d |
|
11,622,000 | 10,568,582 | |||||||||
|
|
|
|||||||||||
| TOTAL INSURANCE |
|
453,904,434 | ||||||||||
|
|
|
|||||||||||
See accompanying notes to financial statements.
16
COHEN & STEERS LOW DURATION PREFERRED AND INCOME FUND, INC.
SCHEDULE OF INVESTMENTS—(Continued)
April 30, 2022
| Principal Amount |
Value | |||||||||||
| OIL & GAS—FOREIGN |
0.9% | |||||||||||
| BP Capital Markets PLC, 4.25% to 3/22/27 (United Kingdom)a,b,f |
|
$ | 1,700,000 | $ | 2,056,488 | |||||||
| BP Capital Markets PLC, 4.375% to 6/22/25 (United Kingdom)a,b |
|
24,362,000 | 23,735,896 | |||||||||
|
|
|
|||||||||||
| 25,792,384 | ||||||||||||
|
|
|
|||||||||||
| PIPELINES—FOREIGN |
1.1% | |||||||||||
| Enbridge, Inc., 6.00% to 1/15/27, due 1/15/77, Series 16-A (Canada)a |
|
3,500,000 | 3,521,059 | |||||||||
| Enbridge, Inc., 6.25% to 3/1/28, due 3/1/78 (Canada)a |
|
4,369,000 | 4,412,415 | |||||||||
| Transcanada Trust, 5.875% to 8/15/26, due 8/15/76, Series 16-A (Canada)a |
|
25,019,000 | 25,139,841 | |||||||||
|
|
|
|||||||||||
| 33,073,315 | ||||||||||||
|
|
|
|||||||||||
| REAL ESTATE—RETAIL—FOREIGN |
0.5% | |||||||||||
| Scentre Group Trust 2, 4.75% to 6/24/26, due 9/24/80, 144A (Australia)a,d |
|
13,500,000 | 13,049,100 | |||||||||
|
|
|
|||||||||||
|
TELECOMMUNICATION—COMMUNICATIONS—FOREIGN |
0.6% | |||||||||||
| Vodafone Group PLC, 6.25% to 7/3/24, due 10/3/78 (United Kingdom)a,f |
|
18,200,000 | 18,448,976 | |||||||||
|
|
|
|||||||||||
| UTILITIES |
4.4% | |||||||||||
| ELECTRIC |
1.9% | |||||||||||
| Edison International, 5.00% to 12/15/26, Series Ba,b |
|
8,115,000 | 7,365,365 | |||||||||
| Edison International, 5.375% to 3/15/26, Series Aa,b |
|
9,173,000 | 8,483,466 | |||||||||
| Sempra Energy, 4.125% to 1/1/27, due 4/1/52a |
|
14,580,000 | 12,840,138 | |||||||||
| Sempra Energy, 4.875% to 10/15/25a,b |
|
27,980,000 | 27,630,250 | |||||||||
|
|
|
|||||||||||
| 56,319,219 | ||||||||||||
|
|
|
|||||||||||
| ELECTRIC—FOREIGN |
2.5% | |||||||||||
| Algonquin Power & Utilities Corp., 4.75% to 1/18/27, due 1/18/82 (Canada)a |
|
15,516,000 | 14,211,725 | |||||||||
| Enel SpA, 8.75% to 9/24/23, due 9/24/73, 144A (Italy)a,d |
|
51,860,000 | 54,899,255 | |||||||||
| Iberdrola International BV, 1.874% to 1/28/26, Series NC5 (Spain)a,b,f |
|
3,100,000 | 3,051,109 | |||||||||
|
|
|
|||||||||||
| 72,162,089 | ||||||||||||
|
|
|
|||||||||||
| TOTAL UTILITIES |
|
128,481,308 | ||||||||||
|
|
|
|||||||||||
| TOTAL PREFERRED
SECURITIES—CAPITAL SECURITIES |
|
2,042,920,347 | ||||||||||
|
|
|
|||||||||||
See accompanying notes to financial statements.
17
COHEN & STEERS LOW DURATION PREFERRED AND INCOME FUND, INC.
SCHEDULE OF INVESTMENTS—(Continued)
April 30, 2022
| Principal Amount |
Value | |||||||||||
| CORPORATE BONDS |
23.2% | |||||||||||
| COMMUNICATIONS—TOWERS |
1.1% | |||||||||||
| American Tower Corp., 1.45%, due 9/15/26 |
|
$ | 6,500,000 | $ | 5,808,203 | |||||||
| American Tower Corp., 2.75%, due 1/15/27 |
|
3,000,000 | 2,790,330 | |||||||||
| American Tower Corp., 3.125%, due 1/15/27 |
|
5,000,000 | 4,726,547 | |||||||||
| SBA Communications Corp., 3.875%, due 2/15/27 |
|
19,700,000 | 18,718,940 | |||||||||
|
|
|
|||||||||||
| 32,044,020 | ||||||||||||
|
|
|
|||||||||||
| CONSUMER CYCLICAL |
0.9% | |||||||||||
| GSK Consumer Healthcare Capital US LLC, 3.024%, due 3/24/24, 144Ad |
|
9,400,000 | 9,312,695 | |||||||||
| GSK Consumer Healthcare Capital US LLC, 3.125%, due 3/24/25, 144Ad |
|
9,000,000 | 8,833,741 | |||||||||
| GSK Consumer Healthcare Capital US LLC, 3.375%, due 3/24/27, 144Ad |
|
7,000,000 | 6,777,051 | |||||||||
|
|
|
|||||||||||
| 24,923,487 | ||||||||||||
|
|
|
|||||||||||
| CONSUMER DISCRETIONARY |
0.5% | |||||||||||
| Amazon.com, Inc., 2.73%, due 4/13/24 |
|
7,850,000 | 7,844,997 | |||||||||
| Amazon.com, Inc., 3.00%, due 4/13/25 |
|
7,850,000 | 7,830,480 | |||||||||
|
|
|
|||||||||||
| 15,675,477 | ||||||||||||
|
|
|
|||||||||||
| CONSUMER STAPLES |
0.2% | |||||||||||
| 7-Eleven, Inc., 0.80%, due 2/10/24, 144Ad |
|
5,580,000 | 5,320,444 | |||||||||
|
|
|
|||||||||||
| ELECTRIC |
2.5% | |||||||||||
| Dominion Energy, Inc., 1.45%, due 4/15/26, Series A |
|
7,000,000 | 6,379,062 | |||||||||
| Dominion Energy, Inc., 3.071%, due 8/15/24 |
|
14,541,000 | 14,362,283 | |||||||||
| DTE Energy Co., 2.529%, due 10/1/24, Series C |
|
5,900,000 | 5,755,067 | |||||||||
| Georgia Power Co., 2.20%, due 9/15/24, Series A |
|
7,000,000 | 6,814,721 | |||||||||
| NextEra Energy Capital Holdings, Inc., 0.65%, due 3/1/23 |
|
13,000,000 | 12,796,558 | |||||||||
| Southern California Edison Co., 0.70%, due 4/3/23 |
|
12,390,000 | 12,131,231 | |||||||||
| Southern California Edison Co., 1.10%, due 4/1/24 |
|
15,250,000 | 14,640,830 | |||||||||
|
|
|
|||||||||||
| 72,879,752 | ||||||||||||
|
|
|
|||||||||||
| ELECTRIC—FOREIGN |
0.2% | |||||||||||
| Emera US Finance LP, 0.833%, due 6/15/24 (Canada) |
|
6,450,000 | 6,047,274 | |||||||||
|
|
|
|||||||||||
See accompanying notes to financial statements.
18
COHEN & STEERS LOW DURATION PREFERRED AND INCOME FUND, INC.
SCHEDULE OF INVESTMENTS—(Continued)
April 30, 2022
| Principal Amount |
Value | |||||||||||
| ENERGY |
0.1% | |||||||||||
| East Ohio Gas Co./The, 1.30%, due 6/15/25, 144Ad |
|
$ | 4,270,000 | $ | 3,972,249 | |||||||
|
|
|
|||||||||||
| FINANCIAL |
3.3% | |||||||||||
| DIVERSIFIED FINANCIAL SERVICES |
3.1% | |||||||||||
| BGC Partners, Inc., 3.75%, due 10/1/24 |
|
7,000,000 | 6,934,659 | |||||||||
| BGC Partners, Inc., 4.375%, due 12/15/25 |
|
4,000,000 | 3,970,071 | |||||||||
| Ford Motor Credit Co. LLC, 2.30%, due 2/10/25 |
|
29,200,000 | 27,153,372 | |||||||||
| Ford Motor Credit Co. LLC, 3.37%, due 11/17/23 |
|
5,635,000 | 5,543,431 | |||||||||
| Ford Motor Credit Co. LLC, 3.375%, due 11/13/25 |
|
7,000,000 | 6,729,555 | |||||||||
| General Motors Financial Co., Inc., 1.25%, due 1/8/26 |
|
6,650,000 | 5,957,135 | |||||||||
| General Motors Financial Co., Inc., 1.574% (SOFR + 1.30%), due 4/7/25 (FRN)c |
|
6,425,000 | 6,409,158 | |||||||||
| General Motors Financial Co., Inc., 1.952% (3 Month US LIBOR + 0.99%), due 1/5/23 (FRN)c |
|
3,875,000 | 3,877,212 | |||||||||
| General Motors Financial Co., Inc., 2.306% (3 Month US LIBOR + 1.31%), due 6/30/22 (FRN)c |
|
4,461,000 | 4,465,688 | |||||||||
| General Motors Financial Co., Inc., 3.80%, due 4/7/25 |
|
6,000,000 | 5,931,561 | |||||||||
| National Rural Utilities Cooperative Finance Corp., 1.875%, due 2/7/25, Series MTN |
|
13,920,000 | 13,327,040 | |||||||||
|
|
|
|||||||||||
| 90,298,882 | ||||||||||||
|
|
|
|||||||||||
| INVESTMENT BANKER/BROKER |
0.2% | |||||||||||
| Ladder Capital Finance Holdings LLLP/Ladder Capital Finance Corp., 4.25%, due 2/1/27, 144Ad |
|
3,000,000 | 2,761,320 | |||||||||
| Ladder Capital Finance Holdings LLLP/Ladder Capital Finance Corp., 4.75%, due 6/15/29, 144Ad |
|
1,800,000 | 1,617,930 | |||||||||
|
|
|
|||||||||||
| 4,379,250 | ||||||||||||
|
|
|
|||||||||||
| TOTAL FINANCIAL |
|
94,678,132 | ||||||||||
|
|
|
|||||||||||
| FINANCIAL—FOREIGN |
0.6% | |||||||||||
| AerCap Ireland Capital DAC Trust, 1.65%, due 10/29/24 (Ireland) |
|
19,120,000 | 17,842,128 | |||||||||
|
|
|
|||||||||||
| INTEGRATED TELECOMMUNICATIONS SERVICES |
2.3% | |||||||||||
| AT&T, Inc., 0.90%, due 3/25/24 |
|
23,000,000 | 22,103,627 | |||||||||
| AT&T, Inc., 2.875% to 3/2/25, Series Ba,b |
|
6,000,000 | 5,984,258 | |||||||||
| T-Mobile USA, Inc., 2.25%, due 2/15/26 |
|
6,420,000 | 5,913,366 | |||||||||
| T-Mobile USA, Inc., 2.625%, due 4/15/26 |
|
10,000,000 | 9,285,000 | |||||||||
See accompanying notes to financial statements.
19
COHEN & STEERS LOW DURATION PREFERRED AND INCOME FUND, INC.
SCHEDULE OF INVESTMENTS—(Continued)
April 30, 2022
| Principal Amount |
Value | |||||||||||
| T-Mobile USA, Inc., 3.50%, due 4/15/25 |
|
$ | 7,000,000 | $ | 6,908,404 | |||||||
| Verizon Communications, Inc., 1.606% (3 Month US LIBOR + 1.10%), due 5/15/25 (FRN)c |
|
16,525,000 | 16,720,753 | |||||||||
|
|
|
|||||||||||
| 66,915,408 | ||||||||||||
|
|
|
|||||||||||
| MEDIA |
1.1% | |||||||||||
| Magallanes Inc, 3.428%, due 3/15/24, 144Ad |
|
4,140,000 | 4,115,719 | |||||||||
| Magallanes, Inc., 3.638%, due 3/15/25, 144Ad |
|
8,615,000 | 8,482,587 | |||||||||
| Magallanes, Inc., 3.755%, due 3/15/27, 144Ad |
|
6,250,000 | 6,052,247 | |||||||||
| Magallanes, Inc., 3.788%, due 3/15/25, 144Ad |
|
13,885,000 | 13,699,237 | |||||||||
|
|
|
|||||||||||
| 32,349,790 | ||||||||||||
|
|
|
|||||||||||
| PIPELINES—FOREIGN |
0.7% | |||||||||||
| Enbridge, Inc., 0.831% (SOFR + 0.63%), due 2/16/24 (FRN) (Canada)c |
|
4,735,000 | 4,742,110 | |||||||||
| Enbridge, Inc., 1.60%, due 10/4/26 (Canada) |
|
9,940,000 | 8,991,974 | |||||||||
| Enbridge, Inc., 2.15%, due 2/16/24 (Canada) |
|
4,735,000 | 4,629,663 | |||||||||
| Enbridge, Inc., 2.50%, due 2/14/25 (Canada) |
|
2,745,000 | 2,662,143 | |||||||||
|
|
|
|||||||||||
| 21,025,890 | ||||||||||||
|
|
|
|||||||||||
| REAL ESTATE |
9.1% | |||||||||||
| DIVERSIFIED |
0.5% | |||||||||||
| American Finance Trust, Inc./American Finance Operating Partner LP, 4.50%, due 9/30/28, 4.50%, 144Ad |
|
7,695,000 | 6,565,605 | |||||||||
| CTR Partnership LP/CareTrust Capital Corp., 3.875%, due 6/30/28, 3.875%, 144Ad |
|
5,350,000 | 4,849,320 | |||||||||
| National Retail Properties, Inc., 3.90%, due 6/15/24 |
|
3,760,000 | 3,784,476 | |||||||||
|
|
|
|||||||||||
| 15,199,401 | ||||||||||||
|
|
|
|||||||||||
| FINANCE |
1.0% | |||||||||||
| Essex Portfolio LP, 3.875%, due 5/1/24 |
|
1,400,000 | 1,406,161 | |||||||||
| Newmark Group, Inc., 6.125%, due 11/15/23, 6.125% |
|
17,310,000 | 17,665,374 | |||||||||
| Retail Opportunity Investments Partnership LP, 4.00%, due 12/15/24 |
|
10,200,000 | 10,112,142 | |||||||||
|
|
|
|||||||||||
| 29,183,677 | ||||||||||||
|
|
|
|||||||||||
| HEALTH CARE |
1.3% | |||||||||||
| MPT Operating Partnership LP/MPT Finance Corp., 5.25%, due 8/1/26 |
|
1,600,000 | 1,604,208 | |||||||||
| Sabra Health Care LP, 5.125%, due 8/15/26 |
|
8,433,000 | 8,419,582 | |||||||||
See accompanying notes to financial statements.
20
COHEN & STEERS LOW DURATION PREFERRED AND INCOME FUND, INC.
SCHEDULE OF INVESTMENTS—(Continued)
April 30, 2022
| Principal Amount |
Value | |||||||||||
| Welltower, Inc., 3.625%, due 3/15/24 |
|
$ | 10,060,000 | $ | 10,057,449 | |||||||
| Welltower, Inc., 4.00%, due 6/1/25 |
|
9,344,000 | 9,365,792 | |||||||||
| Welltower, Inc., 4.50%, due 1/15/24 |
|
8,289,000 | 8,404,469 | |||||||||
|
|
|
|||||||||||
| 37,851,500 | ||||||||||||
|
|
|
|||||||||||
| HOTEL |
0.1% | |||||||||||
| RLJ Lodging Trust LP, 3.75%, due 7/1/26, 3.75%, 144Ad |
|
3,150,000 | 2,917,435 | |||||||||
|
|
|
|||||||||||
| NET LEASE |
2.3% | |||||||||||
| Global Net Lease, Inc./Global Net Lease Operating Partnership LP, 3.75%, due 12/15/27, 144Ad |
|
11,550,000 | 10,386,737 | |||||||||
| Highwoods Realty LP, 3.625%, due 1/15/23 |
|
5,000,000 | 5,013,918 | |||||||||
| Realty Income Corp., 4.60%, due 2/6/24 |
|
9,200,000 | 9,378,771 | |||||||||
| Realty Income Corp., 4.875%, due 6/1/26 |
|
6,996,000 | 7,237,352 | |||||||||
| VICI Properties LP, 4.375%, due 5/15/25 |
|
5,000,000 | 5,001,450 | |||||||||
| VICI Properties LP, 4.75%, due 2/15/28 |
|
7,550,000 | 7,531,125 | |||||||||
| VICI Properties LP/VICI Note Co., Inc., 3.50%, due 2/15/25, 144Ad |
|
6,249,000 | 6,006,914 | |||||||||
| VICI Properties LP/VICI Note Co., Inc., 3.75%, due 2/15/27, 3.75%, 144Ad |
|
6,500,000 | 6,000,865 | |||||||||
| VICI Properties LP/VICI Note Co., Inc., 4.25%, due 12/1/26, 144Ad |
|
2,650,000 | 2,514,240 | |||||||||
| WP Carey, Inc., 4.60%, due 4/1/24 |
|
6,860,000 | 6,965,116 | |||||||||
|
|
|
|||||||||||
| 66,036,488 | ||||||||||||
|
|
|
|||||||||||
| OFFICE |
1.3% | |||||||||||
| Alexandria Real Estate Equities, Inc., 3.80%, due 4/15/26 |
|
5,000,000 | 4,986,050 | |||||||||
| Brandywine Operating Partnership LP, 3.95%, due 2/15/23 |
|
1,000,000 | 1,003,486 | |||||||||
| Kilroy Realty LP, 3.45%, due 12/15/24 |
|
25,393,000 | 25,024,109 | |||||||||
| SL Green Operating Partnership LP, 3.25%, due 10/15/22 |
|
8,190,000 | 8,197,015 | |||||||||
|
|
|
|||||||||||
| 39,210,660 | ||||||||||||
|
|
|
|||||||||||
| RETAIL |
0.2% | |||||||||||
| Retail Opportunity Investments Partnership LP, 5.00%, due 12/15/23 |
|
6,600,000 | 6,673,714 | |||||||||
|
|
|
|||||||||||
See accompanying notes to financial statements.
21
COHEN & STEERS LOW DURATION PREFERRED AND INCOME FUND, INC.
SCHEDULE OF INVESTMENTS—(Continued)
April 30, 2022
| Principal Amount |
Value | |||||||||||
| SELF STORAGE |
0.3% | |||||||||||
| CubeSmart LP, 4.00%, due 11/15/25 |
|
$ | 7,789,000 | $ | 7,754,475 | |||||||
|
|
|
|||||||||||
| SHOPPING CENTERS |
1.5% | |||||||||||
| COMMUNITY CENTER |
1.3% | |||||||||||
| Federal Realty Investment Trust, 3.95%, due 1/15/24 |
|
9,200,000 | 9,260,725 | |||||||||
| Kimco Realty Corp., 2.70%, due 3/1/24 |
|
6,459,000 | 6,363,804 | |||||||||
| Kimco Realty Corp., 3.50%, due 4/15/23 |
|
8,635,000 | 8,654,590 | |||||||||
| Kimco Realty Corp., 3.85%, due 6/1/25 |
|
5,550,000 | 5,537,840 | |||||||||
| Kimco Realty Corp., 4.45%, due 1/15/24 |
|
2,362,000 | 2,388,074 | |||||||||
| Weingarten Realty Investors, 3.375%, due 10/15/22 |
|
5,300,000 | 5,313,581 | |||||||||
|
|
|
|||||||||||
| 37,518,614 | ||||||||||||
|
|
|
|||||||||||
| REGIONAL MALL |
0.2% | |||||||||||
| Brookfield Property REIT, Inc./BPR Cumulus LLC/BPR Nimbus LLC/GGSI Sellco LLC, 5.75%, due 5/15/26, 144Ad |
|
6,426,000 | 6,233,541 | |||||||||
|
|
|
|||||||||||
| TOTAL SHOPPING CENTERS |
|
43,752,155 | ||||||||||
|
|
|
|||||||||||
| SPECIALTY |
0.6% | |||||||||||
| Equinix, Inc., 1.00%, due 9/15/25 |
|
6,000,000 | 5,445,013 | |||||||||
| Equinix, Inc., 2.625%, due 11/18/24 |
|
12,046,000 | 11,736,679 | |||||||||
|
|
|
|||||||||||
| 17,181,692 | ||||||||||||
|
|
|
|||||||||||
| TOTAL REAL ESTATE |
|
265,761,197 | ||||||||||
|
|
|
|||||||||||
| UTILITIES |
0.6% | |||||||||||
| ELECTRIC |
0.3% | |||||||||||
| Sempra Energy, 3.30%, due 4/1/25 |
|
7,140,000 | 7,048,388 | |||||||||
|
|
|
|||||||||||
| UTILITIES |
0.3% | |||||||||||
| National Rural Utilities Cooperative Finance Corp., 1.00%, due 10/18/24, Series D |
|
9,520,000 | 8,984,226 | |||||||||
|
|
|
|||||||||||
| TOTAL UTILITIES |
|
16,032,614 | ||||||||||
|
|
|
|||||||||||
| TOTAL CORPORATE
BONDS |
|
675,467,862 | ||||||||||
|
|
|
|||||||||||
See accompanying notes to financial statements.
22
COHEN & STEERS LOW DURATION PREFERRED AND INCOME FUND, INC.
SCHEDULE OF INVESTMENTS—(Continued)
April 30, 2022
| Shares | Value | |||||||||||
| SHORT-TERM INVESTMENTS |
3.1% | |||||||||||
| MONEY MARKET FUNDS |
|
|||||||||||
| State Street Institutional Treasury Money Market Fund, |
|
89,451,173 | $ | 89,451,173 | ||||||||
|
|
|
|||||||||||
| TOTAL SHORT-TERM
INVESTMENTS |
|
89,451,173 | ||||||||||
|
|
|
|||||||||||
| TOTAL INVESTMENTS IN
SECURITIES |
99.0% | 2,881,475,277 | ||||||||||
| OTHER ASSETS IN EXCESS OF LIABILITIES |
1.0 | 27,645,277 | ||||||||||
|
|
|
|
|
|||||||||
| NET ASSETS |
100.0% | $ | 2,909,120,554 | |||||||||
|
|
|
|
|
|||||||||
Forward Foreign Currency Exchange Contracts
| Counterparty | Contracts to Deliver |
In Exchange For |
Settlement Date |
Unrealized Appreciation (Depreciation) |
||||||||||||||||
| Brown Brothers Harriman |
CAD | 29,858,398 | USD | 23,916,758 | 5/3/22 | $ | 674,444 | |||||||||||||
| Brown Brothers Harriman |
EUR | 14,161,655 | USD | 15,699,044 | 5/3/22 | 759,203 | ||||||||||||||
| Brown Brothers Harriman |
USD | 23,320,752 | CAD | 29,858,398 | 5/3/22 | (78,438 | ) | |||||||||||||
| Brown Brothers Harriman |
USD | 14,921,286 | EUR | 14,161,655 | 5/3/22 | 18,555 | ||||||||||||||
| Brown Brothers Harriman |
GBP | 2,013,135 | USD | 2,631,008 | 5/4/22 | 99,591 | ||||||||||||||
| Brown Brothers Harriman |
GBP | 25,635,651 | USD | 33,677,811 | 5/4/22 | 1,442,252 | ||||||||||||||
| Brown Brothers Harriman |
USD | 34,748,441 | GBP | 27,648,786 | 5/4/22 | 18,536 | ||||||||||||||
| Brown Brothers Harriman |
CAD | 29,021,179 | USD | 22,665,359 | 6/2/22 | 75,369 | ||||||||||||||
| Brown Brothers Harriman |
EUR | 13,724,175 | USD | 14,477,495 | 6/2/22 | (19,100 | ) | |||||||||||||
| Brown Brothers Harriman |
GBP | 26,791,260 | USD | 33,667,505 | 6/6/22 | (20,479 | ) | |||||||||||||
| $ | 2,969,933 | |||||||||||||||||||
|
|
||||||||||||||||||||
See accompanying notes to financial statements.
23
COHEN & STEERS LOW DURATION PREFERRED AND INCOME FUND, INC.
SCHEDULE OF INVESTMENTS—(Continued)
April 30, 2022
Glossary of Portfolio Abbreviations
| CAD |
Canadian Dollar | |
| EMTN |
Euro Medium Term Note | |
| EUR |
Euro Currency | |
| FRN |
Floating Rate Note | |
| GBP |
Great British Pound | |
| LIBOR |
London Interbank Offered Rate | |
| MTN |
Medium Term Note | |
| REIT |
Real Estate Investment Trust | |
| SOFR |
Secured Overnight Financing Rate | |
| TruPS |
Trust Preferred Securities | |
| USD |
United States Dollar |
Note: Percentages indicated are based on the net assets of the Fund.
| † | Represents shares. |
| a | Security converts to floating rate after the indicated fixed-rate coupon period. |
| b | Perpetual security. Perpetual securities have no stated maturity date, but they may be called/redeemed by the issuer. |
| c | Variable rate. Rate shown is in effect at April 30, 2022. |
| d | Securities exempt from registration under Rule 144A of the Securities Act of 1933. These securities may only be resold to qualified institutional buyers. Aggregate holdings amounted to $715,855,355 which represents 24.6% of the net assets of the Fund, of which 0.0% are illiquid. |
| e | Contingent Capital security (CoCo). CoCos are debt or preferred securities with loss absorption characteristics built into the terms of the security for the benefit of the issuer. Aggregate holdings amounted to $446,007,025 or 15.3% of the net assets of the Fund. |
| f | Securities exempt from registration under Regulation S of the Securities Act of 1933. These securities are subject to resale restrictions. Aggregate holdings amounted to $197,560,862 which represents 6.8% of the net assets of the Fund, of which 0.0% are illiquid. |
| g | Rate quoted represents the annualized seven-day yield. |
See accompanying notes to financial statements.
24
COHEN & STEERS LOW DURATION PREFERRED AND INCOME FUND, INC.
SCHEDULE OF INVESTMENTS—(Continued)
April 30, 2022
| Country Summary |
% of Net Assets |
|||
| United States |
61.8 | |||
| United Kingdom |
6.3 | |||
| Japan |
6.0 | |||
| France |
5.3 | |||
| Canada |
4.6 | |||
| Switzerland |
3.9 | |||
| Australia |
2.7 | |||
| Italy |
2.1 | |||
| Netherlands |
1.5 | |||
| Ireland |
0.6 | |||
| Other (includes short-term investments) |
5.2 | |||
|
|
|
|||
| 100.0 | ||||
|
|
|
|||
See accompanying notes to financial statements.
25
COHEN & STEERS LOW DURATION PREFERRED AND INCOME FUND, INC.
STATEMENT OF ASSETS AND LIABILITIES
April 30, 2022
| ASSETS: |
| |||
| Investments in securities, at value (Identified cost—$3,011,816,402) |
$ | 2,881,475,277 | ||
| Cash |
1,111,246 | |||
| Foreign currency, at value (Identified cost—$61,745) |
61,673 | |||
| Receivable for: |
||||
| Dividends and interest |
28,378,578 | |||
| Fund shares sold |
11,132,701 | |||
| Investment securities sold |
3,353,178 | |||
| Unrealized appreciation on forward foreign currency exchange contracts |
3,087,950 | |||
| Other assets |
27,816 | |||
|
|
|
|||
| Total Assets |
2,928,628,419 | |||
|
|
|
|||
| LIABILITIES: |
| |||
| Unrealized depreciation on forward foreign currency exchange contracts |
118,017 | |||
| Payable for: |
||||
| Fund shares redeemed |
9,053,775 | |||
| Investment securities purchased |
5,836,799 | |||
| Dividends declared |
2,459,558 | |||
| Investment advisory fees |
1,058,736 | |||
| Shareholder servicing fees |
506,210 | |||
| Administration fees |
119,490 | |||
| Distribution fees |
10,442 | |||
| Directors’ fees |
7,793 | |||
| Other liabilities |
337,045 | |||
|
|
|
|||
| Total Liabilities |
19,507,865 | |||
|
|
|
|||
| NET ASSETS |
$ | 2,909,120,554 | ||
|
|
|
|||
| NET ASSETS consist of: |
| |||
| Paid-in capital |
$ | 3,154,567,166 | ||
| Total distributable earnings/(accumulated loss) |
(245,446,612 | ) | ||
|
|
|
|||
| $ | 2,909,120,554 | |||
|
|
|
|||
See accompanying notes to financial statements.
26
COHEN & STEERS LOW DURATION PREFERRED AND INCOME FUND, INC.
STATEMENT OF ASSETS AND LIABILITIES—(Continued)
April 30, 2022
| CLASS A SHARES: |
||||
| NET ASSETS |
$ | 280,707,763 | ||
| Shares issued and outstanding ($0.001 par value common stock outstanding) |
29,988,076 | |||
|
|
|
|||
| Net asset value and redemption price per share |
$ | 9.36 | ||
|
|
|
|||
| Maximum offering price per share ($9.36 ÷ 0.98)a |
$ | 9.55 | ||
|
|
|
|||
| CLASS C SHARES: |
||||
| NET ASSETS |
$ | 75,190,439 | ||
| Shares issued and outstanding ($0.001 par value common stock outstanding) |
8,047,991 | |||
|
|
|
|||
| Net asset value and offering price per shareb |
$ | 9.34 | ||
|
|
|
|||
| CLASS F SHARES: |
||||
| NET ASSETS |
$ | 998,502 | ||
| Shares issued and outstanding ($0.001 par value common stock outstanding) |
106,977 | |||
|
|
|
|||
| Net asset value, offering and redemption price per share |
$ | 9.33 | ||
|
|
|
|||
| CLASS I SHARES: |
||||
| NET ASSETS |
$ | 2,551,160,855 | ||
| Shares issued and outstanding ($0.001 par value common stock outstanding) |
273,248,245 | |||
|
|
|
|||
| Net asset value, offering and redemption price per share |
$ | 9.34 | ||
|
|
|
|||
| CLASS R SHARES: |
||||
| NET ASSETS |
$ | 310,896 | ||
| Shares issued and outstanding ($0.001 par value common stock outstanding) |
33,156 | |||
|
|
|
|||
| Net asset value, offering and redemption price per share |
$ | 9.38 | ||
|
|
|
|||
| CLASS Z SHARES: |
||||
| NET ASSETS |
$ | 752,099 | ||
| Shares issued and outstanding ($0.001 par value common stock outstanding) |
80,626 | |||
|
|
|
|||
| Net asset value, offering and redemption price per share |
$ | 9.33 | ||
|
|
|
| a | On investments of $100,000 or more, the offering price is reduced. |
| b | Redemption price per share is equal to the net asset value per share less any applicable contingent deferred sales charge of 1.00% on shares held for less than one year. |
See accompanying notes to financial statements.
27
COHEN & STEERS LOW DURATION PREFERRED AND INCOME FUND, INC.
STATEMENT OF OPERATIONS
For the Year Ended April 30, 2022
| Investment Income: |
| |||
| Interest income |
$ | 89,464,475 | ||
| Dividend income |
6,133,850 | |||
|
|
|
|||
| Total Investment Income |
95,598,325 | |||
|
|
|
|||
| Expenses: |
| |||
| Investment advisory fees |
18,571,560 | |||
| Distribution fees and service fees—Class A (See Note 2) |
900,981 | |||
| Distribution fees and service fees—Class C (See Note 2) |
814,952 | |||
| Distribution fees and service fees—Class R (See Note 2) |
1,622 | |||
| Administration fees |
1,656,337 | |||
| Shareholder servicing fees—Class I (See Note 2) |
1,462,579 | |||
| Registration and filing fees |
323,319 | |||
| Transfer agent fees and expenses |
271,304 | |||
| Shareholder reporting expenses |
122,730 | |||
| Professional fees |
122,472 | |||
| Directors’ fees and expenses |
93,210 | |||
| Custodian fees and expenses |
59,848 | |||
| Miscellaneous |
74,622 | |||
|
|
|
|||
| Total Expenses |
24,475,536 | |||
| Reduction of Expenses (See Note 2) |
(5,615,981 | ) | ||
|
|
|
|||
| Net Expenses |
18,859,555 | |||
|
|
|
|||
| Net Investment Income (Loss) |
76,738,770 | |||
|
|
|
|||
| Net Realized and Unrealized Gain (Loss): |
| |||
| Net realized gain (loss) on: |
| |||
| Investments in securities |
(12,484,738 | ) | ||
| Forward foreign currency exchange contracts |
3,756,450 | |||
| Foreign currency transactions |
88,865 | |||
|
|
|
|||
| Net realized gain (loss) |
(8,639,423 | ) | ||
|
|
|
|||
| Net change in unrealized appreciation (depreciation) on: |
| |||
| Investments in securities |
(198,323,124 | ) | ||
| Forward foreign currency exchange contracts |
4,699,203 | |||
| Foreign currency translations |
(137,389 | ) | ||
|
|
|
|||
| Net change in unrealized appreciation (depreciation) |
(193,761,310 | ) | ||
|
|
|
|||
| Net Realized and Unrealized Gain (Loss) |
(202,400,733 | ) | ||
|
|
|
|||
| Net Increase (Decrease) in Net Assets Resulting from Operations |
$ | (125,661,963 | ) | |
|
|
|
|||
See accompanying notes to financial statements.
28
COHEN & STEERS LOW DURATION PREFERRED AND INCOME FUND, INC.
STATEMENT OF CHANGES IN NET ASSETS
| For the Year Ended April 30, 2022 |
For the Year Ended April 30, 2021 |
|||||||
| Change in Net Assets: |
||||||||
| From Operations: |
||||||||
| Net investment income (loss) |
$ | 76,738,770 | $ | 62,136,464 | ||||
| Net realized gain (loss) |
(8,639,423 | ) | (4,112,498 | ) | ||||
| Net change in unrealized appreciation (depreciation) |
(193,761,310 | ) | 115,857,919 | |||||
|
|
|
|
|
|||||
| Net increase (decrease) in net assets resulting from operations |
(125,661,963 | ) | 173,881,885 | |||||
|
|
|
|
|
|||||
| Distributions to Shareholders: |
||||||||
| Class A |
(10,437,304 | ) | (8,406,517 | ) | ||||
| Class C |
(2,302,206 | ) | (2,325,234 | ) | ||||
| Class F |
(17,571 | ) | (2,178,508 | ) | ||||
| Class I |
(97,456,164 | ) | (70,967,649 | ) | ||||
| Class R |
(10,687 | ) | (11,813 | ) | ||||
| Class Z |
(88,621 | ) | (83,039 | ) | ||||
| Tax Return of Capital to Shareholders: |
||||||||
| Class A |
(722,618 | ) | — | |||||
| Class C |
(200,732 | ) | — | |||||
| Class F |
(1,169 | ) | — | |||||
| Class I |
(6,116,752 | ) | — | |||||
| Class R |
(796 | ) | — | |||||
| Class Z |
(5,797 | ) | — | |||||
|
|
|
|
|
|||||
| Total distributions |
(117,360,417 | ) | (83,972,760 | ) | ||||
|
|
|
|
|
|||||
| Capital Stock Transactions: |
||||||||
| Increase (decrease) in net assets from Fund share transactions |
776,506,273 | 652,581,599 | ||||||
|
|
|
|
|
|||||
| Total increase (decrease) in net assets |
533,483,893 | 742,490,724 | ||||||
| Net Assets: |
||||||||
| Beginning of year |
2,375,636,661 | 1,633,145,937 | ||||||
|
|
|
|
|
|||||
| End of year |
$ | 2,909,120,554 | $ | 2,375,636,661 | ||||
|
|
|
|
|
|||||
See accompanying notes to financial statements.
29
COHEN & STEERS LOW DURATION PREFERRED AND INCOME FUND, INC.
FINANCIAL HIGHLIGHTS
The following tables include selected data for a share outstanding throughout each year and other performance information derived from the financial statements. They should be read in conjunction with the financial statements and notes thereto.
| Class A | ||||||||||||||||||||
| For the Year Ended April 30, | ||||||||||||||||||||
| Per Share Operating Data: |
2022 | 2021 | 2020 | 2019 | 2018 | |||||||||||||||
| Net asset value, beginning of year |
$10.14 | $9.61 | $9.94 | $10.00 | $10.14 | |||||||||||||||
|
|
|
|
|
|
|
|
|
|
|
|||||||||||
| Income (loss) from investment operations: |
| |||||||||||||||||||
| Net investment income (loss)a |
0.24 | 0.30 | 0.37 | 0.36 | 0.33 | |||||||||||||||
| Net realized and unrealized gain (loss) |
(0.64 | ) | 0.63 | (0.28 | ) | (0.00 | )b | (0.04 | ) | |||||||||||
|
|
|
|
|
|
|
|
|
|
|
|||||||||||
| Total from investment operations |
(0.40 | ) | 0.93 | 0.09 | 0.36 | 0.29 | ||||||||||||||
|
|
|
|
|
|
|
|
|
|
|
|||||||||||
| Less dividends and distributions to shareholders from: |
| |||||||||||||||||||
| Net investment income |
(0.36 | ) | (0.40 | ) | (0.42 | ) | (0.42 | ) | (0.43 | ) | ||||||||||
| Net realized gain |
— | — | — | — | (0.00 | )b | ||||||||||||||
| Tax return of capital |
(0.02 | ) | — | — | — | (0.00 | )b | |||||||||||||
|
|
|
|
|
|
|
|
|
|
|
|||||||||||
| Total dividends and distributions to shareholders |
(0.38 | ) | (0.40 | ) | (0.42 | ) | (0.42 | ) | (0.43 | ) | ||||||||||
|
|
|
|
|
|
|
|
|
|
|
|||||||||||
| Net increase (decrease) in net asset value |
(0.78 | ) | 0.53 | (0.33 | ) | (0.06 | ) | (0.14 | ) | |||||||||||
|
|
|
|
|
|
|
|
|
|
|
|||||||||||
| Net asset value, end of year |
$ 9.36 | $10.14 | $9.61 | $9.94 | $10.00 | |||||||||||||||
|
|
|
|
|
|
|
|
|
|
|
|||||||||||
| Total returnc,d |
–4.14 | % | 9.80 | % | 0.82 | % | 3.77 | % | 2.90 | % | ||||||||||
|
|
|
|
|
|
|
|
|
|
|
|||||||||||
| Ratios/Supplemental Data: |
|
|||||||||||||||||||
| Net assets, end of year (in millions) |
$280.7 | $237.5 | $189.6 | $135.0 | $107.7 | |||||||||||||||
|
|
|
|
|
|
|
|
|
|
|
|||||||||||
| Ratios to average daily net assets: |
| |||||||||||||||||||
| Expenses (before expense reduction) |
1.05 | % | 1.05 | % | 1.06 | % | 1.06 | % | 1.09 | % | ||||||||||
|
|
|
|
|
|
|
|
|
|
|
|||||||||||
| Expenses (net of expense reduction) |
0.91 | % | 0.90 | % | 0.89 | % | 0.84 | % | 0.84 | % | ||||||||||
|
|
|
|
|
|
|
|
|
|
|
|||||||||||
| Net investment income (loss) (before expense reduction) |
2.30 | % | 2.81 | % | 3.51 | % | 3.41 | % | 2.97 | % | ||||||||||
|
|
|
|
|
|
|
|
|
|
|
|||||||||||
| Net investment income (loss) (net of expense reduction) |
2.44 | % | 2.96 | % | 3.68 | % | 3.63 | % | 3.22 | % | ||||||||||
|
|
|
|
|
|
|
|
|
|
|
|||||||||||
| Portfolio turnover rate |
44 | % | 44 | % | 53 | % | 52 | % | 34 | % | ||||||||||
|
|
|
|
|
|
|
|
|
|
|
|||||||||||
| a | Calculation based on average shares outstanding. |
| b | Amount is less than $0.005. |
| c | Does not reflect sales charges, which would reduce return. |
| d | Return assumes the reinvestment of all dividends and distributions at net asset value. |
See accompanying notes to financial statements.
30
COHEN & STEERS LOW DURATION PREFERRED AND INCOME FUND, INC.
FINANCIAL HIGHLIGHTS—(Continued)
| Class C | ||||||||||||||||||||
| For the Year Ended April 30, | ||||||||||||||||||||
| Per Share Operating Data: |
2022 | 2021 | 2020 | 2019 | 2018 | |||||||||||||||
| Net asset value, beginning of year |
$10.12 | $9.59 | $9.92 | $9.98 | $10.13 | |||||||||||||||
|
|
|
|
|
|
|
|
|
|
|
|||||||||||
| Income (loss) from investment operations: |
| |||||||||||||||||||
| Net investment income (loss)a |
0.17 | 0.23 | 0.30 | 0.29 | 0.25 | |||||||||||||||
| Net realized and unrealized gain (loss) |
(0.64 | ) | 0.63 | (0.28 | ) | 0.01 | (0.03 | ) | ||||||||||||
|
|
|
|
|
|
|
|
|
|
|
|||||||||||
| Total from investment operations |
(0.47 | ) | 0.86 | 0.02 | 0.30 | 0.22 | ||||||||||||||
|
|
|
|
|
|
|
|
|
|
|
|||||||||||
| Less dividends and distributions to shareholders from: |
| |||||||||||||||||||
| Net investment income |
(0.29 | ) | (0.33 | ) | (0.35 | ) | (0.36 | ) | (0.37 | ) | ||||||||||
| Net realized gain |
— | — | — | — | (0.00 | )b | ||||||||||||||
| Tax return of capital |
(0.02 | ) | — | — | — | (0.00 | )b | |||||||||||||
|
|
|
|
|
|
|
|
|
|
|
|||||||||||
| Total dividends and distributions to shareholders |
(0.31 | ) | (0.33 | ) | (0.35 | ) | (0.36 | ) | (0.37 | ) | ||||||||||
|
|
|
|
|
|
|
|
|
|
|
|||||||||||
| Net increase (decrease) in net asset value |
(0.78 | ) | 0.53 | (0.33 | ) | (0.06 | ) | (0.15 | ) | |||||||||||
|
|
|
|
|
|
|
|
|
|
|
|||||||||||
| Net asset value, end of year |
$ 9.34 | $10.12 | $9.59 | $9.92 | $9.98 | |||||||||||||||
|
|
|
|
|
|
|
|
|
|
|
|||||||||||
| Total returnc,d |
–4.82 | % | 9.04 | % | 0.12 | % | 3.06 | % | 2.13 | % | ||||||||||
|
|
|
|
|
|
|
|
|
|
|
|||||||||||
| Ratios/Supplemental Data: |
||||||||||||||||||||
| Net assets, end of year (in millions) |
$75.2 | $77.2 | $68.9 | $55.5 | $33.0 | |||||||||||||||
|
|
|
|
|
|
|
|
|
|
|
|||||||||||
| Ratios to average daily net assets: |
| |||||||||||||||||||
| Expenses (before expense reduction) |
1.75 | % | 1.75 | % | 1.76 | % | 1.77 | % | 1.79 | % | ||||||||||
|
|
|
|
|
|
|
|
|
|
|
|||||||||||
| Expenses (net of expense reduction) |
1.60 | % | 1.60 | % | 1.59 | % | 1.55 | % | 1.54 | % | ||||||||||
|
|
|
|
|
|
|
|
|
|
|
|||||||||||
| Net investment income (loss) (before expense reduction) |
1.60 | % | 2.13 | % | 2.81 | % | 2.73 | % | 2.25 | % | ||||||||||
|
|
|
|
|
|
|
|
|
|
|
|||||||||||
| Net investment income (loss) (net of expense reduction) |
1.75 | % | 2.28 | % | 2.98 | % | 2.95 | % | 2.50 | % | ||||||||||
|
|
|
|
|
|
|
|
|
|
|
|||||||||||
| Portfolio turnover rate |
44 | % | 44 | % | 53 | % | 52 | % | 34 | % | ||||||||||
|
|
|
|
|
|
|
|
|
|
|
|||||||||||
| a | Calculation based on average shares outstanding. |
| b | Amount is less than $0.005. |
| c | Does not reflect sales charges, which would reduce return. |
| d | Return assumes the reinvestment of all dividends and distributions at net asset value. |
See accompanying notes to financial statements.
31
COHEN & STEERS LOW DURATION PREFERRED AND INCOME FUND, INC.
FINANCIAL HIGHLIGHTS—(Continued)
| Class F | ||||||||
| Per Share Operating Data: |
For the Year Ended April 30, 2022 |
For the Period June 3, 2020a through April 30, 2021 |
||||||
| Net asset value, beginning of period |
$10.12 | $9.74 | ||||||
|
|
|
|
|
|||||
| Income (loss) from investment operations: |
| |||||||
| Net investment income (loss)b |
0.27 | 0.27 | ||||||
| Net realized and unrealized gain (loss) |
(0.65 | ) | 0.51 | |||||
|
|
|
|
|
|||||
| Total from investment operations |
(0.38 | ) | 0.78 | |||||
|
|
|
|
|
|||||
| Less dividends and distributions to shareholders from: |
| |||||||
| Net investment income |
(0.39 | ) | (0.40 | ) | ||||
| Tax return of capital |
(0.02 | ) | — | |||||
|
|
|
|
|
|||||
| Total dividends and distributions to shareholders |
(0.41 | ) | (0.40 | ) | ||||
|
|
|
|
|
|||||
| Net increase (decrease) in net asset value |
(0.79 | ) | 0.38 | |||||
|
|
|
|
|
|||||
| Net asset value, end of period |
$ 9.33 | $10.12 | ||||||
|
|
|
|
|
|||||
| Total returnc |
–3.91 | % | 8.09 | %d | ||||
|
|
|
|
|
|||||
| Ratios/Supplemental Data: |
||||||||
| Net assets, end of period (in 000s) |
$998.5 | $322.1 | ||||||
|
|
|
|
|
|||||
| Ratios to average daily net assets: |
| |||||||
| Expenses (before expense reduction) |
0.75 | % | 0.75 | %e | ||||
|
|
|
|
|
|||||
| Expenses (net of expense reduction) |
0.60 | % | 0.60 | %e | ||||
|
|
|
|
|
|||||
| Net investment income (loss) (before expense reduction) |
2.63 | % | 2.78 | %e | ||||
|
|
|
|
|
|||||
| Net investment income (loss) (net of expense reduction) |
2.78 | % | 2.93 | %e | ||||
|
|
|
|
|
|||||
| Portfolio turnover rate |
44 | % | 44 | % | ||||
|
|
|
|
|
|||||
| a | Inception date. |
| b | Calculation based on average shares outstanding. |
| c | Return assumes the reinvestment of all dividends and distributions at net asset value. |
| d | Not annualized. |
| e | Annualized. |
See accompanying notes to financial statements.
32
COHEN & STEERS LOW DURATION PREFERRED AND INCOME FUND, INC.
FINANCIAL HIGHLIGHTS—(Continued)
| Class I | ||||||||||||||||||||
| For the Year Ended April 30, | ||||||||||||||||||||
| Per Share Operating Data: |
2022 | 2021 | 2020 | 2019 | 2018 | |||||||||||||||
| Net asset value, beginning of year |
$10.12 | $9.60 | $9.93 | $10.00 | $10.14 | |||||||||||||||
|
|
|
|
|
|
|
|
|
|
|
|||||||||||
| Income (loss) from investment operations: |
| |||||||||||||||||||
| Net investment income (loss)a |
0.27 | 0.33 | 0.40 | 0.39 | 0.35 | |||||||||||||||
| Net realized and unrealized gain (loss) |
(0.64 | ) | 0.62 | (0.28 | ) | (0.00 | )b | (0.02 | ) | |||||||||||
|
|
|
|
|
|
|
|
|
|
|
|||||||||||
| Total from investment operations |
(0.37 | ) | 0.95 | 0.12 | 0.39 | 0.33 | ||||||||||||||
|
|
|
|
|
|
|
|
|
|
|
|||||||||||
| Less dividends and distributions to shareholders from: |
| |||||||||||||||||||
| Net investment income |
(0.39 | ) | (0.43 | ) | (0.45 | ) | (0.46 | ) | (0.47 | ) | ||||||||||
| Net realized gain |
— | — | — | — | (0.00 | )b | ||||||||||||||
| Tax return of capital |
(0.02 | ) | — | — | — | (0.00 | )b | |||||||||||||
|
|
|
|
|
|
|
|
|
|
|
|||||||||||
| Total dividends and distributions to shareholders |
(0.41 | ) | (0.43 | ) | (0.45 | ) | (0.46 | ) | (0.47 | ) | ||||||||||
|
|
|
|
|
|
|
|
|
|
|
|||||||||||
| Net increase (decrease) in net asset value |
(0.78 | ) | 0.52 | (0.33 | ) | (0.07 | ) | (0.14 | ) | |||||||||||
|
|
|
|
|
|
|
|
|
|
|
|||||||||||
| Net asset value, end of year |
$9.34 | $10.12 | $9.60 | $9.93 | $10.00 | |||||||||||||||
|
|
|
|
|
|
|
|
|
|
|
|||||||||||
| Total returnc |
–3.81 | % | 10.09 | % | 1.18 | % | 4.02 | % | 3.25 | % | ||||||||||
|
|
|
|
|
|
|
|
|
|
|
|||||||||||
| Ratios/Supplemental Data: |
||||||||||||||||||||
| Net assets, end of year (in millions) |
$2,551.2 | $2,056.4 | $1,374.2 | $1,210.1 | $907.2 | |||||||||||||||
|
|
|
|
|
|
|
|
|
|
|
|||||||||||
| Ratios to average daily net assets: |
| |||||||||||||||||||
| Expenses (before expense reduction) |
0.80 | % | 0.82 | % | 0.82 | % | 0.83 | % | 0.86 | % | ||||||||||
|
|
|
|
|
|
|
|
|
|
|
|||||||||||
| Expenses (net of expense reduction) |
0.60 | % | 0.60 | % | 0.59 | % | 0.55 | % | 0.55 | % | ||||||||||
|
|
|
|
|
|
|
|
|
|
|
|||||||||||
| Net investment income (loss) (before expense reduction) |
2.54 | % | 3.04 | % | 3.75 | % | 3.65 | % | 3.17 | % | ||||||||||
|
|
|
|
|
|
|
|
|
|
|
|||||||||||
| Net investment income (loss) (net of expense reduction) |
2.74 | % | 3.26 | % | 3.98 | % | 3.93 | % | 3.48 | % | ||||||||||
|
|
|
|
|
|
|
|
|
|
|
|||||||||||
| Portfolio turnover rate |
44 | % | 44 | % | 53 | % | 52 | % | 34 | % | ||||||||||
|
|
|
|
|
|
|
|
|
|
|
|||||||||||
| a | Calculation based on average shares outstanding. |
| b | Amount is less than $0.005. |
| c | Return assumes the reinvestment of all dividends and distributions at net asset value. |
See accompanying notes to financial statements.
33
COHEN & STEERS LOW DURATION PREFERRED AND INCOME FUND, INC.
FINANCIAL HIGHLIGHTS—(Continued)
| Class R | ||||||||||||||||||||
| For the Year Ended April 30, | ||||||||||||||||||||
| Per Share Operating Data: |
2022 | 2021 | 2020 | 2019 | 2018 | |||||||||||||||
| Net asset value, beginning of year |
$10.16 | $9.62 | $9.95 | $10.01 | $10.15 | |||||||||||||||
|
|
|
|
|
|
|
|
|
|
|
|||||||||||
| Income (loss) from investment operations: |
| |||||||||||||||||||
| Net investment income (loss)a |
0.22 | 0.28 | 0.35 | 0.34 | 0.31 | |||||||||||||||
| Net realized and unrealized gain (loss) |
(0.65 | ) | 0.64 | (0.28 | ) | (0.00 | )b | (0.04 | ) | |||||||||||
|
|
|
|
|
|
|
|
|
|
|
|||||||||||
| Total from investment operations |
(0.43 | ) | 0.92 | 0.07 | 0.34 | 0.27 | ||||||||||||||
|
|
|
|
|
|
|
|
|
|
|
|||||||||||
| Less dividends and distributions to shareholders from: |
| |||||||||||||||||||
| Net investment income |
(0.33 | ) | (0.38 | ) | (0.40 | ) | (0.40 | ) | (0.41 | ) | ||||||||||
| Net realized gain |
— | — | — | — | (0.00 | )b | ||||||||||||||
| Tax return of capital |
(0.02 | ) | — | — | — | (0.00 | )b | |||||||||||||
|
|
|
|
|
|
|
|
|
|
|
|||||||||||
| Total dividends and distributions to shareholders |
(0.35 | ) | (0.38 | ) | (0.40 | ) | (0.40 | ) | (0.41 | ) | ||||||||||
|
|
|
|
|
|
|
|
|
|
|
|||||||||||
| Net increase (decrease) in net asset value |
(0.78 | ) | 0.54 | (0.33 | ) | (0.06 | ) | (0.14 | ) | |||||||||||
|
|
|
|
|
|
|
|
|
|
|
|||||||||||
| Net asset value, end of year |
$9.38 | $10.16 | $9.62 | $9.95 | $10.01 | |||||||||||||||
|
|
|
|
|
|
|
|
|
|
|
|||||||||||
| Total returnc |
–4.34 | % | 9.64 | % | 0.59 | % | 3.51 | % | 2.65 | % | ||||||||||
|
|
|
|
|
|
|
|
|
|
|
|||||||||||
| Ratios/Supplemental Data: |
||||||||||||||||||||
| Net assets, end of year (in 000s) |
$310.9 | $325.2 | $297.3 | $365.0 | $544.2 | |||||||||||||||
|
|
|
|
|
|
|
|
|
|
|
|||||||||||
| Ratios to average daily net assets: |
| |||||||||||||||||||
| Expenses (before expense reduction) |
1.25 | % | 1.25 | % | 1.26 | % | 1.27 | % | 1.30 | % | ||||||||||
|
|
|
|
|
|
|
|
|
|
|
|||||||||||
| Expenses (net of expense reduction) |
1.10 | % | 1.10 | % | 1.09 | % | 1.05 | % | 1.05 | % | ||||||||||
|
|
|
|
|
|
|
|
|
|
|
|||||||||||
| Net investment income (loss) (before expense reduction) |
2.10 | % | 2.63 | % | 3.32 | % | 3.18 | % | 2.82 | % | ||||||||||
|
|
|
|
|
|
|
|
|
|
|
|||||||||||
| Net investment income (loss) (net of expense reduction) |
2.25 | % | 2.78 | % | 3.49 | % | 3.40 | % | 3.07 | % | ||||||||||
|
|
|
|
|
|
|
|
|
|
|
|||||||||||
| Portfolio turnover rate |
44 | % | 44 | % | 53 | % | 52 | % | 34 | % | ||||||||||
|
|
|
|
|
|
|
|
|
|
|
|||||||||||
| a | Calculation based on average shares outstanding. |
| b | Amount is less than $0.005. |
| c | Return assumes the reinvestment of all dividends and distributions at net asset value. |
See accompanying notes to financial statements.
34
COHEN & STEERS LOW DURATION PREFERRED AND INCOME FUND, INC.
FINANCIAL HIGHLIGHTS—(Continued)
| Class Z | ||||||||||||||||||||
| For the Year Ended April 30, | ||||||||||||||||||||
| Per Share Operating Data: |
2022 | 2021 | 2020 | 2019 | 2018 | |||||||||||||||
| Net asset value, beginning of year |
$10.12 | $9.60 | $9.93 | $10.00 | $10.14 | |||||||||||||||
|
|
|
|
|
|
|
|
|
|
|
|||||||||||
| Income (loss) from investment operations: |
| |||||||||||||||||||
| Net investment income (loss)a |
0.28 | 0.31 | 0.39 | 0.39 | 0.36 | |||||||||||||||
| Net realized and unrealized gain (loss) |
(0.66 | ) | 0.64 | (0.27 | ) | (0.00 | )b | (0.03 | ) | |||||||||||
|
|
|
|
|
|
|
|
|
|
|
|||||||||||
| Total from investment operations |
(0.38 | ) | 0.95 | 0.12 | 0.39 | 0.33 | ||||||||||||||
|
|
|
|
|
|
|
|
|
|
|
|||||||||||
| Less dividends and distributions to shareholders from: |
| |||||||||||||||||||
| Net investment income |
(0.39 | ) | (0.43 | ) | (0.45 | ) | (0.46 | ) | (0.47 | ) | ||||||||||
| Net realized gain |
— | — | — | — | (0.00 | )b | ||||||||||||||
| Tax return of capital |
(0.02 | ) | — | — | — | (0.00 | )b | |||||||||||||
|
|
|
|
|
|
|
|
|
|
|
|||||||||||
| Total dividends and distributions to shareholders |
(0.41 | ) | (0.43 | ) | (0.45 | ) | (0.46 | ) | (0.47 | ) | ||||||||||
|
|
|
|
|
|
|
|
|
|
|
|||||||||||
| Net increase (decrease) in net asset value |
(0.79 | ) | 0.52 | (0.33 | ) | (0.07 | ) | (0.14 | ) | |||||||||||
|
|
|
|
|
|
|
|
|
|
|
|||||||||||
| Net asset value, end of year |
$9.33 | $10.12 | $9.60 | $9.93 | $10.00 | |||||||||||||||
|
|
|
|
|
|
|
|
|
|
|
|||||||||||
| Total returnc |
–3.91 | % | 10.09 | % | 1.18 | % | 4.02 | % | 3.25 | % | ||||||||||
|
|
|
|
|
|
|
|
|
|
|
|||||||||||
| Ratios/Supplemental Data: |
||||||||||||||||||||
| Net assets, end of year (in 000s) |
$752.1 | $3,786.9 | $218.6 | $28.5 | $17.5 | |||||||||||||||
|
|
|
|
|
|
|
|
|
|
|
|||||||||||
| Ratios to average daily net assets: |
| |||||||||||||||||||
| Expenses (before expense reduction) |
0.75 | % | 0.75 | % | 0.76 | % | 0.77 | % | 0.80 | % | ||||||||||
|
|
|
|
|
|
|
|
|
|
|
|||||||||||
| Expenses (net of expense reduction) |
0.60 | % | 0.60 | % | 0.59 | % | 0.55 | % | 0.55 | % | ||||||||||
|
|
|
|
|
|
|
|
|
|
|
|||||||||||
| Net investment income (loss) (before expense reduction) |
2.58 | % | 2.92 | % | 3.74 | % | 3.71 | % | 3.26 | % | ||||||||||
|
|
|
|
|
|
|
|
|
|
|
|||||||||||
| Net investment income (loss) (net of expense reduction) |
2.73 | % | 3.07 | % | 3.91 | % | 3.93 | % | 3.51 | % | ||||||||||
|
|
|
|
|
|
|
|
|
|
|
|||||||||||
| Portfolio turnover rate |
44 | % | 44 | % | 53 | % | 52 | % | 34 | % | ||||||||||
|
|
|
|
|
|
|
|
|
|
|
|||||||||||
| a | Calculation based on average shares outstanding. |
| b | Amount is less than $0.005. |
| c | Return assumes the reinvestment of all dividends and distributions at net asset value. |
See accompanying notes to financial statements.
35
COHEN & STEERS LOW DURATION PREFERRED AND INCOME FUND, INC.
NOTES TO FINANCIAL STATEMENTS
Note 1. Organization and Significant Accounting Policies
Cohen & Steers Low Duration Preferred and Income Fund, Inc. (the Fund) was incorporated under the laws of the State of Maryland on September 2, 2015 and is registered under the Investment Company Act of 1940 (the 1940 Act) as a diversified, open-end management investment company. The Fund’s primary investment objective is to provide high current income and its secondary objective is to provide capital preservation. Class F shares became available for investment on June 3, 2020, on which date the Fund sold 1,027 shares of Class F shares for $10,000 to Cohen & Steers Capital Management, Inc. (the investment advisor). The authorized shares of the Fund are divided into six classes designated Class A, C, F, I, R and Z shares. Each of the Fund’s shares has equal dividend, liquidation and voting rights (except for matters relating to distribution and shareholder servicing of such shares).
The following is a summary of significant accounting policies consistently followed by the Fund in the preparation of its financial statements. The Fund is an investment company and, accordingly, follows the investment company accounting and reporting guidance of the Financial Accounting Standards Board Accounting Standards Codification (ASC) Topic 946—Investment Companies. The accounting policies of the Fund are in conformity with accounting principles generally accepted in the United States of America (GAAP). The preparation of the financial statements in accordance with GAAP requires management to make estimates and assumptions that affect the reported amounts of assets and liabilities at the date of the financial statements and the reported amounts of income and expenses during the reporting period. Actual results could differ from those estimates.
Portfolio Valuation: Investments in securities that are listed on the New York Stock Exchange (NYSE) are valued, except as indicated below, at the last sale price reflected at the close of the NYSE on the business day as of which such value is being determined. If there has been no sale on such day, the securities are valued at the mean of the closing bid and ask prices on such day or, if no ask price is available, at the bid price. Forward foreign currency exchange contracts are valued daily at the prevailing forward exchange rate.
Securities not listed on the NYSE but listed on other domestic or foreign securities exchanges (including NASDAQ) are valued in a similar manner. Securities traded on more than one securities exchange are valued at the last sale price reflected at the close of the exchange representing the principal market for such securities on the business day as of which such value is being determined. If after the close of a foreign market, but prior to the close of business on the day the securities are being valued, market conditions change significantly, certain non-U.S. equity holdings may be fair valued pursuant to procedures established by the Board of Directors.
Readily marketable securities traded in the over-the-counter (OTC) market, including listed securities whose primary market is believed by the investment advisor to be OTC, are valued on the basis of prices provided by a third-party pricing service or third-party broker-dealers when such prices are believed by the investment advisor, pursuant to delegation by the Board of Directors, to reflect the fair value of such securities.
Fixed-income securities are valued on the basis of prices provided by a third-party pricing service or third-party broker-dealers when such prices are believed by the investment advisor, pursuant to delegation by the Board of Directors, to reflect the fair value of such securities. The pricing services or
36
COHEN & STEERS LOW DURATION PREFERRED AND INCOME FUND, INC.
NOTES TO FINANCIAL STATEMENTS—(Continued)
broker-dealers use multiple valuation techniques to determine fair value. In instances where sufficient market activity exists, the pricing services or broker-dealers may utilize a market-based approach through which quotes from market makers are used to determine fair value. In instances where sufficient market activity may not exist or is limited, the pricing services or broker-dealers also utilize proprietary valuation models which may consider market transactions in comparable securities and the various relationships between securities in determining fair value and/or characteristics such as benchmark yield curves, option-adjusted spreads, credit spreads, estimated default rates, coupon rates, anticipated timing of principal repayments, underlying collateral, and other unique security features which are then used to calculate the fair values.
Short-term debt securities with a maturity date of 60 days or less are valued at amortized cost, which approximates fair value. Investments in open-end mutual funds are valued at net asset value (NAV).
The policies and procedures approved by the Fund’s Board of Directors delegate authority to make fair value determinations to the investment advisor, subject to the oversight of the Board of Directors. The investment advisor has established a valuation committee (Valuation Committee) to administer, implement and oversee the fair valuation process according to the policies and procedures approved annually by the Board of Directors. Among other things, these procedures allow the Fund to utilize independent pricing services, quotations from securities and financial instrument dealers and other market sources to determine fair value.
Securities for which market prices are unavailable, or securities for which the investment advisor determines that the bid and/or ask price or a counterparty valuation does not reflect market value, will be valued at fair value, as determined in good faith by the Valuation Committee, pursuant to procedures approved by the Fund’s Board of Directors. Circumstances in which market prices may be unavailable include, but are not limited to, when trading in a security is suspended, the exchange on which the security is traded is subject to an unscheduled close or disruption or material events occur after the close of the exchange on which the security is principally traded. In these circumstances, the Fund determines fair value in a manner that fairly reflects the market value of the security on the valuation date based on consideration of any information or factors it deems appropriate. These may include, but are not limited to, recent transactions in comparable securities, information relating to the specific security and developments in the markets.
The Fund’s use of fair value pricing may cause the NAV of Fund shares to differ from the NAV that would be calculated using market quotations. Fair value pricing involves subjective judgments and it is possible that the fair value determined for a security may be materially different than the value that could be realized upon the sale of that security.
Fair value is defined as the price that the Fund would expect to receive upon the sale of an investment or expect to pay to transfer a liability in an orderly transaction with an independent buyer in
37
COHEN & STEERS LOW DURATION PREFERRED AND INCOME FUND, INC.
NOTES TO FINANCIAL STATEMENTS—(Continued)
the principal market or, in the absence of a principal market, the most advantageous market for the investment or liability. The hierarchy of inputs that are used in determining the fair value of the Fund’s investments is summarized below.
| • | Level 1—quoted prices in active markets for identical investments |
| • | Level 2—other significant observable inputs (including quoted prices for similar investments, interest rates, credit risk, etc.) |
| • | Level 3—significant unobservable inputs (including the Fund’s own assumptions in determining the fair value of investments) |
The inputs or methodology used for valuing investments may or may not be an indication of the risk associated with those investments. Changes in valuation techniques may result in transfers into or out of an assigned level within the disclosure hierarchy.
The following is a summary of the inputs used as of April 30, 2022 in valuing the Fund’s investments carried at value:
| Total | Quoted Prices in Active Markets for Identical Investments (Level 1) |
Other Significant Observable Inputs (Level 2) |
Significant Unobservable Inputs (Level 3) |
|||||||||||||
| Preferred Securities— |
$ | 73,635,895 | $ | 73,635,895 | $ | — | $ | — | ||||||||
| Preferred Securities— |
||||||||||||||||
| Capital Securities |
2,042,920,347 | — | 2,042,920,347 | — | ||||||||||||
| Corporate Bonds |
675,467,862 | — | 675,467,862 | — | ||||||||||||
| Short-Term Investments |
89,451,173 | — | 89,451,173 | — | ||||||||||||
|
|
|
|
|
|
|
|
|
|||||||||
| Total Investments in Securitiesa |
$ | 2,881,475,277 | $ | 73,635,895 | $ | 2,807,839,382 | $ | — | ||||||||
|
|
|
|
|
|
|
|
|
|||||||||
| Forward Foreign Currency Exchange Contracts |
$ | 3,087,950 | $ | — | $ | 3,087,950 | $ | — | ||||||||
|
|
|
|
|
|
|
|
|
|||||||||
| Total Derivative Assetsa |
$ | 3,087,950 | $ | — | $ | 3,087,950 | $ | — | ||||||||
|
|
|
|
|
|
|
|
|
|||||||||
| Forward Foreign Currency Exchange Contracts |
$ | (118,017 | ) | $ | — | $ | (118,017 | ) | $ | — | ||||||
|
|
|
|
|
|
|
|
|
|||||||||
| Total Derivative Liabilitiesa |
$ | (118,017 | ) | $ | — | $ | (118,017 | ) | $ | — | ||||||
|
|
|
|
|
|
|
|
|
|||||||||
| a | Portfolio holdings are disclosed individually on the Schedule of Investments. |
38
COHEN & STEERS LOW DURATION PREFERRED AND INCOME FUND, INC.
NOTES TO FINANCIAL STATEMENTS—(Continued)
The following is a reconciliation of investments for which significant unobservable inputs (Level 3) were used in determining fair value:
| Preferred Securities—Capital Securities—Food |
||||
| Balance as of April 30, 2021 |
$ | 1,507,500 | ||
| Sales |
(1,500,000 | ) | ||
| Realized Gain (Loss) |
(103,125 | ) | ||
| Change in unrealized appreciation (depreciation) |
95,625 | |||
|
|
|
|||
| Balance as of April 30, 2022 |
$ | — | ||
|
|
|
|||
Security Transactions, Investment Income and Expense Allocations: Security transactions are recorded on trade date. Realized gains and losses on investments sold are recorded on the basis of identified cost. Interest income, which includes the amortization of premiums and accretion of discounts, is recorded on the accrual basis. Dividend income is recorded on the ex-dividend date, except for certain dividends on foreign securities, which are recorded as soon as the Fund is informed after the ex-dividend date. Income, expenses (other than expenses attributable to a specific class) and realized and unrealized gains or losses on investments are allocated to each class of shares based on its relative net assets.
Foreign Currency Translation: The books and records of the Fund are maintained in U.S. dollars. Investment securities and other assets and liabilities denominated in foreign currencies are translated into U.S. dollars based upon prevailing exchange rates on the date of valuation. Purchases and sales of investment securities and income and expense items denominated in foreign currencies are translated into U.S. dollars based upon prevailing exchange rates on the respective dates of such transactions. The Fund does not isolate that portion of the results of operations resulting from fluctuations in foreign exchange rates on investments from the fluctuations arising from changes in market prices of securities held. Such fluctuations are included with the net realized and unrealized gain or loss on investments.
Net realized foreign currency translation gains or losses arise from sales of foreign currencies, (excluding gains and losses on forward foreign currency exchange contracts, which are presented separately, if any) currency gains or losses realized between the trade and settlement dates on securities transactions, and the difference between the amounts of dividends, interest, and foreign withholding taxes recorded on the Fund’s books and the U.S. dollar equivalent of the amounts actually received or paid. Net unrealized foreign currency translation gains and losses arise from changes in the values of assets and liabilities, other than investments in securities, on the date of valuation, resulting from changes in exchange rates. Pursuant to U.S. federal income tax regulations, certain foreign currency gains/losses included in realized and unrealized gains/losses are included in or are a reduction of ordinary income for federal income tax purposes.
Forward Foreign Currency Exchange Contracts: The Fund enters into forward foreign currency exchange contracts to hedge the currency exposure associated with certain of its non-U.S. dollar denominated securities. A forward foreign currency exchange contract is a commitment between two parties to purchase or sell foreign currency at a set price on a future date. The market value of a forward
39
COHEN & STEERS LOW DURATION PREFERRED AND INCOME FUND, INC.
NOTES TO FINANCIAL STATEMENTS—(Continued)
foreign currency exchange contract fluctuates with changes in foreign currency exchange rates. These contracts are marked to market daily and the change in value is recorded by the Fund as unrealized appreciation and/or depreciation on forward foreign currency exchange contracts. Realized gains or losses equal to the difference between the value of the contract at the time it was opened and the value at the time it was closed are included in net realized gain or loss on forward foreign currency exchange contracts. For federal income tax purposes, the Fund has made an election to treat gains and losses from forward foreign currency exchange contracts as capital gains and losses.
Forward foreign currency exchange contracts involve elements of market risk in excess of the amounts reflected on the Statement of Assets and Liabilities. The Fund bears the risk of an unfavorable change in the foreign exchange rate underlying the contract. Risks may also arise upon entering these contracts from the potential inability of the counterparties to meet the terms of their contracts. In connection with these contracts, securities may be identified as collateral in accordance with the terms of the respective contracts.
Dividends and Distributions to Shareholders: Dividends from net investment income and capital gain distributions are determined in accordance with U.S. federal income tax regulations, which may differ from GAAP. Dividends from net investment income, if any, are declared and paid monthly. Net realized capital gains, unless offset by any available capital loss carryforward, are typically distributed to shareholders at least annually. Dividends and distributions to shareholders are recorded on the ex-dividend date and are automatically reinvested in full and fractional shares of the Fund based on the net asset value per share at the close of business on the payable date, unless the shareholder has elected to have them paid in cash. Dividends from net investment income are subject to recharacterization for tax purposes. Based upon the results of operations for the year ended April 30, 2022, a portion of the dividends have been reclassified to tax return of capital.
Income Taxes: It is the policy of the Fund to continue to qualify as a regulated investment company (RIC), if such qualification is in the best interest of the shareholders, by complying with the requirements of Subchapter M of the Internal Revenue Code applicable to RICs, and by distributing substantially all of its taxable earnings to its shareholders. Also, in order to avoid the payment of any federal excise taxes, the Fund will distribute substantially all of its net investment income and net realized gains on a calendar year basis. Accordingly, no provision for federal income or excise tax is necessary. Dividend and interest income from holdings in non-U.S. securities is recorded net of non-U.S. taxes paid. Management has analyzed the Fund’s tax positions taken on federal and applicable state income tax returns as well as its tax positions in non-U.S. jurisdictions in which it trades for all open tax years and has concluded that as of April 30, 2022, no additional provisions for income tax are required in the Fund’s financial statements. The Fund’s tax positions for the tax years for which the applicable statutes of limitations have not expired are subject to examination by the Internal Revenue Service, state departments of revenue and by foreign tax authorities.
Note 2. Investment Advisory Fees, Administration Fees and Other Transactions with Affiliates
Investment Advisory Fees: Cohen & Steers Capital Management, Inc. serves as the Fund’s investment advisor pursuant to an investment advisory agreement (the investment advisory agreement). Under the terms of the investment advisory agreement, the investment advisor provides the Fund with
40
COHEN & STEERS LOW DURATION PREFERRED AND INCOME FUND, INC.
NOTES TO FINANCIAL STATEMENTS—(Continued)
day-to-day investment decisions and generally manages the Fund’s investments in accordance with the stated policies of the Fund, subject to the supervision of the Board of Directors.
For the services provided to the Fund, the investment advisor receives a fee, accrued daily and paid monthly, at an annual rate of 0.65% of the average daily net assets of the Fund.
For the year ended April 30, 2022 and through June 30, 2023, the investment advisor has contractually agreed to waive its fee and/or reimburse expenses so that the Fund’s total annual operating expenses (excluding acquired fund fees and expenses, taxes and extraordinary expenses) do not exceed 0.95% for Class A shares, 1.60% for Class C shares, 0.60% for Class F shares, 0.60% for Class I shares, 1.10% for Class R shares and 0.60% for Class Z shares. This contractual agreement can be amended at any time by agreement of the Board of Directors of the Fund and the investment advisor and will terminate automatically in the event of termination of the investment advisory agreement between the Fund and the investment advisor. For the year ended April 30, 2022, fees waived and/or expenses reimbursed totaled $5,615,981.
Administration Fees: The Fund has entered into an administration agreement with the investment advisor under which the investment advisor performs certain administrative functions for the Fund and receives a fee, accrued daily and paid monthly, at the annual rate of 0.05% of the average daily net assets of the Fund. For the year ended April 30, 2022, the Fund incurred $1,428,581 in fees under this administration agreement. Additionally, the Fund pays State Street Bank and Trust Company as co-administrator under a fund accounting and administration agreement.
Distribution and Service Fees: Shares of the Fund are distributed by Cohen & Steers Securities, LLC (the distributor), an affiliated entity of the investment advisor. The Fund has adopted a distribution and service plan (the plan) pursuant to Rule 12b-1 under the 1940 Act, which allows the Fund to pay distribution fees for the sale and distribution of its shares. The plan provides that the Fund will pay the distributor a monthly distribution fee, accrued daily and paid monthly, at an annual rate of up to 0.25%, 0.75% and 0.50% of the average daily net assets attributable to Class A, Class C and Class R shares, respectively. In addition, also under the plan, the Fund may pay the distributor a monthly service fee, accrued daily and paid monthly, at an annual rate of up to 0.10% and 0.25% of the average daily net assets attributable to Class A and Class C shares, respectively. The amounts paid pursuant to the plan for Class A, Class C and Class R shares may also be used to pay for services to Fund shareholders or services related to the maintenance of shareholder accounts.
Shareholder Servicing Fees: For shareholder services, the Fund pays the distributor or its affiliates a fee, accrued daily, at an annual rate of up to 0.10% of the average daily net assets of the Fund’s Class I shares. The distributor is responsible for paying qualified financial institutions for shareholder services.
Sales Charges and Contingent Deferred Sales Charges: There is a maximum initial sales charge of 2.00% for Class A shares. There is a contingent deferred sales charge (CDSC) of 1.00% on purchases of $500,000 or more of Class A shares, which applies if redemption occurs within one year from purchase. There is a CDSC of 1.00% on Class C shares, which applies if redemption occurs within one year from purchase. For the year ended April 30, 2022, the Fund has been advised that the distributor received $18,228, which represents a portion of the sales commissions paid by shareholders from the
41
COHEN & STEERS LOW DURATION PREFERRED AND INCOME FUND, INC.
NOTES TO FINANCIAL STATEMENTS—(Continued)
sale of Class A shares, and $150,206 and $19,508 of CDSC relating to redemptions of Class A and Class C shares, respectively. The distributor has advised the Fund that proceeds from the CDSC on these classes are used by the distributor to defray its expenses related to providing distribution-related services to the Fund in connection with the sale of these classes, including payments to dealers and other financial intermediaries for selling these classes. The payment of a CDSC may result in the Distributor receiving amounts greater or less than the upfront commission paid by the Distributor to the financial intermediary.
Directors’ and Officers’ Fees: Certain directors and officers of the Fund are also directors, officers and/or employees of the investment advisor. The Fund does not pay compensation to directors and officers affiliated with the investment advisor except for the Chief Compliance Officer, who received compensation from the investment advisor, which was reimbursed by the Fund, in the amount of $14,349 for the year ended April 30, 2022.
Note 3. Purchases and Sales of Securities
Purchases and sales of securities, excluding short-term investments, for the year ended April 30, 2022, totaled $1,922,588,287 and $1,194,055,614, respectively.
Note 4. Derivative Investments
The following tables present the value of derivatives held at April 30, 2022 and the effect of derivatives held during the year ended April 30, 2022, along with the respective location in the financial statements.
Statement of Assets and Liabilities
| Assets |
Liabilities |
|||||||||||
| Derivatives |
Location |
Fair Value | Location |
Fair Value | ||||||||
| Foreign Exchange Risk: |
||||||||||||
| Forward Foreign Currency Exchange Contractsa |
Unrealized appreciation | $ | 3,087,950 | Unrealized depreciation | $ | 118,017 | ||||||
| a | Forward foreign currency exchange contracts executed with Brown Brothers Harriman are not subject to a master netting agreement or another similar arrangement. |
Statement of Operations
| Derivatives |
Location |
Realized Gain (Loss) |
Change in Unrealized Appreciation (Depreciation) |
|||||||
| Foreign Exchange Risk: |
||||||||||
| Forward Foreign Currency Exchange Contracts |
Net Realized and Unrealized Gain (Loss) | $ | 3,756,450 | $ | 4,699,203 | |||||
42
COHEN & STEERS LOW DURATION PREFERRED AND INCOME FUND, INC.
NOTES TO FINANCIAL STATEMENTS—(Continued)
The following summarizes the volume of the Fund’s forward foreign currency exchange contracts activity for the year ended April 30, 2022:
| Forward Foreign Currency Exchange Contracts |
||||
| Average Notional Amount |
$ | 98,274,111 | ||
Note 5. Income Tax Information
The tax character of dividends and distributions paid was as follows:
| For the Year Ended April 30, |
||||||||
| 2022 | 2021 | |||||||
| Ordinary income |
$ | 110,312,553 | $ | 83,972,760 | ||||
| Return of capital |
7,047,864 | — | ||||||
|
|
|
|
|
|||||
| Total dividends and distributions |
$ | 117,360,417 | $ | 83,972,760 | ||||
|
|
|
|
|
|||||
As of April 30, 2022, the tax-basis components of accumulated earnings, the federal tax cost and net unrealized appreciation (depreciation) in value of investments held were as follows:
| Cost of investments in securities for federal income tax purposes |
$ | 3,033,031,342 | ||
|
|
|
|||
| Gross unrealized appreciation on investments |
$ | 602,062 | ||
| Gross unrealized depreciation on investments |
(152,218,081 | ) | ||
|
|
|
|||
| Net unrealized appreciation (depreciation) on investments |
$ | (151,616,019 | ) | |
|
|
|
The Fund incurred ordinary losses of $722,504 after October 31, 2021 that it has elected to defer to the following year.
As of April 30, 2022, the Fund has a net capital loss carryforward of $93,062,567 which may be used to offset future capital gains. These losses are a short-term capital loss carryforward of $52,544,224 and long-term capital loss carryforward of $40,518,343, which under current federal income tax rules, may offset capital gains recognized in any future period.
As of April 30, 2022, the Fund had temporary book/tax differences primarily attributable to wash sales on portfolio securities and certain fixed income securities and permanent book/tax differences primarily attributable to certain fixed income securities. To reflect reclassifications arising from the permanent differences, paid-in capital was charged $4,124,258 and total distributable earnings/ (accumulated loss) was credited $4,124,258. Net assets were not affected by this reclassification.
43
COHEN & STEERS LOW DURATION PREFERRED AND INCOME FUND, INC.
NOTES TO FINANCIAL STATEMENTS—(Continued)
Note 6. Capital Stock
The Fund is authorized to issue 1.4 billion shares of capital stock, at a par value of $0.001 per share, classified in six classes as follows: 200 million of Class A capital stock, 200 million of Class C capital stock, 200 million of Class F capital stock, 400 million of Class I capital stock, 200 million of Class R capital stock and 200 million of Class Z capital stock. The Board of Directors of the Fund may increase or decrease the aggregate number of shares of common stock that the Fund has authority to issue. With the exception of Class C shares held through certain intermediaries, Class C shares will automatically convert into Class A shares on a monthly basis approximately eight years after the original date of purchase. Transactions in Fund shares were as follows:
| For the Year Ended April 30, 2022 |
For the Year Ended April 30, 2021 |
|||||||||||||||
| Shares | Amount | Shares | Amount | |||||||||||||
| Class A: |
||||||||||||||||
| Sold |
19,081,462 | $ | 191,104,457 | 11,492,938 | $ | 115,698,776 | ||||||||||
| Issued as reinvestment of dividends |
836,473 | 8,277,415 | 583,448 | 5,842,732 | ||||||||||||
| Redeemed |
(13,352,600 | ) | (131,442,916 | ) | (8,378,471 | ) | (83,994,461 | ) | ||||||||
|
|
|
|
|
|
|
|
|
|||||||||
| Net increase (decrease) |
6,565,335 | $ | 67,938,956 | 3,697,915 | $ | 37,547,047 | ||||||||||
|
|
|
|
|
|
|
|
|
|||||||||
| Class C: |
||||||||||||||||
| Sold |
2,281,635 | $ | 22,818,083 | 2,315,680 | $ | 23,209,384 | ||||||||||
| Issued as reinvestment |
165,530 | 1,636,716 | 148,464 | 1,483,136 | ||||||||||||
| Redeemed |
(2,027,224 | ) | (19,950,806 | ) | (2,018,642 | ) | (20,134,466 | ) | ||||||||
|
|
|
|
|
|
|
|
|
|||||||||
| Net increase (decrease) |
419,941 | $ | 4,503,993 | 445,502 | $ | 4,558,054 | ||||||||||
|
|
|
|
|
|
|
|
|
|||||||||
| Class F: |
||||||||||||||||
| Sold |
100,816 | $ | 1,001,122 | 20,954,465 | $ | 212,432,592 | ||||||||||
| Issued as reinvestment |
1,859 | 17,981 | 215,512 | 2,177,878 | ||||||||||||
| Redeemed |
(27,516 | ) | (277,236 | ) | (21,138,159 | ) | (213,853,590 | ) | ||||||||
|
|
|
|
|
|
|
|
|
|||||||||
| Net increase (decrease) |
75,159 | $ | 741,867 | 31,818 | $ | 756,880 | ||||||||||
|
|
|
|
|
|
|
|
|
|||||||||
| Class I: |
||||||||||||||||
| Sold |
174,478,789 | $ | 1,726,482,767 | 103,672,489 | $ | 1,041,121,333 | ||||||||||
| Issued as reinvestment |
7,805,743 | 77,034,231 | 5,099,194 | 51,025,618 | ||||||||||||
| Redeemed |
(112,216,465 | ) | (1,097,272,301 | ) | (48,772,730 | ) | (485,982,454 | ) | ||||||||
|
|
|
|
|
|
|
|
|
|||||||||
| Net increase (decrease) |
70,068,067 | $ | 706,244,697 | 59,998,953 | $ | 606,164,497 | ||||||||||
|
|
|
|
|
|
|
|
|
|||||||||
44
COHEN & STEERS LOW DURATION PREFERRED AND INCOME FUND, INC.
NOTES TO FINANCIAL STATEMENTS—(Continued)
| For the Year Ended April 30, 2022 |
For the Year Ended April 30, 2021 |
|||||||||||||||
| Shares | Amount | Shares | Amount | |||||||||||||
| Class R: |
||||||||||||||||
| Sold |
— | $ | — | — | $ | — | ||||||||||
| Issued as reinvestment |
1,157 | 11,483 | 1,179 | 11,813 | ||||||||||||
| Redeemed |
(22 | ) | (217 | ) | (59 | ) | (587 | ) | ||||||||
|
|
|
|
|
|
|
|
|
|||||||||
| Net increase (decrease) |
1,135 | $ | 11,266 | 1,120 | $ | 11,226 | ||||||||||
|
|
|
|
|
|
|
|
|
|||||||||
| Class Z: |
||||||||||||||||
| Sold |
30,830 | $ | 312,467 | 391,619 | $ | 3,947,510 | ||||||||||
| Issued as reinvestment |
8,147 | 81,623 | 7,293 | 73,504 | ||||||||||||
| Redeemed |
(332,665 | ) | (3,328,596 | ) | (47,374 | ) | (477,119 | ) | ||||||||
|
|
|
|
|
|
|
|
|
|||||||||
| Net increase (decrease) |
(293,688 | ) | $ | (2,934,506 | ) | 351,538 | $ | 3,543,895 | ||||||||
|
|
|
|
|
|
|
|
|
|||||||||
Note 7. Other Risks
Preferred Securities Risk: Preferred securities are subject to credit risk, which is the risk that a security will decline in price, or the issuer of the security will fail to make dividend, interest or principal payments when due, because the issuer experiences a decline in its financial status. Preferred securities are also subject to interest rate risk and may decline in value because of changes in market interest rates. The Fund may be subject to a greater risk of rising interest rates than would normally be the case in an environment of low interest rates and the effect of potential government fiscal policy initiatives and resulting market reaction to those initiatives. In addition, an issuer may be permitted to defer or omit distributions. Preferred securities are also generally subordinated to bonds and other debt instruments in a company’s capital structure. During periods of declining interest rates, an issuer may be able to exercise an option to redeem (call) its issue at par earlier than scheduled, and the Fund may be forced to reinvest in lower yielding securities. Certain preferred securities may be substantially less liquid than many other securities, such as common stocks. Generally, preferred security holders have no voting rights with respect to the issuing company unless certain events occur. Certain preferred securities may give the issuers special redemption rights allowing the securities to be redeemed prior to a specified date if certain events occur, such as changes to tax or securities laws.
Risks associated with preferred securities differ from risks inherent with other investments. In particular, in the event of bankruptcy, a company’s preferred securities are senior to common stock but subordinated to all other types of corporate debt. Corporate bonds sit higher in the capital structure than preferred securities, and therefore in the event of bankruptcy, will be senior to the preferred securities.
45
COHEN & STEERS LOW DURATION PREFERRED AND INCOME FUND, INC.
NOTES TO FINANCIAL STATEMENTS—(Continued)
Duration Risk: Duration is a mathematical calculation of the average life of a fixed-income or preferred security that serves as a measure of the security’s price risk to changes in interest rates (or yields). Securities with longer durations tend to be more sensitive to interest rate (or yield) changes than securities with shorter durations. Duration differs from maturity in that it considers potential changes to interest rates, and a security’s coupon payments, yield, price and par value and call features, in addition to the amount of time until the security matures. Various techniques may be used to shorten or lengthen the Fund’s duration. The duration of a security will be expected to change over time with changes in market factors and time to maturity.
Credit and Below-Investment-Grade Securities Risk: Preferred securities may be rated below investment grade or may be unrated. Below-investment-grade securities, or equivalent unrated securities, which are commonly known as “high-yield bonds” or “junk bonds,” generally involve greater volatility of price and risk of loss of income and principal, and may be more susceptible to real or perceived adverse economic and competitive industry conditions than higher grade securities. It is reasonable to expect that any adverse economic conditions could disrupt the market for lower-rated securities, have an adverse impact on the value of those securities and adversely affect the ability of the issuers of those securities to repay principal and interest on those securities.
Concentration Risk: Because the Fund invests at least 25% of its net assets in the financials sector, it will be more susceptible to adverse economic or regulatory occurrences affecting this sector, such as changes in interest rates, loan concentration and competition. In addition, the Fund will also be subject to the risks of investing in the individual industries and securities that comprise the financials sector, including the bank, diversified financials, real estate (including REITs) and insurance industries. To the extent that the Fund focuses its investments in other sectors or industries, such as (but not limited to) energy, industrials, utilities, pipelines, health care and telecommunications, the Fund will be subject to the risks associated with these particular sectors and industries. These sectors and industries may be adversely affected by, among others, changes in government regulation, world events and economic conditions.
Liquidity Risk: Liquidity risk is the risk that particular investments of the Fund may become difficult to sell or purchase. The market for certain investments may become less liquid or illiquid due to adverse changes in the conditions of a particular issuer or due to adverse market or economic conditions. In addition, dealer inventories of certain securities, which provide an indication of the ability of dealers to engage in “market making,” are at, or near, historic lows in relation to market size, which has the potential to increase price volatility in the fixed income markets in which the Fund invests. Federal banking regulations may also cause certain dealers to reduce their inventories of certain securities, which may further decrease the Fund’s ability to buy or sell such securities. As a result of this decreased liquidity, the Fund may have to accept a lower price to sell a security, sell other securities to raise cash, or give up an investment opportunity, any of which could have a negative effect on performance. Further, transactions in less liquid or illiquid securities may entail transaction costs that are higher than those for transactions in liquid securities.
Foreign (Non-U.S.) Securities Risk: The Fund directly purchases securities of foreign issuers. Risks of investing in foreign securities include currency risks, future political and economic developments and possible imposition of foreign withholding taxes on income or proceeds payable on the securities. In
46
COHEN & STEERS LOW DURATION PREFERRED AND INCOME FUND, INC.
NOTES TO FINANCIAL STATEMENTS—(Continued)
addition, there may be less publicly available information about a foreign issuer than about a domestic issuer, and foreign issuers may not be subject to the same accounting, auditing and financial recordkeeping standards and requirements as domestic issuers. Moreover, securities of many foreign issuers and their markets may be less liquid and their prices more volatile than securities of comparable U.S. issuers.
Contingent Capital Securities Risk: Contingent capital securities (sometimes referred to as “CoCos”) are debt or preferred securities with loss absorption characteristics built into the terms of the security, for example, a mandatory conversion into common stock of the issuer under certain circumstances, such as the issuer’s capital ratio falling below a certain level. Since the common stock of the issuer may not pay a dividend, investors in these instruments could experience a reduced income rate, potentially to zero, and conversion would deepen the subordination of the investor, hence worsening the investor’s standing in a bankruptcy. Some CoCos provide for a reduction in the value or principal amount of the security under such circumstances. In addition, most CoCos are considered to be high yield or “junk” securities and are therefore subject to the risks of investing in below investment-grade securities. Finally, CoCo issuers can, at their discretion, suspend dividend distributions on their CoCo securities and are more likely to do so in response to negative economic conditions and/or government regulation. Omitted distributions are typically non-cumulative and will not be paid on a future date. Any omitted distribution may negatively impact the returns or distribution rate of the Fund.
Geopolitical Risk: Occurrence of global events similar to those in recent years, such as war (including Russia’s military invasion of Ukraine), terrorist attacks, natural or environmental disasters, country instability, infectious disease epidemics, such as that caused by the COVID-19 virus, market instability, debt crises and downgrades, embargoes, tariffs, sanctions and other trade barriers and other governmental trade or market control programs, the potential exit of a country from its respective union and related geopolitical events, may result in market volatility and may have long-lasting impacts on both the U.S. and global financial markets. Events occurring in one region of the world may negatively impact industries and regions that are not otherwise directly impacted by the events. Additionally, those events, as well as other changes in foreign and domestic political and economic conditions, could adversely affect individual issuers or related groups of issuers, securities markets, interest rates, secondary trading, credit ratings, inflation, investor sentiment and other factors affecting the value of the Fund’s investments.
The outbreak of COVID-19 and efforts to contain its spread have resulted in, among other things, extreme volatility in the financial markets and severe losses, reduced liquidity of many instruments, significant travel restrictions, significant disruptions to business operations, supply chains and customer activity, lower consumer demand for goods and services, service and event cancellations, reductions and other changes, strained healthcare systems, as well as general concern and uncertainty. The impact of the COVID-19 outbreak has negatively affected the global economy, the economies of individual countries, and the financial performance of individual issuers, sectors, industries, asset classes, and markets in significant and unforeseen ways. Pandemics may also exacerbate other pre-existing political, social, economic, market and financial risks. The effects of the outbreak in developing or emerging market countries may be greater due to generally less established health care systems and supply chains. Public health crises caused by the COVID-19 outbreak may exacerbate
47
COHEN & STEERS LOW DURATION PREFERRED AND INCOME FUND, INC.
NOTES TO FINANCIAL STATEMENTS—(Continued)
other pre-existing political, social and economic risks in certain countries or globally. The duration of the COVID-19 outbreak and its effects cannot be determined with certainty. The foregoing could impair the Fund’s ability to maintain operational standards (such as with respect to satisfying redemption requests), disrupt the operations of the Fund’s service providers, adversely affect the value and liquidity of the Fund’s investments, and negatively impact the Fund’s performance and your investment in the Fund.
On January 31, 2020, the United Kingdom (UK) withdrew from the European Union (EU) (referred to as Brexit), commencing a transition period that ended on December 31, 2020. The EU-UK Trade and Cooperation Agreement, a bilateral trade and cooperation deal governing the future relationship between the UK and the EU (TCA), provisionally went into effect on January 1, 2021, and entered into force officially on May 1, 2021. Notwithstanding the TCA, following the transition period, there is likely to be considerable uncertainty as to the UK’s post-transition framework, including how the financial markets will react. As this process unfolds, markets may be further disrupted. Given the size and importance of the UK’s economy, uncertainty about its legal, political and economic relationship with the remaining member states of the EU may continue to be a source of instability.
On February 24, 2022, Russia launched a large-scale invasion of Ukraine significantly amplifying already existing geopolitical tensions. The United States and many other countries have instituted various economic sanctions against Russian individuals and entities. The extent and duration of the military action, sanctions imposed and other punitive actions taken and resulting future market disruptions in Europe and globally cannot be easily predicted, but could be significant and have a severe adverse effect on the global economy, securities markets and commodities markets globally. To the extent the Fund has exposure to the energy sector, the Fund may be especially susceptible to these risks. These disruptions may also make it difficult to value the Fund’s portfolio investments and cause certain of the Fund’s investments to become illiquid. The strengthening or weakening of the U.S. dollar relative to other currencies may, among other things, adversely affect the Fund’s investments denominated in non-U.S. dollar currencies. It is difficult to predict when similar events affecting the U.S. or global financial markets may occur, the effects that such events may have, and the duration of those effects.
Regulatory Risk: The U.S. government has proposed and adopted multiple regulations that could have a long-lasting impact on the Fund and on the mutual fund industry in general. The U.S. Securities and Exchange Commission’s (SEC) final rules, related requirements and amendments to modernize reporting and disclosure, along with other potential upcoming regulations, could, among other things, restrict the Fund’s ability to engage in transactions, impact flows into the Fund and/or increase overall expenses of the Fund. In addition to recently adopted Rule 18f-4, which will govern the way derivatives are used by registered investment companies, the SEC, Congress, various exchanges and regulatory and self-regulatory authorities, both domestic and foreign, have undertaken reviews of the use of derivatives by registered investment companies, which could affect the nature and extent of instruments used by the Fund. While the full extent of all of these regulations is still unclear, these regulations and actions may adversely affect both the Fund and the instruments in which the Fund invests and its ability to execute its investment strategy. Similarly, regulatory developments in other countries may have an unpredictable and adverse impact on the Fund.
48
COHEN & STEERS LOW DURATION PREFERRED AND INCOME FUND, INC.
NOTES TO FINANCIAL STATEMENTS—(Continued)
LIBOR Risk: Many financial instruments are tied to the London Interbank Offered Rate, or “LIBOR,” to determine payment obligations, financing terms, hedging strategies, or investment value. LIBOR is the offered rate for short-term Eurodollar deposits between major international banks. The Head of the UK Financial Conduct Authority the (FCA) and LIBOR’s administrator, ICE Benchmark Administration (IBA) ceased publication of most LIBOR settings at the end of 2021 and the IBA is expected to cease publication of a majority of U.S. dollar LIBOR settings after June 30, 2023. In addition, global regulators have announced that, with limited exceptions, no new LIBOR-based contracts should be entered into after 2021. Actions by regulators have resulted in the establishment of alternative reference rates to LIBOR in most major currencies (e.g., the Secured Overnight Financing Rate for U.S. dollar LIBOR and the Sterling Overnight Interbank Average Rate for GBP LIBOR). Other countries are introducing their own local-currency-denominated alternative reference rates for short-term lending and global consensus on alternative rates is lacking.
There remains uncertainty and risk regarding the willingness and ability of issuers and lenders to include enhanced provisions in new and existing contracts or instruments, the suitability of the proposed replacement rates, and the process for amending existing contracts and instruments remains unclear. As such, the transition away from LIBOR may lead to increased volatility and illiquidity in markets that are tied to LIBOR, reduced values of, inaccurate valuations of, and miscalculations of payment amounts for LIBOR-related investments or investments in issuers that utilize LIBOR, increased difficulty in borrowing or refinancing and reduced effectiveness of hedging strategies, adversely affecting the Fund’s performance or NAV. In addition, any alternative reference rate may be an ineffective substitute resulting in prolonged adverse market conditions for the Fund. Since the usefulness of LIBOR as a benchmark could deteriorate during the transition period, these effects could occur prior to the cessation of LIBOR publications.
This is not a complete list of the risks of investing in the Fund. For additional information concerning the risks of investing in the Fund, please consult the Fund’s prospectus.
Note 8. Other
In the normal course of business, the Fund enters into contracts that provide general indemnifications. The Fund’s maximum exposure under these arrangements is dependent on claims that may be made against the Fund in the future and, therefore, cannot be estimated; however, based on experience, the risk of material loss from such claims is considered remote.
Note 9. New Accounting Pronouncement
In January 2021, the Financial Accounting Standards Board issued Accounting Standards Update No. 2021-01 (ASU 2021-01), “Reference Rate Reform (Topic 848)”. ASU 2021-01 is an update of ASU 2020-04, which is in response to concerns about structural risks of interbank offered rates, and particularly the risk of cessation of LIBOR, regulators have undertaken reference rate reform initiatives to identify alternative reference rates that are more observable or transaction based and less susceptible to manipulation. ASU 2020-04 provides optional guidance for a limited period of time to ease the potential burden in accounting for (or recognizing the effects of) reference rate reform on financial
49
COHEN & STEERS LOW DURATION PREFERRED AND INCOME FUND, INC.
NOTES TO FINANCIAL STATEMENTS—(Continued)
reporting. ASU 2020-04 is elective and applies to all entities, subject to meeting certain criteria, that have contracts, hedging relationships, and other transactions that reference LIBOR or another reference rate expected to be discontinued because of reference rate reform. The ASU 2021-01 update clarifies that certain optional expedients and exceptions in Topic 848 for contract modifications and hedge accounting apply to derivatives that are affected by the discounting transition. The amendments in this update are effective immediately through December 31, 2022, for all entities. Management does not expect any impact to the Fund’s net assets or results of operations.
Note 10. Subsequent Events
Management has evaluated events and transactions occurring after April 30, 2022 through the date that the financial statements were issued, and has determined that no additional disclosure in the financial statements is required.
50
COHEN & STEERS LOW DURATION PREFERRED AND INCOME FUND, INC.
REPORT OF INDEPENDENT REGISTERED PUBLIC ACCOUNTING FIRM
To the Board of Directors and Shareholders of
Cohen & Steers Low Duration Preferred and Income Fund, Inc.
Opinion on the Financial Statements
We have audited the accompanying statement of assets and liabilities, including the schedule of investments, of Cohen & Steers Low Duration Preferred and Income Fund, Inc. (the “Fund”) as of April 30, 2022, the related statement of operations for the year ended April 30, 2022, the statement of changes in net assets for each of the two years in the period ended April 30, 2022, including the related notes, and the financial highlights for each of the periods indicated therein (collectively referred to as the “financial statements”). In our opinion, the financial statements present fairly, in all material respects, the financial position of the Fund as of April 30, 2022, the results of its operations for the year then ended, the changes in its net assets for each of the two years in the period ended April 30, 2022 and the financial highlights for each of the periods indicated therein in conformity with accounting principles generally accepted in the United States of America.
Basis for Opinion
These financial statements are the responsibility of the Fund’s management. Our responsibility is to express an opinion on the Fund’s financial statements based on our audits. We are a public accounting firm registered with the Public Company Accounting Oversight Board (United States) (PCAOB) and are required to be independent with respect to the Fund in accordance with the U.S. federal securities laws and the applicable rules and regulations of the Securities and Exchange Commission and the PCAOB.
We conducted our audits of these financial statements in accordance with the standards of the PCAOB. Those standards require that we plan and perform the audit to obtain reasonable assurance about whether the financial statements are free of material misstatement, whether due to error or fraud.
Our audits included performing procedures to assess the risks of material misstatement of the financial statements, whether due to error or fraud, and performing procedures that respond to those risks. Such procedures included examining, on a test basis, evidence regarding the amounts and disclosures in the financial statements. Our audits also included evaluating the accounting principles used and significant estimates made by management, as well as evaluating the overall presentation of the financial statements. Our procedures included confirmation of securities owned as of April 30, 2022 by correspondence with the custodian, transfer agent and brokers; when replies were not received from brokers, we performed other auditing procedures. We believe that our audits provide a reasonable basis for our opinion.
/s/PricewaterhouseCoopers LLP
New York, New York
June 27, 2022
We have served as the auditor of one or more investment companies in the Cohen & Steers family of mutual funds since 1991.
51
COHEN & STEERS LOW DURATION PREFERRED AND INCOME FUND, INC.
TAX INFORMATION—2022 (Unaudited)
For the fiscal year ended April 30, 2022, for individual taxpayers, the Fund designates $93,573,752 as qualified dividend income eligible for reduced tax rates. In addition, for corporate taxpayers, 37.58% of the ordinary dividends paid qualified for the dividends received deduction (DRD).
OTHER INFORMATION
A description of the policies and procedures that the Fund uses to determine how to vote proxies relating to portfolio securities is available (i) without charge, upon request, by calling 800-330-7348, (ii) on our website at cohenandsteers.com or (iii) on the U.S. Securities and Exchange Commission’s (SEC) website at http://www.sec.gov. In addition, the Fund’s proxy voting record for the most recent 12-month period ended June 30 is available by August 31 of each year (i) without charge, upon request, by calling 800-330-7348 or (ii) on the SEC’s website at http://www.sec.gov.
Disclosures of the Fund’s complete holdings are required to be made monthly on Form N-PORT, with every third month made available to the public by the SEC 60 days after the end of the Fund’s fiscal quarter. The Fund’s Form N-PORT is available (i) without charge, upon request, by calling 800-330-7348 or (ii) on the SEC’s website at http://www.sec.gov.
Please note that distributions paid by the Fund to shareholders are subject to recharacterization for tax purpose and are taxable up to the amount of the Fund’s investment company taxable income and net realized gains. Distributions in excess of the Fund’s investment company taxable income and net realized gains are a return of capital distributed from the Fund’s assets. To the extent this occurs, the Fund’s shareholders of record will be notified of the estimated amount of capital returned to shareholders for each such distribution and this information will also be available at cohenandsteers.com. The final tax treatment of all distribution is reported to shareholders on their 1099-DIV forms, which are mailed after the close of each calendar year. Distributions of capital decrease the Fund’s total assets and, therefore, could have the effect of increasing the Fund’s expense ratio. In addition, in order to make these distributions, the Fund may have to sell portfolio securities at a less than opportune time.
Addition to Portfolio Management Team
Effective April 29, 2022, Mr. Jerry Dorost was added as portfolio manager of the Fund. Mr. Dorost joined the investment advisor in 2010 and currently serves as Senior Vice President of the investment advisor.
Changes to the Board of Directors and Officers
On March 8, 2021, the Board of Directors voted to set the number of directors on the Fund’s Board of Directors to ten. In addition, the Board of Directors elected Ms. Ramona Rogers-Windsor as a Director of the Fund.
Effective December 7, 2021, Director and Chairman Robert H. Steers resigned from the Fund’s Board of Directors. The Board of Directors has appointed Director Joseph M. Harvey to succeed Mr. Steers as Chairman. In addition, effective March 1, 2022, Mr. Harvey, Cohen & Steers, Inc.’s (CNS) current President and a member of CNS’ board of directors, succeeded Mr. Steers as Chief Executive Officer of CNS and Cohen & Steers Capital Management, Inc., the Fund’s investment advisor (the
52
COHEN & STEERS LOW DURATION PREFERRED AND INCOME FUND, INC.
investment advisor). At that time, Mr. Steers assumed the role of Executive Chairman of CNS and continues on as a member of CNS’ board of directors.
On December 7, 2021, the Board of Directors elected Adam M. Derechin, President and Chief Executive Officer of the Fund, as a Director of the Fund. Concurrent with his election, Mr. Derechin resigned as President and Chief Executive Officer of Fund. Mr. Derechin currently serves as the Chief Operating Officer of CNS and the investment advisor since 2004 and 2003, respectively. Effective December 7, 2021, James Giallanza, previously Chief Financial Officer of the Fund, succeeded Mr. Derechin as President and Chief Executive Officer of the Fund and Albert Laskaj, Treasurer of the Fund, succeeded Mr. Giallanza as Chief Financial Officer of the Fund.
In addition, also on December 7, 2021, the Board of Directors voted to set the number of directors on the Fund’s Board of Directors to nine, effective January 1, 2022. Director C. Edward Ward, Jr. retired from the Board of Directors on December 31, 2021 pursuant to the Fund’s mandatory retirement policy.
53
COHEN & STEERS LOW DURATION PREFERRED AND INCOME FUND, INC.
MANAGEMENT OF THE FUND
The business and affairs of the Fund are managed under the direction of the Board of Directors. The Board of Directors approves all significant agreements between the Fund and persons or companies furnishing services to it, including the Fund’s agreements with its investment advisor, administrator, co-administrator, custodian and transfer agent. The management of the Fund’s day-to-day operations is delegated to its officers, the investment advisor, administrator and co-administrator, subject always to the investment objective and policies of the Fund and to the general supervision of the Board of Directors.
The Board of Directors and officers of the Fund and their principal occupations during at least the past five years are set forth below. The statement of additional information (SAI) includes additional information about fund directors and is available, without charge, upon request by calling 800-330-7348.
| Name, Address and Year of Birth1 |
Position(s) Held With Fund |
Term of Office2 |
Principal Occupation During At Least The Past 5 Years (Including Other Directorships Held) |
Number of Funds Within Fund Complex Overseen by Director (Including the Fund) |
Length of Time Served3 |
|||||||
| Interested Directors4 | ||||||||||||
| Joseph M. Harvey5 1963 |
Director, Chairman | Until Next Election of Directors | President of Cohen & Steers Capital Management, Inc. (CSCM or the Advisor) (since 2003) and President of Cohen & Steers, Inc. (CNS) (since 2004). Chief Investment Officer of CSCM from 2003 to 2019. Prior to that, Senior Vice President and Director of Investment Research of CSCM. | 21 | Since 2014 | |||||||
| Adam M. Derechin6 1964 |
Director | Until Next Election of Directors | Chief Operating Officer of CSCM since 2003 and CNS since 2004. | 21 | Since 2021 | |||||||
| Independent Directors | ||||||||||||
| Michael G. Clark 1965 |
Director | Until Next Election of Directors | From 2006 to 2011, President and Chief Executive Officer of DWS Funds and Managing Director of Deutsche Asset Management. | 21 | Since 2011 | |||||||
| George Grossman 1953 |
Director | Until Next Election of Directors | Attorney-at-law. | 21 | Since 1993 | |||||||
(table continued on next page)
54
COHEN & STEERS LOW DURATION PREFERRED AND INCOME FUND, INC.
(table continued from previous page)
| Name, Address and Year of Birth1 |
Position(s) Held With Fund |
Term of Office2 |
Principal Occupation During At Least The Past 5 Years (Including Other Directorships Held) |
Number of Funds Within Fund Complex Overseen by Director (Including the Fund) |
Length of Time Served3 |
|||||
| Dean A. Junkans 1959 |
Director | Until Next Election of Directors | CFA; Advisor to SigFig (a registered investment advisor) since July, 2018; Adjunct Professor and Executive–In–Residence, Bethel University since 2015; Chief Investment Officer at Wells Fargo Private Bank from 2004 to 2014 and Chief Investment Officer of the Wealth, Brokerage and Retirement group at Wells Fargo & Company from 2011 to 2014; former Member and Chair, Claritas Advisory Committee at the CFA Institute from 2013 to 2015; Board Member and Investment Committee member, Bethel University Foundation since 2010; formerly Corporate Executive Board Member of the National Chief Investment Officers Circle, 2010 to 2015; formerly, Member of the Board of Governors of the University of Wisconsin Foundation, River Falls, 1996 to 2004; U.S. Army Veteran, Gulf War. | 21 | Since 2015 | |||||
(table continued on next page)
55
COHEN & STEERS LOW DURATION PREFERRED AND INCOME FUND, INC.
(table continued from previous page)
| Name, Address and Year of Birth1 |
Position(s) Held With Fund |
Term of Office2 |
Principal Occupation During At Least The Past 5 Years (Including Other Directorships Held) |
Number of Funds Within Fund Complex Overseen by Director (Including the Fund) |
Length of Time Served3 |
|||||
| Gerald J. Maginnis 1955 |
Director | Until Next Election of Directors | Philadelphia Office Managing Partner, KPMG LLP from 2006 to 2015; Partner in Charge, KPMG Pennsylvania Audit Practice from 2002 to 2008; President, Pennsylvania Institute of Certified Public Accountants (PICPA) from 2014 to 2015; Member, PICPA Board of Directors from 2012 to 2016; Member, Council of the American Institute of Certified Public Accountants (AICPA) from 2013 to 2017; Member, Board of Trustees of AICPA Foundation from 2015 to 2020; Board member and Audit Committee Chairman of inTEST Corporation since 2020. | 21 | Since 2015 | |||||
| Jane F. Magpiong 1960 |
Director | Until Next Election of Directors | President, Untap Potential since 2013; Board Member, Crespi High School from 2014 to 2017; Senior Managing Director, TIAA-CREF, from 2011 to 2013; National Head of Wealth Management, TIAA- CREF, from 2008 to 2011; and prior to that, President, Bank of America Private Bank from 2005 to 2008. | 21 | Since 2015 | |||||
(table continued on next page)
56
COHEN & STEERS LOW DURATION PREFERRED AND INCOME FUND, INC.
(table continued from previous page)
| Name, Address and Year of Birth1 |
Position(s) Held With Fund |
Term of Office2 |
Principal Occupation During At Least The Past 5 Years (Including Other Directorships Held) |
Number of Funds Within Fund Complex Overseen by Director (Including the Fund) |
Length of Time Served3 |
|||||
| Daphne L. Richards 1966 |
Director | Until Next Election of Directors | Independent Director of Cartica Management, LLC since 2015; Investment Committee Member of the Berkshire Taconic Community Foundation since 2015 and Member of the Advisory Board of Northeast Dutchess Fund since 2016; President and CIO of Ledge Harbor Management since 2016; formerly, worked at Bessemer Trust Company from 1999 to 2014; prior thereto, held investment positions at Frank Russell Company from 1996 to 1999. Union Bank of Switzerland from 1993 to 1996; Credit Suisse from 1990 to 1993; and Hambros International Venture Capital Fund from 1988 to 1989. | 21 | Since 2017 | |||||
(table continued on next page)
57
COHEN & STEERS LOW DURATION PREFERRED AND INCOME FUND, INC.
(table continued from previous page)
| Name, Address and Year of Birth1 |
Position(s) Held With Fund |
Term of Office2 |
Principal Occupation During At Least The Past 5 Years (Including Other Directorships Held) |
Number of Funds Within Fund Complex Overseen by Director (Including the Fund) |
Length of Time Served3 |
|||||
| Ramona Rogers-Windsor7 1960 |
Director | Until Next Election of Directors | Member, Capital Southwest Board of Directors since March 2021; member, Thomas Jefferson University Board of Trustees since 2020; Managing Director, Public Investments Department, Northwestern Mutual Investment Management Company, LLC from 2012 to 2019; member, Milwaukee Film, LLC Board of Directors from 2016 to 2019. | 21 | Since 2021 | |||||
| 1 | The address for each director is 280 Park Avenue, New York, NY 10017. |
| 2 | On March 12, 2008, the Board of Directors adopted a mandatory retirement policy stating a Director must retire from the Board on December 31st of the year in which he or she turns 75 years of age. |
| 3 | The length of time served represents the year in which the Director was first elected or appointed to any fund in the Cohen & Steers Fund Complex. |
| 4 | “Interested person” as defined in the 1940 Act, of the Fund because of affiliation with CSCM (Interested Directors). |
| 5 | Robert H. Steers resigned from the Fund’s Board of Directors and role as Chairman, effective December 7, 2021. The Board of Directors has appointed Joseph M. Harvey to succeed Mr. Steers as Chairman, effective December 7, 2021. |
| 6 | Mr. Derechin was elected as a Director of each of the Funds in the Cohen & Steers Fund Complex by each applicable Fund’s Board of Directors on December 7, 2021. |
| 7 | Ms. Rogers-Windsor was elected as a Director of each of the Funds in the Cohen & Steers Fund Complex by each applicable Fund’s Board of Directors on March 8, 2021. |
58
COHEN & STEERS LOW DURATION PREFERRED AND INCOME FUND, INC.
The officers of the Fund (other than Mr. Harvey, whose biography is provided above), their address, their year of birth and their principal occupations for at least the past five years are set forth below.
| Name, Address and Year of Birth1 |
Position(s) Held With Fund |
Principal Occupation During At Least the Past 5 Years |
Length of Time Served2 |
|||
| James Giallanza 1966 |
President and Chief Executive Officer | Executive Vice President of CSCM since 2014 and Prior to that, Senior Vice President of CSCM since 2006. |
Since 2006 | |||
| Albert Laskaj 1977 |
Treasurer and Chief Financial Officer | Senior Vice President of CSCM since 2019. Prior to that, Vice President of CSCM since 2015. | Since 2015 | |||
| Dana A. DeVivo 1981 |
Secretary and Chief Legal Officer | Senior Vice President of CSCM since 2019. Prior to that, Vice President of CSCM since 2013. | Since 2015 | |||
| Stephen Murphy 1966 |
Chief Compliance Officer and Vice President | Senior Vice President of CSCM since 2019. Prior to that, Managing Director at Mirae Asset Securities (USA) Inc. since 2017. Prior to that, VP & Chief Compliance Officer of Weiss Multi-Strategy Adviser LLC since 2011. | Since 2019 | |||
| William F. Scapell 1967 |
Vice President | Executive Vice President of CSCM since 2014, Prior to that, Senior Vice President of CSCM since 2003. | Since 2003 | |||
| Elaine Zaharis-Nikas 1973 |
Vice President | Senior Vice President of CSCM since 2014. Prior to that, Vice President of CSCM since 2005. | Since 2015 | |||
| 1 | The address of each officer is 280 Park Avenue, New York, NY 10017. |
| 2 | Officers serve one-year terms. The length of time served represents the year in which the officer was first elected as an officer of any fund in the Cohen & Steers fund complex. All of the officers listed above are officers of one or more of the other funds in the complex. |
59
COHEN & STEERS LOW DURATION PREFERRED AND INCOME FUND, INC.
Cohen & Steers Privacy Policy
| Facts | What Does Cohen & Steers Do With Your Personal Information? | |
| Why? | Financial companies choose how they share your personal information. Federal law gives consumers the right to limit some but not all sharing. Federal law also requires us to tell you how we collect, share, and protect your personal information. Please read this notice carefully to understand what we do. | |
| What? | The types of personal information we collect and share depend on the product or service you have with us. This information can include:
• Social Security number and account balances
• Transaction history and account transactions
• Purchase history and wire transfer instructions | |
| How? | All financial companies need to share customers’ personal information to run their everyday business. In the section below, we list the reasons financial companies can share their customers’ personal information; the reasons Cohen & Steers chooses to share; and whether you can limit this sharing. | |
| Reasons we can share your personal information | Does Cohen & Steers share? |
Can you limit this sharing? | ||
| For our everyday business purposes— such as to process your transactions, maintain your account(s), respond to court orders and legal investigations, or reports to credit bureaus |
Yes | No | ||
| For our marketing purposes— to offer our products and services to you |
Yes | No | ||
| For joint marketing with other financial companies— | No | We don’t share | ||
| For our affiliates’ everyday business purposes— information about your transactions and experiences |
No | We don’t share | ||
| For our affiliates’ everyday business purposes— information about your creditworthiness |
No | We don’t share | ||
| For our affiliates to market to you— | No | We don’t share | ||
| For non-affiliates to market to you— | No | We don’t share | ||
| Questions? Call 800.330.7348 | ||||
60
COHEN & STEERS LOW DURATION PREFERRED AND INCOME FUND, INC.
Cohen & Steers Privacy Policy—(Continued)
| Who we are | ||
| Who is providing this notice? | Cohen & Steers Capital Management, Inc., Cohen & Steers Asia Limited, Cohen & Steers Japan Limited, Cohen & Steers UK Limited, Cohen & Steers Ireland Limited, Cohen & Steers Securities, LLC, Cohen & Steers Private Funds and Cohen & Steers Open and Closed-End Funds (collectively, Cohen & Steers). | |
| What we do | ||
| How does Cohen & Steers protect my personal information? | To protect your personal information from unauthorized access and use, we use security measures that comply with federal law. These measures include computer safeguards and secured files and buildings. We restrict access to your information to those employees who need it to perform their jobs, and also require companies that provide services on our behalf to protect your information. | |
| How does Cohen & Steers collect my personal information? | We collect your personal information, for example, when you:
• Open an account or buy securities from us
• Provide account information or give us your contact information
• Make deposits or withdrawals from your account
We also collect your personal information from other companies. | |
| Why can’t I limit all sharing? | Federal law gives you the right to limit only:
• sharing for affiliates’ everyday business purposes—information about your creditworthiness
• affiliates from using your information to market to you
• sharing for non-affiliates to market to you
State law and individual companies may give you additional rights to limit sharing. | |
| Definitions | ||
| Affiliates | Companies related by common ownership or control. They can be financial and nonfinancial companies.
• Cohen & Steers does not share with affiliates. | |
| Non-affiliates | Companies not related by common ownership or control. They can be financial and nonfinancial companies.
• Cohen & Steers does not share with non-affiliates. | |
| Joint marketing | A formal agreement between non-affiliated financial companies that together market financial products or services to you.
• Cohen & Steers does not jointly market. | |
61
COHEN & STEERS LOW DURATION PREFERRED AND INCOME FUND, INC.
Cohen & Steers Open-End Mutual Funds
COHEN & STEERS REALTY SHARES
| • | Designed for investors seeking total return, investing primarily in U.S. real estate securities |
| • | Symbols: CSJAX, CSJCX, CSJIX, CSRSX, CSJRX, CSJZX |
COHEN & STEERS REAL ESTATE SECURITIES FUND
| • | Designed for investors seeking total return, investing primarily in U.S. real estate securities |
| • | Symbols: CSEIX, CSCIX, CREFX, CSDIX, CIRRX, CSZIX |
COHEN & STEERS INSTITUTIONAL REALTY SHARES
| • | Designed for institutional investors seeking total return, investing primarily in U.S. real estate securities |
| • | Symbol: CSRIX |
COHEN & STEERS GLOBAL REALTY SHARES
| • | Designed for investors seeking total return, investing primarily in global real estate equity securities |
| • | Symbols: CSFAX, CSFCX, CSSPX, GRSRX, CSFZX |
COHEN & STEERS INTERNATIONAL REALTY FUND
| • | Designed for investors seeking total return, investing primarily in international (non-U.S.) real estate securities |
| • | Symbols: IRFAX, IRFCX, IRFIX, IRFRX, IRFZX |
COHEN & STEERS REAL ASSETS FUND
| • | Designed for investors seeking total return and the maximization of real returns during inflationary environments by investing primarily in real assets |
| • | Symbols: RAPAX, RAPCX, RAPIX, RAPRX, RAPZX |
COHEN & STEERS PREFERRED SECURITIES
AND INCOME FUND
| • | Designed for investors seeking total return (high current income and capital appreciation), investing primarily in preferred and debt securities issued by U.S. and non-U.S. companies |
| • | Symbols: CPXAX, CPXCX, CPXFX, CPXIX, CPRRX, CPXZX |
COHEN & STEERS LOW DURATION PREFERRED
AND INCOME FUND
| • | Designed for investors seeking high current income and capital preservation by investing in low-duration preferred and other income securities issued by U.S. and non-U.S. companies |
| • | Symbols: LPXAX, LPXCX, LPXFX, LPXIX, LPXRX, LPXZX |
COHEN & STEERS MLP & ENERGY OPPORTUNITY FUND
| • | Designed for investors seeking total return, investing primarily in midstream energy master limited partnership (MLP) units and related stocks |
| • | Symbols: MLOAX, MLOCX, MLOIX, MLORX, MLOZX |
COHEN & STEERS GLOBAL INFRASTRUCTURE FUND
| • | Designed for investors seeking total return, investing primarily in global infrastructure securities |
| • | Symbols: CSUAX, CSUCX, CSUIX, CSURX, CSUZX |
COHEN & STEERS ALTERNATIVE INCOME FUND
| • | Designed for investors seeking high current income and capital appreciation, investing in equity, preferred and debt securities, focused on real assets and alternative income strategies |
| • | Symbols: DVFAX, DVFCX, DVFIX, DVFRX, DVFZX |
Distributed by Cohen & Steers Securities, LLC.
Please consider the investment objectives, risks, charges and expenses of any Cohen & Steers U.S. registered open-end fund carefully before investing. A summary prospectus and prospectus containing this and other information can be obtained by calling 800-330-7348 or by visiting cohenandsteers.com. Please read the summary prospectus and prospectus carefully before investing.
62
COHEN & STEERS LOW DURATION PREFERRED AND INCOME FUND, INC.
OFFICERS AND DIRECTORS
Joseph M. Harvey
Director, Chairman and Vice President
Adam M. Derechin
Director
Michael G. Clark
Director
George Grossman
Director
Dean A. Junkans
Director
Gerald J. Maginnis
Director
Jane F. Magpiong
Director
Daphne L. Richards
Director
Ramona Rogers-Windsor
Director
James Giallanza
President and Chief Executive Officer
Albert Laskaj
Treasurer and Chief Financial Officer
Dana A. DeVivo
Secretary and Chief Legal Officer
Stephen Murphy
Chief Compliance Officer
and Vice President
William F. Scapell
Vice President
Elaine Zaharis-Nikas
Vice President
KEY INFORMATION
Investment Advisor and Administrator
Cohen & Steers Capital Management, Inc.
280 Park Avenue
New York, NY 10017
(212) 832-3232
Co-administrator and Custodian
State Street Bank and Trust Company
One Lincoln Street
Boston, MA 02111
Transfer Agent
DST Asset Manager Solutions, Inc.
P.O. Box 219953
Kansas City, MO 64121-9953
(800) 437-9912
Legal Counsel
Ropes & Gray LLP
1211 Avenue of the Americas
New York, NY 10036
Distributor
Cohen & Steers Securities, LLC
280 Park Avenue
New York, NY 10017
| Nasdaq Symbol: | Class A—LPXAX | |
| Class C—LPXCX | ||
| Class F—LPXFX | ||
| Class I—LPXIX | ||
| Class R—LPXRX | ||
| Class Z—LPXZX |
Website: cohenandsteers.com
This report is authorized for delivery only to shareholders of Cohen & Steers Low Duration Preferred and Income Fund, Inc. unless accompanied or preceded by the delivery of a currently effective prospectus setting forth details of the Fund. Performance data quoted represent past performance. Past performance is no guarantee of future results and your investment may be worth more or less at the time you sell your shares.
63
eDelivery AVAILABLE
Stop traditional mail delivery;
receive your shareholder reports
and prospectus online.
Sign up at cohenandsteers.com

Cohen & Steers
Low Duration
Preferred and
Income Fund
Annual Report April 30, 2022
As permitted by regulations adopted by the U.S. Securities and Exchange Commission, paper copies of the Fund’s annual and semi-annual shareholder reports are no longer sent by mail, unless you specifically requested paper copies of the reports. Instead, the reports are made available on the Fund’s website at www.cohenandsteers.com, and you will be notified by mail each time a report is posted and provided with a website link to access the report.
If you have already elected to receive shareholder reports electronically, you will not be affected by this change and you need not take any action. You may elect to receive shareholder reports and other communications from a Fund electronically anytime by contacting your financial intermediary or, if you are a direct investor, by signing up at www.cohenandsteers.com.
You may elect to receive all future reports in paper, free of charge, at any time. If you invest through a financial intermediary, you can contact your financial intermediary or, if you are a direct investor, you can call (800) 330-7348 to let the Fund know you wish to continue receiving paper copies of your shareholder reports. Your election to receive reports in paper will apply to all Funds held in your account if you invest through your financial intermediary or all Funds held within the fund complex if you invest directly with the Fund.
LPXAXAR
Item 2. Code of Ethics.
The registrant has adopted a code of ethics as defined in Item 2 of Form N-CSR (the “Code of Ethics”) that applies to its Principal Executive Officer and Principal Financial Officer. The Code of Ethics was in effect during the reporting period. In December 2021, the registrant amended the Code of Ethics to reflect the registrant’s current Principal Executive Officer and Principal Financial Officer. The registrant has not granted any waiver, including an implicit waiver, from a provision of the Code of Ethics, as described in Form N-CSR, during the reporting period. A current copy of the Code of Ethics is available on the registrant’s website at https://assets.cohenandsteers.com/assets/content/uploads/Code_of_Ethics_for_Principal_Executive_and_Principal_Financial_Officers_of_the_Funds.pdf. Upon request, a copy of the Code of Ethics can be obtained free of charge by calling 800-330-7348 or writing to the Secretary of the Registrant, 280 Park Avenue, 10th floor, New York, NY 10017.
Item 3. Audit Committee Financial Expert.
The registrant’s board has determined that Gerald J. Maginnis qualifies as an audit committee financial expert based on his years of experience in the public accounting profession. The registrant’s board has determined that Michael G. Clark qualifies as an audit committee financial expert based on his years of experience in the public accounting profession and the investment management and financial services industry. The registrant’s board has determined that Ramona Rogers-Windsor qualifies as an audit committee expert based on her years of experience in the investment management and financial services industry. Each of Messrs. Clark and Maginnis and Ms. Rogers-Windsor are members of the board’s audit committee, and each is independent as such term is defined in Form N-CSR.
Item 4. Principal Accountant Fees and Services.
(a) – (d) Aggregate fees billed to the registrant for the last two fiscal years ended April 30, 2022 and April 30, 2021 for professional services rendered by the registrant’s principal accountant were as follows:
| 2022 | 2021 | |||
| Audit Fees |
$44,564 | $43,690 | ||
| Audit-Related Fees |
$0 | $0 | ||
| Tax Fees |
$6,059 | $5,940 | ||
| All Other Fees |
$0 | $0 |
Tax fees were billed in connection with tax compliance services, including the preparation and review of federal and state tax returns.
(e)(1) The audit committee is required to pre-approve audit and non-audit services performed for the registrant by the principal accountant. The audit committee also is required to pre-approve non-audit services performed by the registrant’s principal accountant for the registrant’s investment advisor and any sub-advisor (not including any sub-advisor whose role is primarily portfolio management and is subcontracted with or overseen by another investment advisor) and/or to any entity controlling, controlled by or under common control with the registrant’s investment advisor that provides ongoing services to the registrant, if the engagement for services relates directly to the operations and financial reporting of the registrant.
The audit committee may delegate pre-approval authority to one or more of its members who are independent members of the board of directors of the registrant. The member or members to whom such authority is delegated shall report any pre-approval decisions to the audit committee at its next scheduled meeting. The audit committee may not delegate its responsibility to pre-approve services to be performed by the registrant’s principal accountant to the investment advisor.
(e)(2) No services included in (b) – (d) above were approved by the audit committee pursuant to paragraphs (c)(7)(i)(C) of Rule 2-01 of Regulation S-X.
(f) Not applicable.
(g) For the fiscal years ended April 30, 2022 and April 30, 2021, the aggregate fees billed by the registrant’s principal accountant for non-audit services rendered to the registrant and for non-audit services rendered to the registrant’s investment advisor (not including any sub-advisor whose role is primarily portfolio management and is subcontracted with or overseen by another investment advisor) and/or to any entity controlling, controlled by or under common control with the registrant’s investment advisor that provides ongoing services to the registrant were:
| 2022 | 2021 | |||
| Registrant |
$6,059 | $5,940 | ||
| Investment Advisor |
$0 | $0 |
(h) The registrant’s audit committee considered whether the provision of non-audit services that were rendered to the registrant’s investment advisor (not including any sub-advisor whose role is primarily portfolio management and is subcontracted with or overseen by another investment advisor) and/or to any entity controlling, controlled by or under common control with the registrant’s investment advisor that provides ongoing services to the registrant that were not required to be pre-approved pursuant to paragraph (c)(7)(ii) of Rule 2-01 of Regulation S-X was compatible with maintaining the principal accountant’s independence.
Item 5. Audit Committee of Listed Registrants.
Not applicable.
Item 6. Schedule of Investments.
Included in Item 1 above.
Item 7. Disclosure of Proxy Voting Policies and Procedures for Closed-End Management Investment Companies.
Not applicable.
Item 8. Portfolio Managers of Closed-End Investment Companies.
Not applicable.
Item 9. Purchases of Equity Securities by Closed-End Management Investment Company and Affiliated Purchasers.
Not applicable.
Item 10. Submission of Matters to a Vote of Security Holders.
None.
Item 11. Controls and Procedures.
(a) The registrant’s principal executive officer and principal financial officer have concluded that the registrant’s disclosure controls and procedures are reasonably designed to ensure that information required to be disclosed by the registrant in this Form N-CSR was recorded, processed, summarized and reported within the time periods specified in the Securities and Exchange Commission’s rules and forms, based upon such officers’ evaluation of these controls and procedures as of a date within 90 days of the filing date of this report.
(b) There were no changes in the registrant’s internal control over financial reporting that occurred during the period covered by this report that have materially affected, or are reasonably likely to materially affect, the registrant’s internal control over financial reporting.
Item 12. Disclosure of Securities Lending Activities for Closed-End Management Investment Companies.
Not applicable.
Item 13. Exhibits.
(a)(1) Not applicable.
(a)(3) Not applicable.
(a)(4) Not applicable.
SIGNATURES
Pursuant to the requirements of the Securities Exchange Act of 1934 and the Investment Company Act of 1940, the registrant has duly caused this report to be signed on its behalf by the undersigned, thereunto duly authorized.
COHEN & STEERS LOW DURATION PREFERRED AND INCOME FUND, INC.
| By: | /s/ James Giallanza | |||
| Name: James Giallanza | ||||
| Title: Principal Executive Officer | ||||
| (President and Chief Executive Officer) | ||||
| Date: | July 6, 2022 | |||
Pursuant to the requirements of the Securities Exchange Act of 1934 and the Investment Company Act of 1940, this report has been signed below by the following persons on behalf of the registrant and in the capacities and on the dates indicated.
| By: | /s/ James Giallanza | |||
| Name: James Giallanza | ||||
| Title: Principal Executive Officer | ||||
| (President and Chief Executive Officer) | ||||
| By: | /s/ Albert Laskaj | |||
| Name: Albert Laskaj | ||||
| Title: Principal Financial Officer | ||||
| (Treasurer and Chief Financial Officer) | ||||
| Date: | July 6, 2022 | |||
EX-99.CERT
EXHIBIT 13 (a)(2)
RULE 30a-2(a) CERTIFICATIONS
I, James Giallanza, certify that:
| 1. | I have reviewed this report on Form N-CSR of Cohen & Steers Low Duration Preferred and Income Fund, Inc.; |
| 2. | Based on my knowledge, this report does not contain any untrue statement of a material fact or omit to state a material fact necessary to make the statements made, in light of the circumstances under which such statements were made, not misleading with respect to the period covered by this report; |
| 3. | Based on my knowledge, the financial statements, and other financial information included in this report, fairly present in all material respects the financial condition, results of operations, changes in net assets, and cash flows (if the financial statements are required to include a statement of cash flows) of the registrant as of, and for, the periods presented in this report; |
| 4. | The registrant’s other certifying officer and I are responsible for establishing and maintaining disclosure controls and procedures (as defined in Rule 30a-3(c) under the Investment Company Act of 1940) and internal control over financial reporting (as defined in Rule 30a-3(d) under the Investment Company Act of 1940) for the registrant and have: |
| (a) | designed such disclosure controls and procedures, or caused such disclosure controls and procedures to be designed under our supervision, to ensure that material information relating to the registrant, including its consolidated subsidiaries, is made known to us by others within those entities, particularly during the period in which this report is being prepared; |
| (b) | designed such internal control over financial reporting, or caused such internal control over financial reporting to be designed under our supervision, to provide reasonable assurance regarding the reliability of financial reporting and the preparation of financial statements for external purposes in accordance with generally accepted accounting principles; |
| (c) | evaluated the effectiveness of the registrant’s disclosure controls and procedures and presented in this report our conclusions about the effectiveness of the disclosure controls and procedures, as of a date within 90 days prior to the filing date of this report based on such evaluation; and |
| (d) | disclosed in this report any change in the registrant’s internal control over financial reporting that occurred during the period covered by this report that has materially affected, or is reasonably likely to materially affect, the registrant’s internal control over financial reporting; and |
| 5. | The registrant’s other certifying officer and I have disclosed to the registrant’s auditors and the audit committee of the registrant’s board of directors (or persons performing the equivalent functions): |
| (a) | all significant deficiencies and material weaknesses in the design or operation of internal control over financial reporting which are reasonably likely to adversely affect the registrant’s ability to record, process, summarize, and report financial information; and |
| (b) | any fraud, whether or not material, that involves management or other employees who have a significant role in the registrant’s internal control over financial reporting. |
| Date: July 6, 2022 |
| /s/ James Giallanza |
| James Giallanza |
| Principal Executive Officer |
| (President and Chief Executive Officer) |
EXHIBIT 13 (a)(2)
RULE 30a-2(a) CERTIFICATIONS
I, Albert Laskaj, certify that:
| 1. | I have reviewed this report on Form N-CSR of Cohen & Steers Low Duration Preferred and Income Fund, Inc.; |
| 2. | Based on my knowledge, this report does not contain any untrue statement of a material fact or omit to state a material fact necessary to make the statements made, in light of the circumstances under which such statements were made, not misleading with respect to the period covered by this report; |
| 3. | Based on my knowledge, the financial statements, and other financial information included in this report, fairly present in all material respects the financial condition, results of operations, changes in net assets, and cash flows (if the financial statements are required to include a statement of cash flows) of the registrant as of, and for, the periods presented in this report; |
| 4. | The registrant’s other certifying officer and I are responsible for establishing and maintaining disclosure controls and procedures (as defined in Rule 30a-3(c) under the Investment Company Act of 1940) and internal control over financial reporting (as defined in Rule 30a-3(d) under the Investment Company Act of 1940) for the registrant and have: |
| (a) | designed such disclosure controls and procedures, or caused such disclosure controls and procedures to be designed under our supervision, to ensure that material information relating to the registrant, including its consolidated subsidiaries, is made known to us by others within those entities, particularly during the period in which this report is being prepared; |
| (b) | designed such internal control over financial reporting, or caused such internal control over financial reporting to be designed under our supervision, to provide reasonable assurance regarding the reliability of financial reporting and the preparation of financial statements for external purposes in accordance with generally accepted accounting principles; |
| (c) | evaluated the effectiveness of the registrant’s disclosure controls and procedures and presented in this report our conclusions about the effectiveness of the disclosure controls and procedures, as of a date within 90 days prior to the filing date of this report based on such evaluation; and |
| (d) | disclosed in this report any change in the registrant’s internal control over financial reporting that occurred during the period covered by this report that has materially affected, or is reasonably likely to materially affect, the registrant’s internal control over financial reporting; and |
| 5. | The registrant’s other certifying officer and I have disclosed to the registrant’s auditors and the audit committee of the registrant’s board of directors (or persons performing the equivalent functions): |
| (a) | all significant deficiencies and material weaknesses in the design or operation of internal control over financial reporting which are reasonably likely to adversely affect the registrant’s ability to record, process, summarize, and report financial information; and |
| (b) | any fraud, whether or not material, that involves management or other employees who have a significant role in the registrant’s internal control over financial reporting. |
| Date: July 6, 2022 |
| /s/ Albert Laskaj |
| Albert Laskaj |
| Principal Financial Officer |
| (Treasurer and Chief Financial Officer) |
EX-99.906CERT
EXHIBIT 13 (b)
RULE 30a-2(b) CERTIFICATIONS
In connection with the Report of Cohen & Steers Low Duration Preferred and Income Fund, Inc. (the “Company”) on Form N-CSR as filed with the Securities and Exchange Commission on the date hereof (the “Report”), I, James Giallanza, Principal Executive Officer of the Company, certify, pursuant to 18 U.S.C. §1350, as adopted pursuant to Section 906 of the Sarbanes-Oxley Act of 2002, that:
| (1) | The Report fully complies with the requirements of Section 13(a) or 15(d) of the Securities Exchange Act of 1934, as applicable; and |
| (2) | The information contained in the Report fairly presents, in all material respects, the financial condition and results of operations of the Company. |
| /s/ James Giallanza |
| James Giallanza |
| Principal Executive Officer |
| (President and Chief Executive Officer) |
| Date: July 6, 2022 |
EXHIBIT 13 (b)
RULE 30a-2(b) CERTIFICATIONS
In connection with the Report of Cohen & Steers Low Duration Preferred and Income Fund, Inc. (the “Company”) on Form N-CSR as filed with the Securities and Exchange Commission on the date hereof (the “Report”), I, Albert Laskaj, Principal Financial Officer of the Company, certify, pursuant to 18 U.S.C. §1350, as adopted pursuant to Section 906 of the Sarbanes-Oxley Act of 2002, that:
| (1) | The Report fully complies with the requirements of Section 13(a) or 15(d) of the Securities Exchange Act of 1934, as applicable; and |
| (2) | The information contained in the Report fairly presents, in all material respects, the financial condition and results of operations of the Company. |
| /s/ Albert Laskaj |
| Albert Laskaj |
| Principal Financial Officer |
| (Treasurer and Chief Financial Officer) |
| Date: July 6, 2022 |
Serious News for Serious Traders! Try StreetInsider.com Premium Free!
You May Also Be Interested In
- Yeelight Elevates RGB Experience with SignalRGB Integration
- University of Phoenix College of Nursing Faculty Leadership Selected for Prestigious Fellows of the American Association of Nurse Practitioners® Program
- HOW TO KEEP PESTS FROM BUZZING THROUGH COMMUNITY CLEAN-UP EVENTS THIS EARTH DAY
Create E-mail Alert Related Categories
SEC FilingsSign up for StreetInsider Free!
Receive full access to all new and archived articles, unlimited portfolio tracking, e-mail alerts, custom newswires and RSS feeds - and more!
