

Form N-CSR CONESTOGA FUNDS For: Sep 30
 Tweet
Tweet Share
Share| OMB APPROVAL |
|
OMB Number: 3235-0570
Expires: July 31, 2022
Estimated average burden hours per response: 20.6 |
UNITED STATES
SECURITIES AND EXCHANGE COMMISSION
Washington, D.C. 20549
FORM N-CSR
CERTIFIED SHAREHOLDER REPORT OF REGISTERED
MANAGEMENT INVESTMENT COMPANIES
| Investment Company Act file number | 811-21120 |
| Conestoga Funds |
| (Exact name of registrant as specified in charter) |
| 550 E. Swedesford Road, Suite 120 Wayne, PA | 19087 |
| (Address of principal executive offices) | (Zip code) |
| Conestoga Capital Advisors 550 E. Swedesford Road, Suite 120 Wayne, PA 19087 |
| (Name and address of agent for service) |
| With Copy To: |
| Josh Deringer, Esq. |
| Faegre Drinker Biddle & Reath LLP |
| One Logan Square, Suite 2000 |
| Philadelphia, PA 19103 |
| Registrant's telephone number, including area code: | (800) 320-7790 |
| Date of fiscal year end: | September 30 | |
| Date of reporting period: | September 30, 2021 |
Form N-CSR is to be used by management investment companies to file reports with the Commission not later than 10 days after the transmission to stockholders of any report that is required to be transmitted to stockholders under Rule 30e-1 under the Investment Company Act of 1940 (17 CFR 270.30e-1). The Commission may use the information provided on Form N-CSR in its regulatory, disclosure review, inspection, and policymaking roles. A registrant is required to disclose the information specified by Form N-CSR, and the Commission will make this information public.
A registrant is not required to respond to the collection of information contained in Form N-CSR unless the Form displays a currently valid Office of Management and Budget (“OMB”) control number. Please direct comments concerning the accuracy of the information collection burden estimate and any suggestions for reducing the burden to Secretary, Securities and Exchange Commission, 450 Fifth Street, NW, Washington, DC 20549-0609. The OMB has reviewed this collection of information under the clearance requirements of 44 U.S.C. § 3507.
Item 1. Reports to Stockholders.
| (a) |
Conestoga Funds
SMALL CAP FUND
SMID CAP FUND
MID CAP FUND
M a n a g e d B y

ANNUAL REPORT
September 30, 2021
CONESTOGA FUNDS |
|
November 18, 2021
Dear Fellow Shareholders of the Conestoga Funds,
The Conestoga Funds fiscal year ended September 30, 2021, has been marked by the continued economic recovery from COVID-19. The global economy has slowly begun to re-open, with some setbacks as cases of the virus surge regionally. Equity markets moved mostly higher over the fiscal year on the strength of corporate earnings and low interest rates. Many major equity indices hit all-time highs during the Summer of 2021.
We are pleased to report that each of the Conestoga Funds outperformed their respective benchmarks during the Funds’ fiscal year. As the Managers describe in their letter that follows, a return to favor for high-quality companies and positive stock selection effects generated excess returns for each of the Funds. Importantly, and consistent with our expectations, the Funds’ outperformance has been driven by limiting downside return during the market’s declines.
This report includes our first report on the Conestoga Mid Cap Fund. We launched the Conestoga Mid Cap Fund on June 29, 2021, with initial funding from members of Conestoga Capital Advisors and our Funds’ Board of Trustees. We are excited to offer the mutual fund as a complement to our over ten-year track record of separate account management.
Also, we are excited to report that the Conestoga Funds will add a new fund later this year. The Conestoga Micro Cap Fund will focus on companies that are smaller and/or earlier-stage growth than those that would be candidates for our Small Cap Fund. We look forward to communicating more on the Micro Cap Fund in our future letters.
On behalf of my fellow trustees of the Conestoga Funds and my partners at Conestoga Capital Advisors, thank you for your continued investment in our Conestoga Funds.
Sincerely,
Robert M. Mitchell.
Robert M. Mitchell
Chairman and Chief Executive Officer
The Conestoga Funds
1
CONESTOGA FUNDS |
|
Dear Fellow Shareholders,
Market Review
Equity markets continued to move higher over the Conestoga Funds’ fiscal year ended September 30, 2021. Market participants watched closely for signs that the global economy would continue to rebound from the impact of COVID-19. The Federal Reserve communicated that its programs to support the economy would be “tapered” down in the quarters ahead and interest rates would likely rise in 2022. Expectations for a temporary spike in inflation are extending longer than expected, and supply chain bottlenecks and labor shortages persist across many sectors of the economy.
The above factors contributed to a rotation away from the companies that have benefited from the economic recovery since mid-2020. In the second half of the Funds’ fiscal year, this aided Conestoga as higher-quality companies (those expected to have more sustainable earnings growth, lower leverage, and higher returns on equity) generally outperformed lower-quality companies (unprofitable and highly levered). We expect the Conestoga Funds to outperform during more volatile and/or down markets, and we are pleased to report the Funds met these expectations over the recent quarters and trailing one-year period.
Markets face several uncertain challenges as 2021 comes to a close and 2022 comes into view. COVID-19 appears to be easing and vaccination rates are rising globally. This should support the continued re-opening of global economies, but any resurgence of COVID-19 cases could temper growth. We expect inflation to be less temporary than forecast, which may also introduce volatility into the market if interest rates rise, supply chain issues persist, and corporate earnings are impacted. Earnings comparisons in the year ahead will be more challenging given the higher base of current earnings against which future earnings will likely be judged, and the current high equity market valuations could be tested. Persistent political challenges surrounding spending packages, tax proposals and debt limits creates additional negative crosscurrents for investment markets.
Readers will note that we have added our recently launched Conestoga Mid Cap Fund (“Mid Cap Fund”) to this Annual Report. Our Mid Cap Fund began operations on June 29, 2021 and holds several “graduates” from our Conestoga Small Cap Fund (“Small Cap Fund”) and Conestoga SMid Cap Fund (“SMid Cap Fund”). Following the additions of investment team members Derek Johnston in 2015 and Ted Chang in 2020 – both of whom are co-portfolio managers on the Conestoga Mid Cap Fund – we believe we are well prepared to manage the Mid Cap Fund and we look forward to introducing the Fund to clients, advisors, and institutional consultants.
2
Returns for the Small Cap Fund, the SMid Cap Fund and the Mid Cap Fund for the periods through September 30, 2021, are below:
|
3Q |
YTD |
1 |
3 |
5 |
10 |
Since |
Conestoga Small Cap Fund (Investors Class) |
3.99% |
10.63% |
37.70% |
13.56% |
19.62% |
17.36% |
13.34% |
Russell 2000 Growth Index |
-5.65% |
2.82% |
33.27% |
11.70% |
15.34% |
15.74% |
12.16% |
|
3Q |
YTD |
1 |
3 |
5 |
|
Since |
Conestoga SMid Cap Fund (Investors Class) |
3.51% |
13.28% |
35.09% |
15.89% |
21.54% |
13.43% |
|
Russell 2500 Growth Index |
-3.53% |
4.84% |
31.98% |
16.01% |
18.21% |
13.25% |
|
3Q |
|
|
|
|
|
Since |
Conestoga Mid Cap Fund (Investors Class) |
4.04% |
3.10% |
|||||
Russell Mid Cap Growth Index |
-0.76% |
-1.20% |
* |
Note – All periods longer than one-year are annualized |
SMALL CAP FUND PERFORMANCE REVIEW
The Conestoga Small Cap Fund Investors Class rose 37.70% net of fees for the twelve months ended September 30, 2021, versus the Russell 2000 Growth Index return of 33.27%. Sector allocation accounted for a significant portion of the outperformance while stock selection also added to relative return. (Note: Conestoga’s sector allocations are driven by the bottom-up stock selection process, not a top-down sector view.)
Sector allocation was strongest within the Health Care, Industrials and Technology sectors, the three heaviest weighted sectors of the portfolio. Within Health Care, the portfolio’s biotech weight was significantly less than the Russell 2000 Growth Index’s weight. The biotech industry within the benchmark was up only 8.9% during the twelve-month period, and the underweight in the industry significantly enhanced the portfolio’s relative return. Within Industrials, the overweight of electronic equipment (Helios Technologies, Inc. (HLIO)), the construction industry (Construction Partners, Inc. (ROAD)) and the engineering and contracting services industry (Exponent, Inc. (EXPO)) were sources of positive relative return. The Small Cap Fund’s overweight of Technology (up 47%), which outperformed the broader benchmark, also enhanced our relative return over the last twelve months.
3
From a stock selection perspective, the portfolio had positive stock selection in seven out of the nine sectors (where we have exposure). As mentioned above, stock selection was strongest within the Health Care sector. A significant portion of the positive stock selection came from medical equipment companies (Cantel Medical Corp. (CMD) and Repligen Corporation (RGEN)) as well as health care services holdings (Omnicell Inc. (OMCL)). Stock selection within Consumer Discretionary, Basic Materials, Utilities and Real Estate were solid over the last twelve months ended September 30, 2021.
We added eight new stocks to the Small Cap Fund during the fiscal year ended September 30, 2021. Within Technology, we added Brooks Automation Inc. (BRKS), Shutterstock Inc. (SSTK), Simulations Plus (SLP), Vertex Inc. (VERX), and Workiva Inc. (WK). In Health Care, we added CareDX Inc. (CDNA) and Vericel Corp. (VCEL). In Industrials, we added Hillman Solutions Corp. (HLMN).
We also removed eight companies from the Small Cap Fund. Three companies were the target of mergers or acquisitions and were sold as a result: Cantel Medical Corp. (CMD), Five9 Inc. (FIVN) and RealPage Inc. (RP). Long-time holding Bio-Techne Corp. (TECH) was sold as its market capitalization rose. ACI Worldwide Inc. (ACIW), Bottomline Technologies (EPAY), Ligand Pharmaceuticals Inc. (LGND). and Proto Labs Inc. (PRLB) were sold on fundamental concerns.
SMID CAP FUND PERFORMANCE REVIEW
The Conestoga SMid Cap Fund Investors Class rose 35.09% net-of-fees for the year ended September 30, 2021, versus the Russell 2500 Growth Index return of 31.98%. We were pleased to observe that the portfolio generated returns consistent with our expectations. During the “up period” from March 2020 through mid-first quarter 2021, the SMid Cap Fund lagged as lower-quality companies propelled the market higher. As volatility increased and the market pulled back from its highs in mid-February 2021, the SMid Cap Fund performed better on a relative basis. The market favored high-quality stocks in the third quarter, 2021, during which the SMid Cap Fund outperformed the benchmark by a wider margin.
As with the Small Cap Fund above, sector allocation accounted for a significant portion of the outperformance while stock selection also added to relative return. Sector allocation was strongest within the Industrials, Health Care, and Consumer Staples sectors. Within Health Care, portfolio’s biotech weight was significantly less than the Russell 2500 Growth Index’s weight. The biotech industry was up only 12.3% for the twelve-month period, and the underweight in the industry significantly enhanced the portfolio’s relative return.
Within Industrials, the overweight in machinery (Generac Holdings, Inc. (GNRC)), the construction industry (Construction Partners, Inc. (ROAD)) and the engineering and contracting services industry (Exponent, Inc. (EXPO)) were sources of positive relative return. The SMid Cap Fund’s lack of exposure to the Consumer Staples sector which underperformed the broader benchmark, also enhanced our relative return over the last twelve months.
From a stock selection perspective, the portfolio had positive stock selection in five out of the seven sectors (where we have exposure). As mentioned above, stock selection was strongest within the Health Care sector. A significant portion of the positive stock selection
4
came from Omnicell, Inc. (OMCL), Repligen Corp (RGEN), and Bio-Techne Corp. (TECH). Stock selection within Consumer Discretionary, Basic Materials, Utilities, Technology and Real Estate were solid over the last twelve months ended September 30, 2021.
Conestoga added nine new companies to the SMid Cap Fund during the fiscal year ended September 30, 2021. Within Technology, we added Avalara Inc. (AVLR), Five9 Inc. (FIVN), Lightspeed Commerce Inc. (LSPD), Novanta Inc. (NOVT), Q2 Holdings Inc. (QTWO), and Workiva Inc. (WK). In Health Care, we added CareDX Inc. (CDNA) and Definitive Healthcare Corp. (DH) and within Industrials, we added Hillman Solutions Corp. (HLMN.)
Eight stocks were removed from the SMid Cap Fund during the fiscal year ended September 30, 2021. Five9 Inc. (FIVN) and RealPage Inc. (RP) were sold after the announcement of acquisitions. Of note, the acquisition of Five9 Inc. by Zoom Communications Inc. (ZM) was not completed and, as a result, we repurchased Five9 Inc. into the SMid Cap Fund in early October 2021. ACI Worldwide, Inc. (ACIW), Bottomline Technologies Inc. (EPAY), Ligand Pharmaceuticals Inc. (LGND), and Pluralsight Inc. (PS) were sold on fundamental concerns to fund purchases in higher conviction holdings. Ansys Inc. (ANSS) and Copart Inc. (CPRT) were sold as their market capitalizations rose to higher levels.
MID CAP FUND PERFORMANCE REVIEW
The Conestoga Mid Cap Fund was launched on June 29, 2021. We are happy to report that the Mid Cap Fund got off to a good start, rising 3.10% from inception through September 30, 2021. This compares to the Russell Mid Cap Growth Index decline of -1.20% over the same period. The Mid Cap Fund benefited from the return to “high quality” factor leadership that was prevalent in the equity market over the summer of 2021. Profitable companies as measured by Return on Invested Capital (ROIC) and operating earnings before interest, taxes, depreciation and amortization (EBITDA) margins significantly outperformed high beta, non-earning companies.
In the Technology sector, strong stock selection was the primary driver of excess returns. Performance was broad-based as seven of the ten holdings within the sector generated positive returns with Fortinet Inc. (FTNT), Gartner Inc. (IT), and Lightspeed Commerce Inc. (LSPD) being the largest gainers. FTNT traded higher following an earnings report that saw revenue and billings accelerate to multi-year highs. Shares of IT were also up for the quarter as sales and earnings exceeded expectations.
Health Care generated positive stock selection effects led by West Pharmaceuticals Inc. (WST), Align Technology Inc. (ALGN), and Bio-Techne Corp. (TECH). WST continues to benefit from strength in its core, pre-pandemic business as well as outperformance in COVID-19 vaccine revenue. The portfolio also received a boost from its lack of exposure to the underperforming biotechnology industry.
Broad-based gains were seen in Consumer Discretionary with five of the seven names in the sector generating positive returns for the quarter ended September 30, 2021. Copart Inc. (CPRT), Tractor Supply Company (TSCO) and Rollins Inc. (ROL) were the largest contributors to relative gains. Vehicle salvage auctioneer CPRT continues to benefit from double-digit pricing, buoyed by a shortage of vehicles, which led to a top- and bottom-line beat during the most recent quarter.
5
There were also a few names that detracted from returns, most notably Coupa Software Inc. (COUP), Graco Inc. (GGG) and Veeva Systems Inc. (VEEV). While financial results for COUP were solid, beating consensus estimates handily, there has been debate around the organic growth of the business and billings guidance. Shares of GGG drifted lower in September 2021 as various industrial companies warned about supply chain shortages and rising input costs. VEEV’s stock price was relatively weak due to concerns sales force reductions in the pharmaceutical industry, which could lower the company’s growth prospects.
CONESTOGA CAPITAL ADVISORS, LLC FIRM UPDATE
Conestoga Capital Advisors, LLC (“Conestoga”) celebrated its 20th anniversary on July 1, 2021. From our initial base of $80 million in client assets and a two- and one-half-year track record, we have grown to a firm of over $8 billion in assets. We very sincerely thank those Fund shareholders, clients, consultants, and advisors who have placed their confidence in our team and our investment approach over the past two decades!
As of September 30, 2021, Conestoga’s total assets were $8.5 billion, an all-time high for the firm. The breakdown of assets across the four primary investment strategies was:
● Small Cap Growth: |
$6.9 billion |
● SMid Cap Growth: |
$1.5 billion |
● Micro Cap Growth: |
$55.9 million |
● Mid Cap Growth: |
$27.0 million |
Conestoga is not actively pursuing new Small Cap Growth separate account placements and the Small Cap Fund remains in soft-close. The Small Cap Fund experienced net inflows over the fiscal year ended September 30, 2021 of $183 million. We are primarily focused on growing the assets of our SMid Cap Fund and SMid Cap Growth separate account strategy. Over the twelve months ended September 30, 2021, the SMid Cap Fund experienced net inflows of $89 million.
Conestoga has filed to create a Micro Cap mutual fund, which we expect to launch in December 2021. We look forward to introducing this strategy to prospective investors. Conestoga has managed a Micro Cap limited partnership since 2018 and a separate account since 2019. We expect to more actively market the Mid Cap Fund and Micro Cap Fund in the year ahead.
In August of 2021, Conestoga continued our program of expanding ownership across the firm. This year. we transitioned ownership to eight partners. Twelve of our fourteen members are owners of Conestoga.
Lastly, after working remotely since March of 2020, Conestoga began to return to the office in June 2021. Any team member that was fully vaccinated was invited to return. On a typical day, more than half of our staff now works in the office. We continue to monitor local developments and will adjust our work plans as warranted.
6
On behalf of all the members of Conestoga, we thank you for your investment in the Funds.
Sincerely,
Robert M. Mitchell |
Joseph F. Monahan |
Derek S. Johnston |
Ted Chang |
7
CONESTOGA SMALL CAP FUND - INSTITUTIONAL CLASS |
Comparison of the Change in Value of a $250,000 Investment in
Conestoga Small Cap Fund – Institutional Class (since inception on 08/13/2014) versus the Russell 2000® Growth Index 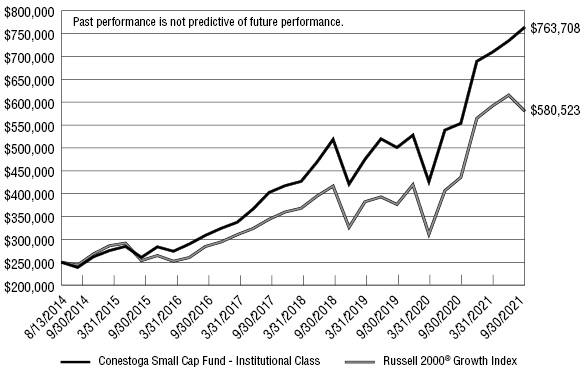
Average Annual Total Returns for the Periods Ended September 30, 2021 |
|||||
1 Year |
3 Years |
5 Years |
Since |
||
Conestoga Small Cap Fund - Institutional Class |
37.96% |
13.79% |
19.86% |
16.95% |
|
Russell 2000® Growth Index |
33.27% |
11.70% |
15.34% |
12.54% |
|
The Fund’s past performance does not predict its future performance. The graph and table shown above do not reflect the deduction of taxes that a shareholder would pay on Fund distributions or the redemption of Fund shares but does reflect the reinvestment of all dividends and distributions. The Fund’s benchmark, the Russell 2000® Growth Index, measures the performance of the small-cap growth segment of the U.S. equity universe. It includes those Russell 2000® companies with higher price-to-value ratios and higher forecasted growth values. The Russell 2000® Index measures the performance of the small-cap segment of the U.S. equity universe. The Russell 2000® Index is a subset of the Russell 3000® Index representing approximately 10% of the total market capitalization of that index. It includes approximately 2000 of the smallest securities in the Russell 3000® Index based on a combination of their market capitalization and current index membership.
8
CONESTOGA SMALL CAP FUND - INVESTORS CLASS |
10 Year Comparison of the Change in Value of a $10,000
Investment in Conestoga Small Cap Fund – Investors Class
versus the Russell 2000® Growth Index

Average Annual Total Returns for the Periods Ended September 30, 2021 |
|||||||
1 Year |
3 Years |
5 Years |
10 Years |
15 Years |
Since |
||
Conestoga Small Cap Fund - Investors Class |
37.70% |
13.56% |
19.62% |
17.36% |
12.57% |
13.34% |
|
Russell 2000® Growth Index |
33.27% |
11.70% |
15.34% |
15.74% |
10.59% |
12.16% |
|
The Fund’s past performance does not predict its future performance. The graph and table shown above do not reflect the deduction of taxes that a shareholder would pay on Fund distributions or the redemption of Fund shares but does reflect the reinvestment of all dividends and distributions. The Fund’s benchmark, the Russell 2000® Growth Index, measures the performance of the small-cap growth segment of the U.S. equity universe. It includes those Russell 2000® companies with higher price-to-value ratios and higher forecasted growth values. The Russell 2000® Index measures the performance of the small-cap segment of the U.S. equity universe. The Russell 2000® Index is a subset of the Russell 3000® Index representing approximately 10% of the total market capitalization of that index. It includes approximately 2000 of the smallest securities in the Russell 3000® Index based on a combination of their market capitalization and current index membership.
9
CONESTOGA SMID CAP FUND - INSTITUTIONAL CLASS |
Comparison of the Change in Value of a $250,000 Investment in
Conestoga SMid Cap Fund – Institutional Class (since inception on 12/15/2014) versus the Russell 2500® Growth Index

Average Annual Total Returns for the Periods Ended September 30, 2021 |
|||||
1 Year |
3 Years |
5 Years |
Since |
||
Conestoga SMid Cap Fund - Institutional Class |
35.46% |
16.16% |
21.83% |
17.59% |
|
Russell 2500® Growth Index |
31.98% |
16.01% |
18.21% |
15.02% |
|
The Fund’s past performance does not predict its future performance. The graph and table shown above do not reflect the deduction of taxes that a shareholder would pay on Fund distributions or the redemption of Fund shares but does reflect the reinvestment of all dividends and distributions. The Fund’s benchmark, the Russell 2500® Growth Index, measures the performance of the small- to mid-cap growth segment of the U.S. equity universe. It includes those Russell 2500® companies with higher growth earnings potential as defined by Russell’s leading style methodology. The Russell 2500® Index measures the performance of the small- to mid-cap segment of the U.S. equity universe, commonly referred to as “smid” cap. The Russell 2500® Index is a subset of the Russell 3000® Index. It includes approximately 2500 of the smallest securities in the Russell 3000® Index based on a combination of their market capitalization and current index membership.
10
CONESTOGA SMID CAP FUND - INVESTORS CLASS |
Comparison of the Change in Value of a $10,000 Investment in
Conestoga SMid Cap Fund – Investors Class (since inception on 01/21/2014) versus the Russell 2500® Growth Index

Average Annual Total Returns for the Periods Ended September 30, 2021 |
|||||
1 Year |
3 Years |
5 Years |
Since |
||
Conestoga SMid Cap Fund - Investors Class |
35.09% |
15.89% |
21.54% |
13.43% |
|
Russell 2500® Growth Index |
31.98% |
16.01% |
18.21% |
13.25% |
|
The Fund’s past performance does not predict its future performance. The graph and table shown above do not reflect the deduction of taxes that a shareholder would pay on Fund distributions or the redemption of Fund shares but does reflect the reinvestment of all dividends and distributions. The Fund’s benchmark, the Russell 2500® Growth Index, measures the performance of the small- to mid-cap growth segment of the U.S. equity universe. It includes those Russell 2500® companies with higher growth earnings potential as defined by Russell’s leading style methodology. The Russell 2500® Index measures the performance of the small- to mid-cap segment of the U.S. equity universe, commonly referred to as “smid” cap. The Russell 2500® Index is a subset of the Russell 3000® Index. It includes approximately 2500 of the smallest securities in the Russell 3000® Index based on a combination of their market capitalization and current index membership.
11
CONESTOGA MID CAP FUND - INSTITUTIONAL CLASS |
Comparison of the Change in Value of a $250,000 Investment in
Conestoga Mid Cap Fund – Institutional Class (since inception on 6/29/2021)
versus the Russell Midcap® Growth Index

Total Returns for the Period Ended September 30, 2021 |
|||||
Since |
|||||
Conestoga Mid Cap Fund - Institutional Class |
3.20% |
||||
Russell Midcap® Growth Index |
(1.20%) |
||||
The Fund’s past performance does not predict its future performance. The graph and table shown above do not reflect the deduction of taxes that a shareholder would pay on Fund distributions or the redemption of Fund shares but does reflect the reinvestment of all dividends and distributions. The Fund’s benchmark, the Russell Midcap® Growth Index, measures the performance of the mid-cap growth segment of the U.S. equity universe. It includes those Russell Midcap® Index companies with higher price-to-book ratios and higher forecasted growth values. The Russell Midcap® Growth Index is constructed to provide a comprehensive and unbiased barometer of the mid-cap growth market. The index is completely reconstituted annually to ensure larger stocks do not distort the performance and characteristics of the true mid-cap growth market.
12
CONESTOGA MID CAP FUND - INVESTORS CLASS |
Comparison of the Change in Value of a $10,000 Investment in
Conestoga Mid Cap Fund – Investors Class (since inception on 6/29/2021)
versus the Russell Midcap® Growth Index

Total Returns for the Period Ended September 30, 2021 |
|||||
Since |
|||||
Conestoga Mid Cap Fund - Investors Class |
3.10% |
||||
Russell Midcap® Growth Index |
(1.20%) |
||||
The Fund’s past performance does not predict its future performance. The graph and table shown above do not reflect the deduction of taxes that a shareholder would pay on Fund distributions or the redemption of Fund shares but does reflect the reinvestment of all dividends and distributions. The Fund’s benchmark, the Russell Midcap® Growth Index, measures the performance of the mid-cap growth segment of the U.S. equity universe. It includes those Russell Midcap® Index companies with higher price-to-book ratios and higher forecasted growth values. The Russell Midcap® Growth Index is constructed to provide a comprehensive and unbiased barometer of the mid-cap growth market. The index is completely reconstituted annually to ensure larger stocks do not distort the performance and characteristics of the true mid-cap growth market.
13
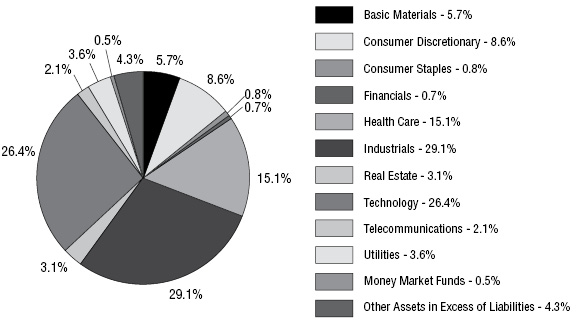
CONESTOGA SMALL CAP FUND |
Diversification*
(% of Net Assets)
Top Ten Equity Holdings
Security Description |
% of Net Assets |
|
SPS Commerce, Inc. |
4.2% |
|
Casella Waste Systems, Inc. - Class A |
3.6% |
|
Descartes Systems Group, Inc. (The) |
3.5% |
|
Fox Factory Holding Corporation |
3.5% |
|
Repligen Corporation |
3.4% |
|
SiteOne Landscape Supply, Inc. |
3.4% |
|
Exponent, Inc. |
3.1% |
|
FirstService Corporation |
3.1% |
|
Paylocity Holding Corporation |
3.1% |
|
Omnicell, Inc. |
2.9% |
* |
Industry categories represent the industry assigned at the time of purchase. See Note 7 of the Notes to Financial Statements. |
14
CONESTOGA SMALL CAP FUND |
||||||||
COMMON STOCKS — 95.2% |
Shares |
Value |
||||||
Basic Materials — 5.7% |
||||||||
Metal Fabricating — 3.5% |
||||||||
Omega Flex, Inc. |
374,370 | $ | 53,418,855 | |||||
RBC Bearings, Inc. (a) |
471,550 | 100,062,910 | ||||||
| 153,481,765 | ||||||||
Specialty Chemicals — 2.2% |
||||||||
Balchem Corporation |
639,435 | 92,762,835 | ||||||
Consumer Discretionary — 8.6% |
||||||||
Auto Parts — 0.8% |
||||||||
Dorman Products, Inc. (a) |
390,464 | 36,965,227 | ||||||
Education Services — 0.9% |
||||||||
Grand Canyon Education, Inc. (a) |
445,655 | 39,199,814 | ||||||
Home Improvement Retailers — 3.4% |
||||||||
SiteOne Landscape Supply, Inc. (a) |
740,530 | 147,713,519 | ||||||
Recreational Products — 3.5% |
||||||||
Fox Factory Holding Corporation (a) |
1,039,513 | 150,251,209 | ||||||
Consumer Staples — 0.8% |
||||||||
Nondurable Household Products — 0.8% |
||||||||
WD-40 Company |
160,293 | 37,104,624 | ||||||
Financials — 0.7% |
||||||||
Financial Data Providers — 0.7% |
||||||||
Computer Services, Inc. |
521,251 | 30,753,809 | ||||||
Health Care — 15.1% |
||||||||
Biotechnology — 1.2% |
||||||||
Vericel Corporation (a) |
1,074,015 | 52,411,932 | ||||||
Health Care Management Services — 0.4% |
||||||||
National Research Corporation |
433,399 | 18,276,436 | ||||||
Health Care Services — 2.9% |
||||||||
Omnicell, Inc. (a) |
859,855 | 127,628,278 | ||||||
15
CONESTOGA SMALL CAP FUND |
||||||||
COMMON STOCKS — 95.2% (Continued) |
Shares |
Value |
||||||
Health Care — 15.1% (Continued) |
||||||||
Medical Equipment — 5.8% |
||||||||
CareDx, Inc. (a) |
534,864 | $ | 33,894,332 | |||||
LeMaitre Vascular, Inc. (b) |
1,274,721 | 67,674,938 | ||||||
Repligen Corporation (a) |
514,735 | 148,753,268 | ||||||
| 250,322,538 | ||||||||
Medical Supplies — 4.8% |
||||||||
Merit Medical Systems, Inc. (a) |
1,490,395 | 107,010,361 | ||||||
Neogen Corporation (a) |
2,316,272 | 100,595,693 | ||||||
| 207,606,054 | ||||||||
Industrials — 29.1% |
||||||||
Building Materials: Other — 5.8% |
||||||||
Hillman Solutions Corporation (a) |
4,957,850 | 59,147,150 | ||||||
Simpson Manufacturing Company, Inc. |
866,415 | 92,680,412 | ||||||
Trex Company, Inc. (a) |
978,485 | 99,736,976 | ||||||
| 251,564,538 | ||||||||
Building: Climate Control — 1.8% |
||||||||
AAON, Inc. |
1,210,050 | 79,064,667 | ||||||
Construction — 2.4% |
||||||||
Construction Partners, Inc. - Class A (a)(b) |
3,117,891 | 104,044,023 | ||||||
Defense — 4.0% |
||||||||
Axon Enterprise, Inc. (a) |
573,110 | 100,305,712 | ||||||
Mercury Systems, Inc. (a) |
1,551,523 | 73,573,221 | ||||||
| 173,878,933 | ||||||||
Diversified Industrials — 1.1% |
||||||||
ESCO Technologies, Inc. |
646,005 | 49,742,385 | ||||||
Electronic Equipment: Control & Filter — 2.0% |
||||||||
Helios Technologies, Inc. |
1,068,207 | 87,710,477 | ||||||
Electronic Equipment: Gauges & Meters — 2.4% |
||||||||
Mesa Laboratories, Inc. (b) |
354,081 | 107,059,931 | ||||||
Engineering & Contracting Services — 3.1% |
||||||||
Exponent, Inc. |
1,196,555 | 135,390,198 | ||||||
Machinery: Construction & Handling — 1.0% |
||||||||
Douglas Dynamics, Inc. (b) |
1,224,465 | 44,448,079 | ||||||
16
CONESTOGA SMALL CAP FUND |
||||||||
COMMON STOCKS — 95.2% (Continued) |
Shares |
Value |
||||||
Industrials — 29.1% (Continued) |
||||||||
Machinery: Industrial — 2.4% |
||||||||
EVI Industries, Inc. (a) |
519,322 | $ | 14,125,558 | |||||
John Bean Technologies Corporation |
631,180 | 88,712,349 | ||||||
| 102,837,907 | ||||||||
Professional Business Support Services — 3.1% |
||||||||
Paylocity Holding Corporation (a) |
476,745 | 133,679,298 | ||||||
Real Estate — 3.1% |
||||||||
Real Estate Services — 3.1% |
||||||||
FirstService Corporation |
748,560 | 135,100,109 | ||||||
Technology — 26.4% |
||||||||
Computer Services — 1.4% |
||||||||
Workiva, Inc. (a) |
443,300 | 62,487,568 | ||||||
Consumer Digital Services — 0.8% |
||||||||
Shutterstock, Inc. |
320,805 | 36,353,623 | ||||||
Electronic Components — 1.3% |
||||||||
Rogers Corporation (a) |
295,960 | 55,190,621 | ||||||
Production Technology Equipment — 4.6% |
||||||||
Brooks Automation, Inc. |
827,000 | 84,643,450 | ||||||
Novanta, Inc. (a) |
731,020 | 112,942,590 | ||||||
| 197,586,040 | ||||||||
Software — 18.3% |
||||||||
Altair Engineering, Inc. - Class A (a) |
1,453,555 | 100,208,082 | ||||||
BlackLine, Inc. (a) |
953,840 | 112,610,350 | ||||||
Descartes Systems Group, Inc. (The) (a) |
1,851,846 | 150,481,006 | ||||||
Model N, Inc. (a)(b) |
2,553,844 | 85,553,774 | ||||||
PROS Holdings, Inc. (a) |
1,436,840 | 50,979,083 | ||||||
Q2 Holdings, Inc. (a) |
600,640 | 48,135,289 | ||||||
Simulations Plus, Inc. |
905,596 | 35,771,042 | ||||||
SPS Commerce, Inc. (a) |
1,123,580 | 181,244,690 | ||||||
Vertex, Inc. - Class A (a) |
1,682,790 | 32,343,224 | ||||||
| 797,326,540 | ||||||||
Telecommunications — 2.1% |
||||||||
Telecommunications Equipment — 2.1% |
||||||||
Vocera Communications, Inc. (a)(b) |
2,004,504 | 91,726,103 | ||||||
17
CONESTOGA SMALL CAP FUND |
||||||||
COMMON STOCKS — 95.2% (Continued) |
Shares |
Value |
||||||
Utilities — 3.6% |
||||||||
Waste & Disposal Services — 3.6% |
||||||||
Casella Waste Systems, Inc. - Class A (a) |
2,045,385 | $ | 155,326,537 | |||||
Total Common Stocks (Cost $2,153,519,264) |
$ | 4,144,995,617 | ||||||
|
||||||||
MONEY MARKET FUNDS — 0.5% |
Shares |
Value |
||||||
Fidelity Investments Treasury Only Portfolio - Institutional Shares, 0.01% (c) (Cost $20,857,171) |
20,857,171 | $ | 20,857,171 | |||||
Total Investments at Value — 95.7% (Cost $2,174,376,435) |
$ | 4,165,852,788 | ||||||
Other Assets in Excess of Liabilities — 4.3% |
188,570,334 | |||||||
Net Assets — 100.0% |
$ | 4,354,423,122 | ||||||
(a) |
Non-income producing security. |
(b) |
The Fund owned 5% or more of the company’s outstanding voting shares thereby making the company an affiliate of the Fund as that term is defined in the Investment Company Act of 1940 (Note 5). |
(c) |
The rate shown is the 7-day effective yield as of September 30, 2021. |
Schedule of Investments uses the Russell ICB Industry and Sector classification. |
|
See accompanying notes to financial statements. |
|
18
CONESTOGA SMID CAP FUND |
Diversification*
(% of Net Assets)

Top Ten Equity Holdings
Security Description |
% of Net Assets |
|
Casella Waste Systems, Inc. - Class A |
3.9% |
|
Exponent, Inc. |
3.4% |
|
Omnicell, Inc. |
3.4% |
|
Repligen Corporation |
3.3% |
|
West Pharmaceutical Services, Inc. |
3.1% |
|
Bio-Techne Corporation |
3.0% |
|
Pool Corporation |
2.8% |
|
Descartes Systems Group, Inc. (The) |
2.7% |
|
FirstService Corporation |
2.6% |
|
SPS Commerce, Inc. |
2.5% |
* |
Industry categories represent the industry assigned at the time of purchase. See Note 7 of the Notes to Financial Statements. |
19
CONESTOGA SMID CAP FUND |
||||||||
COMMON STOCKS — 95.0% |
Shares |
Value |
||||||
Basic Materials — 3.2% |
||||||||
Metal Fabricating — 2.1% |
||||||||
RBC Bearings, Inc. (a) |
40,916 | $ | 8,682,375 | |||||
Specialty Chemicals — 1.1% |
||||||||
Balchem Corporation |
33,375 | 4,841,711 | ||||||
Consumer Discretionary — 15.2% |
||||||||
Consumer Services: Miscellaneous — 4.0% |
||||||||
IAA, Inc. (a) |
118,665 | 6,475,549 | ||||||
Rollins, Inc. |
289,937 | 10,243,474 | ||||||
| 16,719,023 | ||||||||
Education Services — 2.8% |
||||||||
Bright Horizons Family Solutions, Inc. (a) |
65,620 | 9,148,740 | ||||||
Grand Canyon Education, Inc. (a) |
28,395 | 2,497,624 | ||||||
| 11,646,364 | ||||||||
Home Improvement Retailers — 2.5% |
||||||||
SiteOne Landscape Supply, Inc. (a) |
52,145 | 10,401,363 | ||||||
Hotels & Motels — 2.0% |
||||||||
Vail Resorts, Inc. (a) |
25,620 | 8,558,361 | ||||||
Recreational Products — 2.8% |
||||||||
Pool Corporation |
27,370 | 11,889,802 | ||||||
Recreational Vehicles & Boats — 1.1% |
||||||||
LCI Industries |
34,625 | 4,661,564 | ||||||
Health Care — 20.4% |
||||||||
Health Care Services — 5.0% |
||||||||
Definitive Healthcare Corporation (a) |
37,795 | 1,618,760 | ||||||
Health Catalyst, Inc. (a) |
101,205 | 5,061,262 | ||||||
Omnicell, Inc. (a) |
96,035 | 14,254,475 | ||||||
| 20,934,497 | ||||||||
Medical Equipment — 4.1% |
||||||||
CareDx, Inc. (a) |
56,314 | 3,568,618 | ||||||
Repligen Corporation (a) |
47,980 | 13,865,740 | ||||||
| 17,434,358 | ||||||||
20
CONESTOGA SMID CAP FUND |
||||||||
COMMON STOCKS — 95.0% (Continued) |
Shares |
Value |
||||||
Health Care — 20.4% (Continued) |
||||||||
Medical Supplies — 11.3% |
||||||||
Bio-Techne Corporation |
26,070 | $ | 12,632,740 | |||||
Merit Medical Systems, Inc. (a) |
96,038 | 6,895,528 | ||||||
Neogen Corporation (a) |
160,086 | 6,952,535 | ||||||
Teleflex, Inc. |
21,265 | 8,007,336 | ||||||
West Pharmaceutical Services, Inc. |
31,019 | 13,168,806 | ||||||
| 47,656,945 | ||||||||
Industrials — 30.5% |
||||||||
Aerospace — 1.6% |
||||||||
HEICO Corporation - Class A |
55,755 | 6,603,065 | ||||||
Building Materials: Other — 6.2% |
||||||||
Hillman Solutions Corporation (a) |
368,010 | 4,390,359 | ||||||
Simpson Manufacturing Company, Inc. |
45,915 | 4,911,528 | ||||||
Trex Company, Inc. (a) |
94,090 | 9,590,594 | ||||||
Watsco, Inc. |
27,130 | 7,179,141 | ||||||
| 26,071,622 | ||||||||
Construction — 2.2% |
||||||||
Construction Partners, Inc. - Class A (a) |
283,765 | 9,469,238 | ||||||
Containers & Packaging — 1.1% |
||||||||
AptarGroup, Inc. |
40,130 | 4,789,515 | ||||||
Defense — 4.0% |
||||||||
Axon Enterprise, Inc. (a) |
56,545 | 9,896,506 | ||||||
Mercury Systems, Inc. (a) |
145,825 | 6,915,022 | ||||||
| 16,811,528 | ||||||||
Electronic Equipment: Gauges & Meters — 1.8% |
||||||||
Cognex Corporation |
94,785 | 7,603,653 | ||||||
Engineering & Contracting Services — 3.4% |
||||||||
Exponent, Inc. |
127,405 | 14,415,876 | ||||||
Machinery: Construction & Handling — 1.1% |
||||||||
Douglas Dynamics, Inc. |
127,557 | 4,630,319 | ||||||
Machinery: Engines — 1.8% |
||||||||
Generac Holdings, Inc. (a) |
18,400 | 7,519,528 | ||||||
21
CONESTOGA SMID CAP FUND |
||||||||
COMMON STOCKS — 95.0% (Continued) |
Shares |
Value |
||||||
Industrials — 30.5% (Continued) |
||||||||
Machinery: Industrial — 2.2% |
||||||||
EVI Industries, Inc. (a) |
82,850 | $ | 2,253,520 | |||||
John Bean Technologies Corporation |
48,605 | 6,831,433 | ||||||
| 9,084,953 | ||||||||
Machinery: Specialty — 1.8% |
||||||||
Graco, Inc. |
109,540 | 7,664,514 | ||||||
Professional Business Support Services — 1.3% |
||||||||
Fair Isaac Corporation (a) |
13,970 | 5,559,082 | ||||||
Transaction Processing Services — 2.0% |
||||||||
Jack Henry & Associates, Inc. |
52,320 | 8,583,619 | ||||||
Real Estate — 2.6% |
||||||||
Real Estate Services — 2.6% |
||||||||
FirstService Corporation |
60,510 | 10,920,845 | ||||||
Technology — 19.2% |
||||||||
Computer Services — 5.4% |
||||||||
Gartner, Inc. (a) |
25,670 | 7,800,600 | ||||||
Tyler Technologies, Inc. (a) |
19,830 | 9,095,030 | ||||||
Workiva, Inc. (a) |
40,115 | 5,654,610 | ||||||
| 22,550,240 | ||||||||
Production Technology Equipment — 1.1% |
||||||||
Novanta, Inc. (a) |
30,600 | 4,727,700 | ||||||
Software — 12.7% |
||||||||
Altair Engineering, Inc. - Class A (a) |
82,570 | 5,692,376 | ||||||
Avalara, Inc. (a) |
38,455 | 6,720,780 | ||||||
Descartes Systems Group, Inc. (The) (a) |
141,875 | 11,528,763 | ||||||
Guidewire Software, Inc. (a) |
65,745 | 7,815,108 | ||||||
Lightspeed Commerce, Inc. (a) |
68,765 | 6,631,009 | ||||||
Q2 Holdings, Inc. (a) |
60,265 | 4,829,637 | ||||||
SPS Commerce, Inc. (a) |
65,084 | 10,498,700 | ||||||
| 53,716,373 | ||||||||
22
CONESTOGA SMID CAP FUND |
||||||||
COMMON STOCKS — 95.0% (Continued) |
Shares |
Value |
||||||
Utilities — 3.9% |
||||||||
Waste & Disposal Services — 3.9% |
||||||||
Casella Waste Systems, Inc. - Class A (a) |
217,875 | $ | 16,545,427 | |||||
Total Investments at Value — 95.0% (Cost $253,040,216) |
400,693,460 | |||||||
Other Assets in Excess of Liabilities — 5.0% |
20,973,717 | |||||||
Net Assets — 100.0% |
$ | 421,667,177 | ||||||
(a) |
Non-income producing security. |
Schedule of Investments uses the Russell ICB Industry and Sector classification. |
|
See accompanying notes to financial statements. |
|
23
CONESTOGA MID CAP FUND |
Diversification*
(% of Net Assets)

Top Ten Equity Holdings
Security Description |
% of Net Assets |
|
West Pharmaceutical Services, Inc. |
5.8% |
|
Copart, Inc. |
5.2% |
|
Fortinet, Inc. |
4.1% |
|
Bio-Techne Corporation |
3.9% |
|
CoStar Group, Inc. |
3.9% |
|
Align Technology, Inc. |
3.8% |
|
ANSYS, Inc. |
3.4% |
|
Pool Corporation |
3.2% |
|
Gartner, Inc. |
3.2% |
|
Verisk Analytics, Inc. |
3.2% |
* |
Industry categories represent the industry assigned at the time of purchase. See Note 7 of the Notes to Financial Statements. |
24
CONESTOGA MID CAP FUND |
||||||||
COMMON STOCKS — 98.5% |
Shares |
Value |
||||||
Basic Materials — 1.5% |
||||||||
Metal Fabricating — 1.5% |
||||||||
Fastenal Company |
495 | $ | 25,547 | |||||
Consumer Discretionary — 18.7% |
||||||||
Consumer Services: Miscellaneous — 8.1% |
||||||||
Copart, Inc. (a) |
655 | 90,863 | ||||||
Rollins, Inc. |
1,395 | 49,285 | ||||||
| 140,148 | ||||||||
Education Services — 2.1% |
||||||||
Bright Horizons Family Solutions, Inc. (a) |
265 | 36,946 | ||||||
Hotels & Motels — 2.6% |
||||||||
Vail Resorts, Inc. (a) |
135 | 45,097 | ||||||
Recreational Products — 3.2% |
||||||||
Pool Corporation |
130 | 56,473 | ||||||
Specialty Retail — 2.7% |
||||||||
Tractor Supply Company |
230 | 46,600 | ||||||
Financials — 2.5% |
||||||||
Financial Data Providers — 2.5% |
||||||||
FactSet Research Systems, Inc. |
110 | 43,426 | ||||||
Health Care — 25.8% |
||||||||
Health Care Services — 3.0% |
||||||||
Veeva Systems, Inc. - Class A (a) |
180 | 51,871 | ||||||
Medical Equipment — 6.5% |
||||||||
IDEXX Laboratories, Inc. (a) |
90 | 55,971 | ||||||
Masimo Corporation (a) |
105 | 28,425 | ||||||
STERIS plc |
140 | 28,599 | ||||||
| 112,995 | ||||||||
Medical Supplies — 16.3% |
||||||||
Align Technology, Inc. (a) |
100 | 66,543 | ||||||
Bio-Techne Corporation |
140 | 67,839 | ||||||
Teleflex, Inc. |
130 | 48,952 | ||||||
West Pharmaceutical Services, Inc. |
235 | 99,766 | ||||||
| 283,100 | ||||||||
25
CONESTOGA MID CAP FUND |
||||||||
COMMON STOCKS — 98.5% (Continued) |
Shares |
Value |
||||||
Industrials — 18.8% |
||||||||
Aerospace — 3.0% |
||||||||
HEICO Corporation - Class A |
435 | $ | 51,517 | |||||
Containers & Packaging — 2.0% |
||||||||
Ball Corporation |
390 | 35,088 | ||||||
Electronic Equipment: Gauges & Meters — 1.5% |
||||||||
Cognex Corporation |
320 | 25,670 | ||||||
Electronic Equipment: Pollution Control — 1.6% |
||||||||
Xylem, Inc. |
225 | 27,828 | ||||||
Machinery: Specialty — 2.6% |
||||||||
Graco, Inc. |
635 | 44,431 | ||||||
Professional Business Support Services — 5.2% |
||||||||
TransUnion |
310 | 34,816 | ||||||
Verisk Analytics, Inc. |
280 | 56,076 | ||||||
| 90,892 | ||||||||
Transaction Processing Services — 2.9% |
||||||||
Jack Henry & Associates, Inc. |
310 | 50,859 | ||||||
Real Estate — 3.9% |
||||||||
Real Estate Services — 3.9% |
||||||||
CoStar Group, Inc. (a) |
785 | 67,557 | ||||||
Technology — 24.6% |
||||||||
Computer Services — 5.9% |
||||||||
Gartner, Inc. (a) |
185 | 56,218 | ||||||
Tyler Technologies, Inc. (a) |
100 | 45,865 | ||||||
| 102,083 | ||||||||
Software — 18.7% |
||||||||
ANSYS, Inc. (a) |
175 | 59,579 | ||||||
Avalara, Inc. (a) |
195 | 34,080 | ||||||
Coupa Software, Inc. (a) |
125 | 27,398 | ||||||
Fortinet, Inc. (a) |
245 | 71,549 | ||||||
Guidewire Software, Inc. (a) |
275 | 32,689 | ||||||
Lightspeed Commerce, Inc. (a) |
355 | 34,233 | ||||||
Qualtrics International, Inc. - Class A (a) |
745 | 31,841 | ||||||
Roper Technologies, Inc. |
75 | 33,460 | ||||||
| 324,829 | ||||||||
26
CONESTOGA MID CAP FUND |
||||||||
COMMON STOCKS — 98.5% (Continued) |
Shares |
Value |
||||||
Utilities — 2.7% |
||||||||
Waste & Disposal Services — 2.7% |
||||||||
Waste Connections, Inc. |
365 | $ | 45,964 | |||||
Total Investments at Value — 98.5% (Cost $1,671,900) |
$ | 1,708,921 | ||||||
Other Assets in Excess of Liabilities — 1.5% |
26,096 | |||||||
Net Assets — 100.0% |
$ | 1,735,017 | ||||||
(a) |
Non-income producing security. |
Schedule of Investments uses the Russell ICB Industry and Sector classification. |
|
See accompanying notes to financial statements. |
|
27
CONESTOGA FUNDS |
||||||||||||
|
Conestoga |
Conestoga |
Conestoga |
|||||||||
ASSETS |
||||||||||||
Investments in unaffiliated securities, at cost |
$ | 1,848,128,819 | $ | 253,040,216 | $ | 1,671,900 | ||||||
Investments in affiliated securities, at cost |
326,247,616 | — | — | |||||||||
Total investments, at cost |
$ | 2,174,376,435 | $ | 253,040,216 | $ | 1,671,900 | ||||||
Investments in unaffiliated securities, at value (Note 2) |
$ | 3,665,345,940 | $ | 400,693,460 | $ | 1,708,921 | ||||||
Investments in affiliated securities, at value (Notes 2 & 5) |
500,506,848 | — | — | |||||||||
Total investments, at value |
4,165,852,788 | 400,693,460 | 1,708,921 | |||||||||
Cash (Note 2) |
207,034,410 | 22,240,799 | 49,117 | |||||||||
Receivable due from Adviser (Note 4) |
— | — | 17,506 | |||||||||
Receivable for capital shares sold |
2,041,608 | 330,819 | 200 | |||||||||
Receivable for investment securities sold |
2,198,206 | — | — | |||||||||
Dividends and interest receivable |
334,362 | 9,512 | — | |||||||||
Other assets |
52,023 | 21,242 | 794 | |||||||||
Total assets |
4,377,513,397 | 423,295,832 | 1,776,538 | |||||||||
LIABILITIES |
||||||||||||
Payable for capital shares redeemed |
2,215,548 | 384,570 | — | |||||||||
Payable for investment securities purchased |
17,385,747 | 870,037 | — | |||||||||
Payable to Adviser (Note 4) |
3,006,015 | 229,413 | — | |||||||||
Accrued distribution fees (Note 4) |
147,878 | — | 342 | |||||||||
Accrued Trustees’ fees (Note 4) |
46,575 | 46,575 | 491 | |||||||||
Payable to administrator (Note 4) |
53,135 | 11,165 | 4,265 | |||||||||
Other accrued expenses |
235,377 | 86,895 | 36,423 | |||||||||
Total liabilities |
23,090,275 | 1,628,655 | 41,521 | |||||||||
NET ASSETS |
$ | 4,354,423,122 | $ | 421,667,177 | $ | 1,735,017 | ||||||
NET ASSETS CONSIST OF: |
||||||||||||
Paid-in capital |
$ | 2,185,678,773 | $ | 278,061,452 | $ | 1,700,258 | ||||||
Accumulated earnings |
2,168,744,349 | 143,605,725 | 34,759 | |||||||||
NET ASSETS |
$ | 4,354,423,122 | $ | 421,667,177 | $ | 1,735,017 | ||||||
NET ASSET VALUE PER SHARE: |
||||||||||||
INSTITUTIONAL CLASS |
||||||||||||
Net assets applicable to Institutional Class |
$ | 3,385,943,013 | $ | 357,478,568 | $ | 1,168,253 | ||||||
Institutional Class shares of beneficial interest outstanding (unlimited number of shares authorized, no par value) |
38,838,223 | 13,681,564 | 113,238 | |||||||||
Net asset value, offering price and redemption price per share (Note 2) |
$ | 87.18 | $ | 26.13 | $ | 10.32 | ||||||
INVESTORS CLASS |
||||||||||||
Net assets applicable to Investors Class |
$ | 968,480,109 | $ | 64,188,609 | $ | 566,764 | ||||||
Investors Class shares of beneficial interest outstanding (unlimited number of shares authorized, no par value) |
11,284,279 | 2,499,826 | 54,975 | |||||||||
Net asset value, offering price and redemption price per share (Note 2) |
$ | 85.83 | $ | 25.68 | $ | 10.31 | ||||||
See accompanying notes to financial statements. |
28
CONESTOGA FUNDS |
||||||||||||
|
Conestoga |
Conestoga |
Conestoga |
|||||||||
INVESTMENT INCOME |
||||||||||||
Dividend income from unaffiliated investments |
$ | 5,833,924 | $ | 1,295,167 | $ | 1,291 | ||||||
Dividend income from affiliated investments (Note 5) |
2,607,157 | — | — | |||||||||
Foreign withholding taxes on dividends |
(79,711 | ) | (6,002 | ) | (10 | ) | ||||||
Interest |
10,581 | 1,078 | 2 | |||||||||
Total investment income |
8,371,951 | 1,290,243 | 1,283 | |||||||||
EXPENSES |
||||||||||||
Investment advisory fees (Note 4) |
35,662,430 | 2,890,168 | 3,298 | |||||||||
Distribution fees - Investors Class (Note 4) |
2,392,397 | 149,999 | 342 | |||||||||
Shareholder Servicing Fees (Note 4) |
||||||||||||
Institutional Class |
1,446,100 | 227,867 | 276 | |||||||||
Investors Class |
478,787 | 30,000 | 68 | |||||||||
Transfer agent fees (Note 4) |
359,331 | 35,973 | 3,067 | |||||||||
Trustees’ fees and expenses (Note 4) |
193,079 | 187,169 | 491 | |||||||||
Fund accounting fees (Note 4) |
274,475 | 85,091 | 9,242 | |||||||||
Legal fees |
143,693 | 144,939 | 26,981 | |||||||||
Custody and bank service fees |
201,225 | 28,379 | 1,478 | |||||||||
Registration and filing fees |
150,489 | 68,618 | 4,000 | |||||||||
Postage and supplies |
85,601 | 13,156 | 380 | |||||||||
Audit and tax services fees |
17,460 | 15,460 | 9,900 | |||||||||
Insurance expense |
31,652 | 2,515 | — | |||||||||
Printing of shareholder reports |
13,262 | 4,573 | 120 | |||||||||
Administration fees (Note 4) |
3,000 | 3,000 | 768 | |||||||||
Organizational costs (Note 1) |
— | — | 4,324 | |||||||||
Other expenses |
23,052 | 17,148 | 3,825 | |||||||||
Total expenses |
41,476,033 | 3,904,055 | 68,560 | |||||||||
Fee reductions and expense reimbursements by the Adviser (Note 4) |
(3,899,668 | ) | (863,983 | ) | (64,920 | ) | ||||||
Net expenses |
37,576,365 | 3,040,072 | 3,640 | |||||||||
NET INVESTMENT LOSS |
$ | (29,204,414 | ) | $ | (1,749,829 | ) | $ | (2,357 | ) | |||
(a) |
Represents the period from commencement of operations (June 29, 2021) through September 30, 2021. |
29
CONESTOGA FUNDS |
||||||||||||
|
Conestoga |
Conestoga |
Conestoga |
|||||||||
REALIZED AND UNREALIZED GAINS (LOSSES) ON INVESTMENTS |
||||||||||||
Net realized gains from unaffiliated investments |
$ | 235,876,394 | $ | 7,623,945 | $ | 95 | ||||||
Net realized losses from affiliated investments (Note 5) |
(6,440,761 | ) | — | — | ||||||||
Net change in unrealized appreciation (depreciation) on unaffiliated investments |
839,781,987 | 87,198,122 | 37,021 | |||||||||
Net change in unrealized appreciation (depreciation) on affiliated investments (Note 5) |
122,320,113 | — | — | |||||||||
NET REALIZED AND UNREALIZED GAINS ON INVESTMENTS |
1,191,537,733 | 94,822,067 | 37,116 | |||||||||
NET INCREASE IN NET ASSETS RESULTING FROM OPERATIONS |
$ | 1,162,333,319 | $ | 93,072,238 | $ | 34,759 | ||||||
(a) |
Represents the period from commencement of operations (June 29, 2021) through September 30, 2021. |
See accompanying notes to financial statements. |
|
30
CONESTOGA SMALL CAP FUND |
||||||||
|
Year Ended |
Year Ended |
||||||
FROM OPERATIONS |
||||||||
Net investment loss |
$ | (29,204,414 | ) | $ | (16,568,661 | ) | ||
Net realized gains (losses) from investments |
229,435,633 | (12,405,801 | ) | |||||
Net realized gains from in-kind redemptions |
— | 62,786,700 | ||||||
Net change in unrealized appreciation (depreciation) on investments |
962,102,100 | 253,323,708 | ||||||
Net increase in net assets resulting from operations |
1,162,333,319 | 287,135,946 | ||||||
DISTRIBUTIONS TO SHAREHOLDERS (Note 2) |
||||||||
Institutional Class |
— | (38,621,836 | ) | |||||
Investors Class |
— | (18,459,611 | ) | |||||
Decrease in net assets from distributions to shareholders |
— | (57,081,447 | ) | |||||
CAPITAL SHARE TRANSACTIONS (Note 6) |
||||||||
Institutional Class |
||||||||
Proceeds from shares sold |
783,876,197 | 807,652,870 | ||||||
Reinvestment of distributions to shareholders |
— | 28,194,336 | ||||||
Payments for shares redeemed |
(470,707,498 | ) | (555,771,590 | ) | ||||
Net increase in Institutional Class net assets from capital share transactions |
313,168,699 | 280,075,616 | ||||||
Investors Class |
||||||||
Proceeds from shares sold |
118,468,533 | 128,087,873 | ||||||
Reinvestment of distributions to shareholders |
— | 16,437,261 | ||||||
Payments for shares redeemed |
(248,225,990 | ) | (255,964,837 | ) | ||||
Net decrease in Investors Class net assets from capital share transactions |
(129,757,457 | ) | (111,439,703 | ) | ||||
TOTAL INCREASE IN NET ASSETS |
1,345,744,561 | 398,690,412 | ||||||
|
||||||||
NET ASSETS |
||||||||
Beginning of year |
3,008,678,561 | 2,609,988,149 | ||||||
End of year |
$ | 4,354,423,122 | $ | 3,008,678,561 | ||||
See accompanying notes to financial statements. |
31
CONESTOGA SMID CAP FUND |
||||||||
|
Year Ended |
Year Ended |
||||||
FROM OPERATIONS |
||||||||
Net investment loss |
$ | (1,749,829 | ) | $ | (696,766 | ) | ||
Net realized gains (losses) from investments |
7,623,945 | (9,706,211 | ) | |||||
Net change in unrealized appreciation (depreciation) on investments |
87,198,122 | 40,201,692 | ||||||
Net increase in net assets resulting from operations |
93,072,238 | 29,798,715 | ||||||
DISTRIBUTIONS TO SHAREHOLDERS (Note 2) |
||||||||
Institutional Class |
— | (1,206,661 | ) | |||||
Investors Class |
— | (630,211 | ) | |||||
Decrease in net assets from distributions to shareholders |
— | (1,836,872 | ) | |||||
CAPITAL SHARE TRANSACTIONS (Note 6) |
||||||||
Institutional Class |
||||||||
Proceeds from shares sold |
144,722,264 | 120,337,652 | ||||||
Reinvestment of distributions to shareholders |
— | 1,092,700 | ||||||
Payments for shares redeemed |
(51,920,798 | ) | (36,710,977 | ) | ||||
Net increase in Institutional Class net assets from capital share transactions |
92,801,466 | 84,719,375 | ||||||
Investors Class |
||||||||
Proceeds from shares sold |
15,006,418 | 24,293,664 | ||||||
Reinvestment of distributions to shareholders |
— | 564,960 | ||||||
Payments for shares redeemed |
(18,625,647 | ) | (22,363,356 | ) | ||||
Net increase (decrease) in Investors Class net assets from capital share transactions |
(3,619,229 | ) | 2,495,268 | |||||
TOTAL INCREASE IN NET ASSETS |
182,254,475 | 115,176,486 | ||||||
NET ASSETS |
||||||||
Beginning of year |
239,412,702 | 124,236,216 | ||||||
End of year |
$ | 421,667,177 | $ | 239,412,702 | ||||
See accompanying notes to financial statements. |
32
CONESTOGA MID CAP FUND |
||||
|
Period Ended |
|||
FROM OPERATIONS |
||||
Net investment loss |
$ | (2,357 | ) | |
Net realized gains from investments |
95 | |||
Net change in unrealized appreciation (depreciation) on investments |
37,021 | |||
Net increase in net assets resulting from operations |
34,759 | |||
CAPITAL SHARE TRANSACTIONS (Note 6) |
||||
Institutional Class |
||||
Proceeds from shares sold |
1,145,200 | |||
Investors Class |
||||
Proceeds from shares sold |
614,658 | |||
Payments for shares redeemed |
(59,600 | ) | ||
Net increase in Investors Class net assets from capital share transactions |
555,058 | |||
TOTAL INCREASE IN NET ASSETS |
1,735,017 | |||
NET ASSETS |
||||
Beginning of period |
— | |||
End of period |
$ | 1,735,017 | ||
(a) |
Represents the period from commencement of operations (June 29, 2021) through September 30, 2021. |
See accompanying notes to financial statements. |
|
33
CONESTOGA SMALL CAP FUND |
||||||||||||||||||||
Per Share Data for a Share Outstanding Throughout Each Year: |
||||||||||||||||||||
|
Year |
Year |
Year |
Year |
Year |
|||||||||||||||
Net asset value at beginning of year |
$ | 63.19 | $ | 58.40 | $ | 61.27 | $ | 50.29 | $ | 39.01 | ||||||||||
Income (loss) from investment operations: |
||||||||||||||||||||
Net investment loss (a) |
(0.56 | ) | (0.33 | ) | (0.23 | ) | (0.19 | ) | (0.12 | ) | ||||||||||
Net realized and unrealized gains (losses) on investments |
24.55 | 6.39 | (1.93 | ) | 13.93 | 11.88 | ||||||||||||||
Total from investment operations |
23.99 | 6.06 | (2.16 | ) | 13.74 | 11.76 | ||||||||||||||
Less distributions from net realized gains |
— | (1.27 | ) | (0.71 | ) | (2.76 | ) | (0.48 | ) | |||||||||||
Net asset value at end of year |
$ | 87.18 | $ | 63.19 | $ | 58.40 | $ | 61.27 | $ | 50.29 | ||||||||||
Total return (b) |
37.96 | % | 10.53 | % | (3.39 | %) | 28.75 | % | 30.43 | % | ||||||||||
Net assets at end of year (000,000’s) |
$ | 3,386 | $ | 2,204 | $ | 1,752 | $ | 1,648 | $ | 607 | ||||||||||
Ratios/supplementary data: |
||||||||||||||||||||
Ratio of total expenses to average net assets |
0.98 | % | 1.00 | % | 0.99 | % | 0.99 | % | 1.02 | % | ||||||||||
Ratio of net expenses to average net assets (c) |
0.90 | % | 0.90 | % | 0.90 | % | 0.90 | % | 0.90 | % | ||||||||||
Ratio of net investment loss to average net assets (c) |
(0.69 | %) | (0.56 | %) | (0.41 | %) | (0.37 | %) | (0.28 | %) | ||||||||||
Portfolio turnover rate |
19 | % | 22 | % | 26 | % | 9 | % | 24 | % | ||||||||||
(a) |
Per share net investment loss has been determined on the basis of average number of shares outstanding during the period. |
(b) |
Total return is a measure of the change in value of an investment in the Fund over the periods covered. The returns shown do not reflect the deduction of taxes a shareholder would pay on Fund distributions, if any, or the redemption of Fund shares. The total returns would be lower if the Adviser had not reduced advisory fees and/or reimbursed expenses (Note 4). |
(c) |
Ratio was determined after advisory fee reductions and/or expense reimbursements (Note 4). |
See accompanying notes to financial statements. |
|
34
CONESTOGA SMALL CAP FUND |
||||||||||||||||||||
Per Share Data for a Share Outstanding Throughout Each Year: |
||||||||||||||||||||
|
Year |
Year |
Year |
Year |
Year |
|||||||||||||||
Net asset value at beginning of year |
$ | 62.33 | $ | 57.74 | $ | 60.70 | $ | 49.95 | $ | 38.83 | ||||||||||
Income (loss) from investment operations: |
||||||||||||||||||||
Net investment loss (a) |
(0.70 | ) | (0.44 | ) | (0.33 | ) | (0.30 | ) | (0.20 | ) | ||||||||||
Net realized and unrealized gains (losses) on investments |
24.20 | 6.30 | (1.92 | ) | 13.81 | 11.80 | ||||||||||||||
Total from investment operations |
23.50 | 5.86 | (2.25 | ) | 13.51 | 11.60 | ||||||||||||||
Less distributions from net realized gains |
— | (1.27 | ) | (0.71 | ) | (2.76 | ) | (0.48 | ) | |||||||||||
Net asset value at end of year |
$ | 85.83 | $ | 62.33 | $ | 57.74 | $ | 60.70 | $ | 49.95 | ||||||||||
Total return (b) |
37.70 | % | 10.30 | % | (3.57 | %) | 28.47 | % | 30.16 | % | ||||||||||
Net assets at end of year (000,000’s) |
$ | 968 | $ | 805 | $ | 858 | $ | 1,033 | $ | 702 | ||||||||||
Ratios/supplementary data: |
||||||||||||||||||||
Ratio of total expenses to average net assets |
1.25 | % | 1.28 | % | 1.27 | % | 1.29 | % | 1.34 | % | ||||||||||
Ratio of net expenses to average net assets (c) |
1.10 | % | 1.10 | % | 1.10 | % | 1.10 | % | 1.10 | % | ||||||||||
Ratio of net investment loss to average net assets (c) |
(0.89 | %) | (0.75 | %) | (0.60 | %) | (0.56 | %) | (0.48 | %) | ||||||||||
Portfolio turnover rate |
19 | % | 22 | % | 26 | % | 9 | % | 24 | % | ||||||||||
(a) |
Per share net investment loss has been determined on the basis of average number of shares outstanding during the period. |
(b) |
Total return is a measure of the change in value of an investment in the Fund over the periods covered. The returns shown do not reflect the deduction of taxes a shareholder would pay on Fund distributions, if any, or the redemption of Fund shares. The total returns would be lower if the Adviser had not reduced advisory fees and/or reimbursed expenses (Note 4). |
(c) |
Ratio was determined after advisory fee reductions and/or expense reimbursements (Note 4). |
See accompanying notes to financial statements. |
|
35
CONESTOGA SMID CAP FUND |
||||||||||||||||||||
Per Share Data for a Share Outstanding Throughout Each Year: |
||||||||||||||||||||
|
Year |
Year |
Year |
Year |
Year |
|||||||||||||||
Net asset value at beginning of year |
$ | 19.29 | $ | 17.18 | $ | 17.05 | $ | 12.80 | $ | 9.99 | ||||||||||
Income (loss) from investment operations: |
||||||||||||||||||||
Net investment loss (a) |
(0.11 | ) | (0.06 | ) | (0.03 | ) | (0.06 | ) | (0.05 | ) | ||||||||||
Net realized and unrealized gains on investments |
6.95 | 2.40 | 0.30 | 4.35 | 2.86 | |||||||||||||||
Total from investment operations |
6.84 | 2.34 | 0.27 | 4.29 | 2.81 | |||||||||||||||
Less distributions from net realized gains |
— | (0.23 | ) | (0.14 | ) | (0.04 | ) | — | ||||||||||||
Net asset value at end of year |
$ | 26.13 | $ | 19.29 | $ | 17.18 | $ | 17.05 | $ | 12.80 | ||||||||||
Total return (b) |
35.46 | % | 13.76 | % | 1.72 | % | 33.64 | % | 28.13 | % | ||||||||||
Net assets at end of year (000’s) |
$ | 357,479 | $ | 188,836 | $ | 80,814 | $ | 45,210 | $ | 21,653 | ||||||||||
Ratios/supplementary data: |
||||||||||||||||||||
Ratio of total expenses to average net assets |
1.10 | % | 1.26 | % | 1.39 | % | 1.62 | % | 2.11 | % | ||||||||||
Ratio of net expenses to average net assets (c)(d) |
0.85 | % | 0.85 | % | 0.85 | % | 0.86 | % | 0.96 | % | ||||||||||
Ratio of net investment loss to average net assets (c) |
(0.47 | %) | (0.34 | %) | (0.20 | %) | (0.37 | %) | (0.47 | %) | ||||||||||
Portfolio turnover rate |
17 | % | 11 | % | 37 | % | 8 | % | 24 | % | ||||||||||
(a) |
Per share net investment loss has been determined on the basis of average number of shares outstanding during the period. |
(b) |
Total return is a measure of the change in value of an investment in the Fund over the periods covered. The returns shown do not reflect the deduction of taxes a shareholder would pay on Fund distributions, if any, or the redemption of Fund shares. The total returns would be lower if the Adviser had not reduced advisory fees and/or reimbursed expenses (Note 4). |
(c) |
Ratio was determined after advisory fee reductions and/or expense reimbursements (Note 4). |
(d) |
Effective January 31, 2018, the Adviser has agreed to reduce its advisory fees and reimburse other expenses in order to limit annual operating expenses to 0.85% of the average daily net assets allocable to Institutional Class Shares. Between January 31, 2017 and January 31, 2018, the expense limitation had been 0.90%. Prior to January 31, 2017, the expense limitation had been 1.10%. |
See accompanying notes to financial statements. |
|
36
CONESTOGA SMID CAP FUND |
||||||||||||||||||||
Per Share Data for a Share Outstanding Throughout Each Year: |
||||||||||||||||||||
|
Year |
Year |
Year |
Year |
Year |
|||||||||||||||
Net asset value at beginning of year |
$ | 19.01 | $ | 16.97 | $ | 16.88 | $ | 12.71 | $ | 9.94 | ||||||||||
Income (loss) from investment operations: |
||||||||||||||||||||
Net investment loss (a) |
(0.17 | ) | (0.10 | ) | (0.07 | ) | (0.09 | ) | (0.08 | ) | ||||||||||
Net realized and unrealized gains on investments |
6.84 | 2.37 | 0.30 | 4.30 | 2.85 | |||||||||||||||
Total from investment operations |
6.67 | 2.27 | 0.23 | 4.21 | 2.77 | |||||||||||||||
Less distributions from net realized gains |
— | (0.23 | ) | (0.14 | ) | (0.04 | ) | — | ||||||||||||
Net asset value at end of year |
$ | 25.68 | $ | 19.01 | $ | 16.97 | $ | 16.88 | $ | 12.71 | ||||||||||
Total return (b) |
35.09 | % | 13.52 | % | 1.50 | % | 33.25 | % | 27.87 | % | ||||||||||
Net assets at end of year (000’s) |
$ | 64,189 | $ | 50,577 | $ | 43,422 | $ | 38,680 | $ | 3,388 | ||||||||||
Ratios/supplementary data: |
||||||||||||||||||||
Ratio of total expenses to average net assets |
1.36 | % | 1.51 | % | 1.64 | % | 1.95 | % | 3.04 | % | ||||||||||
Ratio of net expenses to average net assets (c)(d) |
1.10 | % | 1.10 | % | 1.10 | % | 1.10 | % | 1.20 | % | ||||||||||
Ratio of net investment loss to average net assets (c) |
(0.71 | %) | (0.57 | %) | (0.45 | %) | (0.62 | %) | (0.73 | %) | ||||||||||
Portfolio turnover rate |
17 | % | 11 | % | 37 | % | 8 | % | 24 | % | ||||||||||
(a) |
Per share net investment loss has been determined on the basis of average number of shares outstanding during the period. |
(b) |
Total return is a measure of the change in value of an investment in the Fund over the periods covered. The returns shown do not reflect the deduction of taxes a shareholder would pay on Fund distributions, if any, or the redemption of Fund shares. The total returns would be lower if the Adviser had not reduced advisory fees and/or reimbursed expenses (Note 4). |
(c) |
Ratio was determined after advisory fee reductions and/or expense reimbursements (Note 4). |
(d) |
Effective January 31, 2018, the Adviser has agreed to reduce its advisory fees and reimburse other expenses in order to limit annual operating expenses to 1.10% of the average daily net assets allocable to Investors Class Shares. Between January 31, 2017 and January 31, 2018, the expense limitation had been 1.15%. Prior to January 31, 2017, the expense limitation had been 1.35%. |
See accompanying notes to financial statements. |
|
37
CONESTOGA MID CAP FUND |
||||
Per Share Data for a Share Outstanding Throughout the Period: |
||||
|
Period |
|||
Net asset value at beginning of period |
$ | 10.00 | ||
Income (loss) from investment operations: |
||||
Net investment loss (b) |
(0.01 | ) | ||
Net realized and unrealized gains on investments |
0.33 | |||
Total from investment operations |
0.32 | |||
Net asset value at end of period |
$ | 10.32 | ||
Total return (c) |
3.20 | %(d) | ||
Net assets at end of period (000’s) |
$ | 1,168 | ||
Ratios/supplementary data: |
||||
Ratio of total expenses to average net assets |
16.18 | %(e) | ||
Ratio of net expenses to average net assets (f) |
0.80 | %(e) | ||
Ratio of net investment loss to average net assets (f) |
(0.50 | %)(e) | ||
Portfolio turnover rate |
1 | %(d) | ||
(a) |
Represents the period from the commencement of operations (June 29, 2021) through September 30, 2021. |
(b) |
Per share net investment loss has been determined on the basis of average number of shares outstanding during the period. |
(c) |
Total return is a measure of the change in value of an investment in the Fund over the period covered. The return shown does not reflect the deduction of taxes a shareholder would pay on Fund distributions, if any, or the redemption of Fund shares. The total return would be lower if the Adviser had not reduced advisory fees and/or reimbursed expenses (Note 4). |
(d) |
Not annualized. |
(e) |
Annualized. |
(f) |
Ratio was determined after advisory fee reductions and/or expense reimbursements (Note 4). |
See accompanying notes to financial statements. |
|
38
CONESTOGA MID CAP FUND |
||||
Per Share Data for a Share Outstanding Throughout the Period: |
||||
|
Period |
|||
Net asset value at beginning of period |
$ | 10.00 | ||
Income (loss) from investment operations: |
||||
Net investment loss (b) |
(0.02 | ) | ||
Net realized and unrealized gains on investments |
0.33 | |||
Total from investment operations |
0.31 | |||
Net asset value at end of period |
$ | 10.31 | ||
Total return (c) |
3.10 | %(d) | ||
Net assets at end of period (000’s) |
$ | 567 | ||
Ratios/supplementary data: |
||||
Ratio of total expenses to average net assets |
17.54 | %(e) | ||
Ratio of net expenses to average net assets (f) |
1.05 | %(e) | ||
Ratio of net investment loss to average net assets (f) |
(0.73 | %)(e) | ||
Portfolio turnover rate |
1 | %(d) | ||
(a) |
Represents the period from the commencement of operations (June 29, 2021) through September 30, 2021. |
(b) |
Per share net investment loss has been determined on the basis of average number of shares outstanding during the period. |
(c) |
Total return is a measure of the change in value of an investment in the Fund over the period covered. The return shown does not reflect the deduction of taxes a shareholder would pay on Fund distributions, if any, or the redemption of Fund shares. The total return would be lower if the Adviser had not reduced advisory fees and/or reimbursed expenses (Note 4). |
(d) |
Not annualized. |
(e) |
Annualized. |
(f) |
Ratio was determined after advisory fee reductions and/or expense reimbursements (Note 4). |
See accompanying notes to financial statements. |
|
39
CONESTOGA FUNDS
NOTES TO FINANCIAL STATEMENTS
September 30, 2021
1. Organization
Conestoga Funds (the “Trust”) was organized as a Delaware statutory trust on February 5, 2002. The Trust consists of three series, the Conestoga Small Cap Fund (the “Small Cap Fund”), the Conestoga SMid Cap Fund (the “SMid Cap Fund”), and the Conestoga Mid Cap Fund (the “Mid Cap Fund”) (individually, a “Fund” and collectively, the “Funds”). The Trust is registered as an open-end diversified management investment company of the series type under the Investment Company Act of 1940, as amended (the “1940 Act”). Each Fund’s investment objective is to achieve long-term growth of capital. Each Fund currently offers two classes of shares, Institutional Class and Investors Class. The Mid Cap Fund commenced operations on June 29, 2021.
Each Fund’s two classes of shares represent interests in the same portfolio of investments, and have the same rights, but the share classes differ primarily in the expenses to which they are subject and have differing investment minimums. Institutional Class shares are sold without any sales loads or distribution fees but are subject to a shareholder servicing fee of up to 0.10% of the average daily net assets allocable to Institutional Class shares and require a $250,000 initial investment. Investors Class shares are sold without any sales loads but are subject to a distribution fee of up to 0.25% and a shareholder servicing fee of up to 0.25% of the average daily net assets allocable to Investors Class shares and require a $2,500 initial investment. The Board of Trustees of the Trust (the “Board”) has determined to limit the shareholder servicing fees paid by Investors Class shares of each Fund to 0.05% of the average daily net assets allocable to Investors Class shares until at least September 30, 2022.
The organizational costs for the Mid Cap Fund totaled $4,324 and were charged to expenses as incurred. These costs are eligible for recoupment by the Conestoga Capital Advisors, LLC (the “Adviser”) within two years of the Mid Cap Fund’s commencement date of operations.
2. Significant Accounting Policies
The following is a summary of the Funds’ significant accounting policies. These policies are in conformity with accounting principles generally accepted in the United States of America (“GAAP”). The Funds follow accounting and reporting guidance under Financial Accounting Standards Board Accounting Standards Codification Topic 946, “Financial Services – Investment Companies.”
Securities valuation – Each Fund values its portfolio securities at market value as of the close of regular trading on the New York Stock Exchange, Inc. (the “NYSE”) (normally 4:00 p.m. Eastern time) on each business day the NYSE is open for business. The Funds value their listed securities on the basis of the security’s last sale price on the security’s primary exchange, if available, otherwise at the exchange’s most recently quoted bid price. NASDAQ-listed securities are valued at the NASDAQ Official Closing Price. Investments representing shares of other open-end investment companies, including money market
40
CONESTOGA FUNDS
NOTES TO FINANCIAL STATEMENTS (Continued)
funds, are valued at their net asset value (“NAV”) as reported by such companies. When using a quoted price and when the market is considered active, the security will be classified as Level 1 within the fair value hierarchy (see below). In the event that market quotations are not readily available or are considered unreliable due to market or other events, the Funds value their securities and other assets at fair value, as determined in good faith by the Trust’s officers, in accordance with procedures established by and under the general supervision of the Board. Under these procedures, the securities will be classified as Level 2 or 3 within the fair value hierarchy, depending on the inputs used. Unavailable or unreliable market quotes may be due to the following factors: a substantial bid-ask spread; infrequent sales resulting in stale prices; insufficient trading volume; small trade sizes; a temporary lapse in any reliable pricing source; and actions of the securities or futures markets, such as the suspension or limitation of trading. As a result, the prices of securities used to calculate each Fund’s NAV may differ from quoted or published prices for the same securities.
GAAP establishes a single authoritative definition of fair value, sets out a framework for measuring fair value, and requires additional disclosures about fair value measurements.
Various inputs are used in determining the value of each Fund’s investments. These inputs are summarized in the three broad levels listed below:
|
● |
Level 1 – quoted prices in active markets for identical securities |
|
● |
Level 2 – other significant observable inputs |
|
● |
Level 3 – significant unobservable inputs |
The inputs or methods used for valuing securities are not necessarily an indication of the risks associated with investing in those securities. The inputs used to measure fair value may fall into different levels of the fair value hierarchy. In such cases, for disclosure purposes, the level in the fair value hierarchy within which the fair value measurement falls in its entirety is determined based on the lowest level input that is significant to the fair value measurement.
The following is a summary of the Funds’ investments based on the inputs used to value the investments as of September 30, 2021:
Conestoga Small Cap Fund |
Level 1 |
Level 2 |
Level 3 |
Total |
||||||||||||
Common Stocks |
$ | 4,144,995,617 | $ | — | $ | — | $ | 4,144,995,617 | ||||||||
Money Market Funds |
20,857,171 | — | — | 20,857,171 | ||||||||||||
Total |
$ | 4,165,852,788 | $ | — | $ | — | $ | 4,165,852,788 | ||||||||
Conestoga SMid Cap Fund |
Level 1 |
Level 2 |
Level 3 |
Total |
||||||||||||
Common Stocks |
$ | 400,693,460 | $ | — | $ | — | $ | 400,693,460 | ||||||||
Total |
$ | 400,693,460 | $ | — | $ | — | $ | 400,693,460 | ||||||||
41
CONESTOGA FUNDS
NOTES TO FINANCIAL STATEMENTS (Continued)
Conestoga Mid Cap Fund |
Level 1 |
Level 2 |
Level 3 |
Total |
||||||||||||
Common Stocks |
$ | 1,708,921 | $ | — | $ | — | $ | 1,708,921 | ||||||||
Total |
$ | 1,708,921 | $ | — | $ | — | $ | 1,708,921 | ||||||||
Refer to each Fund’s Schedule of Investments for a listing of the common stocks by industry and sector type. The Funds did not hold any derivative instruments or any assets or liabilities that were measured at fair value on a recurring basis using significant unobservable inputs (Level 3) as of or during the year or period ended September 30, 2021.
Share valuation – The NAV per share of each class of each Fund is calculated daily by dividing the total value of the assets attributable to that class, less liabilities attributable to that class, by the number of shares outstanding of that class. The offering price and redemption price per share of each class of each Fund is equal to the NAV per share of such class.
Cash – Each Fund’s cash is held in a bank account with balances which may exceed the amount covered by federal deposit insurance. As of September 30, 2021, the cash balances reflected on the Statements of Assets and Liabilities for each Fund represent the amount held in a deposit sweep account.
Investment income – Dividend income is recorded on the ex-dividend date. Interest income is accrued as earned. Non-cash dividends included in dividend income, if any, are recorded at the fair market value of the security received. Withholding taxes on foreign dividends have been recorded in accordance with the Funds’ understanding of the applicable country’s rules and tax rates.
Investment transactions – Investment transactions are accounted for on the trade date. Realized gains and losses on investments sold are determined on a specific identification basis.
Common expenses – Common expenses of the Trust are allocated between the Funds based on the relative net assets of each Fund or the nature of the services performed and the relative applicability to each Fund.
Distributions to shareholders – Each Fund distributes to its shareholders any net investment income dividends and net realized capital gains distributions at least once each year. The amount of such dividends and distributions are determined in accordance with federal income tax regulations, which may differ from GAAP. Dividends and distributions to shareholders are recorded on the ex-dividend date. There were no distributions paid to shareholders of each Fund for the year or period ended September 30, 2021. The tax character of distributions paid to shareholders of the Small Cap Fund and the SMid Cap Fund during the year ended September 30, 2020 was long-term capital gains.
42
CONESTOGA FUNDS
NOTES TO FINANCIAL STATEMENTS (Continued)
Allocation between classes – Investment income earned, realized capital gains and losses, and unrealized appreciation and depreciation are allocated daily to each class of a Fund based upon its proportionate share of total net assets of that Fund. Class-specific expenses are charged directly to the class incurring the expense. Common expenses that are not attributable to a specific class are allocated daily to each class of shares of a Fund based upon its proportionate share of total net assets.
Estimates – The preparation of financial statements in conformity with GAAP requires management to make estimates and assumptions that affect the reported amounts of assets and liabilities and disclosure of contingent assets and liabilities as of the date of the financial statements and the reported amounts of increase (decrease) in net assets from operations during the reporting period. Actual results could differ from those estimates.
Federal income tax – Each Fund intends to or has qualified and intends to continue to qualify as a regulated investment company under the Internal Revenue Code of 1986, as amended (the “Code”). Qualification generally will relieve each Fund of liability for federal income taxes to the extent 100% of its net investment income and net realized capital gains are distributed in accordance with the Code.
In order to avoid imposition of the excise tax applicable to regulated investment companies, it is also each Fund’s intention to declare as dividends in each calendar year at least 98% of its net investment income (earned during the calendar year) and 98.2% of its net realized capital gains (earned during the twelve months ended October 31) plus undistributed amounts from prior years.
The following information is computed on a tax basis for each item as of September 30, 2021:
|
Small Cap Fund |
SMid Cap Fund |
Mid Cap Fund |
|||||||||
Tax cost of portfolio investments |
$ | 2,181,015,852 | $ | 253,767,876 | $ | 1,671,900 | ||||||
Gross unrealized appreciation |
$ | 2,050,205,937 | $ | 151,045,955 | $ | 79,091 | ||||||
Gross unrealized depreciation |
(65,369,001 | ) | (4,120,371 | ) | (42,070 | ) | ||||||
Net unrealized appreciation |
1,984,836,936 | 146,925,584 | 37,021 | |||||||||
Undistributed long-term gains |
207,331,250 | — | — | |||||||||
Accumulated capital and other losses |
(23,423,837 | ) | (3,319,859 | ) | (2,262 | ) | ||||||
Accumulated earnings |
$ | 2,168,744,349 | $ | 143,605,725 | $ | 34,759 | ||||||
The difference between the federal income tax cost of portfolio investments and the financial statement cost of portfolio investments for the Small Cap Fund and SMid Cap Fund are due to certain timing differences in the recognition of capital gains or losses under income tax regulations and GAAP. These “book/tax” differences are temporary in nature and are primarily due to the tax deferral of losses on wash sales.
43
CONESTOGA FUNDS
NOTES TO FINANCIAL STATEMENTS (Continued)
For the year or period ended September 30, 2021, the following reclassifications were made on the Statements of Assets and Liabilities for the Funds as a result of permanent differences between the financial statements and income tax reporting requirements:
|
Small Cap Fund |
SMid Cap Fund |
Mid Cap Fund |
|||||||||
Paid-in capital |
$ | (4,910,146 | ) | $ | (822,088 | ) | $ | — | ||||
Accumulated earnings |
4,910,146 | 822,088 | — | |||||||||
Such reclassifications, the result of permanent differences between financial statement and income tax reporting requirements, had no effect on each Fund’s net assets or NAV per share.
Net qualified late year ordinary losses represent losses incurred after December 31, 2020. These losses are deemed to arise on the first day of the Funds’ next taxable year. For the year or period ended September 30, 2021, the Small Cap Fund, SMid Cap Fund and Mid Cap Fund deferred until October 1, 2021 qualified late year ordinary losses of $23,423,837, $1,543,793, and $2,262 for federal income tax purposes, respectively.
As of September 30, 2021, the Small Cap Fund utilized short-term capital loss carryforward of $8,783,082 against current year gains for federal income tax purposes.
As of September 30, 2021, the SMid Cap Fund had a short-term capital loss carryforward of $1,236,463 and a long-term capital loss carryforward of $539,603 for federal income tax purposes. These capital loss carryforwards, which do not expire, are available to offset net realized capital gains in future years, thereby reducing future taxable gain distributions.
The Funds recognize the tax benefits or expenses of uncertain tax positions only when the position is “more likely than not” of being sustained assuming examination by tax authorities. Management has reviewed each Fund’s tax positions for all open tax years (generally, three years) and has concluded that no provision for unrecognized tax benefits or expenses is required in these financial statements. The Funds identify their major tax jurisdiction as U.S. Federal.
3. Investment Transactions
During the year or period ended September 30, 2021, the cost of purchases and proceeds from sales of investment securities, other than short-term investments, amounted to $762,717,681 and $726,937,021, respectively, for the Small Cap Fund, $,128,222,443 and $55,011,508, respectively, for the SMid Cap Fund and $1,682,889 and $11,083, respectively, for the Mid Cap Fund.
44
CONESTOGA FUNDS
NOTES TO FINANCIAL STATEMENTS (Continued)
4. Transactions with Related Parties
INVESTMENT ADVISORY AGREEMENT
The Small Cap Fund has entered into an Investment Advisory Agreement with the Adviser to provide supervision and assistance in overall management services to the Small Cap Fund. For these services, the Small Cap Fund pays the Adviser a fee, calculated daily and paid monthly, equal to an annual rate of 0.90% of its average daily net assets. The Adviser has contractually agreed to limit the Small Cap Fund’s net annual operating expenses (excluding taxes, extraordinary expenses, reorganization expenses, brokerage commissions, interest, other expenditures that are capitalized in accordance with GAAP, and other extraordinary expenses not incurred in the ordinary course of such Fund’s business) to 1.10% (for the Investors Class) and 0.90% (for the Institutional Class) of average daily net assets until at least January 31, 2022. During the year ended September 30, 2021, the Adviser reduced its fees from the Small Cap Fund by $1,052,384 and reimbursed other operating expenses of $2,847,284 under this arrangement. In addition, if at any point during the 24 months following the date that the Adviser reduced its fees and/or made expense reimbursements, it becomes unnecessary for the Adviser to reduce its fees or make expense reimbursements, the Adviser may recapture any of its prior fee reductions or expense reimbursements to the extent such recapture does not cause the Fund’s total annual operating expenses to exceed the applicable expense limitation that was in effect at the time of the fee reduction or expense reimbursement. As of September 30, 2021, the Adviser may seek recovery of advisory fee reductions and expense reimbursements no later than the dates as stated below:
|
September 30, |
September 30, |
Total |
|||||||||
Small Cap Fund |
$ | 3,223,640 | $ | 3,899,668 | $ | 7,123,308 | ||||||
During the year ended September 30, 2021, the Adviser did not recover any previous fee reductions or expense reimbursements from the Small Cap Fund.
The SMid Cap Fund has entered into an Investment Advisory Agreement with the Adviser to provide supervision and assistance in overall management services to the SMid Cap Fund. For these services, the SMid Cap Fund pays the Adviser a fee, calculated daily and paid monthly, equal to an annual rate of 0.85% of its average daily net assets. The Adviser has contractually agreed to limit the SMid Cap Fund’s net annual operating expenses (excluding interest, taxes, brokerage commissions, other expenditures that are capitalized in accordance with GAAP, and other extraordinary expenses not incurred in the ordinary course of such Fund’s business) to 1.10% (for the Investors Class) and 0.85% (for the Institutional Class) of average daily net assets until at least January 31, 2022. During the year ended September 30, 2021, the Adviser reduced its fees from the SMid Cap Fund by $538,132 and reimbursed other operating expenses of $325,851 under this arrangement. In addition, if at any point during the 24 months following the date that the Adviser
45
CONESTOGA FUNDS
NOTES TO FINANCIAL STATEMENTS (Continued)
reduced its fees and/or made expense reimbursements, it becomes unnecessary for the Adviser to reduce its fees or make expense reimbursements, the Adviser may recapture any of its prior fee reductions or expense reimbursements to the extent such recapture does not cause the Fund’s total annual operating expenses to exceed the current expense limitation or the applicable expense limitation that was in effect at the time of the fee reduction or expense reimbursement. As of September 30, 2021, the Adviser may seek recovery of advisory fee reductions and expense reimbursements no later than the dates as stated below:
|
September 30, |
September 30, |
Total |
|||||||||
SMid Cap Fund |
$ | 698,437 | $ | 863,983 | $ | 1,562,420 | ||||||
During the year ended September 30, 2021, the Adviser did not recover any previous fee reductions or expense reimbursements from the SMid Cap Fund.
The Mid Cap Fund has entered into an Investment Advisory Agreement with the Adviser to provide supervision and assistance in overall management services to the Mid Cap Fund. For these services, the Mid Cap Fund pays the Adviser a fee, calculated daily and paid monthly, equal to an annual rate of 0.80% of its average daily net assets. The Adviser has contractually agreed to limit the Mid Cap Fund’s net annual operating expenses (excluding interest, taxes, brokerage commissions, other expenditures that are capitalized in accordance with GAAP, and other extraordinary expenses not incurred in the ordinary course of such Fund’s business) to 1.05% (for the Investors Class) and 0.80% (for the Institutional Class) of average daily net assets until at least June 30, 2022. During the period from inception through September 30, 2021, the Adviser did not collect any of its advisory fees from the Mid Cap Fund and reimbursed other operating expenses of $61,622 under this arrangement. In addition, if at any point during the 24 months following the date that the Adviser reduced its fees and/or made expense reimbursements, it becomes unnecessary for the Adviser to reduce its fees or make expense reimbursements, the Adviser may recapture any of its prior fee reductions or expense reimbursements to the extent such recapture does not cause the Fund’s total annual operating expenses to exceed the current expense limitation or the applicable expense limitation that was in effect at the time of the fee reduction or expense reimbursement. As of September 30, 2021, the Adviser may seek recovery of advisory fee reductions and expense reimbursements no later than the date as stated below:
|
September 30, |
Total |
||||||
Mid Cap Fund |
$ | 64,920 | $ | 64,920 | ||||
46
CONESTOGA FUNDS
NOTES TO FINANCIAL STATEMENTS (Continued)
DISTRIBUTION AND SHAREHOLDER SERVICING PLANS
The Trust, on behalf of each Fund, has adopted a distribution plan (the “Distribution Plan”), pursuant to Rule 12b-1 under the 1940 Act, which permits each Fund to pay certain expenses associated with the distribution of Investors Class shares, including, but not limited to, advertising, printing of prospectuses and reports for other than existing shareholders, preparation and distribution of advertising material and sales literature, and payments to dealers and shareholder servicing agents who enter into agreements with the Funds. The Distribution Plan provides that each Fund may reimburse the Distributor (hereinafter defined) for distribution expenses in an amount not exceeding, on an annual basis, 0.25% of the average daily net assets allocable to Investors Class shares. During the year or period ended September 30, 2021, Investors Class shares of the Small Cap Fund, the SMid Cap Fund and the Mid Cap Fund incurred fees of $2,392,397, $149,999 and $342, respectively, under the Distribution Plan.
The Trust, on behalf of each Fund, has adopted a Shareholder Servicing Plan under which each Fund may enter into agreements with various shareholder servicing agents, including financial institutions and securities brokers. Each Fund may pay shareholder servicing fees in an amount not exceeding, on an annual basis, 0.10% of the average daily net assets allocable to the Institutional Class shares and 0.25% of the average daily net assets allocable to the Investors Class shares. The Board has approved a limitation on the shareholder servicing fees of 0.05% of the average daily net assets attributable to Investors Class shares for the year or period ended September 30, 2021. During the year ended September 30, 2021, Institutional Class shares and Investors Class shares of the Small Cap Fund incurred fees of $1,446,100 and $478,787, respectively, under the Shareholder Servicing Plan. During the year ended September 30, 2021, Institutional Class shares and Investors Class shares of the SMid Cap Fund incurred fees of $227,867 and $30,000, respectively, under the Shareholder Servicing Plan. During the period ended September 30, 2021, Institutional Class shares and Investors Class shares of the Mid Cap Fund incurred fees of $276 and $68, respectively, under the Shareholder Servicing Plan.
OTHER SERVICE PROVIDERS
Ultimus Fund Solutions, LLC (“Ultimus”) provides fund accounting, compliance, transfer agency and certain administration services to the Funds. Each Fund pays Ultimus fees in accordance with the agreements for such services. In addition, each Fund pays out-of-pocket expenses including, but not limited to, postage, supplies and costs related to the pricing of its portfolio securities.
Under the terms of a Distribution Agreement with the Trust, Ultimus Fund Distributors, LLC (the “Distributor”) serves as the principal underwriter to each Fund. The Distributor is a wholly-owned subsidiary of Ultimus.
Certain officers of the Trust are also officers of Ultimus and/or the Distributor. An employee of Ultimus serves as the Trust’s Anti-Money Laundering Officer.
47
CONESTOGA FUNDS
NOTES TO FINANCIAL STATEMENTS (Continued)
TRUSTEE COMPENSATION
Trustees affiliated with the Adviser are not compensated by the Trust for their services. Effective January 1, 2021, each Trustee who is not an “interested person” of the Trust (“Independent Trustee”) receives from the Trust a quarterly retainer of $11,250 (except that such fee is $17,750 for the Lead Independent Trustee and $16,650 for the Chair of the Audit Committee), a fee of $5,000 for each quarterly or special meeting attended in person; and 50% of such meeting fee for telephonic meetings attended. Prior to January 1, 2021, each Independent Trustee received from the Trust a quarterly retainer of $11,250 (except such fee was $16,250 for each of the Lead Independent Trustee and the Chair of the Audit Committee), a fee of $5,000 for each quarterly or special meeting attended in person; and 50% of such meeting fee for telephonic meetings attended. Each Fund pays its proportionate share of such fees.
PRINCIPAL HOLDERS OF FUND SHARES
As of September 30, 2021, the following shareholders owned of record 25% or more of the outstanding shares of each class of each Fund:
NAME OF RECORD OWNER |
% Ownership |
Conestoga Small Cap Fund - Institutional Class |
|
National Financial Services, LLC (for the benefit of its customers) |
27% |
Conestoga Small Cap Fund - Investor Class |
|
National Financial Services, LLC (for the benefit of its customers) |
41% |
Conestoga SMid Cap Fund - Institutional Class |
|
Charles Schwab & Company, Inc. (for the benefit of its customers) |
41% |
National Financial Services, LLC (for the benefit of its customers) |
38% |
Conestoga SMid Cap Fund - Investor Class |
|
National Financial Services, LLC (for the benefit of its customers) |
50% |
Charles Schwab & Company, Inc. (for the benefit of its customers) |
29% |
Conestoga Mid Cap Fund - Institutional Class |
|
William C. Martindale Jr. |
35% |
A beneficial owner of 25% or more of a Fund’s outstanding shares may be considered a controlling person. That shareholder’s vote could have a more significant effect on matters presented at a shareholders’ meeting.
48
CONESTOGA FUNDS
NOTES TO FINANCIAL STATEMENTS (Continued)
5. Affiliated Issuers
A company is considered an affiliate of a Fund under the 1940 Act if the Fund’s holdings in that company represent 5% or more of the outstanding voting shares of the company. The industry and percentage of net assets for these holdings can be found on the Small Cap Fund’s Schedule of Investments. Further information on these holdings for the year ended September 30, 2021 appears below:
|
Construction |
Douglas |
LeMaitre |
Mesa |
||||||||||||
Percentage of Outstanding Voting Shares Owned |
8.54 | % | 5.33 | % | 5.88 | % | 6.80 | % | ||||||||
Shares at Beginning of Year |
2,895,801 | 1,588,825 | 1,274,721 | 341,731 | ||||||||||||
Shares Purchased During the Year |
242,090 | 43,800 | — | 12,350 | ||||||||||||
Shares Sold During the Year |
(20,000 | ) | (408,160 | ) | — | — | ||||||||||
Shares at End of Year |
3,117,891 | 1,224,465 | 1,274,721 | 354,081 | ||||||||||||
Market Value at Beginning of Year |
$ | 52,703,578 | $ | 54,337,815 | $ | 41,466,674 | $ | 87,059,390 | ||||||||
Cost of Purchases During the Year |
7,565,312 | 1,979,958 | — | 3,541,682 | ||||||||||||
Cost of Sales During the Year |
(411,511 | ) | (18,682,774 | ) | — | — | ||||||||||
Change in Unrealized Appreciation (Depreciation) |
44,186,644 | 6,813,080 | 26,208,264 | 16,458,859 | ||||||||||||
Market Value at End of Year |
$ | 104,044,023 | $ | 44,448,079 | $ | 67,674,938 | $ | 107,059,931 | ||||||||
Net Realized Gains (Losses) During the Year |
$ | 84,673 | $ | (4,145,313 | ) | $ | — | $ | — | |||||||
Dividend Income Earned During the Year |
$ | — | $ | 1,840,765 | $ | 541,756 | $ | 224,636 | ||||||||
49
CONESTOGA FUNDS
NOTES TO FINANCIAL STATEMENTS (Continued)
|
Model N, |
Vocera |
Total |
|||||||||
Percentage of Outstanding Voting Shares Owned |
7.14 | % | 5.77 | % | ||||||||
Shares at Beginning of Year |
1,230,915 | 1,917,704 | ||||||||||
Shares Purchased During the Year |
1,637,929 | 86,800 | ||||||||||
Shares Sold During the Year |
(315,000 | ) | — | |||||||||
Shares at End of Year |
2,553,844 | 2,004,504 | ||||||||||
Market Value at Beginning of Year |
$ | 43,426,681 | $ | 55,766,832 | $ | 334,760,970 | ||||||
Cost of Purchases During the Year |
58,947,538 | 3,722,725 | 75,757,215 | |||||||||
Cost of Sales During the Year |
(13,237,165 | ) | — | (32,331,450 | ) | |||||||
Change in Unrealized Appreciation (Depreciation) |
(3,583,280 | ) | 32,236,546 | 122,320,113 | ||||||||
Market Value at End of Year |
$ | 85,553,774 | $ | 91,726,103 | $ | 500,506,848 | ||||||
Net Realized Gains (Losses) During the Year |
$ | (2,380,121 | ) | $ | — | $ | (6,440,761 | ) | ||||
Dividend Income Earned During the Year |
$ | — | $ | — | $ | 2,607,157 | ||||||
6. Capital Share Activity
The following table summarizes the capital share activity in Institutional Class shares of the Small Cap Fund:
|
For the Year Ended |
For the Year Ended |
||||||||||||||
|
Shares |
Value |
Shares |
Value |
||||||||||||
Issued |
9,832,515 | $ | 783,876,197 | 14,005,921 | $ | 807,652,870 | ||||||||||
Reinvested |
— | — | 476,819 | 28,194,336 | ||||||||||||
Redeemed |
(5,877,642 | ) | (470,707,498 | ) | (9,597,326 | ) | (555,771,590 | ) | ||||||||
Total |
3,954,873 | $ | 313,168,699 | 4,885,414 | $ | 280,075,616 | ||||||||||
50
CONESTOGA FUNDS
NOTES TO FINANCIAL STATEMENTS (Continued)
The following table summarizes the capital share activity in Investors Class shares of the Small Cap Fund:
|
For the Year Ended |
For the Year Ended |
||||||||||||||
|
Shares |
Value |
Shares |
Value |
||||||||||||
Issued |
1,502,807 | $ | 118,468,533 | 2,252,473 | $ | 128,087,873 | ||||||||||
Reinvested |
— | — | 281,315 | 16,437,261 | ||||||||||||
Redeemed |
(3,127,143 | ) | (248,225,990 | ) | (4,489,654 | ) | (255,964,837 | ) | ||||||||
Total |
(1,624,336 | ) | $ | (129,757,457 | ) | (1,955,866 | ) | $ | (111,439,703 | ) | ||||||
The following table summarizes the capital share activity in Institutional Class shares of the SMid Cap Fund:
|
For the Year Ended |
For the Year Ended |
||||||||||||||
|
Shares |
Value |
Shares |
Value |
||||||||||||
Issued |
6,081,217 | $ | 144,722,264 | 7,193,706 | $ | 120,337,652 | ||||||||||
Reinvested |
— | — | 61,526 | 1,092,700 | ||||||||||||
Redeemed |
(2,187,178 | ) | (51,920,798 | ) | (2,172,625 | ) | (36,710,977 | ) | ||||||||
Total |
3,894,039 | $ | 92,801,466 | 5,082,607 | $ | 84,719,375 | ||||||||||
The following table summarizes the capital share activity in Investors Class shares of the SMid Cap Fund:
|
For the Year Ended |
For the Year Ended |
||||||||||||||
|
Shares |
Value |
Shares |
Value |
||||||||||||
Issued |
645,803 | $ | 15,006,418 | 1,416,580 | $ | 24,293,664 | ||||||||||
Reinvested |
— | — | 32,228 | 564,960 | ||||||||||||
Redeemed |
(806,790 | ) | (18,625,647 | ) | (1,347,132 | ) | (22,363,356 | ) | ||||||||
Total |
(160,987 | ) | $ | (3,619,229 | ) | 101,676 | $ | 2,495,268 | ||||||||
51
CONESTOGA FUNDS
NOTES TO FINANCIAL STATEMENTS (Continued)
The following table summarizes the capital share activity in Institutional Class shares of the Mid Cap Fund:
|
For the Period Ended |
|||||||
|
Shares |
Value |
||||||
Issued |
113,238 | $ | 1,145,200 | |||||
Total |
113,238 | $ | 1,145,200 | |||||
(a) |
Represents the period from commencement of operations (June 29, 2021) through September 30, 2021. |
The following table summarizes the capital share activity in Investors Class shares of the Mid Cap Fund:
|
For the Period Ended |
|||||||
|
Shares |
Value |
||||||
Issued |
60,435 | $ | 614,658 | |||||
Redeemed |
(5,460 | ) | (59,600 | ) | ||||
Total |
54,975 | $ | 555,058 | |||||
(a) |
Represents the period from commencement of operations (June 29, 2021) through September 30, 2021. |
7. Industry Risk
If a Fund has significant investments in the securities of issuers within a particular industry, any development affecting that industry will have a greater impact on the value of the net assets of the Fund than would be the case if the Fund did not have significant investments in that industry. In addition, this may increase the risk of loss in the Fund and increase the volatility of the Fund’s NAV per share. Occasionally, market conditions, regulatory changes or other developments may negatively impact a particular industry. Under the Russell ICB Industry and Sector classification, equity companies are categorized within 11 industries and 45 sectors and 171 subsectors. As of September 30, 2021, the Small Cap Fund had 29.1% and 26.4% of the value of its net assets invested in stocks within the Russell ICB Industrials and Technology industries, respectively. As of September 30, 2021, the SMid Cap Fund had 30.5% and 20.4% of the value of its net assets invested in stocks within the Russell ICB Industrials and Health Care industries. As of September 30, 2021, the Mid Cap Fund had 25.8% and 24.6% of the value of its net assets invested in stocks within the Russell ICB Health Care and Technology industries. The Funds consider companies to be “in the same industry” for purposes of industry concentration if the companies are categorized in the same Russell ICB subsector. As of September 30, 2021, none of the Funds had 25% or more of their assets invested in stocks within any one sector or subsector under the Russell ICB Industry and Sector classification.
52
CONESTOGA FUNDS
NOTES TO FINANCIAL STATEMENTS (Continued)
8. Contingencies and Commitments
The Funds indemnify the Trust’s officers and Trustees for certain liabilities that might arise from the performance of their duties to the Funds. Additionally, in the normal course of business, the Funds enter into contracts that contain a variety of representations and warranties and that provide general indemnifications. The Funds’ maximum exposure under these arrangements is unknown, as this would involve future claims that may be made against the Funds that have not yet occurred. However, based on experience, the Funds expect the risk of loss to be remote.
9. Coronavirus (COVID-19) Pandemic
The COVID-19 pandemic has caused financial markets to experience significant volatility and uncertainty exists as to its long-term impact. COVID-19 has resulted in closing borders, quarantines, disruptions to supply chains and customer activity, as well as general concern and economic uncertainty. Although vaccines for COVID-19 are becoming more widely available, the impact of the outbreak may last for an extended period of time, and the pace of recovery may vary from market to market. The impact of epidemics and pandemics such as COVID-19 could affect the economies of many nations, individual companies and the market in general in ways that cannot necessarily be foreseen at the present time. As a result, a Fund’s performance and the ability to achieve its investment objective may be adversely impacted. Management is monitoring the development of the pandemic and evaluating its impact on the financial position and operating results of the Funds.
10. Subsequent Events
The Funds are required to recognize in the financial statements the effects of all subsequent events that provide additional evidence about conditions that existed as of the date of the Statements of Assets and Liabilities. For non-recognized subsequent events that must be disclosed to keep the financial statements from being misleading, the Funds are required to disclose the nature of the event as well as an estimate of its financial effect, or a statement that such an estimate cannot be made. Management has evaluated subsequent events through the issuance of these financial statements and has noted no such events.
53
CONESTOGA FUNDS
REPORT OF INDEPENDENT REGISTERED
PUBLIC ACCOUNTING FIRM
To the Board of Trustees of Conestoga Funds
and the Shareholders of Conestoga Small Cap Fund, Conestoga SMID Cap Fund, and Conestoga Mid Cap Fund
Opinion on the Financial Statements
We have audited the accompanying statements of assets and liabilities of Conestoga Small Cap Fund, Conestoga SMID Cap Fund, and Conestoga Mid Cap Fund, each a series of shares of beneficial interest in Conestoga Funds (the “Funds”), including the schedules of investments, as of September 30, 2021, and the related statements of operations and changes in net assets and financial highlights as noted in the table below, and the related notes (collectively referred to as the “financial statements”). In our opinion, the financial statements present fairly, in all material respects, the financial position of the Funds as of September 30, 2021, and the results of their operations, the changes in their net assets and their financial highlights for each of the periods noted in the table below, in conformity with accounting principles generally accepted in the United States of America.
Fund |
Statements of Operations, Changes In Net Assets and Financial Highlights Presented |
Conestoga Small Cap Fund |
The statement of operations for the year ended September 30, 2021, the statements of changes in net assets for each of the years in the two-year period then ended and the financial highlights for each of the years in the five-year period then ended |
Conestoga SMID Cap Fund |
The statement of operations for the year ended September 30, 2021, the statements of changes in net assets for each of the years in the two-year period then ended and the financial highlights for each of the years in the five-year period then ended |
Conestoga Mid Cap Fund |
The statements of operations and changes in net assets and financial highlights for the period June 29, 2021 (commencement of operations) to September 30, 2021 |
Basis for Opinion
These financial statements are the responsibility of the Funds’ management. Our responsibility is to express an opinion on the Funds’ financial statements based on our audits. We are a public accounting firm registered with the Public Company Accounting Oversight Board (United States) (“PCAOB”) and are required to be independent with respect to the Funds in accordance with the U.S. federal securities law and the applicable rules and regulations of the Securities and Exchange Commission and the PCAOB.
We conducted our audits in accordance with the standards of the PCAOB. Those standards require that we plan and perform the audits to obtain reasonable assurance about whether the financial statements are free of material misstatement, whether due to error or fraud. The Funds are not required to have, nor were we engaged to perform, an audit of their
54
CONESTOGA FUNDS
REPORT OF INDEPENDENT REGISTERED
PUBLIC ACCOUNTING FIRM (Continued)
internal control over financial reporting. As part of our audits we are required to obtain an understanding of internal control over financial reporting but not for the purpose of expressing an opinion on the effectiveness of the Funds’ internal control over financial reporting. Accordingly, we express no such opinion.
Our audits included performing procedures to assess the risk of material misstatement of the financial statements, whether due to error or fraud, and performing procedures that respond to those risks. Such procedures included examining, on a test basis, evidence regarding the amounts and disclosures in the financial statements. Our procedures included confirmation of securities owned as of September 30, 2021 by correspondence with the custodian, brokers, or by other appropriate auditing procedures where replies from brokers were not received. Our audits also included evaluating the accounting principles used and significant estimates made by management, as well as evaluating the overall presentation of the financial statements. We believe that our audits provide a reasonable basis for our opinion.

BBD, LLP
We have served as the auditor of one or more of the Funds in the Conestoga Funds since 2004.
Philadelphia, Pennsylvania
November 23, 2021
55
CONESTOGA FUNDS
LIQUIDITY RISK MANAGEMENT PROGRAM (Unaudited)
Each Fund has adopted a Liquidity Risk Management Program (the “Program”) as required by rule 22e-4 under the Investment Company Act of 1940, as amended. The program seeks to assess, manage and review each Fund’s Liquidity Risk. “Liquidity Risk” is defined as the risk that a Fund could not meet requests to redeem shares issued by the Fund without significant dilution of remaining investors’ interest in the Fund.
The Board has approved the designation of Conestoga Capital Advisors, LLC (the “Adviser”), the investment adviser to the Funds, as the program administrator for the Program. The Adviser has established a Liquidity Committee (the “Committee”) to implement and provide day-to-day administration and oversight of the Program.
At a meeting held on May 14, 2021, the Board received and reviewed the annual written report of the Committee, on behalf of the Adviser (the “Report”) concerning the operation of the Program for the period from April 1, 2020 through March 31, 2021 (the “Reporting Period”). The Report addressed the operation of Program and assessed its adequacy and effectiveness of implementation.
The Report summarized the operation of the Program and the information and factors considered by the Committee in reviewing the adequacy and effectiveness of the Program’s implementation with respect to each Fund. The information and factors included, among other things: (i) the liquidity risk framework used to assess, manage and periodically review each Fund’s liquidity, and the results of this assessment; (ii) the inputs used to classify the liquidity of each Fund’s portfolio investments and the Committee’s assessment that each Fund’s strategy is appropriate for an open-end mutual fund; (iii) that each Fund held primarily highly liquid assets (investments that the Fund anticipates can be converted to cash within 3 business days or less in current market conditions without significantly changing their market value); (iv) that no Fund required the establishment of a highly liquid investment minimum and the methodology for that determination; (v) confirmation that none of the Funds had breached the 15% maximum illiquid security threshold (investments that cannot be sold or disposed of in seven days or less in current market conditions without the sale of the investments significantly changing the market value of the investment) and the procedures for monitoring compliance with the limit; and (vi) information regarding shareholder concentration in each Fund. The Report also noted that no changes were made to the Program.
Based on the review, the Report concluded that the Program was being effectively implemented and that the Program was designed to assess and manage each Fund’s liquidity risk.
56
CONESTOGA FUNDS
ABOUT YOUR FUNDS’ EXPENSES (Unaudited)
We believe it is important for you to understand the impact of costs on your investment. As a shareholder of the Funds, you incur ongoing costs, including management fees, Rule 12b-1 distribution fees (if applicable), shareholder servicing fees and other operating expenses. The following examples are intended to help you understand your ongoing costs (in dollars) of investing in the Funds and to compare these costs with the ongoing costs of investing in other mutual funds.
A mutual fund’s ongoing costs are expressed as a percentage of its average net assets. This figure is known as the expense ratio. The expenses in the table below are based on an investment of $1,000 made at the beginning of the most recent period (April 1, 2021) and held until the end of the period (September 30, 2021), except for the Mid Cap Fund, for which the ongoing costs reflected in the table below are based on an investment of $1,000 made at the commencement of operations (June 29, 2021) and held until the end of the period (September 30, 2021).
The table below illustrates each Fund’s ongoing costs in two ways:
Actual fund return – This section helps you to estimate the actual expenses that you paid over the period. The “Ending Account Value” shown is derived from each Fund’s actual return, and the fourth column shows the dollar amount of operating expenses that would have been paid by an investor who started with $1,000 in the Funds. You may use the information here, together with the amount you invested, to estimate the expenses that you paid over the period.
To do so, simply divide your account value by $1,000 (for example, an $8,600 account value divided by $1,000 = 8.6), then multiply the result by the number given for the Fund under the heading “Expenses Paid During Period.”
Hypothetical 5% return – This section is intended to help you compare each Fund’s ongoing costs with those of other mutual funds. It assumes that each Fund had an annual return of 5% before expenses during the period shown, but that the expense ratio is unchanged. In this case, because the return used is not the Funds’ actual return, the results do not apply to your investment. The example is useful in making comparisons because the U.S. Securities and Exchange Commission (the “SEC”) requires all mutual funds to calculate expenses based on a 5% return. You can assess each Fund’s ongoing costs by comparing this hypothetical example with the hypothetical examples that appear in shareholder reports of other funds.
Note that expenses shown in the table are meant to highlight and help you compare ongoing costs only. The Funds do not charge transaction fees, such as purchase or redemption fees, nor do they carry a “sales load.”
The calculations assume no shares were bought or sold during the period. Your actual costs may have been higher or lower, depending on the amount of your investment and the timing of any purchases or redemptions.
57
CONESTOGA FUNDS
ABOUT YOUR FUNDS’ EXPENSES (Unaudited) (Continued)
More information about the Funds’ expenses can be found in this report. For additional information on operating expenses and other shareholder costs, please refer to each Fund’s prospectus.
Conestoga Small Cap Fund |
Beginning |
Ending |
Net |
Expenses |
Institutional Class |
||||
Based on Actual Fund Return |
$1,000.00 |
$1,076.00 |
0.90% |
$4.68 |
Based on Hypothetical 5% Return (before expenses) |
$1,000.00 |
$1,020.56 |
0.90% |
$4.56 |
Investor Class |
||||
Based on Actual Fund Return |
$1,000.00 |
$1,075.00 |
1.10% |
$5.72 |
Based on Hypothetical 5% Return (before expenses) |
$1,000.00 |
$1,019.55 |
1.10% |
$5.57 |
Conestoga SMid Cap Fund |
|
|
|
|
Institutional Class |
||||
Based on Actual Fund Return |
$1,000.00 |
$1,111.40 |
0.85% |
$4.50 |
Based on Hypothetical 5% Return (before expenses) |
$1,000.00 |
$1,020.81 |
0.85% |
$4.31 |
Investor Class |
||||
Based on Actual Fund Return |
$1,000.00 |
$1,110.20 |
1.10% |
$5.82 |
Based on Hypothetical 5% Return (before expenses) |
$1,000.00 |
$1,019.55 |
1.10% |
$5.57 |
Conestoga Mid Cap Fund |
|
|
|
|
Institutional Class |
||||
Based on Actual Fund Return |
$1,000.00 |
$1,032.00 |
0.80% |
$2.07 |
Based on Hypothetical 5% Return (before expenses) |
$1,000.00 |
$1,021.06 |
0.80% |
$4.05 |
Investor Class |
||||
Based on Actual Fund Return |
$1,000.00 |
$1,031.00 |
1.05% |
$2.72 |
Based on Hypothetical 5% Return (before expenses) |
$1,000.00 |
$1,019.80 |
1.05% |
$5.32 |
(a) |
For the Conestoga Mid Cap Fund, Beginning Account Value is as of June 29, 2021 (date of commencement of operations) for the Actual Fund Return information. |
(b) |
Annualized, based on each Fund’s most recent one-half year expenses, except for the Conestoga Mid Cap Fund which is annualized based on the Fund’s expenses during the period since the commencement of operations on June 29, 2021. |
(c) |
Expenses are equal to each Fund’s annualized net expense ratio multiplied by the average account value over the period, multiplied by 183/365 (to reflect the one-half year period), except for the Conestoga Mid Cap Fund, which is equal to the annualized net expense ratio multiplied by the average account value over the period, multiplied by 93/365 (to reflect the period since commencement of operations on June 29, 2021) and 183/365 (to reflect the one-half year period), for Actual Fund Return and Hypothetical 5% Return information, respectively. |
58
CONESTOGA FUNDS
OTHER INFORMATION (Unaudited)
A description of the policies and procedures that the Funds use to vote proxies relating to portfolio securities is available without charge upon request by calling toll-free 1-800-494-2755, or on the SEC’s website at sec.gov. Information regarding how the Funds voted proxies relating to portfolio securities during the most recent 12-month period ended June 30 is available without charge upon request by calling toll-free 1-800-494-2755, or on the SEC’s website at sec.gov.
The Trust files a complete listing of portfolio holdings for the Funds with the SEC as of the end of the first and third quarters of each fiscal year as an exhibit to its reports on Form N-PORT. These filings are available upon request by calling 1-800-494-2755. Furthermore, you may obtain a copy of the filings on the SEC’s website at sec.gov.
59
CONESTOGA FUNDS
APPROVAL OF ADVISORY AGREEMENT (Unaudited)
At an in-person meeting held on May 14, 2021, the Board of Trustees of Conestoga Funds (the “Board”) considered the approval of the advisory agreement (the “Investment Advisory Agreement”) on behalf of the Conestoga Mid Cap Fund (the “Mid Cap Fund”) between the Mid Cap Fund and Conestoga Capital Advisors, LLC (“CCA” or the “Adviser”).
In evaluating whether to approve the proposed Investment Advisory Agreement between the Conestoga Mid Cap Fund and CCA, generally the Independent Trustees relied upon their knowledge of CCA, CCA’s services and the Conestoga Small Cap Fund and Conestoga SMid Cap Fund, resulting from the Board’s meetings and interactions with management throughout the year. The Board also relied upon the written materials provided by CCA in connection with the meeting and the oral presentations regarding the proposed Investment Advisory Agreement, which the Independent Trustees had received as requested in preparation for its consideration of the Investment Advisory Agreement on behalf of the Mid Cap Fund. The Independent Trustees reviewed and considered the nature, extent and quality of the investment advisory services provided by CCA under the proposed Investment Advisory Agreement, including portfolio management, investment research, equity securities trading and monitoring for best execution, and adviser resources that had been previously dedicated to the Conestoga Small Cap Fund and Conestoga SMid Cap Fund. The Independent Trustees also reviewed and considered the nature, extent and quality of the non-advisory services provided, including accounting, clerical, bookkeeping, compliance, business management and planning, and the provision of supplies, office space and utilities.
The Independent Trustees placed a significant emphasis on the recent investment performance of the Conestoga Small Cap Fund and Conestoga SMid Cap Fund by CCA in considering whether to approve the Investment Advisory Agreement for the Mid Cap Fund as well as comparing the net expense ratio and management fee of the Mid Cap Fund to the net expense ratios and advisory fees of the Mid Cap Peer Group. The Independent Trustees also considered CCA’s undertaking to continue to limit the Funds’ total operating expenses (with certain exclusions). Overall, the Independent Trustees concluded that the management fees to be paid by the Mid Cap Fund to CCA were reasonable in comparison to the management fees of the respective peer groups. The Independent Trustees also concluded that the management fees to be paid by the Mid Cap Fund and their expense structures were acceptable in view of the nature and structure of Fund operations, CCA’s contractual agreements to limit Fund operating expenses, and, with respect to the Conestoga SMid Cap Fund, the size of the Fund. Finally, the Independent Trustees reviewed the costs of the services provided by CCA and considered “fall-out benefits” that could be derived by CCA from its relationship with the Conestoga Small Cap Fund and Conestoga SMid Cap Fund.
After further discussion of other factors relevant to the and consultation with Independent Trustee counsel, the Independent Trustees agreed that they have been provided with sufficient information with which to initially approve the Investment Advisory Agreement with respect to the Mid Cap Fund. Based on all of the above factors, with no single factor
60
CONESTOGA FUNDS
APPROVAL OF ADVISORY AGREEMENT (Unaudited) (Continued)
being determinative and each Trustee not necessarily attributing the same weight to each factor, the Independent Trustees concluded that: (i) the nature, extent, and quality of the services provided by CCA were appropriate for the proper management of the Mid Cap Fund’s assets, and that CCA demonstrated that it possessed the capability and resources to perform the duties required of it under the Investment Advisory Agreement; and (ii) it was in the best interests of the Mid Cap Fund’s shareholders to have the Mid Cap Fund enter into the Investment Advisory Agreement.
61
CONESTOGA FUNDS
BOARD OF TRUSTEES AND EXECUTIVE OFFICERS (Unaudited)
The business and affairs of the Funds are managed under the direction of the Trust’s Board of Trustees. Information pertaining to the trustees and executive officers of the Trust as of September 30, 2021 are set forth below. No Trustee of the Trust is a “member of the immediate family” of any other Trustee or officer of the Trust. A “member of the immediate family” means any parent, spouse of a parent, child, spouse of a child, spouse, brother, or sister, and includes step and adoptive relationships (as defined in the Investment Company Act of 1940, as amended).
Name |
Position(s) Held with the Funds |
Term of Office and Length of Time Served1 |
Principal Occupation During Past Five Years |
Number of Portfolios in Fund Complex2 Overseen by Trustee |
Other Directorships Held by Trustee3 |
Independent Trustees 4: |
|||||
Nicholas J. Kovich |
Lead Independent Trustee |
Since 2002 |
Managing Director, Beach Investment Counsel, from 2011 to 2018; President and Chief Executive Officer, Kovich Capital Management (private asset management) since 2001; Managing Director, Morgan Stanley Investment Management from 1996 to 2001; General Partner, Miller Anderson & Sherrerd from 1988 to 1996; Vice President, Waddell & Reed, Inc. from 1982 to 1988. |
3 |
Trustee, the Milestone Funds |
James G. Logue |
Trustee |
Since 2013 |
Shareholder, McCausland Keen + Buckman (“MKB”) (attorneys at law) since 1991; Associate, MKB from 1987 to 1990. |
3 |
None |
Denise C. Marbach |
Trustee |
Since 2018 |
President of Gwynedd Mercy Academy High School since 2017; Assurance Partner at PwC from 1998 to 2015; Partner, Coopers & Lybrand from 1987 to 1998. |
3 |
None |
M. Eugenie G. Logue |
Trustee |
Since 2020 |
Senior Vice President & Chief Financial Officer of Xponance (formerly FIS Group), Inc. since 2018; Managing Director Rosemont Investment Partners, LLC since 2002. |
3 |
Independent Trustee of the Cheswold Lane Fund (2005-2015) |
62
CONESTOGA FUNDS
BOARD OF TRUSTEES AND EXECUTIVE OFFICERS (Unaudited) (Continued)
Name |
Position(s) Held with the Funds |
Term of Office and Length of Time Served1 |
Principal Occupation During Past Five Years |
Number of Portfolios in Fund Complex2 Overseen by Trustee |
Other Directorships Held by Trustee3 |
Independent Trustees 4 (Continued): |
|||||
James R. Warren |
Trustee |
Since 2020 |
Chief Operating Officer of Clark Capital Management since March 2021; Vice President & Managing Director of SEI Investments from 2004 to 2021. |
3 |
None |
Interested Trustees 4: |
|
|
|
||
Robert M. Mitchell5 |
Chairman of the Board, Chief Executive Officer & Trustee |
Trustee since 2011, Chief Executive Officer since 2019 and Chairman of the Board since 2020 |
Managing Partner, Co-Founder and Portfolio Manager since 2001 and Chief Investment Officer since 2014 of Conestoga Capital Advisors, LLC; Trustee of Academy of Notre Dame de Namur (a non-profit organization) since 2018. |
3 |
None |
Mark S Clewett5 |
Trustee & Senior Vice President |
Trustee since 2020 & Senior Vice President since 2006 |
President since 2018 and Director of Institutional Sales and Client Service since 2006 of Conestoga Capital Advisors, LLC; Board member and ambassador, For You Haiti (not-for profit relief organization) since 2019. |
3 |
None |
63
CONESTOGA FUNDS
BOARD OF TRUSTEES AND EXECUTIVE OFFICERS (Unaudited) (Continued)
Name and |
Position(s) Held with the Funds; Term of Office and Length of Time Served1 |
Principal Occupation |
Executive Officers: |
||
Robert M. Mitchell |
Chairman of the Board since 2020; Chief Executive Officer since 2019 |
Trustee of the Trust since 2011, Treasurer of the Trust from 2002-2019 and Managing Partner, Co-Founder and Portfolio Manager of Conestoga Capital Advisors, LLC since 2001; Trustee of Academy of Notre Dame de Namur (a non-profit organization) since 2018. |
Duane R. D’Orazio |
Secretary since 2002; Chief Compliance Officer since 2004 |
Managing Partner and Co-Founder of Conestoga Capital Advisors, LLC since 2001 and Chief Compliance Officer of Conestoga Capital Advisors, LLC since 2007. |
Mark S. Clewett |
Senior Vice President since 2006 |
Trustee of the Trust since 2020; Managing Partner, President of Conestoga Capital Advisors, LLC since 2018 and Director of Institutional Sales and Client Service of Conestoga Capital Advisors, LLC since 2006. |
Joseph F. Monahan |
Senior Vice President since 2009 and Treasurer since 2019 |
Managing Partner, Portfolio Manager and Research Analyst of Conestoga Capital Advisors, LLC since 2008. |
Jennifer L. Leamer |
Assistant Treasurer since 2016 |
Since 2014, SVP, Fund Accounting and Business Analyst from 2007 to 2014 of Ultimus Fund Solutions, LLC. |
Daniel D. Bauer |
Assistant Treasurer since 2016 |
Since 2015, AVP, Fund Accounting and Fund Accounting Manager from 2012 to 2015 of Ultimus Fund Solutions, LLC. |
Stephen L. Preston |
Assistant Vice President and Anti- Money Laundering Officer since 2021 |
Since 2011, Senior Vice President, Broker Dealer Chief Compliance Officer of Ultimus Fund Solutions, LLC |
1 |
The Independent Trustees have adopted a retirement policy whereby an Independent Trustee shall retire effective as of December 31 of the year he or she reaches the age of 75. The Board of Trustees may, in its sole discretion, suspend the resignation requirement or postpone the effectiveness of the resignation with respect to an individual Independent Trustee. Aside from the Independent Trustee retirement policy, there is no defined term of office for service as a Trustee or Officer. Each Trustee and Officer serves until the earlier of resignation, retirement, removal, death, or the election of a qualified successor. |
2 |
The “Fund Complex” consists of the Funds. |
3 |
Directorships of companies required to report to the Securities and Exchange Commission under the Securities Exchange Act of 1934, as amended (i.e., “public companies”), or other investment companies registered under the 1940 Act. |
4 |
Each Trustee may be contacted by writing to the Trustee, c/o Conestoga Funds, CrossPoint at Valley Forge, 550 E. Swedesford Road, Suite 120 East, Wayne, PA 19087. |
5 |
Messrs. Mitchell and Clewett are deemed to be “interested persons” of the Trust by reason of their positions as Chief Executive Officer and Senior Vice President, respectively, of Conestoga Capital Advisors, LLC. |
64
CONESTOGA FUNDS
BOARD OF TRUSTEES AND EXECUTIVE OFFICERS (Unaudited) (Continued)
Additional information about members of the Board of Trustees and executive officers is available in the Statement of Additional Information (“SAI”). To obtain a free copy of the SAI, please call 1-800-494-2755.
65
Interested Trustees
Robert M. Mitchell, Chairman and
Independent Trustees
Nicholas J. Kovich
Investment Adviser
Conestoga Capital Advisors, LLC
Dividend Paying Agent,
Ultimus Fund Solutions, LLC
Custodian
UMB Bank, NA
Distributor
Ultimus Fund Distributors, LLC |
Independent Registered Public Accounting Firm
BBD, LLP
Legal Counsel
Faegre Drinker Biddle & Reath LLP
Conestoga Funds’ Officers
Robert M. Mitchell, Chairman and |
This report is provided for the general information of the shareholders of the Conestoga Small Cap, SMid Cap and Mid Cap Funds. This report is not intended for distribution to prospective investors in the Funds, unless preceded or accompanied by an effective prospectus.
Conestoga Funds-AR-21
| (b) | Not applicable |
| Item 2. | Code of Ethics. |
As of the end of the period covered by this report, the registrant has adopted a code of ethics that applies to the registrant’s principal executive officer, principal financial officer, principal accounting officer or controller, or persons performing similar functions, regardless of whether these individuals are employed by the registrant or a third party. Pursuant to Item 13(a)(1), a copy of registrant’s code of ethics is filed as an exhibit to this Form N-CSR. During the period covered by this report, the code of ethics has not been amended, and the registrant has not granted any waivers, including implicit waivers, from the provisions of the code of ethics.
| Item 3. | Audit Committee Financial Expert. |
The registrant’s board of trustees has determined that the registrant has at least one audit committee financial expert serving on its audit committee. The name of the audit committee financial expert is Nicholas J. Kovich. Mr. Kovich is “independent” for purposes of this Item.
| Item 4. | Principal Accountant Fees and Services. |
| (a) | Audit Fees. The aggregate fees billed for professional services rendered by the principal accountant for the audit of the registrant’s annual financial statements or for services that are normally provided by the accountant in connection with statutory and regulatory filings or engagements were $31,400 and $24,500 with respect to the registrant’s fiscal years ended September 30, 2021 and 2020, respectively. |
| (b) | Audit-Related Fees. No fees were billed in either of the last two fiscal years for assurance and related services by the principal accountant that are reasonably related to the performance of the audit of the registrant’s financial statements and are not reported under paragraph (a) of this Item. |
| (c) | Tax Fees. The aggregate fees billed for professional services rendered by the principal accountant for tax compliance, tax advice, and tax planning were $9,000 and $6,000 with respect to the registrant’s fiscal years ended September 30, 2021 and 2020, respectively. The services comprising these fees are the preparation of the registrant’s federal income and excise tax returns. |
| (d) | All Other Fees. No fees were billed in either of the last two fiscal years for products and services provided by the principal accountant, other than the services reported in paragraphs (a) through (c) of this Item. |
| (e)(1) | The audit committee has adopted pre-approval policies and procedures described in paragraph (c)(7) of Rule 2-01 of Regulation S-X. |
| (e)(2) | None of the services described in paragraph (b) through (d) of this Item were approved by the audit committee pursuant to paragraph (c)(7)(i)(C) of Rule 2-01 of Regulation S-X. |
| (f) | Less than 50% of hours expended on the principal accountant’s engagement to audit the registrant’s financial statements for the most recent fiscal year were attributed to work performed by persons other than the principal accountant’s full-time, permanent employees. |
| (g) | With respect to the fiscal years ended September 30, 2021 and 2020, aggregate non-audit fees of $9,000 and $6,000, respectively, were billed by the registrant’s principal accountant for services rendered to the registrant. No non-audit fees were billed in either of the last two fiscal years by the registrant’s principal accountant for services rendered to the registrant’s investment adviser (not including any sub-adviser whose role is primarily portfolio management and is subcontracted with or overseen by another investment adviser), and any entity controlling, controlled by, or under common control with the adviser that provides ongoing services to the registrant. |
| (h) | The principal accountant has not provided any non-audit services to the registrant’s investment adviser (not including any sub-adviser whose role is primarily portfolio management and is subcontracted with or overseen by another investment adviser), and any entity controlling, controlled by, or under common control with the investment adviser that provides ongoing services to the registrant. |
| Item 5. | Audit Committee of Listed Registrants. |
Not applicable
| Item 6. | Schedule of Investments. |
| (a) | Schedule filed with Item 1 |
| (b) | Not applicable |
| Item 7. | Disclosure of Proxy Voting Policies and Procedures for Closed-End Management Investment Companies. |
Not applicable
| Item 8. | Portfolio Managers of Closed-End Management Investment Companies. |
Not applicable
| Item 9. | Purchases of Equity Securities by Closed-End Management Investment Company and Affiliated Purchasers. |
Not applicable
| Item 10. | Submission of Matters to a Vote of Security Holders. |
The registrant has not adopted procedures by which shareholders may recommend nominees to the registrant’s board of trustees.
| Item 11. | Controls and Procedures. |
(a) Based on their evaluation of the registrant’s disclosure controls and procedures (as defined in Rule 30a-3(c) under the Investment Company Act of 1940) as of a date within 90 days of the filing date of this report, the registrant’s principal executive officer and principal financial officer have concluded that such disclosure controls and procedures are reasonably designed and are operating effectively to ensure that material information relating to the registrant, including its consolidated subsidiaries, is made known to them by others within those entities, particularly during the period in which this report is being prepared, and that the information required in filings on Form N-CSR is recorded, processed, summarized, and reported on a timely basis.
(b) There were no changes in the registrant’s internal control over financial reporting (as defined in Rule 30a-3(d) under the Investment Company Act of 1940) that occurred during the period covered by this report that have materially affected, or are reasonably likely to materially affect, the registrant’s internal control over financial reporting.
Item 12. Disclosure of Securities Lending Activities for Closed-End Management Investment Companies.
Not applicable
| Item 13. | Exhibits. |
File the exhibits listed below as part of this Form. Letter or number the exhibits in the sequence indicated.
(a)(1) Any code of ethics, or amendment thereto, that is the subject of the disclosure required by Item 2, to the extent that the registrant intends to satisfy the Item 2 requirements through filing of an exhibit: Attached hereto
(a)(2) A separate certification for each principal executive officer and principal financial officer of the registrant as required by Rule 30a-2(a) under the Act (17 CFR 270.30a-2(a)): Attached hereto
(a)(3) Any written solicitation to purchase securities under Rule 23c-1 under the Act (17 CFR 270.23c-1) sent or given during the period covered by the report by or on behalf of the registrant to 10 or more persons: Not applicable
(a)(4) Change in the registrant’s independent public accountants: Not applicable
(b) Certifications required by Rule 30a-2(b) under the Act (17 CFR 270.30a-2(b)): Attached hereto
Exhibit 99.CODE ETH Code of Ethics
Exhibit 99.CERT Certifications required by Rule 30a-2(a) under the Act
Exhibit 99.906CERT Certifications required by Rule 30a-2(b) under the Act
SIGNATURES
Pursuant to the requirements of the Securities Exchange Act of 1934 and the Investment Company Act of 1940, the registrant has duly caused this report to be signed on its behalf by the undersigned, thereunto duly authorized.
| (Registrant) | Conestoga Funds | ||
| By (Signature and Title)* | /s/ Robert M. Mitchell. | ||
| Robert M. Mitchell, Chief Executive Officer | |||
| Date | December 3, 2021 | ||
| Pursuant to the requirements of the Securities Exchange Act of 1934 and the Investment Company Act of 1940, this report has been signed below by the following persons on behalf of the registrant and in the capacities and on the dates indicated. | |||
| By (Signature and Title)* | /s/ Robert M. Mitchell | ||
| Robert M. Mitchell, Chief Executive Officer | |||
| Date | December 3, 2021 | ||
| By (Signature and Title)* | /s/ Joseph F. Monahan | ||
| Joseph F. Monahan, Treasurer and Principal Accounting Officer | |||
| Date | December 3, 2021 | ||
| * | Print the name and title of each signing officer under his or her signature. |
CONESTOGA FUNDS
CODE OF CONDUCT FOR
PRINCIPAL EXECUTIVE OFFICER AND PRINCIPAL FINANCIAL OFFICER
I. Covered Officers/Purpose of the Code
This Code of Conduct (the “Code”) applies to the Principal Executive Officer and Principal Financial Officer of Conestoga Funds (“Conestoga”) (the “Covered Officers”), each of whom is set forth in Exhibit A, for the purpose of promoting:
1. Honest and ethical conduct, including the ethical handling of actual or apparent conflicts of interest between personal and professional relationships;
2. Full, fair, accurate, timely and understandable disclosure in reports and documents that a registrant files with, or submits to, the Securities and Exchange Commission (“SEC”) and in Conestoga’s other public communications;
3. Compliance with applicable laws and governmental rules and regulations;
4. The prompt internal reporting of violations of the Code to an appropriate person or persons identified in the Code; and
5. Accountability for adherence to the Code.
Each Covered Officer should adhere to a high standard of business ethics and should be sensitive to situations that may give rise to actual as well as apparent conflicts of interest.
II. Covered Officers Should Handle Ethically Actual and Apparent Conflicts of Interest
A. Overview. A “conflict of interest” occurs when a Covered Officer’s private interest interferes with the interests of, or his or her service to, Conestoga. For example, a conflict of interest would arise if a Covered Officer, or a member of his or her family, receives improper personal benefits as a result of his or her position with Conestoga.
Certain conflicts of interest that could arise out of the relationships between Covered Officers and Conestoga already are subject to conflict of interest provisions in the Investment Company Act of 1940, as amended (the “1940 Act”), and the Investment Advisers Act of 1940, as amended (the “Advisers Act”). For example, Covered Officers may not individually engage in certain transactions (such as the purchase or sale of securities or other property) with Conestoga because of their status as “affiliated persons” of Conestoga. Conestoga’s and its adviser’s compliance programs and procedures are designed to prevent, or identify and correct, violations of these provisions. This Code does not, and is not intended to, repeat or replace these programs and procedures, and such conflicts fall outside of the parameters of this Code.
Although typically not presenting an opportunity for improper personal benefit, conflicts may arise or result from the contractual relationship between Conestoga and the adviser and the administrator, whose officers or employees also serve as Covered Officers. As a result, this Code recognizes that the Covered Officers will, in the normal course of their duties (whether formally for Conestoga or for the adviser or the administrator, or for both), be involved in establishing policies and implementing decisions that will have different effects on the adviser, the administrator and Conestoga. The participation of the Covered Officers in such activities is inherent in the contractual relationship between the adviser, the administrator and Conestoga and is consistent with the performance by the Covered Officers of their duties as officers of Conestoga. Thus, if performed in conformity with the provisions of the 1940 Act and the Advisers Act, such activities will be deemed to have been handled ethically. In addition, Conestoga’s Board of Trustees (the “Board”) recognizes that the Covered Officers also may be officers or employees of one or more other investment companies covered, or that could become covered, by this or other codes.
Other conflicts of interest are covered by the Code, even if such conflicts of interest are not subject to provisions in the 1940 Act and the Advisers Act. The following list provides examples of conflicts of interest under the Code, but Covered Officers should keep in mind that these examples are not exhaustive. The overarching principle is that the personal interest of a Covered Officer should not be placed improperly before the interest of Conestoga.
B. Each Covered Officer must:
| 1. | Not use his or her personal influence or personal relationships improperly to influence investment decisions or financial reporting by Conestoga whereby the Covered Officer would benefit personally to the detriment of Conestoga; |
| 2. | Not cause Conestoga to take action, or fail to take action, for the individual personal benefit of the Covered Officer rather than the benefit of Conestoga; |
| 3. | Report at least annually outside business affiliations or other relationships (e.g., officer, director, governor, trustee, part-time employment) other than his or her relationship to Conestoga, the adviser or the administrator. |
C. There are some conflict of interest situations that may be discussed with the compliance officer who, for purposes of this Code, shall be the Compliance Officer of Conestoga Capital Advisors, LLC (Conestoga’s investment adviser) (the “Compliance Officer”) if material. Examples of these include:
1. Service as a director on the board of any public or private company;
2. The receipt, as an officer of Conestoga, of any gift in excess of $250;
3. The receipt of any entertainment from any company with which Conestoga has current or prospective business dealings, unless such entertainment is business related, reasonable in cost, appropriate as to time and place, and not so frequent as to raise any question of impropriety;
4. Any ownership interest in, or any consulting or employment relationship with, any of Conestoga’s service providers, other than its adviser, principal underwriter, administrator or any affiliated person thereof; or
5. A direct or indirect financial interest in commissions, transaction charges or spreads paid by Conestoga for effecting portfolio transactions or for selling or redeeming shares other than an interest arising from the Covered Officer’s employment, such as compensation or equity ownership.
III. Disclosure and Compliance
A Each Covered Officer should familiarize himself or herself with the disclosure requirements generally applicable to Conestoga.
B. Each Covered Officer should not knowingly misrepresent, or cause others to misrepresent, facts about Conestoga to others, whether within or outside Conestoga, including to the Board and auditors, and to governmental regulators and self-regulatory organizations.
C. Each Covered Officer should, to the extent appropriate within his or her area of responsibility, consult with other officers and employees of Conestoga, the adviser and the administrator with the goal of promoting full, fair, accurate, timely and understandable disclosure in the reports and documents Conestoga file with, or submit to, the SEC and in Conestoga’s other public communications.
D. It is the responsibility of each Covered Officer to promote compliance with the standards and restrictions imposed by applicable laws, rules and regulations.
IV. Reporting and Accountability
A. Each Covered Officer must:
| 1. | Upon adoption of the Code (or thereafter as applicable, upon becoming a Covered Officer), affirm in writing to the Board that he or she has received, read, and understands the Code; |
| 2. | Annually thereafter affirm to the Board that he or she has complied with the requirements of the Code; |
| 3. | Not retaliate against any other Covered Officer or any employee of Conestoga or its affiliated persons for reports of potential violations that are made in good faith; and |
| 4. | Notify the Compliance Officer promptly if he or she knows of any violation of this Code. Failure to do so is itself a violation of this Code. |
B. The Compliance Officer is responsible for applying this Code to specific situations in which questions are presented under it and has the authority to interpret this Code in any particular situation. The Board, or an appropriate committee thereof, shall consider any requests for waivers from this Code. To the extent required, Conestoga shall disclose any such waivers, as provided by SEC rules.
C. Conestoga will adhere to the following procedures in investigating and enforcing this Code:
| 1. | The Compliance Officer will take all appropriate action to investigate any potential violations reported to him or her; |
| 2. | If, after such investigation, the Compliance Officer believes that no violation has occurred, no further action is required; |
| 3. | Any matter that the Compliance Officer believes is a violation shall be reported to the Board or the appropriate committee; and |
| 4. | If the appropriate committee concurs that a violation has occurred, it will inform and make a recommendation to the Board, which will consider appropriate action, which may include review of, and appropriate modifications to, applicable policies and procedures; notification to appropriate personnel of the adviser or the administrator or their management; or a recommendation to dismiss or impose other appropriate sanctions on, the Covered Officer. |
V. Other Policies and Procedures
This Code shall be the sole code of conduct adopted by Conestoga for purposes of Section 406 of the Sarbanes-Oxley Act and the rules and forms applicable to registered investment companies relating to that section. Insofar as other policies or procedures of Conestoga, Conestoga’s adviser, or other service providers govern or purport to govern the behavior or activities of the Covered Officers who are subject to this Code, they are superseded by this Code to the extent that they overlap or conflict with the provisions of this Code. Conestoga’s and its adviser’s Codes of Ethics under Rule 17j-1 under the 1940 Act and the adviser’s insider trading policies are separate policies that apply to the Covered Officers and others, and are not part of this Code.
VI. Approval and Amendments
A majority of the Board, including a majority of the Trustees who are not “interested persons” (as defined in the 1940 Act) of Conestoga (the “Independent Trustees”), shall initially approve this Code and any amendments thereto, other than amendments to Exhibit A. To the extent required, Conestoga shall disclose any changes to this Code, as provided by SEC rules.
VII. Confidentiality
All reports and records prepared or maintained pursuant to this Code will be considered confidential and shall be maintained and protected accordingly. Except as otherwise required by law or this Code, such matters shall not be disclosed to anyone other than the Board; Conestoga’s officers, adviser, administrator or counsel; or counsel to the Independent Trustees.
VIII. Internal Use
The Code is intended solely for the internal use by Conestoga and does not constitute an admission, by or on behalf of Conestoga, as to any fact, circumstance, or legal conclusion.
Adopted: October 30, 2003
Revised: February 24, 2015
Revised: May 5, 2016
EX-99.CERT
CERTIFICATIONS
I, Robert M. Mitchell, certify that:
1. I have reviewed this report on Form N-CSR of Conestoga Funds;
2. Based on my knowledge, this report does not contain any untrue statement of a material fact or omit to state a material fact necessary to make the statements made, in light of the circumstances under which such statements were made, not misleading with respect to the period covered by this report;
3. Based on my knowledge, the financial statements, and other financial information included in this report, fairly present in all material respects the financial condition, results of operations, changes in net assets, and cash flows (if the financial statements are required to include a statement of cash flows) of the registrant as of, and for, the periods presented in this report;
4. The registrant’s other certifying officer(s) and I are responsible for establishing and maintaining disclosure controls and procedures (as defined in Rule 30a-3(c) under the Investment Company Act of 1940) and internal control over financial reporting (as defined in Rule 30a-3(d) under the Investment Company Act of 1940) for the registrant and have:
(a) Designed such disclosure controls and procedures, or caused such disclosure controls and procedures to be designed under our supervision, to ensure that material information relating to the registrant, including its consolidated subsidiaries, is made known to us by others within those entities, particularly during the period in which this report is being prepared;
(b) Designed such internal control over financial reporting, or caused such internal control over financial reporting to be designed under our supervision, to provide reasonable assurance regarding the reliability of financial reporting and the preparation of financial statements for external purposes in accordance with generally accepted accounting principles;
(c) Evaluated the effectiveness of the registrant’s disclosure controls and procedures and presented in this report our conclusions about the effectiveness of the disclosure controls and procedures, as of a date within 90 days prior to the filing date of this report based on such evaluation; and
(d) Disclosed in this report any change in the registrant’s internal control over financial reporting that occurred during the period covered by this report that has materially affected, or is reasonably likely to materially affect, the registrant’s internal control over financial reporting; and
5. The registrant’s other certifying officer(s) and I have disclosed to the registrant’s auditors and the audit committee of the registrant’s board of directors (or persons performing the equivalent functions):
(a) All significant deficiencies and material weaknesses in the design or operation of internal control over financial reporting which are reasonably likely to adversely affect the registrant’s ability to record, process, summarize, and report financial information; and
(b) Any fraud, whether or not material, that involves management or other employees who have a significant role in the registrant’s internal control over financial reporting.
| Date: December 3, 2021 | /s/ Robert M. Mitchell | |
| Robert M. Mitchell, Chief Executive Officer |
CERTIFICATIONS
I, Joseph F. Monahan, certify that:
1. I have reviewed this report on Form N-CSR of Conestoga Funds;
2. Based on my knowledge, this report does not contain any untrue statement of a material fact or omit to state a material fact necessary to make the statements made, in light of the circumstances under which such statements were made, not misleading with respect to the period covered by this report;
3. Based on my knowledge, the financial statements, and other financial information included in this report, fairly present in all material respects the financial condition, results of operations, changes in net assets, and cash flows (if the financial statements are required to include a statement of cash flows) of the registrant as of, and for, the periods presented in this report;
4. The registrant’s other certifying officer(s) and I are responsible for establishing and maintaining disclosure controls and procedures (as defined in Rule 30a-3(c) under the Investment Company Act of 1940) and internal control over financial reporting (as defined in Rule 30a-3(d) under the Investment Company Act of 1940) for the registrant and have:
(a) Designed such disclosure controls and procedures, or caused such disclosure controls and procedures to be designed under our supervision, to ensure that material information relating to the registrant, including its consolidated subsidiaries, is made known to us by others within those entities, particularly during the period in which this report is being prepared;
(b) Designed such internal control over financial reporting, or caused such internal control over financial reporting to be designed under our supervision, to provide reasonable assurance regarding the reliability of financial reporting and the preparation of financial statements for external purposes in accordance with generally accepted accounting principles;
(c) Evaluated the effectiveness of the registrant’s disclosure controls and procedures and presented in this report our conclusions about the effectiveness of the disclosure controls and procedures, as of a date within 90 days prior to the filing date of this report based on such evaluation; and
(d) Disclosed in this report any change in the registrant’s internal control over financial reporting that occurred during the period covered by this report that has materially affected, or is reasonably likely to materially affect, the registrant’s internal control over financial reporting; and
5. The registrant’s other certifying officer(s) and I have disclosed to the registrant’s auditors and the audit committee of the registrant’s board of directors (or persons performing the equivalent functions):
(a) All significant deficiencies and material weaknesses in the design or operation of internal control over financial reporting which are reasonably likely to adversely affect the registrant’s ability to record, process, summarize, and report financial information; and
(b) Any fraud, whether or not material, that involves management or other employees who have a significant role in the registrant’s internal control over financial reporting.
| Date: December 3, 2021 | /s/ Joseph F. Monahan | |
| Joseph F. Monahan, Treasurer and Principal Accounting Officer |
EX-99.906CERT
CERTIFICATIONS
Robert M. Mitchell, Chief Executive Officer, and Joseph F. Monahan, Treasurer and Principal Accounting Officer, of Conestoga Funds (the “Registrant”), each certify to the best of his knowledge that:
| 1. | The Registrant’s periodic report on Form N-CSR for the period ended September 30, 2021 (the “Form N-CSR”) fully complies with the requirements of section 13(a) or section 15(d) of the Securities Exchange Act of 1934, as amended; and |
| 2. | The information contained in the Form N-CSR fairly presents, in all material respects, the financial condition and results of operations of the Registrant. |
| CHIEF EXECUTIVE OFFICER | CHIEF FINANCIAL OFFICER | ||
| Conestoga Funds | Conestoga Funds | ||
| /s/ Robert M. Mitchell | /s/ Joseph F. Monahan | ||
| Robert M. Mitchell, Chief Executive Officer | Joseph F. Monahan, Treasurer and Principal Accounting Officer | ||
| Date: December 3, 2021 | Date: December 3, 2021 |
A signed original of this written statement required by Section 906, or other document authenticating, acknowledging or otherwise adopting the signature that appears in typed form within the electronic version of this written statement required by Section 906, has been provided to Conestoga Funds and will be retained by Conestoga Funds and furnished to the Securities and Exchange Commission or its staff upon request.
This certification is being furnished to the Securities and Exchange Commission solely pursuant to 18 U.S.C. 1350 and is not being filed as part of the Form N-CSR filed with the Commission.
Serious News for Serious Traders! Try StreetInsider.com Premium Free!
You May Also Be Interested In
- Suzano Ventures invests up to US$5 million into Bioform Technologies to further develop bio-based plastic alternatives
- Digital Health Leaders Meet at HIMSS24 Europe to Deliver Solutions to Tomorrow’s Healthcare Challenges
- Palliser Capital Proposes Advisory Resolution to Give Shareholders a Voice at Keisei’s Forthcoming AGM
Create E-mail Alert Related Categories
SEC FilingsSign up for StreetInsider Free!
Receive full access to all new and archived articles, unlimited portfolio tracking, e-mail alerts, custom newswires and RSS feeds - and more!
