

Form N-CSR BlackRock Hedge Fund For: Mar 31
 Tweet
Tweet Share
ShareUNITED STATES
SECURITIES AND EXCHANGE COMMISSION
Washington, D.C. 20549
FORM N-CSR
CERTIFIED SHAREHOLDER REPORT OF REGISTERED MANAGEMENT
INVESTMENT COMPANIES
Investment Company Act file number: 811-23626
| Name of Fund: | BlackRock Hedge Fund Guided Portfolio Solution |
| Fund Address: | 100 Bellevue Parkway, Wilmington, DE 19809 |
Name and address of agent for service: John M. Perlowski, Chief Executive Officer, BlackRock Hedge Fund Guided Portfolio Solution, 50 Hudson Yards, New York, NY 10001
Registrant’s telephone number, including area code: (800) 882-0052, Option 4
Date of fiscal year end: 3/31/2023
Date of reporting period: 3/31/2023
Item 1 – Report to Stockholders
(a) The Report to Shareholders is attached herewith.

|
MARCH 31, 2023 |
| 2023 Annual Report | ||
BlackRock Hedge Fund Guided Portfolio Solution
| Not FDIC Insured • May Lose Value • No Bank Guarantee |
Dear Shareholder,
Significant economic headwinds emerged during the 12-month reporting period ended March 31, 2023, as investors navigated changing economic conditions and volatile markets. The U.S. economy shrank in the first half of 2022 before returning to modest growth in the second half of the year, marking a shift to a more challenging post-reopening economic environment. Changes in consumer spending patterns and a tight labor market led to elevated inflation, which reached a 40-year high before beginning to moderate.
Equity prices fell as interest rates rose, particularly during the first half of the reporting period. Both large- and small-capitalization U.S. stocks declined, although equities began to recover in the second half of the period as inflation eased and economic growth resumed. Emerging market stocks and international equities from developed markets declined overall, pressured by rising interest rates and volatile commodities prices.
The 10-year U.S. Treasury yield rose during the reporting period, driving its price down, as investors reacted to fluctuating inflation data and attempted to anticipate its impact on future interest rate changes. The corporate bond market also faced inflationary headwinds, and higher interest rates led to rising borrowing costs for corporate issuers.
The U.S. Federal Reserve (the “Fed”), acknowledging that inflation has been more persistent than expected, raised interest rates eight times. Furthermore, the Fed wound down its bond-buying programs and accelerated the reduction of its balance sheet.
Restricted labor supply kept inflation elevated even as other inflation drivers, such as goods prices and energy costs, moderated. While economic growth slowed in the last year, we believe that taming inflation requires a more substantial decline that lowers demand to a level more in line with the economy’s productive capacity. Although the Fed has decelerated the pace of interest rate hikes, we believe that it still seems determined to get inflation back to target. With this in mind, we believe the possibility of a U.S. recession in the near-term is high, but the dimming economic outlook has not yet been fully reflected in current market prices. We believe investors should expect a period of higher volatility as markets adjust to the new economic reality and policymakers attempt to adapt to rapidly changing conditions. Turmoil in the banking sector late in the period highlighted the potential for the knock-on effects of substantially higher interest rates to disrupt markets with little warning.
While we favor an overweight to equities in the long term, we prefer an underweight stance on equities overall in the near term. Expectations for corporate earnings remain elevated, which seems inconsistent with the possibility of a recession. Nevertheless, we are overweight on emerging market stocks as we believe a weakening U.S. dollar provides a supportive backdrop. We also see long-term opportunities in credit, where we believe that valuations are appealing and higher yields provide attractive income, although we are neutral on credit in the near term, as we’re concerned about tightening credit and financial conditions. However, we believe there are still some strong opportunities for a six- to twelve-month horizon, particularly short-term U.S. Treasuries, global inflation-linked bonds, and emerging market bonds denominated in local currency.
Overall, our view is that investors need to think globally, position themselves to be prepared for a decarbonizing economy, and be nimble as market conditions change. We encourage you to talk with your financial advisor and visit blackrock.com for further insight about investing in today’s markets.
Sincerely,

Rob Kapito
President, BlackRock Advisors, LLC

Rob Kapito
President, BlackRock Advisors, LLC
| Total Returns as of March 31, 2023 | ||||
| 6-Month | 12-Month | |||
| U.S. large cap equities (S&P 500® Index)
|
15.62% | (7.73)% | ||
| U.S. small cap equities (Russell 2000® Index)
|
9.14 | (11.61) | ||
| International equities (MSCI Europe, Australasia, Far East Index)
|
27.27 | (1.38) | ||
| Emerging market equities (MSCI Emerging Markets Index)
|
14.04 | (10.70) | ||
| 3-month Treasury bills (ICE BofA 3-Month U.S. Treasury Bill Index)
|
1.93 | 2.52 | ||
| U.S. Treasury securities (ICE BofA 10-Year U.S. Treasury Index)
|
4.38 | (6.90) | ||
| U.S. investment grade bonds (Bloomberg U.S. Aggregate Bond Index)
|
4.89 | (4.78) | ||
| Tax-exempt municipal bonds (Bloomberg Municipal Bond Index)
|
7.00 | 0.26 | ||
| U.S. high yield bonds (Bloomberg U.S. Corporate High Yield 2% Issuer Capped Index)
|
7.88 | (3.35) | ||
| Past performance is not an indication of future results. Index performance is shown for illustrative purposes only. You cannot invest directly in an index. | ||||
| 2 | T H I S P A G E I S N O T P A R T O F Y O U R F U N D R E P O R T |
| Page
|
||||
| 2 | ||||
| Annual Report: |
||||
| 4 | ||||
| 5 | ||||
| 8 | ||||
| Disclosure of Expenses for Continuously Offered Closed-End Funds |
8 | |||
| Financial Statements: |
||||
| 9 | ||||
| 11 | ||||
| 12 | ||||
| 13 | ||||
| 14 | ||||
| 15 | ||||
| 17 | ||||
| 25 | ||||
| 26 | ||||
| 27 | ||||
| 31 | ||||

| 3 |
| The Benefits and Risks of Leveraging | BlackRock Hedge Fund Guided Portfolio Solution |
The Fund may utilize leverage to seek to enhance the distribution rate on, and net asset value (“NAV”) of, its common shares (“Common Shares”). However, there is no guarantee that these objectives can be achieved in all interest rate environments.
In general, the concept of leveraging is based on the premise that the financing cost of leverage, which is based on short-term interest rates, is normally lower than the income earned by the Fund on its longer-term portfolio investments purchased with the proceeds from leverage. To the extent that the total assets of the Fund (including the assets obtained from leverage) are invested in higher-yielding portfolio investments, the Fund’s shareholders benefit from the incremental net income. The interest earned on securities purchased with the proceeds from leverage (after paying the leverage costs) is paid to shareholders in the form of dividends, and the value of these portfolio holdings (less the leverage liability) is reflected in the per share NAV.
To illustrate these concepts, assume the Fund’s capitalization is $100 million and it utilizes leverage for an additional $30 million, creating a total value of $130 million available for investment in longer-term income securities. If prevailing short-term interest rates are 3% and longer-term interest rates are 6%, the yield curve has a strongly positive slope. In this case, the Fund’s financing costs on the $30 million of proceeds obtained from leverage are based on the lower short-term interest rates. At the same time, the securities purchased by the Fund with the proceeds from leverage earn income based on longer-term interest rates. In this case, the Fund’s financing cost of leverage is significantly lower than the income earned on the Fund’s longer-term investments acquired from such leverage proceeds, and therefore the holders of Common Shares (“Common Shareholders”) are the beneficiaries of the incremental net income.
However, in order to benefit shareholders, the return on assets purchased with leverage proceeds must exceed the ongoing costs associated with the leverage. If interest and other costs of leverage exceed the Fund’s return on assets purchased with leverage proceeds, income to shareholders is lower than if the Fund had not used leverage. Furthermore, the value of the Fund’s portfolio investments generally varies inversely with the direction of long-term interest rates, although other factors can influence the value of portfolio investments. In contrast, the amount of the Fund’s obligations under its respective leverage arrangement generally does not fluctuate in relation to interest rates. As a result, changes in interest rates can influence the Fund’s NAVs positively or negatively. Changes in the future direction of interest rates are very difficult to predict accurately, and there is no assurance that the Fund’s intended leveraging strategy will be successful.
The use of leverage also generally causes greater changes in the Fund’s NAV, market price and dividend rates than comparable portfolios without leverage. In a declining market, leverage is likely to cause a greater decline in the NAV and market price of the Fund’s shares than if the Fund were not leveraged. In addition, the Fund may be required to sell portfolio securities at inopportune times or at distressed values in order to comply with regulatory requirements applicable to the use of leverage or as required by the terms of leverage instruments, which may cause the Fund to incur losses. The use of leverage may limit the Fund’s ability to invest in certain types of securities or use certain types of hedging strategies. The Fund incurs expenses in connection with the use of leverage, all of which are borne by shareholders and may reduce income to the shareholders. Moreover, to the extent the calculation of the Fund’s investment advisory fees includes assets purchased with the proceeds of leverage, the investment advisory fees payable to the Fund’s investment adviser will be higher than if the Fund did not use leverage.
The Fund may utilize leverage through a credit facility as described in the Notes to Financial Statements, if applicable.
Under the Investment Company Act of 1940, as amended (the “1940 Act”), the Fund is permitted to borrow money (including through the use of TOB Trusts) or issue debt securities up to 33 1/3% of its total managed assets. The Fund may voluntarily elect to limit its leverage to less than the maximum amount permitted under the 1940 Act. In addition, the Fund may also be subject to certain asset coverage, leverage or portfolio composition requirements imposed by its credit facility, which may be more stringent than those imposed by the 1940 Act.
| 4 | 2 0 2 3 B L A C K R O C K A N N U A L R E P O R T T O S H A R E H O L D E R S |
| Fund Summary as of March 31, 2023 | BlackRock Hedge Fund Guided Portfolio Solution |
Investment Objective
BlackRock Hedge Fund Guided Portfolio Solution’s (the “Fund”) investment objective is to seek, over time, absolute and risk-adjusted returns that exhibit low volatility and low-to-moderate correlation to global equity and fixed income markets, while preserving capital. The Fund seeks to achieve its investment objective by allocating the Fund’s assets to private investment vehicles commonly referred to as “hedge funds” (“Portfolio Funds”) that are managed by third-party investment management firms that are not affiliated with the Fund’s investment adviser.
The Fund’s common shares are not listed on any securities exchange. The Fund is designed for long-term investors, and an investment in the common shares, unlike an investment in a traditional listed closed-end fund, should be considered illiquid.
No assurance can be given that the Fund’s investment objective will be achieved.
Net Asset Value Per Share Summary
| 03/31/23 | 03/31/22 | Change | High | Low | ||||||||||||||||
| Net Asset Value — Class I | $ | 10.03 | $ | 10.14 | (1.08 | )% | $ | 10.18 | $ | 9.90 | ||||||||||
| Net Asset Value — Class A | 9.97 | 10.11 | (1.38 | ) | 10.15 | 9.87 | ||||||||||||||
GROWTH OF $10,000 INVESTMENT
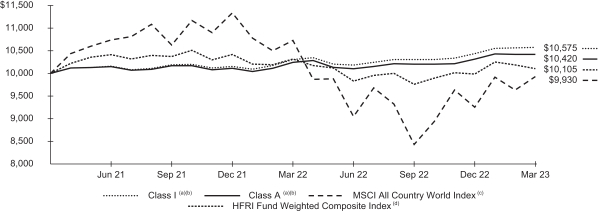
The Fund commenced operations on March 31, 2021.
| (a) | Assuming maximum sales charges, if any, transaction costs and other operating expenses, including investment advisory fees. |
| (b) | The Fund has adopted a policy to invest, under normal circumstances, at least 80% of the value of its net assets, plus the amount of any borrowings for investment purposes, in Portfolio Funds. |
| (c) | An index that captures large- and mid-cap representation across certain developed markets and certain emerging markets. |
| (d) | A global, equal-weighted index of single-manager funds that report to Hedge Fund Research Database. |
| Average Annual Total Returns(a) | ||||||||
| 1 Year | Since Inception(b) |
|||||||
| Class I | 2.60 | % | 2.83% | |||||
| Class A | 1.71 | 2.08 | ||||||
| HFRI Fund Weighted Composite Index(c) | (2.05 | ) | 0.52 | |||||
| MSCI All Country World Index®(d) | (7.44 | ) | (0.35) | |||||
(a) See “About Fund Performance” for a detailed description of share classes and how performance was calculated for certain share classes.
(b) The Fund commenced operations on March 31, 2021.
(c) A global, equal-weighted index of single-manager funds that report to Hedge Fund Research Database.
(d) An index that captures large- and mid-cap representation across certain developed markets and certain emerging markets.
Past performance is not an indication of future results.
Performance results may include adjustments made for financial reporting purposes in accordance with U.S. generally accepted accounting principles.
The Fund is presenting the performance of one or more indices for informational purposes only. The Fund is actively managed and does not seek to track or replicate the performance of any index. The index performance shown is not intended to be indicative of the Fund’s investment strategies, portfolio components or past or future performance.
| F U N D S U M M A R Y |
5 |
| Fund Summary as of March 31, 2023 (continued) | BlackRock Hedge Fund Guided Portfolio Solution |
Portfolio Management Commentary
Investment Strategies
The Fund invests in portfolios of hedge funds as a means to gain exposure to various types of investment strategies in four primary hedge fund strategies, including Equity Hedge, Event-Driven, Relative Value and Macro. The following descriptions are not intended to be complete explanations of the strategies described or a list of all possible investment strategies or methods that may be used by the Fund.
Equity Hedge strategies maintain positions both long and short, normally with a primary focus on equity securities and equity derivatives. A wide variety of investment processes can be employed to arrive at an investment decision, including both quantitative and fundamental techniques.
Event-Driven strategies generally maintain positions in companies currently or prospectively involved in a wide variety of corporate transactions, including, but not limited to, mergers, restructurings, financial distress, tender offers, shareholder buybacks, debt exchanges, security issuances or other capital structure adjustments.
Relative Value strategies maintain positions where the investment thesis is predicated on the realization of a valuation discrepancy in the relationship between multiple securities. These strategies employ a variety of fundamental and quantitative techniques.
Macro strategies employ a broad range of strategies where the investment process is predicated on movements in underlying economic variables and the impact of these movements on equity, fixed income, hard currency and commodity markets.
What factors influenced performance?
The Fund’s exposure to Macro strategies made the largest contribution to positive performance during the period and benefited from price volatility across the energy complex and interest rate yield curves. Relative Value strategies overall added to performance, with positive contribution from credit-related strategies and quantitative strategies offset by modestly negative contribution from volatility arbitrage strategies. Event-Driven strategies were mixed, notably in merger arbitrage, given spread widening resulting from equity volatility and deal-specific developments. Equity Hedge strategies were the largest detractors from performance over the period given a challenging backdrop in equity markets globally.
Describe recent portfolio activity.
On June 1, 2022, the Fund made one new allocation to Drakewood Prospect Fund Ltd.
On September 1, 2022, the Fund made one new allocation to Atlas Enhanced Fund, Ltd.
Over the period, the Fund fully redeemed from Pelham Long/Short Fund, Ltd. and Rose Grove Offshore Fund I, Ltd., and initiated a full redemption from Segantii Asia-Pacific Equity Multi-Strategy Fund, expected to complete by May 2023.
In aggregate, the Fund’s position changes over the period resulted in increased exposure to Equity Hedge strategies, decreased exposure to Relative Value and Event-Driven strategies, and slight changes in Macro strategies. Cash balance in the portfolio was higher at the end of the period.
Describe portfolio positioning at period end.
At period end, the Fund held broad exposure across different hedge fund strategies. For purposes of financial reporting, the underlying hedge funds are categorized based on their primary underlying strategy exposure. In this regard, the categories of investment strategies as a percentage of the Fund’s long term investments are 29% Equity Hedge, 24% Macro, 17% Event-Driven and 17% Relative Value. Cash as a percentage of the Fund’s investments was 13% at period end. Cash is held in the portfolio for deployment in new and existing positions and to comply with regulations. The Fund’s cash position had no material impact to Fund performance during the period.
| 6 | 2 0 2 3 B L A C K R O C K A N N U A L R E P O R T T O S H A R E H O L D E R S |
| Fund Summary as of March 31, 2023 (continued) | BlackRock Hedge Fund Guided Portfolio Solution |
Portfolio Information
TEN LARGEST HOLDINGS
|
|
||||
| Security | Percent of Net Assets |
|||
|
|
||||
| Atlas Enhanced Fund, Ltd. |
8.9% | |||
| Pentwater Event Fund, Ltd. |
8.5% | |||
| One William Street Capital Offshore Fund, Ltd. |
8.2 | |||
| Stratus Feeder, Ltd. |
7.9 | |||
| Voleon Composition International Fund, Ltd. |
6.3 | |||
| Manticore Fund (Cayman) Ltd. |
4.8 | |||
| Polar Multi-Strategy Fund |
4.4 | |||
| East One Commodity Fund Limited |
4.4 | |||
| Schonfeld Strategic Partners Offshore Fund, Ltd. |
4.4 | |||
| Kadensa Fund |
4.3 | |||
|
|
||||
SECTOR ALLOCATION
|
|
||||
| Sector(a) | Percent of
|
|||
|
|
||||
| Equity Hedge |
28.7% | |||
| Macro |
24.5 | |||
| Event-Driven |
17.0 | |||
| Relative Value |
16.9 | |||
| Short-Term Securities |
10.4 | |||
| Other Assets Less Liabilities |
2.5 | |||
|
|
||||
| (a) | For Fund compliance purposes, the Fund’s sector classifications refer to one or more of the sector sub-classifications used by one or more widely recognized market indexes or ratings group indexes, and/or as defined by the investment adviser. These definitions may not apply for purposes of this report, which may combine such sector sub-classifications for reporting ease. |
| F U N D S U M M A R Y | 7 |
| About Fund Performance | BlackRock Hedge Fund Guided Portfolio Solution |
Class I Shares are not subject to any sales charge. These shares bear no ongoing distribution or service fees and are available only to certain eligible investors.
Class A Shares are not subject to any sales charge. These shares are subject to an ongoing distribution fee and shareholder servicing fee of 0.75% per year.
Past performance is not an indication of future results. Financial markets have experienced extreme volatility and trading in many instruments has been disrupted. These circumstances may continue for an extended period of time, and may continue to affect adversely the value and liquidity of the Fund’s investments. As a result, current performance may be lower or higher than the performance data quoted. Refer to blackrock.com to obtain performance data current to the most recent month-end. Performance results do not reflect the deduction of taxes that a shareholder would pay on Fund distributions or the redemption of Fund shares. Figures shown in the performance table(s) assume reinvestment of all distributions, if any, at net asset value (“NAV”) on the ex-dividend date or payable date, as applicable. Investment return and principal value of shares will fluctuate so that shares, when redeemed, may be worth more or less than their original cost. Distributions paid to each class of shares will vary because of the different levels of service, distribution and transfer agency fees applicable to each class, which are deducted from the income available to be paid to shareholders.
BlackRock Advisors, LLC (the “Manager”), the Fund’s investment adviser, has contractually and/or voluntarily agreed to waive and/or reimburse a portion of the Fund’s expenses. Without such waiver(s) and/or reimbursement(s), the Fund’s performance would have been lower. With respect to the Fund’s voluntary waiver(s), if any, the Manager is under no obligation to waive and/or reimburse or to continue waiving and/or reimbursing its fees and such voluntary waiver(s) may be reduced or discontinued at any time. With respect to the Fund’s contractual waiver(s), if any, the Manager is under no obligation to continue waiving and/or reimbursing its fees after the applicable termination date of such agreement. See the Notes to Financial Statements for additional information on waivers and/or reimbursements.
Disclosure of Expenses for Continuously Offered Closed-End Funds
Shareholders of the Fund may incur the following charges: (a) transactional expenses, including early withdrawal fees; and (b) operating expenses, including investment advisory fees, and other fund expenses. The example below (which is based on a hypothetical investment of $1,000 invested at the beginning of the period and held through the end of the period) is intended to assist shareholders both in calculating expenses based on an investment in the Fund and in comparing these expenses with similar costs of investing in other funds.
The expense example provides information about actual account values and actual expenses. Annualized expense ratios reflect contractual and voluntary fee waivers, if any. In order to estimate the expenses a shareholder paid during the period covered by this report, shareholders can divide their account value by $1,000 and then multiply the result by the number corresponding to their Fund and share class under the heading entitled “Expenses Paid During the Period.”
The expense example also provides information about hypothetical account values and hypothetical expenses based on the Fund’s actual expense ratio and an assumed rate of return of 5% per year before expenses. In order to assist shareholders in comparing the ongoing expenses of investing in the Fund and other funds, compare the 5% hypothetical example with the 5% hypothetical examples that appear in shareholder reports of other funds.
The expenses shown in the expense example are intended to highlight shareholders’ ongoing costs only and do not reflect transactional expenses, such as sales charges, if any. Therefore, the hypothetical example is useful in comparing ongoing expenses only and will not help shareholders determine the relative total expenses of owning different funds. If these transactional expenses were included, shareholder expenses would have been higher.
| Actual | Hypothetical 5% Return | |||||||||||||||||||||||||||||||
|
|
|
|
|
|||||||||||||||||||||||||||||
| |
Beginning Account Value (10/01/22) |
|
Ending Account Value (03/31/23) |
|
|
Expenses Paid During the Period |
(a) |
|
Beginning Account Value (10/01/22) |
|
|
Ending Account Value (03/31/23) |
|
|
Expenses Paid During the Period |
(a) |
|
Annualized Expense Ratio |
| |||||||||||||
| Class I |
$ | 1,000.00 | $ | 1,026.00 | $ | 6.21 | $ | 1,000.00 | $ | 1,003.34 | $ | 6.14 | 1.23 | % | ||||||||||||||||||
| Class A |
|
1,000.00
|
|
|
1,021.20
|
|
|
10.88
|
|
|
1,000.00
|
|
|
992.87
|
|
|
10.73
|
|
|
2.16
|
| |||||||||||
| (a) | For each class of the Fund, expenses are equal to the annualized expense ratio for the class, multiplied by the average account value over the period, multiplied by 182/365 (to reflect the one-half year period shown). |
| 8 | 2 0 2 3 B L A C K R O C K A N N U A L R E P O R T T O S H A R E H O L D E R S |
| March 31, 2023 |
BlackRock Hedge Fund Guided Portfolio Solution (Percentages shown are based on Net Assets) |
| Portfolio Funds(a)(b) | First Acquisition Date |
Cost | Value | %of Net Assets |
||||||||||||
|
|
||||||||||||||||
| Equity Hedge |
||||||||||||||||
| Atlas Enhanced Fund, Ltd |
09/01/22 | $ | 7,300,000 | $ | 7,540,811 | 8.9 | % | |||||||||
| Kadensa Fund |
04/01/21 | 3,687,500 | 3,598,413 | 4.3 | % | |||||||||||
| Manticore Fund (Cayman) Ltd. |
04/01/21 | 4,112,500 | 4,016,396 | 4.8 | % | |||||||||||
| Schonfeld Strategic Partners Offshore Fund, Ltd. |
01/01/22 | 3,600,000 | 3,686,646 | 4.4 | % | |||||||||||
| Voleon Composition International Fund, Ltd. |
04/01/21 | 4,653,483 | 5,277,779 | 6.3 | % | |||||||||||
|
|
|
|
|
|
|
|||||||||||
| Total Equity Hedge |
23,353,483 | 24,120,045 | 28.7 | % | ||||||||||||
| Event-Driven |
||||||||||||||||
| MY Asian Opportunities Unit Trust |
05/01/21 | 3,766,075 | 3,512,113 | 4.2 | % | |||||||||||
| Nekton Global Fund Ltd. |
10/01/21 | 3,437,242 | 3,555,648 | 4.2 | % | |||||||||||
| Pentwater Event Fund, Ltd. |
04/01/21 | 6,425,000 | 7,155,621 | 8.5 | % | |||||||||||
| Segantii Asia-Pacific Equity Multi-Strategy Fund |
11/01/21 | 50,352 | 52,353 | 0.1 | % | |||||||||||
|
|
|
|
|
|
|
|||||||||||
| Total Event-Driven |
13,678,669 | 14,275,735 | 17.0 | % | ||||||||||||
| Macro |
||||||||||||||||
| Crabel Fund SPC, Ltd. |
04/01/21 | 3,162,500 | 3,429,305 | 4.1 | % | |||||||||||
| Drakewood Prospect Fund Ltd. |
06/01/22 | 3,550,000 | 3,471,019 | 4.1 | % | |||||||||||
| East One Commodity Fund Limited |
05/01/21 | 2,987,500 | 3,715,882 | 4.4 | % | |||||||||||
| Stratus Feeder, Ltd. |
04/01/21 | 4,834,500 | 6,632,708 | 7.9 | % | |||||||||||
| Systematica Alternative Markets Fund Ltd. |
05/01/21 | 3,087,500 | 3,372,340 | 4.0 | % | |||||||||||
|
|
|
|
|
|
|
|||||||||||
| Total Macro |
17,622,000 | 20,621,254 | 24.5 | % | ||||||||||||
| Relative Value |
||||||||||||||||
| One William Street Capital Offshore Fund, Ltd. |
04/01/21 | 6,250,000 | 6,882,838 | 8.2 | % | |||||||||||
| Parallax Offshore Investors Fund, Ltd. |
04/01/21 | 3,468,187 | 3,597,573 | 4.3 | % | |||||||||||
| Polar Multi-Strategy Fund |
04/01/21 | 3,601,771 | 3,728,703 | 4.4 | % | |||||||||||
|
|
|
|
|
|
|
|||||||||||
| Total Relative Value |
13,319,958 | 14,209,114 | 16.9 | % | ||||||||||||
|
|
|
|
|
|
|
|||||||||||
| Total Portfolio Funds |
67,974,110 | 73,226,148 | 87.1 | % | ||||||||||||
|
|
|
|
|
|
|
|||||||||||
| Security | Shares | Cost | Value | %of Net Assets |
||||||||||||
|
|
||||||||||||||||
| Short-Term Securities |
||||||||||||||||
| Money Market Funds |
||||||||||||||||
| BlackRock Liquidity Funds, T-Fund, Institutional Class, 4.70%(c)(d) |
8,745,590 | 8,745,590 | 8,745,590 | 10.4 | % | |||||||||||
|
|
|
|
|
|
|
|||||||||||
| Total Short-Term Securities |
8,745,590 | 8,745,590 | 10.4 | % | ||||||||||||
|
|
||||||||||||||||
| Total Investments |
$ | 76,719,700 | 81,971,738 | 97.5 | % | |||||||||||
|
|
|
|||||||||||||||
| Other Assets Less Liabilities |
2,083,048 | 2.5 | % | |||||||||||||
|
|
|
|
|
|||||||||||||
| Net Assets |
$ | 84,054,786 | 100.0 | % | ||||||||||||
|
|
|
|
|
|||||||||||||
| (a) | Non-income producing security. |
| (b) | Restricted security as to resale, excluding 144A securities. The Fund held restricted securities with a current value of $73,226,148, representing 87.1% of its net assets as of period end, and an original cost of $67,974,110. |
| (c) | Affiliate of the Fund. |
| (d) | Annualized 7-day yield as of period end. |
Affiliates
Investments in issuers considered to be affiliate(s) of the Fund during the year ended March 31, 2023 for purposes of Section 2(a)(3) of the Investment Company Act of 1940, as amended, were as follows:
|
|
||||||||||||||||||||||||||||||||||||
| Affiliated Issuer | Value at 03/31/22 |
Purchases at Cost |
Proceeds from Sale |
Net Realized Gain (Loss) |
Change in Unrealized Appreciation (Depreciation) |
Value at 03/31/23 |
Shares Held at 03/31/23 |
Income | Capital Gain Distributions from Underlying Funds |
|||||||||||||||||||||||||||
|
|
||||||||||||||||||||||||||||||||||||
| BlackRock Liquidity Funds, T-Fund, Institutional Class |
$ | 4,721,908 | $ | 4,023,682 | (a) | $ | — | $ | — | $ | — | $ | 8,745,590 | 8,745,590 | $ | 191,614 | $ | — | ||||||||||||||||||
|
|
|
|
|
|
|
|
|
|
|
|||||||||||||||||||||||||||
(a) Represents net amount purchased (sold).
|
S C H E D U L E O F I N V E S T M E N T S |
9 |
| Schedule of Investments (continued) March 31, 2023 |
BlackRock Hedge Fund Guided Portfolio Solution |
Fair Value Hierarchy as of Period End
Various inputs are used in determining the fair value of financial instruments. For a description of the input levels and information about the Fund’s policy regarding valuation of financial instruments, refer to the Notes to Financial Statements.
The following table summarizes the Fund’s financial instruments categorized in the fair value hierarchy. The breakdown of the Fund’s financial instruments into major categories is disclosed in the Schedule of Investments above.
| Level 1
|
Level 2
|
Level 3
|
Total
|
|||||||||||||
| Assets |
||||||||||||||||
| Investments |
||||||||||||||||
| Short-Term Securities |
||||||||||||||||
| Money Market Funds |
$ | 8,745,590 | $ | — | $ | — | $ | 8,745,590 | ||||||||
|
|
|
|
|
|
|
|
|
|||||||||
| Investments valued at NAV(a) |
73,226,148 | |||||||||||||||
|
|
|
|||||||||||||||
| $ | 81,971,738 | |||||||||||||||
|
|
|
|||||||||||||||
| (a) | Certain investments of the Fund were fair valued using NAV as a practical expedient as no quoted market value is available and therefore have been excluded from the fair value hierarchy. |
See notes to financial statements.
| 10 | 2 0 2 3 B L A C K R O C K A N N U A L R E P O R T T O S H A R E H O L D E R S |
Statement of Assets and Liabilities
March 31, 2023
| BlackRock Hedge Fund Guided Portfolio Solution |
||||
| ASSETS |
||||
| Investments, at value — unaffiliated(a) |
$ | 73,226,148 | ||
| Investments, at value — affiliated(b) |
8,745,590 | |||
| Investments in Portfolio Funds paid in advance |
7,250,000 | |||
| Investments in Portfolio Funds sold receivable |
996,920 | |||
| Receivables: |
||||
| Dividends — affiliated |
44,837 | |||
| From the Manager |
1,719 | |||
|
|
|
|||
| Total assets |
90,265,214 | |||
|
|
|
|||
| LIABILITIES |
||||
| Capital contributions received in advance |
4,275,000 | |||
| Repurchase offer payable |
1,403,100 | |||
| Payables: |
||||
| Administration fees |
50,000 | |||
| Investment advisory fees |
113,238 | |||
| Other accrued expenses |
263,089 | |||
| Service and distribution fees |
106,001 | |||
|
|
|
|||
| Total liabilities |
6,210,428 | |||
|
|
|
|||
| NET ASSETS |
$ | 84,054,786 | ||
|
|
|
|||
| NET ASSETS CONSIST OF: |
||||
| Paid-in capital |
$ | 84,307,607 | ||
| Accumulated loss |
(252,821 | ) | ||
|
|
|
|||
| NET ASSETS |
$ | 84,054,786 | ||
|
|
|
|||
| NET ASSET VALUE |
||||
| Class I | ||||
| Net assets |
$ | 26,547,071 | ||
|
|
|
|||
| Shares outstanding |
2,646,919 | |||
|
|
|
|||
| Net asset value |
$ | 10.03 | ||
|
|
|
|||
| Class A | ||||
| Net assets |
$ | 57,507,715 | ||
|
|
|
|||
| Shares outstanding |
5,767,381 | |||
|
|
|
|||
| Net asset value |
$ | 9.97 | ||
|
|
|
|||
| (a) Investments, at cost — unaffiliated |
$ | 67,974,110 | ||
| (b) Investments, at cost — affiliated |
$ | 8,745,590 | ||
See notes to financial statements.
|
F I N A N C I A L S T A T E M E N T S |
11 |
Year Ended March 31, 2023
| BlackRock Hedge Fund Guided Portfolio Solution |
||||
| INVESTMENT INCOME |
||||
| Dividends — affiliated |
$ | 191,614 | ||
| Other income — unaffiliated |
13,164 | |||
|
|
|
|||
| Total investment income |
204,778 | |||
|
|
|
|||
| EXPENSES |
||||
| Investment advisory |
391,021 | |||
| Service and distribution — class specific |
359,349 | |||
| Professional |
340,417 | |||
| Administration |
175,000 | |||
| Transfer agent — class specific |
53,083 | |||
| Custodian |
39,839 | |||
| Accounting services |
21,563 | |||
| Trustees and Officer |
3,565 | |||
| Registration |
2,880 | |||
| Miscellaneous |
48,656 | |||
|
|
|
|||
| Total expenses |
1,435,373 | |||
| Less: |
||||
| Fees waived and/or reimbursed by the Manager |
(28,651 | ) | ||
| Transfer agent fees waived and/or reimbursed — class specific |
(53,083 | ) | ||
|
|
|
|||
| Total expenses after fees waived and/or reimbursed |
1,353,639 | |||
|
|
|
|||
| Net investment loss |
(1,148,861 | ) | ||
|
|
|
|||
| REALIZED AND UNREALIZED GAIN (LOSS) |
||||
| Net realized gain (loss) from: |
||||
| Investments — unaffiliated |
(848,204 | ) | ||
|
|
|
|||
| (848,204 | ) | |||
|
|
|
|||
| Net change in unrealized appreciation (depreciation) on: |
||||
| Investments — unaffiliated |
3,709,128 | |||
|
|
|
|||
| Net realized and unrealized gain |
2,860,924 | |||
|
|
|
|||
| NET INCREASE IN NET ASSETS RESULTING FROM OPERATIONS |
$ | 1,712,063 | ||
|
|
|
|||
See notes to financial statements.
| 12 | 2 0 2 3 B L A C K R O C K A N N U A L R E P O R T T O S H A R E H O L D E R S |
Statements of Changes in Net Assets
| BlackRock Hedge Fund Guided Portfolio Solution | ||||||||
| Year Ended 03/31/23 |
Year Ended 03/31/22 |
|||||||
| INCREASE (DECREASE) IN NET ASSETS |
||||||||
| OPERATIONS |
||||||||
| Net investment loss |
$ | (1,148,861 | ) | $ | (726,669 | ) | ||
| Net realized gain (loss) |
(848,204 | ) | 259,220 | |||||
| Net change in unrealized appreciation (depreciation) |
3,709,128 | 1,542,910 | ||||||
|
|
|
|
|
|||||
| Net increase in net assets resulting from operations |
1,712,063 | 1,075,461 | ||||||
|
|
|
|
|
|||||
| DISTRIBUTIONS TO SHAREHOLDERS |
||||||||
| Class A |
(1,652,445 | ) | (398,502 | ) | ||||
| Class I |
(888,253 | ) | (286,621 | ) | ||||
|
|
|
|
|
|||||
| Decrease in net assets resulting from distributions to shareholders |
(2,540,698 | ) | (685,123 | ) | ||||
|
|
|
|
|
|||||
| CAPITAL SHARE TRANSACTIONS |
||||||||
| Proceeds from issuance of capital shares (net of change in capital contributions received in advance) |
29,870,000 | 53,803,500 | ||||||
| Reinvestment of distributions |
2,528,683 | 306,079 | ||||||
| Repurchase of shares resulting from tender offers |
(2,090,597 | ) | (24,582 | ) | ||||
|
|
|
|
|
|||||
| Net increase in net assets derived from capital share transactions |
30,308,086 | 54,084,997 | ||||||
|
|
|
|
|
|||||
| NET ASSETS |
||||||||
| Total increase in net assets |
29,479,451 | 54,475,335 | ||||||
| Beginning of year |
54,575,335 | 100,000 | ||||||
|
|
|
|
|
|||||
| End of year |
$ | 84,054,786 | $ | 54,575,335 | ||||
|
|
|
|
|
|||||
See notes to financial statements.
|
F I N A N C I A L S T A T E M E N T S |
13 |
Year Ended March 31, 2023
| BlackRock Hedge Fund |
||||
| CASH PROVIDED BY (USED FOR) OPERATING ACTIVITIES |
||||
| Net increase in net assets resulting from operations |
$ | 1,712,063 | ||
| Adjustments to reconcile net increase in net assets resulting from operations to net cash used for operating activities: |
||||
| Proceeds from sales of long-term investments |
8,779,194 | |||
| Purchases of long-term investments |
(29,638,164 | ) | ||
| Net proceeds from sales of short-term securities |
(4,023,682 | ) | ||
| Net realized gain on investments |
848,204 | |||
| Net unrealized (appreciation) depreciation on investments |
(3,709,128 | ) | ||
| (Increase) Decrease in Assets: |
||||
| Investments in Portfolio Funds paid in advance |
(6,350,000 | ) | ||
| Receivables: |
||||
| Dividends — affiliated |
(44,457 | ) | ||
| From the Manager |
362,476 | |||
| Prepaid expenses |
181 | |||
| Increase (Decrease) in Liabilities: |
||||
| Payables: |
||||
| Administration fees |
12,500 | |||
| Investment advisory fees |
113,238 | |||
| Service and distribution fees |
(8,495 | ) | ||
| Other accrued expenses |
84,040 | |||
|
|
|
|||
| Net cash used for operating activities |
(31,862,030 | ) | ||
|
|
|
|||
| CASH PROVIDED BY (USED FOR) FINANCING ACTIVITIES |
||||
| Proceeds from issuance of capital shares (net of change in capital contributions received in advance) |
32,564,000 | |||
| Payments on shares repurchased |
(689,955 | ) | ||
| Cash dividends paid to shareholders |
(12,015 | ) | ||
|
|
|
|||
| Net cash provided by financing activities |
31,862,030 | |||
|
|
|
|||
| CASH |
||||
| Net decrease in restricted and unrestricted cash |
— | |||
| Restricted and unrestricted cash at beginning of year |
— | |||
|
|
|
|||
| Restricted and unrestricted cash at end of year |
$ | — | ||
|
|
|
|||
| NON-CASH FINANCING ACTIVITIES |
||||
| Capital shares issued in reinvested dividends and distributions |
$ | 2,528,683 | ||
|
|
|
|||
See notes to financial statements.
| 14 | 2 0 2 3 B L A C K R O C K A N N U A L R E P O R T T O S H A R E H O L D E R S |
(For a share outstanding throughout each period)
| BlackRock Hedge Fund Guided Portfolio Solution | ||||||||
| Class I | ||||||||
| Year Ended 03/31/23 |
Year Ended 03/31/22(a) |
|||||||
| Net asset value, beginning of year |
$ | 10.14 | $ | 10.00 | ||||
|
|
|
|
|
|||||
| Net investment loss(b) |
(0.11 | ) | (0.15 | ) | ||||
| Net realized and unrealized gain |
0.37 | 0.45 | ||||||
|
|
|
|
|
|||||
| Net increase from investment operations |
0.26 | 0.30 | ||||||
|
|
|
|
|
|||||
| Distributions from net investment income |
(0.37 | ) | (0.16 | ) | ||||
|
|
|
|
|
|||||
| Net asset value, end of year |
$ | 10.03 | $ | 10.14 | ||||
|
|
|
|
|
|||||
| Total Return(c) |
||||||||
| Based on net asset value |
2.60 | % | 3.06 | % | ||||
|
|
|
|
|
|||||
| Ratios to Average Net Assets(d) |
||||||||
| Total expenses |
1.43 | % | 3.27 | % | ||||
|
|
|
|
|
|||||
| Total expenses after fees waived and/or reimbursed |
1.34 | % | 1.45 | % | ||||
|
|
|
|
|
|||||
| Net investment loss |
(1.06 | )% | (1.44 | )% | ||||
|
|
|
|
|
|||||
| Supplemental Data |
||||||||
| Net assets, end of year (000) |
$ | 26,547 | $ | 19,831 | ||||
|
|
|
|
|
|||||
| Portfolio turnover rate |
14 | % | 9 | % | ||||
|
|
|
|
|
|||||
| (a) | Commenced operations on March 31, 2021. |
| (b) | Based on average shares outstanding. |
| (c) | Where applicable, assumes the reinvestment of distributions. The Fund is a continuously offered closed-end fund, the Shares of which are offered at net asset value. No secondary market for the Fund’s Shares exists. |
| (d) | Excludes fees and expenses incurred indirectly as a result of investments in underlying funds. |
See notes to financial statements.
|
F I N A N C I A L H I G H L I G H T S |
15 |
Financial Highlights (continued)
(For a share outstanding throughout each period)
| BlackRock Hedge Fund Guided Portfolio Solution (continued) | ||||||||
| Class A | ||||||||
| Year Ended 03/31/23 |
Year Ended 03/31/22(a) |
|||||||
| Net asset value, beginning of year |
$ | 10.11 | $ | 10.00 | ||||
|
|
|
|
|
|||||
| Net investment loss(b) |
(0.19 | ) | (0.22 | ) | ||||
| Net realized and unrealized gain |
0.36 | 0.46 | ||||||
|
|
|
|
|
|||||
| Net increase from investment operations |
0.17 | 0.24 | ||||||
|
|
|
|
|
|||||
| Distributions from net investment income |
(0.31 | ) | (0.13 | ) | ||||
|
|
|
|
|
|||||
| Net asset value, end of year |
$ | 9.97 | $ | 10.11 | ||||
|
|
|
|
|
|||||
| Total Return(c) |
||||||||
| Based on net asset value |
1.71 | % | 2.45 | % | ||||
|
|
|
|
|
|||||
| Ratios to Average Net Assets(d) |
||||||||
| Total expenses |
2.31 | % | 3.75 | % | ||||
|
|
|
|
|
|||||
| Total expenses after fees waived and/or reimbursed |
2.19 | % | 2.16 | % | ||||
|
|
|
|
|
|||||
| Net investment loss |
(1.89 | )% | (2.15 | )% | ||||
|
|
|
|
|
|||||
| Supplemental Data |
||||||||
| Net assets, end of year (000) |
$ | 57,508 | $ | 34,744 | ||||
|
|
|
|
|
|||||
| Portfolio turnover rate |
14 | % | 9 | % | ||||
|
|
|
|
|
|||||
| (a) | Commenced operations on March 31, 2021. |
| (b) | Based on average shares outstanding. |
| (c) | Where applicable, assumes the reinvestment of distributions. The Fund is a continuously offered closed-end fund, the Shares of which are offered at net asset value. No secondary market for the Fund’s Shares exists. |
| (d) | Excludes fees and expenses incurred indirectly as a result of investments in underlying funds. |
See notes to financial statements.
| 16 | 2 0 2 3 B L A C K R O C K A N N U A L R E P O R T T O S H A R E H O L D E R S |
| 1. | ORGANIZATION |
BlackRock Hedge Fund Guided Portfolio Solution (the “Fund”) is registered under the Investment Company Act of 1940, as amended (the “1940 Act”), as a non-diversified, closed-end management investment company. The Fund is organized as a Delaware statutory trust. The Fund engages in a continuous offering of shares. The Fund may from time to time offer to repurchase shares from shareholders in accordance with written tenders by shareholders at those times, in those amounts, and on such terms and conditions as the Board of Trustees of the Fund (the “Board”) may determine in its sole discretion. The Fund calculates the net asset value (“NAV”) per share of the applicable class of the Fund as of the close of business on the last business day of each calendar month, and at such other times as the Board may determine. The Fund’s shares are offered for sale as of the first business day of each calendar month (the “Subscription Date”) at a price equal to the Fund’s NAV per share determined as of the close of business on the last business day of the calendar month preceding the Subscription Date, except that the Fund may offer shares more or less frequently as determined by the Board. The price of the shares during the Fund’s continuous offering will fluctuate over time with the NAV of the shares.
The Fund offers two classes of shares designated as Class I Shares and Class A Shares. Both classes of shares have identical voting, dividend, liquidation and other rights and will be subject to the same terms and conditions, except that Class A Shares bear expenses related to the shareholder servicing and distribution of such shares.
The Fund, together with certain other registered investment companies advised by BlackRock Advisors, LLC (the “Manager”) or its affiliates, is included in a complex of funds referred to as the BlackRock Fixed-Income Complex.
2. SIGNIFICANT ACCOUNTING POLICIES
The financial statements are prepared in conformity with accounting principles generally accepted in the United States of America (“U.S. GAAP”), which may require management to make estimates and assumptions that affect the reported amounts of assets and liabilities in the financial statements, disclosure of contingent assets and liabilities at the date of the financial statements and the reported amounts of increases and decreases in net assets from operations during the reporting period. Actual results could differ from those estimates. The Fund is considered an investment company under U.S. GAAP and follows the accounting and reporting guidance applicable to investment companies. Below is a summary of significant accounting policies:
Investment Transactions and Income Recognition: For financial reporting purposes, investment transactions are recorded on the dates the transactions are executed. Realized gains and losses on investment transactions are determined using the specific identification method. Dividend income and capital gain distributions, if any, are recorded on the ex-dividend dates. Non-cash dividends, if any, are recorded on the ex-dividend dates at fair value. Dividends from foreign securities where the ex-dividend dates may have passed are subsequently recorded when the Fund is informed of the ex-dividend dates. Under the applicable foreign tax laws, a withholding tax at various rates may be imposed on capital gains, dividends and interest. Income, expenses and realized and unrealized gains and losses are allocated daily to each class based on its relative net assets.
Distributions: Distributions from net investment income are declared annually and paid annually. Distributions of capital gains are recorded on the ex-dividend dates and made at least annually. The character and timing of distributions are determined in accordance with U.S. federal income tax regulations, which may differ from U.S. GAAP.
Deferred Compensation Plan: Under the Deferred Compensation Plan (the “Plan”) approved by the Board of Trustees of the Fund (the “Board”), the trustees who are not “interested persons” of the Fund, as defined in the 1940 Act (“Independent Trustees”), may defer a portion of their annual complex-wide compensation. Deferred amounts earn an approximate return as though equivalent dollar amounts had been invested in common shares of certain funds in the BlackRock Fixed-Income Complex selected by the Independent Trustees. This has the same economic effect for the Independent Trustees as if the Independent Trustees had invested the deferred amounts directly in certain funds in the BlackRock Fixed-Income Complex.
The Plan is not funded and obligations thereunder represent general unsecured claims against the general assets of the Fund, as applicable. Deferred compensation liabilities, if any, are included in the Trustees’ and Officer’s fees payable in the Statement of Assets and Liabilities and will remain as a liability of the Fund until such amounts are distributed in accordance with the Plan.
Net appreciation (depreciation) in the value of participants’ deferral accounts is allocated among the participating funds in the BlackRock Fixed Income Complex and reflected as Trustee and Officer expense on the Statement of Operations. The Trustee and Officer expense may be negative as a result of a decrease in value of the deferred accounts.
Indemnifications: In the normal course of business, the Fund enters into contracts that contain a variety of representations that provide general indemnification. The Fund’s maximum exposure under these arrangements is unknown because it involves future potential claims against the Fund, which cannot be predicted with any certainty.
Other: Expenses directly related to the Fund or its classes are charged to the Fund or the applicable class. Expenses directly related to the Fund and other shared expenses prorated to the Fund are allocated daily to each class based on its relative net assets or other appropriate methods. Other operating expenses shared by several funds, including other funds managed by the Manager, are prorated among those funds on the basis of relative net assets or other appropriate methods.
The Fund has an arrangement with its custodian whereby credits are earned on uninvested cash balances, which could be used to reduce custody fees and/or overdraft charges. The Fund may incur charges on certain uninvested cash balances and overdrafts, subject to certain conditions.
3. INVESTMENT VALUATION AND FAIR VALUE MEASUREMENTS
Investment Valuation Policies: The Fund’s investments are valued at fair value (also referred to as “market value” within the financial statements) each day that the Fund is open for business and, for financial reporting purposes, as of the report date. U.S. GAAP defines fair value as the price a fund would receive to sell an asset or pay to transfer a liability in an orderly transaction between market participants at the measurement date. The Board of each Fund has approved the designation of each Fund’s Manager as the valuation designee for the Fund. The Fund determines the fair values of its financial instruments using various independent dealers or pricing services under the Manager’s
| N O T E S T O F I N A N C I A L S T A T E M E N T S |
17 |
Notes to Financial Statements (continued)
policies. If a security’s market price is not readily available or does not otherwise accurately represent the fair value of the security, the security will be valued in accordance with the Manager’s policies and procedures as reflecting fair value. The Manager has formed a committee (the “Valuation Committee”) to develop pricing policies and procedures and to oversee the pricing function for all financial instruments, with assistance from other BlackRock pricing committees.
In valuing interests in Portfolio Funds, the Manager, under the supervision of the Board, considers all relevant information to determine the price that the Fund might reasonably expect to receive from the current sale (or redemption in the case of a Portfolio Fund whose interests carry redemption rights) of the interest in the Portfolio Fund in an arm’s-length transaction. In general, the Manager will rely primarily on any actual or estimated (as applicable) unaudited values provided by the Portfolio Fund manager to the extent such unaudited values are received in a timely fashion and are believed to be the most reliable and relevant indication of the value of interests in such Portfolio Fund. It is anticipated that these unaudited values will be prepared in accordance with U.S. GAAP and will, in effect, be the fair value of each Portfolio Fund’s assets, less such Portfolio Fund’s liabilities (the net asset value). In some cases, estimated unaudited values are provided before final unaudited values. The Manager will rely primarily on such estimated unaudited values or final unaudited values, to the extent they are the most reliable and relevant indication of value of interests in the Portfolio Funds. The Manager will give weight to such valuations and any other factors and considerations set forth in the Valuation Procedures as deemed appropriate in each case. In general, the Manager will, prior to investing in any Portfolio Fund, and periodically thereafter, assess such Portfolio Fund’s valuation policies and procedures for appropriateness in light of the Fund’s obligation to fair value its assets under the 1940 Act and pursuant to U.S. GAAP for investment companies and will assess the overall reasonableness of the information provided by such Portfolio Fund. As part of this assessment, the Manager may also evaluate, among other things, a Portfolio Fund’s practices in respect of creating “side pockets” and such Portfolio Fund’s valuation policies and procedures in respect of any such “side pockets.” The Manager will also review any other information available to it, including reports by independent auditors, fund administrators, if any, and/or other third parties.
In instances where unaudited estimated or final values may not be available, or where such unaudited estimated or final values are determined not to be the most reliable and relevant indication of value of an interest in a Portfolio Fund (as further discussed below), additional factors that may be relevant in determining the value of an interest in a Portfolio Fund, in addition to those other factors and considerations set forth in the Valuation Procedures, include (1) changes in the valuation of hedge fund indices, (2) publicly available information regarding a Portfolio Fund’s underlying portfolio companies or investments, (3) the price at which recent subscriptions and redemptions of such Portfolio Fund interests were offered, (4) relevant news and other sources, (5) significant market events and (6) information provided to the Manager or the Fund by a Portfolio Fund, or the failure to provide such information as agreed to in the Portfolio Fund’s offering materials or other agreements with the Fund.
In circumstances where, taking into account the factors and considerations set forth above and in the Valuation Procedures, the Manager has reason to believe that a value provided by a Portfolio Fund is not the most reliable and relevant indication of the value of an interest in the Portfolio Fund, the Manager may adjust such reported value to reflect the fair value of the interest in the Portfolio Fund. Likewise, in circumstances where a Portfolio Fund does not provide a valuation as contemplated above, the factors and considerations set forth above and in the Valuation Procedures may be the only indicators of the value of an interest in a Portfolio Fund and the Manager will use such factors, together with other valuation methodologies set forth in the Valuation Procedures that may be relevant, to estimate the fair value of its interest in a Portfolio Fund. In circumstances where the Manager determines to adjust the values reported by Portfolio Funds, or in circumstances where the Portfolio Funds do not provide valuations as contemplated above (such circumstances being collectively referred to as “Adjusted Fair Values”), such valuations will be subject to review and approval by the Valuation Committee or its delegate as outlined in the Valuation Procedures. The Board reviews fair value determinations at its regularly scheduled meetings and also reviews the Valuation Procedures on a regular basis.
Fair Value Inputs and Methodologies: The following methods and inputs are used to establish the fair value of the Fund’s assets and liabilities:
| · | Investments in open-end U.S. mutual funds (including money market funds) are valued at that day’s published NAV. |
Fair Value Hierarchy: Various inputs are used in determining the fair value of financial instruments. These inputs to valuation techniques are categorized into a fair value hierarchy consisting of three broad levels for financial reporting purposes as follows:
| · | Level 1 – Unadjusted price quotations in active markets/exchanges for identical assets or liabilities that the Fund has the ability to access; |
| · | Level 2 – Other observable inputs (including, but not limited to, quoted prices for similar assets or liabilities in markets that are active, quoted prices for identical or similar assets or liabilities in markets that are not active, inputs other than quoted prices that are observable for the assets or liabilities (such as interest rates, yield curves, volatilities, prepayment speeds, loss severities, credit risks and default rates) or other market–corroborated inputs); and |
| · | Level 3 – Unobservable inputs based on the best information available in the circumstances, to the extent observable inputs are not available (including the Valuation Committee’s assumptions used in determining the fair value of financial instruments). |
The hierarchy gives the highest priority to unadjusted quoted prices in active markets for identical assets or liabilities (Level 1 measurements) and the lowest priority to unobservable inputs (Level 3 measurements). Accordingly, the degree of judgment exercised in determining fair value is greatest for instruments categorized in Level 3. The inputs used to measure fair value may fall into different levels of the fair value hierarchy. In such cases, for disclosure purposes, the fair value hierarchy classification is determined based on the lowest level input that is significant to the fair value measurement in its entirety. Investments classified within Level 3 have significant unobservable inputs used by the Valuation Committee in determining the price for Fair Valued Investments. Level 3 investments include equity or debt issued by privately held companies or funds that may not have a secondary market and/or may have a limited number of investors. The categorization of a value determined for financial instruments is based on the pricing transparency of the financial instruments and is not necessarily an indication of the risks associated with investing in those securities.
As of March 31, 2023, certain investments of the Fund were fair valued using NAV as the practical expedient as no quoted market value is available and therefore have been excluded from the fair value hierarchy.
| 18 | 2 0 2 3 B L A C K R O C K A N N U A L R E P O R T T O S H A R E H O L D E R S |
Notes to Financial Statements (continued)
| 4. | INVESTMENTS IN PORTFOLIO FUNDS |
Information reflecting the Fund’s investments in Portfolio Funds as of March 31, 2023 is summarized below.
| Investment | Value | % of Fund’s Net Assets |
Primary Geographic Locations |
Redemptions Permitted |
||||||||||||
|
|
||||||||||||||||
| Equity Hedge |
||||||||||||||||
| Atlas Enhanced Fund, Ltd. |
$ | 7,540,811 | 8.9 | % | North America | Quarterly | ||||||||||
| Kadensa Fund |
3,598,413 | 4.3 | |
Developed Asia Pacific, Emerging Markets, North America |
|
Quarterly | ||||||||||
| Manticore Fund (Cayman) Ltd. |
4,016,396 | 4.8 | |
Developed Asia Pacific, Emerging Markets, North America, Western Europe |
|
Monthly | ||||||||||
| Schonfeld Strategic Partners Offshore Fund, Ltd. |
3,686,646 | 4.4 | |
Developed Asia Pacific, Emerging Markets, North America, Western Europe |
|
Monthly | ||||||||||
| Voleon Composition International Fund, Ltd. |
5,277,779 | 6.3 | |
North America, Western Europe |
|
Monthly | ||||||||||
| Event-Driven |
||||||||||||||||
| MY Asian Opportunities Unit Trust |
3,512,113 | 4.2 | North America | Quarterly | ||||||||||||
| Nekton Global Fund Ltd. |
3,555,648 | 4.2 | |
Developed Asia Pacific, Emerging Markets, North America, Western Europe |
|
Quarterly | ||||||||||
| Pentwater Event Fund, Ltd. |
7,155,621 | 8.5 | |
Emerging Markets, North America, Western Europe |
|
Monthly | ||||||||||
| Segantii Asia-Pacific Equity Multi-Strategy Fund |
52,353 | 0.1 | |
Developed Asia Pacific, Emerging Markets, North America |
|
Monthly | ||||||||||
| Macro |
||||||||||||||||
| Crabel Fund SPC, Ltd. |
3,429,305 | 4.1 | |
Developed Asia Pacific, Emerging Markets, North America, Western Europe |
|
Monthly | ||||||||||
| Drakewood Prospect Fund Ltd. |
3,471,019 | 4.1 | North America | Monthly | ||||||||||||
| East One Commodity Fund Limited |
3,715,882 | 4.4 | |
Emerging Markets, North America, Western Europe |
|
Monthly | ||||||||||
| Stratus Feeder, Ltd. |
6,632,708 | 7.9 | |
Developed Asia Pacific, Emerging Markets, North America, Western Europe |
|
Monthly | ||||||||||
| Systematica Alternative Markets Fund Ltd. |
3,372,340 | 4.0 | |
Developed Asia Pacific, Emerging Markets, North America, Western Europe |
|
Monthly | ||||||||||
| Relative Value |
||||||||||||||||
| One William Street Capital Offshore Fund, Ltd. |
6,882,838 | 8.2 | North America | Quarterly | ||||||||||||
| Parallax Offshore Investors Fund, Ltd. |
3,597,573 | 4.3 | |
Developed Asia Pacific, North America, Western Europe |
|
Quarterly | ||||||||||
| Polar Multi-Strategy Fund |
3,728,703 | 4.4 | |
Developed Asia Pacific, Emerging Markets, North America, Western Europe |
|
Monthly | ||||||||||
| $ | 73,226,148 | 87.1 | % | |||||||||||||
|
|
|
|
|
|||||||||||||
| N O T E S T O F I N A N C I A L S T A T E M E N T S |
19 |
Notes to Financial Statements (continued)
| Major Category | Fair Value | Illiquid Investments(a) |
Gates(b) | Lock-ups(c) | Redemption Frequency(d) |
Redemption Notice Period(d) |
||||||||||||||||||
| Equity Hedge(e) |
$ | 24,120,045 | $ | — | $ | 1,955,010 | $ | 11,301,455 | Quarterly, Monthly | 5-65 days | ||||||||||||||
| Event-Driven(f) |
14,275,735 | — | 1,788,905 | — | Quarterly, Monthly | 60-90 days | ||||||||||||||||||
| Macro(g) |
20,621,254 | — | — | 7,145,187 | Monthly | 5-60 days | ||||||||||||||||||
| Relative Value(h) |
14,209,114 | — | 1,720,710 | 10,480,411 | Quarterly, Monthly | 45-90 days | ||||||||||||||||||
|
|
|
|
|
|
|
|
|
|||||||||||||||||
| $ | 73,226,148 | $ | — | $ | 5,464,625 | $ | 28,927,053 | |||||||||||||||||
|
|
|
|
|
|
|
|
|
|||||||||||||||||
| (a) | Represents private investment funds that cannot be voluntarily redeemed by the Fund at any time. This includes: (i) private investment funds that are liquidating and making distribution payments as their underlying assets are sold, (ii) suspended redemptions/withdrawals, and (iii) side pocket holdings. These types of investments may be realized within 1 to 3 years from March 31, 2023, depending on the specific investment and market conditions. This does not include private investment funds with gates and lockups, which are noted above. |
| (b) | Represents the portion of the Portfolio Funds for which there are investor level gates, which are not otherwise included as illiquid investments. |
| (c) | Represents investments that cannot be redeemed without a fee due to a lock-up provision, which are not otherwise included as illiquid investments or investments with gates. The lock-up period for these investments is 6 to 36 months at March 31, 2023. |
| (d) | Redemption frequency and redemption notice period reflect general redemption terms, and exclude liquidity restrictions noted above. |
| (e) | Equity Hedge strategies maintain positions both long and short, normally with a primary focus on equity securities and equity derivatives. A wide variety of investment processes can be employed to arrive at an investment decision, including both quantitative and fundamental techniques. The application of the Valuation Procedures to investments in this category did not result in any Adjusted Fair Values as of March 31, 2023. The fair values of the investments in this category have been estimated based on the net asset values provided by management of the Portfolio Funds. |
| (f) | Event-Driven strategies concentrate on companies that are subject to corporate events such as mergers, acquisitions, restructurings, spin-offs, shareholder activism or other special situations that alter a company’s financial structure or operating strategy. The intended goal of these strategies is to profit when the price of a security changes to reflect more accurately the likelihood and potential impact of the occurrence, or nonoccurrence, of the event. The application of the Valuation Procedures to investments in this category did not result in any Adjusted Fair Values as of March 31, 2023. The fair values of the investments in this category have been estimated based on the net asset values provided by management of the Portfolio Funds. |
| (g) | Macro strategies employ a broad range of strategies where the investment process is predicated on movements in underlying economic variables and the impact of these movements on equity, fixed income, hard currency and commodity markets. The application of the Valuation Procedures to investments in this category did not result in any Adjusted Fair Values as of March 31, 2023. The fair values of the investments in this category have been estimated based on the net asset values provided by management of the Portfolio Funds. |
| (h) | Relative Value strategies seek to profit from the mispricing of financial instruments relative to each other or historical norms. These strategies utilize quantitative and qualitative analyses to identify securities or spreads between securities that deviate from their theoretical fair value and/or historical norms. The application of the Valuation Procedures to investments in this category did not result in any Adjusted Fair Values as of March 31, 2023. The fair values of the investments in this category have been estimated based on the net asset values provided by management of the Portfolio Funds. |
| 5. | INVESTMENT ADVISORY AGREEMENT AND OTHER TRANSACTIONS WITH AFFILIATES |
Investment Advisory: The Fund entered into an Investment Advisory Agreement with the Manager, the Fund’s investment adviser and an indirect, wholly-owned subsidiary of BlackRock, Inc. (“BlackRock”), to provide investment advisory and administrative services. The Manager is responsible for the management of the Fund’s portfolio and provides the personnel, facilities, equipment and certain other services necessary to the operations of the Fund.
For such services, the Fund pays the Manager a monthly fee at an annual rate equal to 0.55% of the average monthly value of the Fund’s net assets.
Service and Distribution Fees: The Fund has entered into a Distribution Agreement (the “Distribution Agreement”) with BlackRock Investments, LLC (the “Distributor”), an affiliate of the Manager, to provide for distribution of the common shares. The Distribution Agreement provides that the Distributor will sell, and will appoint financial intermediaries to sell, common shares on behalf of the Fund on a reasonable efforts basis. The Fund has adopted a distribution and servicing plan (the “Distribution and Servicing Plan”) with respect to certain classes of the common shares and in doing so has voluntarily complied with Rule 12b-1 under the 1940 Act, as if the Fund were an open-end investment company, and will be subject to an ongoing distribution fee and shareholder servicing fee (together, the “Distribution and Servicing Fee”) in respect of the classes of common shares paying such Distribution and Servicing Fee. The maximum annual rates at which the Distribution and Servicing Fees may be paid under the Distribution and Servicing Plan (calculated as a percentage of the Fund’s monthly net assets attributable to the classes of common shares paying such Distribution and Servicing Fee) is 0.75% for Class A Shares. Class I Shares are not subject to a distribution fee or shareholder servicing fee.
For the year ended March 31, 2023, the class specific service and distribution fees borne directly by Class A Shares amounted to $359,349.
Transfer Agent: Pursuant to written agreements, certain financial intermediaries, some of which may be affiliates, provide the Fund with sub-accounting, recordkeeping, sub-transfer agency and other administrative services with respect to servicing of underlying investor accounts. For these services, these entities receive an asset-based fee or an annual fee per shareholder account, which will vary depending on share class and/or net assets. For the year ended March 31, 2023, the Fund did not pay any amounts to affiliates in return for these services.
In addition, the Fund pays the transfer agent, which is not an affiliate, a fee for the issuance, transfer and redemption of shares and the opening and maintenance of shareholder accounts, which is included in transfer agent in the Statement of Operations.
| 20 | 2 0 2 3 B L A C K R O C K A N N U A L R E P O R T T O S H A R E H O L D E R S |
Notes to Financial Statements (continued)
For the year ended March 31, 2023, the following table shows the class specific transfer agent fees borne directly by each share class of the Fund:
| Class Name | Total | |||
| Class I |
$ | 10,300 | ||
| Class A |
42,783 | |||
|
|
|
|||
| 53,083 |
Expense Limitations, Waivers and Reimbursements: The Manager contractually agreed to waive its investment advisory fees by the amount of investment advisory fees the Fund pays to the Manager indirectly through its investment in affiliated money market funds (the “affiliated money market fund waiver”) through June 30, 2024. The contractual agreement may be terminated upon 90 days’ notice by a majority of the Independent Trustees, or by a vote of a majority of the outstanding voting securities of the Fund. This amount is included in fees waived and/or reimbursed by the Manager in the Statements of Operations. For year ended March 31, 2023, the amount waived was $4,837.
The Manager contractually agreed to waive its investment advisory fee with respect to any portion of the Fund’s assets invested in affiliated equity and fixed-income mutual funds and affiliated exchange-traded funds that have a contractual management fee through June 30, 2024. The agreement can be renewed for annual periods thereafter, and may be terminated on 90 days’ notice, each subject to approval by a majority of the Funds’ Independent Trustees. For the year ended March 31, 2023, there were no fees waived by the Manager pursuant to this arrangement.
The Manager contractually agreed to waive and/or reimburse certain operating and other expenses of the Fund in order to limit certain expenses to 0.80% of the Fund’s average monthly value of the net assets of each share class (“expense limitation”). This expense limitation excludes the investment advisory fee, service and distribution fees, interest expense, portfolio transaction, sub-accounting, record keeping, other administrative services and other investment-related costs (including acquired fund fees and expenses, commitment fees on leverage, prime broker fees and dividend expense) and certain other fund expenses, which constitute extraordinary expenses not incurred in the ordinary course of the Fund’s business. The Manager has agreed not to reduce or discontinue the contractual expense limitations through June 30, 2024. This amount is included in fees waived and/or reimbursed by the Manager in the Statements of Operations. For the year ended March 31, 2023, the Manager waived $23,814 pursuant to this arrangement.
In addition, these amounts waived and/or reimbursed by the Manager are included in transfer agent fees waived and/or reimbursed — class specific in the Statement of Operations. For the year ended March 31, 2023, class specific expense waivers and/or reimbursements are as follows:
| Class Name | Total | |||
| Class I |
$ | 10,300 | ||
| Class A |
42,783 | |||
|
|
|
|||
| 53,083 |
With respect to the contractual expense limitation, if during the Fund’s fiscal year the operating expenses of a share class, that at any time during the prior two fiscal years received a waiver and/or reimbursement from the Manager, are less than the current expense limitation for that share class, the Manager is entitled to be reimbursed by such share class up to the lesser of: (a) the amount of fees waived and/or expenses reimbursed during those prior two fiscal years under the agreement and (b) an amount not to exceed either the current expense limitation of that share class or the expense limitation of the share class in effect at the time that the share class received the applicable waiver and/or reimbursement, provided that:
| (1) | the Fund has more than $50 million in assets for the fiscal year, and |
| (2) | the Manager or an affiliate continues to serve as the Fund’s investment adviser or administrator. |
This repayment applies only to the contractual expense limitation on net expenses and does not apply to the contractual advisory fee waiver described above or any voluntary waivers that may be in effect from time to time. Effective April 1, 2028, the repayment arrangement between the Fund and the Manager pursuant to which such Fund may be required to repay amounts waived and/or reimbursed under the Fund’s contractual caps on net expenses will be terminated.
As of March 31, 2023, the fund level and class specific waivers and/or reimbursements subject to possible future recoupment under the expense limitation agreement are as follows:
| Fund Level/Share Class | Expiring March 31, | |||||||
| 2024 | 2025 | |||||||
| Fund Level |
$ | 563,342 | $ | 23,814 | ||||
| Class I |
2,817 | 10,300 | ||||||
| Class A |
13,666 | 42,783 | ||||||
Trustees and Officers: Certain trustees and/or officers of the Trust are directors and/or officers of BlackRock or its affiliates. The Fund reimburses the Manager for a portion of the compensation paid to the Trust’s Chief Compliance Officer, which is included in Trustees and Officer in the Statement of Operations.
| 6. | PURCHASES AND SALES |
For the year ended March 31, 2023, purchases and sales of investments, excluding short-term securities, were $29,638,164 and $8,776,114, respectively.
| N O T E S T O F I N A N C I A L S T A T E M E N T S |
21 |
Notes to Financial Statements (continued)
| 7. | INCOME TAX INFORMATION |
It is the Fund’s policy to comply with the requirements of the Internal Revenue Code of 1986, as amended, applicable to regulated investment companies, and to distribute substantially all of its taxable income to its shareholders. Therefore, no U.S. federal income tax provision is required. The Fund has adopted September 30 as its tax year-end.
The Fund files U.S. federal and various state and local tax returns. No income tax returns are currently under examination. The statute of limitations on the Fund’s U.S. federal tax returns generally remains open for a period of three years after they are filed. The statutes of limitations on the Fund’s state and local tax returns may remain open for an additional year depending upon the jurisdiction.
Management has analyzed tax laws and regulations and their application to the Fund as of March 31, 2023, inclusive of the open tax return years, and does not believe that there are any uncertain tax positions that require recognition of a tax liability in the Fund’s financial statements.
U.S. GAAP requires that certain components of net assets be adjusted to reflect permanent differences between financial and tax reporting. These reclassifications have no effect on net assets or net asset values per share. As of the tax year ended September 30, 2022, permanent differences attributable to non-deductible expenses were reclassified to the following accounts:
|
|
||||
| Amounts | ||||
|
|
||||
| Paid-in capital |
$ | (148,220) | ||
| Accumulated earnings (loss) |
148,220 | |||
The tax character of distributions paid was as follows:
|
|
||||||
| Year Ended 03/31/23 |
Year Ended 03/31/22 |
|||||
|
|
||||||
| Ordinary income |
$2,540,698 | $ | 685,123 | |||
|
|
|
|
||||
|
|
||||||
As of tax year ended September 30, 2022, the tax components of accumulated earnings (loss) were as follows:
|
|
||||
| Amounts | ||||
|
|
||||
| Undistributed ordinary income |
$ | 2,136,419 | ||
| Non-expiring capital loss carryforwards |
(432,174 | ) | ||
| Net unrealized gain (losses)(a) |
(1,192,885 | ) | ||
|
|
|
|||
| $ | 511,360 | |||
|
|
|
|||
|
|
||||
| (a) | The difference between book-basis and tax-basis of net accumulated losses was attributable primarily to the realization for tax purposes of unrealized gains on investments in passive foreign investment companies. |
As of March 31, 2023, gross unrealized appreciation and depreciation based on cost of investments (including short positions and derivatives, if any) for U.S. federal income tax purposes were as follows:
|
|
||||
| Amounts | ||||
|
|
||||
| Tax cost |
$ | 80,750,511 | ||
|
|
|
|||
| Gross unrealized appreciation |
$ | 1,739,361 | ||
| Gross unrealized depreciation |
(518,134 | ) | ||
|
|
|
|||
| Net unrealized appreciation (depreciation) |
$ | 1,221,227 | ||
|
|
|
|||
|
|
||||
| 8. | BANK BORROWINGS |
The Fund is party to a 364-day, $5 million credit agreement with Credit Suisse International. Under this agreement, the Fund may borrow to address timing mismatches between inflows and outflows of capital to and from the Fund in connection with (a) the repurchase of shares in the Fund, (b) the Fund’s investment activities, and (c) the payment of fees, expenses and other obligations of the Fund in the ordinary course of business. The credit agreement has the following terms: a fee of 0.35% per annum on unused commitment amounts and interest at a rate equal to three-month Secured Overnight Financing Rate (“SOFR”) on the date the loan is made plus 0.15% and 1.35% per annum. The agreement expires in September 2023 unless extended or renewed. For the year ended March 31, 2023, the Fund did not borrow under the credit agreement.
| 9. | PRINCIPAL RISKS |
In the normal course of business, the Fund invests in securities or other instruments and may enter into certain transactions, and such activities subject the Fund to various risks, including among others, fluctuations in the market (market risk) or failure of an issuer to meet all of its obligations. The value of securities or other instruments may also be affected by various factors, including, without limitation: (i) the general economy; (ii) the overall market as well as local, regional or global political and/or social instability; (iii) regulation, taxation or international tax treaties between various countries; or (iv) currency, interest rate and price fluctuations. Local, regional or global events such as war, acts of terrorism, the spread of infectious illness or other public health issues, recessions, or other events could have a significant impact on the Fund and its investments. The Fund’s prospectus provides details of the risks to which the Fund is subject.
| 22 | 2 0 2 3 B L A C K R O C K A N N U A L R E P O R T T O S H A R E H O L D E R S |
Notes to Financial Statements (continued)
The Fund may invest without limitation in illiquid or less liquid investments or investments in which no secondary market is readily available or which are otherwise illiquid, including private placement securities. The Fund may not be able to readily dispose of such investments at prices that approximate those at which the Fund could sell such investments if they were more widely traded and, as a result of such illiquidity, the Fund may have to sell other investments or engage in borrowing transactions if necessary to raise funds to meet its obligations. Limited liquidity can also affect the market price of investments, thereby adversely affecting the Fund’s NAV and ability to make dividend distributions. Privately issued debt securities are often of below investment grade quality, frequently are unrated and present many of the same risks as investing in below investment grade public debt securities
Infectious Illness Risk: An outbreak of an infectious illness, such as the COVID-19 pandemic, may adversely impact the economies of many nations and the global economy and may impact individual issuers and capital markets in ways that cannot be foreseen. An infectious illness outbreak may result in, among other things, closed international borders, prolonged quarantines, supply chain disruptions, market volatility or disruptions and other significant economic, social and political impacts.
Valuation Risk: The market values of equities, such as common stocks and preferred securities or equity related investments, such as futures and options, may decline due to general market conditions which are not specifically related to a particular company. They may also decline due to factors which affect a particular industry or industries. The Fund may invest in illiquid investments. An illiquid investment is any investment that the Fund reasonably expects cannot be sold or disposed of in current market conditions in seven calendar days or less without the sale or disposition significantly changing the market value of the investment. The Fund may experience difficulty in selling illiquid investments in a timely manner at the price that it believes the investments are worth. Prices may fluctuate widely over short or extended periods in response to company, market or economic news. Markets also tend to move in cycles, with periods of rising and falling prices. This volatility may cause the Fund’s NAV to experience significant increases or decreases over short periods of time. If there is a general decline in the securities and other markets, the NAV of the Fund may lose value, regardless of the individual results of the securities and other instruments in which the Fund invests.
The price the Fund could receive upon the sale of any particular portfolio investment may differ from the Fund’s valuation of the investment, particularly for securities that trade in thin or volatile markets or that are valued using a fair valuation technique or a price provided by an independent pricing service. Changes to significant unobservable inputs and assumptions (i.e., publicly traded company multiples, growth rate, time to exit) due to the lack of observable inputs may significantly impact the resulting fair value and therefore the Fund’s results of operations. As a result, the price received upon the sale of an investment may be less than the value ascribed by the Fund, and the Fund could realize a greater than expected loss or lesser than expected gain upon the sale of the investment. The Fund’s ability to value its investments may also be impacted by technological issues and/or errors by pricing services or other third-party service providers.
Counterparty Credit Risk: The Fund may be exposed to counterparty credit risk, or the risk that an entity may fail to or be unable to perform on its commitments related to unsettled or open transactions, including making timely interest and/or principal payments or otherwise honoring its obligations. The Fund manages counterparty credit risk by entering into transactions only with counterparties that the Manager believes have the financial resources to honor their obligations and by monitoring the financial stability of those counterparties. Financial assets, which potentially expose the Fund to market, issuer and counterparty credit risks, consist principally of financial instruments and receivables due from counterparties. The extent of the Fund’s exposure to market, issuer and counterparty credit risks with respect to these financial assets is approximately their value recorded in the Statement of Assets and Liabilities, less any collateral held by the Fund.
Concentration Risk: A diversified portfolio, where this is appropriate and consistent with a fund’s objectives, minimizes the risk that a price change of a particular investment will have a material impact on the NAV of a fund. The investment concentrations within the Fund’s portfolio are disclosed in its Schedule of Investments.
The Fund invests a significant portion of its assets in securities within a single or limited number of market sectors. When a fund concentrates its investments in this manner, it assumes the risk that economic, regulatory, political and social conditions affecting such sectors may have a significant impact on the Fund and could affect the income from, or the value or liquidity of, the Fund’s portfolio. Investment percentages in specific sectors are presented in the Schedule of Investments.
| 10. | CAPITAL SHARE TRANSACTIONS |
The Fund is authorized to issue an unlimited number of shares, all of which were initially classified as Common Shares. The par value for the Fund’s Common Shares is $0.001.
Transactions in capital shares for each class were as follows:
| Year Ended 03/31/23 | Year Ended 03/31/22 | |||||||||||||||
| Share Class | Shares | Amount | Shares | Amount | ||||||||||||
| Class I |
||||||||||||||||
| Proceeds from the issuance of shares (excluding capital contributions received in advance) |
693,105 | $ | 6,985,000 | 1,944,195 | $ | 19,477,500 | ||||||||||
| Reinvestment of distributions |
89,406 | 885,117 | 4,036 | 40,321 | ||||||||||||
| Repurchase of shares resulting from tender offers |
(91,362 | ) | (918,376 | ) | (2,461 | ) | (24,582 | ) | ||||||||
|
|
|
|
|
|
|
|
|
|||||||||
| 691,149 | $ | 6,951,741 | 1,945,770 | $ | 19,493,239 | |||||||||||
|
|
|
|
|
|
|
|
|
|||||||||
| N O T E S T O F I N A N C I A L S T A T E M E N T S |
23 |
Notes to Financial Statements (continued)
| Year Ended 03/31/23 | Year Ended 03/31/22 | |||||||||||||||
| Share Class | Shares | Amount | Shares | Amount | ||||||||||||
| Class A |
||||||||||||||||
| Proceeds from the issuance of shares (excluding capital contributions received in advance) |
2,280,994 | $ | 22,885,000 | 3,410,794 | $ | 34,326,000 | ||||||||||
| Reinvestment of distributions |
166,521 | 1,643,566 | 26,629 | 265,758 | ||||||||||||
| Repurchase of shares resulting from tender offers |
(117,557 | ) | (1,172,221 | ) | — | — | ||||||||||
|
|
|
|
|
|
|
|
|
|||||||||
| 2,329,958 | $ | 23,356,345 | 3,437,423 | $ | 34,591,758 | |||||||||||
|
|
|
|
|
|
|
|
|
|||||||||
| 3,021,107 | $ | 30,308,086 | 5,383,193 | $ | 54,084,997 | |||||||||||
|
|
|
|
|
|
|
|
|
|||||||||
For the year ended March 31, 2023, common shares issued and outstanding had a net decrease of 208,919 as a result of 208,919 shares repurchased in tender offers.
The Fund intends, but is not obligated, to conduct quarterly tender offers for up to 25% of the common shares then outstanding in the sole discretion of its Board. In a tender offer, the Fund repurchases outstanding shares at its NAV on the valuation date for the tender offer. In any given quarter, the Manager may or may not recommend to the Board that the Fund conduct tender offers. Accordingly, there may be quarters in which no tender offer is made. Shares are not redeemable at an investor’s option nor are they exchangeable for shares of any other fund.
| Commencement Date of Tender Offer Period(a) |
Valuation Date |
Number of Shares Tendered |
Tendered Shares as a Percentage of Outstanding Shares |
Number of Tendered Shares Purchased |
Tendered Shares as a Percentage of |
Purchase Price |
Total Amount of Purchases |
|||||||||||||||||||||||
| Class I | June 25, 2021 | September 30, 2021 | — | —% | — | — | % | $ | — | $ | — | |||||||||||||||||||
| Class A | June 25, 2021 | September 30, 2021 | — | — | — | — | — | — | ||||||||||||||||||||||
| Class I | September 27, 2021 | December 31, 2021 | 2,461 | 0.05 | 2,461 | 0.05 | 9.99 | 24,582 | ||||||||||||||||||||||
| Class A | September 27, 2021 | December 31, 2021 | — | — | — | — | — | — | ||||||||||||||||||||||
| Class I | December 23, 2021 | March 31, 2022 | — | — | — | — | — | — | ||||||||||||||||||||||
| Class A | December 23, 2021 | March 31, 2022 | — | — | — | — | — | — | ||||||||||||||||||||||
| Class I | March 28, 2022 | June 30, 2022 | — | — | — | — | — | — | ||||||||||||||||||||||
| Class A | March 28, 2022 | June 30, 2022 | 8,020 | 0.21 | 8,020 | 0.21 | 9.97 | 79,962 | ||||||||||||||||||||||
| Class I | June 27, 2022 | September 30, 2022 | 29,062 | 1.29 | 29,062 | 1.29 | 10.14 | 294,693 | ||||||||||||||||||||||
| Class A | June 27, 2022 | September 30, 2022 | 12,464 | 0.26 | 12,464 | 0.26 | 10.07 | 125,516 | ||||||||||||||||||||||
| Class I | September 26, 2022 | December 30, 2022 | 9,090 | 0.37 | 9,090 | 0.37 | 9.90 | 89,988 | ||||||||||||||||||||||
| Class A | September 26, 2022 | December 30, 2022 | 10,715 | 0.20 | 10,715 | 0.20 | 9.87 | 105,752 | ||||||||||||||||||||||
| Class I | December 23, 2022 | March 31, 2023 | 53,210 | 2.01 | 53,210 | 2.01 | 10.03 | 533,695 | ||||||||||||||||||||||
| Class A | December 23, 2022 | March 31, 2023 | 86,358 | 1.50 | 86,358 | 1.50 | 9.97 | 860,991 | ||||||||||||||||||||||
| (a) | Date the tender offer period began. |
The Fund conducted a tender offer to purchase for cash up to 25% of the Fund’s issued and outstanding Class I and Class A common shares of beneficial interest as of March 1, 2023, at a price equal to the NAV per share determined as of June 30, 2023. The tender offer commenced on March 28, 2023 and expired on April 26, 2023.
Tendered share amounts are shown as repurchase of shares resulting from tender offers in the Statements of Changes in Net Assets.
As of March 31, 2023 BlackRock Financial Management, Inc., an affiliate of the Fund, owned 1,555,901 Class I and 1,031,410 Class A Shares of the Fund.
| 11. | SUBSEQUENT EVENTS |
Management’s evaluation of the impact of all subsequent events on the Fund’s financial statements was completed through the date the financial statements were issued and the following items were noted:
On May 16, 2023, the credit agreement with Credit Suisse International was terminated.
Effective May 18, 2023, the Fund is party to a 364-day, $5 million credit agreement with Bank of America. Under this agreement, the Fund may borrow to address timing mismatches between inflows and outflows of capital to and from the Fund in connection with (a) the repurchase of shares in the Fund, (b) the Fund’s investment activities, and (c) the payment of fees, expenses and other obligations of the Fund in the ordinary course of business. The credit agreement has the following terms: a fee of 0.40% per annum on unused commitment amounts and interest at a rate equal to daily simple SOFR or one-month term SOFR on the date the loan is made (plus, in each case, a 0.10% SOFR adjustment) and 1.40% per annum. The agreement expires in May 2024 unless extended or renewed.
| 24 | 2 0 2 3 B L A C K R O C K A N N U A L R E P O R T T O S H A R E H O L D E R S |
Report of Independent Registered Public Accounting Firm
To the Shareholders and the Board of Trustees of BlackRock Hedge Fund Guided Portfolio Solution:
Opinion on the Financial Statements and Financial Highlights
We have audited the accompanying statement of assets and liabilities of BlackRock Hedge Fund Guided Portfolio Solution (the “Fund”), including the schedule of investments, as of March 31, 2023, the related statements of operations and cash flows for the year then ended, the statements of changes in net assets and the financial highlights for each of the two years in the period then ended, and the related notes. In our opinion, the financial statements and financial highlights present fairly, in all material respects, the financial position of the Fund as of March 31, 2023, and the results of its operations and its cash flows for the year then ended, and the changes in its net assets and the financial highlights for each of the two years in the period then ended, in conformity with accounting principles generally accepted in the United States of America.
Basis for Opinion
These financial statements and financial highlights are the responsibility of the Fund’s management. Our responsibility is to express an opinion on the Fund’s financial statements and financial highlights based on our audits. We are a public accounting firm registered with the Public Company Accounting Oversight Board (United States) (PCAOB) and are required to be independent with respect to the Fund in accordance with the U.S. federal securities laws and the applicable rules and regulations of the Securities and Exchange Commission and the PCAOB.
We conducted our audits in accordance with the standards of the PCAOB. Those standards require that we plan and perform the audit to obtain reasonable assurance about whether the financial statements and financial highlights are free of material misstatement, whether due to error or fraud. The Fund is not required to have, nor were we engaged to perform, an audit of its internal control over financial reporting. As part of our audits we are required to obtain an understanding of internal control over financial reporting but not for the purpose of expressing an opinion on the effectiveness of the Fund’s internal control over financial reporting. Accordingly, we express no such opinion.
Our audits included performing procedures to assess the risks of material misstatement of the financial statements and financial highlights, whether due to error or fraud, and performing procedures that respond to those risks. Such procedures included examining, on a test basis, evidence regarding the amounts and disclosures in the financial statements and financial highlights. Our audits also included evaluating the accounting principles used and significant estimates made by management, as well as evaluating the overall presentation of the financial statements and financial highlights. Our procedures included confirmation of securities owned as of March 31, 2023, by correspondence with custodians or counterparties; when replies were not received, we performed other auditing procedures. We believe that our audits provide a reasonable basis for our opinion.
Deloitte & Touche LLP
Boston, Massachusetts
May 24, 2023
We have served as the auditor of one or more BlackRock investment companies since 1992.
| R E P O R T O F I N D E P E N D E N T R E G I S T E R E D P U B L I C A C C O U N T I N G F I R M |
25 |
Automatic Dividend Reinvestment Plan
Pursuant to the Fund’s dividend reinvestment plan (the “Reinvestment Plan”), registered shareholders will have all dividends, including any capital gain dividends, reinvested automatically in additional Shares of the Fund by BNY Mellon Investment Servicing (US) Inc. (the “Reinvestment Plan Agent”), unless the shareholder elects to receive cash. Shareholders who elect not to participate in the Reinvestment Plan will receive all dividends in cash paid directly to the shareholder of record (or, if the Shares are held through banks, brokers or other nominee name, then to such banks, brokers or other nominee) by BNY Mellon Investment Servicing (US) Inc., as dividend disbursing agent. You may elect not to participate in the Reinvestment Plan and to receive all dividends in cash by contacting your bank, broker or other nominee who holds your Fund common shares or if your Fund common shares are held directly by the Fund, by contacting the Reinvestment Plan Agent, at the address set forth below. Participation in the Reinvestment Plan is completely voluntary and may be terminated or resumed at any time without penalty by written notice if received and processed by the Reinvestment Plan Agent prior to the dividend record date. Additionally, the Reinvestment Plan Agent seeks to process notices received after the record date but prior to the payable date and such notices often will become effective by the payable date. Where late notices are not processed by the applicable payable date, such termination or resumption will be effective with respect to any subsequently declared dividend.
In the case of record shareholders such as banks, brokers or other nominees that hold Fund common shares for others who are the beneficial owners, the Reinvestment Plan Agent will administer the Reinvestment Plan on the basis of the number of Shares certified from time to time by the record shareholder as representing the total amount registered in such shareholder’s name and held for the account of beneficial owners who are to participate in the Reinvestment Plan. Shareholders whose Shares are held in the name of a bank, broker or other nominee should contact the bank, broker or other nominee for details. Such shareholders may not be able to transfer their shares to another bank, broker or other nominee and continue to participate in the Reinvestment Plan.
The number of newly issued Shares to be credited to each participant’s account will be determined by dividing the dollar amount of the dividend by the NAV on the reinvestment date; there is no sales or other charge for reinvestment.
The Reinvestment Plan Agent’s fees for the handling of the reinvestment of dividends will be paid by the Fund. The Fund reserves the right to amend or terminate the Reinvestment Plan. There is no direct service charge to participants with regard to newly issued Shares in the Reinvestment Plan. Notice of amendments to the Reinvestment Plan will be sent to participants.
All correspondence concerning the Reinvestment Plan should be directed to the Reinvestment Plan Agent, in writing to: BlackRock Hedge Fund Guided Portfolio Solution, c/o BNY Mellon TA Alternative Investment RIC Funds, PO Box 534415, Pittsburgh, PA 15253-4415, or by calling the Fund toll-free at 1-888-919-6902.
| 26 | 2 0 2 3 B L A C K R O C K A N N U A L R E P O R T T O S H A R E H O L D E R S |
Trustee and Officer Information
| Independent Trustees(a) | ||||||||
| Name Year of Birth(b)
|
Position(s) Held (Length of Service)(c)
|
Principal Occupation(s) During Past 5 Years
|
Number of BlackRock-Advised Registered Investment Companies (“RICs”) Consisting of Investment Portfolios (“Portfolios”) Overseen
|
Public Company Past 5 Years
| ||||
| R. Glenn Hubbard 1958 |
Chair of the Board (Since 2022) Trustee (Since 2021) |
Dean, Columbia Business School from 2004 to 2019; Faculty member, Columbia Business School since 1988. |
70 RICs consisting of 102 Portfolios | ADP (data and information services) from 2004 to 2020; Metropolitan Life Insurance Company (insurance); TotalEnergies SE (multi-energy) | ||||
| W. Carl Kester(d) 1951 |
Vice Chair of the Board (Since 2022) Trustee (Since 2021) |
Baker Foundation Professor and George Fisher Baker Jr. Professor of Business Administration, Emeritus, Harvard Business School since 2022; George Fisher Baker Jr. Professor of Business Administration, Harvard Business School from 2008 to 2022; Deputy Dean for Academic Affairs from 2006 to 2010; Chairman of the Finance Unit, from 2005 to 2006; Senior Associate Dean and Chairman of the MBA Program from 1999 to 2005; Member of the faculty of Harvard Business School since 1981. |
72 RICs consisting of 104 Portfolios | None | ||||
| Cynthia L. Egan 1955 |
Trustee (Since 2021) |
Advisor, U.S. Department of the Treasury from 2014 to 2015; President, Retirement Plan Services, for T. Rowe Price Group, Inc. from 2007 to 2012; executive positions within Fidelity Investments from 1989 to 2007. |
70 RICs consisting of 102 Portfolios | Unum (insurance); The Hanover Insurance Group (Board Chair); Huntsman Corporation (Lead Independent Director and non Executive Vice Chair of the Board) (chemical products) | ||||
| Frank J. Fabozzi(d) 1948 |
Trustee (Since 2021) |
Editor of The Journal of Portfolio Management since 1986; Professor of Finance, EDHEC Business School (France) from 2011 to 2022; Professor of Practice, Johns Hopkins University since 2021; Professor in the Practice of Finance, Yale University School of Management from 1994 to 2011 and currently a Teaching Fellow in Yale’s Executive Programs; Visiting Professor, Rutgers University for the Spring 2019 semester; Visiting Professor, New York University for the 2019 academic year; Adjunct Professor of Finance, Carnegie Mellon University in fall 2020 semester. |
72 RICs consisting of 104 Portfolios | None | ||||
| Lorenzo A. Flores 1964 |
Trustee (Since 2021) |
Vice Chairman, Kioxia, Inc. since 2019; Chief Financial Officer, Xilinx, Inc. from 2016 to 2019; Corporate Controller, Xilinx, Inc. from 2008 to 2016. |
70 RICs consisting of 102 Portfolios | None | ||||
| Stayce D. Harris 1959 |
Trustee (Since 2021) |
Lieutenant General, Inspector General, Office of the Secretary of the United States Air Force from 2017 to 2019; Lieutenant General, Assistant Vice Chief of Staff and Director, Air Staff, United States Air Force from 2016 to 2017; Major General, Commander, 22nd Air Force, AFRC, Dobbins Air Reserve Base, Georgia from 2014 to 2016; Pilot, United Airlines from 1990 to 2020. |
70 RICs consisting of 102 Portfolios | KULR Technology Group, Inc. in 2021; The Boeing Company (airplane manufacturer) | ||||
| T R U S T E E A N D O F F I C E R I N F O R M A T I O N |
27 |
Trustee and Officer Information (continued)
| Independent Trustees(a) | ||||||||
| Name Year of Birth(b)
|
Position(s) Held (Length of Service)(c)
|
Principal Occupation(s) During Past 5 Years
|
Number of BlackRock-Advised Registered Investment Companies (“RICs”) Consisting of Investment Portfolios (“Portfolios”) Overseen
|
Public Company
| ||||
| J. Phillip Holloman 1955 |
Trustee (Since 2021) |
President and Chief Operating Officer, Cintas Corporation from 2008 to 2018. |
70 RICs consisting of 102 Portfolios | PulteGroup, Inc. (home construction); Rockwell Automation Inc. (industrial automation) | ||||
| Catherine A. Lynch(d) 1961 |
Trustee (Since 2021) |
Chief Executive Officer, Chief Investment Officer and various other positions, National Railroad Retirement Investment Trust from 2003 to 2016; Associate Vice President for Treasury Management, The George Washington University from 1999 to 2003; Assistant Treasurer, Episcopal Church of America from 1995 to 1999. |
72 RICs consisting of 104 Portfolios | PennyMac Mortgage Investment Trust | ||||
| 28 | 2 0 2 3 B L A C K R O C K A N N U A L R E P O R T T O S H A R E H O L D E R S |
Trustee and Officer Information (continued)
| Interested Trustees(a)(e) | ||||||||
| Name Year of Birth(b)
|
Position(s) Held (Length of Service)(c)
|
Principal Occupation(s) During Past 5 Years
|
Number of BlackRock-Advised Registered Investment Companies (“RICs”) Consisting of Investment Portfolios (“Portfolios”) Overseen
|
Public Company
| ||||
| Robert Fairbairn 1965 |
Director (Since 2021) |
Vice Chairman of BlackRock, Inc. since 2019; Member of BlackRock’s Global Executive and Global Operating Committees; Co-Chair of BlackRock’s Human Capital Committee; Senior Managing Director of BlackRock, Inc. from 2010 to 2019; oversaw BlackRock’s Strategic Partner Program and Strategic Product Management Group from 2012 to 2019; Member of the Board of Managers of BlackRock Investments, LLC from 2011 to 2018; Global Head of BlackRock’s Retail and iShares® businesses from 2012 to 2016. |
98 RICs consisting of 268 Portfolios | None | ||||
| John M. Perlowski(d) 1964 |
Director (since 2021) and President and Chief Executive Officer (Since 2021) |
Managing Director of BlackRock, Inc. since 2009; Head of BlackRock Global Accounting and Product Services since 2009; Advisory Director of Family Resource Network (charitable foundation) since 2009. |
100 RICs consisting of 270 Portfolios | None | ||||
| (a) | The address of each Trustee is c/o BlackRock, Inc., 50 Hudson Yards, New York, NY 10001. |
| (b) | Each Independent Trustee holds office until his or her successor is duly elected and qualifies or until his or her earlier death, resignation, retirement or removal as provided by the Trust’s by-laws or charter or statute, or until December 31 of the year in which he or she turns 75. Trustees who are “interested persons,” as defined in the 1940 Act, serve until their successor is duly elected and qualifies or until their earlier death, resignation, retirement or removal as provided by the Trust’s by-laws or statute, or until December 31 of the year in which they turn 72. The Board may determine to extend the terms of Independent Trustees on a case-by-case basis, as appropriate. |
| (c) | Following the combination of Merrill Lynch Investment Managers, L.P. (“MLIM”) and BlackRock, Inc. in September 2006, the various legacy MLIM and legacy BlackRock fund boards were realigned and consolidated into three new fund boards in 2007. Certain Independent Trustees first became members of the boards of other legacy MLIM or legacy BlackRock funds as follows: Frank J. Fabozzi, 1988; R. Glenn Hubbard, 2004; and W. Carl Kester, 1995. |
| (d) | Dr. Fabozzi, Dr. Kester, Ms. Lynch and Mr. Perlowski are also trustees of the BlackRock Credit Strategies Fund and BlackRock Private Investments Fund. |
| (e) | Mr. Fairbairn and Mr. Perlowski are both “interested persons,” as defined in the 1940 Act, of the Trust based on their positions with BlackRock, Inc. and its affiliates. Mr. Fairbairn and Mr. Perlowski are also board members of the BlackRock Multi-Asset Complex. |
| T R U S T E E A N D O F F I C E R I N F O R M A T I O N |
29 |
Trustee and Officer Information (continued)
| Officers Who Are Not Trustees(a) | ||||
| Name Year of Birth(b)
|
Position(s) Held (Length of Service)
|
Principal Occupation(s) During Past 5 Years
| ||
| Jonathan Diorio 1980 |
Vice President (Since 2021) |
Managing Director of BlackRock, Inc. since 2015; Director of BlackRock, Inc. from 2011 to 2015. | ||
| Trent Walker 1974 |
Chief Financial Officer (Since 2021) |
Managing Director of BlackRock, Inc. since September 2019; Executive Vice President of PIMCO from 2016 to 2019; Senior Vice President of PIMCO from 2008 to 2015; Treasurer from 2013 to 2019 and Assistant Treasurer from 2007 to 2017 of PIMCO Funds, PIMCO Variable Insurance Trust, PIMCO ETF Trust, PIMCO Equity Series, PIMCO Equity Series VIT, PIMCO Managed Accounts Trust, 2 PIMCO-sponsored interval funds and 21 PIMCO-sponsored closed-end funds. | ||
| Jay M. Fife 1970 |
Treasurer (Since 2021) |
Managing Director of BlackRock, Inc. since 2007. | ||
| Charles Park 1967 |
Chief Compliance Officer (Since 2021) |
Anti-Money Laundering Compliance Officer for certain BlackRock-advised Funds from 2014 to 2015; Chief Compliance Officer of BlackRock Advisors, LLC and the BlackRock-advised Funds in the BlackRock Multi Asset Complex and the BlackRock Fixed-Income Complex since 2014; Principal of and Chief Compliance Officer for iShares® Delaware Trust Sponsor LLC since 2012 and BlackRock Fund Advisors (“BFA”) since 2006; Chief Compliance Officer for the BFA-advised iShares® exchange traded funds since 2006; Chief Compliance Officer for BlackRock Asset Management International Inc. since 2012. | ||
| Lisa Belle 1968 |
Anti-Money Laundering Compliance Officer (Since 2021) |
Managing Director of BlackRock, Inc. since 2019; Global Financial Crime Head for Asset and Wealth Management of JP Morgan from 2013 to 2019; Managing Director of RBS Securities from 2012 to 2013; Head of Financial Crimes for Barclays Wealth Americas from 2010 to 2012. | ||
| Janey Ahn 1975 |
Secretary (Since 2021) |
Managing Director of BlackRock, Inc. since 2018; Director of BlackRock, Inc. from 2009 to 2017. | ||
| (a) | The address of each Officer is c/o BlackRock, Inc., 50 Hudson Yards, New York, NY 10001. |
| (b) | Officers of the Fund serve at the pleasure of the Board. |
Further information about the Fund’s Trustees and Officers is available in the Fund’s Statement of Additional Information, which can be obtained without charge by calling (800) 882-0052.
| 30 | 2 0 2 3 B L A C K R O C K A N N U A L R E P O R T T O S H A R E H O L D E R S |
The following information is a summary of certain changes since March 31, 2022. This information may not reflect all of the changes that have occurred since you purchased the Fund.
General Information
Except if noted otherwise herein, there were no changes to the Fund’s charter or by-laws that would delay or prevent a change of control of the Fund that were not approved by the shareholders. Except if noted otherwise herein, there have been no changes in the persons who are primarily responsible for the day-to-day management of the Fund’s portfolios.
The Fund calculates its NAV as of the close of business on the last Business Day of each calendar month, within approximately 25 calendar days after the last Business Day of such month, and at such other times as the Board may determine. Shareholders desiring to obtain the Fund’s most recently calculated NAV may contact The Bank of New York Mellon, at 1-888-919-6902.
In accordance with Section 23(c) of the Investment Company Act of 1940, the Fund may from time to time purchase shares of its common stock in the open market or in private transactions.
Quarterly performance, semi-annual and annual reports, current net asset value and other information regarding the Fund may be found on BlackRock’s website, which can be accessed at blackrock.com. Any reference to BlackRock’s website in this report is intended to allow investors public access to information regarding the Fund and does not, and is not intended to, incorporate BlackRock’s website in this report.
Electronic Delivery
Shareholders can sign up for e-mail notifications of quarterly statements, annual and semi-annual shareholder reports and prospectuses by enrolling in the electronic delivery program. Electronic copies of shareholder reports and prospectuses are available on BlackRock’s website.
To enroll in electronic delivery:
Shareholders Who Hold Accounts with Investment Advisers, Banks or Brokerages:
Please contact your financial adviser. Please note that not all investment advisers, banks or brokerages may offer this service.
Householding
The Fund will mail only one copy of shareholder documents, including prospectuses, annual and semi-annual reports, Rule 30e-3 notices and proxy statements, to shareholders with multiple accounts at the same address. This practice is commonly called “householding” and is intended to reduce expenses and eliminate duplicate mailings of shareholder documents. Mailings of your shareholder documents may be householded indefinitely unless you instruct us otherwise. If you do not want the mailing of these documents to be combined with those for other members of your household, please call the Fund at (800) 882-0052.
Availability of Quarterly Schedule of Investments
The Fund files its complete schedule of portfolio holdings with the SEC for the first and third quarters of each fiscal year as an exhibit to its reports on Form N-PORT. The Fund’s Form N-PORT is available on the SEC’s website at sec.gov. Additionally, the Fund makes its portfolio holdings for the first and third quarters of each fiscal year available at blackrock.com/fundreports.
Availability of Proxy Voting Policies, Procedures and Voting Records
A description of the policies and procedures that the Fund uses to determine how to vote proxies relating to portfolio securities and information about how the Fund voted proxies relating to securities held in the Fund’s portfolios during the most recent 12-month period ended June 30 is available without charge, upon request (1) by calling (800) 882-0052; (2) on the BlackRock website at blackrock.com; and (3) on the SEC’s website at sec.gov.
Availability of Fund Updates
BlackRock will update performance and certain other data for the Fund on a monthly basis on its website in the “Closed-end Funds” section of blackrock.com as well as certain other material information as necessary from time to time. Investors and others are advised to check the website for updated performance information and the release of other material information about the Fund. This reference to BlackRock’s website is intended to allow investors public access to information regarding the Fund and does not, and is not intended to, incorporate BlackRock’s website in this report.
BlackRock Privacy Principles
BlackRock is committed to maintaining the privacy of its current and former fund investors and individual clients (collectively, “Clients”) and to safeguarding their non-public personal information. The following information is provided to help you understand what personal information BlackRock collects, how we protect that information and why in certain cases we share such information with select parties.
| A D D I T I O N A L I N F O R M A T I O N |
31 |
Additional Information (continued)
BlackRock Privacy Principles (continued)
If you are located in a jurisdiction where specific laws, rules or regulations require BlackRock to provide you with additional or different privacy-related rights beyond what is set forth below, then BlackRock will comply with those specific laws, rules or regulations.
BlackRock obtains or verifies personal non-public information from and about you from different sources, including the following: (i) information we receive from you or, if applicable, your financial intermediary, on applications, forms or other documents; (ii) information about your transactions with us, our affiliates, or others; (iii) information we receive from a consumer reporting agency; and (iv) from visits to our websites.
BlackRock does not sell or disclose to non-affiliated third parties any non-public personal information about its Clients, except as permitted by law or as is necessary to respond to regulatory requests or to service Client accounts. These non-affiliated third parties are required to protect the confidentiality and security of this information and to use it only for its intended purpose.
We may share information with our affiliates to service your account or to provide you with information about other BlackRock products or services that may be of interest to you. In addition, BlackRock restricts access to non-public personal information about its Clients to those BlackRock employees with a legitimate business need for the information. BlackRock maintains physical, electronic and procedural safeguards that are designed to protect the non-public personal information of its Clients, including procedures relating to the proper storage and disposal of such information.
Fund and Service Providers
Investment Adviser
BlackRock Advisors, LLC
Wilmington, DE 19809
Accounting Agent and Transfer Agent
BNY Mellon Investment Servicing (US) Inc.
Wilmington, DE 19809
Custodian
The Bank of New York Mellon
New York, NY 10286
Independent Registered Public Accounting Firm
Deloitte & Touche LLP
Boston, MA 02116
Distributor
BlackRock Investments, LLC
New York, NY 10001
Legal Counsel
Willkie Farr & Gallagher LLP
New York, NY 10019
Address of the Fund
100 Bellevue Parkway
Wilmington, DE 19809
| 32 | 2 0 2 3 B L A C K R O C K A N N U A L R E P O R T T O S H A R E H O L D E R S |
Want to know more?
blackrock.com | 800-441-7762
This report is intended for current holders. It is not authorized for use as an offer of sale or a solicitation of an offer to buy shares of the Fund unless preceded or accompanied by the Fund’s current prospectus. Past performance results shown in this report should not be considered a representation of future performance. Investment returns and principal value of shares will fluctuate so that shares, if repurchased by the Fund in connection with any applicable tender offer, may be worth more or less than their original cost. Statements and other information herein are as dated and are subject to change.
GPS-3/23AR
|
|

|
(b) Not Applicable
| Item 3 – | Audit Committee Financial Experts – The registrant’s board of directors (the “board of directors”), has determined that (i) the registrant has the following audit committee financial experts serving on its audit committee and (ii) each audit committee financial expert is independent: |
Frank J. Fabozzi
Lorenzo A. Flores Catherine A. Lynch
Under applicable securities laws, a person determined to be an audit committee financial expert will not be deemed an “expert” for any purpose, including without limitation for the purposes of Section 11 of the Securities Act of 1933, as a result of being designated or identified as an audit committee financial expert. The designation or identification of a person as an audit committee financial expert does not impose on such person any duties, obligations, or liabilities greater than the duties, obligations, and liabilities imposed on such person as a member of the audit committee and board of directors in the absence of such designation or identification. The designation or identification of a person as an audit committee financial expert does not affect the duties, obligations, or liability of any other member of the audit committee or board of directors.
| Item 4 – | Principal Accountant Fees and Services |
The following table presents fees billed by Deloitte & Touche LLP (“D&T”) in each of the last two fiscal years for the services rendered to the Fund:
| (a) Audit Fees | (b) Audit-Related Fees1 | (c) Tax Fees2 | (d) All Other Fees | |||||||||||||
| Entity Name | Current Fiscal Year End |
Previous Fiscal Year End |
Current Fiscal Year End |
Previous Fiscal Year End |
Current Fiscal Year End |
Previous Fiscal Year End |
Current Fiscal Year End |
Previous Fiscal Year End | ||||||||
| BlackRock Hedge Fund Guided Portfolio Solution | $46,818 | $44,982 | $0 | $213 | $22,900 | $22,000 | $218 | $0 | ||||||||
The following table presents fees billed by D&T that were required to be approved by the registrant’s audit committee (the “Committee”) for services that relate directly to the operations or financial reporting of the Fund and that are rendered on behalf of BlackRock Advisors, LLC (“Investment Adviser” or “BlackRock”) and entities controlling, controlled by, or under common control with BlackRock (not including any sub-adviser whose role is primarily portfolio management and is subcontracted with or overseen by another investment adviser) that provide ongoing services to the Fund (“Affiliated Service Providers”):
2
| Current Fiscal Year End | Previous Fiscal Year End | |||
| (b) Audit-Related Fees1 | $0 | $0 | ||
| (c) Tax Fees2 | $0 | $0 | ||
| (d) All Other Fees3 | $2,154,000 | $2,098,000 |
1 The nature of the services includes assurance and related services reasonably related to the performance of the audit or review of financial statements not included in Audit Fees, including accounting consultations, agreed-upon procedure reports, attestation reports, comfort letters, out-of-pocket expenses and internal control reviews not required by regulators.
2 The nature of the services includes tax compliance and/or tax preparation, including services relating to the filing or amendment of federal, state or local income tax returns, regulated investment company qualification reviews, taxable income and tax distribution calculations.
3 Non-audit fees of $2,154,000 and $2,098,000 for the current fiscal year and previous fiscal year, respectively, were paid to the Fund’s principal accountant in their entirety by BlackRock, in connection with services provided to the Affiliated Service Providers of the Fund and of certain other funds sponsored and advised by BlackRock or its affiliates for a service organization review and an accounting research tool subscription. These amounts represent aggregate fees paid by BlackRock and were not allocated on a per fund basis.
(e)(1) Audit Committee Pre-Approval Policies and Procedures:
The Committee has adopted policies and procedures with regard to the pre-approval of services. Audit, audit-related and tax compliance services provided to the registrant on an annual basis require specific pre-approval by the Committee. The Committee also must approve other non-audit services provided to the registrant and those non-audit services provided to the Investment Adviser and Affiliated Service Providers that relate directly to the operations and the financial reporting of the registrant. Certain of these non-audit services that the Committee believes are (a) consistent with the SEC’s auditor independence rules and (b) routine and recurring services that will not impair the independence of the independent accountants may be approved by the Committee without consideration on a specific case-by-case basis (“general pre-approval”). The term of any general pre-approval is 12 months from the date of the pre-approval, unless the Committee provides for a different period. Tax or other non-audit services provided to the registrant which have a direct impact on the operations or financial reporting of the registrant will only be deemed pre-approved provided that any individual project does not exceed $10,000 attributable to the registrant or $50,000 per project. For this purpose, multiple projects will be aggregated to determine if they exceed the previously mentioned cost levels.
Any proposed services exceeding the pre-approved cost levels will require specific pre-approval by the Committee, as will any other services not subject to general pre-approval (e.g., unanticipated but permissible services). The Committee is informed of each service approved subject to general pre-approval at the next regularly scheduled in-person board meeting. At this meeting, an analysis of such services is presented to the Committee for ratification. The Committee may delegate to the Committee Chairman the authority to approve the provision of and fees for any specific engagement of permitted non-audit services, including services exceeding pre-approved cost levels.
(e)(2) None of the services described in each of Items 4(b) through (d) were approved by the Committee pursuant to the de minimis exception in paragraph (c)(7)(i)(C) of Rule 2-01 of Regulation S-X.
(f) Not Applicable
(g) The aggregate non-audit fees, defined as the sum of the fees shown under “Audit-Related Fees,”
3
“Tax Fees” and “All Other Fees,” paid to the accountant for services rendered by the accountant to the registrant, the Investment Adviser and the Affiliated Service Providers were:
| Entity Name | Current Fiscal Year End |
Previous Fiscal Year End | ||||
| BlackRock Hedge Fund Guided Portfolio Solution | $23,118 | $22,213 |
Additionally, the amounts billed by D&T in connection with services provided to the Affiliated Service Providers of the Fund and of other funds sponsored or advised by BlackRock or its affiliates during the current and previous fiscal years for a service organization review and an accounting research tool subscription were:
|
Current Fiscal Year End |
Previous Fiscal Year End | |
| $2,154,000 | $2,098,000 |
These amounts represent aggregate fees paid by BlackRock and were not allocated on a per fund basis.
(h) The Committee has considered and determined that the provision of non-audit services that were rendered to the Investment Adviser, and the Affiliated Service Providers that were not pre-approved pursuant to paragraph (c)(7)(ii) of Rule 2-01 of Regulation S-X is compatible with maintaining the principal accountant’s independence.
(i) – Not Applicable
(j) – Not Applicable
| Item 5 – | Audit Committee of Listed Registrant |
(a) Not Applicable
(b) Not Applicable
| Item 6 – | Investments |
(a) The registrant’s Schedule of Investments is included as part of the Report to Stockholders filed under Item 1(a) of this Form.
(b) Not Applicable due to no such divestments during the semi-annual period covered since the previous Form N-CSR filing.
| Item 7 – | Disclosure of Proxy Voting Policies and Procedures for Closed-End Management Investment Companies – The board of directors has delegated the voting of proxies for the Fund’s portfolio securities to the Investment Adviser pursuant to the Investment Adviser’s proxy voting guidelines. Under these guidelines, the Investment Adviser will vote proxies related to Fund securities in the |
4
best interests of the Fund and its stockholders. From time to time, a vote may present a conflict between the interests of the Fund’s stockholders, on the one hand, and those of the Investment Adviser, or any affiliated person of the Fund or the Investment Adviser, on the other. In such event, provided that the Investment Adviser’s Equity Investment Policy Oversight Committee, or a sub-committee thereof (the “Oversight Committee”) is aware of the real or potential conflict or material non-routine matter and if the Oversight Committee does not reasonably believe it is able to follow its general voting guidelines (or if the particular proxy matter is not addressed in the guidelines) and vote impartially, the Oversight Committee may retain an independent fiduciary to advise the Oversight Committee on how to vote or to cast votes on behalf of the Investment Adviser’s clients. If the Investment Adviser determines not to retain an independent fiduciary, or does not desire to follow the advice of such independent fiduciary, the Oversight Committee shall determine how to vote the proxy after consulting with the Investment Adviser’s Portfolio Management Group and/or the Investment Adviser’s Legal and Compliance Department and concluding that the vote cast is in its client’s best interest notwithstanding the conflict. A copy of the Fund’s Proxy Voting Policy and Procedures are attached as Exhibit 99.PROXYPOL, a copy of the Fund’s Global Corporate Governance & Engagement Principles are attached as Exhibit 99.GLOBAL.CORP.GOV and a copy of the Fund’s Corporate Governance and Proxy Voting Guidelines for U.S. Securities are attached as Exhibit 99.US.CORP.GOV. Information on how the Fund voted proxies relating to portfolio securities during the most recent 12-month period ended June 30 is available without charge, (i) at www.blackrock.com and (ii) on the SEC’s website at http://www.sec.gov.
| Item 8 – | Portfolio Managers of Closed-End Management Investment Companies |
(a)(1) As of the date of filing this Report:
The registrant is managed by a team of investment professionals comprised of Jeff Dunbar, CFA, Managing Director at BlackRock, and Albert Matriotti, Managing Director at BlackRock. Messrs. Dunbar and Matriotti are the Fund’s co-portfolio managers and are responsible for the day-to-day management of the Fund’s portfolio and the selection of its investments. Messrs. Dunbar and Matriotti have been members of the Fund’s management team since 2021.
| Portfolio Manager | Biography | |
| Jeff Dunbar, CFA | Managing Director of BlackRock since 2007. | |
| Albert Matriotti | Managing Director of BlackRock since 2007. |
(a)(2) As of March 31, 2023:
| (ii) Number of Other Accounts Managed and Assets by Account Type
|
(iii) Number of Other Accounts and Assets for Which Advisory Fee is Performance-Based | |||||||||||
|
(i) Name of Portfolio Manager |
Other Registered Investment Companies |
Other Pooled Investment Vehicles
|
Other Accounts |
Other Registered Investment Companies |
Other Pooled Investment Vehicles
|
Other Accounts | ||||||
|
Jeff Dunbar, CFA |
0 | 13 | 0 | 0 | 6 | 0 | ||||||
| $0 | $2.38 Billion | $0 | $0 | $637.9 Million | $0 | |||||||
|
Albert Matriotti |
0 | 24 | 2 | 0 | 8 | 1 | ||||||
| $0 | $6.06 Billion | $285.4 Million | $0 | $1.90 Billion | $72.06 Million | |||||||
5
| (iv) | Portfolio Manager Potential Material Conflicts of Interest |
BlackRock has built a professional working environment, firm-wide compliance culture and compliance procedures and systems designed to protect against potential incentives that may favor one account over another. BlackRock has adopted policies and procedures that address the allocation of investment opportunities, execution of portfolio transactions, personal trading by employees and other potential conflicts of interest that are designed to ensure that all client accounts are treated equitably over time. Nevertheless, BlackRock furnishes investment management and advisory services to numerous clients in addition to the Fund, and BlackRock may, consistent with applicable law, make investment recommendations to other clients or accounts (including accounts which are hedge funds or have performance or higher fees paid to BlackRock, or in which portfolio managers have a personal interest in the receipt of such fees), which may be the same as or different from those made to the Fund. In addition, BlackRock, Inc., its affiliates and significant shareholders and any officer, director, shareholder or employee may or may not have an interest in the securities whose purchase and sale BlackRock recommends to the Fund. BlackRock, Inc., or any of its affiliates or significant shareholders, or any officer, director, shareholder, employee or any member of their families may take different actions than those recommended to the Fund by BlackRock with respect to the same securities. Moreover, BlackRock may refrain from rendering any advice or services concerning securities of companies of which any of BlackRock, Inc.’s (or its affiliates’ or significant shareholders’) officers, directors or employees are directors or officers, or companies as to which BlackRock, Inc. or any of its affiliates or significant shareholders or the officers, directors and employees of any of them has any substantial economic interest or possesses material non-public information. Certain portfolio managers also may manage accounts whose investment strategies may at times be opposed to the strategy utilized for a fund. It should also be noted that Messrs. Dunbar and Matriotti may be managing hedge fund and/or long only accounts, or may be part of a team managing hedge fund and/or long only accounts, subject to incentive fees. Messrs. Dunbar and Matriotti may therefore be entitled to receive a portion of any incentive fees earned on such accounts.
As a fiduciary, BlackRock owes a duty of loyalty to its clients and must treat each client fairly. When BlackRock purchases or sells securities for more than one account, the trades must be allocated in a manner consistent with its fiduciary duties. BlackRock attempts to allocate investments in a fair and equitable manner among client accounts, with no account receiving preferential treatment. To this end, BlackRock, Inc. has adopted policies that are intended to ensure reasonable efficiency in client transactions and provide BlackRock with sufficient flexibility to allocate investments in a manner that is consistent with the particular investment discipline and client base, as appropriate.
(a)(3) As of March 31, 2023:
Portfolio Manager Compensation Overview
6
The discussion below describes the portfolio managers’ compensation as of March 31, 2023.
BlackRock’s financial arrangements with its portfolio managers, its competitive compensation and its career path emphasis at all levels reflect the value senior management places on key resources. Compensation may include a variety of components and may vary from year to year based on a number of factors. The principal components of compensation include a base salary, a performance-based discretionary bonus, participation in various benefits programs and one or more of the incentive compensation programs established by BlackRock.
Base Compensation. Generally, portfolio managers receive base compensation based on their position with the firm.
Discretionary Incentive Compensation
Discretionary incentive compensation is a function of several components: the performance of BlackRock, Inc., the performance of the portfolio manager’s group within BlackRock, the investment performance, including risk-adjusted returns, of the firm’s assets under management or supervision by that portfolio manager, in some cases relative to a predetermined benchmark, and the individual’s performance and contribution to the overall performance of these portfolios and BlackRock. Among other things, BAA’s Compensation Committee makes a subjective determination with respect to each BAA portfolio manager’s compensation based on the performance of the Funds and other accounts managed by each portfolio manager. The performance of these portfolio managers is not measured against a specific benchmark.
Distribution of Discretionary Incentive Compensation. Discretionary incentive compensation is distributed to portfolio managers in a combination of cash, deferred BlackRock, Inc. stock awards, and/or deferred cash awards that notionally track the return of certain BlackRock investment products.
Portfolio managers receive their annual discretionary incentive compensation in the form of cash. Portfolio managers whose total compensation is above a specified threshold also receive deferred BlackRock, Inc. stock awards annually as part of their discretionary incentive compensation. Paying a portion of discretionary incentive compensation in the form of deferred BlackRock, Inc. stock puts compensation earned by a portfolio manager for a given year “at risk” based on BlackRock’s ability to sustain and improve its performance over future periods. In some cases, additional deferred BlackRock, Inc. stock may be granted to certain key employees as part of a long-term incentive award to aid in retention, align interests with long-term shareholders and motivate performance. Deferred BlackRock, Inc. stock awards are generally granted in the form of BlackRock, Inc. restricted stock units that vest pursuant to the terms of the applicable plan and, once vested, settle in BlackRock, Inc. common stock. The portfolio managers of this Fund have deferred BlackRock, Inc. stock awards.
For certain portfolio managers, a portion of the discretionary incentive compensation is also distributed in the form of deferred cash awards that notionally track
7
the returns of select BlackRock investment products they manage, which provides direct alignment of portfolio manager discretionary incentive compensation with investment product results. Deferred cash awards vest ratably over a number of years and, once vested, settle in the form of cash. Only portfolio managers who manage specified products and whose total compensation is above a specified threshold are eligible to participate in the deferred cash award program.
Other Compensation Benefits. In addition to base salary and discretionary incentive compensation, portfolio managers may be eligible to receive or participate in one or more of the following:
Incentive Savings Plans — BlackRock, Inc. has created a variety of incentive savings plans in which BlackRock, Inc. employees are eligible to participate, including a 401(k) plan, the BlackRock Retirement Savings Plan (RSP), and the BlackRock Employee Stock Purchase Plan (ESPP). The employer contribution components of the RSP include a company match equal to 50% of the first 8% of eligible pay contributed to the plan capped at $5,000 per year, and a company retirement contribution equal to 3-5% of eligible compensation up to the Internal Revenue Service limit ($330,000 for 2023). The RSP offers a range of investment options, including registered investment companies and collective investment funds managed by the firm. BlackRock, Inc. contributions follow the investment direction set by participants for their own contributions or, absent participant investment direction, are invested into a target date fund that corresponds to, or is closest to, the year in which the participant attains age 65. The ESPP allows for investment in BlackRock, Inc. common stock at a 5% discount on the fair market value of the stock on the purchase date. Annual participation in the ESPP is limited to the purchase of 1,000 shares of common stock or a dollar value of $25,000 based on its fair market value on the purchase date. All of the eligible portfolio managers are eligible to participate in these plans.
(a)(4) Beneficial Ownership of Securities – As of March 31, 2023.
| Portfolio Manager | Dollar Range of Equity Securities of the Fund Beneficially Owned | |
| Jeff Dunbar, CFA | None | |
| Albert Matriotti | None |
(b) Not Applicable
| Item 9 – | Purchases of Equity Securities by Closed-End Management Investment Company and Affiliated Purchasers – Not Applicable |
| Item 10 – | Submission of Matters to a Vote of Security Holders – There have been no material changes to these procedures. |
| Item 11 – | Controls and Procedures |
8
(a) The registrant’s principal executive and principal financial officers, or persons performing similar functions, have concluded that the registrant’s disclosure controls and procedures (as defined in Rule 30a-3(c) under the Investment Company Act of 1940, as amended (the “1940 Act”)) are effective as of a date within 90 days of the filing of this report based on the evaluation of these controls and procedures required by Rule 30a-3(b) under the 1940 Act and Rule 13a-15(b) under the Securities Exchange Act of 1934, as amended.
(b) There were no changes in the registrant’s internal control over financial reporting (as defined in Rule 30a-3(d) under the 1940 Act) that occurred during the period covered by this report that have materially affected, or are reasonably likely to materially affect, the registrant’s internal control over financial reporting.
| Item 12 – | Disclosure of Securities Lending Activities for Closed-End Management Investment Companies – Not Applicable |
| Item 13 – | Exhibits attached hereto |
(a)(1) Code of Ethics – See Item 2
(a)(2) Section 302 Certifications are attached
(a)(3) Any written solicitation to purchase securities under Rule 23c-1 – Not Applicable
(a)(4) Change in Registrant’s independent public accountant – Not Applicable
(b) Section 906 Certifications are attached
9
Pursuant to the requirements of the Securities Exchange Act of 1934 and the Investment Company Act of 1940, the registrant has duly caused this report to be signed on its behalf by the undersigned, thereunto duly authorized.
BlackRock Hedge Fund Guided Portfolio Solution
| By: | /s/ John M. Perlowski | |||
| John M. Perlowski | ||||
| Chief Executive Officer (principal executive officer) of | ||||
| BlackRock Hedge Fund Guided Portfolio Solution |
Date: May 24, 2023
Pursuant to the requirements of the Securities Exchange Act of 1934 and the Investment Company Act of 1940, this report has been signed below by the following persons on behalf of the registrant and in the capacities and on the dates indicated.
| By: | /s/ John M. Perlowski | |||
| John M. Perlowski | ||||
| Chief Executive Officer (principal executive officer) of | ||||
| BlackRock Hedge Fund Guided Portfolio Solution |
Date: May 24, 2023
| By: | /s/ Trent Walker | |||
| Trent Walker | ||||
| Chief Financial Officer (principal financial officer) of | ||||
| BlackRock Hedge Fund Guided Portfolio Solution |
Date: May 24, 2023
10
ATTACHMENTS / EXHIBITS
CERTIFICATION PURSUANT TO SECTION 302
CERTIFICATION PURSUANT TO SECTION 906
GLOBAL CORPORATE GOVERNANCE & ENGAGEMENT PRINCIPLES
Serious News for Serious Traders! Try StreetInsider.com Premium Free!
You May Also Be Interested In
- HP Inc. (HPQ) Climbs Following Stake by Greenlight Capital
- LuxUrban Hotels (LUXH) Appoints Andrew Schwartz to its Board
- FREYR Battery (FREY) Appoints Todd Kantor, Tore Ivar Slettemoen, and David Manners to its Board
Create E-mail Alert Related Categories
SEC FilingsRelated Entities
Hedge FundsSign up for StreetInsider Free!
Receive full access to all new and archived articles, unlimited portfolio tracking, e-mail alerts, custom newswires and RSS feeds - and more!
