

Form N-CSR Advisors' Inner Circle For: Sep 30
 Tweet
Tweet Share
Share
UNITED STATES
SECURITIES AND EXCHANGE COMMISSION
Washington, D.C. 20549
FORM N-CSR
CERTIFIED SHAREHOLDER REPORT OF REGISTERED
MANAGEMENT INVESTMENT COMPANIES
Investment Company Act File Number 811-22920
The Advisors’ Inner Circle Fund III
(Exact name of registrant as specified in charter)
SEI Investments
One Freedom Valley Drive
Oaks, PA 19456
(Address of principal executive offices) (Zip code)
SEI Investments
One Freedom Valley Drive
Oaks, PA 19456
(Name and address of agent for service)
Registrant’s telephone number, including area code: (877) 446-3863
Date of fiscal year end: September 30, 2022
Date of reporting period: September 30, 2022
Item 1. Reports to Stockholders.
A copy of the report transmitted to stockholders pursuant to Rule 30e-1 under the Investment Company Act of 1940, as amended (the “Act”) (17 CFR § 270.30e-1), is attached hereto.
The Advisors’ Inner Circle Fund III

First Foundation Fixed Income Fund
First Foundation Total Return Fund
| ANNUAL REPORT | SEPTEMBER 30, 2022 |
|
Investment Adviser: Brookmont Capital Management, LLC
|
| THE ADVISORS’ INNER CIRCLE FUND III | BROOKMONT FUNDS | |
| SEPTEMBER 30, 2022 | ||
| 1 | ||||
| 7 | ||||
| 26 | ||||
| 28 | ||||
| 29 | ||||
| 33 | ||||
| 37 | ||||
| 59 | ||||
| 60 | ||||
| Trustees and Officers of the Advisors’ Inner Circle Fund III |
62 | |||
| 70 | ||||
| 74 | ||||
The Funds file their complete schedule of investments with the US Securities and Exchange Commission (“SEC”) for the first and third quarters of each fiscal year as an exhibit to its reports on Form N-PORT (Form N-Q for filings prior to March 31, 2020). The Funds’ Form N-Q and N-PORT are available on the SEC’s website at https://www.sec.gov, and may be reviewed and copied at the SEC’s Public Reference Room in Washington, DC. Information on the operation of the Public Reference Room may be obtained by calling 1-800-SEC-0330.
A description of the policies and procedures that the Funds use to determine how to vote proxies relating to Fund securities, as well as information relating to how a Fund voted proxies relating to fund securities during the most recent 12-month period ended June 30, is available (i) without charge, upon request, by calling 1-800-838-0191 and (ii) on the SEC’s website at https://www.sec.gov.
| THE ADVISORS’ INNER CIRCLE FUND III | FIRST FOUNDATION | |
| FIXED INCOME FUND | ||
| SEPTEMBER 30, 2022 | ||
| (Unaudited) |
For the twelve-month period ended September 30, 2022, the First Foundation Fixed Income Fund (the “Fund”) returned -13.79% for Class A shares (without load) and -13.59% for Class Y shares. The Fund’s benchmark, the Bloomberg US Aggregate Bond Index, returned -14.60%, and the Fund’s Morningstar peer group, the Intermediate Core-Plus Bond Category, returned -14.56% over the same period.
The outperformance over the past twelve months was primarily driven by the Fund’s exposure to credit risk and underweight exposure to longer-duration securities. The Fund had a duration of 5.8 years versus 6.8 years for the index to begin the year.
Manager’s Discussion
Throughout 2022, the Federal Reserve (Fed) has moved aggressively in its attempts to rein in inflation by raising interest rates and shrinking its balance sheet. In September, the Fed moved 75bp, taking the Fed funds rate to 3.0 – 3.25%. That is over a 300bp move in the federal funds rate in just over six months. The Fed’s strategy has been to get rates back to a neutral level as fast as possible and embrace restrictive monetary policy for as long as necessary, based on how the economic and labor markets evolve.
After a year of highly aggressive monetary policy, many fixed-income sectors are pricing at compelling levels. Treasury yields have hit decade highs as the financial markets price in a nearly 5% fed funds rate within the next six months. With fixed-income yields at decade highs and treasury yields over 4% across the curve, income opportunities abound in our markets. With core CPI at a 40-year high and the unemployment rate at a 50-year low, the market dynamics within the U.S. should continue to pressure the Fed to stay aggressive with monetary policy. As such, fixed-income markets will remain volatile, and we currently prefer the “higher quality, greater liquidity” theme within markets. Thus, while we remain diligent in our search for attractive risk-adjusted returns, we believe patience and protection are in order and will be rewarded and afford attractive entry points to be exploited in the future.
1
| THE ADVISORS’ INNER CIRCLE FUND III | FIRST FOUNDATION | |
| FIXED INCOME FUND | ||
| SEPTEMBER 30, 2022 | ||
| (Unaudited) |
|
AVERAGE ANNUAL TOTAL RETURN FOR THE YEAR ENDED SEPTEMBER 30, 2022* | ||||||||||
| One Year Return |
Three Year Return |
Five Year Return |
Ten Year Return |
Annualized Inception to Date* | ||||||
| First Foundation Fixed Income Fund, Class A Shares (with load)** | -17.44% | -3.41% | -0.87% | 0.63% | 3.74% | |||||
| First Foundation Fixed Income Fund, Class A Shares (without load)** | -13.79% | -2.00% | 0.00% | 1.07% | 3.90% | |||||
| First Foundation Fixed Income Fund, Class Y Shares | -13.59% | -1.75% | 0.24% | 1.33% | 4.15% | |||||
| Bloomberg U.S. Aggregate Bond Index |
-14.60% | -3.26% | -0.27% | 0.89% | 4.34% | |||||
Growth of a $10,000 Investment
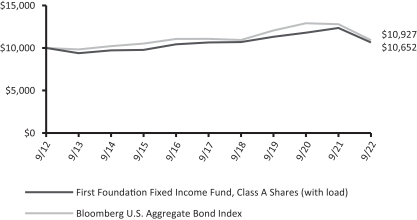
* Inception date of the Fund is November 29, 1993.
** Refers to the individual maximum sales charge of 4.25%.
The performance data quoted herein represents past performance and the return and value of an investment in the Fund will fluctuate so that, when redeemed, may be worth less than its original cost.
Past performance is no guarantee of future performance and should not be considered as a representation of the future results of the Fund. The Fund’s performance assumes the reinvestment of all dividends and all capital gains. Index returns assume reinvestment of dividends and, unlike a Fund’s returns, do not reflect any fees or expenses. If such fees and expenses were included in the index returns, the performance would have been lower.
Please note that one cannot invest directly in an unmanaged index. There are no assurances that the Fund will meet its stated objectives. The Fund’s holdings and
2
| THE ADVISORS’ INNER CIRCLE FUND III | FIRST FOUNDATION | |
| FIXED INCOME FUND | ||
| SEPTEMBER 30, 2022 | ||
| (Unaudited) |
allocations are subject to change because it is actively managed and should not be considered recommendations to buy individual securities.
Returns shown do not reflect the deduction of taxes that a shareholder would pay on Fund distributions or the redemption of Fund shares.
See definition of comparative indices on page 6.
3
| THE ADVISORS’ INNER CIRCLE FUND III | FIRST FOUNDATION | |
| TOTAL RETURN FUND | ||
| SEPTEMBER 30, 2022 | ||
| (Unaudited) |
Performance Review
For the twelve-month period ended September 30, 2022, the First Foundation Total Return Fund (the “Fund”) returned -4.98% for Class Y shares and -5.20% for the Class A shares (without load). The Fund’s benchmarks, the Bloomberg U.S. Aggregate Bond Index and the S&P 500 Index, returned -14.60% and -15.47% respectively, over the same period.
Manager’s Discussion
The Fund seeks to maximize total return by investing primarily in a combination of U.S. and International equity and debt securities. We utilize an active approach to asset allocation and hold concentrated positions. Our valuation discipline across asset classes and independent insights ensures that each investment candidate is evaluated from varying perspectives and ideas compete for capital.
During a weak period in the last twelve months ending September 30, both the stock and bond market were down 15%. The simultaneous pain in both bond and equity indexes led to little benefit to diversification for those indexes. We were relieved to have captured only one third of the downside of the broad security markets during this time.
With the mainline investment markets offering few places to hide, we were pleased to be a relatively safe port in the storm. Versus our Morningstar Moderate Index we use to evaluate ourselves we are now the 1st percentile manager through September 30th on a year-to- date, 2nd percentile over one year and 1st percentile on a 3 year basis. Over the past 5 years we are in the 11th percentile, and we believe our since inception numbers (7.5 years) to be better than 95% of our peers. Being willing to express our view in an independent manner has led us away from the major equity and bond index weights which we also believe to be superior from a risk standpoint.
The Fund has not made any significant changes over the past year except to increase our weightings in “ballast” companies that are lower beta than the average equity and to recycle our investible real asset equities. Our large position in low duration bonds has proved fruitful during our management tenure especially in the past 12 months as it has preserved our ability to dynamically allocate capital.
|
AVERAGE ANNUAL TOTAL RETURN FOR THE YEAR ENDED SEPTEMBER 30, 2022* | ||||||||||
| One Year Return |
Three Year Return |
Five Year Return |
Ten Year Return |
Annualized Inception to Date* | ||||||
| First Foundation Total Return Fund, Class A Shares (with load)** | -10.65% | 6.35% | 4.11% | 5.75% | 6.50% | |||||
| First Foundation Total Return Fund, Class A Shares (without load)** |
-5.20% | 8.47% | 5.35% | 6.38% | 6.72% | |||||
| First Foundation Total Return Fund, Class Y Shares |
-4.98% | 8.75% | 5.61% | 6.64% | 6.92% | |||||
| S&P 500 Index |
-15.47% | 8.16% | 9.24% | 11.70% | 9.45% | |||||
| Bloomberg U.S. Aggregate Bond Index |
-14.60% | -3.26% | -0.27% | 0.89% | 4.34% | |||||
4
| THE ADVISORS’ INNER CIRCLE FUND III | FIRST FOUNDATION | |
| TOTAL RETURN FUND | ||
| SEPTEMBER 30, 2022 | ||
| (Unaudited) |
Growth of a $10,000 Investment
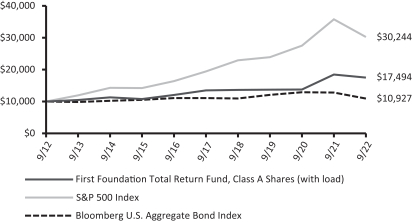
* Inception date of the Fund is February 22, 1993.
** Refers to the individual maximum sales charge of 5.75%.
The performance data quoted herein represents past performance and the return and value of an investment in the Fund will fluctuate so that, when redeemed, may be worth less than its original cost.
Past performance is no guarantee of future performance and should not be considered as a representation of the future results of the Fund. The Fund’s performance assumes the reinvestment of all dividends and all capital gains. Index returns assume reinvestment of dividends and, unlike a Fund’s returns, do not reflect any fees or expenses. If such fees and expenses were included in the index returns, the performance would have been lower.
Please note that one cannot invest directly in an unmanaged index. There are no assurances that the Fund will meet its stated objectives. The Fund’s holdings and allocations are subject to change because it is actively managed and should not be considered recommendations to buy individual securities.
Returns shown do not reflect the deduction of taxes that a shareholder would pay on Fund distributions or the redemption of Fund shares.
See definition of comparative indices on page 6.
5
| THE ADVISORS’ INNER CIRCLE FUND III | FIRST FOUNDATION | |
| TOTAL RETURN FUND | ||
| SEPTEMBER 30, 2022 | ||
| (Unaudited) |
Definition of the Comparative Index
Bloomberg U.S. Aggregate Bond Index is a market capitalization-weighted index that measures the performance of high-quality, fixed- income securities across the government, corporate, mortgage-backed, asset-backed, and commercial mortgage- backed markets.
S&P 500 Index is an unmanaged, market-weighted index that consists of approximately 500 of the largest publicly-traded U.S. companies and is considered representative of the broad U.S. stock market.
6
| THE ADVISORS’ INNER CIRCLE FUND III | FIRST FOUNDATION | |
| FIXED INCOME FUND | ||
| SEPTEMBER 30, 2022 | ||
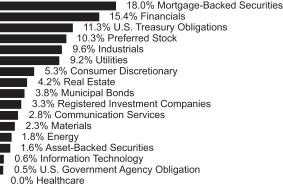
†Percentages are based on total investments.
| Principal Amount ($) |
Value ($) | |||||||
| Corporate Obligations — 50.6% |
| |||||||
| COMMUNICATION SERVICES — 2.8% |
| |||||||
| Netflix |
||||||||
| 4.88%, 04/15/28 |
750,000 | 701,936 | ||||||
| 4.88%, 06/15/30 (a) |
750,000 | 685,378 | ||||||
| ROBLOX |
||||||||
| 3.88%, 05/01/30 (a) |
2,000,000 | 1,627,740 | ||||||
| |
||||||||
| 3.88%, 12/15/27 (a) |
1,000,000 | 937,725 | ||||||
| Warner Media |
||||||||
| 5.35%, 12/15/43 |
168,000 | 131,838 | ||||||
|
|
|
|||||||
| 4,084,617 | ||||||||
|
|
|
|||||||
| CONSUMER DISCRETIONARY — 5.3% |
| |||||||
| Ford Motor Credit |
||||||||
| 3.38%, 11/13/25 |
750,000 | 662,630 | ||||||
| Las Vegas Sands |
||||||||
| 3.20%, 08/08/24 |
1,500,000 | 1,413,989 | ||||||
| 3.90%, 08/08/29 |
2,410,000 | 1,992,535 | ||||||
| Marriott International |
||||||||
| 3.50%, 10/15/32 |
1,000,000 | 804,222 | ||||||
| 4.00%, 04/15/28 |
3,250,000 | 2,942,862 | ||||||
|
|
|
|||||||
| 7,816,238 | ||||||||
|
|
|
|||||||
The accompanying notes are an integral part of the financial statements.
7
| THE ADVISORS’ INNER CIRCLE FUND III | FIRST FOUNDATION | |
| FIXED INCOME FUND | ||
| SEPTEMBER 30, 2022 | ||
| Principal Amount ($) |
Value ($) | |||||||
| Corporate Obligations (continued) |
| |||||||
| ENERGY — 1.7% |
| |||||||
| BP Capital Markets |
||||||||
| US Treas Yield Curve Rate T Note Const Mat 5 Yr + 4.398%, 4.88% (b)(c) |
1,725,000 | 1,483,500 | ||||||
| Energy Transfer |
||||||||
| 6.50%, 02/01/42 |
259,000 | 241,031 | ||||||
| Plains All American Pipeline |
||||||||
| ICE LIBOR USD 3 Month + 4.110%, 6.13% (b)(c) |
1,000,000 | 815,112 | ||||||
|
|
|
|||||||
| 2,539,643 | ||||||||
|
|
|
|||||||
| FINANCIALS — 15.2% |
| |||||||
| Arbor Realty Trust |
||||||||
| 4.50%, 03/15/27 |
1,750,000 | 1,470,557 | ||||||
| Athene Holding |
||||||||
| 3.50%, 01/15/31 |
2,000,000 | 1,601,733 | ||||||
| Bank of America |
||||||||
| ICE LIBOR USD 3 Month + 3.898%, 6.10% (b)(c) |
1,750,000 | 1,677,568 | ||||||
| ICE LIBOR USD 3 Month + 4.553%, 6.30% (b)(c) |
500,000 | 491,150 | ||||||
| Bank of New York Mellon |
||||||||
| US Treas Yield Curve Rate T Note Const Mat 5 Yr + 4.358%, 4.70% (b)(c) |
1,000,000 | 957,500 | ||||||
| Charles Schwab |
||||||||
| US Treas Yield Curve Rate T Note Const Mat 5 Yr + 4.971%, 5.38% (b)(c) |
1,400,000 | 1,361,500 | ||||||
| Everest Reinsurance Holdings |
||||||||
| ICE LIBOR USD 3 Month + 2.385%, 5.29%, 05/15/37 (b) |
1,500,000 | 1,210,109 | ||||||
| Independent Bank Group |
||||||||
| ICE LIBOR USD 3 Month + 2.830%, 5.00%, 12/31/27 (b) |
500,000 | 497,910 | ||||||
| JPMorgan Chase & Co |
||||||||
| ICE LIBOR USD 3 Month + 3.470%, 6.28% (b)(c) |
245,000 | 244,996 | ||||||
| ICE LIBOR USD 3 Month + 3.780%, 6.75% (b)(c) |
3,000,000 | 2,972,778 | ||||||
| Lincoln National |
||||||||
| ICE LIBOR USD 3 Month + 2.040%, 4.75%, 04/20/67 (b) |
400,000 | 267,880 | ||||||
| M&T Bank |
||||||||
| 4.00%, 07/15/24 |
250,000 | 246,473 | ||||||
| Oaktree Specialty Lending |
||||||||
| 2.70%, 01/15/27 |
400,000 | 336,817 | ||||||
| 3.50%, 02/25/25 |
2,750,000 | 2,612,377 | ||||||
| PNC Financial Services Group |
||||||||
| US Treas Yield Curve Rate T Note Const Mat 5 Yr + 3.238%, 6.20% (b)(c) |
150,000 | 141,750 | ||||||
| Prudential Financial, Inc. |
||||||||
| ICE LIBOR USD 3 Month + 3.920%, 5.63%, 06/15/43 (b) |
895,000 | 881,808 | ||||||
The accompanying notes are an integral part of the financial statements.
8
| THE ADVISORS’ INNER CIRCLE FUND III | FIRST FOUNDATION | |
| FIXED INCOME FUND | ||
| SEPTEMBER 30, 2022 | ||
| Principal Amount ($) |
Value ($) | |||||||
| Corporate Obligations (continued) |
| |||||||
| FINANCIALS (continued) |
| |||||||
| Rocket Mortgage |
||||||||
| 2.88%, 10/15/26 (a) |
2,000,000 | 1,640,000 | ||||||
| State Street |
||||||||
| ICE LIBOR USD 3 Month + 1.000%, 4.29%, 06/15/47 (b) |
750,000 | 573,633 | ||||||
| Truist Financial |
||||||||
| US Treas Yield Curve Rate T Note Const Mat 5 Yr + 4.605%, 4.95% (b)(c) |
1,650,000 | 1,585,304 | ||||||
| UBS AG |
||||||||
| 5.13%, 05/15/24 |
500,000 | 487,433 | ||||||
| United Wholesale Mortgage |
||||||||
| 5.50%, 04/15/29 (a) |
500,000 | 380,000 | ||||||
| Wells Fargo |
||||||||
| ICE LIBOR USD 3 Month + 0.500%, 3.01%, 01/15/27 (b) |
795,000 | 743,772 | ||||||
|
|
|
|||||||
| 22,383,048 | ||||||||
|
|
|
|||||||
| HEALTHCARE — 0.0% |
| |||||||
| CVS Pass-Through Trust |
||||||||
| 6.04%, 12/10/28 |
42,159 | 41,866 | ||||||
| Endo Finance |
||||||||
| 5.38%, 01/15/23 (a)(d) |
187,000 | 10,285 | ||||||
|
|
|
|||||||
| 52,151 | ||||||||
|
|
|
|||||||
| INDUSTRIALS — 9.6% |
| |||||||
| BNSF Funding Trust I |
||||||||
| ICE LIBOR USD 3 Month + 2.350%, 6.61%, 12/15/55 (b) |
1,554,000 | 1,454,566 | ||||||
| Boeing |
||||||||
| 3.25%, 03/01/28 to 02/01/35 (e) |
2,125,000 | 1,739,986 | ||||||
| 3.45%, 11/01/28 |
2,150,000 | 1,852,150 | ||||||
| 3.60%, 05/01/34 |
750,000 | 562,174 | ||||||
| 3.63%, 02/01/31 |
1,000,000 | 830,049 | ||||||
| General Electric |
||||||||
| ICE LIBOR USD 3 Month + 3.330%, 6.62% (b)(c) |
1,495,000 | 1,398,099 | ||||||
| General Electric MTN |
||||||||
| ICE LIBOR USD 3 Month + 0.300%, 2.81%, 05/13/24 (b) |
750,000 | 734,690 | ||||||
| Southwest Airlines |
||||||||
| 2.63%, 02/10/30 |
1,000,000 | 802,171 | ||||||
| 3.45%, 11/16/27 |
200,000 | 180,559 | ||||||
| 7.38%, 03/01/27 |
3,100,000 | 3,285,718 | ||||||
| Uber Technologies |
||||||||
| 4.50%, 08/15/29 (a) |
1,000,000 | 840,625 | ||||||
| 6.25%, 01/15/28 (a) |
500,000 | 465,000 | ||||||
|
|
|
|||||||
| 14,145,787 | ||||||||
|
|
|
|||||||
The accompanying notes are an integral part of the financial statements.
9
| THE ADVISORS’ INNER CIRCLE FUND III | FIRST FOUNDATION | |
| FIXED INCOME FUND | ||
| SEPTEMBER 30, 2022 | ||
| Principal Amount ($) |
Value ($) | |||||||
| Corporate Obligations (continued) |
| |||||||
| INFORMATION TECHNOLOGY — 0.6% |
| |||||||
| Fiserv |
||||||||
| 3.50%, 07/01/29 |
1,000,000 | 870,039 | ||||||
|
|
|
|||||||
| MATERIALS — 2.3% |
| |||||||
| Ball |
||||||||
| 2.88%, 08/15/30 |
2,250,000 | 1,726,751 | ||||||
| 4.88%, 03/15/26 |
1,750,000 | 1,660,243 | ||||||
|
|
|
|||||||
| 3,386,994 | ||||||||
|
|
|
|||||||
| REAL ESTATE — 3.9% |
| |||||||
| Brookfield Property |
||||||||
| 5.75%, 05/15/26 (a) |
250,000 | 226,004 | ||||||
| Federal Realty Investment Trust |
||||||||
| 3.50%, 06/01/30 |
2,500,000 | 2,128,283 | ||||||
| Phillips Edison Grocery Center Operating Partnership I |
||||||||
| 2.63%, 11/15/31 |
1,000,000 | 725,986 | ||||||
| Regency Centers |
||||||||
| 2.95%, 09/15/29 |
750,000 | 622,030 | ||||||
| Retail Opportunity Investments Partnership |
||||||||
| 4.00%, 12/15/24 |
850,000 | 813,196 | ||||||
| Rexford Industrial Realty |
||||||||
| 2.13%, 12/01/30 |
1,500,000 | 1,145,291 | ||||||
|
|
|
|||||||
| 5,660,790 | ||||||||
|
|
|
|||||||
| UTILITIES — 9.2% |
| |||||||
| Duke Energy |
||||||||
| US Treas Yield Curve Rate T Note Const Mat 5 Yr + 3.388%, 4.88% (b)(c) |
1,500,000 | 1,344,364 | ||||||
| Edison International |
||||||||
| 4.13%, 03/15/28 |
2,550,000 | 2,274,971 | ||||||
| US Treas Yield Curve Rate T Note Const Mat 5 Yr + 4.698%, 5.38% (b)(c) |
2,125,000 | 1,747,812 | ||||||
| Pacific Gas and Electric |
||||||||
| 2.50%, 02/01/31 |
4,250,000 | 3,092,521 | ||||||
| 3.50%, 08/01/50 |
3,000,000 | 1,825,683 | ||||||
| 4.95%, 07/01/50 |
1,500,000 | 1,097,890 | ||||||
| PacifiCorp |
||||||||
| 6.25%, 10/15/37 |
42,000 | 42,980 | ||||||
| Southern California Edison |
||||||||
| 3.90%, 12/01/41 |
15,000 | 10,911 | ||||||
| WEC Energy Group, Inc. |
||||||||
| ICE LIBOR USD 3 Month + 2.113%, 5.02%, 05/15/67 (b) |
2,560,000 | 2,124,800 | ||||||
|
|
|
|||||||
| 13,561,932 | ||||||||
|
|
|
|||||||
| Total Corporate Obligations |
||||||||
| (Cost $88,147,726) |
74,501,239 | |||||||
|
|
|
|||||||
The accompanying notes are an integral part of the financial statements.
10
| THE ADVISORS’ INNER CIRCLE FUND III | FIRST FOUNDATION | |
| FIXED INCOME FUND | ||
| SEPTEMBER 30, 2022 | ||
| Principal Amount ($) |
Value ($) | |||||||
| Mortgage-Backed Securities — 18.0% |
| |||||||
| AGENCY MORTGAGE-BACKED SECURITIES — 17.0% |
| |||||||
| FHLMC |
||||||||
| 4.00%, 05/01/44 |
402,290 | 381,125 | ||||||
| 5.00%, 06/01/41 |
74,251 | 74,680 | ||||||
| FHLMC Multifamily Structured Pass-Through Certificates, Series K735, Class AM |
||||||||
| 2.46%, 05/25/26 |
2,000,000 | 1,841,575 | ||||||
| FNMA, Series 2010-16, Class PA |
||||||||
| 4.50%, 02/25/40 |
26,304 | 25,777 | ||||||
| FNMA, Series 2019-M12, Class A2 |
||||||||
| 2.89%, 06/25/29 (b) |
1,500,000 | 1,357,591 | ||||||
| FNMA |
||||||||
| 3.00%, 02/01/43 to 06/01/43 (e) |
1,666,540 | 1,492,450 | ||||||
| 3.50%, 11/01/42 to 02/01/43 (e) |
716,360 | 661,428 | ||||||
| 4.00%, 01/01/41 to 03/01/44 (e) |
529,319 | 502,995 | ||||||
| 4.50%, 10/01/39 to 04/01/41 (e) |
683,810 | 668,918 | ||||||
| 5.00%, 06/01/41 |
88,608 | 89,018 | ||||||
| FNMA, Series 2016-104, Class QA |
||||||||
| 3.00%, 11/25/43 |
163,295 | 159,248 | ||||||
| FRESB Mortgage Trust, Series 2018-SB52, Class A10F |
||||||||
| 3.48%, 06/25/28 (b) |
2,104,164 | 1,992,120 | ||||||
| FRESB Mortgage Trust, Series 2019-SB63, Class A10H |
||||||||
| 2.89%, 03/25/39 (b) |
581,386 | 531,474 | ||||||
| FRESB Mortgage Trust, Series 2019-SB60, Class A10F |
||||||||
| 3.31%, 01/25/29 (b) |
757,696 | 708,960 | ||||||
| FRESB Mortgage Trust, Series 2018-SB53, Class A10F |
||||||||
| 3.66%, 06/25/28 (b) |
1,556,814 | 1,484,386 | ||||||
| FRESB Mortgage Trust, Series 2019-SB62, Class A10F |
||||||||
| 3.07%, 03/25/29 (b) |
1,562,043 | 1,438,135 | ||||||
| FRESB Mortgage Trust, Series 2017-SB42, Class A10F |
||||||||
| 2.96%, 10/25/27 (b) |
986,375 | 909,845 | ||||||
| GNMA, Series 2012-83, Class AK |
||||||||
| 3.20%, 12/16/53 (b) |
587,282 | 533,203 | ||||||
| GNMA, Series 2018-129, Class AG |
||||||||
| 3.10%, 05/16/59 |
127,466 | 125,946 | ||||||
| GNMA, Series 2018-3, Class AG |
||||||||
| 2.50%, 10/16/58 |
223,360 | 198,471 | ||||||
| GNMA, Series 2017-24, Class A |
||||||||
| 2.25%, 09/16/44 |
145,886 | 140,548 | ||||||
| GNMA, Series 2018-156, Class AD |
||||||||
| 3.25%, 08/16/59 (b) |
350,077 | 328,159 | ||||||
| GNMA, Series 2018-68, Class B |
||||||||
| 3.00%, 02/16/59 (b) |
1,000,000 | 864,785 | ||||||
| GNMA, Series 2020-8, Class AH |
||||||||
| 2.55%, 01/16/62 |
1,316,938 | 1,147,975 | ||||||
The accompanying notes are an integral part of the financial statements.
11
| THE ADVISORS’ INNER CIRCLE FUND III | FIRST FOUNDATION | |
| FIXED INCOME FUND | ||
| SEPTEMBER 30, 2022 | ||
| Principal Amount ($) |
Value ($) | |||||||
| Mortgage-Backed Securities (continued) |
| |||||||
| AGENCY MORTGAGE-BACKED SECURITIES (continued) |
| |||||||
| GNMA, Series 2017-46, Class A |
||||||||
| 2.50%, 11/16/57 |
373,470 | 324,580 | ||||||
| GNMA, Series 2017-106, Class AC |
||||||||
| 2.60%, 04/16/51 |
286,676 | 263,637 | ||||||
| GNMA |
||||||||
| 3.50%, 05/20/43 |
467,866 | 435,453 | ||||||
| 4.00%, 01/20/41 to 04/20/43 (e) |
446,281 | 424,863 | ||||||
| GNMA, Series 2019-2, Class AE |
||||||||
| 3.25%, 03/16/59 |
843,684 | 795,236 | ||||||
| GNMA, Series 2019-55, Class AH |
||||||||
| 3.15%, 03/16/61 (b) |
778,691 | 694,934 | ||||||
| GNMA, Series 2017-70, Class AE |
||||||||
| 2.60%, 10/16/58 |
813,127 | 716,459 | ||||||
| GNMA, Series 2017-69, Class AS |
||||||||
| 2.75%, 02/16/58 |
724,715 | 670,185 | ||||||
| GNMA, Series 2020-3, Class AH |
||||||||
| 2.50%, 02/16/62 |
1,010,392 | 879,894 | ||||||
| GNMA, Series 2012-100, Class BA |
||||||||
| 2.60%, 08/16/52 (b) |
2,500,000 | 2,135,403 | ||||||
|
|
|
|||||||
| 24,999,456 | ||||||||
|
|
|
|||||||
| NON-AGENCY MORTGAGE-BACKED SECURITIES — 1.0% |
| |||||||
| Commercial Mortgage Trust, Series 2013-LC13, Class AM |
||||||||
| 4.56%, 08/10/46 (a)(b) |
100,000 | 98,649 | ||||||
| Commercial Mortgage Trust, Series 2014-CR14, Class AM |
||||||||
| 4.53%, 02/10/47 (b) |
120,000 | 117,783 | ||||||
| GS Mortgage Securities Trust, Series 2014-GC20, Class AS |
||||||||
| 4.26%, 04/10/47 |
105,000 | 102,165 | ||||||
| JPMBB Commercial Mortgage Securities Trust, Series 2013-C17, Class C |
||||||||
| 5.05%, 01/15/47 (b) |
153,000 | 146,960 | ||||||
| JPMBB Commercial Mortgage Securities Trust, Series 2014-C18, Class C |
||||||||
| 4.95%, 02/15/47 (b) |
100,000 | 91,892 | ||||||
| Morgan Stanley Bank of America Merrill Lynch Trust, Series 2013-C10, Class AS |
||||||||
| 4.21%, 07/15/46 (b) |
210,000 | 206,699 | ||||||
| Morgan Stanley Bank of America Merrill Lynch Trust, Series 2013-C10, Class C |
||||||||
| 4.21%, 07/15/46 (b) |
191,000 | 172,277 | ||||||
|
WFRBS Commercial Mortgage Trust, Series 2014-LC14, Class AS |
||||||||
| 4.35%, 03/15/47 (b) |
263,000 | 256,799 | ||||||
The accompanying notes are an integral part of the financial statements.
12
| THE ADVISORS’ INNER CIRCLE FUND III | FIRST FOUNDATION | |
| FIXED INCOME FUND | ||
| SEPTEMBER 30, 2022 | ||
| Principal Amount ($)/Shares |
Value ($) | |||||||
| Mortgage-Backed Securities (continued) |
| |||||||
| NON-AGENCY MORTGAGE-BACKED SECURITIES (continued) |
| |||||||
| WFRBS Commercial Mortgage Trust, Series 2013-C17, Class AS |
||||||||
| 4.26%, 12/15/46 |
115,000 | 112,704 | ||||||
| WFRBS Commercial Mortgage Trust, Series 2014-C19, Class B |
||||||||
| 4.72%, 03/15/47 (b) |
140,000 | 135,044 | ||||||
|
|
|
|||||||
| 1,440,972 | ||||||||
|
|
|
|||||||
| Total Mortgage-Backed Securities |
||||||||
| (Cost $29,024,322) |
26,440,428 | |||||||
|
|
|
|||||||
| U.S. Treasury Obligations — 11.2% |
| |||||||
| U.S. Treasury Bill |
||||||||
| 2.46%, 10/11/2022 (f) |
3,000,000 | 2,998,367 | ||||||
| U.S. Treasury Bonds |
||||||||
| 1.13%, 5/15/2040 to 8/15/2040 (e) |
5,500,000 | 3,420,566 | ||||||
| 1.25%, 5/15/2050 |
500,000 | 279,844 | ||||||
| 2.25%, 8/15/2046 |
1,000,000 | 720,078 | ||||||
| U.S. Treasury Notes |
||||||||
| 0.38%, 7/31/2027 |
800,000 | 671,656 | ||||||
| 0.63%, 10/15/2024 to 8/15/2030 (e) |
6,000,000 | 5,040,400 | ||||||
| 1.25%, 11/30/2026 |
2,000,000 | 1,779,766 | ||||||
| 1.38%, 11/15/2031 |
2,000,000 | 1,625,000 | ||||||
|
|
|
|||||||
| Total U.S. Treasury Obligations |
||||||||
| (Cost $19,547,827) |
16,535,677 | |||||||
|
|
|
|||||||
| Preferred Stock — 10.3% |
| |||||||
| COMMUNICATION SERVICES — 2.6% |
| |||||||
| Qwest Corp. 6.50%, 09/01/2056 |
55,790 | 1,264,201 | ||||||
| Qwest Corp. 6.75%, 06/15/2057 |
45,187 | 1,039,301 | ||||||
| Telephone and Data Systems 6.00% (c) |
80,000 | 1,488,000 | ||||||
|
|
|
|||||||
| 3,791,502 | ||||||||
|
|
|
|||||||
| ENERGY — 1.5% |
| |||||||
| Enbridge 6.38%, 04/15/2078 (b) |
10,022 | 237,221 | ||||||
| Energy Transfer 7.63% (b)(c) |
53,750 | 1,229,262 | ||||||
| Energy Transfer 7.38% (b)(c) |
32,862 | 718,035 | ||||||
| Energy Transfer 7.60% (b)(c) |
1,394 | 33,721 | ||||||
|
|
|
|||||||
| 2,218,239 | ||||||||
|
|
|
|||||||
The accompanying notes are an integral part of the financial statements.
13
| THE ADVISORS’ INNER CIRCLE FUND III | FIRST FOUNDATION | |
| FIXED INCOME FUND | ||
| SEPTEMBER 30, 2022 | ||
| Shares/ Principal Amount ($) |
Value ($) | |||||||
| Preferred Stock (continued) |
| |||||||
| FINANCIALS — 3.7% |
| |||||||
| Arbor Realty Trust, REIT 6.38% (c) |
34,000 | 660,960 | ||||||
| Athene Holding 6.38% (b)(c) |
5,929 | 149,529 | ||||||
| B Riley Financial 5.00%, 12/31/2026 |
80,000 | 1,796,800 | ||||||
| B. Riley Financial 6.00%, 01/31/2028 |
40,000 | 908,400 | ||||||
| B. Riley Financial 6.75%, 05/31/2024 |
8,892 | 219,633 | ||||||
| Ellington Financial, REIT 6.25% (b)(c) |
80,000 | 1,337,600 | ||||||
| RiverNorth DoubleLine Strategic Opportunity Fund I 4.38% (c) |
21,000 | 388,920 | ||||||
|
|
|
|||||||
| 5,461,842 | ||||||||
|
|
|
|||||||
| REAL ESTATE — 1.5% |
| |||||||
| Brookfield Property Partners 6.50% (c) |
20,600 | 390,782 | ||||||
| CTO Realty Growth, REIT 6.38% (c) |
80,000 | 1,756,800 | ||||||
|
|
|
|||||||
| 2,147,582 | ||||||||
|
|
|
|||||||
| UTILITIES — 1.0% |
| |||||||
| SCE Trust III 5.75% (b)(c) |
61,167 | 1,260,652 | ||||||
| SCE Trust VI 5.00% (c) |
12,348 | 228,932 | ||||||
|
|
|
|||||||
| 1,489,584 | ||||||||
|
|
|
|||||||
| Total Preferred Stock |
||||||||
| (Cost $17,366,002) |
15,108,749 | |||||||
|
|
|
|||||||
| Municipal Bonds — 3.8% |
| |||||||
| CALIFORNIA — 0.3% |
| |||||||
| San Francisco City & County Redevelopment Financing Authority TA |
||||||||
| 8.26%, 08/01/29 |
300,000 | 343,275 | ||||||
|
|
|
|||||||
| KENTUCKY — 0.5% |
| |||||||
| Clark County School District Finance Corp RB |
||||||||
| Insured: ST INTERCEPT |
||||||||
| 5.20%, 06/01/26 |
750,000 | 764,891 | ||||||
|
|
|
|||||||
| MARYLAND — 0.3% |
| |||||||
| Maryland Economic Development RB |
||||||||
| 3.70%, 06/01/25 |
500,000 | 478,535 | ||||||
|
|
|
|||||||
| MICHIGAN — 0.9% |
| |||||||
| Belding Area Schools GO |
||||||||
| Insured: Q-SBLF |
||||||||
| 6.50%, 05/01/25 |
750,000 | 751,134 | ||||||
| Comstock Park Public Schools GO |
||||||||
| Insured: Q-SBLF |
||||||||
| 6.30%, 05/01/26 |
635,000 | 635,686 | ||||||
|
|
|
|||||||
| 1,386,820 | ||||||||
|
|
|
|||||||
The accompanying notes are an integral part of the financial statements.
14
| THE ADVISORS’ INNER CIRCLE FUND III | FIRST FOUNDATION | |
| FIXED INCOME FUND | ||
| SEPTEMBER 30, 2022 | ||
| Principal Amount ($)/Shares |
Value ($) | |||||||
| Municipal Bonds (continued) |
| |||||||
| NEW YORK — 0.7% |
| |||||||
| New York & New Jersey Port Authority RB |
||||||||
| 4.46%, 10/01/62 |
320,000 | 279,583 | ||||||
| New York State Dormitory Authority RB |
||||||||
| 5.00%, 01/01/24 (g) |
720,000 | 725,877 | ||||||
|
|
|
|||||||
| 1,005,460 | ||||||||
|
|
|
|||||||
| NORTH DAKOTA — 0.6% |
| |||||||
| Kindred Public School District No. 2 GO |
||||||||
| 6.00%, 08/01/27 |
750,000 | 789,444 | ||||||
|
|
|
|||||||
| WASHINGTON — 0.5% |
| |||||||
| Washington Higher Education Facilities Authority RB |
||||||||
| 4.27%, 10/01/22 |
750,000 | 750,000 | ||||||
|
|
|
|||||||
| Total Municipal Bonds |
||||||||
| (Cost $5,579,949) |
5,518,425 | |||||||
|
|
|
|||||||
| Registered Investment Companies — 3.3% |
| |||||||
| Ares Dynamic Credit Allocation Fund |
7,808 | 91,744 | ||||||
| DoubleLine Income Solutions Fund |
99,865 | 1,078,542 | ||||||
| DoubleLine Opportunistic Credit Fund |
6,295 | 90,963 | ||||||
| PGIM High Yield Bond Fund |
25,596 | 295,378 | ||||||
| PIMCO Dynamic Income Fund |
34,714 | 672,766 | ||||||
| PIMCO Dynamic Income Opportunities Fund |
134,944 | 1,779,911 | ||||||
| RiverNorth DoubleLine Strategic Opportunity Fund |
97,148 | 893,762 | ||||||
|
|
|
|||||||
| Total Registered Investment Companies |
4,903,066 | |||||||
|
|
|
|||||||
| Asset-Backed Securities — 1.6% |
| |||||||
| SBA Small Business Investment Company, Series 2018-10B, Class 1 |
||||||||
| 3.55%, 9/10/2028 |
985,280 | 926,424 | ||||||
| SBA Small Business Investment Company, Series 2018-10A, Class 1 |
||||||||
| 3.19%, 3/10/2028 |
671,377 | 633,397 | ||||||
| Small Business Administration, Series 2018-20H, Class 1 |
||||||||
| 3.58%, 8/1/2038 |
895,531 | 847,747 | ||||||
|
|
|
|||||||
| Total Asset-Backed Securities |
2,407,568 | |||||||
|
|
|
|||||||
The accompanying notes are an integral part of the financial statements.
15
| THE ADVISORS’ INNER CIRCLE FUND III | FIRST FOUNDATION | |
| FIXED INCOME FUND | ||
| SEPTEMBER 30, 2022 | ||
| Principal Amount ($)/Shares |
Value ($) | |||||||
| U.S. Government Agency Obligation — 0.5% |
| |||||||
| FHLMC MTN |
||||||||
| 2.00%, 10/29/2040 |
1,000,000 | 663,116 | ||||||
|
|
|
|||||||
| Total U.S. Government Agency Obligations |
663,116 | |||||||
|
|
|
|||||||
| Common Stock — 0.4% |
| |||||||
| ENERGY — 0.1% |
| |||||||
| Unit Corp (h) |
2,231 | 118,846 | ||||||
|
|
|
|||||||
| REAL ESTATE — 0.3% |
| |||||||
| Creative Media & Community Trust, REIT |
69,150 | 441,868 | ||||||
| Orion Office Inc, REIT |
726 | 6,356 | ||||||
|
|
|
|||||||
| 448,224 | ||||||||
|
|
|
|||||||
| Total Common Stock |
567,070 | |||||||
|
|
|
|||||||
| Total Investments - 99.7% |
146,645,338 | |||||||
|
|
|
|||||||
| (Cost $170,667,545) |
||||||||
| Other Assets & Liabilities, Net - 0.3% |
499,759 | |||||||
|
|
|
|||||||
| Net Assets - 100.0% |
147,145,097 | |||||||
|
|
|
|||||||
| (a) | Securities exempt from registration under Rule 144A of the 1933 Act. These securities may only be resold in transactions exempt from registration to qualified institutional buyers. The Board has determined these investments to be liquid. At September 30, 2022, these securities amounted to $6,911,406 or 4.7% of Net Assets of the Fund. |
| (b) | Variable or floating rate security. The rate shown is the effective interest rate as of period end. The rates on certain securities are not based on published reference rates and spreads and are either determined by the issuer or agent based on current market conditions; by using a formula based on the rates of underlying loans; or by adjusting periodically based on prevailing interest rates. |
| (c) | Perpetual security with no stated maturity date. |
| (d) | The issuer is, or is in danger of being, in default of its payment obligation. |
| (e) | Securities are grouped by coupon and represent a range of maturities. |
| (f) | Interest rate represents the security’s effective yield at the time of purchase. |
| (g) | Escrowed to Maturity |
| (h) | Non-income producing security. |
The accompanying notes are an integral part of the financial statements.
16
| THE ADVISORS’ INNER CIRCLE FUND III | FIRST FOUNDATION | |
| FIXED INCOME FUND | ||
| SEPTEMBER 30, 2022 | ||
FHLMC — Federal Home Loan Mortgage Corporation
FNMA — Federal National Mortgage Association
FRESB — Freddie Mac Small Balance Mortgage Trust
GNMA — Government National Mortgage Association
GO — General Obligation
ICE — Intercontinental Exchange
LIBOR — London Interbank Offered Rate
MTN — Medium Term Note
REIT — Real Estate Investment Trust
RB — Revenue Bond
TA — Tax Allocation
USD — U.S. Dollar
The following is a summary of the inputs used as of September 30, 2022 in valuing the Fund’s investments carried at value:
| Investments in Securities | Level 1 | Level 2 | Level 3 | Total | ||||||||||||
| Corporate Obligations |
$ | — | $ | 74,501,239 | $ | — | $ | 74,501,239 | ||||||||
| Mortgage-Backed Securities |
— | 26,440,428 | — | 26,440,428 | ||||||||||||
| U.S. Treasury Obligations |
13,537,310 | 2,998,367 | — | 16,535,677 | ||||||||||||
| Preferred Stock |
15,108,749 | — | — | 15,108,749 | ||||||||||||
| Municipal Bonds |
— | 5,518,425 | — | 5,518,425 | ||||||||||||
| Registered Investment Companies |
4,903,066 | — | — | 4,903,066 | ||||||||||||
| Asset-Backed Securities |
— | 2,407,568 | — | 2,407,568 | ||||||||||||
| U.S. Government Agency Obligation |
— | 663,116 | — | 663,116 | ||||||||||||
| Common Stock |
567,070 | — | — | 567,070 | ||||||||||||
|
|
|
|
|
|
|
|
|
|||||||||
| Total Investments in Securities |
$ | 34,116,195 | $ | 112,529,143 | $ | — | $ | 146,645,338 | ||||||||
|
|
|
|
|
|
|
|
|
|||||||||
Amounts designated as “—” are $0 or have been rounded to $0.
For more information on valuation inputs, see Note 2 – Significant Accounting Policies in the Notes to Financial Statements.
The accompanying notes are an integral part of the financial statements.
17
| THE ADVISORS’ INNER CIRCLE FUND III | FIRST FOUNDATION | |
| TOTAL RETURN FUND | ||
| SEPTEMBER 30, 2022 |
| SECTOR WEIGHTINGS (Unaudited)† |
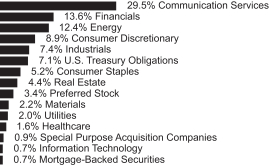
†Percentages are based on total investments.
| Shares | Value ($) | |||||||
| Common Stock — 43.5% |
| |||||||
| COMMUNICATION SERVICES — 13.3% |
| |||||||
| Activision Blizzard |
29,750 | 2,211,615 | ||||||
| Alphabet, Inc., Class A (a) |
11,620 | 1,111,453 | ||||||
| Alphabet, Inc., Class C (a) |
3,860 | 371,139 | ||||||
| Liberty Media Corp.-Liberty Formula One, Class A (a) |
73,750 | 3,873,350 | ||||||
| Madison Square Garden Entertainment (a) |
77,882 | 3,433,817 | ||||||
| Walt Disney Co. (a) |
14,250 | 1,344,203 | ||||||
|
|
|
|||||||
| 12,345,577 | ||||||||
|
|
|
|||||||
| CONSUMER DISCRETIONARY — 5.2% |
| |||||||
| Amazon.com, Inc. (a) |
8,450 | 954,850 | ||||||
| Domino’s Pizza |
1,375 | 426,525 | ||||||
| MGM Resorts International |
51,500 | 1,530,580 | ||||||
| Tandy Leather Factory (a) |
524,514 | 1,914,476 | ||||||
|
|
|
|||||||
| 4,826,431 | ||||||||
|
|
|
|||||||
| CONSUMER STAPLES — 2.9% |
| |||||||
| Altria Group |
24,400 | 985,272 | ||||||
| Philip Morris International, Inc. |
20,900 | 1,734,909 | ||||||
|
|
|
|||||||
| 2,720,181 | ||||||||
|
|
|
|||||||
| ENERGY — 9.2% |
| |||||||
| Texas Pacific Land |
4,370 | 7,766,495 | ||||||
| Unit Corp (a) |
14,335 | 763,626 | ||||||
| Windrock |
23 | 12,880 | ||||||
|
|
|
|||||||
| 8,543,001 | ||||||||
|
|
|
|||||||
The accompanying notes are an integral part of the financial statements.
18
| THE ADVISORS’ INNER CIRCLE FUND III | FIRST FOUNDATION | |
| TOTAL RETURN FUND | ||
| SEPTEMBER 30, 2022 |
| Shares | Value ($) | |||||||
| Common Stock (continued) |
| |||||||
| FINANCIALS — 5.1% |
| |||||||
| Aon, Class A |
3,015 | 807,628 | ||||||
| Berkshire Hathaway, Inc., Class B (a) |
5,055 | 1,349,786 | ||||||
| JPMorgan Chase |
20,025 | 2,092,613 | ||||||
| PNC Financial Services Group |
3,000 | 448,260 | ||||||
|
|
|
|||||||
| 4,698,287 | ||||||||
|
|
|
|||||||
| HEALTHCARE — 1.5% |
| |||||||
| Edwards Lifesciences Corp. (a) |
6,000 | 495,780 | ||||||
| HCA Healthcare, Inc. |
2,775 | 510,017 | ||||||
| Laboratory Corp of America Holdings |
2,000 | 409,620 | ||||||
|
|
|
|||||||
| 1,415,417 | ||||||||
|
|
|
|||||||
| INDUSTRIALS — 0.5% |
| |||||||
| Honeywell International |
2,790 | 465,846 | ||||||
|
|
|
|||||||
| INFORMATION TECHNOLOGY — 0.5% |
| |||||||
| Broadcom, Inc. |
970 | 430,690 | ||||||
|
|
|
|||||||
| MATERIALS — 1.8% |
| |||||||
| Compass Minerals International, Inc. |
18,206 | 701,477 | ||||||
| Keweenaw Land Association Ltd. |
52,595 | 928,302 | ||||||
|
|
|
|||||||
| 1,629,779 | ||||||||
|
|
|
|||||||
| REAL ESTATE — 3.5% |
| |||||||
| Creative Media & Community Trust, REIT |
234,895 | 1,500,979 | ||||||
| CTO Realty Growth, REIT |
74,634 | 1,398,641 | ||||||
| Equity LifeStyle Properties, REIT |
4,755 | 298,804 | ||||||
|
|
|
|||||||
| 3,198,424 | ||||||||
|
|
|
|||||||
| Total Common Stock (Cost $39,681,526) |
40,273,633 | |||||||
|
|
|
|||||||
| Foreign Common Stock — 32.2% |
| |||||||
| CANADA — 6.4% |
| |||||||
| Brookfield Asset Management, Inc., Class A |
53,368 | 2,182,218 | ||||||
| Canadian Pacific Railway |
21,300 | 1,421,136 | ||||||
| GreenFirst Forest Products (a) |
336,500 | 391,834 | ||||||
| PrairieSky Royalty Ltd. |
152,235 | 1,973,222 | ||||||
|
|
|
|||||||
| 5,968,410 | ||||||||
|
|
|
|||||||
| FRANCE — 18.5% |
| |||||||
| Bollore SA |
1,239,539 | 5,734,008 | ||||||
| Cie de L’Odet |
3,617 | 4,082,001 | ||||||
| Cie du Cambodge |
1 | 5,388 | ||||||
The accompanying notes are an integral part of the financial statements.
19
| THE ADVISORS’ INNER CIRCLE FUND III | FIRST FOUNDATION | |
| TOTAL RETURN FUND | ||
| SEPTEMBER 30, 2022 |
| Shares/ Principal Amount ($) |
Value ($) | |||||||
| Foreign Common Stock (continued) |
| |||||||
| FRANCE (continued) |
| |||||||
| Financiere Moncey |
1 | 5,290 | ||||||
| Lagardere |
126,239 | 1,874,842 | ||||||
| LVMH Moet Hennessy Louis Vuitton ADR |
7,150 | 840,125 | ||||||
| Societe Industrielle et Financiere de l’Artois |
1 | 4,291 | ||||||
| Vivendi SA |
553,390 | 4,321,860 | ||||||
| Vivendi SA ADR |
35,800 | 275,302 | ||||||
|
|
|
|||||||
| 17,143,107 | ||||||||
|
|
|
|||||||
| JAPAN — 1.0% |
| |||||||
| Nintendo Co, Ltd. |
16,000 | 647,097 | ||||||
| Nintendo Co, Ltd. ADR |
5,250 | 267,592 | ||||||
|
|
|
|||||||
| 914,689 | ||||||||
|
|
|
|||||||
| MEXICO — 2.2% |
| |||||||
| Becle |
1,152,214 | 2,035,965 | ||||||
|
|
|
|||||||
| NETHERLANDS — 4.1% |
| |||||||
| EXOR |
62,850 | 3,823,569 | ||||||
|
|
|
|||||||
| Total Foreign Common Stock |
29,885,740 | |||||||
|
|
|
|||||||
| Corporate Obligations — 11.1% |
| |||||||
| COMMUNICATION SERVICES — 1.6% |
||||||||
| iHeartCommunications, Inc. |
||||||||
| 6.38%, 05/01/26 |
545 | 506 | ||||||
| 8.38%, 05/01/27 |
132 | 111 | ||||||
| Lumen Technologies |
||||||||
| 7.50%, 04/01/24 |
722,000 | 743,660 | ||||||
| Sky |
||||||||
| 3.13%, 11/26/22 (b) |
770,000 | 768,736 | ||||||
|
|
|
|||||||
| 1,513,013 | ||||||||
|
|
|
|||||||
| CONSUMER DISCRETIONARY — 2.7% |
||||||||
| 7-Eleven |
||||||||
| 0.63%, 02/10/23 (b) |
795,000 | 783,588 | ||||||
| eBay |
||||||||
| 2.75%, 01/30/23 |
1,042,000 | 1,035,673 | ||||||
| Hyundai Capital America |
||||||||
| 1.15%, 11/10/22 (b) |
270,000 | 269,017 | ||||||
| 5.75%, 04/06/23 (b) |
215,000 | 215,632 | ||||||
The accompanying notes are an integral part of the financial statements.
20
| THE ADVISORS’ INNER CIRCLE FUND III | FIRST FOUNDATION | |
| TOTAL RETURN FUND | ||
| SEPTEMBER 30, 2022 |
| Principal Amount ($) |
Value ($) | |||||||
| Corporate Obligations (continued) |
| |||||||
| CONSUMER DISCRETIONARY (continued) |
| |||||||
| Toll Brothers Finance |
||||||||
| 4.38%, 04/15/23 |
182,000 | 181,035 | ||||||
|
|
|
|||||||
| 2,484,945 | ||||||||
|
|
|
|||||||
| ENERGY — 0.9% |
| |||||||
| Kinder Morgan, Inc. |
||||||||
| 5.63%, 11/15/23 (b) |
42,000 | 42,015 | ||||||
| Schlumberger Finance Canada |
||||||||
| 2.65%, 11/20/22 (b) |
70,000 | 69,953 | ||||||
| Southern Natural Gas |
||||||||
| 0.63%, 04/28/23 (b) |
59,000 | 57,382 | ||||||
| Texas Eastern Transmission |
||||||||
| 2.80%, 10/15/22 (b) |
575,000 | 574,668 | ||||||
| Williams |
||||||||
| 3.70%, 01/15/23 |
59,000 | 58,957 | ||||||
|
|
|
|||||||
| 802,975 | ||||||||
|
|
|
|||||||
| FINANCIALS — 1.9% |
| |||||||
| Bank of America |
||||||||
| ICE LIBOR USD 3 Month + 4.174%, 6.50% (c)(d) |
340,000 | 333,609 | ||||||
| Charles Schwab |
||||||||
| 2.65%, 01/25/23 |
201,000 | 200,242 | ||||||
| ICE LIBOR USD 3 Month + 4.820%, 7.60% (c)(d) |
100,000 | 100,083 | ||||||
| JPMorgan Chase & Co |
||||||||
| ICE LIBOR USD 3 Month + 3.470%, 6.28% (c)(d) |
181,000 | 180,998 | ||||||
| MUFG Union Bank |
||||||||
| 2.10%, 12/09/22 |
260,000 | 258,738 | ||||||
| Prudential Financial, Inc. |
||||||||
| ICE LIBOR USD 3 Month + 3.920%, |
500,000 | 492,630 | ||||||
| Swiss Re Treasury US |
||||||||
| 2.88%, 12/06/22 (b) |
200,000 | 199,632 | ||||||
|
|
|
|||||||
| 1,765,932 | ||||||||
|
|
|
|||||||
| HEALTHCARE — 0.0% |
| |||||||
| Allergan, Inc. |
||||||||
| 2.80%, 03/15/23 |
61,000 | 60,259 | ||||||
|
|
|
|||||||
| INDUSTRIALS — 0.9% |
| |||||||
| Air Lease |
||||||||
| 2.25%, 01/15/23 |
861,000 | 853,746 | ||||||
|
|
|
|||||||
| INFORMATION TECHNOLOGY — 0.2% |
| |||||||
| Hewlett Packard Enterprise |
||||||||
| 2.25%, 04/01/23 |
202,000 | 199,679 | ||||||
|
|
|
|||||||
The accompanying notes are an integral part of the financial statements.
21
| THE ADVISORS’ INNER CIRCLE FUND III | FIRST FOUNDATION | |
| TOTAL RETURN FUND | ||
| SEPTEMBER 30, 2022 |
| Principal ($)/Shares |
Value ($) | |||||||
| Corporate Obligations (continued) |
| |||||||
| REAL ESTATE — 0.9% |
| |||||||
| American Tower |
||||||||
| 3.00%, 06/15/23 |
26,000 | 25,665 | ||||||
| 3.50%, 01/31/23 |
782,000 | 779,552 | ||||||
|
|
|
|||||||
| 805,217 | ||||||||
|
|
|
|||||||
| UTILITIES — 2.0% |
| |||||||
| Dominion Energy |
||||||||
| 2.45%, 01/15/23 (b) |
300,000 | 298,315 | ||||||
| Duke Energy Carolinas |
||||||||
| 2.50%, 03/15/23 |
480,000 | 476,201 | ||||||
| Edison International |
||||||||
| 3.13%, 11/15/22 |
226,000 | 225,604 | ||||||
| Public Service Enterprise Group |
||||||||
| 2.65%, 11/15/22 |
425,000 | 424,334 | ||||||
| Virginia Electric and Power |
||||||||
| 2.75%, 03/15/23 |
200,000 | 198,008 | ||||||
| WEC Energy Group, Inc. |
||||||||
| ICE LIBOR USD 3 Month + 2.113%, |
250,000 | 207,500 | ||||||
|
|
|
|||||||
| 1,829,962 | ||||||||
|
|
|
|||||||
| Total Corporate Obligations |
||||||||
| (Cost $10,447,552) |
10,315,728 | |||||||
|
|
|
|||||||
| U.S. Treasury Obligations — 7.0% |
| |||||||
| U.S. Treasury Bills |
||||||||
| 2.98%, 12/8/2022 (e) |
1,000,000 | 994,589 | ||||||
| 3.33%, 3/2/2023 (e) |
1,000,000 | 984,632 | ||||||
| U.S. Treasury Notes |
||||||||
| 0.25%, 4/15/2023 |
2,000,000 | 1,961,172 | ||||||
| 0.38%, 4/15/2024 |
2,000,000 | 1,883,047 | ||||||
| 1.88%, 2/15/2032 |
825,000 | 699,058 | ||||||
|
|
|
|||||||
| Total U.S. Treasury Obligations |
6,522,498 | |||||||
|
|
|
|||||||
| Preferred Stock — 3.3% |
| |||||||
| COMMUNICATION SERVICES — 0.7% |
| |||||||
| Liberty Broadband 7.00% (d) |
4,499 | 112,126 | ||||||
| Telephone and Data Systems 6.00% (d) |
27,000 | 502,200 | ||||||
|
|
|
|||||||
| 614,326 | ||||||||
|
|
|
|||||||
The accompanying notes are an integral part of the financial statements.
22
| THE ADVISORS’ INNER CIRCLE FUND III | FIRST FOUNDATION | |
| TOTAL RETURN FUND | ||
| SEPTEMBER 30, 2022 |
| Shares/ Principal Amount ($) |
Value ($) | |||||||
| Preferred Stock (continued) |
| |||||||
| ENERGY — 0.2% |
| |||||||
| Energy Transfer 7.38% (c)(d) |
9,850 | 215,223 | ||||||
|
|
|
|||||||
| FINANCIALS — 0.9% |
| |||||||
| Bank of America 7.25% (a)(d) |
635 | 744,855 | ||||||
| RiverNorth DoubleLine Strategic Opportunity Fund I 4.38% (d) |
4,000 | 74,080 | ||||||
| Wells Fargo 5.85% (c)(d) |
3,200 | 71,840 | ||||||
|
|
|
|||||||
| 890,775 | ||||||||
|
|
|
|||||||
| REAL ESTATE — 1.5% |
| |||||||
| CTO Realty Growth, REIT 6.38% (d) |
56,847 | 1,248,360 | ||||||
| Equity Commonwealth, REIT 6.50% (a)(d) |
4,000 | 104,680 | ||||||
| Rexford Industrial Realty, REIT 5.88% (d) |
900 | 20,916 | ||||||
|
|
|
|||||||
| 1,373,956 | ||||||||
|
|
|
|||||||
| Total Preferred Stock |
3,094,280 | |||||||
|
|
|
|||||||
| Special Purpose Acquisition Companies — 0.9% |
| |||||||
| Liberty Media Acquisition, Class A (a) |
80,200 | 797,188 | ||||||
| Pershing Square Tontine (a) |
42,443 | — | ||||||
|
|
|
|||||||
| 797,188 | ||||||||
|
|
|
|||||||
| Total Special Purpose Acquisition Companies |
797,188 | |||||||
|
|
|
|||||||
| Mortgage-Backed Securities — 0.7% |
| |||||||
| AGENCY MORTGAGE-BACKED SECURITIES — 0.6% |
| |||||||
| FHLMC |
23,480 | 23,615 | ||||||
| FNMA |
215,696 | 193,168 | ||||||
| 3.50%, 11/01/42 to 02/01/43 (f) |
96,842 | 89,390 | ||||||
| 4.00%, 02/01/44 |
25,276 | 24,013 | ||||||
| 4.50%, 02/01/40 to 01/01/41 (f) |
48,607 | 47,644 | ||||||
| 5.00%, 06/01/41 |
28,020 | 28,150 | ||||||
| FNMA, Series 2012-93, Class SW |
16,702 | 1,815 | ||||||
| FNMA, Series 2004-354, Class 1 |
1,683 | 1,475 | ||||||
| GNMA |
||||||||
| 3.00%, 04/20/43 to 06/20/43 (f) |
40,401 | 36,319 | ||||||
| 3.50%, 05/20/43 |
41,682 | 38,795 | ||||||
The accompanying notes are an integral part of the financial statements.
23
| THE ADVISORS’ INNER CIRCLE FUND III | FIRST FOUNDATION | |
| TOTAL RETURN FUND | ||
| SEPTEMBER 30, 2022 |
| Principal Amount ($) |
Value ($) | |||||||
| Mortgage-Backed Securities (continued) |
| |||||||
| AGENCY MORTGAGE-BACKED SECURITIES (continued) |
| |||||||
| 4.00%, 01/20/41 to 04/20/43 (f) |
46,338 | 44,177 | ||||||
| 4.50%, 05/20/40 to 03/20/41 (f) |
16,118 | 15,927 | ||||||
|
|
|
|||||||
| 544,488 | ||||||||
|
|
|
|||||||
| NON-AGENCY MORTGAGE-BACKED SECURITIES — 0.1% |
| |||||||
| JPMBB Commercial Mortgage Securities Trust, Series 2013-C17,
Class C |
60,000 | 57,631 | ||||||
| WFRBS Commercial Mortgage Trust, Series 2014-LC14, Class AS |
40,000 | 39,057 | ||||||
|
|
|
|||||||
| 96,688 | ||||||||
|
|
|
|||||||
| Total Mortgage-Backed Securities |
641,176 | |||||||
|
|
|
|||||||
| Total Investments - 98.7% |
91,530,243 | |||||||
|
|
|
|||||||
| (Cost $95,040,940) |
||||||||
| Other Assets & Liabilities, Net - 1.3% |
1,223,072 | |||||||
|
|
|
|||||||
| Net Assets - 100.0% |
92,753,315 | |||||||
|
|
|
|||||||
| (a) | Non-income producing security. |
| (b) | Securities exempt from registration under Rule 144A of the 1933 Act. These securities may only be resold in transactions exempt from registration to qualified institutional buyers. The Board has determined these investments to be liquid. At September 30, 2022, these securities amounted to $3,278,938 or 3.5% of Net Assets of the Fund. |
| (c) | Variable or floating rate security. The rate shown is the effective interest rate as of period end. The rates on certain securities are not based on published reference rates and spreads and are either determined by the issuer or agent based on current market conditions; by using a formula based on the rates of underlying loans; or by adjusting periodically based on prevailing interest rates. |
| (d) | Perpetual security with no stated maturity date. |
| (e) | Interest rate represents the security’s effective yield at the time of purchase. |
| (f) | Securities are grouped by coupon and represent a range of maturities. |
| (g) | Interest only security (“IO”). These types of securities represent the right to receive the monthly interest payments on an underlying pool of mortgages. Payments of principal on the pool reduce the value of the “interest only” holding. |
| (h) | Principal only security (“PO”). These types of securities represent the right to receive the monthly principal payments on an underlying pool of mortgages. No payments of interest on the pool are passed through to the “principal only” holder. |
The accompanying notes are an integral part of the financial statements.
24
| THE ADVISORS’ INNER CIRCLE FUND III | FIRST FOUNDATION | |
| TOTAL RETURN FUND | ||
| SEPTEMBER 30, 2022 |
ADR — American Depositary Receipt
FHLMC — Federal Home Loan Mortgage Corporation
FNMA — Federal National Mortgage Association
GNMA — Government National Mortgage Association
ICE — Intercontinental Exchange
LIBOR — London Interbank Offered Rate
Ltd. — Limited
REIT — Real Estate Investment Trust
USD — U.S. Dollar
The following is a summary of the inputs used as of September 30, 2022 in valuing the Fund’s investments carried at value:
| Investments in Securities | Level 1 | Level 2 | Level 3 | Total | ||||||||||||
| Common Stock |
$ | 39,345,331 | $ | 928,302 | $ | — | $ | 40,273,633 | ||||||||
| Foreign Common Stock |
29,885,740 | — | — | 29,885,740 | ||||||||||||
| Corporate Obligations |
— | 10,315,728 | — | 10,315,728 | ||||||||||||
| U.S. Treasury Obligations |
— | 6,522,498 | — | 6,522,498 | ||||||||||||
| Preferred Stock |
3,094,280 | — | — | 3,094,280 | ||||||||||||
| Special Purpose Acquisition Companies |
797,188 | — | — | 797,188 | ||||||||||||
| Mortgage-Backed Securities |
— | 641,176 | — | 641,176 | ||||||||||||
|
|
|
|
|
|
|
|
|
|||||||||
| Total Investments in Securities |
$ | 73,122,539 | $ | 18,407,704 | $ | — | $ | 91,530,243 | ||||||||
|
|
|
|
|
|
|
|
|
|||||||||
Amounts designated as “—” are $0 or have been rounded to $0.
For more information on valuation inputs, see Note 2 – Significant Accounting Policies in the Notes to Financial Statements.
The accompanying notes are an integral part of the financial statements.
25
| THE ADVISORS’ INNER CIRCLE FUND III | BROOKMONT FUNDS | |
| SEPTEMBER 30, 2022 | ||
| STATEMENTS OF ASSETS AND LIABILITIES | ||
| First Foundation Fixed Income Fund |
First Foundation Total Return Fund |
|||||||
| Assets |
||||||||
| Investments, at value (Cost $170,667,545 and $95,040,940) |
$ | 146,645,338 | $ | 91,530,243 | ||||
| Cash equivalents (Note 2) |
– | 1,474,187 | ||||||
| Foreign tax reclaim receivable |
– | 204,847 | ||||||
| Receivable for: |
||||||||
| Investments sold |
– | 645,082 | ||||||
| Dividends and interest |
1,043,085 | 220,845 | ||||||
| Prepaid expenses and other assets |
10,326 | 9,722 | ||||||
|
|
|
|
|
|||||
| Total assets |
147,698,749 | 94,084,926 | ||||||
|
|
|
|
|
|||||
| Liabilities: |
||||||||
| Payable for: |
||||||||
| Fund shares redeemed |
149,135 | 1,183 | ||||||
| Transfer agent fees |
74,395 | 46,056 | ||||||
| Distribution and shareholder servicing fees |
43,570 | 11,038 | ||||||
| Investment advisory fees payable |
37,462 | 40,757 | ||||||
| Audit fees |
35,815 | 27,185 | ||||||
| Income distribution payable |
22,122 | – | ||||||
| Payable due to administrator |
14,974 | 9,775 | ||||||
| Trustees fees |
5,306 | 3,423 | ||||||
| CCO fees payable |
2,158 | 1,392 | ||||||
| Investments purchased |
– | 991,287 | ||||||
| Foreign currency payable, at value (Proceeds $- and $198,720) |
– | 175,498 | ||||||
| Due to custodian |
133,107 | – | ||||||
| Accrued expenses and other liabilities |
35,608 | 24,017 | ||||||
|
|
|
|
|
|||||
| Total liabilities |
553,652 | 1,331,611 | ||||||
|
|
|
|
|
|||||
| Net Assets |
$ | 147,145,097 | $ | 92,753,315 | ||||
|
|
|
|
|
|||||
The accompanying notes are an integral part of the financial statements.
26
| THE ADVISORS’ INNER CIRCLE FUND III | BROOKMONT FUNDS | |
| SEPTEMBER 30, 2022 | ||
| STATEMENTS OF ASSETS AND LIABILITIES | ||
| First Foundation Fixed Income Fund |
First Foundation Total Return Fund |
|||||||
| Net Assets Consist of: |
||||||||
| Paid-in capital |
$ | 172,544,244 | $ | 87,039,996 | ||||
| Total distributable earnings (accumulated loss) |
(25,399,147) | 5,713,319 | ||||||
|
|
|
|
|
|||||
| Net Assets |
$ | 147,145,097 | $ | 92,753,315 | ||||
|
|
|
|
|
|||||
| Class A: |
||||||||
| Net assets |
$ | 55,515,610 | $ | 33,456,420 | ||||
| Shares outstanding (no par value; unlimited shares authorized) |
4,988,471 | 1,336,813 | ||||||
| Net asset value per share(a)(b) |
$ | 11.13 | $ | 25.03 | ||||
|
|
|
|
|
|||||
| Maximum offering price per share(c) |
$ | 11.62 | $ | 26.56 | ||||
|
|
|
|
|
|||||
| Class Y: |
||||||||
| Net assets |
$ | 91,629,487 | $ | 59,296,895 | ||||
| Shares outstanding (no par value; unlimited shares authorized) |
8,240,919 | 2,322,041 | ||||||
| Net asset value, offering and redemption price per share |
$ | 11.12 | $ | 25.54 | ||||
|
|
|
|
|
|||||
(a) Redemption price per share is equal to net asset value per share less any applicable contingent deferred sales charge (“CDSC”).
(b) Purchases without an initial sales charge of $1,000,000 or more are subject to a 0.50% CDSC if redeemed within one year of purchase.
(c) The sales charge is 4.25% for the Fixed Income Fund and 5.75% for the Total Return Fund. On sales of $1,000,000 or more, there is no sales charge and therefore the offering will be lower.
Amounts designated as “—” are $0 or have been rounded to $0.
The accompanying notes are an integral part of the financial statements.
27
| THE ADVISORS’ INNER CIRCLE FUND III | BROOKMONT FUNDS | |
| FOR THE YEAR ENDED | ||
| SEPTEMBER 30, 2022 | ||
| STATEMENTS OF OPERATIONS | ||
| First Foundation Fixed Income Fund |
First Foundation Total Return Fund |
|||||||
| Investment Income: |
||||||||
| Dividends |
$ | 1,799,001 | $ | 4,629,065 | ||||
| Interest |
5,514,133 | 267,196 | ||||||
| Less: Foreign taxes withheld |
– | (267,390) | ||||||
|
|
|
|
|
|||||
| Total income |
7,313,134 | 4,628,871 | ||||||
|
|
|
|
|
|||||
| Expenses: |
||||||||
| Investment advisory fees |
537,764 | 475,294 | ||||||
| Administration fees |
211,864 | 112,451 | ||||||
| Distribution and shareholder service fees: |
||||||||
| Class A Shares |
162,907 | 96,293 | ||||||
| Transfer agent fees |
231,339 | 148,653 | ||||||
| Legal fees |
65,186 | 32,929 | ||||||
| Registration fees |
49,671 | 45,455 | ||||||
| Audit fees |
36,294 | 33,706 | ||||||
| Trustees fees |
– | 12,161 | ||||||
| Reports to shareholders |
46,397 | 26,519 | ||||||
| Chief compliance officer fees |
8,124 | 5,782 | ||||||
| Custodian/wire agent fees |
3,934 | 12,382 | ||||||
| Other |
54,589 | 22,163 | ||||||
|
|
|
|
|
|||||
| Total operating expenses |
1,408,069 | 1,023,788 | ||||||
| Less: |
||||||||
| Fees Paid Indirectly |
(4,933) | (3,038) | ||||||
|
|
|
|
|
|||||
| Net operating expenses |
1,403,136 | 1,020,750 | ||||||
|
|
|
|
|
|||||
| Net investment income |
5,909,998 | 3,608,121 | ||||||
|
|
|
|
|
|||||
| Realized gain (loss) on: |
||||||||
| Investments in securities |
(1,460,694) | 3,177,948 | ||||||
| Foreign currency related transactions |
– | 18,593 | ||||||
| Reimbursement from affiliate(1) |
310,750 | – | ||||||
|
|
|
|
|
|||||
| Net realized gain (loss) |
(1,149,944) | 3,196,541 | ||||||
|
|
|
|
|
|||||
| Net Change in Unrealized Appreciation (Depreciation) on: |
||||||||
| Investments in securities |
(30,657,303) | (12,681,406) | ||||||
| Foreign currency related translations |
– | 14,671 | ||||||
|
|
|
|
|
|||||
| Net change in unrealized depreciation |
(30,657,303) | (12,666,735) | ||||||
|
|
|
|
|
|||||
| Net realized and unrealized loss |
(31,807,247) | (9,470,194) | ||||||
|
|
|
|
|
|||||
| Total decrease in net assets resulting from operations |
$ | (25,897,249) | $ | (5,862,073) | ||||
|
|
|
|
|
|||||
(1) See Note 3 in Notes to Financial Statements.
Amounts designated as “—” are $0 or have been rounded to $0.
The accompanying notes are an integral part of the financial statements.
28
| THE ADVISORS’ INNER CIRCLE FUND III | FIRST FOUNDATION | |
| FIXED INCOME FUND | ||
| STATEMENTS OF CHANGES IN NET ASSETS | ||
| Year Ended September 30, 2022 |
Year Ended September 30, 2021(1) |
|||||||
| Increase (Decrease) in Net Assets |
||||||||
| Operations: |
||||||||
| Net investment income |
$ | 5,909,998 | $ | 5,807,242 | ||||
| Net realized gain (loss) |
(1,460,694 | ) | 1,096,938 | |||||
| Reimbursement from affiliate(2) |
310,750 | — | ||||||
| Net change in unrealized appreciation (depreciation) |
(30,657,303 | ) | 2,577,438 | |||||
|
|
|
|
|
|||||
| Net increase (decrease) resulting from operations |
(25,897,249 | ) | 9,481,618 | |||||
|
|
|
|
|
|||||
| Distributions: |
||||||||
| Class A Shares |
(2,125,082 | ) | (3,155,161 | ) | ||||
| Class Y Shares |
(3,981,390 | ) | (4,991,270 | ) | ||||
| Return of capital: |
||||||||
| Class A Shares |
— | (110,119 | ) | |||||
| Class Y Shares |
— | (167,310 | ) | |||||
|
|
|
|
|
|||||
| Net decrease resulting from distributions |
(6,106,472 | ) | (8,423,860 | ) | ||||
|
|
|
|
|
|||||
| Net increase (decrease) in net assets from operations and distributions |
(32,003,721 | ) | 1,057,758 | |||||
|
|
|
|
|
|||||
| Capital Share transactions:(3) |
||||||||
| Class A Shares |
||||||||
| Issued |
147,215 | 812,193 | ||||||
| Reinvestment of Distributions |
1,916,026 | 2,944,606 | ||||||
| Redeemed |
(10,138,724 | ) | (11,353,144 | ) | ||||
|
|
|
|
|
|||||
| Net decrease from Class A share transactions |
(8,075,483 | ) | (7,596,345 | ) | ||||
|
|
|
|
|
|||||
| Class C Shares(4) |
||||||||
| Issued |
— | 30 | ||||||
| Reinvestment of Distributions |
— | 3,364 | ||||||
| Redeemed |
— | (1,772,881 | ) | |||||
|
|
|
|
|
|||||
| Net decrease from Class C share transactions |
— | (1,769,487 | ) | |||||
|
|
|
|
|
|||||
The accompanying notes are an integral part of the financial statements.
29
| THE ADVISORS’ INNER CIRCLE FUND III | FIRST FOUNDATION | |
| FIXED INCOME FUND | ||
| Year Ended September 30, 2022 |
Year Ended September 30, 2021(1) |
|||||||
| Class Y Shares |
||||||||
| Issued |
$ | 14,540,345 | $ | 25,810,990 | ||||
| Reinvestment of Distributions |
3,920,137 | 5,062,941 | ||||||
| Redeemed |
(30,607,739 | ) | (22,102,037 | ) | ||||
|
|
|
|
|
|||||
| Net increase (decrease) from Class Y share transactions |
(12,147,257 | ) | 8,771,894 | |||||
|
|
|
|
|
|||||
| Total increase (decrease) in net assets |
(52,226,461 | ) | 463,820 | |||||
|
|
|
|
|
|||||
| Net Assets |
||||||||
| Beginning of year |
199,371,558 | 198,907,738 | ||||||
|
|
|
|
|
|||||
| End of year |
$ | 147,145,097 | $ | 199,371,558 | ||||
|
|
|
|
|
|||||
(1) On January 11, 2021, the Highland Fixed Income Fund (the “Fixed Income Predecessor Fund”) was reorganized into the First Foundation Fixed Income Fund (the “Fixed Income Fund”). Class A and Class Y shares of the Fixed Income Predecessor Fund were exchanged on a tax-free basis for Class A and Class Y shares of the Fixed Income Fund. Information presented prior to January 11, 2021 is that of the Fixed Income Predecessor Fund. See Note 1 in Notes to Financial Statements.
(2) See Note 3 in Notes to Financial Statements.
(3) For share transactions, see Note 6 in Notes to Financial Statements.
(4) On November 16, 2020, Class C Shares of the Fixed Income Predecessor Fund were converted to Class Y Shares of the Fixed Income Predecessor Fund, and the Class C Shares were terminated. See Note 1 in Notes to Financial Statements.
Amounts designated as “—” are $0 or have been rounded to $0.
The accompanying notes are an integral part of the financial statements.
30
| THE ADVISORS’ INNER CIRCLE FUND III | FIRST FOUNDATION | |
| TOTAL RETURN FUND | ||
| STATEMENTS OF CHANGES IN NET ASSETS | ||
| Year Ended September 30, 2022 |
Year Ended September 30, 2021(1) |
|||||||
| Increase (Decrease) in Net Assets |
||||||||
| Operations: |
||||||||
| Net investment income |
$ | 3,608,121 | $ | 1,722,086 | ||||
| Net realized gain |
3,196,541 | 10,870,102 | ||||||
| Net change in unrealized appreciation (depreciation) |
(12,666,735 | ) | 8,719,000 | |||||
|
|
|
|
|
|||||
| Net increase (decrease) resulting from operations |
(5,862,073 | ) | 21,311,188 | |||||
|
|
|
|
|
|||||
| Distributions: |
||||||||
| Class A Shares |
(5,493,365 | ) | (324,066 | ) | ||||
| Class Y Shares |
(6,905,918 | ) | (352,574 | ) | ||||
|
|
|
|
|
|||||
| Net decrease resulting from distributions |
(12,399,283 | ) | (676,640 | ) | ||||
|
|
|
|
|
|||||
| Net increase (decrease) in net assets from operations and distributions |
(18,261,356 | ) | 20,634,548 | |||||
|
|
|
|
|
|||||
| Capital Share transactions:(2) |
||||||||
| Class A Shares |
||||||||
| Issued |
387,433 | 659,915 | ||||||
| Reinvestment of Distributions |
5,200,902 | 306,898 | ||||||
| Redeemed |
(5,379,063 | ) | (6,632,116 | ) | ||||
|
|
|
|
|
|||||
| Net increase (decrease) from Class A share transactions |
209,272 | (5,665,303 | ) | |||||
|
|
|
|
|
|||||
| Class C Shares(3) |
||||||||
| Issued |
— | 441 | ||||||
| Redeemed |
— | (2,179,380 | ) | |||||
|
|
|
|
|
|||||
| Net decrease from Class C share transactions |
— | (2,178,939 | ) | |||||
|
|
|
|
|
|||||
| Class Y Shares |
||||||||
| Issued |
26,665,299 | 15,277,244 | ||||||
| Reinvestment of Distributions |
6,799,972 | 344,048 | ||||||
| Redeemed |
(10,621,088 | ) | (7,806,485 | ) | ||||
|
|
|
|
|
|||||
| Net increase from Class Y share transactions |
22,844,183 | 7,814,807 | ||||||
|
|
|
|
|
|||||
| Total increase in net assets |
4,792,099 | 20,605,113 | ||||||
|
|
|
|
|
|||||
| Net Assets |
||||||||
| Beginning of year |
87,961,216 | 67,356,103 | ||||||
|
|
|
|
|
|||||
| End of year |
$ | 92,753,315 | $ | 87,961,216 | ||||
|
|
|
|
|
|||||
The accompanying notes are an integral part of the financial statements.
31
| THE ADVISORS’ INNER CIRCLE FUND III | FIRST FOUNDATION | |
| TOTAL RETURN FUND | ||
(1) On January 11, 2021, the Highland Total Return Fund (the “Total Return Predecessor Fund”) was reorganized into the First Foundation Total Return Fund (the “Total Return Fund”). Class A and Class Y shares of the Total Return Predecessor Fund were exchanged on a tax-free basis for Class A and Class Y shares of the Total Return Fund. Information presented prior to January 11, 2021 is that of the Total Return Predecessor Fund. See Note 1 in Notes to Financial Statements.
(2) For share transactions, see Note 6 in Notes to Financial Statements.
(3) On November 16, 2020, Class C Shares of the Total Return Predecessor Fund were converted to Class Y Shares of the Total Return Predecessor Fund, and the Class C Shares were terminated. See Note 1 in Notes to Financial Statements.
Amounts designated as “—” are $0 or have been rounded to $0.
The accompanying notes are an integral part of the financial statements.
32
| THE ADVISORS’ INNER CIRCLE FUND III | FIRST FOUNDATION | |
| FIXED INCOME FUND | ||
| FINANCIAL HIGHLIGHTS | ||
| Selected Per Share Data & Ratios For a Share Outstanding Throughout the Year | ||
| Class A Shares |
Year Ended September 30, 2022 |
Year Ended September 30, 2021(1) |
Year Ended September 30, 2020 |
Year Ended September 30, 2019 |
Year Ended September 30, 2018 |
|||||||||||||||
| Net Asset Value, Beginning of Year |
$ | 13.34 | $ | 13.27 | $ | 13.05 | $ | 12.69 | $ | 12.98 | ||||||||||
|
|
|
|
|
|
|
|
|
|
|
|||||||||||
| Income from Investment Operations: |
||||||||||||||||||||
| Net investment income(a) |
0.39 | 0.37 | 0.36 | 0.35 | 0.33 | |||||||||||||||
| Net realized and unrealized gain (loss) |
(2.19) | 0.25 | 0.19 | 0.37 | (0.28) | |||||||||||||||
|
|
|
|
|
|
|
|
|
|
|
|||||||||||
| Total from Investment Operations |
(1.80) | 0.62 | 0.55 | 0.72 | 0.05 | |||||||||||||||
|
|
|
|
|
|
|
|
|
|
|
|||||||||||
| Distributions and Distributions: |
||||||||||||||||||||
| Net investment income |
(0.39) | (0.42) | (0.33) | (0.36) | (0.32) | |||||||||||||||
| Net realized gains |
(0.02) | (0.11) | — | — | — | |||||||||||||||
| Return of capital |
— | (0.02) | — | —(b) | (0.02) | |||||||||||||||
|
|
|
|
|
|
|
|
|
|
|
|||||||||||
| Total Dividends and Distributions |
(0.41) | (0.55) | (0.33) | (0.36) | (0.34) | |||||||||||||||
|
|
|
|
|
|
|
|
|
|
|
|||||||||||
|
Net Asset Value, End of Year(c) |
$ | 11.13 | $ | 13.34 | $ | 13.27 | $ | 13.05 | $ | 12.69 | ||||||||||
|
|
|
|
|
|
|
|
|
|
|
|||||||||||
| Total Return(c)(d) |
(13.79)% | (f) | 4.71% | 4.27% | 5.76% | 0.43% | ||||||||||||||
|
|
|
|
|
|
|
|
|
|
|
|||||||||||
|
Ratios to Average Net Assets:(e) |
||||||||||||||||||||
| Net Assets, End of Year (000’s) |
$55,516 | $75,144 | $82,276 | $89,042 | $96,380 | |||||||||||||||
| Ratio of Expenses to Average Net Assets |
0.94% | 0.91% | 0.90% | 0.90% | 0.89% | |||||||||||||||
| Ratio of Expenses to Average Net Assets (Excluding Waivers, Reimbursements and Fees Paid Indirectly) |
0.94% | 1.02% | 1.07% | 0.95% | 0.92% | |||||||||||||||
| Ratio of Net Investment Income to Average Net Assets |
3.14% | 2.79% | 2.74% | 2.72% | 2.55% | |||||||||||||||
| Portfolio Turnover Rate |
14% | 34% | 75% | 53% | 45% | |||||||||||||||
| (a) | Per share data was calculated using average shares outstanding during the period. |
| (b) | Represents less than $0.005 per share. |
| (c) | The Net Asset Value per share and total return have been calculated based on net assets which include adjustments made in accordance with U.S. Generally Accepted Accounting Principles required at period end for financial reporting purposes. These figures do not necessarily reflect the Net Asset Value per share or total return experienced by the shareholder at period end. |
| (d) | Total return is at net asset value assuming all distributions are reinvested and no initial sales charge or CDSC. For periods with waivers/reimbursements, had the Fund’s Investment Adviser not waived or reimbursed a portion of expenses, total return would have been lower. |
| (e) | All ratios for the period have been annualized, unless otherwise indicated. |
| (f) | If not for the capital contribution from First Foundation Advisors, the total return would have been (13.94)%. See Note 3 in Notes to Financial Statements. |
| (1) | On January 11, 2021, the Highland Fixed Income Fund (the “Fixed Income Predecessor Fund”) was reorganized into the First Foundation Fixed Income Fund (the “Fixed Income Fund”). Class A shares of the Fixed Income Predecessor Fund were exchanged on a tax-free basis for Class A shares of the Fixed Income Fund. Information presented prior to January 11, 2021 is that of the Fixed Income Predecessor Fund. See Note 1 in Notes to Financial Statements. |
Amounts designated as “—” are $0 or have been rounded to $0.
The accompanying notes are an integral part of the financial statements.
33
| THE ADVISORS’ INNER CIRCLE FUND III | FIRST FOUNDATION | |
| FIXED INCOME FUND | ||
| FINANCIAL HIGHLIGHTS | ||
| Selected Per Share Data & Ratios For a Share Outstanding Throughout the Year | ||
| Class Y Shares |
Year Ended September 30, 2022 |
Year Ended September 30, 2021(1)(2) |
Year Ended September 30, 2020 |
Year Ended September 30, 2019 |
Year Ended September 30, 2018 |
|||||||||||||||
| Net Asset Value, Beginning of Year |
$ | 13.33 | $ | 13.26 | $ | 13.04 | $ | 12.68 | $ | 12.97 | ||||||||||
|
|
|
|
|
|
|
|
|
|
|
|||||||||||
| Income from Investment Operations: |
||||||||||||||||||||
| Net investment income(a) |
0.42 | 0.40 | 0.39 | 0.38 | 0.35 | |||||||||||||||
| Net realized and unrealized gain (loss) |
(2.19) | 0.25 | 0.19 | 0.37 | (0.26) | |||||||||||||||
|
|
|
|
|
|
|
|
|
|
|
|||||||||||
| Total from Investment Operations |
(1.77) | 0.65 | 0.58 | 0.75 | 0.09 | |||||||||||||||
|
|
|
|
|
|
|
|
|
|
|
|||||||||||
| Distributions and Distributions: |
||||||||||||||||||||
| Net investment income |
(0.42) | (0.45) | (0.36) | (0.39) | (0.36) | |||||||||||||||
| Net realized gains |
(0.02) | (0.11) | — | — | — | |||||||||||||||
| Return of capital |
— | (0.02) | — | —(b) | (0.02) | |||||||||||||||
|
|
|
|
|
|
|
|
|
|
|
|||||||||||
| Total Dividends and Distributions |
(0.44) | (0.58) | (0.36) | (0.39) | (0.38) | |||||||||||||||
|
|
|
|
|
|
|
|
|
|
|
|||||||||||
| Net Asset Value, End of Year(c) |
$ | 11.12 | $ | 13.33 | $ | 13.26 | $ | 13.04 | $ | 12.68 | ||||||||||
|
|
|
|
|
|
|
|
|
|
|
|||||||||||
| Total Return(c)(d) |
(13.59)% | (f) | 4.97% | 4.54% | 6.02% | 0.68% | ||||||||||||||
|
|
|
|
|
|
|
|
|
|
|
|||||||||||
| Ratios to Average Net Assets:(e) |
||||||||||||||||||||
| Net Assets, End of Year (000’s) |
$91,629 | $124,228 | $114,884 | $106,978 | $96,936 | |||||||||||||||
| Ratio of Expenses to Average Net Assets |
0.69% | 0.66% | 0.65% | 0.65% | 0.66% | |||||||||||||||
| Ratio of Expenses to Average Net Assets (Excluding Waivers, Reimbursements and Fees Paid Indirectly) |
0.69% | 0.77% | 0.82% | 0.71% | 0.67% | |||||||||||||||
| Ratio of Net Investment Income to Average Net Assets |
3.39% | 3.03% | 3.01% | 2.97% | 2.76% | |||||||||||||||
| Portfolio Turnover Rate |
14% | 34% | 75% | 53% | 45% | |||||||||||||||
| (a) | Per share data was calculated using average shares outstanding during the period. |
| (b) | Represents less than $0.005 per share. |
| (c) | The Net Asset Value per share and total return have been calculated based on net assets which include adjustments made in accordance with U.S. Generally Accepted Accounting Principles required at period end for financial reporting purposes. These figures do not necessarily reflect the Net Asset Value per share or total return experienced by the shareholder at period end. |
| (d) | Total return is at net asset value assuming all distributions are reinvested and no initial sales charge or CDSC. For periods with waivers/reimbursements, had the Fund’s Investment Adviser not waived or reimbursed a portion of expenses, total return would have been lower. |
| (e) | All ratios for the period have been annualized, unless otherwise indicated. |
| (f) | If not for the capital contribution from First Foundation Advisors, the total return would have been (13.74)%. See Note 3 in Notes to Financial Statements. |
| (1) | On January 11, 2021, the Highland Fixed Income Fund (the “Fixed Income Predecessor Fund”) was reorganized into the First Foundation Fixed Income Fund (the “Fixed Income Fund”). Class Y shares of the Fixed Income Predecessor Fund were exchanged on a tax-free basis for Class Y shares of the Fixed Income Fund. Information presented prior to January 11, 2021 is that of the Fixed Income Predecessor Fund. See Note 1 in Notes to Financial Statements. |
| (2) | On November 16, 2020, Class C Shares of the Fixed Income Predecessor Fund were converted to Class Y Shares of the Fixed Income Predecessor Fund, and the Class C Shares were terminated. See Note 1 in Notes to Financial Statements. |
Amounts designated as “—” are $0 or have been rounded to $0.
The accompanying notes are an integral part of the financial statements.
34
| THE ADVISORS’ INNER CIRCLE FUND III | FIRST FOUNDATION | |
| TOTAL RETURN FUND | ||
| FINANCIAL HIGHLIGHTS | ||
| Selected Per Share Data & Ratios For a Share Outstanding Throughout the Year | ||
| Class A Shares |
Year Ended September 30, 2022 |
Year Ended September 30, 2021(1) |
Year Ended September 30, 2020 |
Year Ended September 30, 2019 |
Year Ended September 30, 2018 |
|||||||||||||||
| Net Asset Value, Beginning of Year |
$ | 30.50 | $ | 22.94 | $ | 22.99 | $ | 23.03 | $ | 24.04 | ||||||||||
|
|
|
|
|
|
|
|
|
|
|
|||||||||||
| Income from Investment Operations: |
||||||||||||||||||||
| Net investment income(a) |
1.13 | 0.55 | 0.18 | 0.19 | 0.95 | |||||||||||||||
| Net realized and unrealized gain (loss) |
(2.34) | 7.23 | (0.08) | (0.09) | (0.68) | |||||||||||||||
|
|
|
|
|
|
|
|
|
|
|
|||||||||||
| Total from Investment Operations |
(1.21) | 7.78 | 0.10 | 0.10 | 0.27 | |||||||||||||||
|
|
|
|
|
|
|
|
|
|
|
|||||||||||
| Distributions and Distributions: |
||||||||||||||||||||
| Net investment income |
(0.45) | (0.22) | (0.15) | (0.02) | (0.40) | |||||||||||||||
| Net realized gains |
(3.81) | — | — | (0.12) | (0.50) | |||||||||||||||
| Return of capital |
— | — | — | — | (0.38) | |||||||||||||||
|
|
|
|
|
|
|
|
|
|
|
|||||||||||
| Total Dividends and Distributions |
(4.26) | (0.22) | (0.15) | (0.14) | (1.28) | |||||||||||||||
|
|
|
|
|
|
|
|
|
|
|
|||||||||||
| Net Asset Value, End of Year(b) |
$ | 25.03 | $ | 30.50 | $ | 22.94 | $ | 22.99 | $ | 23.03 | ||||||||||
|
|
|
|
|
|
|
|
|
|
|
|||||||||||
| Total Return(b)(c) |
(5.20)% | 34.09% | 0.39% | 0.53% | 1.17% | |||||||||||||||
|
|
|
|
|
|
|
|
|
|
|
|||||||||||
| Ratios to Average Net Assets:(d) |
||||||||||||||||||||
| Net Assets, End of Year (000’s) |
$33,456 | $40,395 | $35,088 | $40,099 | $46,188 | |||||||||||||||
| Ratio of Expenses to Average Net Assets |
1.22% | 1.20% | 1.20% | 1.20% | 1.17% | |||||||||||||||
| Ratio of Expenses to Average Net Assets (Excluding Waivers, Reimbursements and Fees Paid Indirectly) |
1.22% | 1.35% | 1.56% | 1.23% | 1.17% | |||||||||||||||
| Ratio of Net Investment Income to Average Net Assets |
3.99% | 1.98% | 0.80% | 0.86% | 4.13% | |||||||||||||||
| Portfolio Turnover Rate |
105% | 85% | 73% | 62% | 105% | |||||||||||||||
| (a) | Per share data was calculated using average shares outstanding during the period. |
| (b) | The Net Asset Value per share and total return have been calculated based on net assets which include adjustments made in accordance with U.S. Generally Accepted Accounting Principles required at period end for financial reporting purposes. These figures do not necessarily reflect the Net Asset Value per share or total return experienced by the shareholder at period end. |
| (c) | Total return is at net asset value assuming all distributions are reinvested and no initial sales charge or CDSC. For periods with waivers/reimbursements, had the Fund’s Investment Adviser not waived or reimbursed a portion of expenses; total return would have been lower. |
| (d) | All ratios for the period have been annualized, unless otherwise indicated. |
| (1) | On January 11, 2021, the Highland Total Return Fund (the “Total Return Predecessor Fund”) was reorganized into the First Foundation Total Return Fund (the “Total Return Fund”). Class A shares of the Total Return Predecessor Fund were exchanged on a tax-free basis for Class A shares of the Total Return Fund. Information presented prior to January 11, 2021 is that of the Total Return Predecessor Fund. See Note 1 in Notes to Financial Statements. |
Amounts designated as “—” are $0 or have been rounded to $0.
The accompanying notes are an integral part of the financial statements.
35
| THE ADVISORS’ INNER CIRCLE FUND III | FIRST FOUNDATION | |
| TOTAL RETURN FUND | ||
| FINANCIAL HIGHLIGHTS | ||
Selected Per Share Data & Ratios
For a Share Outstanding
Throughout the Year
| Class Y Shares |
Year Ended September 30, 2022 |
Year Ended September 30, 2021(1)(2) |
Year Ended September 30, 2020 |
Year Ended September 30, 2019 |
Year Ended September 30, 2018 |
|||||||||||||||
| Net Asset Value, Beginning of Year |
$ | 31.04 | $ |
23.34 |
|
$ | 23.38 | $ | 23.43 | $ | 24.44 | |||||||||
|
|
|
|
|
|
|
|
|
|
|
|||||||||||
| Income from Investment Operations: |
||||||||||||||||||||
| Net investment income(a) |
1.05 | 0.71 | 0.23 | 0.25 | 1.00 | |||||||||||||||
| Net realized and unrealized gain (loss) |
(2.22) | 7.27 | (0.06) | (0.10) | (0.67) | |||||||||||||||
|
|
|
|
|
|
|
|
|
|
|
|||||||||||
| Total from Investment Operations |
(1.17) | 7.98 | 0.17 | 0.15 | 0.33 | |||||||||||||||
|
|
|
|
|
|
|
|
|
|
|
|||||||||||
| Distributions and Distributions: |
||||||||||||||||||||
| Net investment income |
(0.52) | (0.28) | (0.21) | (0.08) | (0.43) | |||||||||||||||
| Net realized gains |
(3.81) | — | — | (0.12) | (0.50) | |||||||||||||||
| Return of capital |
— | — | — | — | (0.41) | |||||||||||||||
|
|
|
|
|
|
|
|
|
|
|
|||||||||||
| Total Dividends and Distributions |
(4.33) | (0.28) | (0.21) | (0.20) | (1.34) | |||||||||||||||
|
|
|
|
|
|
|
|
|
|
|
|||||||||||
| Net Asset Value, End of Year(b) |
$ | 25.54 | $ | 31.04 | $ | 23.34 | $ | 23.38 | $ | 23.43 | ||||||||||
|
|
|
|
|
|
|
|
|
|
|
|||||||||||
| Total Return(b)(c) |
(4.98)% | 34.42% | 0.68% | 0.74% | 1.41% | |||||||||||||||
|
|
|
|
|
|
|
|
|
|
|
|||||||||||
| Ratios to Average Net Assets:(d) |
||||||||||||||||||||
| Net Assets, End of Year (000’s) |
$59,297 | $47,566 | $30,271 | $35,575 | $40,931 | |||||||||||||||
| Ratio of Expenses to Average Net Assets |
0.97% | 0.95% | 0.95% | 0.95% | 0.92% | |||||||||||||||
| Ratio of Expenses to Average Net Assets (Excluding Waivers, Reimbursements and Fees Paid Indirectly) |
0.97% | 1.10% | 1.31% | 0.98% | 0.92% | |||||||||||||||
| Ratio of Net Investment Income to Average Net Assets |
3.66% | 2 .48% | 1 .01% | 1 .11% | 4 .30% | |||||||||||||||
| Portfolio Turnover Rate |
105% | 85% | 73% | 62% | 105% | |||||||||||||||
| (a) | Per share data was calculated using average shares outstanding during the period. |
| (b) | The Net Asset Value per share and total return have been calculated based on net assets which include adjustments made in accordance with U.S. Generally Accepted Accounting Principles required at period end for financial reporting purposes. These figures do not necessarily reflect the Net Asset Value per share or total return experienced by the shareholder at period end. |
| (c) | Total return is at net asset value assuming all distributions are reinvested and no initial sales charge or CDSC. For periods with waivers/reimbursements, had the Fund’s Investment Adviser not waived or reimbursed a portion of expenses; total return would have been lower. |
| (d) | All ratios for the period have been annualized, unless otherwise indicated. |
| (1) | On January 11, 2021, the Highland Total Return Fund (the “Total Return Predecessor Fund”) was reorganized into the First Foundation Total Return Fund (the “Total Return Fund”). Class Y shares of the Total Return Predecessor Fund were exchanged on a tax-free basis for Class Y shares of the Total Return Fund. Information presented prior to January 11, 2021 is that of the Total Return Predecessor Fund. See Note 1 in Notes to Financial Statements. |
| (2) | On November 16, 2020, Class C Shares of the Total Return Predecessor Fund were converted to Class Y Shares of the Total Return Predecessor Fund, and the Class C Shares were terminated. See Note 1 in Notes to Financial Statements. |
Amounts designated as “—” are $0 or have been rounded to $0.
The accompanying notes are an integral part of the financial statements.
36
| THE ADVISORS’ INNER CIRCLE FUND III | BROOKMONT FUNDS | |
| SEPTEMBER 30, 2022 | ||
1. Organization:
The Advisors’ Inner Circle Fund III (the “Trust”) is organized as a Delaware statutory trust under a Declaration of Trust dated December 4, 2013. The Trust is registered under the Investment Company Act of 1940, as amended, as an open-end management investment company with 65 funds. The financial statements herein are those of the First Foundation Fixed Income Fund and the First Foundation Total Return Fund (each a “Fund” and collectively, the “Funds”). The investment objective of the First Foundation Fixed Income Fund is to seek maximum income consistent with prudent investment management and the preservation of capital. The investment objective of the First Foundation Total Return Fund is to seek maximum total return (total return includes both income and capital appreciation). The Funds are each classified as a diversified investment company. Brookmont Capital Management, LLC serves as the Funds’ investment adviser (the “Adviser”). The financial statements of the remaining funds of the Trust are presented separately. The assets of each fund are segregated, and a shareholder’s interest is limited to the fund in which shares are held.
The First Foundation Fixed Income Fund (the “Fixed Income Fund”) is the successor to the Highland Fixed Income Fund (the “Fixed Income Predecessor Fund”) and the First Foundation Total Return Fund (the “Total Return Fund”) is the successor to the Highland Total Return Fund (the “Total Return Predecessor Fund” and, together with the Fixed Income Predecessor Fund, the “Predecessor Funds”). The Predecessor Funds were managed by Highland Capital Management Fund Advisors, L.P., the Predecessor Funds’ investment adviser (the “Predecessor Adviser”), prior to their reorganizations into the Funds. The Predecessor Fixed Income Fund and the Predecessor Total Return Fund had substantially similar investment objectives, investment strategies, policies and restrictions as those of the Fixed Income Fund and the Total Return Fund, respectively. Each Fund acquired the assets and assumed all of the liabilities of its Predecessor Fund (the “Reorganization”) on January 11, 2021 in a tax-free transaction. The Funds had no operations prior to the Reorganization. The financial statements and financial highlights reflect the financial information of the Predecessor Funds for periods prior to January 11, 2021. The Funds currently offer Class A and Class Y Shares. On November 16, 2020, Class C Shares of each Predecessor Fund were converted to Class Y Shares of the applicable Predecessor Fund, and the Class C Shares were terminated.
2. Significant Accounting Policies:
The following are significant accounting policies, which are consistently followed in the preparation of the financial statements of the Funds. The Funds are
37
| THE ADVISORS’ INNER CIRCLE FUND III | BROOKMONT FUNDS | |
| SEPTEMBER 30, 2022 | ||
| NOTES TO FINANCIAL STATEMENTS - continued |
investment companies that apply the accounting and reporting guidance issued in Topic 946 by the U.S. Financial Accounting Standards Board (“FASB”).
Use of Estimates — The preparation of financial statements in conformity with United States generally accepted accounting principles (“U.S. GAAP”) requires management to make estimates and assumptions that affect the fair value of assets and liabilities and disclosure of contingent assets and liabilities at the date of the financial statements and the reported amounts of revenues and expenses during the reporting period. Actual results could differ from those estimates and such differences could be material.
Security Valuation — Securities listed on a securities exchange, market or automated quotation system for which quotations are readily available (except for securities traded on the NASDAQ Stock Market (the “NASDAQ”)), including securities traded over the counter, are valued at the last quoted sale price on an exchange or market (foreign or domestic) on which they are traded on valuation date (or at approximately 4:00 pm Eastern Standard Time if a security’s primary exchange is normally open at that time), or, if there is no such reported sale on the valuation date, at the most recent quoted bid price. For securities traded on NASDAQ, the NASDAQ Official Closing Price will be used. If available, debt securities are priced based upon valuations provided by independent, third-party pricing agents. Such values generally reflect the last reported sales price if the security is actively traded. The third-party pricing agents may also value debt securities at an evaluated bid price by employing methodologies that utilize actual market transactions, broker supplied valuations, or other methodologies designed to identify the market value for such securities. Such methodologies generally consider such factors as security prices, yields, maturities, call features, ratings and developments relating to specific securities in arriving at valuations. On the first day a new debt security purchase is recorded, if a price is not available on the automated pricing feeds from our primary and secondary pricing vendors nor is it available from an independent broker, the security may be valued at its purchase price. Each day thereafter, the debt security will be valued according to the Trusts’ Fair Value Procedures until an independent source can be secured. Debt obligations with remaining maturities of sixty days or less may be valued at their amortized cost, which approximates market value provided that it is determined the amortized cost continues to approximate fair value. Should existing credit, liquidity or interest rate conditions in the relevant markets and issuer specific circumstances suggest that amortized cost does not approximate fair value, then the amortized cost method may not be used. The prices for foreign securities are reported in local currency and converted to U.S. dollars using currency exchange rates.
38
| THE ADVISORS’ INNER CIRCLE FUND III | BROOKMONT FUNDS | |
| SEPTEMBER 30, 2022 | ||
| NOTES TO FINANCIAL STATEMENTS - continued |
Securities for which market prices are not “readily available” are required to be fair valued under the 1940 Act.
In December 2020, the SEC adopted Rule 2a-5 under the 1940 Act, establishing requirements to determine fair value in good faith for purposes of the 1940 Act. The rule permits fund boards to designate a fund’s investment adviser to perform fair-value determinations, subject to board oversight and certain other conditions. The rule also defines when market quotations are “readily available” for purposes of the 1940 Act and requires a fund to fair value a portfolio investment when a market quotation is not readily available. The SEC also adopted new Rule 31a-4 under the 1940 Act, which sets forth recordkeeping requirements associated with fair-value determinations. The compliance date for Rule 2a-5 and Rule 31a-4 was September 8, 2022.
Effective September 8, 2022, and pursuant to the requirements of Rule 2a-5, the Trust’s Board of Trustees designated the Adviser as the Board’s valuation designee to perform fair-value determinations for the Funds through a Fair Value Committee established by the Adviser and approved new Adviser Fair Value Procedures for the Funds. Prior to September 8, 2022, fair-value determinations were performed in accordance with the Trust’s Fair Value Procedures established by the Funds’ Board of Trustees and were implemented through a Fair Value Committee designated by the Board.
Some of the more common reasons that may necessitate that a security be valued using Fair Value Procedures include: the security’s trading has been halted or suspended; the security has been de-listed from a national exchange; the security’s primary trading market is temporarily closed at a time when under normal conditions it would be open; the security has not been traded for an extended period of time; the security’s primary pricing source is not able or willing to provide a price; or trading of the security is subject to local government imposed restrictions. When a security is valued in accordance with the Fair Value Procedures, the Committee will determine the value after taking into consideration relevant information reasonably available to the Committee.
Futures contracts that are traded on an exchange are valued at their last reported sales price as of the valuation date.
In accordance with U.S. GAAP, the Funds disclose fair value of their investments in a hierarchy that prioritizes the inputs to valuation techniques used to measure the fair value. The objective of a fair value measurement is
39
| THE ADVISORS’ INNER CIRCLE FUND III | BROOKMONT FUNDS | |
| SEPTEMBER 30, 2022 | ||
| NOTES TO FINANCIAL STATEMENTS - continued |
to determine the price that would be received to sell an asset or paid to transfer a liability in an orderly transaction between market participants at the measurement date (an exit price). Accordingly, the fair value hierarchy gives the highest priority to quoted prices (unadjusted) in active markets for identical assets or liabilities (Level 1) and the lowest priority to unobservable inputs (Level 3). The three levels of the fair value hierarchy are described below:
| ● | Level 1 — Unadjusted quoted prices in active markets for identical, unrestricted assets or liabilities that the Fund has the ability to access at the measurement date; |
| ● | Level 2 — Other significant observable inputs (includes quoted prices for similar securities, interest rates, prepayment speeds, credit risk, referenced indices, quoted prices in inactive markets, adjusted quoted prices in active markets, adjusted quoted prices on foreign equity securities that were adjusted in accordance with pricing procedures approved by the Board, etc.); and |
| ● | Level 3 — Prices, inputs or proprietary modeling techniques which are both significant to the fair value measurement and unobservable (supported by little or no market activity). |
Investments are classified within the level of the lowest significant input considered in determining fair value. Investments classified within Level 3 whose fair value measurement considers several inputs may include Level 1 or Level 2 inputs as components of the overall fair value measurement.
Federal Income Taxes — It is the Funds’ intention to qualify as a regulated investment company for Federal income tax purposes by complying with the appropriate provisions of Subchapter M of the Internal Revenue Code of 1986 (the “Code”), as amended. Accordingly, no provisions for Federal income taxes have been made in the financial statements.
The Funds evaluate tax positions taken or expected to be taken in the course of preparing the Funds’ tax returns to determine whether it is “more-likely than-not” (i.e., greater than 50-percent) that each tax position will be sustained upon examination by a taxing authority based on the technical merits of the position. Tax positions not deemed to meet the more-likely-than-not threshold are recorded as a tax benefit or expense in the current period. The Funds did not record any tax provision in the current period. However, management’s conclusions regarding tax positions taken may be subject to review and adjustment at a later date based on factors including, but not limited to, examination by tax authorities (i.e., from commencement
40
| THE ADVISORS’ INNER CIRCLE FUND III | BROOKMONT FUNDS | |
| SEPTEMBER 30, 2022 | ||
| NOTES TO FINANCIAL STATEMENTS - continued |
of operations, as applicable), on-going analysis of and changes to tax laws, regulations and interpretations thereof.
As of and during the year ended September 30, 2022, the Funds did not have a liability for any unrecognized tax benefits. The Funds recognize interest and penalties, if any, related to unrecognized tax benefits as income tax expense in the Statements of Operations. During the year ended September 30, 2022, the Funds did not incur any interest or penalties.
Security Transactions and Investment Income — Security transactions are accounted for on trade date. Costs used in determining realized gains and losses on the sale of investment securities are based on the specific identification method. Dividend income and expense are recorded on the ex-dividend date. Interest income is recognized on the accrual basis from settlement date and includes the amortization of premiums and the accretion of discount. Certain dividends from foreign securities will be recorded as soon as the Funds are informed of the dividend if such information is obtained subsequent to the ex-dividend date. Discounts and premiums on fixed income securities are accreted and amortized using the effective interest method. Realized gains (losses) on paydowns of mortgage-backed and asset-backed securities are recorded as an adjustment to interest income.
Futures Contracts — To the extent consistent with its investment objective and strategies, the Funds may use futures contracts for tactical hedging purposes as well as to enhance the Funds’ returns. Initial margin deposits of cash or securities are made upon entering into futures contracts. The futures contracts are valued at the settlement price established each day by the exchange on which they are traded. The futures contracts are marked to market daily and the resulting changes in value are accounted for as unrealized gains and losses. Variation margin payments are paid or received, depending upon whether unrealized gains or losses are incurred. When the futures contract is closed, the Fund records a realized gain or loss equal to the difference between the proceeds from (or cost of) the closing transaction and the amount invested in the futures contract.
Risks of entering into futures contracts include the possibility that there will be an imperfect price correlation between the futures and the underlying securities. Second, it is possible that a lack of liquidity for futures contracts could exist in the secondary market, resulting in an inability to close a position prior to its maturity date. Third, the futures contract involves the risk that a fund could lose more than the original margin deposit required to initiate a futures transaction.
41
| THE ADVISORS’ INNER CIRCLE FUND III | BROOKMONT FUNDS | |
| SEPTEMBER 30, 2022 | ||
| NOTES TO FINANCIAL STATEMENTS - continued |
Finally, the risk exists that losses could exceed amounts disclosed on the Statements of Assets and Liabilities. For the year ended September 30, 2022, the Funds did not hold any future contracts.
Expenses — Most expenses of the Trust can be directly attributed to a particular fund. Expenses which cannot be directly attributed to a particular fund are apportioned among the funds of the Trust based on the number of funds and/or relative net assets.
Cash — Idle cash may be swept into various time deposit accounts and is classified as cash on the Statements of Assets and Liabilities. The Funds maintain cash in bank deposit accounts which, at times may exceed United States federally insured limits. Amounts invested are available on the same business day.
Dividends and Distributions to Shareholders — The First Foundation Fixed Income Fund distributes its net investment income, if any, at least monthly. The First Foundation Total Return Fund distributes its net investment income, if any, at least annually. Any net realized capital gains are distributed annually. All distributions are recorded on ex-dividend date.
Reorganization fees — Reorganization fees of the Funds, including costs of printing the proxy statement/prospectus, legal fees, accounting fees, transfer agent and custodian conversion costs are being amortized to expense over a twelve month period. The Reorganization fees were split equally between the Funds and prorated between each Fund’s respective share classes. As of September 30, 2022, the Reorganization fees have been fully amortized.
Foreign Currency Translation — The books and records of the Funds are maintained in U.S. dollars. Investment securities and other assets and liabilities denominated in a foreign currency are translated into U.S. dollars on the date of valuation. The Funds do not isolate that portion of realized or unrealized gains and losses resulting from changes in the foreign exchange rate from fluctuations arising from changes in the market prices of the securities. These gains and losses are included in net realized and unrealized gains and losses on investments on the Statements of Operations. Net realized and unrealized gains and losses on foreign currency transactions represent net foreign exchange gains or losses from foreign currency exchange contracts, disposition of foreign currencies, currency gains or losses realized between trade and settlement dates on securities transactions and the difference between the amount of the investment income and foreign withholding taxes recorded on the Funds’ books and the U.S. dollar equivalent of the amounts actually received or paid.
42
| THE ADVISORS’ INNER CIRCLE FUND III | BROOKMONT FUNDS | |
| SEPTEMBER 30, 2022 | ||
| NOTES TO FINANCIAL STATEMENTS - continued |
Options Written/Purchased — The Funds may utilize options on securities or indices to varying degrees as part of their principal investment strategy. An option on a security is a contract that gives the holder of the option, in return for a premium, the right to buy from (in the case of a call) or sell to (in the case of a put) the writer of the option the security underlying the option at a specified exercise or “strike” price. The writer of an option on a security has the obligation upon exercise of the option to deliver the underlying security upon payment of the exercise price or to pay the exercise price upon delivery of the underlying security.
The risk in writing a call option is that the Funds give up the opportunity to profit if the market price of the security increases. The risk in writing a put option is that the Funds may incur a loss if the market price of the security decreases and the option is exercised. The risk in purchasing an option is that the Funds pay a premium whether or not the option is exercised. The Funds also have the additional risk of being unable to enter into a closing transaction at an acceptable price if a liquid secondary market does not exist. Option contracts also involve the risk that they may not work as intended due to unanticipated developments in market conditions or other causes.
For the year ended September 30, 2022, the Funds did not hold any option contracts.
Swap Contracts — The Funds are authorized to enter into swap contracts, including total return swaps and equity swap contracts. Swaps are a two-party contract in which the seller (buyer) will pay to the buyer (seller) the difference between the current value of a security and its value at the time the contract was entered. In a typical equity swap, one party agrees to pay another party the return on a stock, stock index or basket of stocks in return for a specified interest rate. By entering into an equity index swap, for example, the index receiver can gain exposure to stocks making up the index of securities without actually purchasing those stocks. Equity index swaps involve not only the risk associated with investment in the securities represented in the index, but also the risk that the performance of such securities, including dividends, will not exceed the return on the interest rate that the Fund will be committed to pay.
Total return swaps are contracts in which one party agrees to make payments of the total return from a reference instrument — which may be a single asset, a pool of assets or an index of assets — during a specified period, in return for payments equal to a fixed or floating rate of interest or the total return from another underlying reference instrument. The total return includes appreciation or depreciation on the underlying asset, plus
43
| THE ADVISORS’ INNER CIRCLE FUND III | BROOKMONT FUNDS | |
| SEPTEMBER 30, 2022 | ||
| NOTES TO FINANCIAL STATEMENTS - continued |
any interest or dividend payments. Payments under the swap are based upon an agreed upon principal amount but, since the principal amount is not exchanged, it represents neither an asset nor a liability to either counterparty, and is referred to as notional. Total return swaps are marked to market daily using different sources, including quotations from counterparties, pricing services, brokers or market makers. The unrealized appreciation or depreciation related to the change in the valuation of the notional amount of the swap is combined with the amount due to the Fund at termination or settlement. The primary risks associated with total return swaps are credit risks (if the counterparty fails to meet its obligations) and market risk (if there is no liquid market for the swap or unfavorable changes occur to the underlying reference instrument).
Periodic payments made or received are recorded as realized gains or losses. At year end, the Statements of Assets and Liabilities reflect, if any, unrealized appreciation or depreciation and accrued periodic payments for swap contracts the Fund may have open at year end. Entering into swap contracts involve, to varying degrees, elements of credit, interest rate and market risk in excess of the amounts recognized on the Statements of Assets and Liabilities. Such risks involve the possibility that there will be no liquid market for these contracts, that the counterparty to the contract may default on its obligation to perform and that there may be unfavorable changes in market conditions or fluctuations in interest rates. Swap contracts outstanding at year end, if any, are listed on the Schedules of Investments. In connection with swap contracts, cash or securities may be segregated as collateral by the Fund’s custodian. At September 30, 2022, the Funds did not hold swap contracts.
3. Transactions with Affiliates:
Certain officers of the Trust are also employees of SEI Investments Global Funds Services (the “Administrator”), a wholly owned subsidiary of SEI Investments Company, and/or SEI Investments Distribution Co. (the “Distributor”). Such officers are paid no fees by the Trust, other than the Chief Compliance Officer (“CCO”) as described below, for serving as officers of the Trust.
The services provided by the CCO and his staff are paid for by the Trust as incurred. The services include regulatory oversight of the Trust’s Advisors and service providers as required by SEC regulations. The CCO’s services and fees have been approved by and are reviewed by the Board.
On September 13, 2022, First Foundation Advisors made a capital contribution to the First Foundation Fixed Income Fund in the amount of $310,750. The capital transaction was made to reimburse the Fund for a loss associated with an
44
| THE ADVISORS’ INNER CIRCLE FUND III | BROOKMONT FUNDS | |
| SEPTEMBER 30, 2022 | ||
| NOTES TO FINANCIAL STATEMENTS - continued |
investment error. The contribution represented 0.17% of the Fund’s average net assets for the year ended September 30, 2022.
4. Administration, Distribution, Shareholder Servicing, Custodian and Transfer Agent Agreements:
The Funds and the Administrator are parties to an Administration Agreement under which the Administrator provides administration services to the Funds. For these services, the Administrator is paid an asset based fee, which will vary depending on the number of share classes and the average daily net assets of the Funds. For the year ended September 30, 2022, the First Foundation Fixed Income Fund and First Foundation Total Return Fund paid $211,864 and $112,451 respectively for these services.
Effective January 11, 2021, the Funds have adopted a distribution plan (the “Plan”) pursuant to Rule 12b-1 of the 1940 Act for Class A shares that allows the Funds to pay distribution and/or service fees for the sale and distribution of Fund shares, and for services provided to shareholders. Under the Plan, the Distributor or financial intermediaries may receive up to 0.25% of the average daily net assets of the Class A shares. Prior to January 11, 2021, the Predecessor Funds adopted a distribution plan (the “Predecessor Plan”) pursuant to Rule 12b-1 of the 1940 Act. The Predecessor Plan required the payment of a monthly service fee to NexPoint Securities, Inc. (“NexPoint”) at an annual rate of 0.25% of the average daily net assets attributable to Class A and Class C shares of the Predecessor Funds. The Predecessor Plan also required the payment of a monthly distribution fee to NexPoint at an annual rate of 0.75% of the average daily net assets attributable to Class C shares.
Brown Brothers Harriman & Co. acts as custodian (the “Custodian”) for the Funds. The Custodian plays no role in determining the investment policies of the Funds or which securities are to be purchased or sold by the Funds.
DST Systems, Inc., serves as the transfer agent and dividend disbursing agent for the Funds under a transfer agency agreement with the Trust. The Funds may earn cash management credits which can be used to offset transfer agent expenses. During the year ended September 30, 2022, the Fixed Income Fund and Total Return Fund earned credits of $4,933 and $3,038, respectively. These amounts are listed as “Fees Paid Indirectly” on the Statements of Operations.
45
| THE ADVISORS’ INNER CIRCLE FUND III | BROOKMONT FUNDS | |
| SEPTEMBER 30, 2022 | ||
| NOTES TO FINANCIAL STATEMENTS - continued |
5. Investment Advisory Agreement:
For its services to each Fund under the Advisory Agreement, the Adviser is entitled to a management fee, which is calculated daily and paid monthly, at the following annual rates based on the average daily net assets of each Fund:
| Fund | Advisory Fee | |||
| First Foundation Fixed Income Fund |
0.30% | |||
| First Foundation Total Return Fund |
0.50% | |||
For each Fund, until January 31, 2022, the Adviser had contractually agreed to reduce its fees and/or reimburse expenses to the extent necessary to keep total annual Fund operating expenses (excluding interest, taxes, brokerage commissions and other costs and expenses relating to the securities that are purchased and sold by the Fund, acquired fund fees and expenses, other expenditures which are capitalized in accordance with generally accepted accounting principles, non-routine expenses and any class-specific expenses (including distribution and/or service (12b-1) fees and shareholder servicing fees) (collectively, “excluded expenses”)) from exceeding 0.74% of the average daily net assets of each of the Fixed Income Fund’s share classes and 1.13% of the average daily net assets of each of the Total Return Fund’s share classes. This contractual agreement was terminated by the Adviser effective as of January 31, 2022. In addition, the Adviser may receive from the Fund the difference between the total annual Fund operating expenses (not including excluded expenses) and the contractual expense limit to recoup all or a portion of its prior fee waivers or expense reimbursements made during the rolling three-year period preceding the recoupment if at any point total annual Fund operating expenses (not including excluded expenses) are below the contractual expense limit (i) at the time of the fee waiver and/ or expense reimbursement and (ii) at the time of the recoupment.
For the year ended September 30, 2022, there were no previously waived fees reimbursed to the Funds by the Adviser.
First Foundation Advisors (“FFA” or the “Sub-Adviser”) serves as the investment sub-adviser to the Funds. FFA makes investment decisions for each Fund and continuously reviews, supervises and administers each Fund’s investment program. For its services to the Funds, FFA is entitled to receive from the Adviser a fee, which is calculated daily and paid monthly, at the following annual rates based on the average daily net assets of each Fund:
| Fund | Sub-Advisory Fee | |||
| First Foundation Fixed Income Fund |
0.15% | |||
| First Foundation Total Return Fund |
0.25% | |||
46
| THE ADVISORS’ INNER CIRCLE FUND III | BROOKMONT FUNDS | |
| SEPTEMBER 30, 2022 | ||
| NOTES TO FINANCIAL STATEMENTS - continued |
6. Share Transactions
| First Foundation Fixed Income Fund(1) |
First Foundation Total Return Fund(2) |
|||||||||||||||
| 10/1/2021 to 9/30/2022 |
10/1/2020 to 9/30/2021 |
10/1/2021 9/30/2022 |
10/1/2020 to 9/30/2021 |
|||||||||||||
| Class A: |
| |||||||||||||||
| Shares Issued |
12,213 | 60,894 | 13,902 | 24,000 | ||||||||||||
| Shares Issued in Lieu of Dividends and Distributions |
155,369 | 220,182 | 186,753 | 12,030 | ||||||||||||
| Shares Redeemed |
(811,661 | ) | (849,787 | ) | (188,079 | ) | (241,093) | |||||||||
| Total Increase (Decrease) in Net Assets Derived from Class A Transactions |
(644,079 | ) | (568,711 | ) | 12,576 | (205,063) | ||||||||||
| Class C(3): |
| |||||||||||||||
| Shares Issued |
– | 2 | – | 21 | ||||||||||||
| Shares Issued in Lieu of Dividends and Distributions |
– | 255 | – | – | ||||||||||||
| Shares Redeemed |
– | (131,810 | ) | – | (98,608) | |||||||||||
| Total Decrease in Net Assets Derived from Class C Transactions
|
– | (131,553 | ) | – | (98,587) | |||||||||||
| Class Y: |
| |||||||||||||||
| Shares Issued |
1,145,743 | 1,932,831 | 931,693 | 518,827 | ||||||||||||
| Shares Issued in Lieu of Dividends and Distributions |
318,203 | 378,890 | 239,275 | 13,273 | ||||||||||||
| Shares Redeemed |
(2,542,334 | ) | (1,658,655 | ) | (381,232 | ) | (296,548) | |||||||||
| Total Increase (Decrease) in Net Assets Derived from Class Y Transactions |
(1,078,388 | ) | 653,066 | 789,736 | 235,552 | |||||||||||
(1) On January 11, 2021, the Fixed Income Predecessor Fund was reorganized into the First Foundation Fixed Income Fund (the “Fixed Income Fund”). Class A and Class Y shares of the Fixed Income Predecessor Fund were exchanged on a tax-free basis for Class A and Class Y shares of the Fixed Income Fund. Information presented prior to January 11, 2021 is that of the Fixed Income Predecessor Fund.
(2) On January 11, 2021, the Total Return Predecessor Fund was reorganized into the First Foundation Total Return Fund (the “Total Return Fund”). Class A shares of the Total Return Predecessor Fund were exchanged on a tax-free basis for Class A shares of the Total Return Fund. Information presented prior to January 11, 2021 is that of the Total Return Predecessor Fund.
(3) On November 16, 2020, Class C Shares of each Predecessor Fund were converted to Class Y Shares of the applicable Predecessor Fund, and the Class C Shares were terminated.
47
| THE ADVISORS’ INNER CIRCLE FUND III | BROOKMONT FUNDS | |
| SEPTEMBER 30, 2022 | ||
| NOTES TO FINANCIAL STATEMENTS - continued |
7. Investment Transactions:
The cost of security purchases and the proceeds from security sales other than short-term securities, for the year ended September 30, 2022, were as follows:
| U.S. Gov’t | Other | Total | ||||||||||
| First Foundation Fixed Income Fund |
|
|||||||||||
| Purchases |
$ | 10,719,510 | $ | 13,239,328 | $ | 23,958,838 | ||||||
| Sales |
5,189,517 | 29,503,838 | 34,693,355 | |||||||||
| First Foundation Total Return Fund |
||||||||||||
| Purchases |
4,583,976 | 95,407,156 | 99,991,132 | |||||||||
| Sales |
149,405 | 87,758,636 | 87,908,041 | |||||||||
8. Federal Tax Information:
The amount and character of income and capital gain distributions to be paid, if any, are determined in accordance with Federal income tax regulations, which may differ from U.S. GAAP. These differences include (but are not limited to) investments organized as partnerships for tax purposes, passive foreign investment companies (PFICs), REITs, paydown gain (loss), foreign currency, convertible preferred, perpetual bond, losses deferred due to wash sale transactions, tax treatment of net investment loss and distributions in excess of net investment income. Reclassifications are made to the Fund’s capital accounts to reflect income and gains available for distribution (or available capital loss carryovers) under income tax regulations. The calculation of net investment income per share in the Financial Highlights table excludes these adjustments.
The permanent differences that are credited or charged to Paid-in Capital and Distributable Earnings as of September 30, 2022 are primarily attributable to distributions in excess of net investment income and partnerships and have been reclassified to/(from) the following accounts for year ended September 30, 2022.
| Distributable Earnings (Loss) |
Paid-in- Capital |
|||||||
| First Foundation Fixed Income Fund |
$ | 51,871 | $ | (51,871) | ||||
| First Foundation Total Return Fund |
117 | (117) | ||||||
48
| THE ADVISORS’ INNER CIRCLE FUND III | BROOKMONT FUNDS | |
| SEPTEMBER 30, 2022 | ||
| NOTES TO FINANCIAL STATEMENTS - continued |
At September 30, 2022, the components of Distributable Earnings (Accumulated Losses) on a tax basis were as follows:
| Fixed Income Fund | Total Return Fund | |||||||
| Undistributed Ordinary Income |
$ | 128,488 | $ | 3,612,474 | ||||
| Undistributed Long-Term Capital Gains |
– | 5,833,138 | ||||||
| Post October Losses |
(1,483,822 | ) | – | |||||
| Unrealized Depreciation |
(23,942,612 | ) | (3,732,296 | ) | ||||
| Other Temporary Differences |
(101,201 | ) | 3 | |||||
|
|
|
|||||||
| Net Distributable Earnings (Accumulated Losses) |
$ | (25,399,147 | ) | $ | 5,713,319 | |||
|
|
|
|||||||
Post-October losses represent losses realized on investment transactions from November 1, 2021 through September 30, 2022 that, in accordance with Federal income tax regulations, the Funds have elected to defer and treat as having arisen in the following fiscal year.
The other temporary differences are comprised of dividends payable and losses deferred to off-setting positions.
The tax character of distributions paid during the years ended September 30, 2022 and September 30, 2021 is as follows:
| Ordinary Income | Long-term Capital Gain | Return of Capital | Total | |||||||||||||
| First Foundation Fixed Income Fund |
||||||||||||||||
| 2022 | $ | 5,954,962 | $ | 151,510 | $ | — | $ | 6,106,472 | ||||||||
| 2021 | 8,125,328 | 21,103 | 277,429 | 8,423,860 | ||||||||||||
| First Foundation Total Return Fund |
||||||||||||||||
| 2022 | 7,158,729 | 5,240,554 | — | 12,399,283 | ||||||||||||
| 2021 | 676,640 | — | — | 676,640 | ||||||||||||
The Federal tax cost and gross unrealized appreciation and depreciation on investments (including foreign currency and derivatives, if applicable) held by the Funds at September 30, 2022 were as follows:
| Federal Tax Cost | Aggregated Gross Unrealized Appreciation |
Aggregated Gross Unrealized Depreciation |
Net Unrealized (Depreciation) |
|||||||||||||
| First Foundation Fixed Income Fund |
$ | 170,587,950 | $ | 508,407 | $ | (24,451,019) | $ | (23,942,612) | ||||||||
| First Foundation Total Return Fund |
95,274,328 | 6,244,623 | (9,976,919) | (3,732,296) | ||||||||||||
49
| THE ADVISORS’ INNER CIRCLE FUND III | BROOKMONT FUNDS | |
| SEPTEMBER 30, 2022 | ||
| NOTES TO FINANCIAL STATEMENTS - continued |
For Federal income tax purposes the difference between federal tax cost and book cost primarily relates to wash sales and investments in partnerships.
9. Concentration of Risks:
As with all mutual funds, there is no guarantee that the Fund will achieve its investment objective. You could lose money by investing in the Fund. A Fund share is not a bank deposit and is not insured or guaranteed by the FDIC or any government agency. The principal risk factors affecting shareholders’ investments in the Fund are set forth below. The following risks pertain to the Funds, unless otherwise noted.
Market Risk — The risk that the market value of a security may move up and down, sometimes rapidly and unpredictably. Market risk may affect a single issuer, an industry, a sector or the equity market as a whole. In addition, the impact of any epidemic, pandemic or natural disaster, or widespread fear that such events may occur, could negatively affect the global economy, as well as the economies of individual countries, the financial performance of individual companies and sectors, and the markets in general in significant and unforeseen ways. Any such impact could adversely affect the prices and liquidity of the securities and other instruments in which the Fund invests, which in turn could negatively impact the Fund’s performance and cause losses on your investment in the Fund.
Asset Allocation Risk (First Foundation Total Return Fund) — The Fund is subject to asset allocation risk, which is the risk that the Sub-Adviser’s allocation of the Fund’s assets among strategies will cause the Fund to underperform other funds with a similar investment objective and/or underperform the markets in which the Fund invests.
Liquidity Risk — The risk that certain securities may be difficult or impossible to sell at the time and price that the Fund would like. The Fund may have to lower the price of the security, sell other securities instead or forego an investment opportunity, any of which could have a negative effect on Fund management or performance. Liquidity risk may be heightened in the emerging market countries in which the Fund invests, as a result of their markets being less developed.
Equity Risk — Since it purchases equity securities, the Fund is subject to the risk that stock prices will fall over short or extended periods of time. Historically, the equity markets have moved in cycles, and the value of the Fund’s equity securities may fluctuate drastically from day to day. Individual companies may report poor results or be negatively affected by industry and/or economic trends
50
| THE ADVISORS’ INNER CIRCLE FUND III | BROOKMONT FUNDS | |
| SEPTEMBER 30, 2022 | ||
| NOTES TO FINANCIAL STATEMENTS - continued |
and developments. The prices of securities issued by such companies may suffer a decline in response. These factors contribute to price volatility.
Large Shareholder Risk (First Foundation Total Return Fund) — The risk that a significant percentage of the Fund’s shares may be owned or controlled by a large shareholder, such as other funds or accounts, including those of which the Adviser, the Sub-Adviser or an affiliate of the Adviser or Sub-Adviser, may have investment discretion. Accordingly, the Fund can be subject to the potential for large scale inflows and outflows as a result of purchases and redemptions made by significant shareholders. These inflows and outflows could be significant, could cause the Fund to sell securities at inopportune times in order to meet redemption requests, and could cause the Fund’s portfolio turnover rate and transaction costs to rise, which may negatively affect the Fund’s performance and have adverse tax consequences for Fund shareholders.
Real Estate Sector Risk — Securities of companies principally engaged In the real estate sector may be subject to the risks associated with the direct ownership of real estate. Risks commonly associated with the direct ownership of real estate include (i) changes in general economic and market conditions; (ii) changes In the value of real estate properties: (iii) risks related to local economic conditions, overbuilding and increased competition: (iv) increases in property taxes and operating expenses; (v) changes in zoning laws: (vi) casualty and condemnation losses; (vii) variations in rental income, neighborhood values or the appeal of property to tenants: (viii) the availability of financing; and (ix) changes in interest rates and quality of credit extended.
Value Style Risk (First Foundation Total Return Fund) — If the Sub-Adviser’s assessment of market conditions, or a company’s value or prospects for exceeding earnings expectations is wrong, the Fund could suffer losses or produce poor performance relative to other funds. In addition, “value stocks” can continue to be undervalued by the market for long periods of time.
Communications Sector Risk (First Foundation Total Return Fund) — Communications Sector Risk is the risk that the securities of, or financial instruments tied to the performance of, issuers in the Communications Sector that the Fund purchases will underperform the market as a whole. To the extent that the Fund’s investments are exposed to issuers conducting business in the Communications Sector (“Communications Companies”), the Fund is subject to legislative or regulatory changes, adverse market conditions and/or increased competition affecting the Communications Sector, The prices of the securities of Communications Companies may fluctuate widely due to both federal and state
51
| THE ADVISORS’ INNER CIRCLE FUND III | BROOKMONT FUNDS | |
| SEPTEMBER 30, 2022 | ||
| NOTES TO FINANCIAL STATEMENTS - continued |
regulations governing rates of return and services that may be offered, fierce competition for market share, and competitive challenges in the U.S. from foreign competitors engaged In strategic joint ventures with U.S. companies, and in foreign markets from both U.S. and foreign competitors. In addition, recent industry consolidation trends may lead to increased regulation of Communications Companies in their primary markets.
Counterparty Risk — There is a risk that the Fund may incur a loss arising from the failure of another party to a contract (the counterparty) to meet its obligations. Substantial losses can be incurred if a counterparty fails to deliver on its contractual obligations.
Credit Risk — The risk that the issuer of a security or, the counterparty to a contract, will default or otherwise become unable to honor a financial obligation.
Currency Risk — As a result of the Fund’s investments in securities or other investments denominated in, and/or receiving revenues in, foreign currencies, the Fund will be subject to currency risk. Currency risk is the risk that foreign currencies will decline in value relative to the U.S. dollar or, in the case of hedging positions, that the U.S. dollar will decline in value relative to the currency hedged. In either event, the dollar value of an investment in the Fund would be adversely affected. Currency exchange rates may fluctuate in response to, among other things, changes in interest rates, intervention (or failure to intervene) by U.S. or foreign governments, central banks or supranational entities, or by the imposition of currency controls or other political developments in the United States or abroad.
Fixed Income Market Risk — The prices of the Fund’s fixed income securities respond to economic developments, particularly interest rate changes, as well as to perceptions about the creditworthiness of individual issuers, including governments and their agencies. Generally, the Fund’s fixed income securities will decrease in value if interest rates rise and vice versa. In a low interest rate environment, risks associated with rising rates are heightened. Declines in dealer market-making capacity as a result of structural or regulatory changes could decrease liquidity and/or increase volatility in the fixed income markets. In the case of foreign securities, price fluctuations will reflect international economic and political events, as well as changes in currency valuations relative to the U.S. dollar. In response to these events, the Fund’s value may fluctuate and/or the Fund may experience increased redemptions from shareholders, which may impact the Fund’s liquidity or force the Fund to sell securities into a declining or illiquid market.
52
| THE ADVISORS’ INNER CIRCLE FUND III | BROOKMONT FUNDS | |
| SEPTEMBER 30, 2022 | ||
| NOTES TO FINANCIAL STATEMENTS - continued |
Derivatives Risk — The Fund’s use of futures contracts, options, and swaps is subject to market risk, leverage risk, correlation risk and liquidity risk. Liquidity risk and market risk are described elsewhere in this section. Correlation risk is the risk that changes in the value of the derivative may not correlate perfectly with the underlying asset, rate or index. Each of these risks could cause the Fund to lose more than the principal amount invested in a derivative instrument. Some derivatives have the potential for unlimited loss, regardless of the size of the Fund’s initial investment. The Fund’s use of derivatives may also increase the amount of taxes payable by shareholders. Both U.S. and non-U.S. regulators have adopted and are in the process of adopting and implementing regulations governing derivatives markets, the ultimate impact of which remains unclear.
Foreign investment/Emerging Markets Risk — The risk that non-U.S. securities may be subject to additional risks due to, among other things, political, social and economic developments abroad, currency movements and different legal, regulatory and tax environments. These additional risks may be heightened with respect to emerging market countries because political turmoil and rapid changes in economic conditions are more likely to occur in these countries. In addition, periodic U.S. Government restrictions on Investments in Issuers from certain non-U.S. countries may require the Fund to sell such investments at inopportune times which could result in losses to the Fund.
Investments In Investment Company Risk — When the Fund invests in an investment company, including closed-end funds and ETFs, in addition to directly bearing the expenses associated with its own operations, it will bear a pro rata portion of the investment company’s expenses. Further, while the risks of owning shares of an investment company generally reflect the risks of owning the underlying investments of the Investment Company, the Fund may be subject to additional or different risks than if the Fund had invested directly in the underlying investments. For example, the lack of liquidity in an ETF could result in its share price being more volatile than that of the underlying portfolio securities. Certain closed-end investment companies issue a fixed number of shares that trade on a stock exchange at a premium or a discount to their net asset value (“NAV”). As a result, a closed-end fund’s share price fluctuates based on what another investor is willing to pay rather than on the market value of the securities in the fund.
Growth Style Risk (First Foundation Total Return Fund) — If a growth company does not meet the Sub-Adviser’s expectations that its earnings will increase at a certain rate, the price of its stock may decline significantly, even if it has increased earnings. Many growth companies do not pay dividends. Companies that do not pay dividends often have greater stock price declines during market
53
| THE ADVISORS’ INNER CIRCLE FUND III | BROOKMONT FUNDS | |
| SEPTEMBER 30, 2022 | ||
| NOTES TO FINANCIAL STATEMENTS - continued |
downturns. Over time, a growth investing style may go in and out of favor, and when out of favor, may cause the Fund to underperform other funds that use differing investing styles.
Hedging Risk (First Foundation Total Return Fund) — Hedging risk is the risk that instruments used for hedging purposes may also limit any potential gain that may result from the increase in value of the hedged asset. To the extent that the Fund engages in hedging strategies, there can be no assurance that such strategy will be effective or that there will be a hedge in place at any given time.
Below Investment Grade Securities (Junk Bonds) Risk — Fixed income securities rated below investment grade (junk bonds) involve greater risks of default or downgrade and are generally more volatile than investment grade securities because the prospect for repayment of principal and interest of many of these securities is speculative. Because these securities typically offer a higher rate of return to compensate investors for these risks, they are sometimes referred to as “high yield bonds”, but there is no guarantee that an investment in these securities will result in a high rate of return.
Interest Rate Risk — The risk that a rise in interest rates will cause a fall in the value of fixed income securities, including U.S. Government securities, in which the Fund invests. Although U.S. Government securities are considered to be among the safest investments, they are not guaranteed against price movements due to changing interest rates. A low interest rate environment may present greater interest rate risk because there may be a greater likelihood of rates increasing and rates may increase more rapidly. Interest rate risk may be heightened for investments in emerging market countries.
Large Capitalization Company Risk — The risk that larger, more established companies may be unable to respond quickly to new competitive challenges such as changes in technology and consumer tastes. Larger companies also may not be able to attain the high growth rates of successful smaller companies.
Small-and-Mid-Capitalization Company Risk — The small and mid-capitalization companies in which the Fund may invest may be more vulnerable to adverse business or economic events than larger, more established companies. In particular, investments in these small- and mid-sized companies may pose additional risks, including liquidity risk because these companies tend to have limited product lines markets and financial resources, and may depend upon a relatively small management group. Therefore, small- and mid-cap stocks may be more volatile than those of larger companies. These securities may be traded over-the-counter or listed on an exchange.
54
| THE ADVISORS’ INNER CIRCLE FUND III | BROOKMONT FUNDS | |
| SEPTEMBER 30, 2022 | ||
| NOTES TO FINANCIAL STATEMENTS - continued |
Micro-Capitalization Company Risk (First Foundation Total Return Fund) — Micro-capitalization companies may be newly formed or in the early stages of development with limited product lines, markets or financial resources. Therefore, micro-capitalization companies may be less financially secure than large-, mid-and small-capitalization companies and may be more vulnerable to key personnel losses due to reliance on a smaller number of management personnel. In addition, there may be less public information available about these companies. Micro-cap stock prices may be more volatile than large-, mid- and small-capitalization companies and such stocks may be more thinly traded and thus difficult for the Fund to buy and sell in the market.
Mortgage-Backed Securities Risk — Mortgage-backed securities are affected significantly by the rate of prepayments and modifications of the mortgage loans backing those securities, as well as by other factors such as borrower defaults, delinquencies, realized or liquidation losses and other shortfalls. Mortgage-backed securities are particularly sensitive to prepayment risk, which is described below, given that the term to maturity for mortgage loans is generally substantially longer than the expected lives of those securities; however, the timing and amount of prepayments cannot be accurately predicted. The timing of changes in the rate of prepayments of the mortgage loans may significantly affect the Fund’s actual yield to maturity on any mortgage-backed securities, even if the average rate of principal payments is consistent with the Fund’s expectation. Along with prepayment risk, mortgage-backed securities are significantly affected by interest rate risk, which is described above. In a low interest rate environment, mortgage loan prepayments would generally be expected to increase due to factors such as refinancing’s and loan modifications at lower Interest rates. In contrast, if prevailing interest rates rise prepayments of mortgage loans would generally be expected to decline and therefore extend the weighted average lives of mortgage-backed securities held or acquired by the Fund.
Cyber Security Risk — The Fund and its service providers may be susceptible to operational and information security risks resulting from a breach In cyber security, including cyber-attacks. Cyber-attacks may interfere with the processing of shareholder transactions, impact the Fund’s ability to calculate its NAV, cause the release of private shareholder Information or confidential company Information, impede redemptions, subject the Fund to regulatory fines or financial losses, and cause reputational damage. Similar types of cyber security risks are also present for issuers of securities in which the Fund invests.
Prepayment Risk — The risk that, in a declining interest environment fixed income securities with stated interest rates may have the principal paid earlier than expected, requiring the Fund to invest the proceeds at generally lower interest rates.
55
| THE ADVISORS’ INNER CIRCLE FUND III | BROOKMONT FUNDS | |
| SEPTEMBER 30, 2022 | ||
| NOTES TO FINANCIAL STATEMENTS - continued |
Portfolio Turnover Risk (First Foundation Total Return Fund) — Due to its investment strategy, the Fund may buy and sell securities frequently. This may result in higher transaction costs and additional capital gains tax liabilities, which may affect the Fund’s performance.
REITs Risk — REITs are pooled investment vehicles that own, and usually operate income-producing real estate or finance real estate. REITs are susceptible to the risks associated with direct ownership of real estate, as discussed elsewhere in this section. REITs typically incur fees that are separate from those of the Fund. Accordingly, the Fund’s investments in REITs will result in the layering of expenses such that shareholders will indirectly bear a proportionate share of the REITs’ operating expenses, in addition to paying Fund expenses.
Restricted Securities Risk (First Foundation Total Return Fund) — Investments in restricted securities may be illiquid. Although these securities may be resold in privately negotiated transactions, the prices realized from these sales could be less than those originally paid by the Fund or less than what may be considered the fair value of such securities. Further, restricted securities may not be subject to the disclosure and other investor protection requirements that might be applicable to unrestricted securities. In order to sell restricted securities, the Fund may have to bear the expense of registering the securities for resale and the risk of substantial delays in effecting the registration. Other transaction costs may be higher for restricted securities than unrestricted securities.
LIBOR Replacement Risk — The elimination of the London Inter-Bank Offered Rate (“LIBOR”) may adversely affect the interest rates on, and value of, certain Fund investments for which the value is tied to LIBOR. The U.K. Financial Conduct Authority has announced that it intends to stop compelling or inducing banks to submit LIBOR rates after 2021. On March 5, 2021, the administrator of LIBOR clarified that the publication of LIBOR on a representative basis will cease for the one-week and two-month U.S. dollar LIBOR settings immediately after December 31, 2021, and for the remaining U.S. dollar LIBOR settings immediately after June 30, 2023. Alternatives to LIBOR are established or in development in most major currencies, including the Secured Overnight Financing Rate (“SOFR”), which is intended to replace U.S. dollar LIBOR. Markets are slowly developing in response to these new rates. Questions around liquidity impacted by these rates, and how to appropriately adjust these rates at the time of transition, remain a concern for the Fund. Accordingly, it is difficult to predict the full impact of the transition away from LIBOR on the Fund until new reference rates and fallbacks for both legacy and new products, instruments and contracts are commercially accepted.
56
| THE ADVISORS’ INNER CIRCLE FUND III | BROOKMONT FUNDS | |
| SEPTEMBER 30, 2022 | ||
| NOTES TO FINANCIAL STATEMENTS - continued |
Asset-Backed Securities Risk (First Foundation Fixed Income Fund) — Payment of principal and interest on asset-backed securities is dependent largely on the cash flows generated by the assets backing the securities. Securitization trusts generally do not have any assets or sources of funds other than the receivables and related property they own, and asset-backed securities are generally not insured or guaranteed by the related sponsor or any other entity. Asset-backed securities may be more illiquid than more conventional types of fixed-income securities that the Fund may acquire.
Financials Sector Risk (First Foundation Fixed Income Fund) — The Fund is subject to the risk that the securities of issuers in the Financials Sector will underperform the market as a whole due to legislative or regulatory changes, adverse market conditions and/or increased competition affecting the Financials Sector. Companies operating in the Financials Sector are subject to extensive government regulation, which may limit the financial commitments they can make and the interest rates and fees they can charge. Profitability is largely dependent on the availability and cost of capital funds, and can fluctuate significantly when interest rates change or due to increased competition.
Preferred Stock Risk (First Foundation Fixed Income Fund) — Preferred stocks are nonvoting equity securities that pay a stated fixed or variable rate of return. Preferred stocks are subject to issuer-specific risks (such as credit risk) and market risks applicable generally to equity securities. The market value of preferred stocks generally decreases when interest rates rise. Preferred stocks generally are subordinated to bonds and other debt instruments in a company’s capital structure in terms of priority to corporate income and liquidation payments and, therefore, will be subject to greater credit risk than the company’s bonds and other debt instruments. Preferred stock may also be subject to prepayment risk, which is discussed below.
Municipal Securities Risk (First Foundation Fixed Income Fund) — Municipal securities, like other fixed income securities, rise and fall in value in response to economic and market factors, primarily changes in interest rates, and actual or perceived credit quality. Rising interest rates will generally cause municipal securities to decline in value. Longer-term securities respond more sharply to interest rate changes than do shorter-term securities. A municipal security will also lose value if, due to rating downgrades or other factors, there are concerns about the issuer’s current or future ability to make principal or interest payments. State and local governments rely on taxes and, to some extent, revenues from private projects financed by municipal securities, to pay interest and principal on municipal debt. Poor statewide or local economic results or changing political
57
| THE ADVISORS’ INNER CIRCLE FUND III | BROOKMONT FUNDS | |
| SEPTEMBER 30, 2022 | ||
| NOTES TO FINANCIAL STATEMENTS - concluded |
sentiments may reduce tax revenues and increase the expenses of municipal issuers, making it more difficult for them to meet their obligations. Actual or perceived erosion of the creditworthiness of municipal issuers may reduce the value of the Fund’s holdings. As a result, the Fund will be more susceptible to factors that adversely affect issuers of municipal obligations than a mutual fund that does not have as great a concentration in municipal obligations.
10. Other:
At September 30, 2022, the percentage of total shares outstanding held by shareholders owning 10% or greater for the Funds, which are comprised of individual shareholders and omnibus accounts that are held on behalf of various individual shareholders was as follows:
| No.
of Shareholders |
% Ownership |
|||||||
| First Foundation Fixed Income Fund, Class A |
1 | 14 | % | |||||
| First Foundation Fixed Income Fund, Class Y |
1 | 90 | % | |||||
| First Foundation Total Return Fund, Class Y |
1 | 77 | % | |||||
In the normal course of business, the Funds enter into contracts that provide general indemnifications. The Funds’ maximum exposure under these arrangements is dependent on future claims that may be made against the Funds and, therefore, cannot be established; however, based on experience, the risk of loss from such claim is considered remote.
11. Subsequent Events:
On September 7, 2021, Brown Brothers Harriman & Co. (“BBH”), the Funds’ custodian, announced that it had entered into an agreement with State Street Bank and Trust Company (“State Street”) to sell BBH’s Investor Services business to State Street (the “Transaction”). The Transaction is subject to certain closing conditions, including regulatory and customary approvals, and it is expected to be consummated in the first quarter of 2023 or it may be delayed until a later date (the “Closing Date”). In addition, there is an increasing potential that the Transaction may be cancelled altogether. Assuming the Transaction is consummated, it is expected that State Street will replace BBH as the Funds’ custodian effective as of the Closing Date.
The Funds have evaluated the need for additional disclosures and/or adjustments resulting from subsequent events through the date the financial
statements were issued. Based on this evaluation, no additional disclosures and/or adjustments were required to the financial statements as of September 30, 2022.
58
| THE ADVISORS’ INNER CIRCLE FUND III | BROOKMONT FUNDS | |
| SEPTEMBER 30, 2022 | ||
REPORT OF INDEPENDENT REGISTERED PUBLIC ACCOUNTING FIRM
To the Shareholders of First Foundation Fixed Income Fund and First Foundation Total Return Fund and the Board of Trustees of The Advisors’ Inner Circle Fund III:
Opinion on the Financial Statements and Financial Highlights
We have audited the accompanying statements of assets and liabilities of First Foundation Fixed Income Fund and First Foundation Total Return Fund, (collectively the “Funds”), two of the funds constituting The Advisors’ Inner Circle Fund III, including the schedules of investments, as of September 30, 2022, the related statements of operations for the year then ended, the statements of changes in net assets and financial highlights for each of the two years in the period then ended, and the related notes. In our opinion, the financial statements and financial highlights present fairly, in all material aspects, the financial position of each of the Funds constituting the Advisors’ Inner Circle Fund III as of September 30, 2022, and the results of their operations for the year then ended, the changes in their net assets and the financial highlights for each of the two years in the period then ended, in conformity with accounting principles generally accepted in the United States of America. The financial highlights of the Funds, for the year ended September 30, 2020, were audited by other auditors whose report, dated November 30, 2020, expressed an unqualified opinion on those financial highlights. The financial highlights of the Funds, for the years ended September 30, 2019, and 2018, respectively, were audited by other auditors whose report, dated November 27, 2019, expressed an unqualified opinion on those financial highlights.
Basis for Opinion
These financial statements and financial highlights are the responsibility of the Funds’ management. Our responsibility is to express an opinion on the Funds’ financial statements and financial highlights based on our audits. We are a public accounting firm registered with the Public Company Accounting Oversight Board (United States) (PCAOB) and are required to be independent with respect to the Funds in accordance with the U.S. federal securities laws and the applicable rules and regulations of the Securities and Exchange Commission and the PCAOB.
We conducted our audits in accordance with the standards of the PCAOB. Those standards require that we plan and perform the audit to obtain reasonable assurance about whether the financial statements and financial highlights are free of material misstatement, whether due to error or fraud. The Funds are not required to have, nor were we engaged to perform, an audit of their internal control over financial reporting. As part of our audits, we are required to obtain an understanding of internal control over financial reporting but not for the purpose of expressing an opinion on the effectiveness of the Funds’ internal control over financial reporting. Accordingly, we express no such opinion.
Our audits included performing procedures to assess the risks of material misstatement of the financial statements and financial highlights, whether due to error or fraud, and performing procedures that respond to those risks. Such procedures included examining, on a test basis, evidence regarding the amounts and disclosures in the financial statements and financial highlights. Our audits also included evaluating the accounting principles used and significant estimates made by management, as well as evaluating the overall presentation of the financial statements and financial highlights. Our procedures included confirmation of securities owned as of September 30, 2022, by correspondence with the custodian and brokers; when replies were not received from brokers, we performed other auditing procedures. We believe that our audits provide a reasonable basis for our opinion.
Deloitte & Touche LLP
Philadelphia, Pennsylvania
November 23, 2022
We have served as the auditor of one or more of The Advisors’ Inner Circle Fund III investment companies since 2017.
59
| THE ADVISORS’ INNER CIRCLE FUND III | BROOKMONT FUNDS | |
| SEPTEMBER 30, 2022 | ||
All mutual funds have operating expenses. As a shareholder of a mutual fund, your investment is affected by these ongoing costs, which include (among others) costs for Fund management, administrative services, and shareholder reports like this one. It is important for you to understand the impact of these costs on your investment returns.
Operating expenses such as these are deducted from the mutual fund’s gross income and directly reduce your final investment return. These expenses are expressed as a percentage of the mutual fund’s average net assets; this percentage is known as the mutual fund’s expense ratio.
The following examples use the expense ratio and are intended to help you understand the ongoing costs (in dollars) of investing in your Fund and to compare these costs with those of other mutual funds. The examples are based on an investment of $1,000 made at the beginning of the period shown and held for the entire period from April 1, 2022 to September 30, 2022.
The table on the next page illustrates your Fund’s costs in two ways:
Actual Fund Return. This section helps you to estimate the actual expenses after fee waivers that your Fund incurred over the period. The “Expenses Paid During Period” column shows the actual dollar expense cost incurred by a $1,000 investment in the Fund, and the “Ending Account Value” number is derived from deducting that expense cost from the Fund’s gross investment return.
You can use this information, together with the actual amount you invested in the Fund, to estimate the expenses you paid over that period. Simply divide your ending starting account value by $1,000 to arrive at a ratio (for example, an $8,600 account value divided by $1,000 = 8.6), then multiply that ratio by the number shown for your Fund under “Expenses Paid During Period.”
Hypothetical 5% Return. This section helps you compare your Fund’s costs with those of other mutual funds. It assumes that the Fund had an annual 5% return before expenses during the year, but that the expense ratio (Column 3) for the period is unchanged. This example is useful in making comparisons because the Securities and Exchange Commission requires all mutual funds to make this 5% calculation. You can assess your Fund’s comparative cost by comparing the hypothetical result for your Fund in the “Expenses Paid During Period” column with those that appear in the same charts in the shareholder reports for other mutual funds.
60
| THE ADVISORS’ INNER CIRCLE FUND III | BROOKMONT FUNDS | |
| SEPTEMBER 30, 2022 | ||
| DISCLOSURE OF FUND EXPENSES – (Unaudited) concluded |
Note: Because the return is set at 5% for comparison purposes — NOT your Fund’s actual return — the account values shown may not apply to your specific investment.
| Beginning Account Value 4/1/22 |
Ending Account Value 9/30/22 |
Annualized Expense Ratios |
Expenses Period* |
|||||||||||
| First Foundation Fixed Income Fund |
| |||||||||||||
| Actual Fund Return |
| |||||||||||||
| Class A |
$1,000.00 | $ | 913.50 | 1.04 | % | $ | 4.99 | |||||||
| Class Y |
1,000.00 | 914.50 | 0.79 | 3.79 | ||||||||||
| Hypothetical |
| |||||||||||||
| Class A |
$1,000.00 | $ | 1,019.85 | 1.04 | % | $ | 5.27 | |||||||
| Class Y |
1,000.00 | 1,021.11 | 0.79 | 4.00 | ||||||||||
| First Foundation Total Return Fund |
| |||||||||||||
| Actual Fund Return |
| |||||||||||||
| Class A |
$1,000.00 | $ | 867.00 | 1.32 | % | $ | 6.18 | |||||||
| Class Y |
1,000.00 | 867.80 | 1.07 | 5.01 | ||||||||||
| Hypothetical |
| |||||||||||||
| Class A |
$1,000.00 | $ | 1,018.45 | 1.32 | % | $ | 6.68 | |||||||
| Class Y |
1,000.00 | 1,019.70 | 1.07 | 5.42 | ||||||||||
| * | Expenses are equal to the Fund’s annualized expense ratio multiplied by the average account value over the period, multiplied by 183/365. |
61
| THE ADVISORS’ INNER CIRCLE FUND III | BROOKMONT FUNDS | |
| SEPTEMBER 30, 2022 | ||
| TRUSTEES AND OFFICERS OF THE ADVISORS’ INNER CIRCLE FUND III (Unaudited) |
Set forth below are the names, years of birth, positions with the Trust, length of term of office, and the principal occupations for the last five years of each of the persons currently serving as Trustees and Officers of the Trust. Unless otherwise noted, the business address of each Trustee is SEI Investments Company, One Freedom Valley Drive, Oaks Pennsylvania 19456. Trustees who are deemed not to be “interested persons” are referred to as “Independent Trustees.” Mr. Doran is
| Name and Year of Birth | Position with Trust and length of Time Served1 |
Principal Occupation in the Past Five Years | ||
| INTERESTED TRUSTEES2 3
|
||||
| William M. Doran (Born: 1940) |
Chairman of Board of Trustees (since 2014) |
Self-Employed Consultant since 2003. Partner at Morgan, Lewis & Bockius LLP (law firm) from 1976 to 2003. Counsel to the Trust, SEI Investments, SIMC, the Administrator and the Distributor. Secretary of SEI Investments since 1978.
| ||
| INDEPENDENT TRUSTEES3
|
||||
| Jon C. Hunt (Born: 1951) |
Trustee and Lead Independent Trustee (since 2014) |
Retired since 2013. Consultant to Management, Convergent Capital Management, LLC (“CCM”) from 2012 to 2013. Managing Director and Chief Operating Officer, CCM from 1998 to 2012.
| ||
| Thomas P. Lemke (Born: 1954) |
Trustee (since 2014) |
Retired since 2013. Executive Vice President and General Counsel, Legg Mason, Inc. from 2005 to 2013.
|
| 1 | Each Trustee shall hold office during the lifetime of this Trust until the election and qualification of his or her successor, or until he or she sooner dies, resigns, or is removed in accordance with the Trust’s Declaration of Trust. |
| 2 | Denotes Trustees who may be deemed to be “interested” persons of the Fund as that term is defined in the 1940 Act by virtue of their affiliation with the Distributor and/or its affiliates. |
| 3 | Trustees oversee 65 funds in The Advisors’ Inner Circle Fund III. |
62
| THE ADVISORS’ INNER CIRCLE FUND III | BROOKMONT FUNDS | |
| SEPTEMBER 30, 2022 | ||
a Trustee who may be deemed to be “interested” person of the Trust as that term is defined in the 1940 Act by virtue of their affiliation with the Trust’s Distributor. The Trust’s Statement of Additional Information (“SAI”) includes additional information about the Trustees and Officers. The SAI may be obtained without charge by calling 1-800-838-0191. The following chart lists Trustees and Officers as of September 30, 2022.
| Other Directorships Held in the Past Five Years4 |
| Current Directorships: Trustee of Gallery Trust, Delaware Wilshire Private Markets Master Fund, Delaware Wilshire Private Markets Fund, Delaware Wilshire Private Markets Tender Fund, SEI Daily Income Trust, SEI Institutional International Trust, SEI Institutional Investments Trust, SEI Institutional Managed Trust, SEI Asset Allocation Trust, SEI Tax Exempt Trust, Adviser Managed Trust, New Covenant Funds, SEI Insurance Products Trust and SEI Catholic Values Trust. Director of SEI Investments, SEI Investments (Europe), Limited, SEI Investments—Global Funds Services, Limited, SEI Investments Global, Limited, SEI Investments (Asia), Limited, SEI Global Nominee Ltd., SEI Investments – Unit Trust Management (UK) Limited and SEI Investments Co. Director of the Distributor.
Former Directorships: Trustee of Winton Series Trust to 2017. Trustee of The Advisors’ Inner Circle Fund, The Advisors’ Inner Circle Fund II, Bishop Street Funds, The KP Funds and Winton Diversified Opportunities Fund (closed-end investment company) to 2018. Trustee of Schroder Global Series Trust to 2021. Trustee of Schroder Series Trust to 2022.
|
|
|
|
Current Directorships: Trustee of City National Rochdale Funds, Gallery Trust, Delaware Wilshire Private Markets Master Fund, Delaware Wilshire Private Markets Fund and Delaware Wilshire Private Markets Tender Fund. Director of Chiron Capital Allocation Fund Ltd.
Former Directorships: Trustee of O’Connor EQUUS (closed-end investment company) to 2016. Member of Independent Committee of Nuveen Commodities Asset Management to 2016. Trustee of Winton Series Trust to 2017. Trustee of Winton Diversified Opportunities Fund (closed-end investment company) to 2018. Trustee of Schroder Global Series Trust to 2021. Trustee of Schroder Series Trust to 2022.
|
| Current Directorships: Trustee of Gallery Trust, Delaware Wilshire Private Markets Master Fund, Delaware Wilshire Private Markets Fund, Delaware Wilshire Private Markets Tender Fund, JP Morgan Active Exchange-Traded Funds (171 Portfolios) and Symmetry Panoramic Trust (16 Portfolios). Director of Chiron Capital Allocation Fund Ltd.
Former Directorships: Trustee of Winton Series Trust and AXA Premier VIP Trust to 2017. Trustee of Winton Diversified Opportunities Fund (closed-end investment company) to 2018. Trustee of Schroder Global Series Trust to 2021. Trustee of Schroder Series Trust to 2022.
|
| 4. Directorships of Companies required to report to the Securities and Exchange Commission under the Securities Exchange act of 1934 (i.e., “public companies”) or other investment companies under the 1940 Act. |
63
| THE ADVISORS’ INNER CIRCLE FUND III | BROOKMONT FUNDS | |
| SEPTEMBER 30, 2022 | ||
| Name and Year of Birth | Position with the Trust and Length of Time Served1 |
Principal Occupation During the Past Five Years | ||
| INDEPENDENT TRUSTEES (continued)2
| ||||
| Nichelle Maynard-Elliott (Born: 1968) |
Trustee (since 2021) |
Independent Director since 2018. Executive Director, M&A at Praxair Inc. from 2011-2019.
| ||
| Jay C. Nadel (Born: 1958) |
Trustee (since 2016) |
Self-Employed Consultant since 2004. Executive Vice President, Bank of New York Broker Dealer from 2002 to 2004. Partner/Managing Director, Weiss Peck & Greer/Robeco from 1986 to 2001.
| ||
| Randall S. Yanker (Born: 1960) |
Trustee (since 2014) |
Co-Founder and Senior Partner, Alternative Asset Managers, L.P. since 2004.
| ||
| OFFICERS
|
||||
| Michael Beattie (Born: 1965) |
President (since 2014) |
Director of Client Service, SEI Investments Company, since 2004.
| ||
| James Bernstein (Born: 1962) |
Vice President (since 2017)
Secretary (since 2020) |
Attorney, SEI Investments, since 2017.
Prior Positions: Self-employed consultant, 2017. Associate General Counsel & Vice President, Nationwide Funds Group and Nationwide Mutual Insurance Company, from 2002 to 2016. Assistant General Counsel & Vice President, Market Street Funds and Provident Mutual Insurance Company, from 1999 to 2002.
| ||
| John Bourgeois (Born: 1973) |
Assistant Treasurer (since 2017) |
Fund Accounting Manager, SEI Investments, since 2000.
| ||
1 Each Trustee shall hold office during the lifetime of this Trust until the election and qualification of his or her successor, or until he or she sooner dies, resigns, or is removed in accordance with the Trust’s Declaration of Trust.
2 Trustees oversee 65 funds in The Advisors’ Inner Circle Fund III.
3 Directorships of Companies required to report to the Securities and Exchange Commission under the Securities Exchange Act of 1934 (i.e., “public companies”) or other investment companies under the 1940 Act.
64
| THE ADVISORS’ INNER CIRCLE FUND III | BROOKMONT FUNDS | |
| SEPTEMBER 30, 2022 | ||
|
Other Directorships Held in the Past Five Years3 |
|
|
Current Directorships: Trustee of Gallery Trust, Delaware Wilshire Private Markets Master Fund, Delaware Wilshire Private Markets Fund, Delaware Wilshire Private Markets Tender Fund. Director of Chiron Capital Allocation Fund Ltd. Director of Element Solutions Inc., Director of Xerox Holdings Corporation, and Director Nominee for Lucid Group, Inc.
Former Directorships: Trustee of Schroder Global Series Trust to 2021. Trustee of Schroder Series Trust to 2022.
Current Directorships: Chairman of the Board of Trustees of City National Rochdale Funds. Trustee of Gallery Trust, Delaware Wilshire Private Markets Master Fund, Delaware Wilshire Private Markets Fund and Delaware Wilshire Private Markets Tender Fund. Director of Chiron Capital Allocation Fund Ltd.
Former Directorships: Trustee of Winton Series Trust to 2017. Director of Lapolla Industries, Inc. to 2017. Trustee of Winton Diversified Opportunities Fund (closed-end investment company) to 2018. Trustee of Schroder Global Series Trust to 2021. Trustee of Schroder Series Trust to 2022.
Current Directorships: Trustee of Gallery Trust, Delaware Wilshire Private Markets Master Fund, Delaware Wilshire Private Markets Fund and Delaware Wilshire Private Markets Tender Fund. Independent Non-Executive Director of HFA Holdings Limited. Director of Chiron Capital Allocation Fund Ltd.
Former Directorships: Trustee of Winton Series Trust to 2017. Trustee of Winton Diversified Opportunities Fund (closed-end investment company) to 2018. Trustee of Schroder Global Series Trust to 2021. Trustee of Schroder Series Trust to 2022.
| None. |
| None. |
| None. |
65
| THE ADVISORS’ INNER CIRCLE FUND III | BROOKMONT FUNDS | |
| SEPTEMBER 30, 2022 | ||
| Name and Year of Birth | Position with Trust and Length of Time Served |
Principal Occupation During the Past Five Years | ||
| OFFICERS (continued) |
||||
| Eric C. Griffith (Born: 1969) |
Vice President and Assistant Secretary (since 2020) |
Counsel at SEI Investments since 2019. Vice President and Assistant General Counsel, JPMorgan Chase & Co., from 2012 to 2018.
| ||
| Matthew M. Maher (Born: 1975) |
Vice President and Assistant Secretary (since 2018) |
Counsel at SEI Investments since 2018. Attorney, Blank Rome LLP, from 2015 to 2018. Assistant Counsel & Vice President, Bank of New York Mellon, from 2013 to 2014. Attorney, Dilworth Paxson LLP, from 2006 to 2013.
| ||
| Andrew Metzger (Born: 1980) |
Treasurer, Controller and Chief Financial Officer (since 2021) |
Director of Fund Accounting, SEI Investments, since 2020. Senior Director, Embark, from 2019 to 2020. Senior Manager, PricewaterhouseCoopers LLP, from 2002 to 2019.
| ||
| Robert Morrow (Born: 1968)
|
Vice President (since 2017) |
Account Manager, SEI Investments, since 2007. | ||
| Stephen F. Panner (Born: 1970) |
Chief Compliance Officer (since 2022) |
Chief Compliance Officer of SEI Asset Allocation Trust, SEI Daily Income Trust, SEI Daily Income Trust, SEI Institutional Investment Managed Trust, SEI Tax Exempt Trust, Adviser Managed Trust, New Covenant Funds, SEI Catholic Values Trust, SEI Exchange Traded Funds, SEI Structured Credit Fund LP, The Advisors’ Inner Circle Fund, The Advisors’ Inner Circle Fund II, The Advisors’ Inner Circle Fund III, Bishop Street Funds, Frost Family of Funds, Gallery Trust, Delaware Wilshire Private Markets Fund, Delaware Wilshire Private Markets Master Fund, Delaware Wilshire Private Markets Tender Fund and Catholic Responsible Investments Funds since September 2022. Fund Compliance Officer of SEI Investments Company from February 2011 to September 2022. Fund Accounting Director and CFO and Controller for the SEI Funds from July 2005 to February 2011. | ||
66
| THE ADVISORS’ INNER CIRCLE FUND III | BROOKMONT FUNDS | |
| SEPTEMBER 30, 2022 | ||
| Other Directorships Held in the Past Five Years | ||
|
| ||
| None. | ||
| None. | ||
| None. | ||
| None. | ||
| None. | ||
67
| THE ADVISORS’ INNER CIRCLE FUND III | BROOKMONT FUNDS | |
| SEPTEMBER 30, 2022 | ||
| Name and Year of Birth | Position with Trust and Length of Time Served | Principal Occupation During the Past Five Years | ||
| OFFICERS (continued)
|
||||
| Alexander F. Smith (Born: 1977) |
Vice President and Assistant Secretary (since 2020) |
Counsel at SEI Investments since 2020. Associate Counsel & Manager, Vanguard, 2012 to 2020. Attorney, Stradley Ronon Stevens & Young, LLP, 2008 to 2012.
| ||
| Bridget E. Sudall (Born: 1980) |
Privacy Officer (from 2015 – June 2022 and since November 2022) Anti-Money Laundering Officer (from 2015 – June 2022 and since November 2022) |
Senior Associate and AML Officer, Morgan Stanley Alternative Investment Partners, from 2011 to 2015. Investor Services Team Lead, Morgan Stanley Alternative Investment Partners, from 2007 to 2011.
|
68
| THE ADVISORS’ INNER CIRCLE FUND III | BROOKMONT FUNDS | |
| SEPTEMBER 30, 2022 | ||
Other Directorships
Held in the Past Five Years
None.
None.
69
| THE ADVISORS’ INNER CIRCLE FUND III | BROOKMONT FUNDS | |
| SEPTEMBER 30, 2022 | ||
Pursuant to Section 15 of the Investment Company Act of 1940 (the “1940 Act”), the Funds’ advisory agreement (the “Agreement”) must be renewed at least annually after its initial two-year term: (i) by the vote of the Board of Trustees (the “Board” or the “Trustees”) of The Advisors’ Inner Circle Fund III (the “Trust”) or by a vote of a majority of the shareholders of the Funds; and (ii) by the vote of a majority of the Trustees who are not parties to the Agreement or “interested persons” of any party thereto, as defined in the 1940 Act (the “Independent Trustees”), cast in person at a meeting called for the purpose of voting on such renewal.
A Board meeting was held on September 14-15, 2022 to decide whether to renew the Agreement for an additional one-year term. In preparation for the meeting, the Trustees requested that the Adviser furnish information necessary to evaluate the terms of the Agreement. Prior to the meeting, the Independent Trustees of the Funds met to review and discuss the information provided. The Trustees used this information, as well as other information that the Adviser and other service providers of the Funds presented or submitted to the Board at the meeting and other meetings held during the prior year, to help them decide whether to renew the Agreement for an additional year.
Specifically, the Board requested and received written materials from the Adviser and other service providers of the Funds regarding: (i) the nature, extent and quality of the Adviser’s services; (ii) the Adviser’s investment management personnel; (iii) the Adviser’s operations and financial condition; (iv) the Adviser’s brokerage practices (including any soft dollar arrangements) and investment strategies; (v) the Funds’ advisory fees paid to the Adviser and overall fees and operating expenses compared with peer groups of mutual funds; (vi) the level of the Adviser’s profitability from its relationship with the Funds, including both direct and indirect benefits accruing to the Adviser and its affiliates; (vii) the Adviser’s potential economies of scale; (viii) the Adviser’s compliance program, including a description of material compliance matters and material compliance violations; (ix) the Adviser’s policies on and compliance procedures for personal securities transactions; and (x) the Funds’ performance compared with peer groups of mutual funds and the Funds’ benchmark indices.
Representatives from the Adviser, along with other Fund service providers, presented additional information and participated in question and answer sessions at the Board meeting to help the Trustees evaluate the Adviser’s services, fees and other aspects of the Agreement. The Independent Trustees received advice from independent counsel and met in executive sessions outside the presence of Fund management and the Adviser.
70
| THE ADVISORS’ INNER CIRCLE FUND III | BROOKMONT FUNDS | |
| SEPTEMBER 30, 2022 | ||
At the Board meeting, the Trustees, including all of the Independent Trustees, based on their evaluation of the information provided by the Adviser and other service providers of the Funds, renewed the Agreement. In considering the renewal of the Agreement, the Board considered various factors that they determined were relevant, including: (i) the nature, extent and quality of the services provided by the Adviser; (ii) the investment performance of the Funds and the Adviser; (iii) the costs of the services provided and profits realized by the Adviser from its relationship with the Funds, including both direct and indirect benefits accruing to the Adviser and its affiliates; (iv) the extent to which economies of scale are being realized by the Adviser; and (v) whether fee levels reflect such economies of scale for the benefit of Fund investors, as discussed in further detail below.
Nature, Extent and Quality of Services Provided by the Adviser
In considering the nature, extent and quality of the services provided by the Adviser, the Board reviewed the portfolio management services provided by the Adviser to the Funds, including the quality and continuity of the Adviser’s portfolio management personnel, the resources of the Adviser, and the Adviser’s compliance history and compliance program. The Trustees reviewed the terms of the Agreement. The Trustees also reviewed the Adviser’s investment and risk management approaches for the Funds. The most recent investment adviser registration form (“Form ADV”) for the Adviser was available to the Board, as was the response of the Adviser to a detailed series of questions which included, among other things, information about the investment advisory services provided by the Adviser to the Funds.
The Trustees also considered other services provided to the Funds by the Adviser such as selecting broker-dealers for executing portfolio transactions, monitoring adherence to the Funds’ investment restrictions, and monitoring compliance with various Fund policies and procedures and with applicable securities laws and regulations. Based on the factors above, as well as those discussed below, the Board concluded, within the context of its full deliberations, that the nature, extent and quality of the services provided to the Funds by the Adviser were sufficient to support renewal of the Agreement.
Investment Performance of the Funds and the Adviser
The Board was provided with regular reports regarding the Funds’ performance over various time periods. The Trustees also reviewed reports prepared by the Funds’ administrator comparing the Funds’ performance to their benchmark
71
| THE ADVISORS’ INNER CIRCLE FUND III | BROOKMONT FUNDS | |
| SEPTEMBER 30, 2022 | ||
indices and peer groups of mutual funds as classified by Lipper, an independent provider of investment company data, over various periods of time. Representatives from the Adviser provided information regarding and led discussions of factors impacting the performance of the Funds, outlining current market conditions and explaining their expectations and strategies for the future. The Trustees determined that the Funds’ performance was satisfactory, or, where the Funds’ performance was materially below their benchmarks and/or peer groups, the Trustees were satisfied by the reasons for the underperformance and/or the steps taken by the Adviser in an effort to improve the performance of the Funds. Based on this information, the Board concluded, within the context of its full deliberations, that the investment results that the Adviser had been able to achieve for the Funds were sufficient to support renewal of the Agreement.
Costs of Advisory Services, Profitability and Economies of Scale
In considering the advisory fee payable by the Funds to the Adviser, the Trustees reviewed, among other things, a report of the advisory fee paid to the Adviser. The Trustees also reviewed reports prepared by the Funds’ administrator comparing the Funds’ net and gross expense ratios and advisory fees to those paid by peer groups of mutual funds as classified by Lipper. The Board concluded, within the context of its full deliberations, that the advisory fees were reasonable in light of the nature and quality of the services rendered by the Adviser.
The Trustees reviewed the costs of services provided by and the profits realized by the Adviser from its relationship with the Funds, including both direct benefits and indirect benefits, such as research and brokerage services received under soft dollar arrangements, accruing to the Adviser and its affiliates. The Trustees considered how the Adviser’s profitability was affected by factors such as its organizational structure and method for allocating expenses. The Trustees concluded that the profit margins of the Adviser with respect to the management of the Funds were not unreasonable. The Board also considered the Adviser’s commitment to managing the Funds.
The Trustees considered the Adviser’s views relating to economies of scale in connection with the Funds as Fund assets grow and the extent to which the benefits of any such economies of scale are shared with the Funds and Fund shareholders. The Board considered the existence of any economies of scale and whether those were passed along to the Funds’ shareholders through a graduated advisory fee schedule or other means, including fee waivers. The
72
| THE ADVISORS’ INNER CIRCLE FUND III | BROOKMONT FUNDS | |
| SEPTEMBER 30, 2022 | ||
Trustees recognized that economies of scale are difficult to identify and quantify and are rarely identifiable on a fund-by-fund basis. Based on this evaluation, the Board concluded that the advisory fees were reasonable in light of the information that was provided to the Trustees by the Adviser with respect to economies of scale.
Renewal of the Agreement
Based on the Board’s deliberations and its evaluation of the information described above and other factors and information it believed relevant in the exercise of its reasonable business judgment, the Board, including all of the Independent Trustees, with the assistance of Fund counsel and Independent Trustees’ counsel, unanimously concluded that the terms of the Agreement, including the fees payable thereunder, were fair and reasonable and agreed to renew the Agreement for another year. In its deliberations, the Board did not identify any absence of information as material to its decision, or any particular factor (or conclusion with respect thereto) or single piece of information that was all-important, controlling or determinative of its decision, but considered all of the factors together, and each Trustee may have attributed different weights to the various factors (and conclusions with respect thereto) and information.
73
| THE ADVISORS’ INNER CIRCLE FUND III | BROOKMONT FUNDS | |
| SEPTEMBER 30, 2022 | ||
For shareholders that do not have a September 30, 2022 tax year end, this notice is for informational purposes only. For shareholders with a September 30, 2022 tax year end, please consult your tax advisor as to the pertinence of this notice. For the fiscal period ended September 30, 2022, the Fund is designating the following items with regard to distributions paid during the period.
| Return of Capital |
Long-Term Capital Gains Distribution |
Ordinary Income |
Total Distribution |
Dividends Received | ||||||
| First Foundation Fixed Income Fund | 0.00% | 2.48% | 97.52% | 100.00% | 11.75% | |||||
| First Foundation Total Return Fund | 0.00% | 42.26% | 57.74% | 100.00% | 11.27% |
| Qualifying Dividend Income(2) |
Qualifying Business Income(3) |
U.S. Government |
Interest Related |
Qualified Short-Term Capital Gain(6) | ||||||
| First Foundation Fixed Income Fund | 12.39% | 3.02% | 2.80% | 59.39% | 100.00% | |||||
| First Foundation Total Return Fund | 17.24% | 2.41% | 0.55% | 1.00% | 100.00% |
(1) Qualifying dividends represent dividends which qualify for the corporate dividends received deduction and is reflected as a percentage of ordinary income distributions (the total of short term capital gain and net investment income distributions).
(2) The percentage in this column represents the amount of “Qualifying Dividend Income” as created by the Jobs and Growth Tax Relief Reconciliation Act of 2003 and is reflected as a percentage of ordinary income distributions (the total of short term capital gain and net investment income distributions). It is the intention of the Fund to designate the maximum amount permitted by law.
(3) The percentage of this column represents that amount of ordinary dividend income that qualified for 20% Business Income Deduction.
(4) “U.S. Government Interest” represents the amount of interest that was derived from direct U.S. Government obligations and distributed during the fiscal year. This amount is reflected as a percentage of ordinary income. (the total of short term capital gain and net investment income distributions). Generally, interest from direct U.S. Government obligations is exempt from state income tax. However, for residents of California, Connecticut and New York, the statutory threshold requirements were not satisfied to permit exemption of these amounts from state income.
(5) The percentage in this column represents the amount of “Interest Related Dividend” and is reflected as a percentage of ordinary income distributions. Interest related dividends are exempted from U.S. withholding tax when paid to foreign investors.
(6) The percentage of this column represents the amount of “Short-Term Capital Gain Dividends” and is reflected as a percentage of short term capital gain distributions that is exempted from U.S. withholding tax when paid to foreign investors.
74
| THE ADVISORS’ INNER CIRCLE FUND III | BROOKMONT FUNDS | |
| SEPTEMBER 30, 2022 | ||
The information reported herein may differ from the information and distributions taxable to the shareholders for the calendar year ending December 31, 2022. Complete information will be computed and reported in conjunction with your 2022 Form 1099-DIV.
75
Brookmont Funds
PO Box 219009
Kansas City, MO 64121
800-838-0191
Investment Adviser:
Brookmont Capital Management, LLC
5950 Berkshire Lane, Suite 1420,
Dallas, TX 75225
Sub-Adviser:
First Foundation Advisors
18101 Von Karman Avenue, Suite 700,
Irvine, CA 92612
Administrator:
SEI Investments Global Funds Services
One Freedom Valley Drive
Oaks, PA 19456
Distributor:
SEI Investments Distribution Co.
One Freedom Valley Drive
Oaks, PA 19456
Legal Counsel:
Morgan, Lewis & Bockius LLP
1701 Market Street
Philadelphia, PA 19103
Independent Registered Public Accounting Firm:
Deloitte & Touche LLP
1700 Market Street
Philadelphia, PA 19103
This information must be preceded or accompanied by a current prospectus for the Funds described. Investors should read it carefully before investing or sending money.
BRK-AR-001-0200
Item 2. Code of Ethics.
The Registrant (also referred to as the “Trust”) has adopted a code of ethics that applies to the Registrant’s principal executive officer, principal financial officer, controller or principal accounting officer, and any person who performs a similar function. There have been no amendments to or waivers granted to this code of ethics during the period covered by this report.
Item 3. Audit Committee Financial Expert.
(a)(1) The Registrant’s board of trustees has determined that the Registrant has at least one audit committee financial expert serving on the audit committee.
(a) (2) The Registrant’s audit committee financial experts are Thomas P. Lemke and Jay Nadel, and each of Messrs. Lemke and Nadel is considered to be “independent” as that term is defined in Form N-CSR Item 3 (a)(2).
Item 4. Principal Accountant Fees and Services.
Fees billed by PricewaterhouseCoopers LLP (“PwC”) related to The Advisors’ Inner Circle Fund III (the aforementioned “Trust”).
PwC billed the Trust aggregate fees for services rendered to the Trust for the last two fiscal years as follows:
| FYE September 30, 2022 | FYE September 30, 2021 | |||||||||||||||||||||||||
| All fees and services to the Trust that were pre-approved |
All fees and services to service affiliates that were pre-approved |
All other fees and services to service affiliates that did not require pre-approval |
All fees and services to the Trust that were pre-approved |
All fees and services to service affiliates that were pre-approved |
All other fees and services to service affiliates that did not require pre-approval |
|||||||||||||||||||||
| (a) |
Audit Fees(1) | $ | 682,615 | None | None | $ | 730,515 | None | $ | 11,990 | ||||||||||||||||
| (b) |
Audit-Related Fees | None | None | None | $ | 4,000 | None |
None | ||||||||||||||||||
| (c) |
Tax Fees | $ | 88,500 | (4) | None | $ | 57,000 | (2) | None | None | $ | 90,000 | (2) | |||||||||||||
| (d) |
All Other Fees | None | None | None | None | None | $ | 1,473 | ||||||||||||||||||
Fees billed by Ernst & Young LLP (“E&Y”) relate to the Trust.
E&Y billed the Trust aggregate fees for services rendered to the Trust for the last two fiscal years as follows:
| FYE September 30, 2022 | FYE September 30, 2021 | |||||||||||||||||||||||||
| All fees and services to the Trust that were pre-approved |
All fees and services to service affiliates that were pre-approved |
All other fees and services to service affiliates that did not require pre-approval |
All fees and services to the Trust that were pre-approved |
All fees and services to service affiliates that were pre-approved |
All other fees and services to service affiliates that did not require pre-approval |
|||||||||||||||||||||
| (a) |
Audit Fees(1) | $ | 133,360 | None | None | $ | 48,940 | None | None | |||||||||||||||||
| (b) |
Audit-Related Fees | None | None | None | None | None | None | |||||||||||||||||||
| (c) |
Tax Fees | $ | 6,650 | (3) | None | None | $ | 2,660 | (3) | None | None | |||||||||||||||
| (d) |
All Other Fees | None | None | None | None | None | None | |||||||||||||||||||
Fees billed by Deloitte & Touche LLP (“D&T”) relate to the Trust.
D&T billed the Trust aggregate fees for services rendered to the Trust for the last two fiscal years as follows
| FYE September 30, 2022 | FYE September 30, 2021 | |||||||||||||||||||||||||
| All fees and services to the Trust that were pre-approved |
All fees and services to service affiliates that were pre-approved |
All other fees and services to service affiliates that did not require pre-approval |
All fees and services to the Trust that were pre-approved |
All fees and services to service affiliates that were pre-approved |
All other fees and services to service affiliates that did not require pre-approval |
|||||||||||||||||||||
| (a) |
Audit Fees(1) | $ | 60,000 | None | None | $ | 60,000 | None | None | |||||||||||||||||
| (b) |
Audit-Related Fees | None | None | None | None | None | None | |||||||||||||||||||
| (c) |
Tax Fees | None | None | None | None | None | None | |||||||||||||||||||
| (d) |
All Other Fees | None | None | None | None | None | None | |||||||||||||||||||
Notes:
| (1) | Audit fees include amounts related to the audit of the Trust’s annual financial statements and services normally provided by the accountant in connection with statutory and regulatory filings. |
| (2) | Tax return preparation fees for affiliates of the Funds. |
| (3) | Tax Fees for UK Reporting Fund Status. |
| (4) | Fees in connection with international withholding tax analysis. |
(e)(1) The Trust’s Audit Committee has adopted and the Board of Trustees has ratified an Audit and Non-Audit Services Pre-Approval Policy (the “Policy”), which sets forth the procedures and the conditions pursuant to which services proposed to be performed by the independent auditor of the Funds may be pre-approved.
The Policy provides that all requests or applications for proposed services to be provided by the independent auditor must be submitted to the Registrant’s Chief Financial Officer (“CFO”) and must include a detailed description of the services proposed to be rendered. The CFO will determine whether such services: (1) require specific pre-approval; (2) are included within the list of services that have received the general pre-approval of the Audit Committee pursuant to the Policy; or (3) have been previously pre-approved in connection with the independent auditor’s annual engagement letter for the applicable year or otherwise. In any instance where services require pre-approval, the Audit Committee will consider whether such services are consistent with SEC’s rules and whether the provision of such services would impair the auditor’s independence.
Requests or applications to provide services that require specific pre-approval by the Audit Committee will be submitted to the Audit Committee by the CFO. The Audit Committee will be informed by the CFO on a quarterly basis of all services rendered by the independent auditor. The Audit Committee has delegated specific pre-approval authority to either the Audit Committee Chair or financial expert; provided, that the estimated fee for any such proposed pre-approved service does not exceed $100,000 and any pre-approval decisions are reported to the Audit Committee at its next regularly-scheduled meeting.
Services that have received the general pre-approval of the Audit Committee are identified and described in the Policy. In addition, the Policy sets forth a maximum fee per engagement with respect to each identified service that has received general pre-approval.
All services to be provided by the independent auditor shall be provided pursuant to a signed written engagement letter with the Registrant, the investment adviser, or applicable control affiliate (except that matters as to which an engagement letter would be impractical because of timing issues or because the matter is small may not be the subject of an engagement letter) that sets forth both the services to be provided by the independent auditor and the total fees to be paid to the independent auditor for those services.
In addition, the Audit Committee has determined to take additional measures on an annual basis to meet the Audit Committee’s responsibility to oversee the work of the independent auditor and to assure the auditor’s independence from the Registrant, such as (a) reviewing a formal written statement from the independent auditor delineating all relationships between the independent auditor and the Registrant, and (b) discussing with the independent auditor the independent auditor’s methods and procedures for ensuring independence.
(e)(2) Percentage of fees billed applicable to non-audit services pursuant to waiver of pre-approval requirement were as follows (PwC):
| FYE September 30, 2022 |
FYE September 30, 2021 |
|||||||
| Audit-Related Fees |
None | None | ||||||
| Tax Fees |
None | None | ||||||
| All Other Fees |
None | None | ||||||
(e)(2) Percentage of fees billed applicable to non-audit services pursuant to waiver of pre-approval requirement were as follows (E&Y):
| FYE September 30, 2022 |
FYE September 30, 2021 |
|||||||
| Audit-Related Fees |
None | None | ||||||
| Tax Fees |
None | None | ||||||
| All Other Fees |
None | None | ||||||
(e)(2) Percentage of fees billed applicable to non-audit services pursuant to waiver of pre-approval requirement were as follows (D&T):
| FYE September 30, 2022 |
FYE September 30, 2021 |
|||||||
| Audit-Related Fees |
None | None | ||||||
| Tax Fees |
None | None | ||||||
| All Other Fees |
None | None | ||||||
(f) Not applicable.
(g) The aggregate non-audit fees and services billed by PwC for services rendered to the Registrant, and rendered to the Registrant’s investment adviser (not including any sub-adviser whose role is primarily portfolio management and is subcontracted with or overseen by another investment adviser), and any entity controlling, controlled by, or under common control with the adviser that provides ongoing services to the Registrant for the last two fiscal-years-ended September 30th were $57,000 and $91,473 for 2022 and 2021, respectively.
(g) The aggregate non-audit fees and services billed by E&Y for services rendered to the Registrant, and rendered to the Registrant’s investment adviser (not including any sub-adviser whose role is primarily portfolio management and is subcontracted with or overseen by another investment adviser), and any entity controlling, controlled by, or under common control with the adviser that provides ongoing services to the Registrant for the last two fiscal-years-ended September 30th were $6,650 and $2,660 for 2022 and 2021, respectively.
(g) The aggregate non-audit fees and services billed by D&T for services rendered to the Registrant, and rendered to the Registrant’s investment adviser (not including any sub-adviser whose role is primarily portfolio management and is subcontracted with or overseen by another investment adviser), and any entity controlling, controlled by, or under common control with the adviser that provides ongoing services to the Registrant for the last two fiscal-years-ended September 30th were $0 and $0 for 2022 and 2021, respectively.
(h) During the past fiscal year, all non-audit services provided by the Registrant’s principal accountant to either the Registrant’s investment adviser or to any entity controlling, controlled by, or under common control with the Registrant’s investment adviser that provides ongoing services to the Registrant were pre-approved by the Audit Committee of Registrant’s Board of Trustees. Included in the Audit Committee’s pre-approval of these non-audit service were the review and consideration as to whether the provision of these non-audit services is compatible with maintaining the principal accountant’s independence.
(i) Not Applicable. The Registrant has not retained, for the preparation of the audit report on the financial statements included in the Form N-CSR, a registered public accounting firm that has a branch or office that is located in a foreign jurisdiction and that the Public Company Accounting Oversight Board (the “PCAOB”) has determined that the PCAOB is unable to inspect or investigate completely because of a position taken by an authority in the foreign jurisdiction.
(j) Not Applicable. The Registrant is not a “foreign issuer,” as defined in 17 CFR 240.3b-4.
Item 5. Audit Committee of Listed Registrants.
Not applicable to open-end management investment companies.
Item 6. Schedule of Investments.
Schedule of Investments is included as part of the Report to Shareholders filed under Item 1 of this form.
Item 7. Disclosure of Proxy Voting Policies and Procedures for Closed-End Management Investment Companies.
Not applicable to open-end management investment companies.
Item 8. Portfolio Managers of Closed-End Management Investment Companies.
Not applicable to open-end management investment companies.
Item 9. Purchases of Equity Securities by Closed-End Management Company and Affiliated Purchasers.
Not applicable to open-end management investment companies.
Item 10. Submission of Matters to a Vote of Security Holders.
There have been no changes to the procedures by which shareholders may recommend nominees to the Registrant’s Board of Trustees during the period covered by this report.
Item 11. Controls and Procedures.
(a) The Registrant’s principal executive and principal financial officers, or persons performing similar functions, have concluded that the Registrant’s disclosure controls and procedures, as defined in Rule 30a-3(c) under the Act (17 CFR §270.30a-3(c)), as of a date within 90 days of the filing date of the report, are effective based on the evaluation of these controls and procedures required by Rule 30a-3(b) under the Act (17 CFR §270.30a-3(b)) and Rule 13a-15(b) or Rule 15d-15(b) under the Exchange Act (17 CFR §240.13a-15(b) or §240.15d-15(b)).
(b) There has been no change in the Registrant’s internal control over financial reporting (as defined in Rule 30a-3(d) under the Act (17CFR §270.3a-3(d)) that occurred during the period covered by this report that has materially affected, or is reasonably likely to materially affect, the Registrant’s internal control over financial reporting.
Item 12. Disclosure of Securities Lending Activities for Closed-End Management Investment Companies.
Not applicable to open-end management investment companies.
Item 13. Exhibits.
SIGNATURES
Pursuant to the requirements of the Securities Exchange Act of 1934 and the Investment Company Act of 1940, the Registrant has duly caused this report to be signed on its behalf by the undersigned, thereunto duly authorized.
| (Registrant) | The Advisors’ Inner Circle Fund III | |||||
| By (Signature and Title) | /s/ Michael Beattie | |||||
| Michael Beattie, President | ||||||
| Date: December 9, 2022 | ||||||
Pursuant to the requirements of the Securities Exchange Act of 1934 and the Investment Company Act of 1940, this report has been signed below by the following persons on behalf of the Registrant and in the capacities and on the dates indicated.
| By (Signature and Title) | /s/ Michael Beattie | |||||
| Michael Beattie, President | ||||||
| Date: December 9, 2022 | ||||||
| By (Signature and Title) | /s/ Andrew Metzger | |||||
| Andrew Metzger, | ||||||
| Treasurer, Controller, and CFO | ||||||
Date: December 9, 2022
ATTACHMENTS / EXHIBITS
Serious News for Serious Traders! Try StreetInsider.com Premium Free!
You May Also Be Interested In
- BGHL (GBP): NAV(s)
- Sequana Medical announces the Annual and Extraordinary General Meetings of Shareholders on 23 May 2024
- foodpanda and The Trade Desk Partner Up to Provide Brands With Data-Driven Retail Media Solutions
Create E-mail Alert Related Categories
SEC FilingsSign up for StreetInsider Free!
Receive full access to all new and archived articles, unlimited portfolio tracking, e-mail alerts, custom newswires and RSS feeds - and more!
