

Form N-CSR AMERICAN CENTURY GROWTH For: Jul 31
 Tweet
Tweet Share
ShareUNITED STATES
SECURITIES AND EXCHANGE COMMISSION
Washington, D.C. 20549
FORM N-CSR
CERTIFIED SHAREHOLDER REPORT OF REGISTERED
MANAGEMENT INVESTMENT COMPANIES
| Investment Company Act file number | 811-21861 | |||||||||||||||||||
| AMERICAN CENTURY GROWTH FUNDS, INC. | ||||||||||||||||||||
| (Exact name of registrant as specified in charter) | ||||||||||||||||||||
| 4500 MAIN STREET, KANSAS CITY, MISSOURI | 64111 | |||||||||||||||||||
| (Address of principal executive offices) | (Zip Code) | |||||||||||||||||||
| JOHN PAK 4500 MAIN STREET, KANSAS CITY, MISSOURI 64111 | ||||||||||||||||||||
| (Name and address of agent for service) | ||||||||||||||||||||
| Registrant’s telephone number, including area code: | 816-531-5575 | |||||||||||||||||||
| Date of fiscal year end: | 07-31 | |||||||||||||||||||
| Date of reporting period: | 07-31-2022 | |||||||||||||||||||
ITEM 1. REPORTS TO STOCKHOLDERS.
(a) Provided under separate cover.

| Annual Report | |||||
| July 31, 2022 | |||||
| Focused Dynamic Growth Fund | |||||
| Investor Class (ACFOX) | |||||
| I Class (ACFSX) | |||||
| A Class (ACFDX) | |||||
| R Class (ACFCX) | |||||
| R6 Class (ACFNX) | |||||
| G Class (ACFGX) | |||||
| Table of Contents | ||
| President’s Letter | |||||
| Performance | |||||
| Portfolio Commentary | |||||
| Fund Characteristics | |||||
| Shareholder Fee Example | |||||
| Schedule of Investments | |||||
| Statement of Assets and Liabilities | |||||
| Statement of Operations | |||||
| Statement of Changes in Net Assets | |||||
| Notes to Financial Statements | |||||
| Financial Highlights | |||||
| Report of Independent Registered Public Accounting Firm | |||||
| Management | |||||
| Approval of Management Agreement | |||||
| Liquidity Risk Management Program | |||||
| Additional Information | |||||
Any opinions expressed in this report reflect those of the author as of the date of the report, and do not necessarily represent the opinions of American Century Investments® or any other person in the American Century Investments organization. Any such opinions are subject to change at any time based upon market or other conditions and American Century Investments disclaims any responsibility to update such opinions. These opinions may not be relied upon as investment advice and, because investment decisions made by American Century Investments funds are based on numerous factors, may not be relied upon as an indication of trading intent on behalf of any American Century Investments fund. Security examples are used for representational purposes only and are not intended as recommendations to purchase or sell securities. Performance information for comparative indices and securities is provided to American Century Investments by third party vendors. To the best of American Century Investments’ knowledge, such information is accurate at the time of printing.
| President’s Letter | ||
 Jonathan Thomas
Dear Investor:
Thank you for reviewing this annual report for the period ended July 31, 2022. Annual reports help convey important information about fund returns, including market factors that affected performance. For additional investment insights, please visit americancentury.com.
2022 Sell-Off Sank Stock Returns for the Fiscal Year
Stock market performance changed dramatically during the 12-month period. In the first five months, generally upbeat economic activity and corporate earnings supported solid returns for most broad U.S. and global stock indices. Performance remained positive despite rapidly rising inflation and waning central bank support.
The market climate changed considerably in early 2022. Inflation, which was already at multiyear highs, rose to levels last seen in the early 1980s. The massive fiscal and monetary support unleashed during the pandemic was partly to blame. In addition, escalating energy prices, supply chain breakdowns and labor market shortages further aggravated the inflation rate in the U.S. and other developed markets. Russia’s invasion of Ukraine in February also exacerbated global inflationary pressures.
The Federal Reserve responded to surging inflation in March, launching an aggressive rate-hike campaign and ending its asset purchase program. Policymakers indicated taming inflation remains their priority, even as the economy contracted for two consecutive quarters. Despite a rate-hike total of 2.25 percentage points through July 31, U.S. inflation climbed to a 41-year high of 9.1% in June before easing to 8.5% in July.
The combination of accelerating inflation, tighter monetary policy, geopolitical strife and weakening economies triggered sharp market volatility and fueled recession fears. U.S. and global stocks erased their late 2021 gains and declined for the 12-month period. U.S. stocks generally fared better than non-U.S. stocks, large caps outpaced small caps, and value outperformed growth.
Staying Disciplined in Uncertain Times
We expect market volatility to linger as investors navigate a complex environment of high inflation, rising interest rates and economic uncertainty. In addition, Russia’s invasion of Ukraine complicates a tense geopolitical backdrop. We will continue to monitor this evolving situation and what it broadly means for our clients and investment exposure.
We appreciate your confidence in us during these extraordinary times. Our firm has a long history of helping clients weather unpredictable markets, and we’re confident we will continue to meet today’s challenges.
Sincerely,

Jonathan Thomas
President and Chief Executive Officer
American Century Investments
2
| Performance | ||
| Total Returns as of July 31, 2022 | ||||||||||||||||||||
| Average Annual Returns | ||||||||||||||||||||
| Ticker Symbol | 1 year | 5 years | 10 years | Since Inception | Inception Date | |||||||||||||||
| Investor Class | ACFOX | -28.42% | 16.38% | 15.30% | — | 5/31/06 | ||||||||||||||
| Russell 1000 Growth Index | — | -11.93% | 16.29% | 15.94% | — | — | ||||||||||||||
| I Class | ACFSX | -28.26% | 16.60% | 15.54% | — | 5/31/06 | ||||||||||||||
| A Class | ACFDX | 5/31/06 | ||||||||||||||||||
| No sales charge | -28.58% | 16.08% | 15.02% | — | ||||||||||||||||
| With sales charge | -32.69% | 14.71% | 14.35% | — | ||||||||||||||||
| R Class | ACFCX | -28.77% | 15.79% | 14.73% | — | 5/31/06 | ||||||||||||||
| R6 Class | ACFNX | -28.17% | 16.78% | — | 18.99% | 12/1/16 | ||||||||||||||
| G Class | ACFGX | -27.80% | — | — | 14.49% | 4/1/19 | ||||||||||||||
Average annual returns since inception are presented when ten years of performance history is not available.
Fund returns would have been lower if a portion of the fees had not been waived. Prior to June 15, 2020, the A Class was referred to as the Advisor Class and did not have a front-end sales charge. Performance prior to that date has been adjusted to reflect this charge.
Sales charges include initial sales charges and contingent deferred sales charges (CDSCs), as applicable. A Class shares have a 5.75% maximum initial sales charge and may be subject to a maximum CDSC of 1.00%. The SEC requires that mutual funds provide performance information net of maximum sales charges in all cases where charges could be applied.
Data presented reflect past performance. Past performance is no guarantee of future results. Current performance may be higher or lower than the performance shown. Total returns for periods less than one year are not annualized. Investment return and principal value will fluctuate, and redemption value may be more or less than original cost. Data assumes reinvestment of dividends and capital gains, and none of the charts reflect the deduction of taxes that a shareholder would pay on fund distributions or the redemption of fund shares. To obtain performance data current to the most recent month end, please call 1-800-345-2021 or visit americancentury.com. For additional information about the fund, please consult the prospectus.
3
| Growth of $10,000 Over 10 Years | ||
| $10,000 investment made July 31, 2012 | ||
| Performance for other share classes will vary due to differences in fee structure. | ||
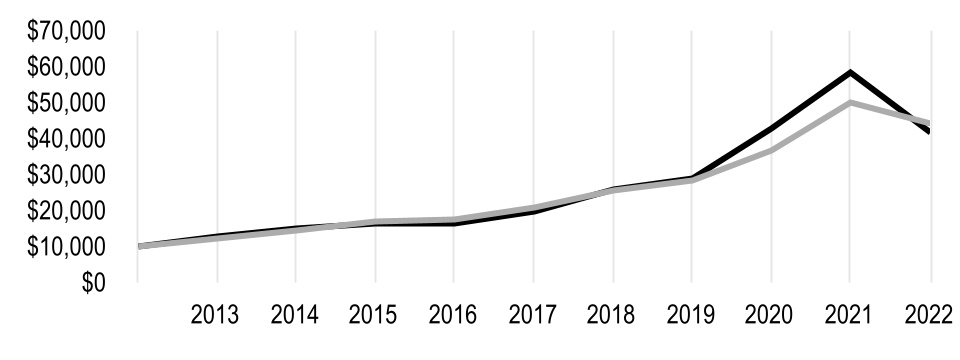
| Value on July 31, 2022 | |||||
| Investor Class — $41,555 | |||||
| Russell 1000 Growth Index — $43,927 | |||||
Ending value of Investor Class would have been lower if a portion of the fees had not been waived.
| Total Annual Fund Operating Expenses | |||||||||||||||||
| Investor Class | I Class | A Class | R Class | R6 Class | G Class | ||||||||||||
| 0.85% | 0.65% | 1.10% | 1.35% | 0.50% | 0.50% | ||||||||||||
The total annual fund operating expenses shown is as stated in the fund’s prospectus current as of the date of this report. The prospectus may vary from the expense ratio shown elsewhere in this report because it is based on a different time period, includes acquired fund fees and expenses, and, if applicable, does not include fee waivers or expense reimbursements.
Data presented reflect past performance. Past performance is no guarantee of future results. Current performance may be higher or lower than the performance shown. Total returns for periods less than one year are not annualized. Investment return and principal value will fluctuate, and redemption value may be more or less than original cost. Data assumes reinvestment of dividends and capital gains, and none of the charts reflect the deduction of taxes that a shareholder would pay on fund distributions or the redemption of fund shares. To obtain performance data current to the most recent month end, please call 1-800-345-2021 or visit americancentury.com. For additional information about the fund, please consult the prospectus.
4
| Portfolio Commentary | ||
Portfolio Managers: Keith Lee, Michael Li, Henry He and Prabha Ram
Performance Summary
Focused Dynamic Growth returned -28.42%* for the 12 months ended July 31, 2022, versus the -11.93% return of its benchmark, the Russell 1000 Growth Index.
U.S. stocks fell sharply over the past 12 months, with most of the losses coming from late 2021 through midyear 2022. The downturn began amid a combination of factors—the new omicron variant of COVID-19, rising inflation, the Federal Reserve signaling interest rate increases—that led to investors moving to more defensive positioning. The market action was marked by a rotation out of the highest growth stocks and pandemic winners into either lower growth or more traditional cyclical value stocks. Market declines intensified after Russia invaded Ukraine, exacerbating already stretched supply chains and leading to soaring oil prices that helped drive inflation to four-decade highs. For context, the first six months of 2022 marked the worst first half of a year for the broad S&P 500 Index since 1970. Within the fund’s benchmark Russell 1000 Growth Index, energy posted strong returns, benefiting from rising prices as demand for oil rose and supply was limited. Consumer staples and utilities stocks registered more modest gains. All other sectors declined.
The fund’s investment strategy features a concentrated portfolio of comparatively early and rapid-stage companies we believe have the potential to sustain above-average growth rates. That focus on a relatively small number of high-growth, early stage companies led to very disappointing performance in absolute terms and relative to the benchmark during the fiscal year. The fund’s underperformance relative to the Russell 1000 Growth Index was largely due to stock selection in several sectors, especially in information technology and communication services. An overweight allocation to energy benefited performance relative to the benchmark.
Information Technology Stocks Detracted From Relative Performance
Our holdings in the information technology sector dominated the fund’s underperformance amid the growth sell-off, as investors sold the stocks of many companies that rose during the pandemic. DocuSign was a significant detractor. The stock of this developer of software for online signatures and document management had been a leading contributor to performance in recent years. It was a beneficiary of the pandemic-driven work-from-home environment but offered disappointing guidance as that tailwind subsided. Other sector detractors included Okta. The company provides cloud-based software for online identity verification, a rapidly growing market with scope for tremendous innovation. The stock fell sharply after Okta reported a third-party data breach potentially affecting a number of corporate clients that it had failed to notify in a timely manner. The small- and micro-merchant digital payments company Block (formerly Square), a darling during the pandemic, suffered during the growth sell-off as first rising interest rates and later recessionary fears weighed on the stock. Additionally, Block’s focus on blockchain technology—which enables cryptocurrencies—hurt as crypto prices fell.
Elsewhere, the online education provider Chegg reported disappointing earnings and enrollment figures, precipitating a sharp decline. We eliminated our holding. Fund performance was also hurt by not owning some stocks that are benchmark components. Despite supply chain struggles that have affected most electronics companies, Apple posted record sales and earnings, led by sales of the iPhone. The software giant Microsoft outperformed on better-than-expected earnings. These later-stage growth companies do not fit the investment profile we seek.
*All fund returns referenced in this commentary are for Investor Class shares. Performance for other share classes will vary due to differences in fee structure; when Investor Class performance exceeds that of the fund’s benchmark, other share classes may not. See page 3 for returns for all share classes.
5
Energy Benefited Performance
Our positioning in the energy sector relative to the benchmark was helpful. Higher oil prices caused by rising demand benefited Cactus, which leases equipment to energy producers. The company is gaining market share in niche capital equipment focused on shale oil well development by creating tools that are differentiated by their efficiency and safety.
Other top contributors came from a variety of sectors. The stock price of Tesla rose after the company reported better-than-expected quarterly earnings. The electric vehicle maker offered optimistic guidance but noted production headwinds due to supply chain disruptions and persistent lockdowns in China. We continue to view Tesla as an early stage growth company with significant competitive advantages relative to traditional automakers. Constellation Brands was another top contributor. This innovative beer, wine and spirits beverage company reported quarterly revenue and earnings that beat expectations, driven by strength in its portfolio of beer brands. Westinghouse Air Brake Technologies outperformed, aided by the strong results of its freight rail segment. The stock of Argenx, a Belgium-based biotechnology company, rose after it reported sales of Vyvgart that exceeded expectations. Vyvgart treats myasthenia gravis, a neuromuscular disorder. Our lack of exposure to PayPal Holdings benefited performance compared with the benchmark. The digital payment company’s stock price fell on slower growth, primarily due to losing its eBay account, but also because of difficult year-over-year comparisons as PayPal registered strong growth during the height of the pandemic.
Outlook
While this is a difficult period for growth equities, we want to reassure you that we retain high conviction in our investment process and portfolio holdings. We acknowledge the challenging environment and are closely monitoring the fundamentals of our investments. But our long-term focus also leads us to look through the short-term noise. Indeed, we believe many enduring secular growth trends will persist, such as a shift to electric vehicles; aging global demographics intersecting with advancements in health care; companies shifting more of their expenditures to technology; and increased digitization of transactions, among many others. As such, we believe this period can create attractive opportunities for long-term investors willing to be patient with companies that we believe are poised to grow over time.
As a result of this approach, the fund’s sector allocations are primarily the result of this investment process emphasizing growth and individual security selection. Our holdings are concentrated among companies that we believe have good management teams and are producing very strong earnings growth and have demonstrated their unique value proposition for customers. We think these companies are well positioned competitively.
6
| Fund Characteristics | ||
| JULY 31, 2022 | |||||
| Types of Investments in Portfolio | % of net assets | ||||
| Common Stocks | 98.7% | ||||
| Short-Term Investments | 1.5% | ||||
| Other Assets and Liabilities | (0.2)% | ||||
| Top Five Industries | % of net assets | ||||
| IT Services | 12.5% | ||||
| Automobiles | 9.3% | ||||
| Internet and Direct Marketing Retail | 9.2% | ||||
| Software | 9.0% | ||||
| Interactive Media and Services | 8.6% | ||||
7
| Shareholder Fee Example | ||
Fund shareholders may incur two types of costs: (1) transaction costs, including sales charges (loads) on purchase payments and redemption/exchange fees; and (2) ongoing costs, including management fees; distribution and service (12b-1) fees; and other fund expenses. This example is intended to help you understand your ongoing costs (in dollars) of investing in your fund and to compare these costs with the ongoing cost of investing in other mutual funds.
The example is based on an investment of $1,000 made at the beginning of the period and held for the entire period from February 1, 2022 to July 31, 2022.
Actual Expenses
The table provides information about actual account values and actual expenses for each class. You may use the information, together with the amount you invested, to estimate the expenses that you paid over the period. First, identify the share class you own. Then simply divide your account value by $1,000 (for example, an $8,600 account value divided by $1,000 = 8.6), then multiply the result by the number under the heading “Expenses Paid During Period” to estimate the expenses you paid on your account during this period.
If you hold Investor Class shares of any American Century Investments fund, or I Class shares of the American Century Diversified Bond Fund, in an American Century Investments account (i.e., not through a financial intermediary or employer-sponsored retirement plan account), American Century Investments may charge you a $25.00 annual account maintenance fee if the value of those shares is less than $10,000. We will redeem shares automatically in one of your accounts to pay the $25.00 fee. In determining your total eligible investment amount, we will include your investments in all personal accounts (including American Century Investments brokerage accounts) registered under your Social Security number. Personal accounts include individual accounts, joint accounts, UGMA/UTMA accounts, personal trusts, Coverdell Education Savings Accounts and IRAs (including traditional, Roth, Rollover, SEP-, SARSEP- and SIMPLE-IRAs), and certain other retirement accounts. If you have only business, business retirement, employer-sponsored or American Century Investments brokerage accounts, you are currently not subject to this fee. If you are subject to the account maintenance fee, your account value could be reduced by the fee amount.
Hypothetical Example for Comparison Purposes
The table also provides information about hypothetical account values and hypothetical expenses based on the actual expense ratio of each class of your fund and an assumed rate of return of 5% per year before expenses, which is not the actual return of a fund’s share class. The hypothetical account values and expenses may not be used to estimate the actual ending account balance or expenses you paid for the period. You may use this information to compare the ongoing costs of investing in your fund and other funds. To do so, compare this 5% hypothetical example with the 5% hypothetical examples that appear in the shareholder reports of the other funds.
Please note that the expenses shown in the table are meant to highlight your ongoing costs only and do not reflect any transactional costs, such as sales charges (loads) or redemption/exchange fees. Therefore, the table is useful in comparing ongoing costs only, and will not help you determine the relative total costs of owning different funds. In addition, if these transactional costs were included, your costs would have been higher.
8
| Beginning Account Value 2/1/22 | Ending Account Value 7/31/22 | Expenses Paid During Period(1) 2/1/22 - 7/31/22 | Annualized Expense Ratio(1) | |||||||||||
| Actual | ||||||||||||||
| Investor Class | $1,000 | $842.90 | $3.93 | 0.86% | ||||||||||
| I Class | $1,000 | $843.90 | $3.02 | 0.66% | ||||||||||
| A Class | $1,000 | $842.00 | $5.07 | 1.11% | ||||||||||
| R Class | $1,000 | $840.90 | $6.21 | 1.36% | ||||||||||
| R6 Class | $1,000 | $844.30 | $2.33 | 0.51% | ||||||||||
| G Class | $1,000 | $846.50 | $0.05 | 0.01% | ||||||||||
| Hypothetical | ||||||||||||||
| Investor Class | $1,000 | $1,020.53 | $4.31 | 0.86% | ||||||||||
| I Class | $1,000 | $1,021.52 | $3.31 | 0.66% | ||||||||||
| A Class | $1,000 | $1,019.29 | $5.56 | 1.11% | ||||||||||
| R Class | $1,000 | $1,018.05 | $6.81 | 1.36% | ||||||||||
| R6 Class | $1,000 | $1,022.27 | $2.56 | 0.51% | ||||||||||
| G Class | $1,000 | $1,024.74 | $0.05 | 0.01% | ||||||||||
(1)Expenses are equal to the class's annualized expense ratio listed in the table above, multiplied by the average account value over the period, multiplied by 181, the number of days in the most recent fiscal half-year, divided by 365, to reflect the one-half year period. Annualized expense ratio reflects actual expenses, including any applicable fee waivers or expense reimbursements and excluding any acquired fund fees and expenses.
9
| Schedule of Investments | ||
JULY 31, 2022
| Shares | Value | |||||||
COMMON STOCKS — 98.7% | ||||||||
| Aerospace and Defense — 0.4% | ||||||||
Rocket Lab USA, Inc.(1) | 1,314,887 | $ | 6,140,522 | |||||
| Automobiles — 9.3% | ||||||||
Tesla, Inc.(1) | 174,619 | 155,664,107 | ||||||
| Beverages — 7.6% | ||||||||
Boston Beer Co., Inc., Class A(1) | 65,302 | 24,842,840 | ||||||
| Constellation Brands, Inc., Class A | 416,762 | 102,652,648 | ||||||
| 127,495,488 | ||||||||
| Biotechnology — 7.5% | ||||||||
Alnylam Pharmaceuticals, Inc.(1) | 167,187 | 23,747,242 | ||||||
Argenx SE, ADR(1) | 81,825 | 29,801,483 | ||||||
Ascendis Pharma A/S, ADR(1) | 130,915 | 11,197,160 | ||||||
Blueprint Medicines Corp.(1) | 170,301 | 8,695,569 | ||||||
Regeneron Pharmaceuticals, Inc.(1) | 88,861 | 51,689,555 | ||||||
| 125,131,009 | ||||||||
| Capital Markets — 5.9% | ||||||||
| Intercontinental Exchange, Inc. | 420,847 | 42,922,186 | ||||||
| S&P Global, Inc. | 149,024 | 56,171,616 | ||||||
| 99,093,802 | ||||||||
| Electronic Equipment, Instruments and Components — 1.7% | ||||||||
| Cognex Corp. | 560,851 | 28,592,184 | ||||||
| Energy Equipment and Services — 1.4% | ||||||||
| Cactus, Inc., Class A | 547,015 | 22,750,354 | ||||||
| Entertainment — 0.4% | ||||||||
Netflix, Inc.(1) | 27,787 | 6,249,296 | ||||||
| Health Care Equipment and Supplies — 4.2% | ||||||||
Intuitive Surgical, Inc.(1) | 247,010 | 56,854,292 | ||||||
Silk Road Medical, Inc.(1) | 300,577 | 13,679,259 | ||||||
| 70,533,551 | ||||||||
| Hotels, Restaurants and Leisure — 3.0% | ||||||||
Chipotle Mexican Grill, Inc.(1) | 32,353 | 50,607,210 | ||||||
| Interactive Media and Services — 8.6% | ||||||||
Alphabet, Inc., Class C(1) | 1,176,740 | 137,254,953 | ||||||
Meta Platforms, Inc., Class A(1) | 46,307 | 7,367,444 | ||||||
| 144,622,397 | ||||||||
| Internet and Direct Marketing Retail — 9.2% | ||||||||
Amazon.com, Inc.(1) | 1,148,436 | 154,981,438 | ||||||
| IT Services — 12.5% | ||||||||
Block, Inc.(1) | 375,005 | 28,522,880 | ||||||
| Mastercard, Inc., Class A | 184,621 | 65,317,064 | ||||||
Okta, Inc.(1) | 420,953 | 41,442,823 | ||||||
| Visa, Inc., Class A | 354,855 | 75,268,294 | ||||||
| 210,551,061 | ||||||||
| Machinery — 6.7% | ||||||||
| FANUC Corp. | 233,800 | 40,321,256 | ||||||
| Westinghouse Air Brake Technologies Corp. | 775,255 | 72,463,085 | ||||||
| 112,784,341 | ||||||||
10
| Shares | Value | |||||||
| Professional Services — 1.2% | ||||||||
| Verisk Analytics, Inc. | 103,115 | $ | 19,617,629 | |||||
| Semiconductors and Semiconductor Equipment — 7.3% | ||||||||
| Monolithic Power Systems, Inc. | 151,463 | 70,387,886 | ||||||
| NVIDIA Corp. | 288,556 | 52,410,426 | ||||||
| 122,798,312 | ||||||||
| Software — 9.0% | ||||||||
Bill.com Holdings, Inc.(1) | 280,271 | 37,859,007 | ||||||
DocuSign, Inc.(1) | 359,213 | 22,982,448 | ||||||
Paylocity Holding Corp.(1) | 271,781 | 55,967,861 | ||||||
Salesforce, Inc.(1) | 190,974 | 35,143,035 | ||||||
| 151,952,351 | ||||||||
| Textiles, Apparel and Luxury Goods — 2.8% | ||||||||
| NIKE, Inc., Class B | 416,089 | 47,816,948 | ||||||
TOTAL COMMON STOCKS (Cost $1,368,340,136) | 1,657,382,000 | |||||||
SHORT-TERM INVESTMENTS — 1.5% | ||||||||
Money Market Funds† | ||||||||
| State Street Institutional U.S. Government Money Market Fund, Premier Class | 28,758 | 28,758 | ||||||
| Repurchase Agreements — 1.5% | ||||||||
| BMO Capital Markets Corp., (collateralized by various U.S. Treasury obligations, 1.625% - 3.00%, 5/31/23 - 2/15/48, valued at $3,299,177), in a joint trading account at 2.18%, dated 7/29/22, due 8/1/22 (Delivery value $3,235,818) | 3,235,230 | |||||||
| Fixed Income Clearing Corp., (collateralized by various U.S. Treasury obligations, 2.250%, 8/15/49, valued at $23,118,358), at 2.23%, dated 7/29/22, due 8/1/22 (Delivery value $22,669,212) | 22,665,000 | |||||||
| 25,900,230 | ||||||||
TOTAL SHORT-TERM INVESTMENTS (Cost $25,928,988) | 25,928,988 | |||||||
TOTAL INVESTMENT SECURITIES — 100.2% (Cost $1,394,269,124) | 1,683,310,988 | |||||||
OTHER ASSETS AND LIABILITIES — (0.2)% | (3,202,542) | |||||||
TOTAL NET ASSETS — 100.0% | $ | 1,680,108,446 | ||||||
| NOTES TO SCHEDULE OF INVESTMENTS | ||||||||
| ADR | - | American Depositary Receipt | ||||||
†Category is less than 0.05% of total net assets.
(1)Non-income producing.
See Notes to Financial Statements.
11
| Statement of Assets and Liabilities | ||
| JULY 31, 2022 | |||||
| Assets | |||||
| Investment securities, at value (cost of $1,394,269,124) | $ | 1,683,310,988 | |||
| Receivable for capital shares sold | 1,168,556 | ||||
| Dividends and interest receivable | 95,288 | ||||
| Securities lending receivable | 262 | ||||
| 1,684,575,094 | |||||
| Liabilities | |||||
| Payable for investments purchased | 2,122,856 | ||||
| Payable for capital shares redeemed | 1,597,197 | ||||
| Accrued management fees | 739,008 | ||||
| Distribution and service fees payable | 7,587 | ||||
| 4,466,648 | |||||
| Net Assets | $ | 1,680,108,446 | |||
| Net Assets Consist of: | |||||
| Capital (par value and paid-in surplus) | $ | 1,564,400,809 | |||
| Distributable earnings | 115,707,637 | ||||
| $ | 1,680,108,446 | ||||
| Net Assets | Shares Outstanding | Net Asset Value Per Share* | |||||||||
| Investor Class, $0.01 Par Value | $735,963,055 | 17,695,227 | $41.59 | ||||||||
| I Class, $0.01 Par Value | $421,104,581 | 9,984,637 | $42.18 | ||||||||
| A Class, $0.01 Par Value | $14,840,246 | 363,930 | $40.78 | ||||||||
| R Class, $0.01 Par Value | $11,633,850 | 291,134 | $39.96 | ||||||||
| R6 Class, $0.01 Par Value | $41,751,759 | 969,540 | $43.06 | ||||||||
| G Class, $0.01 Par Value | $454,814,955 | 10,383,048 | $43.80 | ||||||||
*Maximum offering price per share was equal to the net asset value per share for all share classes, except Class A, for which the maximum offering price per share was $43.27 (net asset value divided by 0.9425). A contingent deferred sales charge may be imposed on redemptions of Class A.
See Notes to Financial Statements.
12
| Statement of Operations | ||
| YEAR ENDED JULY 31, 2022 | |||||
| Investment Income (Loss) | |||||
| Income: | |||||
| Dividends (net of foreign taxes withheld of $108,372) | $ | 5,860,438 | |||
| Securities lending, net | 299,072 | ||||
| Interest | 40,386 | ||||
| 6,199,896 | |||||
| Expenses: | |||||
| Management fees | 15,979,183 | ||||
| Distribution and service fees: | |||||
| A Class | 49,064 | ||||
| R Class | 66,801 | ||||
| Directors' fees and expenses | 55,686 | ||||
| Other expenses | 58,906 | ||||
| 16,209,640 | |||||
| Fees waived - G Class | (2,384,398) | ||||
| 13,825,242 | |||||
| Net investment income (loss) | (7,625,346) | ||||
| Realized and Unrealized Gain (Loss) | |||||
| Net realized gain (loss) on: | |||||
| Investment transactions | (154,125,562) | ||||
| Foreign currency translation transactions | (29,282) | ||||
| (154,154,844) | |||||
| Change in net unrealized appreciation (depreciation) on investments | (568,898,272) | ||||
| Net realized and unrealized gain (loss) | (723,053,116) | ||||
| Net Increase (Decrease) in Net Assets Resulting from Operations | $ | (730,678,462) | |||
See Notes to Financial Statements.
13
| Statement of Changes in Net Assets | ||
| YEARS ENDED JULY 31, 2022 AND JULY 31, 2021 | ||||||||
| Increase (Decrease) in Net Assets | July 31, 2022 | July 31, 2021 | ||||||
| Operations | ||||||||
| Net investment income (loss) | $ | (7,625,346) | $ | (7,420,678) | ||||
| Net realized gain (loss) | (154,154,844) | 65,148,883 | ||||||
| Change in net unrealized appreciation (depreciation) | (568,898,272) | 531,540,932 | ||||||
| Net increase (decrease) in net assets resulting from operations | (730,678,462) | 589,269,137 | ||||||
| Distributions to Shareholders | ||||||||
| From earnings: | ||||||||
| Investor Class | (31,507,033) | (6,347,386) | ||||||
| I Class | (17,567,092) | (2,711,822) | ||||||
| A Class | (548,377) | (49,793) | ||||||
| R Class | (378,862) | (64,216) | ||||||
| R6 Class | (1,120,998) | (9,446) | ||||||
| G Class | (11,387,272) | (2,706,526) | ||||||
| Decrease in net assets from distributions | (62,509,634) | (11,889,189) | ||||||
| Capital Share Transactions | ||||||||
| Net increase (decrease) in net assets from capital share transactions (Note 5) | (252,656,179) | 762,468,893 | ||||||
| Net increase (decrease) in net assets | (1,045,844,275) | 1,339,848,841 | ||||||
| Net Assets | ||||||||
| Beginning of period | 2,725,952,721 | 1,386,103,880 | ||||||
| End of period | $ | 1,680,108,446 | $ | 2,725,952,721 | ||||
See Notes to Financial Statements.
14
| Notes to Financial Statements | ||
JULY 31, 2022
1. Organization
American Century Growth Funds, Inc. (the corporation) is registered under the Investment Company Act of 1940, as amended (the 1940 Act), as an open-end management investment company and is organized as a Maryland corporation. Focused Dynamic Growth Fund (the fund) is one fund in a series issued by the corporation. The fund’s investment objective is to seek long-term capital growth.
The fund offers the Investor Class, I Class, A Class, R Class, R6 Class and G Class. The A Class may incur an initial sales charge and may be subject to a contingent deferred sales charge.
2. Significant Accounting Policies
The following is a summary of significant accounting policies consistently followed by the fund in preparation of its financial statements. The fund is an investment company and follows accounting and reporting guidance in accordance with accounting principles generally accepted in the United States of America. This may require management to make certain estimates and assumptions at the date of the financial statements. Actual results could differ from these estimates. Management evaluated the impact of events or transactions occurring through the date the financial statements were issued that would merit recognition or disclosure.
Investment Valuations — The fund determines the fair value of its investments and computes its net asset value (NAV) per share at the close of regular trading (usually 4 p.m. Eastern time) on the New York Stock Exchange (NYSE) on each day the NYSE is open. The Board of Directors has adopted valuation policies and procedures to guide the investment advisor in the fund’s investment valuation process and to provide methodologies for the oversight of the fund’s pricing function.
Equity securities that are listed or traded on a domestic securities exchange are valued at the last reported sales price or at the official closing price as provided by the exchange. Equity securities traded on foreign securities exchanges are generally valued at the closing price of such securities on the exchange where primarily traded or at the close of the NYSE, if that is earlier. If no last sales price is reported, or if local convention or regulation so provides, the mean of the latest bid and asked prices may be used. Securities traded over-the-counter are valued at the mean of the latest bid and asked prices, the last sales price, or the official closing price. Equity securities initially expressed in local currencies are translated into U.S. dollars at the mean of the appropriate currency exchange rate at the close of the NYSE as provided by an independent pricing service.
Open-end management investment companies are valued at the reported NAV per share. Repurchase agreements are valued at cost, which approximates fair value.
If the fund determines that the market price for an investment is not readily available or the valuation methods mentioned above do not reflect an investment’s fair value, such investment is valued as determined in good faith by the Board of Directors or its delegate, in accordance with policies and procedures adopted by the Board of Directors. In its determination of fair value, the fund may review several factors including, but not limited to, market information regarding the specific investment or comparable investments and correlation with other investment types, futures indices or general market indicators. Circumstances that may cause the fund to use these procedures to value an investment include, but are not limited to: an investment has been declared in default or is distressed; trading in a security has been suspended during the trading day or a security is not actively trading on its principal exchange; prices received from a regular pricing source are deemed unreliable; or there is a foreign market holiday and no trading occurred.
15
The fund monitors for significant events occurring after the close of an investment’s primary exchange but before the fund’s NAV per share is determined. Significant events may include, but are not limited to: corporate announcements and transactions; governmental action and political unrest that could impact a specific investment or an investment sector; or armed conflicts, natural disasters and similar events that could affect investments in a specific country or region. The fund also monitors for significant fluctuations between domestic and foreign markets, as evidenced by the U.S. market or such other indicators that the Board of Directors, or its delegate, deems appropriate. The fund may apply a model-derived factor to the closing price of equity securities traded on foreign securities exchanges. The factor is based on observable market data as provided by an independent pricing service.
Security Transactions — Security transactions are accounted for as of the trade date. Net realized gains and losses are determined on the identified cost basis, which is also used for federal income tax purposes.
Investment Income — Dividend income less foreign taxes withheld, if any, is recorded as of the ex-dividend date. Distributions received on securities that represent a return of capital or long-term capital gain are recorded as a reduction of cost of investments and/or as a realized gain. The fund may estimate the components of distributions received that may be considered nontaxable distributions or long-term capital gain distributions for income tax purposes. Interest income is recorded on the accrual basis and includes accretion of discounts and amortization of premiums. Securities lending income is net of fees and rebates earned by the lending agent for its services.
Foreign Currency Translations — All assets and liabilities initially expressed in foreign currencies are translated into U.S. dollars at prevailing exchange rates at period end. The fund may enter into spot foreign currency exchange contracts to facilitate transactions denominated in a foreign currency. Purchases and sales of investment securities, dividend and interest income, spot foreign currency exchange contracts, and expenses are translated at the rates of exchange prevailing on the respective dates of such transactions. Net realized and unrealized foreign currency exchange gains or losses related to investment securities are a component of net realized gain (loss) on investment transactions and change in net unrealized appreciation (depreciation) on investments, respectively.
Repurchase Agreements — The fund may enter into repurchase agreements with institutions that American Century Investment Management, Inc. (ACIM) (the investment advisor) has determined are creditworthy pursuant to criteria adopted by the Board of Directors. The fund requires that the collateral, represented by securities, received in a repurchase transaction be transferred to the custodian in a manner sufficient to enable the fund to obtain those securities in the event of a default under the repurchase agreement. ACIM monitors, on a daily basis, the securities transferred to ensure the value, including accrued interest, of the securities under each repurchase agreement is equal to or greater than amounts owed to the fund under each repurchase agreement.
Joint Trading Account — Pursuant to an Exemptive Order issued by the Securities and Exchange Commission, the fund, along with certain other funds in the American Century Investments family of funds, may transfer uninvested cash balances into a joint trading account. These balances are invested in one or more repurchase agreements that are collateralized by U.S. Treasury or Agency obligations.
Segregated Assets — In accordance with the 1940 Act, the fund segregates assets on its books and records to cover certain types of investment securities and other financial instruments. ACIM monitors, on a daily basis, the securities segregated to ensure the fund designates a sufficient amount of liquid assets, marked-to-market daily. The fund may also receive assets or be required to pledge assets at the custodian bank or with a broker for collateral requirements.
Income Tax Status — It is the fund’s policy to distribute substantially all net investment income and net realized gains to shareholders and to otherwise qualify as a regulated investment company under provisions of the Internal Revenue Code. Accordingly, no provision has been made for income taxes. The fund files U.S. federal, state, local and non-U.S. tax returns as applicable. The fund's tax returns are subject to examination by the relevant taxing authority until expiration of the applicable statute of limitations, which is generally three years from the date of filing but can be longer in certain jurisdictions. At this time, management believes there are no uncertain tax positions which, based on their technical merit, would not be sustained upon examination and for which it is reasonably possible that the total amounts of unrecognized tax benefits will significantly change in the next twelve months.
16
Multiple Class — All shares of the fund represent an equal pro rata interest in the net assets of the class to which such shares belong, and have identical voting, dividend, liquidation and other rights and the same terms and conditions, except for class specific expenses and exclusive rights to vote on matters affecting only individual classes. Income, non-class specific expenses, and realized and unrealized capital gains and losses of the fund are allocated to each class of shares based on their relative net assets.
Distributions to Shareholders — Distributions from net investment income and net realized gains, if any, are generally declared and paid annually.
Indemnifications — Under the corporation’s organizational documents, its officers and directors are indemnified against certain liabilities arising out of the performance of their duties to the fund. In addition, in the normal course of business, the fund enters into contracts that provide general indemnifications. The maximum exposure under these arrangements is unknown as this would involve future claims that may be made against a fund. The risk of material loss from such claims is considered by management to be remote.
Securities Lending — Securities are lent to qualified financial institutions and brokers. State Street Bank & Trust Co. serves as securities lending agent to the fund pursuant to a Securities Lending Agreement. The lending of securities exposes the fund to risks such as: the borrowers may fail to return the loaned securities, the borrowers may not be able to provide additional collateral, the fund may experience delays in recovery of the loaned securities or delays in access to collateral, or the fund may experience losses related to the investment collateral. To minimize certain risks, loan counterparties pledge collateral in the form of cash and/or securities. The lending agent has agreed to indemnify the fund in the case of default of any securities borrowed. Cash collateral received is invested in the State Street Navigator Securities Lending Government Money Market Portfolio, a money market mutual fund registered under the 1940 Act. The loans may also be secured by U.S. government securities in an amount at least equal to the market value of the securities loaned, plus accrued interest and dividends, determined on a daily basis and adjusted accordingly. By lending securities, the fund seeks to increase its net investment income through the receipt of interest and fees. Such income is reflected separately within the Statement of Operations. The value of loaned securities and related collateral outstanding at period end, if any, are shown on a gross basis within the Schedule of Investments and Statement of Assets and Liabilities.
3. Fees and Transactions with Related Parties
Certain officers and directors of the corporation are also officers and/or directors of American Century Companies, Inc. (ACC). The corporation’s investment advisor, ACIM, the corporation's distributor, American Century Investment Services, Inc. (ACIS), and the corporation’s transfer agent, American Century Services, LLC, are wholly owned, directly or indirectly, by ACC. Various funds issued by American Century Asset Allocation Portfolios, Inc. own, in aggregate, 17% of the shares of the fund.
Management Fees — The corporation has entered into a management agreement with ACIM, under which ACIM provides the fund with investment advisory and management services in exchange for a single, unified management fee (the fee) per class. The agreement provides that ACIM will pay all expenses of managing and operating the fund, except brokerage expenses, taxes, interest, fees and expenses of the independent directors (including legal counsel fees), extraordinary expenses, and expenses incurred in connection with the provision of shareholder services and distribution services under a plan adopted pursuant to Rule 12b-1 under the 1940 Act. The fee is computed and accrued daily based on each class's daily net assets and paid monthly in arrears. The difference in the fee among the classes is a result of their separate arrangements for non-Rule 12b-1 shareholder services. It is not the result of any difference in advisory or custodial fees or other expenses related to the management of the fund's assets, which do not vary by class. The rate of the fee is determined by applying a fee rate calculation formula. This formula takes into account the fund's assets as well as certain assets, if any, of other clients of the investment advisor outside the American Century Investments family of funds (such as subadvised funds and separate accounts) that use very similar investment teams and strategies (strategy assets). The investment advisor agreed to waive the G Class's management fee in its entirety. The investment advisor expects this waiver to remain in effect permanently and cannot terminate it without the approval of the Board of Directors.
17
The management fee schedule range and the effective annual management fee for each class for the period ended July 31, 2022, are as follows:
Management Fee Schedule Range | Effective Annual Management Fee | |||||||
| Investor Class | 0.80% to 0.85% | 0.85% | ||||||
| I Class | 0.60% to 0.65% | 0.65% | ||||||
| A Class | 0.80% to 0.85% | 0.85% | ||||||
| R Class | 0.80% to 0.85% | 0.85% | ||||||
| R6 Class | 0.45% to 0.50% | 0.50% | ||||||
| G Class | 0.45% to 0.50% | 0.00%(1) | ||||||
(1)Effective annual management fee before waiver was 0.50%.
Distribution and Service Fees — The Board of Directors has adopted a separate Master Distribution and Individual Shareholder Services Plan for each of the A Class and R Class (collectively the plans), pursuant to Rule 12b-1 of the 1940 Act. The plans provide that the A Class will pay ACIS an annual distribution and service fee of 0.25%. The plans provide that the R Class will pay ACIS an annual distribution and service fee of 0.50%. The fees are computed and accrued daily based on each class’s daily net assets and paid monthly in arrears. The fees are used to pay financial intermediaries for distribution and individual shareholder services. Fees incurred under the plans during the period ended July 31, 2022 are detailed in the Statement of Operations.
Directors' Fees and Expenses — The Board of Directors is responsible for overseeing the investment advisor’s management and operations of the fund. The directors receive detailed information about the fund and its investment advisor regularly throughout the year, and meet at least quarterly with management of the investment advisor to review reports about fund operations. The fund’s officers do not receive compensation from the fund.
Interfund Transactions — The fund may enter into security transactions with other American Century Investments funds and other client accounts of the investment advisor, in accordance with the 1940 Act rules and procedures adopted by the Board of Directors. The rules and procedures require, among other things, that these transactions be effected at the independent current market price of the security. There were no interfund transactions during the period.
4. Investment Transactions
Purchases and sales of investment securities, excluding short-term investments, for the period ended July 31, 2022 were $507,160,666 and $817,644,894, respectively.
18
5. Capital Share Transactions
The corporation is authorized to issue 3,000,000,000 shares. Transactions in shares of the fund were as follows:
| Year ended July 31, 2022 | Year ended July 31, 2021 | |||||||||||||
| Shares | Amount | Shares | Amount | |||||||||||
| Investor Class | ||||||||||||||
| Sold | 4,310,874 | $ | 231,990,735 | 18,777,278 | $ | 977,809,720 | ||||||||
| Issued in reinvestment of distributions | 545,087 | 30,846,490 | 114,787 | 6,035,495 | ||||||||||
| Redeemed | (10,028,007) | (501,198,588) | (10,632,225) | (555,592,071) | ||||||||||
| (5,172,046) | (238,361,363) | 8,259,840 | 428,253,144 | |||||||||||
| I Class | ||||||||||||||
| Sold | 6,342,968 | 326,601,359 | 10,567,508 | 569,718,676 | ||||||||||
| Issued in reinvestment of distributions | 299,992 | 17,192,549 | 50,870 | 2,703,717 | ||||||||||
| Redeemed | (9,317,909) | (465,151,085) | (4,496,087) | (232,299,301) | ||||||||||
| (2,674,949) | (121,357,177) | 6,122,291 | 340,123,092 | |||||||||||
| A Class | ||||||||||||||
| Sold | 139,747 | 6,920,284 | 454,982 | 24,452,958 | ||||||||||
| Issued in reinvestment of distributions | 9,739 | 541,224 | 941 | 48,736 | ||||||||||
| Redeemed | (155,371) | (7,044,923) | (257,338) | (13,122,350) | ||||||||||
| (5,885) | 416,585 | 198,585 | 11,379,344 | |||||||||||
| R Class | ||||||||||||||
| Sold | 114,536 | 5,612,179 | 183,506 | 9,381,959 | ||||||||||
| Issued in reinvestment of distributions | 6,946 | 378,862 | 559 | 27,838 | ||||||||||
| Redeemed | (93,467) | (4,631,725) | (70,585) | (3,626,997) | ||||||||||
| 28,015 | 1,359,316 | 113,480 | 5,782,800 | |||||||||||
| R6 Class | ||||||||||||||
| Sold | 559,433 | 30,034,184 | 679,567 | 38,632,627 | ||||||||||
| Issued in reinvestment of distributions | 19,145 | 1,119,236 | 167 | 9,026 | ||||||||||
| Redeemed | (244,072) | (12,904,544) | (54,385) | (3,120,479) | ||||||||||
| 334,506 | 18,248,876 | 625,349 | 35,521,174 | |||||||||||
| G Class | ||||||||||||||
| Sold | 2,654,901 | 131,464,351 | 1,289,555 | 70,780,465 | ||||||||||
| Issued in reinvestment of distributions | 192,125 | 11,387,272 | 49,588 | 2,706,526 | ||||||||||
| Redeemed | (943,689) | (55,814,039) | (2,488,354) | (132,077,652) | ||||||||||
| 1,903,337 | 87,037,584 | (1,149,211) | (58,590,661) | |||||||||||
| Net increase (decrease) | (5,587,022) | $ | (252,656,179) | 14,170,334 | $ | 762,468,893 | ||||||||
6. Fair Value Measurements
The fund’s investments valuation process is based on several considerations and may use multiple inputs to determine the fair value of the investments held by the fund. In conformity with accounting principles generally accepted in the United States of America, the inputs used to determine a valuation are classified into three broad levels.
•Level 1 valuation inputs consist of unadjusted quoted prices in an active market for identical investments.
•Level 2 valuation inputs consist of direct or indirect observable market data (including quoted prices for comparable investments, evaluations of subsequent market events, interest rates, prepayment speeds, credit risk, etc.). These inputs also consist of quoted prices for identical investments initially expressed in local currencies that are adjusted through translation into U.S. dollars.
•Level 3 valuation inputs consist of unobservable data (including a fund’s own assumptions).
19
The level classification is based on the lowest level input that is significant to the fair valuation measurement. The valuation inputs are not necessarily an indication of the risks associated with investing in these securities or other financial instruments.
The following is a summary of the level classifications as of period end. The Schedule of Investments provides additional information on the fund’s portfolio holdings.
| Level 1 | Level 2 | Level 3 | |||||||||
| Assets | |||||||||||
| Investment Securities | |||||||||||
| Common Stocks | $ | 1,617,060,744 | $ | 40,321,256 | — | ||||||
| Short-Term Investments | 28,758 | 25,900,230 | — | ||||||||
| $ | 1,617,089,502 | $ | 66,221,486 | — | |||||||
7. Risk Factors
The value of the fund’s shares will go up and down, sometimes rapidly or unpredictably, based on the performance of the securities owned by the fund and other factors generally affecting the securities market. Market risks, including political, regulatory, economic and social developments, can affect the value of the fund’s investments. Natural disasters, public health emergencies, war, terrorism and other unforeseeable events may lead to increased market volatility and may have adverse long-term effects on world economies and markets generally.
8. Federal Tax Information
The tax character of distributions paid during the years ended July 31, 2022 and July 31, 2021 were as follows:
| 2022 | 2021 | |||||||
| Distributions Paid From | ||||||||
| Ordinary income | $ | 33,199,382 | $ | 1,068,234 | ||||
| Long-term capital gains | $ | 29,310,252 | $ | 10,820,955 | ||||
The book-basis character of distributions made during the year from net investment income or net realized gains may differ from their ultimate characterization for federal income tax purposes. These differences reflect the differing character of certain income items and net realized gains and losses for financial statement and tax purposes, and may result in reclassification among certain capital accounts on the financial statements.
As of period end, the federal tax cost of investments and the components of distributable earnings on a tax-basis were as follows:
| Federal tax cost of investments | $ | 1,396,427,116 | |||
| Gross tax appreciation of investments | $ | 378,883,613 | |||
| Gross tax depreciation of investments | (91,999,741) | ||||
| Net tax appreciation (depreciation) of investments | $ | 286,883,872 | |||
| Undistributed ordinary income | — | ||||
| Late-year ordinary loss deferral | $ | (3,503,945) | |||
| Post-October capital loss deferral | $ | (167,672,290) | |||
The difference between book-basis and tax-basis unrealized appreciation (depreciation) is attributable primarily to the tax deferral of losses on wash sales.
Loss deferrals represent certain qualified losses that the fund has elected to treat as having been incurred in
the following fiscal year for federal income tax purposes.
20
| Financial Highlights | ||
| For a Share Outstanding Throughout the Years Ended July 31 (except as noted) | |||||||||||||||||||||||||||||||||||||||||
| Per-Share Data | Ratios and Supplemental Data | ||||||||||||||||||||||||||||||||||||||||
| Income From Investment Operations: | Ratio to Average Net Assets of: | ||||||||||||||||||||||||||||||||||||||||
| Net Asset Value, Beginning of Period | Net Investment Income (Loss)(1) | Net Realized and Unrealized Gain (Loss) | Total From Investment Operations | Distributions From Net Realized Gains | Net Asset Value, End of Period | Total Return(2) | Operating Expenses | Operating Expenses (before expense waiver) | Net Investment Income (Loss) | Net Investment Income (Loss) (before expense waiver) | Portfolio Turnover Rate | Net Assets, End of Period (in thousands) | |||||||||||||||||||||||||||||
| Investor Class | |||||||||||||||||||||||||||||||||||||||||
| 2022 | $59.53 | (0.30) | (16.25) | (16.55) | (1.39) | $41.59 | (28.42)% | 0.86% | 0.86% | (0.58)% | (0.58)% | 23% | $735,963 | ||||||||||||||||||||||||||||
| 2021 | $44.02 | (0.31) | 16.15 | 15.84 | (0.33) | $59.53 | 36.09% | 0.84% | 1.01% | (0.58)% | (0.75)% | 12% | $1,361,233 | ||||||||||||||||||||||||||||
| 2020 | $29.60 | (0.21) | 14.63 | 14.42 | — | $44.02 | 48.72% | 0.85% | 1.02% | (0.62)% | (0.79)% | 27% | $642,987 | ||||||||||||||||||||||||||||
| 2019 | $26.49 | (0.14) | 3.25 | 3.11 | — | $29.60 | 11.74% | 0.89% | 1.02% | (0.52)% | (0.65)% | 23% | $160,079 | ||||||||||||||||||||||||||||
| 2018 | $20.08 | (0.16) | 6.57 | 6.41 | — | $26.49 | 31.92% | 1.02% | 1.10% | (0.68)% | (0.76)% | 29% | $82,826 | ||||||||||||||||||||||||||||
| I Class | |||||||||||||||||||||||||||||||||||||||||
| 2022 | $60.22 | (0.20) | (16.45) | (16.65) | (1.39) | $42.18 | (28.26)% | 0.66% | 0.66% | (0.38)% | (0.38)% | 23% | $421,105 | ||||||||||||||||||||||||||||
| 2021 | $44.44 | (0.21) | 16.32 | 16.11 | (0.33) | $60.22 | 36.35% | 0.64% | 0.81% | (0.38)% | (0.55)% | 12% | $762,419 | ||||||||||||||||||||||||||||
| 2020 | $29.83 | (0.16) | 14.77 | 14.61 | — | $44.44 | 48.98% | 0.65% | 0.82% | (0.42)% | (0.59)% | 27% | $290,523 | ||||||||||||||||||||||||||||
| 2019 | $26.64 | (0.09) | 3.28 | 3.19 | — | $29.83 | 11.97% | 0.69% | 0.82% | (0.32)% | (0.45)% | 23% | $32,275 | ||||||||||||||||||||||||||||
| 2018 | $20.16 | (0.12) | 6.60 | 6.48 | — | $26.64 | 32.14% | 0.82% | 0.90% | (0.48)% | (0.56)% | 29% | $614 | ||||||||||||||||||||||||||||
| For a Share Outstanding Throughout the Years Ended July 31 (except as noted) | |||||||||||||||||||||||||||||||||||||||||
| Per-Share Data | Ratios and Supplemental Data | ||||||||||||||||||||||||||||||||||||||||
| Income From Investment Operations: | Ratio to Average Net Assets of: | ||||||||||||||||||||||||||||||||||||||||
| Net Asset Value, Beginning of Period | Net Investment Income (Loss)(1) | Net Realized and Unrealized Gain (Loss) | Total From Investment Operations | Distributions From Net Realized Gains | Net Asset Value, End of Period | Total Return(2) | Operating Expenses | Operating Expenses (before expense waiver) | Net Investment Income (Loss) | Net Investment Income (Loss) (before expense waiver) | Portfolio Turnover Rate | Net Assets, End of Period (in thousands) | |||||||||||||||||||||||||||||
| A Class | |||||||||||||||||||||||||||||||||||||||||
| 2022 | $58.54 | (0.41) | (15.96) | (16.37) | (1.39) | $40.78 | (28.58)% | 1.11% | 1.11% | (0.83)% | (0.83)% | 23% | $14,840 | ||||||||||||||||||||||||||||
| 2021 | $43.39 | (0.46) | 15.94 | 15.48 | (0.33) | $58.54 | 35.76% | 1.09% | 1.26% | (0.83)% | (1.00)% | 12% | $21,648 | ||||||||||||||||||||||||||||
| 2020 | $29.26 | (0.30) | 14.43 | 14.13 | — | $43.39 | 48.29% | 1.10% | 1.27% | (0.87)% | (1.04)% | 27% | $7,430 | ||||||||||||||||||||||||||||
| 2019 | $26.24 | (0.21) | 3.23 | 3.02 | — | $29.26 | 11.51% | 1.14% | 1.27% | (0.77)% | (0.90)% | 23% | $1,202 | ||||||||||||||||||||||||||||
| 2018 | $19.95 | (0.21) | 6.50 | 6.29 | — | $26.24 | 31.53% | 1.27% | 1.35% | (0.93)% | (1.01)% | 29% | $639 | ||||||||||||||||||||||||||||
| R Class | |||||||||||||||||||||||||||||||||||||||||
| 2022 | $57.53 | (0.53) | (15.65) | (16.18) | (1.39) | $39.96 | (28.77)% | 1.36% | 1.36% | (1.08)% | (1.08)% | 23% | $11,634 | ||||||||||||||||||||||||||||
| 2021 | $42.76 | (0.56) | 15.66 | 15.10 | (0.33) | $57.53 | 35.42% | 1.34% | 1.51% | (1.08)% | (1.25)% | 12% | $15,138 | ||||||||||||||||||||||||||||
| 2020 | $28.90 | (0.36) | 14.22 | 13.86 | — | $42.76 | 47.96% | 1.35% | 1.52% | (1.12)% | (1.29)% | 27% | $6,399 | ||||||||||||||||||||||||||||
| 2019 | $25.99 | (0.27) | 3.18 | 2.91 | — | $28.90 | 11.20% | 1.39% | 1.52% | (1.02)% | (1.15)% | 23% | $2,192 | ||||||||||||||||||||||||||||
| 2018 | $19.81 | (0.28) | 6.46 | 6.18 | — | $25.99 | 31.20% | 1.52% | 1.60% | (1.18)% | (1.26)% | 29% | $613 | ||||||||||||||||||||||||||||
| R6 Class | |||||||||||||||||||||||||||||||||||||||||
| 2022 | $61.37 | (0.12) | (16.80) | (16.92) | (1.39) | $43.06 | (28.17)% | 0.51% | 0.51% | (0.23)% | (0.23)% | 23% | $41,752 | ||||||||||||||||||||||||||||
| 2021 | $45.22 | (0.18) | 16.66 | 16.48 | (0.33) | $61.37 | 36.55% | 0.49% | 0.66% | (0.23)% | (0.40)% | 12% | $38,973 | ||||||||||||||||||||||||||||
| 2020 | $30.30 | (0.07) | 14.99 | 14.92 | — | $45.22 | 49.24% | 0.50% | 0.67% | (0.27)% | (0.44)% | 27% | $438 | ||||||||||||||||||||||||||||
| 2019 | $27.02 | (0.05) | 3.33 | 3.28 | — | $30.30 | 12.14% | 0.54% | 0.67% | (0.17)% | (0.30)% | 23% | $8,072 | ||||||||||||||||||||||||||||
| 2018 | $20.41 | (0.07) | 6.68 | 6.61 | — | $27.02 | 32.39% | 0.67% | 0.75% | (0.33)% | (0.41)% | 29% | $41 | ||||||||||||||||||||||||||||
| For a Share Outstanding Throughout the Years Ended July 31 (except as noted) | |||||||||||||||||||||||||||||||||||||||||
| Per-Share Data | Ratios and Supplemental Data | ||||||||||||||||||||||||||||||||||||||||
| Income From Investment Operations: | Ratio to Average Net Assets of: | ||||||||||||||||||||||||||||||||||||||||
| Net Asset Value, Beginning of Period | Net Investment Income (Loss)(1) | Net Realized and Unrealized Gain (Loss) | Total From Investment Operations | Distributions From Net Realized Gains | Net Asset Value, End of Period | Total Return(2) | Operating Expenses | Operating Expenses (before expense waiver) | Net Investment Income (Loss) | Net Investment Income (Loss) (before expense waiver) | Portfolio Turnover Rate | Net Assets, End of Period (in thousands) | |||||||||||||||||||||||||||||
| G Class | |||||||||||||||||||||||||||||||||||||||||
| 2022 | $62.09 | 0.14 | (17.04) | (16.90) | (1.39) | $43.80 | (27.80)% | 0.01% | 0.51% | 0.27% | (0.23)% | 23% | $454,815 | ||||||||||||||||||||||||||||
| 2021 | $45.52 | 0.14 | 16.76 | 16.90 | (0.33) | $62.09 | 37.23% | 0.00%(3) | 0.66% | 0.26% | (0.40)% | 12% | $526,543 | ||||||||||||||||||||||||||||
| 2020 | $30.35 | 0.08 | 15.09 | 15.17 | — | $45.52 | 49.98% | 0.00%(3) | 0.67% | 0.23% | (0.44)% | 27% | $438,327 | ||||||||||||||||||||||||||||
2019(4) | $28.72 | 0.02 | 1.61 | 1.63 | — | $30.35 | 5.68% | 0.00%(3)(5) | 0.67%(5) | 0.16%(5) | (0.51)%(5) | 23%(6) | $88 | ||||||||||||||||||||||||||||
| Notes to Financial Highlights | ||
(1)Computed using average shares outstanding throughout the period.
(2)Total returns are calculated based on the net asset value of the last business day and do not reflect applicable sales charges, if any. Total returns for periods less than one year are not annualized.
(3)Ratio was less than 0.005%.
(4)April 1, 2019 (commencement of sale) through July 31, 2019.
(5)Annualized.
(6)Portfolio turnover is calculated at the fund level. Percentage indicated was calculated for the year ended July 31, 2019.
See Notes to Financial Statements.
| Report of Independent Registered Public Accounting Firm | ||
To the Shareholders and the Board of Directors of American Century Growth Funds, Inc.:
Opinion on the Financial Statements and Financial Highlights
We have audited the accompanying statement of assets and liabilities, including the schedule of investments, of Focused Dynamic Growth Fund (the “Fund”), the fund comprising the American Century Growth Funds, Inc., as of July 31, 2022, the related statement of operations for the year then ended, the statements of changes in net assets for each of the two years in the period then ended, the financial highlights for each of the five years in the period then ended, and the related notes. In our opinion, the financial statements and financial highlights present fairly, in all material respects, the financial position of Focused Dynamic Growth Fund of the American Century Growth Funds, Inc. as of July 31, 2022, and the results of its operations for the year then ended, the changes in its net assets for each of the two years in the period then ended, and the financial highlights for each of the five years in the period then ended, in conformity with accounting principles generally accepted in the United States of America.
Basis for Opinion
These financial statements and financial highlights are the responsibility of the Fund's management. Our responsibility is to express an opinion on the Fund’s financial statements and financial highlights based on our audit. We are a public accounting firm registered with the Public Company Accounting Oversight Board (United States) (PCAOB) and are required to be independent with respect to the Fund in accordance with the U.S. federal securities laws and the applicable rules and regulations of the Securities and Exchange Commission and the PCAOB.
We conducted our audit in accordance with the standards of the PCAOB. Those standards require that we plan and perform the audit to obtain reasonable assurance about whether the financial statements and financial highlights are free of material misstatement, whether due to error or fraud. The Fund is not required to have, nor were we engaged to perform, an audit of its internal control over financial reporting. As part of our audit, we are required to obtain an understanding of internal control over financial reporting but not for the purpose of expressing an opinion on the effectiveness of the Fund’s internal control over financial reporting. Accordingly, we express no such opinion.
Our audit included performing procedures to assess the risks of material misstatement of the financial statements and financial highlights, whether due to error or fraud, and performing procedures that respond to those risks. Such procedures included examining, on a test basis, evidence regarding the amounts and disclosures in the financial statements and financial highlights. Our audit also included evaluating the accounting principles used and significant estimates made by management, as well as evaluating the overall presentation of the financial statements and financial highlights. Our procedures included confirmation of securities owned as of July 31, 2022, by correspondence with the custodian and brokers; when replies were not received from brokers, we performed other auditing procedures. We believe that our audit provides a reasonable basis for our opinion.
/s/ Deloitte & Touche LLP
Kansas City, Missouri
September 15, 2022
We have served as the auditor of one or more American Century investment companies since 1997.
24
| Management | ||
The Board of Directors
The individuals listed below serve as directors of the funds. Each director will continue to serve in this capacity until death, retirement, resignation or removal from office. The board has adopted a mandatory retirement age for directors who are not “interested persons,” as that term is defined in the Investment Company Act (independent directors). Independent directors shall retire on December 31 of the year in which they reach their 75th birthday.
Jonathan S. Thomas is an “interested person” because he currently serves as President and Chief Executive Officer of American Century Companies, Inc. (ACC), the parent company of American Century Investment Management, Inc. (ACIM or the advisor). The other directors (more than three-fourths of the total number) are independent. They are not employees, directors or officers of, and have no financial interest in, ACC or any of its wholly owned, direct or indirect, subsidiaries, including ACIM, American Century Investment Services, Inc. (ACIS) and American Century Services, LLC (ACS), and they do not have any other affiliations, positions or relationships that would cause them to be considered “interested persons” under the Investment Company Act. The directors serve in this capacity for seven (in the case of Jonathan S. Thomas, 16; and Stephen E. Yates, 8) registered investment companies in the American Century Investments family of funds.
The following table presents additional information about the directors. The mailing address for each director is 4500 Main Street, Kansas City, Missouri 64111.
| Name (Year of Birth) | Position(s) Held with Funds | Length of Time Served | Principal Occupation(s) During Past 5 Years | Number of American Century Portfolios Overseen by Director | Other Directorships Held During Past 5 Years | ||||||||||||
| Independent Directors | |||||||||||||||||
| Thomas W. Bunn (1953) | Director | Since 2017 | Retired | 64 | None | ||||||||||||
| Chris H. Cheesman (1962) | Director | Since 2019 | Retired. Senior Vice President & Chief Audit Executive, AllianceBernstein (1999 to 2018) | 64 | Alleghany Corporation | ||||||||||||
| Barry Fink (1955) | Director | Since 2012 (independent since 2016) | Retired | 64 | None | ||||||||||||
| Rajesh K. Gupta (1960) | Director | Since 2019 | Partner Emeritus, SeaCrest Investment Management and SeaCrest Wealth Management (2019 to present); Chief Executive Officer and Chief Investment Officer, SeaCrest Investment Management (2006 to 2019); Chief Executive Officer and Chief Investment Officer, SeaCrest Wealth Management (2008 to 2019) | 64 | None | ||||||||||||
25
| Name (Year of Birth) | Position(s) Held with Funds | Length of Time Served | Principal Occupation(s) During Past 5 Years | Number of American Century Portfolios Overseen by Director | Other Directorships Held During Past 5 Years | ||||||||||||
| Independent Directors | |||||||||||||||||
| Lynn Jenkins (1963) | Director | Since 2019 | Consultant, LJ Strategies (2019 to present); United States Representative, U.S. House of Representatives (2009 to 2018) | 64 | MGP Ingredients, Inc. (2019 to 2021) | ||||||||||||
| Jan M. Lewis (1957) | Director and Board Chair | Since 2011 (Board Chair since 2022) | Retired | 64 | None | ||||||||||||
| Stephen E. Yates (1948) | Director | Since 2012 | Retired | 105 | None | ||||||||||||
| Interested Director | |||||||||||||||||
| Jonathan S. Thomas (1963) | Director | Since 2007 | President and Chief Executive Officer, ACC (2007 to present). Also serves as Chief Executive Officer, ACS; Director, ACC and other ACC subsidiaries | 139 | None | ||||||||||||
The Statement of Additional Information has additional information about the fund's directors and is available without charge, upon request, by calling 1-800-345-2021.
26
Officers
The following table presents certain information about the executive officers of the funds. Each officer serves as an officer for each of the 16 (in the case of Robert J. Leach, 15) investment companies in the American Century family of funds. No officer is compensated for his or her service as an officer of the funds. The listed officers are interested persons of the funds and are appointed or re-appointed on an annual basis. The mailing address for each officer listed below is 4500 Main Street, Kansas City, Missouri 64111.
| Name (Year of Birth) | Offices with the Funds | Principal Occupation(s) During the Past Five Years | ||||||
| Patrick Bannigan (1965) | President since 2019 | Executive Vice President and Director, ACC (2012 to present); Chief Financial Officer, Chief Accounting Officer and Treasurer, ACC (2015 to present). Also serves as President, ACS; Vice President, ACIM; Chief Financial Officer, Chief Accounting Officer and/or Director, ACIM, ACS and other ACC subsidiaries | ||||||
| R. Wes Campbell (1974) | Chief Financial Officer and Treasurer since 2018 | Vice President, ACS, (2020 to present); Investment Operations and Investment Accounting, ACS (2000 to present) | ||||||
| Amy D. Shelton (1964) | Chief Compliance Officer and Vice President since 2014 | Chief Compliance Officer, American Century funds, (2014 to present); Chief Compliance Officer, ACIM (2014 to present); Chief Compliance Officer, ACIS (2009 to present). Also serves as Vice President, ACIS | ||||||
| John Pak (1968) | General Counsel and Senior Vice President since 2021 | General Counsel and Senior Vice President, ACC (2021 to present); Also serves as General Counsel and Senior Vice President, ACIM, ACS and ACIS. Chief Legal Officer of Investment and Wealth Management, The Bank of New York Mellon (2014 to 2021) | ||||||
| C. Jean Wade (1964) | Vice President since 2012 | Senior Vice President, ACS (2017 to present); Vice President, ACS (2000 to 2017) | ||||||
| Robert J. Leach (1966) | Vice President since 2006 | Vice President, ACS (2000 to present) | ||||||
| David H. Reinmiller (1963) | Vice President since 2000 | Attorney, ACC (1994 to present). Also serves as Vice President, ACIM and ACS | ||||||
| Ward D. Stauffer (1960) | Secretary since 2005 | Attorney, ACC (2003 to present) | ||||||
27
| Approval of Management Agreement | ||
At a meeting held on June 29, 2022, the Fund’s Board of Directors (the "Board") unanimously approved the renewal of the management agreement pursuant to which American Century Investment Management, Inc. (the “Advisor”) acts as the investment advisor for the Fund. Under Section 15(c) of the Investment Company Act of 1940 (the “Investment Company Act”), contracts for investment advisory services are required to be reviewed, evaluated, and approved by a majority of a fund’s Directors, including a majority of the independent Directors, each year.
Prior to its consideration of the renewal of the management agreement, the Directors requested and reviewed data and information compiled by the Advisor and certain independent data providers concerning the Fund. This review was in addition to the oversight and evaluation undertaken by the Board and its committees on a continual basis and the information received was supplemental to the information that the Board and its committees receive and consider throughout the year.
In connection with its consideration of the renewal of the management agreement, the Board’s review and evaluation of the services provided by the Advisor and its affiliates included, but was not limited to, the following:
•the nature, extent, and quality of investment management, shareholder services, and other services provided and to be provided to the Fund including without limitation portfolio management and trading services, shareholder and intermediary services, compliance and legal services, fund accounting and financial reporting, and fund share distribution;
•the wide range of other programs and services provided to the Fund and its shareholders on a routine and non-routine basis;
•the Fund’s investment performance, including data comparing the Fund's performance to an appropriate benchmark(s) and peer group of other mutual funds with similar investment objectives and strategies;
•the cost of owning the Fund compared to the cost of owning similarly-managed funds;
•the compliance policies, procedures, and regulatory experience of the Advisor and the Fund's service providers;
•the Advisor’s strategic plans, generally, and with respect to the ongoing impact of the COVID-19 pandemic response, heightened areas of interest in the mutual fund industry and recent geopolitical issues;
•the Advisor’s business continuity plans, vendor management practices, and cyber security practices;
•financial data showing the cost of services provided to the Fund, the profitability of the Fund to the Advisor, and the overall profitability of the Advisor;
•possible economies of scale associated with the Advisor’s management of the Fund and other accounts;
•services provided and charges to the Advisor's other investment management clients;
•acquired fund fees and expenses;
•payments and practices in connection with financial intermediaries holding shares of the Fund and the services provided by intermediaries in connection therewith; and
•possible collateral benefits to the Advisor from the management of the Fund.
The Board held four meetings to consider the renewal. The independent Directors also met in private session multiple times to review and discuss the information provided in response to their request. The independent Directors held active discussions with the Advisor regarding the renewal of the management agreement, requesting supplemental information, and reviewing information provided by the Advisor in response thereto. The independent Directors had the benefit of the advice of their independent counsel throughout the process.
28
Factors Considered
The Directors considered all of the information provided by the Advisor, the independent data providers, and independent counsel in connection with the approval. They determined that the information was sufficient for them to evaluate the management agreement for the Fund. In connection with their review, the Directors did not identify any single factor as being all-important or controlling, and each Director may have attributed different levels of importance to different factors. In deciding to renew the management agreement, the Board based its decision on a number of factors, including without limitation the following:
Nature, Extent and Quality of Services — Generally. Under the management agreement, the Advisor is responsible for providing or arranging for all services necessary for the operation of the Fund. The Board noted that the Advisor provides or arranges at its own expense a wide variety of services which include, without limitation, the following:
•constructing and designing the Fund
•portfolio research and security selection
•initial capitalization/funding
•securities trading
•Fund administration
•custody of Fund assets
•daily valuation of the Fund’s portfolio
•liquidity monitoring and management
•risk management, including cyber security
•shareholder servicing and transfer agency, including shareholder confirmations, recordkeeping, and communications
•legal services (except the independent Directors’ counsel)
•regulatory and portfolio compliance
•financial reporting
•marketing and distribution (except amounts paid by the Fund under Rule 12b-1 plans)
The Board noted that many of these services have expanded over time in terms of both quantity and complexity in response to shareholder demands, competition in the industry, changing distribution channels, and the changing regulatory environment.
Investment Management Services. The nature of the investment management services provided to the Fund is quite complex and allows Fund shareholders access to professional money management, instant diversification of their investments within an asset class, the opportunity to easily diversify among asset classes by investing in or exchanging among various American Century Investments funds, and liquidity. In evaluating investment performance, the Board expects the Advisor to manage the Fund in accordance with its investment objectives and principal investment strategies. Further, the Directors recognize that the Advisor has an obligation to monitor trading activities, and in particular to seek the best execution of Fund trades, and to evaluate the use of and payment for research. In providing these services, the Advisor utilizes teams of investment professionals (portfolio managers, analysts, research assistants, and securities traders) who require extensive information technology, research, training, compliance, and other systems to conduct their business. The Board, directly and through its Fund Performance Review Committee, provides oversight of the investment performance process. It regularly reviews investment performance information for the Fund, together with comparative information for appropriate benchmarks and/or peer groups of similarly-managed funds, over different time horizons. The Directors also review investment performance information during the management agreement renewal process. If performance concerns are identified, the Board discusses with the Advisor the reasons for such results (e.g., market conditions, security selection) and any actions being taken to improve performance, and may conduct special reviews until performance improves. The Fund’s performance was above its benchmark for the three-, five-, and ten-year periods and below its benchmark for the one-year period reviewed by the Board. The Board found the investment
29
management services provided by the Advisor to the Fund to be satisfactory and consistent with the management agreement.
Shareholder and Other Services. Under the management agreement, the Advisor provides the Fund with a comprehensive package of transfer agency, shareholder, and other services. The Board, directly and through its various committees, regularly reviews reports and evaluations of such services at its regular meetings. These reports include, but are not limited to, information regarding the operational efficiency and accuracy of the shareholder and transfer agency services provided, staffing levels, shareholder satisfaction, technology support (including cyber security), new products and services offered to Fund shareholders, securities trading activities, portfolio valuation services, auditing services, and legal and operational compliance activities. The Board found the services provided by the Advisor to the Fund under the management agreement to be competitive and of high quality.
Costs of Services and Profitability. The Advisor provides detailed information concerning its cost of providing various services to the Fund, its profitability in managing the Fund (pre- and post-distribution), its overall profitability, and its financial condition. The Directors have reviewed with the Advisor the methodology used to prepare this financial information. This information is considered in evaluating the Advisor’s financial condition, its ability to continue to provide services under the management agreement, and the reasonableness of the current management fee. The Board concluded that the Advisor’s profits were reasonable in light of the services provided to the Fund.
Ethics. The Board generally considers the Advisor’s commitment to providing quality services to shareholders and to conducting its business ethically. They noted that the Advisor’s practices generally meet or exceed industry best practices.
Economies of Scale. The Board also reviewed information provided by the Advisor regarding the possible existence of economies of scale in connection with the management of the Fund. The Board concluded that economies of scale are difficult to measure and predict with precision, especially on a fund-by-fund basis. The Board concluded that the Advisor is sharing economies of scale, to the extent they exist, through its fee structure, and through reinvestment in its business, infrastructure, investment capabilities and initiatives to provide shareholders enhanced and expanded content and services. The Board also noted that economies of scale are shared with the Fund and its shareholders through management fee breakpoints that serve to reduce the effective management fee as the assets of the Fund grow.
Comparison to Other Funds’ Fees. The management agreement provides that the Fund pays the Advisor a single, all-inclusive (or unified) management fee for providing all services necessary for the management and operation of the Fund, other than securities transaction expenses, taxes, interest, extraordinary expenses, fees and expenses of the Fund’s independent Directors (including their independent legal counsel), and expenses incurred in connection with the provision of shareholder services and distribution services under a plan adopted pursuant to Investment Company Act Rule 12b-1. Under the unified fee structure, the Advisor is responsible for providing all investment advisory, custody, audit, administrative, compliance, recordkeeping, marketing and shareholder services, or arranging and supervising third parties to provide such services. By contrast, most other funds are charged a variety of fees, including an investment advisory fee, a transfer agency fee, an administrative fee, distribution charges, and other expenses. Other than their investment advisory fees and any applicable Rule 12b-1 distribution fees, all other components of the total fees charged by these other funds may be increased without shareholder approval. The Board believes the unified fee structure is a benefit to Fund shareholders because it clearly discloses to shareholders the cost of owning Fund shares, and, since the unified fee cannot be increased without a vote of Fund shareholders, it shifts to the Advisor the risk of increased costs of operating the Fund and provides a direct incentive to minimize administrative inefficiencies. Part of the Board’s analysis of fee levels involves reviewing certain evaluative data compiled by an independent provider comparing the Fund’s unified fee to the total expense ratios of its peers. The unified fee charged to shareholders of the Fund was below the median of the total expense ratios of the Fund’s peer expense universe. In addition, the Board reviewed the Fund’s position relative to
30
the narrower set of its expense group peers. The Board and the Advisor agreed to a permanent change to the Fund's breakpoint fee schedule adding 0.025% reductions on net assets over $5 billion and $10 billion, respectively, beginning August 1, 2022. The Board concluded that the management fee paid by the Fund to the Advisor under the management agreement is reasonable in light of the services provided to the Fund.
Comparison to Fees and Services Provided to Other Clients of the Advisor. The Board also requested and received information from the Advisor concerning the nature of the services, fees, costs, and profitability of its advisory services to advisory clients other than the Fund. They observed that these varying types of client accounts require different services and involve different regulatory and entrepreneurial risks than the management of the Fund. The Board analyzed this information and concluded that the fees charged and services provided to the Fund were reasonable by comparison.
Payments to Intermediaries. The Directors also requested and received a description of payments made to intermediaries by the Fund and the Advisor and services provided in response thereto. These payments include various payments made by the Fund or the Advisor to different types of intermediaries and recordkeepers for distribution and service activities provided for the Fund. The Directors reviewed such information and received representations from the Advisor that all such payments by the Fund were made pursuant to the Fund's Rule 12b-1 Plan and that all such payments by the Advisor were made from the Advisor’s resources and reasonable profits.
Collateral or “Fall-Out” Benefits Derived by the Advisor. The Board considered the possible existence of collateral benefits the Advisor may receive as a result of its relationship with the Fund. They concluded that the Advisor’s primary business is managing funds and it generally does not use fund or shareholder information to generate profits in other lines of business, and therefore does not derive any significant collateral benefits from them. To the extent there are potential collateral benefits, the Board has been advised and has taken this into consideration in its review of the management contract with the Fund. The Board noted that additional assets from other clients may offer the Advisor some benefit from increased leverage with service providers and counterparties. Additionally, the Advisor may receive proprietary research from broker-dealers that execute fund portfolio transactions, which the Board concluded is likely to benefit other clients of the Advisor, as well as Fund shareholders. The Board also determined that the Advisor is able to provide investment management services to certain clients other than the Fund, at least in part, due to its existing infrastructure built to serve the fund complex. The Board concluded that appropriate allocation methodologies had been employed to assign resources and the cost of those resources to these other clients and, where expressly provided, these other client assets
may be included with the assets of the Fund to determine breakpoints in the management fee
schedule.
Existing Relationship. The Board also considered whether there was any reason for not continuing the existing arrangement with the Advisor. In this regard, the Board was mindful of the potential disruptions of the Fund’s operations and various risks, uncertainties, and other effects that could occur as a result of a decision not to continue such relationship. In particular, the Board recognized that most shareholders have invested in the Fund on the strength of the Advisor’s industry standing and reputation and in the expectation that the Advisor will have a continuing role in providing advisory services to the Fund.
Conclusion of the Directors. As a result of this process, the Board, including all of the independent Directors, taking into account all of the factors discussed above and the information provided by the Advisor and others in connection with its review and throughout the year, determined that the terms of the management agreement are fair and reasonable and that the management fee charged to the Fund is reasonable in light of the services provided and that the management agreement between the Fund and the Advisor should be renewed for an additional one-year period.
31
| Liquidity Risk Management Program | ||
The Fund has adopted a liquidity risk management program (the “program”). The Fund’s Board of Directors (the "Board") has designated American Century Investment Management, Inc. (“ACIM”) as the administrator of the program. Personnel of ACIM or its affiliates conduct the day-to-day operation of the program pursuant to policies and procedures administered by the Program Administrator, including members of ACIM’s Investment Oversight Committee who are members of the ACIM’s Investment Management and Global Analytics departments.
Under the program, ACIM manages the Fund’s liquidity risk, which is the risk that the Fund could not meet shareholder redemption requests without significant dilution of remaining shareholders’ interests in the Fund. This risk is managed by monitoring the degree of liquidity of the Fund’s investments, limiting the amount of the Fund’s illiquid investments, and utilizing various risk management tools and facilities available to the Fund for meeting shareholder redemptions, among other means. ACIM’s process of determining the degree of liquidity of certain Fund’s investments is supported by a third-party liquidity assessment vendor.
The Board reviewed a report prepared by ACIM regarding the operation and effectiveness of the program for the period January 1, 2021 through December 31, 2021. No significant liquidity events impacting the Fund were noted in the report. In addition, ACIM provided its assessment that the program had been effective in managing the Fund’s liquidity risk.
32
| Additional Information | ||
Retirement Account Information
As required by law, distributions you receive from certain retirement accounts are subject to federal income tax withholding, unless you elect not to have withholding apply*. Tax will be withheld on the total amount withdrawn even though you may be receiving amounts that are not subject to withholding, such as nondeductible contributions. In such case, excess amounts of withholding could occur. You may adjust your withholding election so that a greater or lesser amount will be withheld.
If you don’t want us to withhold on this amount, you must notify us to not withhold the federal income tax. You may notify us in writing or in certain situations by telephone or through other electronic means. For systematic withdrawals, your withholding election will remain in effect until revoked or changed by filing a new election. You have the right to revoke your election at any time and change your withholding percentage for future distributions.
Remember, even if you elect not to have income tax withheld, you are liable for paying income tax on the taxable portion of your withdrawal. If you elect not to have income tax withheld or you don’t have enough income tax withheld, you may be responsible for payment of estimated tax. You may incur penalties under the estimated tax rules if your withholding and estimated tax payments are not sufficient. You can reduce or defer the income tax on a distribution by directly or indirectly rolling such distribution over to another IRA or eligible plan. You should consult your tax advisor for additional information.
State tax will be withheld if, at the time of your distribution, your address is within one of the mandatory withholding states and you have federal income tax withheld (or as otherwise required by state law). State taxes will be withheld from your distribution in accordance with the respective state rules.
*Some 403(b), 457 and qualified retirement plan distributions may be subject to 20% mandatory withholding, as they are subject to special tax and withholding rules. Your plan administrator or plan sponsor is required to provide you with a special tax notice explaining those rules at the time you request a distribution. If applicable, federal and/or state taxes may be withheld from your distribution amount.
Proxy Voting Policies
A description of the policies that the fund's investment advisor uses in exercising the voting rights associated with the securities purchased and/or held by the fund is available without charge, upon request, by calling 1-800-345-2021. It is also available on American Century Investments’ website at americancentury.com/proxy and on the Securities and Exchange Commission’s website at sec.gov. Information regarding how the investment advisor voted proxies relating to portfolio securities during the most recent 12-month period ended June 30 is available on americancentury.com/proxy. It is also available at sec.gov.
Quarterly Portfolio Disclosure
The fund files its complete schedule of portfolio holdings with the Securities and Exchange
Commission (SEC) for the first and third quarters of each fiscal year as an exhibit to its reports on
Form N-PORT. These portfolio holdings are available on the fund's website at
americancentury.com and, upon request, by calling 1-800-345-2021. The fund’s Form N-PORT
reports are available on the SEC’s website at sec.gov.
33
Other Tax Information
The following information is provided pursuant to provisions of the Internal Revenue Code.
The fund hereby designates up to the maximum amount allowable as qualified dividend income for
the fiscal year ended July 31, 2022.
For corporate taxpayers, the fund hereby designates $5,168,782, or up to the maximum amount
allowable, of ordinary income distributions paid during the fiscal year ended July 31, 2022 as
qualified for the corporate dividends received deduction.
The fund hereby designates $33,199,382 as qualified short-term capital gain distributions for
purposes of Internal Revenue Code Section 871 for the fiscal year ended July 31, 2022.
The fund hereby designates $29,310,252, or up to the maximum amount allowable, as long-term
capital gain distributions (20% rate gain distributions) for the fiscal year ended July 31, 2022.
34
| Notes | ||
35
| Notes | ||
36
| ||||||||
| Contact Us | americancentury.com | |||||||
| Automated Information Line | 1-800-345-8765 | |||||||
| Investor Services Representative | 1-800-345-2021 or 816-531-5575 | |||||||
| Investors Using Advisors | 1-800-378-9878 | |||||||
| Business, Not-For-Profit, Employer-Sponsored Retirement Plans | 1-800-345-3533 | |||||||
| Banks and Trust Companies, Broker-Dealers, Financial Professionals, Insurance Companies | 1-800-345-6488 | |||||||
| Telecommunications Relay Service for the Deaf | 711 | |||||||
| American Century Growth Funds, Inc. | ||||||||
Investment Advisor: American Century Investment Management, Inc. Kansas City, Missouri | ||||||||
| This report and the statements it contains are submitted for the general information of our shareholders. The report is not authorized for distribution to prospective investors unless preceded or accompanied by an effective prospectus. | ||||||||
| ©2022 American Century Proprietary Holdings, Inc. All rights reserved. CL-ANN-93182 2209 | ||||||||
(b) None.
ITEM 2. CODE OF ETHICS.
(a) The registrant has adopted a Code of Ethics for Senior Financial Officers that applies to the registrant’s principal executive officer, principal financial officer, principal accounting officer, and persons performing similar functions.
(b) No response required.
(c) None.
(d) None.
(e) Not applicable.
(f) The registrant’s Code of Ethics for Senior Financial Officers was filed as Exhibit 12 (a)(1) to American Century Asset Allocation Portfolios, Inc.’s Annual Certified Shareholder Report on Form N-CSR, File No. 811-21591, on September 29, 2005, and is incorporated herein by reference.
ITEM 3. AUDIT COMMITTEE FINANCIAL EXPERT.
(a)(1) The registrant’s board has determined that the registrant has at least one audit committee financial expert serving on its audit committee.
(a)(2) Chris H. Cheesman, Lynn M. Jenkins and Barry Fink are the registrant’s designated audit committee financial experts. They are “independent” as defined in Item 3 of Form N-CSR.
(a)(3) Not applicable.
(b) No response required.
(c) No response required.
(d) No response required.
ITEM 4. PRINCIPAL ACCOUNTANT FEES AND SERVICES.
(a) Audit Fees.
The aggregate fees billed for each of the last two fiscal years for professional services rendered by the principal accountant for the audit of the registrant’s annual financial statements or services that are normally provided by the accountant in connection with statutory and regulatory filings or engagements for those fiscal years were as follows:
FY 2021: $18,380
FY 2022: $18,880
(b) Audit-Related Fees.
The aggregate fees billed in each of the last two fiscal years for assurance and related services by the principal accountant that are reasonably related to the performance of the audit of the registrant’s financial statements and are not reported under paragraph (a) of this Item were as follows:
For services rendered to the registrant:
FY 2021: $0
FY 2022: $0
Fees required to be approved pursuant to paragraph (c)(7)(ii) of Rule 2-01 of Regulation S-X (relating to certain engagements for non-audit services with the registrant’s investment adviser and its affiliates):
FY 2021: $0
FY 2022: $0
(c) Tax Fees.
The aggregate fees billed in each of the last two fiscal years for professional services rendered by the principal accountant for tax compliance, tax advice, and tax planning were as follows:
For services rendered to the registrant:
FY 2021: $0
FY 2022: $0
Fees required to be approved pursuant to paragraph (c)(7)(ii) of Rule 2-01 of Regulation S-X (relating to certain engagements for non-audit services with the registrant’s investment adviser and its affiliates):
FY 2021: $0
FY 2022: $0
(d) All Other Fees.
The aggregate fees billed in each of the last two fiscal years for products and services provided by the principal accountant, other than the services reported in paragraphs (a) through (c) of this Item were as follows:
For services rendered to the registrant:
FY 2021: $0
FY 2022: $0
Fees required to be approved pursuant to paragraph (c)(7)(ii) of Rule 2-01 of Regulation S-X (relating to certain engagements for non-audit services with the registrant’s investment adviser and its affiliates):
FY 2021: $0
FY 2022: $0
(e)(1) In accordance with paragraph (c)(7)(i)(A) of Rule 2-01 of Regulation S-X, before the accountant is engaged by the registrant to render audit or non-audit services, the engagement is approved by the registrant’s audit committee. Pursuant to paragraph (c)(7)(ii) of Rule 2-01 of Regulation S-X, the registrant’s audit committee also pre-approves its accountant’s engagements for non-audit services with the registrant’s investment adviser, its parent company, and any entity controlled by, or under common control with the investment adviser that provides ongoing services to the registrant, if the engagement relates directly to the operations and financial reporting of the registrant.
(e)(2) All services described in each of paragraphs (b) through (d) of this Item were pre-approved before the engagement by the registrant’s audit committee pursuant to paragraph (c)(7)(i)(A) of Rule 2-01 of Regulation S-X. Consequently, none of such services were required to be approved by the audit committee pursuant to paragraph (c)(7)(i)(C).
(f) The percentage of hours expended on the principal accountant’s engagement to audit the registrant’s financial statements for the most recent fiscal year that were attributed to work performed by persons other than the principal accountant’s full-time, permanent employees was less than 50%.
(g) The aggregate non-audit fees billed by the registrant’s accountant for services rendered to the registrant, and rendered to the registrant’s investment adviser (not including any sub-adviser whose role is primarily portfolio management and is subcontracted with or overseen by another investment adviser), and any entity controlling, controlled by, or under common control with the adviser that provides ongoing services to the registrant for each of the last two fiscal years of the registrant were as follows:
FY 2021: $546,515
FY 2022: $2,285,611
(h) The registrant’s investment adviser and accountant have notified the registrant’s audit committee of all non-audit services that were rendered by the registrant’s accountant to the registrant’s investment adviser, its parent company, and any entity controlled by, or under common control with the investment adviser that provides services to the registrant, which services were not required to be pre-approved pursuant to paragraph (c)(7)(ii) of Rule 2-01 of Regulation S-X. The notification provided to the registrant’s audit committee included sufficient details regarding such services to allow the registrant’s audit committee to consider the continuing independence of its principal accountant.
ITEM 5. AUDIT COMMITTEE OF LISTED REGISTRANTS.
Not applicable.
ITEM 6. INVESTMENTS.
(a) The schedule of investments is included as part of the report to stockholders filed under Item 1 of this Form.
(b) Not applicable.
ITEM 7. DISCLOSURE OF PROXY VOTING POLICIES AND PROCEDURES FOR CLOSED-END MANAGEMENT INVESTMENT COMPANIES.
Not applicable.
ITEM 8. PORTFOLIO MANAGERS OF CLOSED-END MANAGEMENT INVESTMENT COMPANIES.
Not applicable.
ITEM 9. PURCHASES OF EQUITY SECURITIES BY CLOSED-END MANAGEMENT INVESTMENT COMPANY AND AFFILIATED PURCHASERS.
Not applicable.
ITEM 10. SUBMISSION OF MATTERS TO A VOTE OF SECURITY HOLDERS.
During the reporting period, there were no material changes to the procedures by which shareholders may recommend nominees to the registrant’s board.
ITEM 11. CONTROLS AND PROCEDURES.
(a) The registrant's principal executive officer and principal financial officer have concluded that the registrant's disclosure controls and procedures (as defined in Rule 30a-3(c) under the Investment Company Act of 1940) are effective based on their evaluation of these controls and procedures as of a date within 90 days of the filing date of this report.
(b) There were no changes in the registrant's internal control over financial reporting (as defined in Rule 30a-3(d) under the Investment Company Act of 1940) that occurred during the period covered by this report that have materially affected, or are reasonably likely to materially affect, the registrant's internal control over financial reporting.
ITEM 12. DISCLOSURE OF SECURITIES LENDING ACTIVITIES FOR CLOSED-END MANAGEMENT INVESTMENT COMPANIES.
Not applicable.
ITEM 13. EXHIBITS.
(a)(1) Registrant’s Code of Ethics for Senior Financial Officers, which is the subject of the disclosure required by Item 2 of Form N-CSR, was filed as Exhibit 12(a)(1) to American Century Asset Allocation Portfolios, Inc.’s Certified Shareholder Report on Form N-CSR, File No. 811-21591, on September 29, 2005.
(a)(2) Separate certifications by the registrant’s principal executive officer and principal financial officer, pursuant to Section 302 of the Sarbanes-Oxley Act of 2002 and Rule 30a-2(a) under the Investment Company Act of 1940, are filed and attached hereto as EX-99.CERT.
(a)(3) Not applicable.
(a)(4) Not applicable.
(b) A certification by the registrant’s chief executive officer and chief financial officer, pursuant to Section 906 of the Sarbanes-Oxley Act of 2002, is furnished and attached hereto as EX-99.906CERT.
SIGNATURES
Pursuant to the requirements of the Securities Exchange Act of 1934 and the Investment Company Act of 1940, the registrant has duly caused this report to be signed on its behalf by the undersigned, thereunto duly authorized.
| Registrant: | American Century Growth Funds, Inc. | ||||||||||
| By: | /s/ Patrick Bannigan | ||||||||||
| Name: | Patrick Bannigan | ||||||||||
| Title: | President | ||||||||||
| Date: | September 28, 2022 | ||||||||||
Pursuant to the requirements of the Securities Exchange Act of 1934 and the Investment Company Act of 1940, this report has been signed below by the following persons on behalf of the registrant and in the capacities and on the dates indicated.
| By: | /s/ Patrick Bannigan | ||||||||||
| Name: | Patrick Bannigan | ||||||||||
| Title: | President | ||||||||||
| (principal executive officer) | |||||||||||
| Date: | September 28, 2022 | ||||||||||
| By: | /s/ R. Wes Campbell | ||||||||||
| Name: | R. Wes Campbell | ||||||||||
| Title: | Treasurer and | ||||||||||
| Chief Financial Officer | |||||||||||
| (principal financial officer) | |||||||||||
| Date: | September 28, 2022 | ||||||||||
ATTACHMENTS / EXHIBITS
Serious News for Serious Traders! Try StreetInsider.com Premium Free!
You May Also Be Interested In
- Arthrex Wins Both Gold and Silver Medals at 2024 Edison Awards
- Armenian Political Prisoner Initiates Hunger Strike in Baku, According to Free Armenian Prisoners
- T2EARTH Celebrates Earth Day by Leading the Wood Products Industry towards a Sustainable Built Environment
Create E-mail Alert Related Categories
SEC FilingsSign up for StreetInsider Free!
Receive full access to all new and archived articles, unlimited portfolio tracking, e-mail alerts, custom newswires and RSS feeds - and more!
