

Form N-CSR ADVISORS SERIES TRUST For: Sep 30
 Tweet
Tweet Share
ShareUNITED STATES
SECURITIES AND EXCHANGE COMMISSION
Washington, D.C. 20549
SECURITIES AND EXCHANGE COMMISSION
Washington, D.C. 20549
FORM N-CSR
CERTIFIED SHAREHOLDER REPORT OF REGISTERED
MANAGEMENT INVESTMENT COMPANIES
Investment Company Act file number 811-07959
Advisors Series Trust
(Exact name of registrant as specified in charter)
(Exact name of registrant as specified in charter)
615 East Michigan Street
Milwaukee, WI 53202
(Address of principal executive offices) (Zip code)
(Address of principal executive offices) (Zip code)
Jeffrey T. Rauman, President/Chief Executive Officer
Advisors Series Trust
c/o U.S. Bancorp Fund Services, LLC
777 East Wisconsin Avenue, 5th Floor
Milwaukee, WI 53202
(Name and address of agent for service)
(Name and address of agent for service)
(626) 914-7363
Registrant's telephone number, including area code
Date of fiscal year end: September 30, 2022
Date of reporting period: September 30, 2022
Item 1. Reports to Stockholders.
(a)
|
Annual Report
September 30, 2022
|
Poplar Forest Funds
Poplar Forest Partners Fund
Class A (PFPFX)
Class I (IPFPX)
Poplar Forest Cornerstone Fund
Investor Class (IPFCX)
POPLAR FOREST FUNDS
TABLE OF CONTENTS
|
Performance
|
1
|
|
Letter to Partner
|
2
|
|
Sector Allocation of Portfolio Assets
|
12
|
|
Expense Example
|
14
|
|
Investment Highlights
|
16
|
|
Schedules of Investments
|
19
|
|
Statements of Assets and Liabilities
|
26
|
|
Statements of Operations
|
28
|
|
Statements of Changes in Net Assets
|
29
|
|
Financial Highlights
|
31
|
|
Notes to Financial Statements
|
34
|
|
Report of Independent Registered Public Accounting Firm
|
45
|
|
Notice to Shareholders
|
47
|
|
Information about Trustees and Officers
|
48
|
|
Householding
|
52
|
|
Privacy Notice
|
53
|
POPLAR FOREST FUNDS
Performance of each Fund class for the 1-, 3-, 5-, 10-year and since inception periods as of September 30, 2022, is as follows:

|
*
|
The 60/40 blended index comprises 60% S&P 500® Index and 40% Bloomberg U.S. Aggregate
Bond Index.
|
|
|
**
|
Returns for periods greater than 1 year have been annualized.
|
Performance data quoted represents past performance; past performance does not guarantee future results. The investment return and principal value of an investment will fluctuate so
that an investor’s shares, when redeemed, may be worth more or less than their original cost. Current performance of the Funds may be lower or higher than the performance quoted. Performance data current to the most recent month-end may be obtained
by calling 1-877-522-8860. Performance for Class A shares with load reflects a maximum 5.00% sales charge. Class A shares without load do not take into account any sales charges which would reduce performance.
As of the Funds’ most recently filed registration statement, the Partners Fund Class A shares gross expense ratio is 1.31%; net expense ratio is 1.20% and is applicable to investors.
The Partners Fund Institutional Class shares gross expense ratio is 1.06%; net expense ratio is 0.95% and is applicable to investors. The Cornerstone Fund gross expense ratio is 1.53%; net expense ratio is 0.90% and is applicable to investors. The
Adviser has contractually agreed to the fee waiver through at least January 27, 2023.
1
POPLAR FOREST FUNDS
Portfolio Manager Commentary
Dear Partner,
With COVID having become endemic, 2022 was the year we all dared to take much-delayed summer vacations. For me, that meant heading to the beach in North Carolina. You may wonder: doesn’t he live in
California? I do, and while I’ve surely enjoyed many an hour looking out at the Pacific, the view of the Atlantic from the Carolina coast feels like heaven to me. When I was a kid, our family vacation was most often a week or two in a rented condo in
Myrtle Beach, S.C. - and I loved just about every minute of it: body surfing and beach walks, hours at the arcade and all the fresh shrimp we could eat.
The only things I don’t remember fondly were the occasional hurricane warnings. When the warnings came, we’d nervously watch the news each evening for reports on the path of storms that might be headed
our way. Those storms usually stayed out at sea and our vacations were uninterrupted, but in 1998, the first time I’d taken my own kids to Myrtle Beach, our family was forced to evacuate in advance of Hurricane Bonnie. The weather looked almost
placid as we packed to leave, but 24 hours later, Bonnie came ashore as a category 2 storm that killed several people and caused a half billion dollars of damage.
Hurricane season in the Atlantic typically runs from June to November. According to the National Weather Service, a hurricane is a “tropical cyclone with maximum sustained winds of 74 mph (64 knots) or
higher.” These cyclones are created when masses of warm air collide with cool air over warm ocean water. Warm water and warm air are key ingredients, but it is that collision with cooler air that produces the wind, rain and thunderstorms that make
hurricanes so destructive.
I’ve been thinking about hurricanes lately as I’ve been evaluating the potential impact of a recession on our portfolio. Just as hurricanes can cause damage to coastal property, recessions can harm
investor portfolios as a shrinking economy sends corporate profits lower. With memories of the Category 5 calamity of the Global Financial Crisis (the “GFC” in 2008-09), it is no wonder that the risk of recession is top of mind for many investors
today.
First and foremost, I do not believe that we are currently in a recession; quite the contrary – the economy is as warm as the water in the tropics. Corporate margins are robust and earnings have
continued to grow. The employment picture is rosy with low initial claims for unemployment and roughly two job openings for every one person looking for work. Basically, fiscal stimulus and accommodative monetary policy did such a good job offsetting
COVID-induced weakness that strong demand has overwhelmed more limited supply. The result: unacceptably high inflation.
While inflation has probably peaked, we are living in a supply constrained world and I suspect inflation will be stickier than central bankers want. Importantly,
the decade after the Global Financial Crisis was a time of excess supply, and central bankers around the world kept interest rates artificially low to stimulate demand. Investment strategies that worked well in the
aftermath of the GFC seem less likely to work well in coming years – in particular, and as we’ve seen so far in 2022, investment approaches that favor long duration (high P/E) growth stocks may fare poorly in a time of increasing interest
rates. If, as I suspect, it takes more time than desired for inflation to fall to levels consistent with the U.S. Federal Reserve’s (the “Fed’s”) definition of price
2
POPLAR FOREST FUNDS
stability (2% inflation), then we may be living with structurally higher interest rates for years. Value stocks may do particularly well in this environment. The
Fed has made clear that they will use monetary policy to cool the economy to combat inflation. Just as cool air colliding with warm air over tropical waters produces hurricanes, the collision of increasingly chilly monetary policy and a warm economy
could create an economic storm with the potential to turn into a hurricane.
Storm Watch
According to the National Oceanic and Atmospheric Administration, typically 10 tropical storms form each year in the Atlantic Ocean, the Caribbean Sea, and the Gulf of Mexico. Roughly six of these
storms grow into hurricanes, but the majority stay at sea. In an average three-year period, only two major hurricanes will strike the U.S. coastline between Texas and Maine. While the 2022 hurricane season had been relatively mild, in just the last
two weeks, Hurricane Fiona caused extensive damage in Puerto Rico and Canada while Hurricane Ian has wreaked havoc in Florida and the Carolina coast. Our thoughts and prayers are with all of those who have been affected by these destructive storms.
Recessions are rarer than hurricanes – over the last 40 years, we’ve only had four. While I am hopeful that the growing economic storm clouds will fizzle out over the proverbial ocean, at Poplar Forest,
we think it is prudent to plan for something more severe. Fed Chairman Powell seems intent on convincing the market that he can whip inflation, and an aggressive Fed could turn a relatively harmless tropical storm into an economic hurricane. As you
can see below, recessionary economic activity (highlighted in grey) reduces companies’ revenues and profits. If there is a recession in 2023, earnings estimates may decline by 20% or more for the S&P 500® Index (“S&P 500”). We have already seen some diminution in estimates during September and we expect more when companies report third quarter earnings in the next few weeks. While stocks don’t
currently look particularly expensive when compared to current consensus expectations for earnings, if those expectations are reduced by 20% or more, then the price-to-earnings ratio on the S&P 500 could increase from the fairly reasonable
current level of 16x to a more expensive 20x or more.

Source: Intrinsic Research
3
POPLAR FOREST FUNDS
Like meteorologists watching for signs of dangerous storms, we are monitoring various indicators for signals of economic trouble. While the economy looks mostly sunny today, the extended forecast is
more worrisome as measured by the Conference Board’s Index of Leading Economic Indicators (the “LEI”). The ten components of the LEI for the U.S. include:
|
1.
|
Average weekly hours in manufacturing;
|
|
|
2.
|
Average weekly initial claims for unemployment insurance;
|
|
|
3.
|
Manufacturers’ new orders for consumer goods and materials;
|
|
|
4.
|
ISM® Index of New Orders;
|
|
|
5.
|
Manufacturers’ new orders for nondefense capital goods excluding aircraft orders;
|
|
|
6.
|
Building permits for new private housing units;
|
|
|
7.
|
S&P 500® Index of Stock Prices;
|
|
|
8.
|
Leading Credit Index™;
|
|
|
9.
|
Interest rate spread (10-year Treasury bonds less federal funds rate);
|
|
|
10.
|
Average consumer expectations for business conditions.
|
This collection of macroeconomic variables has historically done a very good job of forecasting the direction of the economy; earnings for the S&P 500 have historically followed a similar pattern.
As the Conference Board said in its recent release: the “U.S. LEI continued to decline signaling a contraction in economic activity may be imminent.”

Source: The Conference Board
I believe the most helpful leading indicator is the difference (the “spread”) between yields on 10-year Treasury Bonds and the Federal Funds rate. As you can see below, in the past, this indicator has
fallen well below zero in advance of recessions. Despite the Fed’s decision to raise rates by 0.75% (to 3.00-3.25%) at its last meeting, this yield spread is currently still well above zero with 10-year Treasury bonds now yielding 3.75%. While risks
are growing, increasing long-term interest rates are a sign that the Fed has not yet moved far enough to actually trigger a recession. We will be watching closely to see where long-term rates go as the Fed continues to raise short-term rates
(potentially to 4.5% or more in 2023).
4
POPLAR FOREST FUNDS
In terms of recession signaling, the danger generally comes when long-term interest rates stop going up alongside short-term rates and the yield curve inverts
(when short-term interest rates become materially higher than long-term rates). One exception to this rule of thumb was in 1998; the yield curve inverted, and although economic conditions worsened dramatically in emerging markets, a U.S. recession
was avoided. The S&P 500 declined 19.3% during a 45 day stretch in 1998, but stock prices quickly recovered and moved higher as the tech bubble continued to inflate in 1999.

Trying to Reason with Hurricane Season
There is no guarantee that restrictive monetary policy will create a recession. And even if it does, it is important to remember that monetary policy works with a lag that has historically averaged
about a year – that means we may be looking at mid-2023 before the threatening winds really pick up. At this point, in our multi-year projections for the businesses in which we are invested, we are assuming that we will have to live through a
Category 1 or 2 storm (a mild recession) sometime in 2023. I hope this will prove to be an overly conservative assumption, but given the clouds we see on the horizon, it seems prudent to be conservative right now.
As long-term owners of businesses, we don’t turn and run just because a storm might come. Storms come and go and, over time, the market has continued to move to new highs. However, this is not a time
for risky investments; we want to make sure that the companies in our portfolio can survive a potential economic hurricane. We focus on the absolute value of businesses (low valuations are like homeowners’ insurance). We avoid speculation (we don’t
build on the sand). We focus on businesses with strong balance sheets and consistent free cash flow (it’s important to be resting on a strong foundation when the wind starts howling). We focus on idiosyncratic opportunities (where we’re not merely
dependent on the weather staying sunny). We have avoided housing and autos (industries where a storm seems most likely to come ashore). We have been holding a bit of extra cash (the equivalent of bottled water and flashlight batteries in case the
power goes out). Our cash reserves are currently around 5% of
5
POPLAR FOREST FUNDS
assets; if we get really concerned that a Category 5 storm is coming, we may take cash to 20-25% of our portfolios if we don’t find great investment opportunities as short-term oriented investors head
for higher ground.
Furthermore, I’ve lived through enough cycles to know that people sometimes panic when they hear a dire weather forecast. We have identified a list of companies we’d like to invest in; if someone wants
to sell us their beautiful beach house at a 50% discount to what we think its worth, we may buy it – especially if we believe the foundation is strong.
The Forecast – Partly Cloudy with a Chance of Thunderstorms
While I’m generally an optimistic person, I came into this year with a defensive mindset. That approach has served us relatively well in this volatile period. Like Bill Murray’s character in the 1980
comedy classic Caddyshack said, about impending rain, while “I don’t think the heavy stuff’s going to come down for a while,” I do think a conservative posture continues to make sense given the Fed’s attitude on battling inflation. One of the longest
standing admonitions in the investment business is: “Don’t fight the Fed.” History suggests that when the Fed is raising interest rates, it is prudent to plan for inclement weather, and that’s just what we’ve done.
Historically, value investing has been particularly helpful in managing bear markets. While this wasn’t the case when the Housing Bubble burst, it definitely was when the Tech Bubble popped. I continue to believe that we are in the midst of an investment cycle that resembles the late 1990s/early 2000s period. If I’m right, value stocks will have several more years of outperformance and our focus on absolute
value may prove particularly rewarding. As someone who invests alongside each of you, I continue to be excited about the long-term prospects of our portfolio of companies with solid balance sheets, ample free cash flow, and robust
idiosyncratic opportunities. While our companies are projected to grow earnings faster than the S&P 500 over the next few years, they are valued at less than 9x estimated 2023 earnings while the S&P 500 is
valued at 15x. Though there are a few clouds on the horizon, our portfolio continues to look like an incredible bargain to me.
We will continue to watch the skies for signs of trouble and believe we have a solid plan for navigating whatever weather comes our way.

J. Dale Harvey
Founder, CIO and Portfolio Manager
6
POPLAR FOREST FUNDS
Partners Fund Portfolio Review
The Partners Fund Institutional Class shares produced a return of -5.43% while Class A shares (no load) produced an -5.68% return for the fiscal year ended September 30, 2022. This compared to a return
of -15.47% for the S&P 500 and -11.36% for the Russell 1000 Value Index.
Relative to the S&P 500, the portfolio’s top contributing sectors to performance over this fiscal period were Healthcare, Energy and Consumer Discretionary. The bottom contributing sectors were
Industrials, Financials and Consumer Staples. Overall, positive performance came from both stock selection and sector allocation.
At the security level, the Fund’s top detractors from overall performance were Ally Financial, MillerKnoll, Citigroup, FedEx and AT&T. Offsetting this was positive contribution from top contributors
Chevron, Murphy Oil, Dollar Tree, CVS Health and National Fuel Gas.
Market Outlook
Economic activity is slowing, but the economy is still growing. The employment picture is very healthy. This strength is driving the Fed to increase interest rates in hopes of cooling things down, but
monetary policy works with a lag. The Fed’s aggressive actions have flattened the yield curve, with inversion in parts of the curve.
An inverted yield curve has historically been an early indicator of economic softness. While many investors talk about the spread between two-year treasuries and their ten-year siblings, as was
previously discussed, we have found that the spread between the Fed Funds rate and the ten-year treasury to be a better indicator of recession risk. This rate spread is included in the Conference Board’s index of Leading Economic Indicators for good
reason, in our opinion.
At present, the spread between the ten-year and Fed Funds has narrowed considerably, but it is still positive. This suggests to us that recession risk is growing, but that a recession is still at least
a few quarters in front of us. That said, for at least the last six months, our earnings and free cash flow forecasts have been based on an assumption that we will have to live through at least a mild 2023 recession. While we hope the Fed can avert a
recession, we think it is prudent to plan conservatively and as such, we are focused on companies that have already “taken their medicine” on weakening demand, pricing, and margins. Conversely, we see risks for companies selling relatively
undifferentiated products whose stock prices embed expectations for continued price gains and margin expansion in 2023-24. Management teams will be developing their 2023 business plans in the next few months and we foresee the potential for high
magnitude margin disappointments if pricing assumptions don’t accurately reflect the risk of deteriorating unit demand trends. Caution may be warranted for companies whose valuations don’t compensate investors for the risk of falling unit demand,
weakening prices, and rising inventory-to-sales ratios.
Portfolio Changes and Positioning
At the start of the Fund’s fiscal year, we were seeing signs that the economy was quite strong. Government stimulus had lifted consumer’s balance sheets. Also, pandemic impacted supply chains were
taking longer to correct which created a supply/demand imbalance. The Fed’s highly accommodative interest rate policy seemed inappropriate
7
POPLAR FOREST FUNDS
and suggested economic risk was building as inflation needed to be tamed. Against this backdrop, we positioned the portfolio to be slightly more defensive than we might otherwise be as cyclical names no
longer offered the same risk/reward tradeoff. In our view, investors didn’t share our concern about a potentially slowing economy. By March 2022, investors’ perception had shifted as it became clear the Fed needed to act aggressively to combat
inflation. Now, most investors are keenly aware of the potential for a recession and the opportunities appear to be more balanced between economically sensitive and defensive businesses. We are focusing on those companies with solid balance sheets,
ample free cash flow, and robust idiosyncratic opportunities where we believe the risk/reward is favorable despite macro trends.
Cornerstone Fund Portfolio Review
The Cornerstone Fund produced a -5.60% return. This compares to a -14.85% return for a 60/40 blend of the S&P 500 and the Bloomberg U.S. Aggregate Bond Index for the fiscal year ended September 30,
2022.
At the security level, the Fund benefitted from top contributing equity investments Chevron, Dollar Tree, Murphy Oil, National Fuel Gas and United Therapeutics. The top detracting equity investments
were MillerKnoll, Ally Financial, Citigroup, FedEx and AT&T.
While the overlap between the equities owned in the Cornerstone and Partners Funds is high, the Cornerstone Fund remains far more defensive with roughly 10% in cash and equivalents and roughly 28% in
fixed income investments. With interest rates returning to more normal levels, we have increased our exposure to fixed income securities year over year and the Fund’s asset allocation is closer to a neutral level. Within the bond portfolio, we
continue to be relatively balanced in our exposure to corporate and treasury and/or agency issues. Our duration remains a bit lower than neutral as we worry that there are still potential rate increases coming.
We remain focused on trying to manage downside risk while also striving to protect our investors’ long-term purchasing power. Our equities currently account for approximately 62% of the Fund which
compares to 73% on September 30, 2021. The draw-down in 2022’s weak stock market environment was less than that of the Partners Fund.
As we look ahead, we believe our portfolio is well positioned to generate solid inflation-adjusted returns. The Fund remains focused on high quality companies that are trading at what we believe are
discounted valuations, while our bond selections continue to emphasize our goal of capital preservation.
Disclosures
Must be preceded or accompanied by a prospectus.
Mutual fund investing involves risk. Principal loss is possible. The Funds may invest in debt securities which typically decrease in value when interest rates rise. This risk is
usually greater for longer-term debt securities. The Funds may invest in foreign securities which involve greater volatility and political, economic and currency risks and differences in accounting methods. These risks are greater in emerging
markets. Investing in small and medium sized companies may involve greater risk than investing in larger, more established companies because small and medium capitalization companies can be subject to greater share price volatility. The Funds may
invest in
8
POPLAR FOREST FUNDS
options, which may be subject to greater fluctuations in value than an investment in the underlying securities. When the Cornerstone Fund invests in other funds and ETFs an investor
will indirectly bear the principal risks and its share of the fees and expenses of the underlying funds. Investments in asset-backed and mortgage-backed securities involve additional risks such as credit risk, prepayment risk, possible illiquidity
and default, and increased susceptibility to adverse economic developments. Diversification does not assure a profit, nor does it protect against a loss in a declining market.
Value stocks typically are less volatile than growth stocks; however, value stocks have a lower expected growth rate in earnings and sales.
Opinions expressed are subject to change at any time, are not guaranteed and should not be considered investment advice. Fund holdings and sector allocations are subject to change and should not be
considered recommendations to buy or sell any security.
Fund holdings and sector allocations are subject to change at any time and should not be considered a recommendation to buy or sell any security. For a complete list of holdings, please refer to the
schedule of investments in this report.
Opinions expressed are subject to change at any time, are not guaranteed and should not be considered investment advice.
Poplar Forest Capital LLC is the adviser to the Poplar Forest Funds which are distributed by Quasar Distributors, LLC.
Partners Fund Top Ten Equity Holdings and Percentage Weights as of 9/30/22:
|
Chevron
|
5.02
|
%
|
||
|
AmerisourceBergen
|
4.73
|
|||
|
Allstate
|
4.64
|
|||
|
United Therapeutics
|
4.53
|
|||
|
Wells Fargo
|
4.38
|
|||
|
CVS Health
|
4.36
|
|||
|
National Fuel Gas
|
4.34
|
|||
|
Equitable Holdings
|
4.30
|
|||
|
Dollar Tree
|
4.01
|
|||
|
International Business Machines
|
3.99
|
Cornerstone Fund Top Ten Equity Holdings and Percentage Weights as of 9/30/22:
|
United Therapeutics
|
2.82
|
%
|
||
|
Las Vegas Sands
|
2.51
|
|||
|
Perrigo Co.
|
2.51
|
|||
|
Conagra Brands
|
2.45
|
|||
|
Allstate
|
2.43
|
|||
|
AmerisourceBergen
|
2.41
|
|||
|
Equitable Holdings
|
2.40
|
|||
|
CVS Health
|
2.34
|
|||
|
Curtiss Wright
|
2.34
|
|||
|
International Business Machines
|
2.32
|
The S&P 500® Index: is a market-value weighted index consisting of 500 stocks chosen for market size, liquidity, and
industry group representation. The Index is unmanaged.
9
POPLAR FOREST FUNDS
The Russell 1000® Value index: measures the performance of the Russell 1000’s value segment, which is defined to include
firms whose share prices have lower price/book ratios and lower expected long/term mean earnings growth rates.
The Bloomberg U.S. Aggregate Bond Index: is a broad-based flagship benchmark that measures the investment grade, U.S. dollar-denominated, fixed-rate taxable bond market. The index includes Treasuries,
government-related and corporate securities, mortgage-backed securities, asset-backed securities and commercial mortgage-backed securities.
Blended index: (also known as a blended benchmark) is a combination of two or more indices in varying percentages. To take a simple example, if an investor’s assets are allocated to 60% stocks and 40%
bonds, the portfolio’s performance might be best measured against a blended benchmark consisting of 60% in a stock index (e.g. S&P 500® index) and 40% in a bond
index (e.g. Bloomberg U.S. Aggregate Bond Index).
The Consumer Price Index (CPI): is a measure of the average change over time in the prices paid by urban consumers for a market basket of consumer goods and services. The annual percentage change in a
CPI is used as a measure of inflation.
It is not possible to invest directly in an index.
Index performance is not indicative of a fund’s performance. Past performance does not guarantee future results. Earnings growth is not a measure of the Fund’s future performance.
Earnings Growth: The annual rate of growth of earnings typically measured as Earnings Per Share Growth.
Free Cash Flow: Is equal to the after-tax net income of a company plus depreciation and amortization less capital expenditures.
Inflation: Is a quantitative measure of the rate at which the average price level of a basket of selected goods and services in an economy increases over a period of time. Often expressed as a
percentage, inflation indicates a decrease in the purchasing power of a nation’s currency.
Price/Earnings (P/E) Ratio: Is a common tool for comparing the prices of different common stocks and is calculated by dividing the earnings per share into the current market price of a stock.
Yield Curve: Is a line that compares the yield of bonds of equal quality but different maturity dates. In general, bonds with longer maturity dates offer higher yields than bonds with shorter maturity
dates, thus producing an upward sloping yield curve.
Bear Market: A period marked with falling stock prices. In a bear market, investor confidence is extremely low. Many investors opt to sell off their stocks during a bear market for fear of further
losses.
Dividend Yield: Represents the trailing 12-month dividend yield aggregating all income distributions per share over the past year, divided by the period ending fund or stock share price. It does not
reflect capital gains distributions.
Earnings Per Share (EPS): is the net income of a company divided by the total number of shares it has outstanding.
10
POPLAR FOREST FUNDS
Index Fund: Is a type of mutual fund with a portfolio constructed to match or track the components of a market index, such as the Standard & Poor’s 500 Index (S&P 500).
Passive investing: Is an investment strategy to maximize returns by minimizing buying and selling. Index investing in one common passive investing strategy whereby investors purchase a representative
benchmark, such as the S&P 500 Index, and hold it over a long-time horizon.
11
POPLAR FOREST PARTNERS FUND
SECTOR ALLOCATION OF PORTFOLIO ASSETS at September 30, 2022 (Unaudited)

Percentages represent market value as a percentage of total investments.
The Global Industry Classification Standard (GICS®) was developed by and/or is the exclusive property of MSCI, Inc. and
Standard & Poor’s Financial Services LLC (“S&P”). GICS is a service mark of MSCI and S&P and has been licensed for use by U.S. Bancorp Fund Services, LLC.
12
POPLAR FOREST CORNERSTONE FUND
SECTOR ALLOCATION OF PORTFOLIO ASSETS at September 30, 2022 (Unaudited)
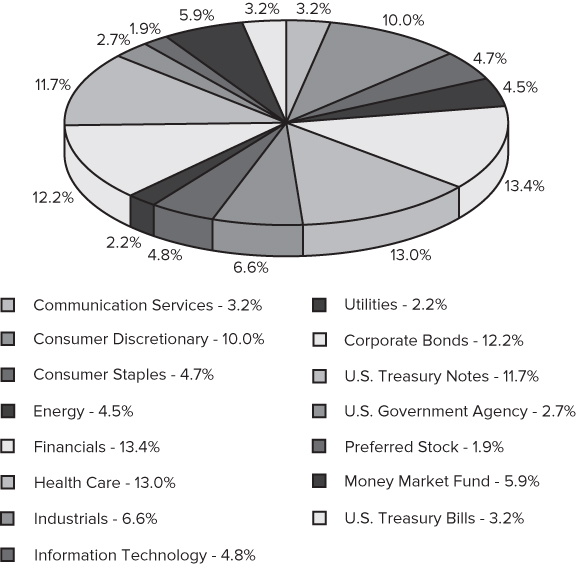
Percentages represent market value as a percentage of total investments.
The Global Industry Classification Standard (GICS®) was developed by and/or is the exclusive property of MSCI, Inc. and
Standard & Poor’s Financial Services LLC (“S&P”). GICS is a service mark of MSCI and S&P and has been licensed for use by U.S. Bancorp Fund Services, LLC.
13
POPLAR FOREST FUNDS
EXPENSE EXAMPLE at September 30, 2022 (Unaudited)
As a shareholder of a mutual fund, you incur two types of costs: (1) transaction costs, including sales charges (loads) on purchase payments, redemption fees, and exchange fees, and (2) ongoing costs,
including management fees, distribution and/or service fees, and other fund expenses. This Example is intended to help you understand your ongoing costs (in dollars) of investing in the Funds and to compare these costs with the ongoing costs of
investing in other mutual funds. The Example is based on an investment of $1,000 invested at the beginning of the period and held for the entire period (4/1/22 – 9/30/22).
Actual Expenses
For each class of each Fund, two lines are presented in the tables below, with the first line providing information about actual account values and actual expenses. You will be assessed fees for
outgoing wire transfers, returned checks, and stop payment orders at prevailing rates charged by U.S. Bancorp Fund Services, LLC, the Funds’ transfer agent. The Example below includes, but is not limited to, management fees, 12b-1 fees, fund
accounting, custody and transfer agent fees. You may use this information, together with the amount you invested, to estimate the expenses that you paid over the period. Simply divide your account value by $1,000 (for example, an $8,600 account
value divided by $1,000 = 8.6), then multiply the result by the number in the first line under the heading entitled “Expenses Paid During Period” to estimate the expenses you paid on your account during this period.
Hypothetical Example for Comparison Purposes
For each class of each Fund, the second line provides information about hypothetical account values and hypothetical expenses based on the respective Fund’s actual expense ratio and an assumed rate of
return of 5% per year before expenses, which is not the Fund’s actual return. The hypothetical account values and expenses may not be used to estimate the actual ending account balance or expenses you paid for the period. You may use this
information to compare the ongoing costs of investing in the Funds and other funds. To do so, compare this 5% hypothetical example with the 5% hypothetical examples that appear in the shareholder reports of the other funds. Please note that the
expenses shown in the table are meant to highlight your ongoing costs only and do not reflect any transaction costs, such as sales charges (loads), redemption fees, or exchange fees. Therefore, the second line of the tables for each class of each
Fund is useful in comparing ongoing costs only, and will not help you determine the relative total costs of owning different funds. In addition, if these transaction costs were included, your costs would have been higher.
14
POPLAR FOREST FUNDS
EXPENSE EXAMPLE at September 30, 2022 (Unaudited), Continued
|
Beginning
|
Ending
|
Expenses Paid
|
Annualized
|
|
|
Account Value
|
Account Value
|
During Period
|
Expense
|
|
|
4/1/22
|
9/30/22
|
4/1/22 – 9/30/22
|
Ratio*
|
|
|
Poplar Forest Partners Fund
|
||||
|
Class A Shares
|
||||
|
Actual
|
$1,000.00
|
$ 848.60
|
$5.56
|
1.20%
|
|
Hypothetical (5% return
|
||||
|
before expenses)
|
$1,000.00
|
$1,019.05
|
$6.07
|
1.20%
|
|
Institutional Class Shares
|
||||
|
Actual
|
$1,000.00
|
$ 849.90
|
$4.41
|
0.95%
|
|
Hypothetical (5% return
|
||||
|
before expenses)
|
$1,000.00
|
$1,020.31
|
$4.81
|
0.95%
|
|
Beginning
|
Ending
|
Expenses Paid
|
Annualized
|
|
|
Account Value
|
Account Value
|
During Period
|
Expense
|
|
|
4/1/22
|
9/30/22
|
4/1/22 – 9/30/22
|
Ratio*
|
|
|
Poplar Forest Cornerstone Fund
|
||||
|
Investor Class Shares
|
||||
|
Actual
|
$1,000.00
|
$ 876.10
|
$4.23
|
0.90%
|
|
Hypothetical (5% return
|
||||
|
before expenses)
|
$1,000.00
|
$1,020.56
|
$4.56
|
0.90%
|
|
*
|
Expenses are equal to the annualized expense ratio of each class, multiplied by the average account value over the period, multiplied by 183 (days in most recent fiscal half-year) / 365 days to
reflect the one-half year expense.
|
15
POPLAR FOREST PARTNERS FUND
Comparison of the change in value of a $100,000 investment in the
Poplar Forest Partners Fund – Institutional Class Shares vs
the S&P 500® Index and the Russell 1000®
Value Index

|
Average Annual Total Return:
|
1 Year
|
5 Year
|
10 Year
|
|
Poplar Forest Partners Fund –
|
|||
|
Institutional Class Shares
|
-5.43%
|
4.91%
|
9.85%
|
|
Poplar Forest Partners Fund –
|
|||
|
Class A Shares (with sales load)
|
-10.40%
|
3.58%
|
9.02%
|
|
Poplar Forest Partners Fund –
|
|||
|
Class A Shares (without sales load)
|
-5.68%
|
4.65%
|
9.58%
|
|
S&P 500® Index
|
-15.47%
|
9.24%
|
11.70%
|
|
Russell 1000® Value Index
|
-11.36%
|
5.29%
|
9.17%
|
Performance data quoted represents past performance; past performance does not guarantee future results. The investment return and principal value of an investment will fluctuate so that an investor’s
shares, when redeemed, may be worth more or less than their original cost. Current performance of the Fund may be lower or higher than the performance quoted. Performance data current to the most recent month end may be obtained by calling
1-877-522-8860.
Returns reflect the reinvestment of dividends and capital gain distributions. Fee waivers are in effect. In the absence of fee waivers, returns would be reduced. Class A shares may be subject to a
5.00% front-end sales load. The performance data and graph do not reflect the deduction of taxes that a shareholder may pay on dividends, capital gain distributions, or redemption of Fund shares. This chart does not imply any future performance.
Indices do not incur expenses and are not available for investment.
The S&P 500® Index is a market-value weighted index consisting of 500 stocks chosen for market size, liquidity, and
industry group representation.
The Russell 1000® Value Index is a measure of the performance of the Russell 1000’s value segment, which is defined to
include firms whose share prices have lower price/book ratios and lower expected long/term mean earnings growth rates.
16
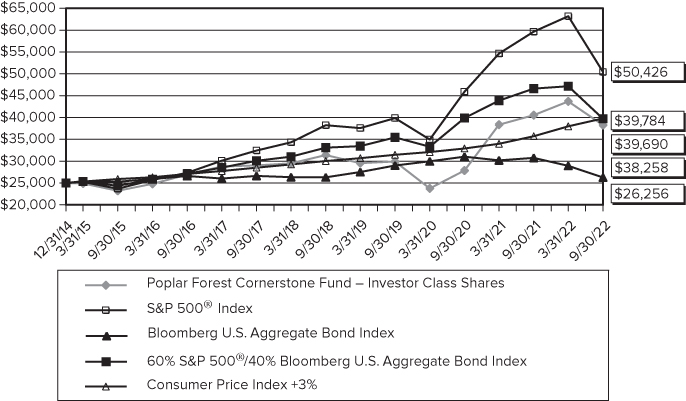
POPLAR FOREST CORNERSTONE FUND
Comparison of the change in value of $25,000 investment in the
Poplar Forest Cornerstone Fund – Investor Class Shares vs.
the S&P 500® Index, the Bloomberg U.S. Aggregate Bond Index,
the Blended Index and the Consumer Price Index +3%
|
Since
|
|||
|
Average Annual Total Return:
|
1 Year
|
5 Year
|
Inception1
|
|
Poplar Forest Cornerstone Fund –
|
|||
|
Investor Class Shares
|
-5.60%
|
5.68%
|
5.65%
|
|
S&P 500® Index
|
-15.47%
|
9.24%
|
9.48%
|
|
Bloomberg U.S. Aggregate Bond Index
|
-14.60%
|
-0.27%
|
0.63%
|
|
60% S&P 500®/ 40% U.S. Aggregate Bond Index
|
-14.85%
|
5.70%
|
6.15%
|
|
Consumer Price Index +3%
|
11.43%
|
6.86%
|
6.15%
|
Performance data quoted represents past performance; past performance does not guarantee future results. The investment return and principal value of an investment will fluctuate so
that an investor’s shares, when redeemed, may be worth more or less than their original cost. Current performance of the Fund may be lower or higher than the performance quoted. Performance data current to the most recent month end may be obtained
by calling 1-877-522-8860.
Returns reflect the reinvestment of dividends and capital gain distributions. Fee waivers are in effect. In the absence of fee waivers, returns would be reduced. The performance data and graph do not
reflect the deduction of taxes that a shareholder may pay on dividends, capital gain distributions, or redemption of Fund shares. This chart does not imply any future performance. Indices do not incur expenses and are not available for investment.
The S&P 500® Index is a market-value weighted index consisting of 500 stocks chosen for market size, liquidity, and
industry group representation.
17
POPLAR FOREST CORNERSTONE FUND
The Bloomberg U.S. Aggregate Bond Index is a broad based benchmark that measures the investment grade, U.S. dollar-denominated, fixed-rate taxable market, including Treasuries, government related and
corporate securities.
The blended index is a 60% S&P 500® Index and 40% Bloomberg U.S. Aggregate Bond Index blend.
Consumer Price Index (CPI) is a measure of the average change over time in the prices paid by urban consumers for a market basket of consumer goods and services. The annual percentage change in a CPI
is used as a measure of inflation. The CPI +3% is a measure defined as an objective in the Fund’s prospectus.
|
1
|
The Fund commenced operations on December 31, 2014.
|
18
POPLAR FOREST PARTNERS FUND
SCHEDULE OF INVESTMENTS at September 30, 2022
|
Shares
|
COMMON STOCKS – 95.1%
|
Value
|
|||||
|
Aerospace & Defense – 2.5%
|
|||||||
|
53,500
|
Curtiss-Wright Corp.
|
$
|
7,445,060
|
||||
|
Air Freight & Logistics – 2.5%
|
|||||||
|
50,700
|
FedEx Corp.
|
7,527,429
|
|||||
|
Banks – 7.3%
|
|||||||
|
211,000
|
Citigroup, Inc.
|
8,792,370
|
|||||
|
327,000
|
Wells Fargo & Co.
|
13,151,940
|
|||||
|
21,944,310
|
|||||||
|
Biotechnology – 4.5%
|
|||||||
|
65,000
|
United Therapeutics Corp. (b)
|
13,609,700
|
|||||
|
Commercial Services & Supplies – 1.1%
|
|||||||
|
217,000
|
MillerKnoll, Inc.
|
3,385,200
|
|||||
|
Consumer Finance – 2.7%
|
|||||||
|
296,000
|
Ally Financial, Inc.
|
8,237,680
|
|||||
|
Diversified Financial Services – 4.3%
|
|||||||
|
490,000
|
Equitable Holdings, Inc.
|
12,911,500
|
|||||
|
Diversified Telecommunication Services – 3.9%
|
|||||||
|
763,000
|
AT&T, Inc.
|
11,704,420
|
|||||
|
Entertainment – 1.0%
|
|||||||
|
249,000
|
Warner Bros. Discovery, Inc. (b)
|
2,863,500
|
|||||
|
Food Products – 3.1%
|
|||||||
|
284,000
|
Conagra Brands, Inc.
|
9,266,920
|
|||||
|
Gas Utilities – 4.4%
|
|||||||
|
212,000
|
National Fuel Gas Co.
|
13,048,600
|
|||||
|
Health Care Providers & Services – 9.1%
|
|||||||
|
105,000
|
AmerisourceBergen Corp.
|
14,209,650
|
|||||
|
137,500
|
CVS Health Corp.
|
13,113,375
|
|||||
|
27,323,025
|
|||||||
|
Hotels, Restaurants & Leisure – 3.2%
|
|||||||
|
257,000
|
Las Vegas Sands Corp. (b)
|
9,642,640
|
|||||
|
Household Durables – 1.7%
|
|||||||
|
360,000
|
Newell Brands, Inc.
|
5,000,400
|
|||||
|
Insurance – 8.6%
|
|||||||
|
112,000
|
Allstate Corp.
|
13,947,360
|
|||||
|
250,500
|
American International Group, Inc.
|
11,893,740
|
|||||
|
25,841,100
|
|||||||
|
IT Services – 6.2%
|
|||||||
|
264,000
|
DXC Technology Co. (b)
|
6,462,720
|
|||||
|
100,800
|
International Business Machines Corp.
|
11,976,048
|
|||||
|
18,438,768
|
|||||||
The accompanying notes are an integral part of these financial statements.
19
POPLAR FOREST PARTNERS FUND
SCHEDULE OF INVESTMENTS at September 30, 2022, Continued
|
Shares
|
Value
|
||||||
|
Machinery – 1.7%
|
|||||||
|
468,000
|
CNH Industrial NV (a)
|
$
|
5,227,560
|
||||
|
Multi-line Retail – 4.0%
|
|||||||
|
88,500
|
Dollar Tree, Inc. (b)
|
12,044,850
|
|||||
|
Oil, Gas & Consumable Fuels – 8.1%
|
|||||||
|
105,000
|
Chevron Corp.
|
15,085,350
|
|||||
|
260,000
|
Murphy Oil Corp.
|
9,144,200
|
|||||
|
24,229,550
|
|||||||
|
Pharmaceuticals – 7.2%
|
|||||||
|
135,000
|
Merck & Co., Inc.
|
11,626,200
|
|||||
|
276,000
|
Perrigo Co. PLC (a)
|
9,842,160
|
|||||
|
21,468,360
|
|||||||
|
Specialty Retail – 3.0%
|
|||||||
|
57,500
|
Advance Auto Parts, Inc.
|
8,989,550
|
|||||
|
Textiles, Apparel & Luxury Goods – 2.3%
|
|||||||
|
240,000
|
Tapestry, Inc.
|
6,823,200
|
|||||
|
Tobacco – 2.7%
|
|||||||
|
99,000
|
Philip Morris International, Inc.
|
8,217,990
|
|||||
|
TOTAL COMMON STOCKS
|
|||||||
|
(Cost $245,092,997)
|
285,191,312
|
||||||
|
MONEY MARKET FUND – 4.9%
|
|||||||
|
14,644,960
|
Morgan Stanley Institutional Liquidity Funds –
|
||||||
|
Treasury Portfolio – Institutional Class, 2.768% (c)
|
14,644,960
|
||||||
|
TOTAL MONEY MARKET FUND
|
|||||||
|
(Cost $14,644,960)
|
14,644,960
|
||||||
|
Total Investments in Securities
|
|||||||
|
(Cost $259,737,957) – 100.0%
|
299,836,272
|
||||||
|
Other Assets in Excess of Liabilities – 0.0%
|
16,351
|
||||||
|
NET ASSETS – 100.0%
|
$
|
299,852,623
|
|||||
|
(a)
|
U.S. traded security of a foreign issuer.
|
|
(b)
|
Non-income producing security.
|
|
(c)
|
Rate shown is the 7-day annualized yield at September 30, 2022.
|
The Global Industry Classification Standard (GICS®) was developed by and/or is the exclusive property of MSCI, Inc. and
Standard & Poor’s Financial Services LLC (“S&P”). GICS is a service mark of MSCI and S&P and has been licensed for use by U.S. Bancorp Fund Services, LLC.
The accompanying notes are an integral part of these financial statements.
20
POPLAR FOREST CORNERSTONE FUND
SCHEDULE OF INVESTMENTS at September 30, 2022
|
Shares
|
COMMON STOCKS – 65.6%
|
Value
|
|||||
|
Aerospace & Defense – 2.5%
|
|||||||
|
5,000
|
Curtiss-Wright Corp.
|
$
|
695,800
|
||||
|
Air Freight & Logistics – 1.8%
|
|||||||
|
3,350
|
FedEx Corp.
|
497,375
|
|||||
|
Banks – 4.4%
|
|||||||
|
16,300
|
Citigroup, Inc.
|
679,221
|
|||||
|
14,200
|
Wells Fargo & Co.
|
571,124
|
|||||
|
1,250,345
|
|||||||
|
Biotechnology – 3.0%
|
|||||||
|
4,000
|
United Therapeutics Corp. (a)
|
837,520
|
|||||
|
Commercial Services & Supplies – 1.1%
|
|||||||
|
20,100
|
MillerKnoll, Inc.
|
313,560
|
|||||
|
Consumer Finance – 1.8%
|
|||||||
|
18,000
|
Ally Financial, Inc.
|
500,940
|
|||||
|
Diversified Financial Services – 3.2%
|
|||||||
|
4,021
|
Apollo Global Management, Inc.
|
186,976
|
|||||
|
27,100
|
Equitable Holdings, Inc.
|
714,085
|
|||||
|
901,061
|
|||||||
|
Diversified Telecommunication Services – 2.4%
|
|||||||
|
44,100
|
AT&T, Inc.
|
676,494
|
|||||
|
Entertainment – 1.0%
|
|||||||
|
24,000
|
Warner Bros. Discovery, Inc. (a)
|
276,000
|
|||||
|
Food Products – 2.6%
|
|||||||
|
22,300
|
Conagra Brands, Inc.
|
727,649
|
|||||
|
Gas Utilities – 2.3%
|
|||||||
|
10,700
|
National Fuel Gas Co.
|
658,585
|
|||||
|
Health Care Providers & Services – 6.0%
|
|||||||
|
5,300
|
AmerisourceBergen Corp.
|
717,249
|
|||||
|
7,300
|
CVS Health Corp.
|
696,201
|
|||||
|
600
|
Elevance Health, Inc.
|
272,544
|
|||||
|
1,685,994
|
|||||||
|
Hotels, Restaurants & Leisure – 2.7%
|
|||||||
|
19,900
|
Las Vegas Sands Corp. (a)
|
746,648
|
|||||
|
Household Durables – 1.4%
|
|||||||
|
29,000
|
Newell Brands, Inc.
|
402,810
|
|||||
|
Insurance – 4.7%
|
|||||||
|
5,800
|
Allstate Corp.
|
722,274
|
|||||
|
12,400
|
American International Group, Inc.
|
588,752
|
|||||
|
1,311,026
|
|||||||
The accompanying notes are an integral part of these financial statements.
21
POPLAR FOREST CORNERSTONE FUND
SCHEDULE OF INVESTMENTS at September 30, 2022, Continued
|
Shares
|
Value
|
||||||
|
IT Services – 4.1%
|
|||||||
|
19,500
|
DXC Technology Co. (a)
|
$
|
477,360
|
||||
|
5,800
|
International Business Machines Corp.
|
689,098
|
|||||
|
1,166,458
|
|||||||
|
Machinery – 1.6%
|
|||||||
|
39,600
|
CNH Industrial NV (c)
|
442,332
|
|||||
|
Multi-line Retail – 2.4%
|
|||||||
|
4,900
|
Dollar Tree, Inc. (a)
|
666,890
|
|||||
|
Oil, Gas & Consumable Fuels – 4.7%
|
|||||||
|
4,600
|
Chevron Corp.
|
660,882
|
|||||
|
18,900
|
Murphy Oil Corp.
|
664,713
|
|||||
|
1,325,595
|
|||||||
|
Pharmaceuticals – 4.7%
|
|||||||
|
6,600
|
Merck & Co., Inc.
|
568,392
|
|||||
|
20,900
|
Perrigo Co. PLC (c)
|
745,294
|
|||||
|
1,313,686
|
|||||||
|
Software – 0.9%
|
|||||||
|
2,500
|
VMware, Inc.
|
266,150
|
|||||
|
Specialty Retail – 1.8%
|
|||||||
|
3,200
|
Advance Auto Parts, Inc.
|
500,288
|
|||||
|
Textiles, Apparel & Luxury Goods – 2.2%
|
|||||||
|
22,300
|
Tapestry, Inc.
|
633,989
|
|||||
|
Tobacco – 2.3%
|
|||||||
|
7,800
|
Philip Morris International, Inc.
|
647,478
|
|||||
|
TOTAL COMMON STOCKS
|
|||||||
|
(Cost $16,680,218)
|
18,444,673
|
||||||
|
Principal
|
|||||||
|
Amount
|
CORPORATE BONDS – 12.8%
|
||||||
|
Banks – 2.4%
|
|||||||
|
Citizens Financial Group, Inc.
|
|||||||
|
$
|
700,000
|
3.750%, 7/1/24
|
676,473
|
||||
|
Food Products – 2.5%
|
|||||||
|
McCormick & Company, Inc.
|
|||||||
|
715,000
|
3.500%, 9/1/23
|
705,990
|
|||||
|
Gas Utilities – 2.5%
|
|||||||
|
National Fuel Gas Co.
|
|||||||
|
800,000
|
3.950%, 9/15/27
|
711,035
|
|||||
|
Professional Services – 2.7%
|
|||||||
|
Equifax, Inc.
|
|||||||
|
750,000
|
3.300%, 12/15/22
|
749,728
|
|||||
The accompanying notes are an integral part of these financial statements.
22
POPLAR FOREST CORNERSTONE FUND
SCHEDULE OF INVESTMENTS at September 30, 2022, Continued
|
Principal
|
|||||||
|
Amount
|
Value
|
||||||
|
Specialty Retail – 2.7%
|
|||||||
|
Dick’s Sporting Goods, Inc.
|
|||||||
|
$
|
1,000,000
|
3.150%, 1/15/32
|
$
|
762,733
|
|||
|
TOTAL CORPORATE BONDS
|
|||||||
|
(Cost $3,731,614)
|
3,605,959
|
||||||
|
U.S. TREASURY NOTES – 12.3%
|
|||||||
|
U.S. Treasury Floating Rate Note
|
|||||||
|
650,000
|
3.346%, (USBMMY3M + 0.049%), 1/31/23 (d)
|
650,644
|
|||||
|
U.S. Treasury Note TIPS
|
|||||||
|
873,432
|
0.125%, 7/15/24
|
843,795
|
|||||
|
868,695
|
0.250%, 7/15/29
|
783,264
|
|||||
|
U.S. Treasury Notes
|
|||||||
|
310,000
|
0.500%, 11/30/23
|
296,807
|
|||||
|
145,000
|
0.750%, 12/31/23
|
138,860
|
|||||
|
165,000
|
0.875%, 1/31/24
|
157,688
|
|||||
|
165,000
|
1.500%, 2/29/24
|
158,735
|
|||||
|
145,000
|
2.250%, 3/31/24
|
140,707
|
|||||
|
300,000
|
2.625%, 4/15/25
|
288,222
|
|||||
|
TOTAL U.S. TREASURY NOTES
|
|||||||
|
(Cost $3,622,420)
|
3,458,722
|
||||||
|
U.S. GOVERNMENT AGENCY – 2.9%
|
|||||||
|
Federal Home Loan Banks
|
|||||||
|
800,000
|
4.000%, 9/30/27
|
800,918
|
|||||
|
TOTAL U.S. GOVERNMENT AGENCY
|
|||||||
|
(Cost $800,000)
|
800,918
|
||||||
|
PREFERRED STOCK – 2.0%
|
|||||||
|
Consumer Finance – 2.0%
|
|||||||
|
700,000
|
Ally Financial, Inc. – Series B, 4.70%
|
548,121
|
|||||
|
TOTAL PREFERRED STOCK
|
|||||||
|
(Cost $713,347)
|
548,121
|
||||||
|
SHORT-TERM INVESTMENTS – 9.6%
|
|||||||
|
Money Market Fund – 6.2%
|
|||||||
|
1,745,760
|
Morgan Stanley Institutional Liquidity Funds –
|
||||||
|
Treasury Portfolio – Institutional Class, 2.768% (b)
|
1,745,760
|
||||||
The accompanying notes are an integral part of these financial statements.
23
POPLAR FOREST CORNERSTONE FUND
SCHEDULE OF INVESTMENTS at September 30, 2022, Continued
|
Principal
|
|||||||
|
Amount
|
Value
|
||||||
|
U.S. Treasury Bills – 3.4%
|
|||||||
|
$
|
175,000
|
0.090%, 10/6/22 (e)
|
$
|
174,966
|
|||
|
175,000
|
0.160%, 11/3/22 (e)
|
174,600
|
|||||
|
155,000
|
0.240%, 12/1/22% (e)
|
154,267
|
|||||
|
145,000
|
0.39%, 12/29/22 (e)
|
143,880
|
|||||
|
165,000
|
1.145%, 2/23/23 (e)
|
162,693
|
|||||
|
145,000
|
1.590%, 3/23/23 (e)
|
142,481
|
|||||
|
952,887
|
|||||||
|
TOTAL SHORT-TERM INVESTMENTS
|
|||||||
|
(Cost $2,703,660)
|
2,698,647
|
||||||
|
Total Investments in Securities
|
|||||||
|
(Cost $28,251,259) – 105.2%
|
29,557,040
|
||||||
|
Liabilities in Excess of Other Assets – (5.2)%
|
(1,450,512
|
)
|
|||||
|
NET ASSETS – 100.0%
|
$
|
28,106,528
|
|||||
TIPS – Treasury Inflation Protected Securities
USBMMY3M – U.S. Treasury 3 Month Bill Money Market Fund
|
(a)
|
Non-income producing security.
|
|
(b)
|
Rate shown is the 7-day annualized yield at September 30, 2022.
|
|
(c)
|
U.S. traded security of a foreign issuer.
|
|
(d)
|
Variable or floating rate security based on a reference index and spread. The rate reported is the rate in effect as of September 30, 2022.
|
|
(e)
|
Rate shown is the discount rate at September 30, 2022.
|
The Global Industry Classification Standard (GICS®) was developed by and/or is the exclusive property of MSCI, Inc. and
Standard & Poor’s Financial Services LLC (“S&P”). GICS is a service mark of MSCI and S&P and has been licensed for use by U.S. Bancorp Fund Services, LLC.
The accompanying notes are an integral part of these financial statements.
24
(This Page Intentionally Left Blank.)
25
POPLAR FOREST FUNDS
STATEMENTS OF ASSETS AND LIABILITIES at September 30, 2022
|
Poplar Forest
|
Poplar Forest
|
|||||||
|
Partners Fund
|
Cornerstone Fund
|
|||||||
|
ASSETS
|
||||||||
|
Investments in securities, at value (identified cost
|
||||||||
|
$259,737,957 and $28,251,259, respectively)
|
$
|
299,836,272
|
$
|
29,557,040
|
||||
|
Receivables
|
||||||||
|
Fund shares issued
|
71,713
|
54,000
|
||||||
|
Dividends and interest
|
550,615
|
74,723
|
||||||
|
Prepaid expenses
|
25,213
|
2,826
|
||||||
|
Total assets
|
300,483,813
|
29,688,589
|
||||||
|
LIABILITIES
|
||||||||
|
Payables
|
||||||||
|
Investments purchased
|
—
|
1,519,316
|
||||||
|
Fund shares redeemed
|
285,753
|
8,812
|
||||||
|
Due to Adviser
|
195,346
|
6,028
|
||||||
|
12b-1 fees
|
22,497
|
—
|
||||||
|
Custody fees
|
6,871
|
1,394
|
||||||
|
Administration and fund accounting fees
|
50,326
|
16,461
|
||||||
|
Transfer agent fees and expenses
|
34,585
|
3,675
|
||||||
|
Audit fees
|
22,500
|
20,997
|
||||||
|
Chief Compliance Officer fee
|
2,083
|
2,082
|
||||||
|
Trustee fees and expenses
|
401
|
629
|
||||||
|
Accrued expenses
|
10,828
|
2,667
|
||||||
|
Total liabilities
|
631,190
|
1,582,061
|
||||||
|
NET ASSETS
|
$
|
299,852,623
|
$
|
28,106,528
|
||||
The accompanying notes are an integral part of these financial statements.
26
POPLAR FOREST FUNDS
STATEMENTS OF ASSETS AND LIABILITIES at September 30, 2022, Continued
|
Poplar Forest
|
Poplar Forest
|
|||||||
|
Partners Fund
|
Cornerstone Fund
|
|||||||
|
CALCULATION OF NET ASSET VALUE PER SHARE
|
||||||||
|
Class A Shares
|
||||||||
|
Net assets applicable to shares outstanding
|
$
|
23,387,444
|
$
|
—
|
||||
|
Shares issued and outstanding [unlimited number
|
||||||||
|
of shares (par value $0.01) authorized]
|
507,599
|
—
|
||||||
|
Net asset value and redemption price per share
|
$
|
46.07
|
$
|
—
|
||||
|
Maximum offering price per share (Net asset value
|
||||||||
|
per share divided by 95.00%)
|
$
|
48.49
|
$
|
—
|
||||
|
Investor Class Shares
|
||||||||
|
Net assets applicable to shares outstanding
|
$
|
—
|
$
|
28,106,528
|
||||
|
Shares issued and outstanding [unlimited number
|
||||||||
|
of shares (par value $0.01) authorized]
|
—
|
1,037,914
|
||||||
|
Net asset value, offering and redemption price per share
|
$
|
—
|
$
|
27.08
|
||||
|
Institutional Class Shares
|
||||||||
|
Net assets applicable to shares outstanding
|
$
|
276,465,179
|
$
|
—
|
||||
|
Shares issued and outstanding [unlimited number
|
||||||||
|
of shares (par value $0.01) authorized]
|
5,989,920
|
—
|
||||||
|
Net asset value, offering and redemption price per share
|
$
|
46.16
|
$
|
—
|
||||
|
COMPONENTS OF NET ASSETS
|
||||||||
|
Paid-in capital
|
$
|
240,063,644
|
$
|
24,269,379
|
||||
|
Total distributable earnings
|
59,788,979
|
3,837,149
|
||||||
|
Net assets
|
$
|
299,852,623
|
$
|
28,106,528
|
||||
The accompanying notes are an integral part of these financial statements.
27
POPLAR FOREST FUNDS
STATEMENTS OF OPERATIONS For the Year Ended September 30, 2022
|
Poplar Forest
|
Poplar Forest
|
|||||||
|
Partners Fund
|
Cornerstone Fund
|
|||||||
|
INVESTMENT INCOME
|
||||||||
|
Income
|
||||||||
|
Dividends
|
$
|
8,350,397
|
$
|
549,156
|
||||
|
Interest
|
72,407
|
281,638
|
||||||
|
Total Income
|
8,422,804
|
830,794
|
||||||
|
Expenses
|
||||||||
|
Advisory fees (Note 4)
|
2,800,746
|
249,837
|
||||||
|
Administration and fund accounting fees (Note 4)
|
297,977
|
97,742
|
||||||
|
Transfer agent fees and expenses (Note 4)
|
137,053
|
19,079
|
||||||
|
Sub-transfer agent fees (Note 4)
|
81,075
|
856
|
||||||
|
12b-1 fees – Class A shares (Note 5)
|
68,333
|
—
|
||||||
|
Registration fees
|
37,622
|
8,301
|
||||||
|
Custody fees (Note 4)
|
38,716
|
6,501
|
||||||
|
Audit fees
|
22,500
|
19,997
|
||||||
|
Printing and mailing expense
|
17,357
|
5,256
|
||||||
|
Trustees fees and expenses
|
13,843
|
14,070
|
||||||
|
Chief Compliance Officer fee (Note 4)
|
12,500
|
12,499
|
||||||
|
Legal fees
|
6,592
|
6,755
|
||||||
|
Insurance expense
|
6,181
|
2,569
|
||||||
|
Miscellaneous
|
26,762
|
6,387
|
||||||
|
Total expenses
|
3,567,257
|
449,849
|
||||||
|
Less: Advisory fees waived (Note 4)
|
(295,589
|
)
|
(168,783
|
)
|
||||
|
Net expenses
|
3,271,668
|
281,066
|
||||||
|
Net investment income
|
5,151,136
|
549,728
|
||||||
|
REALIZED AND UNREALIZED GAIN/(LOSS) ON INVESTMENTS
|
||||||||
|
Net realized gain from investments
|
21,976,629
|
2,183,894
|
||||||
|
Net change in unrealized appreciation on investments
|
(45,477,946
|
)
|
(4,474,030
|
)
|
||||
|
Net realized and unrealized loss on investments
|
(23,501,317
|
)
|
(2,290,136
|
)
|
||||
|
Net Decrease in Net Assets Resulting from Operations
|
$
|
(18,350,181
|
)
|
$
|
(1,740,408
|
)
|
||
The accompanying notes are an integral part of these financial statements.
28
POPLAR FOREST PARTNERS FUND
STATEMENTS OF CHANGES IN NET ASSETS
|
Year Ended
|
Year Ended
|
|||||||
|
September 30, 2022
|
September 30, 2021
|
|||||||
|
NET INCREASE/(DECREASE) IN NET ASSETS FROM:
|
||||||||
|
OPERATIONS
|
||||||||
|
Net investment income
|
$
|
5,151,136
|
$
|
4,885,897
|
||||
|
Net realized gain from investments
|
21,976,629
|
39,388,544
|
||||||
|
Net change in unrealized appreciation/
|
||||||||
|
(depreciation) on investments
|
(45,477,946
|
)
|
78,809,934
|
|||||
|
Net increase/(decrease) in net assets
|
||||||||
|
resulting from operations
|
(18,350,181
|
)
|
123,084,375
|
|||||
|
DIVIDENDS AND DISTRIBUTIONS TO SHAREHOLDERS
|
||||||||
|
Net dividends and distributions to shareholders —
|
||||||||
|
Class A Shares
|
(3,177,349
|
)
|
(415,085
|
)
|
||||
|
Net dividends and distributions to shareholders —
|
||||||||
|
Institutional Class Shares
|
(38,843,292
|
)
|
(5,476,997
|
)
|
||||
|
Total dividends and distributions to shareholders
|
(42,020,641
|
)
|
(5,892,082
|
)
|
||||
|
CAPITAL SHARE TRANSACTIONS
|
||||||||
|
Net increase/(decrease) in net assets derived
|
||||||||
|
from net change in outstanding shares (a)
|
46,622,960
|
(13,007,866
|
)
|
|||||
|
Total increase/(decrease) in net assets
|
(13,747,862
|
)
|
104,184,427
|
|||||
|
NET ASSETS
|
||||||||
|
Beginning of year
|
313,600,485
|
209,416,058
|
||||||
|
End of year
|
$
|
299,852,623
|
$
|
313,600,485
|
||||
|
(a)
|
A summary of share transactions is as follows:
|
|
Year Ended
|
Year Ended
|
||||||||||||||||
|
September 30, 2022
|
September 30, 2021
|
||||||||||||||||
|
Class A Shares
|
Shares
|
Paid-in Capital
|
Shares
|
Paid-in Capital
|
|||||||||||||
|
Shares sold
|
123,157
|
$
|
6,537,843
|
25,420
|
$
|
1,304,406
|
|||||||||||
|
Shares issued on
|
|||||||||||||||||
|
reinvestments of distributions
|
53,592
|
2,723,003
|
8,381
|
359,307
|
|||||||||||||
|
Shares redeemed
|
(99,674
|
)
|
(5,070,147
|
)
|
(75,059
|
)
|
(3,502,736
|
)
|
|||||||||
|
Net increase/(decrease)
|
77,075
|
$
|
4,190,699
|
(41,258
|
)
|
$
|
(1,839,023
|
)
|
|||||||||
|
Year Ended
|
Year Ended
|
||||||||||||||||
|
September 30, 2022
|
September 30, 2021
|
||||||||||||||||
|
Institutional Class Shares
|
Shares
|
Paid-in Capital
|
Shares
|
Paid-in Capital
|
|||||||||||||
|
Shares sold
|
1,418,632
|
$
|
75,102,907
|
761,086
|
$
|
38,036,211
|
|||||||||||
|
Shares issued on
|
|||||||||||||||||
|
reinvestments of distributions
|
561,705
|
28,529,000
|
95,132
|
4,077,349
|
|||||||||||||
|
Shares redeemed
|
(1,153,787
|
)
|
(61,199,646
|
)
|
(1,080,237
|
)
|
(53,282,403
|
)
|
|||||||||
|
Net increase/(decrease)
|
826,550
|
$
|
42,432,261
|
(224,019
|
)
|
$
|
(11,168,843
|
)
|
|||||||||
The accompanying notes are an integral part of these financial statements.
29
POPLAR FOREST CORNERSTONE FUND
STATEMENTS OF CHANGES IN NET ASSETS
|
Year Ended
|
Year Ended
|
|||||||
|
September 30, 2022
|
September 30, 2021
|
|||||||
|
NET INCREASE/(DECREASE) IN NET ASSETS FROM:
|
||||||||
|
OPERATIONS
|
||||||||
|
Net investment income
|
$
|
549,728
|
$
|
548,438
|
||||
|
Net realized gain from investments
|
2,183,894
|
2,924,392
|
||||||
|
Net change in unrealized appreciation/
|
||||||||
|
(depreciation) on investments
|
(4,474,030
|
)
|
5,994,523
|
|||||
|
Net increase/(decrease) in net assets
|
||||||||
|
resulting from operations
|
(1,740,408
|
)
|
9,467,353
|
|||||
|
DIVIDENDS AND DISTRIBUTIONS TO SHAREHOLDERS
|
||||||||
|
Net dividends and distributions to shareholders —
|
||||||||
|
Investor Class Shares
|
(3,563,788
|
)
|
(472,669
|
)
|
||||
|
Total dividends and distributions to shareholders
|
(3,563,788
|
)
|
(472,669
|
)
|
||||
|
CAPITAL SHARE TRANSACTIONS
|
||||||||
|
Net increase/(decrease) in net assets derived
|
||||||||
|
from net change in outstanding shares (a)
|
3,967,318
|
(2,174,853
|
)
|
|||||
|
Total increase/(decrease) in net assets
|
(1,336,878
|
)
|
6,819,831
|
|||||
|
NET ASSETS
|
||||||||
|
Beginning of year
|
29,443,406
|
22,623,575
|
||||||
|
End of year
|
$
|
28,106,528
|
$
|
29,443,406
|
||||
|
(a)
|
A summary of share transactions is as follows:
|
|
Year Ended
|
Year Ended
|
||||||||||||||||
|
September 30, 2022
|
September 30, 2021
|
||||||||||||||||
|
Class A Shares*
|
Shares
|
Paid-in Capital
|
Shares
|
Paid-in Capital
|
|||||||||||||
|
Payment for conversion
|
|||||||||||||||||
|
of Class A shares
|
—
|
$
|
—
|
(22,671
|
)
|
$
|
(515,549
|
)
|
|||||||||
|
Shares redeemed
|
—
|
—
|
(1,124
|
)
|
(26,622
|
)
|
|||||||||||
|
Net decrease
|
—
|
$
|
—
|
(23,795
|
)
|
$
|
(542,171
|
)
|
|||||||||
|
Year Ended
|
Year Ended
|
||||||||||||||||
|
September 30, 2022
|
September 30, 2021
|
||||||||||||||||
|
Investor Class Shares
|
Shares
|
Paid-in Capital
|
Shares
|
Paid-in Capital
|
|||||||||||||
|
Shares sold
|
62,751
|
$
|
1,948,560
|
9,455
|
$
|
309,101
|
|||||||||||
|
Proceeds from conversion
|
|||||||||||||||||
|
of Class A shares
|
—
|
—
|
22,612
|
515,549
|
|||||||||||||
|
Shares issued on
|
|||||||||||||||||
|
reinvestments of distributions
|
114,029
|
3,375,255
|
17,427
|
457,118
|
|||||||||||||
|
Shares redeemed
|
(45,031
|
)
|
(1,356,497
|
)
|
(113,808
|
)
|
(2,914,450
|
)
|
|||||||||
|
Net increase/(decrease)
|
131,749
|
$
|
3,967,318
|
(64,314
|
)
|
$
|
(1,632,682
|
)
|
|||||||||
|
*
|
Class A Shares converted to Investor Class Shares on October 30, 2020. See Note 1 in the Notes to Financial Statements.
|
The accompanying notes are an integral part of these financial statements.
30
POPLAR FOREST PARTNERS FUND
FINANCIAL HIGHLIGHTS For a share outstanding throughout each year
Class A Shares
|
Year Ended September 30,
|
||||||||||||||||||||
|
2022
|
2021
|
2020
|
2019
|
2018
|
||||||||||||||||
|
Net asset value, beginning of year
|
$
|
55.97
|
$
|
35.69
|
$
|
42.22
|
$
|
52.65
|
$
|
50.88
|
||||||||||
|
Income from investment operations:
|
||||||||||||||||||||
|
Net investment income^
|
0.69
|
0.74
|
0.74
|
0.58
|
0.39
|
|||||||||||||||
|
Net realized and unrealized
|
||||||||||||||||||||
|
gain/(loss) on investments
|
(3.18
|
)
|
20.48
|
(6.65
|
)
|
(6.50
|
)
|
3.77
|
||||||||||||
|
Total from investment operations
|
(2.49
|
)
|
21.22
|
(5.91
|
)
|
(5.92
|
)
|
4.16
|
||||||||||||
|
Less distributions:
|
||||||||||||||||||||
|
From net investment income
|
(0.94
|
)
|
(0.94
|
)
|
(0.62
|
)
|
(0.50
|
)
|
(0.85
|
)
|
||||||||||
|
From net realized
|
||||||||||||||||||||
|
gain on investments
|
(6.47
|
)
|
—
|
—
|
(4.01
|
)
|
(1.54
|
)
|
||||||||||||
|
Total distributions
|
(7.41
|
)
|
(0.94
|
)
|
(0.62
|
)
|
(4.51
|
)
|
(2.39
|
)
|
||||||||||
|
Net asset value, end of year
|
$
|
46.07
|
$
|
55.97
|
$
|
35.69
|
$
|
42.22
|
$
|
52.65
|
||||||||||
|
Total return
|
-5.68
|
%
|
60.26
|
%
|
-14.27
|
%
|
-10.71
|
%
|
8.45
|
%
|
||||||||||
|
Ratios/supplemental data:
|
||||||||||||||||||||
|
Net assets, end of year (thousands)
|
$
|
23,387
|
$
|
24,098
|
$
|
16,840
|
$
|
29,359
|
$
|
48,157
|
||||||||||
|
Ratio of expenses
|
||||||||||||||||||||
|
to average net assets:
|
||||||||||||||||||||
|
Before fee waiver
|
1.29
|
%
|
1.34
|
%
|
1.43
|
%
|
1.36
|
%
|
1.28
|
%
|
||||||||||
|
After fee waiver
|
1.20
|
%
|
1.21
|
%
|
1.25
|
%
|
1.25
|
%
|
1.25
|
%
|
||||||||||
|
Ratio of net investment income
|
||||||||||||||||||||
|
to average net assets:
|
||||||||||||||||||||
|
Before fee waiver
|
1.21
|
%
|
1.35
|
%
|
1.75
|
%
|
1.25
|
%
|
0.74
|
%
|
||||||||||
|
After fee waiver
|
1.30
|
%
|
1.48
|
%
|
1.93
|
%
|
1.36
|
%
|
0.77
|
%
|
||||||||||
|
Portfolio turnover rate
|
30.29
|
%
|
40.94
|
%
|
40.35
|
%
|
30.72
|
%
|
31.83
|
%
|
||||||||||
|
^
|
Based on average shares outstanding.
|
The accompanying notes are an integral part of these financial statements.
31
POPLAR FOREST PARTNERS FUND
FINANCIAL HIGHLIGHTS For a share outstanding throughout each year
Institutional Class
|
Year Ended September 30,
|
||||||||||||||||||||
|
2022
|
2021
|
2020
|
2019
|
2018
|
||||||||||||||||
|
Net asset value, beginning of year
|
$
|
56.07
|
$
|
35.75
|
$
|
42.29
|
$
|
52.79
|
$
|
51.06
|
||||||||||
|
Income from investment operations:
|
||||||||||||||||||||
|
Net investment income^
|
0.83
|
0.86
|
0.84
|
0.69
|
0.53
|
|||||||||||||||
|
Net realized and unrealized
|
||||||||||||||||||||
|
gain/(loss) on investments
|
(3.19
|
)
|
20.50
|
(6.65
|
)
|
(6.53
|
)
|
3.77
|
||||||||||||
|
Total from investment operations
|
(2.36
|
)
|
21.36
|
(5.81
|
)
|
(5.84
|
)
|
4.30
|
||||||||||||
|
Less distributions:
|
||||||||||||||||||||
|
From net investment income
|
(1.08
|
)
|
(1.04
|
)
|
(0.73
|
)
|
(0.65
|
)
|
(1.03
|
)
|
||||||||||
|
From net realized
|
||||||||||||||||||||
|
gain on investments
|
(6.47
|
)
|
—
|
—
|
(4.01
|
)
|
(1.54
|
)
|
||||||||||||
|
Total distributions
|
(7.55
|
)
|
(1.04
|
)
|
(0.73
|
)
|
(4.66
|
)
|
(2.57
|
)
|
||||||||||
|
Net asset value, end of year
|
$
|
46.16
|
$
|
56.07
|
$
|
35.75
|
$
|
42.29
|
$
|
52.79
|
||||||||||
|
Total return
|
-5.43
|
%
|
60.63
|
%
|
-14.03
|
%
|
-10.49
|
%
|
8.72
|
%
|
||||||||||
|
Ratios/supplemental data:
|
||||||||||||||||||||
|
Net assets, end of year (thousands)
|
$
|
276,465
|
$
|
289,502
|
$
|
192,576
|
$
|
362,369
|
$
|
701,542
|
||||||||||
|
Ratio of expenses
|
||||||||||||||||||||
|
to average net assets:
|
||||||||||||||||||||
|
Before fee waiver
|
1.04
|
%
|
1.09
|
%
|
1.18
|
%
|
1.11
|
%
|
1.03
|
%
|
||||||||||
|
After fee waiver
|
0.95
|
%
|
0.96
|
%
|
1.00
|
%
|
1.00
|
%
|
1.00
|
%
|
||||||||||
|
Ratio of net investment income
|
||||||||||||||||||||
|
to average net assets:
|
||||||||||||||||||||
|
Before fee waiver
|
1.46
|
%
|
1.59
|
%
|
2.00
|
%
|
1.50
|
%
|
1.02
|
%
|
||||||||||
|
After fee waiver
|
1.55
|
%
|
1.72
|
%
|
2.18
|
%
|
1.61
|
%
|
1.05
|
%
|
||||||||||
|
Portfolio turnover rate
|
30.29
|
%
|
40.94
|
%
|
40.35
|
%
|
30.72
|
%
|
31.83
|
%
|
||||||||||
|
^
|
Based on average shares outstanding.
|
The accompanying notes are an integral part of these financial statements.
32
POPLAR FOREST CORNERSTONE FUND
FINANCIAL HIGHLIGHTS For a share outstanding throughout each year
Investor Shares
|
Year Ended September 30,
|
||||||||||||||||||||
|
2022
|
2021
|
2020
|
2019
|
2018
|
||||||||||||||||
|
Net asset value, beginning of year
|
$
|
32.49
|
$
|
22.76
|
$
|
25.58
|
$
|
28.20
|
$
|
26.70
|
||||||||||
|
Income from investment operations:
|
||||||||||||||||||||
|
Net investment income^
|
0.54
|
0.60
|
0.45
|
0.42
|
0.33
|
|||||||||||||||
|
Net realized and unrealized
|
||||||||||||||||||||
|
gain/(loss) on investments
|
(2.03
|
)
|
9.64
|
(2.11
|
)
|
(1.83
|
)
|
1.81
|
||||||||||||
|
Total from investment operations
|
(1.49
|
)
|
10.24
|
(1.66
|
)
|
(1.41
|
)
|
2.14
|
||||||||||||
|
Less distributions:
|
||||||||||||||||||||
|
From net investment income
|
(0.72
|
)
|
(0.51
|
)
|
(0.34
|
)
|
(0.42
|
)
|
(0.40
|
)
|
||||||||||
|
From net realized
|
||||||||||||||||||||
|
gain on investments
|
(3.20
|
)
|
—
|
(0.82
|
)
|
(0.79
|
)
|
(0.24
|
)
|
|||||||||||
|
Total distributions
|
(3.92
|
)
|
(0.51
|
)
|
(1.16
|
)
|
(1.21
|
)
|
(0.64
|
)
|
||||||||||
|
Net asset value, end of year
|
$
|
27.08
|
$
|
32.49
|
$
|
22.76
|
$
|
25.58
|
$
|
28.20
|
||||||||||
|
Total return
|
-5.60
|
%
|
45.53
|
%
|
-6.89
|
%
|
-4.71
|
%
|
8.15
|
%
|
||||||||||
|
Ratios/supplemental data:
|
||||||||||||||||||||
|
Net assets, end of year (thousands)
|
$
|
28,107
|
$
|
29,443
|
$
|
22,084
|
$
|
26,739
|
$
|
31,005
|
||||||||||
|
Ratio of expenses
|
||||||||||||||||||||
|
to average net assets:
|
||||||||||||||||||||
|
Before fee waiver
|
1.44
|
%
|
1.53
|
%#
|
1.76
|
%
|
1.64
|
%
|
1.49
|
%
|
||||||||||
|
After fee waiver
|
0.90
|
%
|
0.90
|
%#
|
0.90
|
%
|
0.90
|
%
|
0.90
|
%
|
||||||||||
|
Ratio of net investment income
|
||||||||||||||||||||
|
to average net assets:
|
||||||||||||||||||||
|
Before fee waiver
|
1.22
|
%
|
1.38
|
%
|
1.05
|
%
|
0.92
|
%
|
0.61
|
%
|
||||||||||
|
After fee waiver
|
1.76
|
%
|
2.01
|
%
|
1.91
|
%
|
1.66
|
%
|
1.20
|
%
|
||||||||||
|
Portfolio turnover rate
|
29.73
|
%
|
36.13
|
%
|
39.97
|
%
|
38.12
|
%
|
29.88
|
%
|
||||||||||
|
^
|
Based on average shares outstanding.
|
|
#
|
Includes expenses of Class A Shares which converted to Investor Class Shares on October 30, 2020.
|
The accompanying notes are an integral part of these financial statements.
33
POPLAR FOREST FUNDS
NOTES TO FINANCIAL STATEMENTS at September 30, 2022
NOTE 1 – ORGANIZATION
The Poplar Forest Partners Fund (the “Partners Fund”) and the Poplar Forest Cornerstone Fund (“Cornerstone Fund”), (each, a “Fund” and collectively, the “Funds”) are diversified series of Advisors
Series Trust (the “Trust”), which is registered under the Investment Company Act of 1940, as amended, (the “1940 Act”) as an open-end management investment company. Each Fund is an investment company and accordingly follows the investment company
accounting and reporting guidance of the Financial Accounting Standards Board (FASB) Accounting Standard Codification Topic 946 “Financial Services – Investment Companies.”
The investment objective of the Partners Fund is to seek long-term growth of capital. The investment objective of the Cornerstone Fund is to seek to achieve current income and long-term growth of
capital. The Partners Fund currently offers Class A shares and Institutional Class shares. The Cornerstone Fund currently offers Investor Class shares. Class A shares are subject to a maximum front-end sales load of 5.00%, which decreases
depending on the amount invested. The Partner Fund’s Class A shares and Institutional Class shares commenced operations on December 31, 2009.
The Cornerstone Fund’s Class A shares and Institutional Class shares commenced operations on December 31, 2014. At the close of business on October 30, 2020, the Cornerstone Fund’s Class A shares
converted to the Institutional Class shares. On January 28, 2021, the class name changed from Institutional Class to Investor Class.
NOTE 2 – SIGNIFICANT ACCOUNTING POLICIES
The following is a summary of significant accounting policies consistently followed by the Funds. These policies are in conformity with accounting principles generally accepted in the United States of
America.
|
A.
|
Security Valuation: All investments in securities are recorded at their estimated fair value, as described in note 3.
|
|
|
B.
|
Federal Income Taxes: It is the Funds’ policy to comply with the requirements of Subchapter M of the Internal Revenue Code applicable to regulated
investment companies and to distribute substantially all of its taxable income to its shareholders. Therefore, no Federal income or excise tax provision is required.
|
|
|
The Funds recognize the tax benefits of uncertain tax positions only where the position is “more likely than not” to be sustained assuming examination by tax authorities. The tax returns of the
Funds’ prior three fiscal years are open for examination. Management has reviewed all open tax years in major jurisdictions and concluded that there is no impact on the Funds’ net assets and no tax liability resulting from unrecognized tax
events relating to uncertain income tax positions taken or expected to be taken on a tax return. The Funds identify their major tax jurisdictions as U.S. Federal and the state of Wisconsin. The Funds are not aware of any tax positions for
which it is reasonably possible that the total amounts of unrecognized tax benefits will change materially in the next twelve months.
|
34
POPLAR FOREST FUNDS
NOTES TO FINANCIAL STATEMENTS at September 30, 2022, Continued
|
C.
|
Security Transactions, Income and Distributions: Security transactions are accounted for on the trade date. Realized gains and losses on securities sold
are calculated on the basis of specific cost. Interest income is recorded on an accrual basis. Discounts on securities purchased are accreted over the life of the respective security. Premiums on securities purchased are amortized to the
earliest call date. Dividend income, income and capital gain distributions from underlying funds, and distributions to shareholders are recorded on the ex-dividend date. Withholding taxes on foreign dividends have been provided for in
accordance with the Funds’ understanding of the applicable country’s tax rules and rates.
|
|
|
Investment income, expenses (other than those specific to the class of shares), and realized and unrealized gains and losses on investments are allocated to the separate classes of each Fund
based upon their relative net assets on the date income is earned or expensed and realized and unrealized gains and losses are incurred.
|
||
|
Each Fund is charged for those expenses that are directly attributable to the Fund, such as investment advisory, custody and transfer agent fees. Expenses that are not attributable to a Fund
are typically allocated among the Funds in proportion to their respective net assets. Common expenses of the Trust are typically allocated among the funds in the Trust based on a fund’s respective net assets, or by other equitable means.
|
||
|
The Funds distribute substantially all net investment income, if any, and net realized gains, if any, annually. Distributions from net realized gains for book purposes may include short-term
capital gains. All short-term capital gains are included in ordinary income for tax purposes.
|
||
|
The amount of dividends and distributions to shareholders from net investment income and net realized capital gains is determined in accordance with Federal income tax regulations which differ
from accounting principles generally accepted in the United States of America. To the extent these book/tax differences are permanent, such amounts are reclassified within the capital accounts based on their Federal tax treatment.
|
||
|
D.
|
Reclassification of Capital Accounts: Accounting principles generally accepted in the United States of America require that certain components of net
assets relating to permanent differences be reclassified between financial and tax reporting. These reclassifications have no effect on net assets or net asset value per share.
|
|
|
For the year ended September 30, 2022, the Funds made the following permanent tax adjustments on the statements of assets and liabilities:
|
|
Total
|
|||||||||
|
Distributable
|
|||||||||
|
Earnings
|
Paid-in Capital
|
||||||||
|
Partners Fund
|
$
|
(3,321,536
|
)
|
$
|
3,321,536
|
||||
|
Cornerstone Fund
|
$
|
(70,285
|
)
|
$
|
70,285
|
||||
35
POPLAR FOREST FUNDS
NOTES TO FINANCIAL STATEMENTS at September 30, 2022, Continued
|
E.
|
Use of Estimates: The preparation of financial statements in conformity with accounting principles generally accepted in the United States of America
requires management to make estimates and assumptions that affect the reported amounts of assets and liabilities at the date of the financial statements and the reported amounts of increases and decreases in net assets during the reporting
period. Actual results could differ from those estimates.
|
|
|
F.
|
Events Subsequent to the Fiscal Year End: In preparing the financial statements as of September 30, 2022, management considered the impact of subsequent
events for potential recognition or disclosure in the financial statements. Management has determined there were no subsequent events that would need to be disclosed in the Funds’ financial statements.
|
NOTE 3 – SECURITIES VALUATION
The Funds have adopted authoritative fair value accounting standards which establish an authoritative definition of fair value and set out a hierarchy for measuring fair value. These standards require
additional disclosures about the various inputs and valuation techniques used to develop the measurements of fair value, a discussion in changes in valuation techniques and related inputs during the period and expanded disclosure of valuation levels
for major security types. These inputs are summarized in the three broad levels listed below:
|
Level 1 –
|
Unadjusted quoted prices in active markets for identical assets or liabilities that the Funds have the ability to access.
|
|
|
Level 2 –
|
Observable inputs other than quoted prices included in level 1 that are observable for the asset or liability, either directly or indirectly. These inputs may include quoted prices for the
identical instrument on an inactive market, prices for similar instruments, interest rates, prepayment speeds, credit risk, yield curves, default rates and similar data.
|
|
|
Level 3 –
|
Unobservable inputs for the asset or liability, to the extent relevant observable inputs are not available, representing each Fund’s own assumptions about the assumptions a market participant
would use in valuing the asset or liability, and would be based on the best information available.
|
Following is a description of the valuation techniques applied to the Funds’ major categories of assets and liabilities measured at fair value on a recurring basis.
Each Fund determines the fair value of its investments and computes its net asset value per share as of the close of regular trading on the New York Stock Exchange (4:00 pm EST).
Equity Securities: The Funds’ investments are carried at fair value. Equity securities that are primarily traded on a national securities exchange shall be
valued at the last sale price on the exchange on which they are primarily traded on the day of valuation or, if there has been no sale on such day, at the mean between the bid and asked
36
POPLAR FOREST FUNDS
NOTES TO FINANCIAL STATEMENTS at September 30, 2022, Continued
prices. Securities primarily traded in the NASDAQ Global Market System for which market quotations are readily available shall be valued using the NASDAQ Official Closing Price (“NOCP”). If the NOCP is
not available, such securities shall be valued at the last sale price on the day of valuation, or if there has been no sale on such day, at the mean between the bid and asked prices. Over-the-counter (“OTC”) securities which are not traded in the
NASDAQ Global Market System shall be valued at the most recent sales price. To the extent these securities are actively traded and valuation adjustments are not applied, they are categorized in level 1 of the fair value hierarchy.
Investment Companies: Investments in open-end mutual funds, including money market funds, are generally priced at their net asset value per share provided by
the service agent of the funds and will be classified in level 1 of the fair value hierarchy.
Debt Securities: Debt securities are valued at the mean of the bid and asked prices furnished by an independent pricing service using valuation methods that are
designed to represent fair value. These valuation methods can include matrix pricing and other analytical pricing models, market transactions, and dealer-supplied valuations. The pricing service may consider recently executed transactions in
securities of the issuer or comparable issuers, market price quotations (where observable), bond spreads, and fundamental data relating to the issuer. Most debt securities are categorized in level 2 of the fair value hierarchy.
Short-Term Securities: Short-term debt securities, including those securities having a maturity of 60 days or less, are valued at the evaluated mean between the
bid and asked prices. To the extent the inputs are observable and timely, these securities would be classified in level 2 of the fair value hierarchy.
Prior to the effectiveness of Rule 2a-5 on September 8, 2022, the Board of Trustees had delegated day-to-day valuation issues to a Valuation Committee of the Trust which was comprised of representatives
from the Funds’ administrator, U.S. Bancorp Fund Services, LLC, doing business as U.S. Bank Global Fund Services (“Fund Services”). The function of the Valuation Committee was to value securities where current and reliable market quotations were not
readily available or the closing price did not represent fair value by following procedures approved by the Board of Trustees. These procedures considered many factors, including the type of security, size of holding, trading volume and news
events. All actions taken by the Valuation Committee were subsequently reviewed and ratified by the Board of Trustees. The Valuation Committee served until September 7, 2022. Effective September 8, 2022, the Board of Trustees approved Poplar
Forest Capital, LLC (the “Adviser”), as the Funds’ valuation designee under Rule 2a-5.
Depending on the relative significance of the valuation inputs, fair valued securities may be classified in either level 2 or level 3 of the fair value hierarchy.
37
POPLAR FOREST FUNDS
NOTES TO FINANCIAL STATEMENTS at September 30, 2022, Continued
The inputs or methodology used for valuing securities are not an indication of the risk associated with investing in those securities. The following is a summary of the inputs used to value the Funds’
securities as of September 30, 2022:
|
Partners Fund
|
||||||||||||||||
|
Level 1
|
Level 2
|
Level 3
|
Total
|
|||||||||||||
|
Common Stocks
|
||||||||||||||||
|
Communication Services
|
$
|
14,567,920
|
$
|
—
|
$
|
—
|
$
|
14,567,920
|
||||||||
|
Consumer Discretionary
|
42,500,640
|
—
|
—
|
42,500,640
|
||||||||||||
|
Consumer Staples
|
17,484,910
|
—
|
—
|
17,484,910
|
||||||||||||
|
Energy
|
24,229,550
|
—
|
—
|
24,229,550
|
||||||||||||
|
Financials
|
68,934,590
|
—
|
—
|
68,934,590
|
||||||||||||
|
Health Care
|
62,401,085
|
—
|
—
|
62,401,085
|
||||||||||||
|
Industrials
|
23,585,249
|
—
|
—
|
23,585,249
|
||||||||||||
|
Information Technology
|
18,438,768
|
—
|
—
|
18,438,768
|
||||||||||||
|
Utilities
|
13,048,600
|
—
|
—
|
13,048,600
|
||||||||||||
|
Total Common Stocks
|
285,191,312
|
—
|
—
|
285,191,312
|
||||||||||||
|
Money Market Fund
|
14,644,960
|
—
|
—
|
14,644,960
|
||||||||||||
|
Total Investments
|
||||||||||||||||
|
in Securities
|
$
|
299,836,272
|
$
|
—
|
$
|
—
|
$
|
299,836,272
|
||||||||
|
Cornerstone Fund
|
||||||||||||||||
|
Level 1
|
Level 2
|
Level 3
|
Total
|
|||||||||||||
|
Common Stocks
|
||||||||||||||||
|
Communication Services
|
$
|
952,494
|
$
|
—
|
$
|
—
|
$
|
952,494
|
||||||||
|
Consumer Discretionary
|
2,950,625
|
—
|
—
|
2,950,625
|
||||||||||||
|
Consumer Staples
|
1,375,127
|
—
|
—
|
1,375,127
|
||||||||||||
|
Energy
|
1,325,595
|
—
|
—
|
1,325,595
|
||||||||||||
|
Financials
|
3,963,373
|
—
|
—
|
3,963,373
|
||||||||||||
|
Health Care
|
3,837,200
|
—
|
—
|
3,837,200
|
||||||||||||
|
Industrials
|
1,949,066
|
—
|
—
|
1,949,066
|
||||||||||||
|
Information Technology
|
1,432,608
|
—
|
—
|
1,432,608
|
||||||||||||
|
Utilities
|
658,585
|
—
|
—
|
658,585
|
||||||||||||
|
Total Common Stocks
|
18,444,673
|
—
|
—
|
18,444,673
|
||||||||||||
|
Fixed Income
|
||||||||||||||||
|
Corporate Bonds
|
—
|
3,605,959
|
—
|
3,605,959
|
||||||||||||
|
U.S. Treasury Notes
|
—
|
3,458,722
|
—
|
3,458,722
|
||||||||||||
|
U.S. Government Agency
|
—
|
800,918
|
—
|
800,918
|
||||||||||||
|
Total Fixed Income
|
—
|
7,865,599
|
—
|
7,865,599
|
||||||||||||
|
Preferred Stock
|
—
|
548,121
|
—
|
548,121
|
||||||||||||
|
Money Market Fund
|
1,745,760
|
—
|
—
|
1,745,760
|
||||||||||||
|
U.S. Treasury Bills
|
—
|
952,887
|
—
|
952,887
|
||||||||||||
|
Total Investments
|
||||||||||||||||
|
in Securities
|
$
|
20,190,433
|
$
|
9,366,607
|
$
|
—
|
$
|
29,557,040
|
||||||||
38
POPLAR FOREST FUNDS
NOTES TO FINANCIAL STATEMENTS at September 30, 2022, Continued
Refer to the Funds’ schedules of investments for a detailed break-out of securities by industry classification.
In October 2020, the Securities and Exchange Commission (the “SEC”) adopted new regulations governing the use of derivatives by registered investment companies (“Rule 18f-4”). Funds were required to
implement and comply with Rule 18f-4 by August 19, 2022. Rule 18f-4 imposes limits on the amount of derivatives a fund can enter into, eliminates the asset segregation framework currently used by funds to comply with Section 18 of the 1940 Act,
treats derivatives as senior securities and requires funds whose use of derivatives is more than a limited specified exposure amount to establish and maintain a comprehensive derivatives risk management program and appoint a derivatives risk
manager. The Funds most recently filed statement of additional information allows the Funds to enter into derivative transactions. The Funds are considered limited derivative users under Rule 18f-4. During the year ended September 30, 2022, the
Funds did not enter into derivatives transactions. The Funds are in compliance with Rule 18f-4 as of September 30, 2022.
In December 2020, the SEC adopted a new rule providing a framework for fund valuation practices (“Rule 2a-5”). Rule 2a-5 establishes requirements for determining fair value in good faith for purposes
of the 1940 Act. Rule 2a-5 permits fund boards to designate certain parties to perform fair value determinations, subject to board oversight and certain other conditions. Rule 2a-5 also defines when market quotations are “readily available” for
purposes of the 1940 Act and the threshold for determining whether a fund must fair value a security. In connection with Rule 2a-5, the SEC also adopted related recordkeeping requirements and rescinded previously issued guidance, including with
respect to the role of a board in determining fair value and the accounting and auditing of fund investments. The Funds are in compliance with Rule 2a-5, which had a compliance date of September 8, 2022.
The global outbreak of COVID-19 (commonly referred to as “coronavirus”) has disrupted economic markets and the prolonged economic impact is uncertain. Although vaccines for COVID-19 are becoming more
widely available, the ultimate economic fallout from the pandemic, amid the spread of COVID-19 variants, and the long-term impact on economies, markets, industries and individual companies are not known. The operational and financial performance of
individual companies and the market in general depends on future developments, including the duration and spread of any future outbreaks and the pace of recovery which may vary from market to market, and such uncertainty may in turn adversely affect
the value and liquidity of the Funds’ investments, impair the Funds’ ability to satisfy redemption requests, and negatively impact the Funds’ performance.
NOTE 4 – INVESTMENT ADVISORY FEE AND OTHER TRANSACTIONS WITH AFFILIATES
The Adviser provides the Funds with investment management services under an investment advisory agreement. The Adviser furnishes all investment advice, office space, facilities, and provides most of the
personnel needed by the Funds. As compensation for its services, each Fund pays the Adviser a monthly management fee. For the Partners Fund, the fees are calculated at an annual rate of 0.85% of average
39
POPLAR FOREST FUNDS
NOTES TO FINANCIAL STATEMENTS at September 30, 2022, Continued
daily net assets for the first $250 million of assets, 0.775% of the Fund’s average daily net assets for the next $750 million of assets, and 0.70% of the Fund’s average daily net assets in excess of $1
billion. For the Cornerstone Fund, the fees are calculated at an annual rate of 0.80% of average daily net assets for the first $250 million of assets, 0.70% of the Fund’s average daily net assets for the next $750 million of assets, and 0.60% of the
Fund’s average daily net assets in excess of $1 billion. For the year ended September 30, 2022, the advisory fees incurred by the Funds are disclosed in the statement of operations. Any amount due from the Adviser is paid monthly to the Funds.
The Funds are responsible for their own operating expenses. The Adviser has contractually agreed to reduce fees payable to it by the Funds and to pay Fund operating expenses (excluding acquired fund
fees and expenses, interest, taxes, extraordinary expenses, Rule 12b-1 fees, shareholder servicing fees, and other class-specific expenses) to the extent necessary to limit each Fund’s aggregate annual operating expenses as a percent of average daily
net assets as follows:
|
Partners Fund
|
0.95%
|
||
|
Cornerstone Fund
|
0.90%
|
Any such reduction made by the Adviser in its fees or payment of expenses which are a Fund’s obligation are subject to reimbursement by the Fund to the Adviser, if so requested by the Adviser, in any
subsequent month in the 36-month period from the date of the management fee reduction and expense payment if the aggregate amount actually paid by the Fund toward the operating expenses for such fiscal year (taking into account the reimbursement)
will not cause the Fund to exceed the lesser of (1) the expense limitation in place at the time of the management fee reduction and expense payment; or (2) the expense limitation in place at the time of the reimbursement. Any such reimbursement is
also contingent upon Board of Trustees review and approval. Such reimbursement may not be paid prior to the Funds’ payment of current ordinary operating expenses. For the year ended September 30, 2022, the Adviser reduced its fees in the amount of
$295,589 and $168,783 in the Partners Fund and the Cornerstone Fund, respectively. No amounts were recouped by the Adviser. The expense limitation will remain in effect through at least January 27, 2023, and may be terminated only by the Trust’s
Board of Trustees. The Adviser may recapture portions of the amounts shown below no later than the corresponding dates:
|
9/30/2023
|
9/30/2024
|
9/30/2025
|
Total
|
||||||||||||||
|
Partners Fund
|
$
|
541,745
|
$
|
364,246
|
$
|
295,589
|
$
|
1,201,580
|
|||||||||
|
Cornerstone Fund
|
212,025
|
172,025
|
168,783
|
552,833
|
|||||||||||||
Fund Services serves as the Funds’ administrator, fund accountant and transfer agent. U.S. Bank N.A. serves as custodian (the “Custodian”) to the Funds. The Custodian is an affiliate of Fund Services.
Fund Services maintains the Funds’ books and records, calculates the Funds’ NAV, prepares various federal and state regulatory filings, coordinates the payment of fund expenses, reviews expense accruals and prepares materials supplied to the Board of
Trustees. The officers of the Trust, including the Chief Compliance Officer, are employees of Fund Services. Fees paid by the Fund for administration and accounting, transfer agency, custody and compliance services for the year ended September 30,
2022, are disclosed in the statement of operations.
40
POPLAR FOREST FUNDS
NOTES TO FINANCIAL STATEMENTS at September 30, 2022, Continued
Quasar Distributors, LLC (“Quasar” or the “Distributor”) acts as the Funds’ principal underwriter in a continuous public offering of the Funds’ shares. Quasar is a wholly-owned broker-dealer subsidiary
of Foreside Financial Group, LLC.
The Funds have entered into agreements with various brokers, dealers, and financial intermediaries in connection with the sale of shares of the Funds. The agreements provide for periodic payments by the
Funds to the brokers, dealers, and financial intermediaries for providing certain shareholder maintenance services (sub-transfer agent fees). These shareholder services include the pre-processing and quality control of new accounts, shareholder
correspondence, answering customer inquiries regarding account status, and facilitating shareholder telephone transactions. The sub-transfer agent fees expensed by the Funds during the year ended September 30, 2022 are included in the statement of
operations.
NOTE 5 – DISTRIBUTION AGREEMENT AND PLAN
The Funds have adopted a Distribution Plan pursuant to Rule 12b-1 (the “Plan”). The Plan permits the Partners Fund to pay the Distributor for distribution and related expenses at an annual rate of up
to 0.25% of the average daily net assets of the Fund’s Class A shares. The expenses covered by the Plan may include the cost in connection with the promotion and distribution of shares and the provision of personal services to shareholders,
including, but not necessarily limited to, advertising, compensation to underwriters, dealers and selling personnel, the printing and mailing of prospectuses to other than current Fund shareholders, and the printing and mailing of sales literature.
Payments made pursuant to the Plan will represent compensation for distribution and service activities, not reimbursements for specific expenses incurred. The 12b-1 fees accrued by the Fund’s Class A shares for the year ended September 30, 2022 are
disclosed in the statement of operations.
NOTE 6 – PURCHASES AND SALES OF SECURITIES
For the year ended September 30, 2022, the cost of purchases and the proceeds from sales of securities, excluding short-term securities, were as follows.
|
Purchases
|
Sales
|
||||||||||||||||
|
Non-
|
Non-
|
||||||||||||||||
|
Government
|
Government
|
Government
|
Government
|
||||||||||||||
|
Partners Fund
|
$
|
—
|
$
|
97,997,588
|
$
|
—
|
$
|
97,567,639
|
|||||||||
|
Cornerstone Fund
|
2,027,350
|
8,515,360
|
808,335
|
7,656,327
|
|||||||||||||
NOTE 7 – LINE OF CREDIT
The Partners Fund and the Cornerstone Fund have secured lines of credit in the amount of $55,000,000 and $4,000,000, respectively. These lines of credit are intended to provide short-term financing, if
necessary, subject to certain restrictions, in connection with shareholder redemptions. The credit facility is with the Funds’ custodian, U.S. Bank N.A. During the year ended September 30, 2022, the Funds did not draw upon their lines of credit.
At September 30, 2022, the Funds had no outstanding loan amounts.
41
POPLAR FOREST FUNDS
NOTES TO FINANCIAL STATEMENTS at September 30, 2022, Continued
NOTE 8 – INCOME TAXES AND DISTRIBUTIONS TO SHAREHOLDERS
The tax character of distributions paid by the Funds during the years ended September 30, 2022 and September 30, 2021 was as follows:
|
Year Ended
|
Year Ended
|
||||||||
|
September 30, 2022
|
September 30, 2021
|
||||||||
|
Partners Fund
|
|||||||||
|
Ordinary income
|
$
|
9,720,898
|
$
|
5,892,082
|
|||||
|
Long-term capital gains
|
32,299,743
|
—
|
|||||||
|
Year Ended
|
Year Ended
|
||||||||
|
September 30, 2022
|
September 30, 2021
|
||||||||
|
Cornerstone Fund
|
|||||||||
|
Ordinary income
|
$
|
837,215
|
$
|
472,669
|
|||||
|
Long-term capital gains
|
2,726,573
|
—
|
|||||||
As of September 30, 2022, the components of capital on a tax basis were as follows:
|
Partners Fund
|
Cornerstone Fund
|
||||||||
|
Cost of investments (a)
|
$
|
260,216,888
|
$
|
28,116,424
|
|||||
|
Gross unrealized appreciation
|
63,808,032
|
4,285,618
|
|||||||
|
Gross unrealized depreciation
|
(24,188,648
|
)
|
(2,845,002
|
)
|
|||||
|
Net unrealized appreciation (a)
|
39,619,384
|
1,440,616
|
|||||||
|
Undistributed ordinary income
|
3,964,220
|
436,232
|
|||||||
|
Undistributed long-term capital gains
|
16,205,375
|
1,960,301
|
|||||||
|
Total distributable earnings
|
20,169,595
|
2,396,533
|
|||||||
|
Other accumulated gains/(losses)
|
—
|
—
|
|||||||
|
Total accumulated earnings/(losses)
|
$
|
59,788,979
|
$
|
3,837,149
|
|||||
|
(a)
|
The difference between book-basis and tax-basis cost and net unrealized appreciation is attributable primarily to the tax deferral of losses on wash sale adjustments and tax adjustments related
to a transfer in-kind.
|
NOTE 9 – PRINCIPAL RISKS
Below is a summary of some, but not all, of the principal risks of investing in the Funds, each of which may adversely affect a Fund’s net asset value and total return. The Funds’ most recent prospectus
provides further descriptions of each Fund’s investment objective, principal investment strategies and principal risks.
General Market Risk – Economies and financial markets throughout the world are becoming increasingly interconnected, which increases the likelihood that events
or conditions in one country or region will adversely impact markets or issuers in other countries or regions. Securities in a Fund’s portfolio may underperform in comparison to securities in general financial markets, a particular financial market
or other asset classes due to a number of factors, including inflation (or expectations for inflation), deflation (or expectations for deflation), interest rates, global demand for particular products or resources, market instability, debt crises and
downgrades, embargoes,
42
POPLAR FOREST FUNDS
NOTES TO FINANCIAL STATEMENTS at September 30, 2022, Continued
tariffs, sanctions and other trade barriers, regulatory events, other governmental trade or market control programs and related geopolitical events. In addition, the value of a Fund’s investments may be
negatively affected by the occurrence of global events such as war, terrorism, environmental disasters, natural disasters or events, country instability, and infectious disease epidemics or pandemics. For example, the outbreak of COVID-19, a novel
coronavirus disease, has negatively affected economies, markets and individual companies throughout the world, including those in which the Fund invests. The effects of this pandemic to public health and business and market conditions, including
exchange trading suspensions and closures, may continue to have a significant negative impact on the performance of a Fund’s investments, increase the Fund’s volatility, negatively impact the Fund’s arbitrage and pricing mechanisms, exacerbate
pre-existing political, social and economic risks to the Fund, and negatively impact broad segments of businesses and populations. The Funds’ operations may be interrupted as a result, which may contribute to the negative impact on investment
performance. In addition, governments, their regulatory agencies, or self-regulatory organizations may take actions in response to the pandemic that affect the instruments in which a Fund invests, or the issuers of such instruments, in ways that
could have a significant negative impact on the Fund’s investment performance. The full impact of the COVID-19 pandemic, or other future epidemics or pandemics, is currently unknown.
Value-Style Investing Risk (Both Funds) – Value stocks can perform differently from the market as a whole and from other types of stocks. Value stocks may be
purchased based upon the belief that a given security may be out of favor; that belief may be misplaced or the security may stay out of favor for an extended period of time.
Debt Securities Risk (Both Funds) – The following risks are associated with the Funds’ investment in debt securities.
|
o
|
Prepayment and Extension Risk. The risk that the securities may be paid off earlier or later than expected. Either situation could cause securities to
pay lower-than-market rates of interest, which could hurt the Fund’s yield or share price.
|
|
|
o
|
Interest Rate Risk. The Funds’ investments in fixed income securities will change in value based on changes in interest rates. If rates increase, the
value of these investments generally declines. Securities with greater interest rate sensitivity and longer maturities generally are subject to greater fluctuations in value.
|
|
|
o
|
Credit Risk. The risk of loss on an investment due to the deterioration of an issuer’s financial strength. Such a deterioration of financial strength
may result in a reduction of the credit rating of the issuer’s securities and may lead to the issuer’s inability to honor its contractual obligations, including making timely payment of interest and principal.
|
|
|
o
|
High-Yield Securities Risk. Debt securities that are rated below investment grade (i.e., “junk bonds”) are subject to additional risk factors due to the
speculative nature of these securities, such as increased possibility of default liquidation of the security, and changes in value based on public perception of the issuer.
|
43
POPLAR FOREST FUNDS
NOTES TO FINANCIAL STATEMENTS at September 30, 2022, Continued
Large-Sized Companies Risk (Partners Fund) – Larger, more established companies may be unable to respond quickly to new competitive challenges like changes in
consumer tastes or innovative smaller competitors. In addition, large-cap companies are sometimes unable to attain the high growth rates of successful, smaller companies, especially during extended periods of economic expansion.
Medium-Sized Companies Risk (Both Funds) – Investing in securities of medium-sized companies may involve greater risk than investing in larger, more established
companies because they can be subject to greater share price volatility than larger, more established companies.
NOTE 10 – CONTROL OWNERSHIP
The beneficial ownership, either directly or indirectly of more than 25% of the voting securities of a Fund creates a presumption of control of the Fund, under Section 2(a)(9) of the 1940 Act. The
following table reflects shareholders that maintain accounts of more than 25% of the voting securities of a Fund as of September 30, 2022:
|
Fund
|
Shareholder
|
Percent of Shares Held
|
|
|
Cornerstone Fund
|
Charles Schwab & Co.
|
38.19%
|
NOTE 11 – TRUSTEES AND OFFICERS
Mr. Joe Redwine became the Audit Chairman of the Board effective January 1, 2022. Ms. Michelle Sanville-Seebold resigned as Deputy Chief Compliance Officer effective May 27, 2022.
44
POPLAR FOREST FUNDS
REPORT OF INDEPENDENT REGISTERED PUBLIC ACCOUNTING FIRM
To the Shareholders of
Poplar Forest Partners Fund
Poplar Forest Cornerstone Fund
and Board of Directors
of Advisors Series Trust
Opinion on the Financial Statements
We have audited the accompanying statements of assets and liabilities of the Poplar Forest Partners Fund and the Poplar Forest Cornerstone Fund (the “Funds”), each a series of Advisors Series Trust (the
“Trust”), including the schedules of investments, as of September 30, 2022, the related statement of operations for the year then ended, the statements of changes in net assets for each of the two years in the period then ended, and the financial
highlights for each of the five years in the period then ended, and the related notes (collectively referred to as the “financial statements”). In our opinion, the financial statements present fairly, in all material respects, the financial position
of the Funds as of September 30, 2022, the results of their operations for the year then ended, the changes in their net assets for each of the two years in the period then ended, and their financial highlights for each of the five years in the
period then ended, in conformity with accounting principles generally accepted in the United States of America.
Basis for Opinion
These financial statements are the responsibility of the Funds’ management. Our responsibility is to express an opinion on the Funds’ financial statements based on our audits. We are a public accounting
firm registered with the Public Company Accounting Oversight Board (United States) (“PCAOB”) and are required to be independent with respect to the Funds in accordance with the U.S. federal securities laws and the applicable rules and regulations of
the Securities and Exchange Commission and the PCAOB. We have served as the auditor of one or more of the funds in the Trust since 2003.
We conducted our audits in accordance with the standards of the PCAOB. Those standards require that we plan and perform the audits to obtain reasonable assurance about whether the financial statements
are free of material misstatement, whether due to error or fraud. The Funds are not required to have, nor were we engaged to perform, an audit of the Funds’ internal control over financial reporting. As part of our audits we are required to obtain an
understanding of internal control over financial reporting, but not for the purpose of expressing an opinion on the effectiveness of the Funds’ internal control over financial reporting. Accordingly, we express no such opinion.
Our audits included performing procedures to assess the risks of material misstatement of the financial statements, whether due to error or fraud, and performing procedures that respond to those risks.
Such procedures included examining, on a test basis, evidence regarding the amounts and disclosures in the financial statements. Our audits also included evaluating the accounting principles used and significant estimates made by management, as well
as evaluating the overall presentation of the financial
45
POPLAR FOREST FUNDS
REPORT OF INDEPENDENT REGISTERED PUBLIC ACCOUNTING FIRM, Continued
statements. Our procedures included confirmation of securities owned as of September 30, 2022 by correspondence with the custodian and brokers; when replies were not received from brokers, we performed
other auditing procedures. We believe that our audits provide a reasonable basis for our opinion.
TAIT, WELLER & BAKER LLP
Philadelphia, Pennsylvania
November 29, 2022
46
POPLAR FOREST FUNDS
NOTICE TO SHAREHOLDERS at September 30, 2022 (Unaudited)
For the year ended September 30, 2022, the Partners Fund and the Cornerstone Fund designated $9,720,898 and $837,215, respectively, as ordinary income for purposes of the dividends paid deduction. For
the year ended September 30, 2022, the Partners Fund and the Cornerstone Fund designated $32,299,743 and $2,726,573, respectively, as long-term capital gains for purposes of the dividends paid deduction.
Certain dividends paid by the Partners Fund and the Cornerstone Fund may be subject to a maximum tax rate of 15%, as provided by the Jobs and Growth Tax Relief Reconciliation Act of 2003. For the
Partners Fund and the Cornerstone Fund, the percentage of dividends declared from net investment income designated as qualified dividend income for the year ended September 30, 2022 was 88.89% and 77.80%, respectively.
For corporate shareholders in the Partners Fund and Cornerstone Fund, the percent of ordinary income distributions qualifying for the corporate dividends received deduction for the year ended September
30, 2022 was 87.82% and 76.36%, respectively.
The percentage of taxable ordinary income distributions that are designated as short-term capital gain distributions under Internal Revenue Section 871 (k)(2)(C) for the Partners Fund and Cornerstone
Fund was 38.45% and 21.16%, respectively.
How to Obtain a Copy of the Funds’ Proxy Voting Policies
A description of the policies and procedures that the Funds use to determine how to vote proxies relating to portfolio securities is available without charge, upon request, by calling 1-877-522-8860 or
on the U.S. Securities and Exchange Commission’s (“SEC”) website at http://www.sec.gov.
How to Obtain a Copy of the Funds’ Proxy Voting Records for the 12-Month Period Ended June 30
Information regarding how the Funds voted proxies relating to portfolio securities during the most recent 12-month period ended June 30 is available without charge, upon request, by calling
1-877-522-8860. Furthermore, you can obtain the Funds’ proxy voting records on the SEC’s website at http://www.sec.gov.
Quarterly Filings on Form N-PORT
The Funds file their complete schedules of portfolio holdings with the SEC for the first and third quarters of each fiscal year on Part F of Form N-PORT. The Funds’ Form N-PORT is available on the
SEC’s website at http://www.sec.gov. Information included in the Funds’ Form N-PORT is also available, upon request, by calling 1-877-522-8860.
47
POPLAR FOREST FUNDS
INFORMATION ABOUT TRUSTEES AND OFFICERS (Unaudited)
This chart provides information about the Trustees and Officers who oversee the Funds. Officers elected by the Trustees manage the day-to-day operations of the Funds and execute policies formulated by
the Trustees.
|
Term of
|
Number of
|
Other
|
|||
|
Office and
|
Principal
|
Portfolios in
|
Directorships
|
||
|
Position
|
Length
|
Occupation
|
Fund Complex
|
Held
|
|
|
Name, Address
|
Held with
|
of Time
|
During Past
|
Overseen by
|
During Past
|
|
and Age
|
the Trust
|
Served*
|
Five Years
|
Trustee(2)
|
Five Years(3)
|
|
Independent Trustees(1)
|
|||||
|
David G. Mertens
|
Trustee
|
Indefinite
|
Partner and Head of
|
2
|
Trustee,
|
|
(age 62)
|
term;
|
Business Development
|
Advisors
|
||
|
615 E. Michigan Street
|
since
|
Ballast Equity
|
Series Trust
|
||
|
Milwaukee, WI 53202
|
March
|
Management, LLC
|
(for series not
|
||
|
2017.
|
(a privately-held
|
affiliated with
|
|||
|
investment advisory
|
the Funds).
|
||||
|
firm) (February 2019
|
|||||
|
to present); Managing
|
|||||
|
Director and Vice
|
|||||
|
President, Jensen
|
|||||
|
Investment Management,
|
|||||
|
Inc. (a privately-held
|
|||||
|
investment advisory
|
|||||
|
firm) (2002 to 2017).
|
|||||
|
Joe D. Redwine
|
Trustee
|
Indefinite
|
Retired; formerly
|
2
|
Trustee,
|
|
(age 75)
|
term;
|
Manager, President,
|
Advisors
|
||
|
615 E. Michigan Street
|
since
|
CEO, U.S. Bancorp
|
Series Trust
|
||
|
Milwaukee, WI 53202
|
September
|
Fund Services, LLC
|
(for series not
|
||
|
2008.
|
and its predecessors
|
affiliated with
|
|||
|
(May 1991 to July 2017).
|
the Funds).
|
48
POPLAR FOREST FUNDS
INFORMATION ABOUT TRUSTEES AND OFFICERS (Unaudited), Continued
|
Term of
|
Number of
|
Other
|
|||
|
Office and
|
Principal
|
Portfolios in
|
Directorships
|
||
|
Position
|
Length
|
Occupation
|
Fund Complex
|
Held
|
|
|
Name, Address
|
Held with
|
of Time
|
During Past
|
Overseen by
|
During Past
|
|
and Age
|
the Trust
|
Served*
|
Five Years
|
Trustee(2)
|
Five Years(3)
|
|
Independent Trustees(1)
|
|||||
|
Raymond B. Woolson
|
Chairman
|
Indefinite
|
President, Apogee
|
2
|
Trustee,
|
|
(age 63)
|
of the
|
term;
|
Group, Inc. (financial
|
Advisors
|
|
|
615 E. Michigan Street
|
Board
|
since
|
consulting firm)
|
Series Trust
|
|
|
Milwaukee, WI 53202
|
January
|
(1998 to present).
|
(for series not
|
||
|
2020.
|
affiliated with
|
||||
|
Trustee
|
Indefinite
|
the Funds);
|
|||
|
term;
|
Independent
|
||||
|
since
|
Trustee,
|
||||
|
January
|
DoubleLine
|
||||
|
2016.
|
Funds Trust
|
||||
|
(an open-end
|
|||||
|
investment
|
|||||
|
company with
|
|||||
|
20 portfolios),
|
|||||
|
DoubleLine
|
|||||
|
Opportunistic
|
|||||
|
Credit Fund,
|
|||||
|
DoubleLine
|
|||||
|
Selective
|
|||||
|
Credit Fund
|
|||||
|
and
|
|||||
|
DoubleLine
|
|||||
|
Income
|
|||||
|
Solutions
|
|||||
|
Fund, from
|
|||||
|
2010 to
|
|||||
|
present.
|
|
Term of
|
|||
|
Office and
|
|||
|
Position
|
Length
|
||
|
Name, Address
|
Held with
|
of Time
|
Principal Occupation
|
|
and Age
|
the Trust
|
Served
|
During Past Five Years
|
|
Officers
|
|||
|
Jeffrey T. Rauman
|
President,
|
Indefinite
|
Senior Vice President, Compliance and
|
|
(age 53)
|
Chief
|
term;
|
Administration, U.S. Bank Global Fund Services
|
|
615 E. Michigan Street
|
Executive
|
since
|
(February 1996 to present).
|
|
Milwaukee, WI 53202
|
Officer and
|
December
|
|
|
Principal
|
2018.
|
||
|
Executive
|
|||
|
Officer
|
49
POPLAR FOREST FUNDS
INFORMATION ABOUT TRUSTEES AND OFFICERS (Unaudited), Continued
|
Term of
|
|||
|
Office and
|
|||
|
Position
|
Length
|
||
|
Name, Address
|
Held with
|
of Time
|
Principal Occupation
|
|
and Age
|
the Trust
|
Served
|
During Past Five Years
|
|
Cheryl L. King
|
Vice
|
Indefinite
|
Vice President, Compliance and Administration,
|
|
(age 61)
|
President,
|
term;
|
U.S. Bank Global Fund Services
|
|
615 E. Michigan Street
|
Treasurer
|
since
|
(October 1998 to present).
|
|
Milwaukee, WI 53202
|
and
|
December
|
|
|
Principal
|
2007.
|
||
|
Financial
|
|||
|
Officer
|
|||
|
Kevin J. Hayden
|
Assistant
|
Indefinite
|
Vice President, Compliance and Administration,
|
|
(age 51)
|
Treasurer
|
term;
|
U.S. Bank Global Fund Services
|
|
615 E. Michigan Street
|
since
|
(June 2005 to present).
|
|
|
Milwaukee, WI 53202
|
September
|
||
|
2013.
|
|||
|
Richard R. Conner
|
Assistant
|
Indefinite
|
Assistant Vice President, Compliance and
|
|
(age 40)
|
Treasurer
|
term;
|
Administration, U.S. Bank Global Fund Services
|
|
615 E. Michigan Street
|
since
|
(July 2010 to present).
|
|
|
Milwaukee, WI 53202
|
December
|
||
|
2018.
|
|||
|
Michael L. Ceccato
|
Vice
|
Indefinite
|
Senior Vice President, U.S. Bank Global Fund
|
|
(age 65)
|
President,
|
term;
|
Services and Vice President, U.S. Bank N.A.
|
|
615 E. Michigan Street
|
Chief
|
since
|
(February 2008 to present).
|
|
Milwaukee, WI 53202
|
Compliance
|
September
|
|
|
Officer and
|
2009.
|
||
|
AML Officer
|
|||
|
Elaine E. Richards
|
Vice
|
Indefinite
|
Senior Vice President, U.S. Bank Global Fund
|
|
(age 54)
|
President
|
term;
|
Services (July 2007 to present).
|
|
2020 East Financial
|
and
|
since
|
|
|
Way, Suite 100
|
Secretary
|
September
|
|
|
Glendora, CA 91741
|
2019.
|
50
POPLAR FOREST FUNDS
INFORMATION ABOUT TRUSTEES AND OFFICERS (Unaudited), Continued
|
|
Term of |
||
|
|
Office and | ||
|
|
Position
|
Length | |
|
Name, Address
|
Held with
|
of Time
|
Principal Occupation
|
|
and Age
|
the Trust
|
Served
|
During Past Five Years
|
|
Ryan Charles
|
Assistant
|
Indefinite
|
Assistant Vice President, U.S. Bank Global
|
|
(age 44)
|
Secretary
|
term;
|
Fund Services (May 2021 to present); Chief
|
|
2020 East Financial
|
since
|
Legal Officer and Secretary Davis Selected
|
|
|
Way, Suite 100
|
January
|
Advisers, L.P. (2004 to 2021).
|
|
|
Glendora, CA 91741
|
2022.
|
|
*
|
The Trustees have designated a mandatory retirement age of 75, such that each Trustee, serving as such on the date he or she reaches the age of 75, shall submit his or her resignation not later
than the last day of the calendar year in which his or her 75th birthday occurs (“Retiring Trustee”). Upon request, the Board may, by vote of a majority of Trustees eligible to vote on such matter, determine whether or not to extend such
Retiring Trustee’s term and on the length of a one-time extension of up to three additional years.
|
|
(1)
|
The Trustees of the Trust who are not “interested persons” of the Trust as defined under the 1940 Act (“Independent Trustees”).
|
|
(2)
|
As of September 30, 2022, the Trust was comprised of 34 active portfolios managed by unaffiliated investment advisers. The term “Fund Complex” applies only to the Funds. The Funds do not hold
themselves out as related to any other series within the Trust for investment purposes, nor does it share the same investment adviser with any other series.
|
|
(3)
|
“Other Directorships Held” includes only directorships of companies required to register or file reports with the SEC under the Securities Exchange Act of 1934, as amended, (that is, “public
companies”) or other investment companies registered under the 1940 Act.
|
The Statement of Additional Information includes additional information about the Funds’ Trustees and Officers and is available, without charge, upon request by calling 1-877-522-8860.
51
POPLAR FOREST FUNDS
HOUSEHOLDING (Unaudited)
In an effort to decrease costs, the Funds will reduce the number of duplicate prospectuses, supplements, and certain other shareholder documents that you receive by sending only one copy of each to
those addresses shown by two or more accounts. Please call the Funds’ transfer agent toll free at 1-877-522-8860 to request individual copies of these documents. The Funds will begin sending individual copies 30 days after receiving your request.
This policy does not apply to account statements.
52
POPLAR FOREST FUNDS
PRIVACY NOTICE
The Funds collect non-public information about you from the following sources:
• Information we receive about you
on applications or other forms;
• Information you give us orally;
and/or
• Information about your
transactions with us or others.
We do not disclose any non-public personal information about our customers or former customers without the customer’s authorization, except as permitted by law or in response to inquiries from
governmental authorities. We may share information with affiliated and unaffiliated third parties with whom we have contracts for servicing the Funds. We will provide unaffiliated third parties with only the information necessary to carry out their
assigned responsibilities. We maintain physical, electronic and procedural safeguards to guard your non-public personal information and require third parties to treat your personal information with the same high degree of confidentiality.
In the event that you hold shares of the Funds through a financial intermediary, including, but not limited to, a broker-dealer, bank, or trust company, the privacy policy of your financial intermediary
would govern how your non-public personal information would be shared by those entities with unaffiliated third parties.
53
Investment Adviser
Poplar Forest Capital, LLC
225 South Lake Avenue, Suite 950
Pasadena, CA 91101
Distributor
Quasar Distributors, LLC
111 East Kilbourn Avenue, Suite 2200
Milwaukee, WI 53202
Transfer Agent, Fund Accountant and Fund Administrator
U.S. Bank Global Fund Services
615 East Michigan Street
Milwaukee, WI 53202
(877) 522-8860
Custodian
U.S. Bank National Association
Custody Operations
1555 North RiverCenter Drive, Suite 302
Milwaukee, WI 53212
Independent Registered Public Accounting Firm
Tait, Weller & Baker LLP
Two Liberty Place
50 South 16th Street, Suite 2900
Philadelphia, PA 19102
Legal Counsel
Sullivan & Worcester LLP
1633 Broadway, 32nd Floor
New York, NY 10019
This report is intended for shareholders of the Funds and may not be used as sales literature unless preceded or accompanied by a current prospectus. For a current prospectus, please call
1-877-522-8860.
(b) Not applicable.
Item 2. Code of Ethics.
The registrant has adopted a code of ethics that applies to the registrant’s principal executive officer and principal financial officer. The registrant has not made any substantive amendments to its code of ethics during the period covered by
this report. The registrant has not granted any waivers from any provisions of the code of ethics during the period covered by this report.
A copy of the registrant’s Code of Ethics is filed herewith.
Item 3. Audit Committee Financial Expert.
The registrant’s Board of Trustees has determined that there is at least one audit committee financial expert serving on its audit committee. Mr. Joe D. Redwine is the “audit committee financial expert” and is considered to be “independent” as
each term is defined in Item 3 of Form N‑CSR.
Item 4. Principal Accountant Fees and Services.
The registrant has engaged its principal accountant to perform audit services, audit-related services, tax services and other services during the past two fiscal years. “Audit services” refer to performing an audit of the registrant's annual
financial statements or services that are normally provided by the accountant in connection with statutory and regulatory filings or engagements for those fiscal years. “Audit-related services” refer to the assurance and related services by the
principal accountant that are reasonably related to the performance of the audit. “Tax services” refer to professional services rendered by the principal accountant including the review of federal income tax returns, review of federal excise tax
returns, review of state tax returns, if any, and assistance with calculation of required income, capital gain and excise distributions. There were no “other services” provided by the principal accountant. The following table details the
aggregate fees billed or expected to be billed for each of the last two fiscal years for audit fees, audit-related fees, tax fees and other fees by the principal accountant.
|
FYE
9/30/2022
|
FYE
9/30/2021
|
|
|
(a) Audit Fees
|
$36,800
|
$36,800
|
|
(b) Audit-Related Fees
|
N/A
|
N/A
|
|
(c) Tax Fees
|
$7,200
|
$7,200
|
|
(d) All Other Fees
|
N/A
|
N/A
|
(e)(1) The audit committee has adopted pre-approval policies and procedures that require the audit committee to pre‑approve all audit and non‑audit services of the registrant, including services provided to any entity affiliated with the
registrant.
(e)(2) The percentage of fees billed by Tait, Weller, & Baker LLP applicable to non-audit services pursuant to waiver of pre-approval requirement were as follows:
|
FYE 9/30/2022
|
FYE 9/30/2021
|
|
|
Audit-Related Fees
|
0%
|
0%
|
|
Tax Fees
|
0%
|
0%
|
|
All Other Fees
|
0%
|
0%
|
(f) All of the principal accountant’s hours spent on auditing the registrant’s financial statements were attributed to work performed by full‑time permanent employees of the principal accountant.
(g) The following table indicates the non-audit fees billed or expected to be billed by the registrant’s accountant for services to the registrant and to the registrant’s investment adviser (and any other
controlling entity, etc.—not sub-adviser) for the last two years.
|
Non-Audit Related Fees
|
FYE 9/30/2022
|
FYE 9/30/2021
|
|
Registrant
|
N/A
|
N/A
|
|
Registrant’s Investment Adviser
|
$6,000
|
$6,000
|
(h) The audit committee of the board of trustees/directors has considered whether the provision of non-audit services that were rendered to the registrant's investment adviser is compatible with maintaining the principal accountant's
independence and has concluded that the provision of such non-audit services by the accountant has not compromised the accountant’s independence.
The registrant has not been identified by the U.S. Securities and Exchange Commission as having filed an annual report issued by a registered public accounting firm branch or office that is
located in a foreign jurisdiction where the Public Company Accounting Oversight Board is unable to inspect or completely investigate because of a position taken by an authority in that jurisdiction.
The registrant is not a foreign issuer.
Item 5. Audit Committee of Listed Registrants.
(a) Not applicable to registrants who are not listed issuers (as defined in Rule 10A-3 under the Securities Exchange Act of 1934).
(b) Not applicable.
Item 6. Investments.
(a) Schedule of Investments is included as part of the report to shareholders filed under Item 1 of this Form.
(b) Not applicable.
Item 7. Disclosure of Proxy Voting Policies and Procedures for Closed-End Management Investment Companies.
Not applicable to open-end investment companies.
Item 8. Portfolio Managers of Closed-End Management Investment Companies.
Not applicable to open-end investment companies.
Item 9. Purchases of Equity Securities by Closed‑End Management Investment Company and Affiliated Purchasers.
Not applicable to open-end investment companies.
Item 10. Submission of Matters to a Vote of Security Holders.
There have been no material changes to the procedures by which shareholders may recommend nominees to the Registrant’s Board of Trustees.
Item 11. Controls and Procedures.
|
(a)
|
The Registrant’s President/Chief Executive Officer/Principal Executive Officer and Vice President/Treasurer/Principal Financial Officer have reviewed the Registrant's disclosure controls and procedures (as defined in Rule 30a-3(c)
under the Investment Company Act of 1940, as amended, (the “Act”)) as of a date within 90 days of the filing of this report, as required by Rule 30a-3(b) under the Act and Rules 13a-15(b) or 15d‑15(b) under the Securities Exchange Act of
1934. Based on their review, such officers have concluded that the disclosure controls and procedures are effective in ensuring that information required to be disclosed in this report is appropriately recorded, processed, summarized and
reported and made known to them by others within the Registrant and by the Registrant’s service provider.
|
|
(b)
|
There were no changes in the Registrant's internal control over financial reporting (as defined in Rule 30a-3(d) under the Act) that occurred during the period covered by this report that has materially affected, or is reasonably
likely to materially affect, the Registrant's internal control over financial reporting.
|
Item 12. Disclosure of Securities Lending Activities for Closed-End Management Investment Companies.
Not applicable to open-end investment companies.
Item 13. Exhibits.
(3) Any written solicitation to purchase securities under Rule 23c‑1 under the Act sent or given during the period covered by the report by or on behalf of the registrant to 10 or
more persons. Not applicable to open-end investment companies.
(4) Change in the registrant’s independent public accountant. There was no change in the registrant’s independent public accountant for the period covered by this report.
SIGNATURES
Pursuant to the requirements of the Securities Exchange Act of 1934 and the Investment Company Act of 1940, as amended, the registrant has duly caused this report to be signed on its behalf by the undersigned,
thereunto duly authorized.
(Registrant) Advisors Series Trust
By (Signature and Title)* /s/ Jeffrey T. Rauman
Jeffrey T. Rauman, President/Chief Executive Officer/Principal
Executive Officer
Date 12/9/2022
Pursuant to the requirements of the Securities Exchange Act of 1934 and the Investment Company Act of 1940, as amended, this report has been signed below by the following persons on behalf of the registrant and in the
capacities and on the dates indicated.
By (Signature and Title)* /s/ Jeffrey T. Rauman
Jeffrey T. Rauman, President/Chief Executive Officer/Principal
Executive Officer
Date 12/9/2022
By (Signature and Title)* /s/ Cheryl L. King
Cheryl L. King, Vice President/Treasurer/Principal Financial
Officer
Date 12/9/2022
* Print the name and title of each signing officer under his or her signature.
ATTACHMENTS / EXHIBITS
Serious News for Serious Traders! Try StreetInsider.com Premium Free!
You May Also Be Interested In
- Share Buyback Transaction Details April 11 – April 17, 2024
- Intellistocks Launches Significant Upgrade to IntelliQ Platform Following Stellar Performance in Volatile Markets
- New Egress Report Reveals Millennials are the Key Target, as AI, Quishing, and Multi-channel Attacks Top Phishing Trends
Create E-mail Alert Related Categories
SEC FilingsSign up for StreetInsider Free!
Receive full access to all new and archived articles, unlimited portfolio tracking, e-mail alerts, custom newswires and RSS feeds - and more!
