

Form N-CSR ADVISORS SERIES TRUST For: Sep 30
 Tweet
Tweet Share
ShareUNITED STATES
SECURITIES AND EXCHANGE COMMISSION
Washington, D.C. 20549
SECURITIES AND EXCHANGE COMMISSION
Washington, D.C. 20549
FORM N-CSR
CERTIFIED SHAREHOLDER REPORT OF REGISTERED
MANAGEMENT INVESTMENT COMPANIES
Investment Company Act file number 811-07959
Advisors Series Trust
(Exact name of registrant as specified in charter)
(Exact name of registrant as specified in charter)
615 East Michigan Street
Milwaukee, WI 53202
(Address of principal executive offices) (Zip code)
(Address of principal executive offices) (Zip code)
Jeffrey T. Rauman, President/Chief Executive Officer
Advisors Series Trust
c/o U.S. Bancorp Fund Services, LLC
777 East Wisconsin Avenue, 5th Floor
Milwaukee, WI 53202
(Name and address of agent for service)
(Name and address of agent for service)
(626) 914-7363
Registrant's telephone number, including area code
Date of fiscal year end: September 30, 2021
Date of reporting period: September 30, 2021
Item 1. Reports to Stockholders.
(a) [Insert full text of semi-annual or annual report here]
Scharf Fund
Institutional Class – LOGIX
Retail Class – LOGRX
Scharf Multi-Asset Opportunity Fund
Institutional Class – LOGOX
Retail Class – LOGBX
Scharf Global Opportunity Fund
Retail Class – WRLDX
Scharf Alpha Opportunity Fund
Retail Class – HEDJX
ANNUAL REPORT
September 30, 2021
Scharf Investments, LLC
(This Page Intentionally Left Blank.)
SCHARF FUNDS
TABLE OF CONTENTS
|
Letter from the President
|
2
|
|
To Our Shareholders
|
6
|
|
Investment Highlights
|
9
|
|
Expense Examples
|
15
|
|
Sector Allocation of Portfolio Assets
|
17
|
|
Schedules of Investments
|
21
|
|
Statements of Assets and Liabilities
|
38
|
|
Statements of Operations
|
40
|
|
Statements of Changes in Net Assets
|
42
|
|
Statement of Cash Flows
|
48
|
|
Financial Highlights
|
49
|
|
Notes to Financial Statements
|
55
|
|
Report of Independent Registered Public Accounting Firm
|
74
|
|
Notice to Shareholders
|
76
|
|
Information about Trustees and Officers
|
78
|
|
Householding
|
82
|
|
Privacy Notice
|
83
|
SCHARF FUNDS
Letter from the President

Dear Fellow Shareholders,
We have believed since early spring that the speed and magnitude of the economic recovery places us further along the market cycle than most investors appreciate. Historically, when the economic
recovery growth rate peaks, stock leadership transfers from cyclicals who benefit early in the cycle to more defensive stocks who offer superior earning sustainability throughout the cycle. Leading economic indicators like the 10-year treasury yield,
the ISM Manufacturing PMI index and upwards earnings estimates revisions all peaked in April. If past is prologue, the rotation into quality stocks is just beginning this cycle and likely to last for a while.
Meanwhile, U.S. equity markets continue to set new highs, powered by an increasingly narrow group of stocks. Currently, just 30% of S&P 500 stocks are trading above their 50-day moving averages.
This is highly unusual. Setting aside the cognitive dissonance-inducing earnings impacts from the pandemic and subsequent recovery, stocks continue to look expensive vs. their long-term earnings power. The cyclically-adjusted price earnings (CAPE)
ratio averages the trailing 10 years of S&P 500 earnings, adjusted for inflation, and compares it to current market levels. The S&P 500’s CAPE ratio is currently 36x, a figure near its historical peak of 44x in December 1999, and well over
twice the long-term average of 17x. S&P 500 margins may also be peaking. Labor, materials, transportation and even tax rate inflationary pressures pose risks to current margin levels.

So, against the backdrop of a peaking U.S. market with peak corporate profit margins and a potential rotation into defensive stocks, we have high conviction in our portfolio’s positioning. Our exacting
investment discipline, one we have followed since inception, emphasizes high quality companies trading at compelling discounts to fair value. We seek to buy stocks with 30%+ plus upside to our price targets and limited downside if our investment
thesis proves incorrect. We use this upside vs. downside calculus to create a stock’s Favorability Ratio. Leaving our own projections aside and using consensus earnings and the historical median high and low P/Es for
2
SCHARF FUNDS
stocks, the Scharf portfolio Favorability Ratio is 3.34 vs. 0.45 for the S&P 500. The Scharf portfolio also sports a top quartile Earnings Predictability, a figure that measures the volatility of a
company’s earnings for the prior 32 quarters against 1,700 stocks in the Value Line universe. The higher the earnings predictability, the better a company can be expected to perform when the economy slows.
Despite expensive market indices, we are finding attractive opportunities within defensive areas like health care (e.g., CVS and Centene), communication services (e.g., broadband providers Charter and
Comcast), insurance (e.g., strong underwriters and capital allocators Berkshire Hathaway and Markel) and business services/software (e.g., Cognizant and Fiserv). All of these examples have multiples that are several turns less than relevant peers,
the market or fair value, yet generally have superior earnings quality, prospects and capital returns.
Higher Inflation
As we have mentioned elsewhere, the threat of extended inflation is not factored into U.S. equity prices. That’s not a good setup for many risk assets either. With the Producer Price Index (PPI) at 8.3%
and the Consumer Price Index (CPI) at 5.3% vs. a 10-Year TIPS/Treasury breakeven rate of 2.37%, investors clearly believe inflation is transitory. However, the Fed has been surprised at the extended nature of elevated prices. At first, Fed Chairman
Powell cited base effect issues as the cause, but since the Fed’s Jackson Hole meeting, he has admitted that supply chain issues are driving prices and these constraints are likely to last into 2022.
There are several companies in the Scharf Portfolio that we believe should fare well should inflation take root. These include companies with pricing power or who own long-term, irreplaceable fixed
assets. Software companies like Microsoft and Oracle offer deeply integrated and mission critical software solutions, increasingly via cloud subscriptions with annual fee increases to corporate clients around the world. Kansas City Southern owns
6,700 miles of railroad track in the U.S. and Mexico. CVS Health and Centene reprice health insurance annually. Unilever and Heineken, owners of strong brands such as Ben & Jerry’s and the namesake beer brand, can navigate inflation via price
increases. Insurance companies Berkshire Hathaway and Markel will benefit should higher inflation bring on high interest rates since they will be able to invest consumer premiums in bonds with higher yields. A well-diversified, high-quality portfolio
of companies should help mitigate the threat of inflation.
The Path Forward
If one thing is certain, it’s that the markets do not like uncertainty. Market headwinds include questions around Federal Reserve policy and interest rates, uncertainty in Washington D.C. over the
infrastructure bill, inflation, and ongoing concerns over COVID-19 and potential variants. We believe it’s best to stay the course and keep focused on company fundamentals. We remain focused on executing our time-tested
3
SCHARF FUNDS
investment strategy of investing in attractively priced, quality companies with both predictable earnings and compelling favorability ratios. We believe history has shown that this is a proven way to
build wealth over the long term.
I sincerely hope that you, your families and those closest to you are healthy and well. Thank you for your continued trust and confidence in Scharf Investments and the Scharf Funds. My team and I
welcome your comments and the opportunity to respond to your questions. Please don’t hesitate to reach out to us.
Best regards,

Brian Krawez, CFA
President and Portfolio Manager
November 1, 2021
Active investing has higher management fees because of the manager’s increased level of involvement while passive investing has lower management and operating fees. Investing in both
actively and passively managed mutual funds involves risk and principal loss is possible. Both actively and passively managed mutual funds generally have daily liquidity. There are no guarantees regarding the performance of actively and passively
managed mutual funds. Actively managed mutual funds may have higher portfolio turnover than passively managed funds. Excessive turnover can limit returns and can incur capital gains.
Mutual fund investing involves risk. Principal loss is possible. The Funds may invest in securities representing equity or debt. These securities may be issued by small- and
medium-sized companies, which involve additional risks such as limited liquidity and greater volatility. The Funds may invest in foreign securities which involve greater volatility, political, economic and currency risks, and differences in
accounting methods. These risks are greater for emerging markets. The Funds may invest in exchange-traded funds (“ETFs”) or mutual funds, the risks of owning either generally reflecting the risks of owning the underlying securities held by the ETF or
mutual fund. The Funds follow an investment style that favors relatively low valuations. Investment in debt securities typically decrease in value when interest rates rise. This risk is usually greater for longer-term debt securities. Investment in
lower-rated, non-rated and distressed securities presents a greater risk of loss to principal and interest than higher-rated securities. The Scharf Alpha Opportunity Fund may make short sales of securities, which involves the risk that losses may
exceed the original amount invested. The Scharf Alpha Opportunity Fund may use leverage which may exaggerate the effect of any increase or decrease in the value of portfolio securities or the net asset value of the Fund, and money borrowed will be
subject to interest costs.
Forward earnings and EPS Growth are not measures of the Funds’ future performance.
4
SCHARF FUNDS
Terms and Definitions:
The S&P 500® Index
is a broad-based unmanaged index of 500 stocks, which is widely recognized as representative of the equity market in general.
The S&P 500® Growth
Index is a market-capitalization-weighted index developed by Standard and Poor’s consisting of those stocks within the S&P 500 Index that exhibit strong growth characteristics.
The S&P 500® Value Index
is a market-capitalization-weighted index developed by Standard and Poor’s consisting of those stocks within the S&P 500 Index that exhibit strong value characteristics.
The Lipper Balanced Funds Index is an index of open-end mutual funds whose primary objective is to conserve principal by maintaining at all times a balanced
portfolio of both equities and bonds.
The Bloomberg U.S. Aggregate Bond Index is a broad-based benchmark that measures the investment grade, U.S. dollar-denominated, fixed-rate taxable bond market,
including Treasuries, government related and corporate securities.
The MSCI All Country World Index (Net) is a broad measure of stock performance throughout the world, with the exception of U.S. based companies.
The HFRX Equity Hedge Index encompasses various equity hedge strategies, also known as long/short equity, that combine core long holdings of equities with short
sales of stock, stock indices, related derivatives, or other financial instruments related to the equity markets.
Price to Earnings Ratio (P/E) is a valuation of a company’s current share price compared to its per-share earnings.
Producer Price Index (PPI) measures the average changes in prices received by domestic producers for their output.
Consumer Price Index (CPI) measures the weighted average market basket of consumer goods and services purchased by households.
Treasury Inflation-Protected Securities (TIPS) is a bond that offsets the effects of rising prices by adjusting its principal value as inflation rises.
You cannot invest directly in an index.
The information provided herein represents the opinion of the Funds’ manager, is subject to change at any time, is not guaranteed and should not be considered investment advice.
The Funds’ holdings and sector allocations are subject to change at any time and should not be considered recommendations to buy and sell any security. Please refer to the Schedule of Investments in
this report for a complete list of Fund holdings.
Must be preceded or accompanied by a prospectus.
5
SCHARF FUNDS
TO OUR SHAREHOLDERS
|
PERFORMANCE AS OF 9/30/2021
|
||||||
|
SCHARF FUND
|
||||||
|
|
Since
|
Since
|
||||
|
|
6
|
One
|
Three
|
Five
|
Inception
|
Inception
|
|
Cumulative:
|
Months
|
Year
|
Year
|
Year
|
12/30/11
|
1/28/15
|
|
Scharf Fund – Institutional Class
|
4.88%
|
23.43%
|
43.61%
|
70.68%
|
210.31%
|
N/A
|
|
Scharf Fund – Retail Class
|
4.73%
|
23.08%
|
42.43%
|
68.28%
|
N/A
|
80.73%
|
|
S&P 500® Index
|
9.18%
|
30.00%
|
56.07%
|
118.26%
|
316.63%
|
145.15%
|
|
(with dividends reinvested)
|
||||||
|
Annualized:
|
||||||
|
Scharf Fund – Institutional Class
|
—
|
—
|
12.82%
|
11.28%
|
12.31%
|
N/A
|
|
Scharf Fund – Retail Class
|
—
|
—
|
12.51%
|
10.97%
|
N/A
|
9.28%
|
|
S&P 500® Index
|
—
|
—
|
15.99%
|
16.90%
|
15.76%
|
14.39%
|
|
(with dividends reinvested)
|
||||||
|
SCHARF MULTI-ASSET OPPORTUNITY FUND
|
||||||
|
|
Since
|
Since
|
||||
|
|
6
|
One
|
Three
|
Five
|
Inception
|
Inception
|
|
Cumulative:
|
Months
|
Year
|
Year
|
Year
|
12/31/12
|
1/21/16
|
|
Scharf Multi-Asset Opportunity
|
||||||
|
Fund – Institutional Class
|
3.95%
|
16.46%
|
35.69%
|
54.27%
|
117.13%
|
N/A
|
|
Scharf Multi-Asset Opportunity
|
||||||
|
Fund – Retail Class
|
3.82%
|
16.18%
|
34.67%
|
52.29%
|
N/A
|
68.02%
|
|
Lipper Balanced Funds Index
|
2.78%
|
18.69%
|
35.68%
|
60.88%
|
112.84%
|
80.95%
|
|
(with dividends reinvested)
|
||||||
|
Bloomberg U.S.
|
||||||
|
Aggregate Bond Index
|
1.88%
|
-0.90%
|
16.94%
|
15.61%
|
27.68%
|
21.20%
|
|
S&P 500® Index
|
||||||
|
(with dividends reinvested)
|
9.18%
|
30.00%
|
56.07%
|
118.26%
|
259.15%
|
157.15%
|
|
Annualized:
|
||||||
|
Scharf Multi-Asset Opportunity
|
||||||
|
Fund – Institutional Class
|
—
|
—
|
10.71%
|
9.06%
|
9.27%
|
N/A
|
|
Scharf Multi-Asset Opportunity
|
||||||
|
Fund – Retail Class
|
—
|
—
|
10.43%
|
8.78%
|
N/A
|
9.54%
|
|
Lipper Balanced Funds Index
|
—
|
—
|
10.71%
|
9.98%
|
9.02%
|
10.98%
|
|
(with dividends reinvested)
|
||||||
|
Bloomberg U.S.
|
||||||
|
Aggregate Bond Index
|
—
|
—
|
5.36%
|
2.94%
|
2.83%
|
3.44%
|
|
S&P 500® Index
|
||||||
|
(with dividends reinvested)
|
—
|
—
|
15.99%
|
16.90%
|
15.74%
|
18.05%
|
6
SCHARF FUNDS
|
SCHARF GLOBAL OPPORTUNITY FUND
|
|||||
|
|
Since
|
||||
|
|
6
|
One
|
Three
|
Five
|
Inception
|
|
Cumulative:
|
Months
|
Year
|
Year
|
Year
|
10/14/14
|
|
Scharf Global Opportunity Fund
|
3.90%
|
26.33%
|
43.27%
|
79.43%
|
110.77%
|
|
MSCI All Country World Index (Net)
|
6.26%
|
27.44%
|
42.69%
|
85.84%
|
103.82%
|
|
Annualized:
|
|||||
|
Scharf Global Opportunity Fund
|
—
|
—
|
12.73%
|
12.40%
|
11.30%
|
|
MSCI All Country World Index (Net)
|
—
|
—
|
12.58%
|
13.20%
|
10.77%
|
|
SCHARF ALPHA OPPORTUNITY FUND
|
|||||
|
|
Since
|
||||
|
|
6
|
One
|
Three
|
Five
|
Inception
|
|
Cumulative:
|
Months
|
Year
|
Year
|
Year
|
12/31/15
|
|
Scharf Alpha Opportunity Fund
|
-0.08%
|
8.56%
|
8.60%
|
8.49%
|
10.84%
|
|
HFRX Equity Hedge Index
|
6.42%
|
17.74%
|
15.64%
|
27.03%
|
26.15%
|
|
Bloomberg U.S.
|
|||||
|
Aggregate Bond Index
|
1.88%
|
-0.90%
|
16.94%
|
15.61%
|
22.31%
|
|
S&P 500® Index
|
9.18%
|
30.00%
|
56.07%
|
118.26%
|
135.37%
|
|
(with dividends reinvested)
|
|||||
|
Annualized:
|
|||||
|
Scharf Alpha Opportunity Fund
|
—
|
—
|
2.79%
|
1.64%
|
1.81%
|
|
HFRX Equity Hedge Index
|
—
|
—
|
4.96%
|
4.90%
|
4.12%
|
|
Bloomberg U.S.
|
|||||
|
Aggregate Bond Index
|
—
|
—
|
5.36%
|
2.94%
|
3.56%
|
|
S&P 500® Index
|
—
|
—
|
15.99%
|
16.90%
|
16.05%
|
|
(with dividends reinvested)
|
|||||
Performance data quoted represents past performance; past performance does not guarantee future results. The investment return and principal value of an investment will fluctuate so
that an investor’s shares, when redeemed, may be worth more or less than their original cost. Current performance of the Funds may be lower or higher than the performance quoted. Performance data current to the most recent month end may be obtained
by calling 1-866-572-4273.
The gross expense ratios, as of the Funds’ registration statement dated January 28, 2021, for the Scharf Fund Institutional Class, Scharf Fund Retail Class, Scharf Multi-Asset Opportunity Fund
Institutional Class, Scharf Multi-Asset Opportunity Fund Retail Class, Scharf Global Opportunity Fund, and Scharf Alpha Opportunity Fund are 0.98%, 1.23%, 1.51%, 1.76%, 2.13%, and 3.40%, respectively. The net expense ratios, as of the Funds’
registration statement dated January 28, 2021, for the Scharf Fund Institutional Class, Scharf Fund Retail Class, Scharf Multi-Asset Opportunity Fund Institutional Class, Scharf Multi-Asset Opportunity Fund Retail Class, Scharf Global Opportunity
Fund, and Scharf Alpha Opportunity Fund represent the percentages paid by investors and are 0.89%, 1.14%, 1.00%, 1.25%, 0.90%, and 1.99%, respectively, after fee waivers and expense reimbursements, including acquired fund fees and expenses, interest,
taxes and extraordinary expenses. Scharf Investments, LLC (the “Adviser”), the Funds’ investment adviser, has contractually agreed to waive fees through January 27, 2022 for the Scharf Fund, Scharf Multi-Asset Opportunity Fund, Scharf Global
Opportunity Fund, and Scharf Alpha Opportunity Fund. The Scharf Fund charges a 2.00% redemption fee on redemptions or exchanges of fund shares that are made within 60 days of
7
SCHARF FUNDS
purchase. The Scharf Multi-Asset Opportunity Fund, Scharf Global Opportunity Fund, and Scharf Alpha Opportunity Fund charge a 2.00% redemption fee on redemptions or exchanges of fund shares that are
made within 15 days of purchase. Had a redemption fee been included, returns would be lower.
For the fiscal year ended September 30, 2021, the Scharf Funds mutual funds performed as follows:
Scharf Fund Institutional Class and Retail Class returned 23.43% and 23.08%, respectively, compared to the 30.00% return for the S&P 500® Index (“S&P 500”). The key contributors to relative performance for the period were Valvoline, Inc., CVS Health Corp., and Baidu, Inc. – ADR. The key detractors from
relative performance were Progressive Corp., Berkshire Hathaway, Inc. – Class B, and Lockheed Martin Corp.
Scharf Multi-Asset Opportunity Fund Institutional Class and Retail Class returned 16.46% and 16.18%, respectively, compared to the 18.69% return for the Lipper
Balanced Funds Index, -0.90% return for the Bloomberg U.S. Aggregate Bond Index, and 30.00% return for the S&P 500. The key contributors to relative performance for the period were CVS Health Corp., Valvoline, Inc., and Baidu, Inc. – ADR. The key
detractors from relative performance were Progressive Corp., Berkshire Hathaway, Inc. – Class B, and Lockheed Martin Corp.
Scharf Global Opportunity Fund returned 26.33% compared to the 27.44% return for the MSCI All Country World Index (Net). The key contributors to relative
performance for the period were Grupo Televisa S.A.B. – ADR, Baidu Inc. – ADR, and Porsche Automobil Holding SE. The key detractors from relative performance were Barrick Gold Corp., Lockheed Martin Corp., and Novartis AG – ADR.
Scharf Alpha Opportunity Fund returned 8.56% compared to the 17.74% return for the HFRX Equity Hedge Index, -0.90% return for the Bloomberg U.S. Aggregate Bond
Index, and 30.00% return for the S&P 500. The key contributors to relative performance for the period were Valvoline, Inc., CVS Health Corp., and Baidu, Inc. – ADR. The key detractors from relative performance were Progressive Corp., Berkshire
Hathaway, Inc. – Class B, and Lockheed Martin Corp.
8
SCHARF FUNDS
Comparison of the change in value of a hypothetical $1,000,000 investment
in the Scharf Fund – Institutional Class vs. the S&P 500® Index

Average Annual Total Return for the Periods Ended 9/30/2021:
|
Since
|
Since
|
|||
|
Inception
|
Inception
|
|||
|
1 year
|
5 year
|
(12/30/11)
|
(1/28/15)
|
|
|
Scharf Fund – Institutional Class1
|
23.43%
|
11.28%
|
12.31%
|
—
|
|
Scharf Fund – Retail Class2
|
23.08%
|
10.97%
|
—
|
9.28%
|
|
S&P 500® Index
|
30.00%
|
16.90%
|
15.76%
|
14.39%
|
Performance data quoted on this page represents past performance and does not guarantee future results. The investment return and principal value of an investment will fluctuate so
that an investor’s shares, when redeemed, may be worth more or less than their original cost. Current performance of the Fund may be lower or higher than the performance quoted. Performance data current to the most recent month end may be obtained by
calling 1–866–572–4273 (1–866–5SCHARF).
Returns reflect reinvestment of dividends and capital gains distributions. Fee waivers are in effect. In the absence of fee waivers, returns would be reduced. The performance data and graph do not
reflect the deduction of taxes that a shareholder would pay on dividends, capital gains distributions, or redemption of Fund shares. The performance data and graph do not reflect the 2.00% redemption fee imposed on shares held 60 days or less.
Indices do not incur expenses and are not available for investment.
The S&P 500® Index is an unmanaged capitalization-weighted index of 500 stocks designed to represent the broad
domestic economy.
|
1
|
Institutional Class commenced operations on December 30, 2011.
|
|
2
|
Retail Class commenced operations on January 28, 2015.
|
9
SCHARF MULTI-ASSET OPPORTUNITY FUND
Comparison of the change in value of a hypothetical $5,000,000 investment in
the Scharf Multi-Asset Opportunity Fund – Institutional Class vs.
the Lipper Balanced Funds Index, the S&P 500® Index,
and the Bloomberg U.S. Aggregate Bond Index

Average Annual Total Return for the Periods Ended 9/30/2021:
|
Since
|
Since
|
|||
|
Inception
|
Inception
|
|||
|
1 year
|
5 year
|
(12/31/12)
|
(1/21/16)
|
|
|
Scharf Multi–Asset Opportunity
|
||||
|
Fund – Institutional Class1
|
16.46%
|
9.06%
|
9.27%
|
—
|
|
Scharf Multi–Asset Opportunity
|
||||
|
Fund – Retail Class2
|
16.18%
|
8.78%
|
—
|
9.54%
|
|
S&P 500® Index
|
30.00%
|
16.90%
|
15.74%
|
18.05%
|
|
Bloomberg U.S.
|
||||
|
Aggregate Bond Index
|
-0.90%
|
2.94%
|
2.83%
|
3.44%
|
|
Lipper Balanced Funds Index
|
18.69%
|
9.98%
|
9.02%
|
10.98%
|
Performance data quoted on this page represents past performance and does not guarantee future results. The investment return and principal value of an investment will fluctuate so
that an investor’s shares, when redeemed, may be worth more or less than their original cost. Current performance of the Fund may be lower or higher than the performance quoted. Performance data current to the most recent month end may be obtained by
calling 1–866–572–4273 (1–866–5SCHARF).
Returns reflect reinvestment of dividends and capital gains distributions. Fee waivers are in effect. In the absence of fee waivers, returns would be reduced. The performance data and graph do not
reflect the deduction of taxes that a shareholder
10
SCHARF MULTI-ASSET OPPORTUNITY FUND
would pay on dividends, capital gains distributions, or redemption of Fund shares. The performance data and graph do not reflect the 2.00% redemption fee imposed on shares held 15 days or less. Indices
do not incur expenses and are not available for investment.
The S&P 500® Index is an unmanaged capitalization-weighted index of 500 stocks designed to represent the broad
domestic economy.
The Lipper Balanced Funds Index is an equally weighted index of the 30 largest U.S. balanced funds.
The Bloomberg U.S. Aggregate Bond Index is a broad based benchmark that measures the investment grade, U.S. dollar-denominated, fixed-rate taxable bond market, including Treasuries, government related
and corporate securities.
|
1
|
The Fund commenced operations on December 31, 2012.
|
|
2
|
The Fund commenced operations on January 21, 2016.
|
11
SCHARF GLOBAL OPPORTUNITY FUND
Comparison of the change in value of a hypothetical $10,000 investment in the
Scharf Global Opportunity Fund vs. the MSCI World All Country Index (Net).
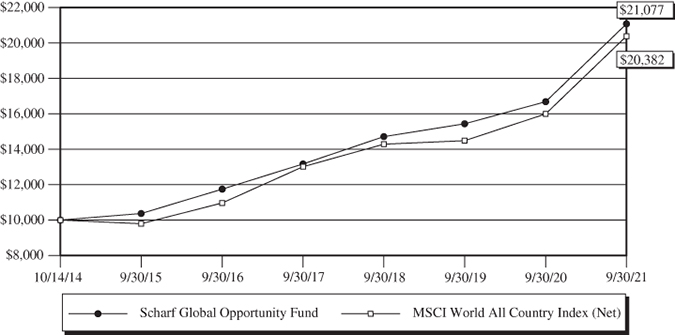
Average Annual Total Return for the Periods Ended 9/30/2021:
|
1 year
|
5 year
|
Since Inception1
|
|
|
Scharf Global Opportunity Fund
|
26.33%
|
12.40%
|
11.30%
|
|
MSCI World All Cap Country Index (Net)
|
27.44%
|
13.20%
|
10.77%
|
Performance data quoted on this page represents past performance and does not guarantee future results. The investment return and principal value of an investment will fluctuate so
that an investor’s shares, when redeemed, may be worth more or less than their original cost. Current performance of the Fund may be lower or higher than the performance quoted. Performance data current to the most recent month end may be obtained by
calling 1–866–572–4273 (1–866–5SCHARF).
Returns reflect reinvestment of dividends and capital gains distributions. Fee waivers are in effect. In the absence of fee waivers, returns would be reduced. The performance data and graph do not
reflect the deduction of taxes that a shareholder would pay on dividends, capital gains distributions, or redemption of Fund shares. The performance data and graph do not reflect the 2.00% redemption fee imposed on shares held 15 days or less.
Indices do not incur expenses and are not available for investment.
The MSCI World All Country Index (Net) captures large and mid cap representation across 23 Developed Markets (DM) and 23 Emerging Markets (EM) countries. Net total return indexes reinvest dividends
after the deduction of withholding taxes, using a tax rate applicable to non–resident institutional investors who do not benefit from double taxation treaties.
|
1
|
The Fund commenced operations on October 14, 2014.
|
12
SCHARF Alpha OPPORTUNITY FUND
Comparison of the change in value of a hypothetical $10,000 investment in
the Scharf Alpha Opportunity Fund vs. the HFRX Equity Hedge Index,
S&P 500® Index, and the Bloomberg U.S. Aggregate Bond Index.

Average Annual Total Return for the Periods Ended 9/30/2021:
|
1 year
|
5 year
|
Since Inception1
|
|
|
Scharf Alpha Opportunity Fund
|
8.56%
|
1.64%
|
1.81%
|
|
HFRX Equity Hedge Index
|
17.74%
|
4.90%
|
4.12%
|
|
Bloomberg U.S. Aggregate Bond Index
|
-0.90%
|
2.94%
|
3.56%
|
|
S&P 500® Index
|
30.00%
|
16.90%
|
16.05%
|
Performance data quoted on this page represents past performance and does not guarantee future results. The investment return and principal value of an investment will fluctuate so
that an investor’s shares, when redeemed, may be worth more or less than their original cost. Current performance of the Fund may be lower or higher than the performance quoted. Performance data current to the most recent month end may be obtained by
calling 1–866–572–4273 (1–866–5SCHARF).
Returns reflect reinvestment of dividends and capital gains distributions. Fee waivers are in effect. In the absence of fee waivers, returns would be reduced. The performance data and graph do not
reflect the deduction of taxes that a shareholder would pay on dividends, capital gains distributions, or redemption of Fund shares. The performance data and graph do not reflect the 2.00% redemption fee imposed on shares held 15 days or less.
Indices do not incur expenses and are not available for investment.
The HFRX Equity Hedge Index encompasses various equity hedge strategies, also known as long/short equity, that combine core long holdings of equities with short
13
SCHARF Alpha OPPORTUNITY FUND
sales of stock, stock indices, related derivatives, or other financial instruments related to the equity markets.
The S&P 500® Index is an unmanaged capitalization–weighted index of 500 stocks designed to represent the broad
domestic economy.
The Bloomberg U.S. Aggregate Bond Index is a broad based benchmark that measures the investment grade, U.S. dollar–denominated, fixed–rate taxable bond market, including Treasuries, government related
and corporate securities.
|
1
|
The Fund commenced operations on December 31, 2015.
|
14
SCHARF FUNDS
EXPENSE EXAMPLES at September 30, 2021 (Unaudited)
Shareholders in mutual funds generally incur two types of costs: (1) transaction costs, including sales charges (loads) on purchase payments, redemption fees, and exchange fees; and (2) ongoing costs,
including management fees, distribution and/or service fees, and other fund expenses. The Scharf Fund, Scharf Multi–Asset Opportunity Fund, Scharf Global Opportunity Fund, and the Scharf Alpha Opportunity Fund are
no–load mutual funds. These Examples are intended to help you understand your ongoing costs (in dollars) of investing in the Funds and to compare these costs with the ongoing costs of investing in other mutual funds. The Example is based on
an investment of $1,000 invested in each Fund at the beginning of the period and held for the entire period (4/1/21-9/30/21).
Actual Expenses
The first line of each table below provides information about actual account values and actual expenses, with actual net expenses being limited. Although the Funds charge no sales load or transaction
fees, you will be assessed fees for outgoing wire transfers, returned checks, and stop payment orders at prevailing rates charged by U.S. Bancorp Fund Services, LLC, the Funds’ transfer agent. The Examples below include, but are not limited to,
management fees, fund accounting, custody and transfer agent fees. You may use the information in the first line of the tables, together with the amount you invested, to estimate the expenses that you paid over the period. Simply divide your account
value by $1,000 (for example, an $8,600 account value divided by $1,000 = 8.6), then multiply the result by the number in the first line under the heading entitled “Expenses Paid During Period’’ to estimate the expenses you paid on your account
during this period.
Hypothetical Example for Comparison Purposes
The second line of each table below provides information about hypothetical account values and hypothetical expenses based on the Funds’ actual expense ratio and an assumed rate of return of 5% per year
before expenses, which is not the Funds’ actual return. The hypothetical account values and expenses may not be used to estimate the actual ending account balance or expenses you paid for the period. You may use this information to compare the
ongoing costs of investing in the Funds and other funds. To do so, compare this 5% hypothetical example with the 5% hypothetical examples that appear in the shareholder reports of the other funds. Please note that the expenses shown in the tables are
meant to highlight your ongoing costs only and will not help you determine the relative total costs of owning different funds, as they may charge transaction costs, such as sales charges (loads), redemption fees, or exchange fees.
15
SCHARF FUNDS
EXPENSE EXAMPLES at September 30, 2021 (Unaudited), Continued
|
Beginning
|
Ending
|
Expenses Paid
|
Annualized
|
|
|
Account Value
|
Account Value
|
During Period*
|
Expense
|
|
|
Scharf Fund
|
4/1/21
|
9/30/21
|
4/1/21-9/30/21
|
Ratio*
|
|
Institutional Class
|
||||
|
Actual
|
$1,000.00
|
$1,048.80
|
$4.42
|
0.86%
|
|
Hypothetical (5% return
|
||||
|
before expenses)
|
$1,000.00
|
$1,020.76
|
$4.36
|
0.86%
|
|
Retail Class
|
||||
|
Actual
|
$1,000.00
|
$1,047.30
|
$5.85
|
1.14%
|
|
Hypothetical (5% return
|
||||
|
before expenses)
|
$1,000.00
|
$1,019.35
|
$5.77
|
1.14%
|
|
Beginning
|
Ending
|
Expenses Paid
|
Annualized
|
|
|
Scharf Multi-Asset
|
Account Value
|
Account Value
|
During Period*
|
Expense
|
|
Opportunity Fund
|
4/1/21
|
9/30/21
|
4/1/21-9/30/21
|
Ratio*
|
|
Institutional Class
|
||||
|
Actual
|
$1,000.00
|
$1,039.50
|
$4.96
|
0.97%
|
|
Hypothetical (5% return
|
||||
|
before expenses)
|
$1,000.00
|
$1,020.21
|
$4.91
|
0.97%
|
|
Retail Class
|
||||
|
Actual
|
$1,000.00
|
$1,038.20
|
$6.28
|
1.23%
|
|
Hypothetical (5% return
|
||||
|
before expenses)
|
$1,000.00
|
$1,018.90
|
$6.23
|
1.23%
|
|
Beginning
|
Ending
|
Expenses Paid
|
Annualized
|
|
|
Scharf Global
|
Account Value
|
Account Value
|
During Period*
|
Expense
|
|
Opportunity Fund
|
4/1/21
|
9/30/21
|
4/1/21-9/30/21
|
Ratio*
|
|
Retail Class
|
||||
|
Actual
|
$1,000.00
|
$1,039.00
|
$3.83
|
0.75%
|
|
Hypothetical (5% return
|
||||
|
before expenses)
|
$1,000.00
|
$1,021.31
|
$3.80
|
0.75%
|
|
Beginning
|
Ending
|
Expenses Paid
|
Annualized
|
|
|
Scharf Alpha
|
Account Value
|
Account Value
|
During Period*
|
Expense
|
|
Opportunity Fund
|
4/1/21
|
9/30/21
|
4/1/21-9/30/21
|
Ratio*
|
|
Retail Class
|
||||
|
Actual(1)
|
$1,000.00
|
$ 999.20
|
$9.17
|
1.83%
|
|
Hypothetical (5% return
|
||||
|
before expenses)(1)
|
$1,000.00
|
$1,015.89
|
$9.25
|
1.83%
|
|
(1)
|
Excluding interest expense and dividends on short positions, your actual expenses would be $4.36 and your hypothetical expenses would be $4.41.
|
|
|
*
|
Expenses are equal to the Fund’s annualized expense ratio of each class, multiplied by the average account value over the period, multiplied by 183 (days in most recent fiscal half-year)/365
days to reflect the one-half year expense.
|
16
SCHARF FUND
SECTOR ALLOCATION OF PORTFOLIO ASSETS at September 30, 2021 (Unaudited)

The Global Industry Classification Standard (GICS®) was developed by and/or is the exclusive property of MSCI, Inc. and
Standard & Poor’s Financial Services LLC (“S&P”). GICS is a service mark of MSCI and S&P and has been licensed for use by U.S. Bancorp Fund Services, LLC.
17
SCHARF MULTI-ASSET OPPORTUNITY FUND
SECTOR ALLOCATION OF PORTFOLIO ASSETS at September 30, 2021 (Unaudited)
The Global Industry Classification Standard (GICS®) was developed by and/or is the exclusive property of MSCI, Inc. and
Standard & Poor’s Financial Services LLC (“S&P”). GICS is a service mark of MSCI and S&P and has been licensed for use by U.S. Bancorp Fund Services, LLC.
18
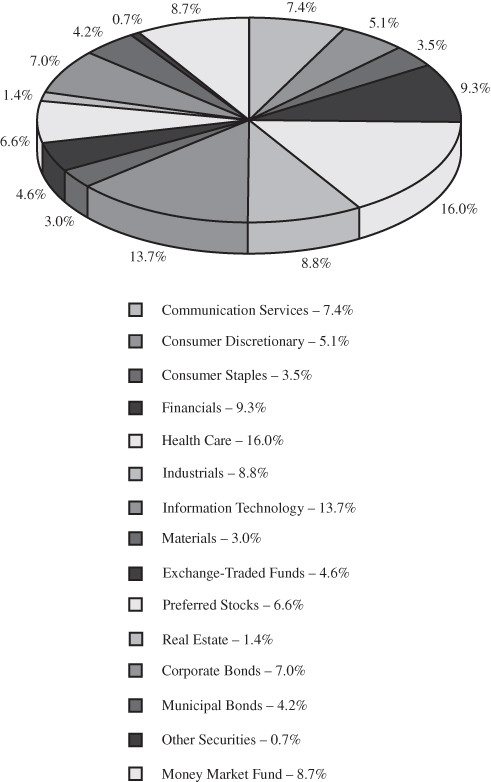
SCHARF GLOBAL OPPORTUNITY FUND
SECTOR ALLOCATION OF PORTFOLIO ASSETS at September 30, 2021 (Unaudited)

The Global Industry Classification Standard (GICS®) was developed by and/or is the exclusive property of MSCI, Inc. and
Standard & Poor’s Financial Services LLC (“S&P”). GICS is a service mark of MSCI and S&P and has been licensed for use by U.S. Bancorp Fund Services, LLC.
19
SCHARF Alpha OPPORTUNITY FUND
SECTOR ALLOCATION OF PORTFOLIO ASSETS at September 30, 2021 (Unaudited)

The Global Industry Classification Standard (GICS®) was developed by and/or is the exclusive property of MSCI, Inc. and
Standard & Poor’s Financial Services LLC (“S&P”). GICS is a service mark of MSCI and S&P and has been licensed for use by U.S. Bancorp Fund Services, LLC.
20
SCHARF FUND
SCHEDULE OF INVESTMENTS at September 30, 2021
|
Shares
|
COMMON STOCKS – 92.58%
|
Value
|
|||||
|
Aerospace and Defense – 3.68%
|
|||||||
|
42,695
|
Lockheed Martin Corp.
|
$
|
14,734,044
|
||||
|
Beverages – 2.29%
|
|||||||
|
87,835
|
Heineken N.V. (b)
|
9,177,247
|
|||||
|
Building Products – 3.85%
|
|||||||
|
277,355
|
Masco Corp.
|
15,407,070
|
|||||
|
Chemicals – 4.23%
|
|||||||
|
543,210
|
Valvoline, Inc.
|
16,937,288
|
|||||
|
Commercial Services & Supplies – 1.94%
|
|||||||
|
206,476
|
Herman Miller, Inc.
|
7,775,886
|
|||||
|
Construction & Engineering – 1.30%
|
|||||||
|
39,215
|
Jacobs Engineering Group, Inc.
|
5,197,164
|
|||||
|
Diversified Financial Services – 6.03%
|
|||||||
|
88,524
|
Berkshire Hathaway, Inc. – Class B (a)
|
24,161,741
|
|||||
|
Health Care Providers & Services – 14.79%
|
|||||||
|
238,875
|
Centene Corp. (a)
|
14,884,301
|
|||||
|
232,695
|
CVS Health Corp.
|
19,746,497
|
|||||
|
100,715
|
McKesson Corp.
|
20,080,557
|
|||||
|
31,393
|
Quest Diagnostics, Inc.
|
4,561,717
|
|||||
|
59,273,072
|
|||||||
|
Insurance – 7.17%
|
|||||||
|
15,343
|
Markel Corp. (a)
|
18,336,880
|
|||||
|
114,790
|
Progressive Corp.
|
10,375,868
|
|||||
|
28,712,748
|
|||||||
|
Interactive Media & Services – 1.51%
|
|||||||
|
39,465
|
Baidu, Inc. – ADR (a)
|
6,067,744
|
|||||
|
IT Services – 7.13%
|
|||||||
|
177,180
|
Cognizant Technology Solutions Corp. – Class A
|
13,148,528
|
|||||
|
141,950
|
Fiserv, Inc. (a)
|
15,401,575
|
|||||
|
28,550,103
|
|||||||
|
Media – 9.25%
|
|||||||
|
359,150
|
Comcast Corp. – Class A
|
20,087,259
|
|||||
|
98,355
|
Liberty Broadband Corp. (a)
|
16,985,909
|
|||||
|
37,073,168
|
|||||||
The accompanying notes are an integral part of these financial statements.
21
SCHARF FUND
SCHEDULE OF INVESTMENTS at September 30, 2021, Continued
|
Shares
|
COMMON STOCKS – 92.58%, Continued
|
Value
|
|||||
|
Personal Products – 2.60%
|
|||||||
|
192,345
|
Unilever plc – ADR
|
$
|
10,428,946
|
||||
|
Pharmaceuticals – 7.83%
|
|||||||
|
105,095
|
AstraZeneca plc – ADR
|
6,312,006
|
|||||
|
85,029
|
Johnson & Johnson
|
13,732,183
|
|||||
|
138,640
|
Novartis AG – ADR
|
11,337,979
|
|||||
|
31,382,168
|
|||||||
|
Road & Rail – 1.47%
|
|||||||
|
21,732
|
Kansas City Southern
|
5,881,548
|
|||||
|
Software – 12.42%
|
|||||||
|
111,385
|
Microsoft Corp.
|
31,401,659
|
|||||
|
210,660
|
Oracle Corp.
|
18,354,806
|
|||||
|
49,756,465
|
|||||||
|
Specialty Retail – 5.09%
|
|||||||
|
97,556
|
Advance Auto Parts, Inc.
|
20,378,473
|
|||||
|
TOTAL COMMON STOCKS
|
|||||||
|
(Cost $261,796,927)
|
370,894,875
|
||||||
|
PREFERRED STOCK – 3.45%
|
|||||||
|
Technology Hardware,
|
|||||||
|
Storage & Peripherals – 3.45%
|
|||||||
|
234,960
|
Samsung Electronics Co., Ltd. (b)
|
13,811,838
|
|||||
|
TOTAL PREFERRED STOCK
|
|||||||
|
(Cost $3,804,584)
|
13,811,838
|
||||||
The accompanying notes are an integral part of these financial statements.
22
SCHARF FUND
SCHEDULE OF INVESTMENTS at September 30, 2021, Continued
|
Shares
|
MONEY MARKET FUND – 3.84%
|
Value
|
|||||
|
15,385,061
|
First American Treasury Obligations
|
||||||
|
Fund, Class Z, 0.01% (c)
|
$
|
15,385,061
|
|||||
|
TOTAL MONEY MARKET FUND
|
|||||||
|
(Cost $15,385,061)
|
15,385,061
|
||||||
|
Total Investments in Securities
|
|||||||
|
(Cost $280,986,572) – 99.87%
|
400,091,774
|
||||||
|
Other Assets in Excess of Liabilities – 0.13%
|
524,398
|
||||||
|
TOTAL NET ASSETS – 100.00%
|
$
|
400,616,172
|
|||||
|
ADR
|
American Depository Receipt
|
|
(a)
|
Non–income producing security.
|
|
(b)
|
Foreign issuer.
|
|
(c)
|
Rate shown is the 7–day annualized yield as of September 30, 2021.
|
The Global Industry Classification Standard (GICS®) was developed by and/or is the exclusive property of MSCI, Inc. and
Standard & Poor’s Financial Services LLC (“S&P”). GICS is a service mark of MSCI and S&P and has been licensed for use by U.S. Bancorp Fund Services, LLC.
The accompanying notes are an integral part of these financial statements.
23
SCHARF MULTI-ASSET OPPORTUNITY FUND
SCHEDULE OF INVESTMENTS at September 30, 2021
|
Shares
|
COMMON STOCKS – 66.57%
|
Value
|
|||||
|
Aerospace and Defense – 2.51%
|
|||||||
|
3,675
|
Lockheed Martin Corp.
|
$
|
1,268,242
|
||||
|
Beverages – 1.68%
|
|||||||
|
8,150
|
Heineken N.V. (b)
|
851,535
|
|||||
|
Building Products – 2.75%
|
|||||||
|
25,035
|
Masco Corp.
|
1,390,694
|
|||||
|
Chemicals – 2.98%
|
|||||||
|
48,245
|
Valvoline, Inc.
|
1,504,279
|
|||||
|
Commercial Services & Supplies – 1.39%
|
|||||||
|
18,680
|
Herman Miller, Inc.
|
703,489
|
|||||
|
Construction & Engineering – 0.93%
|
|||||||
|
3,549
|
Jacobs Engineering Group, Inc.
|
470,349
|
|||||
|
Diversified Financial Services – 4.32%
|
|||||||
|
7,999
|
Berkshire Hathaway, Inc. – Class B (a)
|
2,183,247
|
|||||
|
Health Care Providers & Services – 10.47%
|
|||||||
|
21,492
|
Centene Corp. (a)
|
1,339,166
|
|||||
|
20,908
|
CVS Health Corp.
|
1,774,253
|
|||||
|
8,883
|
McKesson Corp.
|
1,771,093
|
|||||
|
2,815
|
Quest Diagnostics, Inc.
|
409,048
|
|||||
|
5,293,560
|
|||||||
|
Hotels, Restaurants & Leisure – 1.33%
|
|||||||
|
126,300
|
Domino’s Pizza Group plc (b)
|
674,240
|
|||||
|
Insurance – 4.99%
|
|||||||
|
1,392
|
Markel Corp. (a)
|
1,663,621
|
|||||
|
9,489
|
Progressive Corp.
|
857,711
|
|||||
|
2,521,332
|
|||||||
|
Interactive Media & Services – 0.94%
|
|||||||
|
3,080
|
Baidu, Inc. – ADR (a)
|
473,550
|
|||||
|
IT Services – 5.09%
|
|||||||
|
15,486
|
Cognizant Technology Solutions Corp. – Class A
|
1,149,216
|
|||||
|
13,129
|
Fiserv, Inc. (a)
|
1,424,496
|
|||||
|
2,573,712
|
|||||||
The accompanying notes are an integral part of these financial statements.
24
SCHARF MULTI-ASSET OPPORTUNITY FUND
SCHEDULE OF INVESTMENTS at September 30, 2021, Continued
|
Shares/
|
|||||||
|
Principal
|
|||||||
|
Amount
|
COMMON STOCKS – 66.57%, Continued
|
Value
|
|||||
|
Media – 6.42%
|
|||||||
|
31,101
|
Comcast Corp. – Class A
|
$
|
1,739,479
|
||||
|
8,714
|
Liberty Broadband Corp. (a)
|
1,504,908
|
|||||
|
3,244,387
|
|||||||
|
Personal Products – 1.78%
|
|||||||
|
16,569
|
Unilever plc – ADR
|
898,371
|
|||||
|
Pharmaceuticals – 5.50%
|
|||||||
|
9,721
|
AstraZeneca plc – ADR
|
583,843
|
|||||
|
7,230
|
Johnson & Johnson
|
1,167,645
|
|||||
|
12,565
|
Novartis AG – ADR
|
1,027,566
|
|||||
|
2,779,054
|
|||||||
|
Road & Rail – 1.15%
|
|||||||
|
2,147
|
Kansas City Southern
|
581,064
|
|||||
|
Software – 8.60%
|
|||||||
|
9,850
|
Microsoft Corp.
|
2,776,912
|
|||||
|
18,038
|
Oracle Corp.
|
1,571,651
|
|||||
|
4,348,563
|
|||||||
|
Specialty Retail – 3.74%
|
|||||||
|
9,040
|
Advance Auto Parts, Inc.
|
1,888,366
|
|||||
|
TOTAL COMMON STOCKS
|
|||||||
|
(Cost $23,466,632)
|
33,648,034
|
||||||
|
PREFERRED STOCKS – 6.62%
|
|||||||
|
Capital Markets – 1.54%
|
|||||||
|
$
|
700,000
|
Charles Schwab Corp. – Series G, 5.375%
|
779,625
|
||||
|
Closed–End Fund – 2.01%
|
|||||||
|
38,400
|
Gabelli Equity Trust, Inc. – Series K, 5.00%
|
1,015,681
|
|||||
|
Technology Hardware,
|
|||||||
|
Storage & Peripherals – 3.07%
|
|||||||
|
26,435
|
Samsung Electronics Co., Ltd. 3.59% (b)
|
1,553,949
|
|||||
|
TOTAL PREFERRED STOCKS
|
|||||||
|
(Cost $2,166,669)
|
3,349,255
|
||||||
The accompanying notes are an integral part of these financial statements.
25
SCHARF MULTI-ASSET OPPORTUNITY FUND
SCHEDULE OF INVESTMENTS at September 30, 2021, Continued
|
Shares
|
REIT – 1.45%
|
Value
|
|||||
|
Equity Real Estate
|
|||||||
|
Investment Trust (REIT) – 1.45%
|
|||||||
|
11,250
|
Realty Income Corp.
|
$
|
729,675
|
||||
|
TOTAL REIT
|
|||||||
|
(Cost $735,778)
|
729,675
|
||||||
|
EXCHANGE-TRADED FUNDS – 4.61%
|
|||||||
|
52,929
|
iShares Silver Trust (a)
|
1,086,103
|
|||||
|
7,558
|
SPDR Gold Shares (a)
|
1,241,175
|
|||||
|
TOTAL EXCHANGE–TRADED FUNDS
|
|||||||
|
(Cost $1,961,065)
|
2,327,278
|
||||||
|
Principal
|
|||||||
|
Amount
|
CORPORATE BONDS – 7.04%
|
||||||
|
Beverages – 0.16%
|
|||||||
|
Keurig Dr. Pepper, Inc.
|
|||||||
|
$
|
76,000
|
4.057%, 5/25/2023
|
80,335
|
||||
|
Biotechnology – 0.30%
|
|||||||
|
AbbVie, Inc.
|
|||||||
|
150,000
|
2.30%, 11/21/2022 (d)
|
153,104
|
|||||
|
Chemicals – 0.11%
|
|||||||
|
DuPont de Nemours, Inc.
|
|||||||
|
50,000
|
4.205%, 11/15/2023
|
53,699
|
|||||
|
Computer and Electronic
|
|||||||
|
Product Manufacturing – 0.19%
|
|||||||
|
Digital Equipment Corp.
|
|||||||
|
89,000
|
7.75%, 4/1/2023
|
96,430
|
|||||
|
Entertainment – 0.34%
|
|||||||
|
Walt Disney Co.
|
|||||||
|
150,000
|
8.875%, 4/26/2023
|
169,884
|
|||||
|
Health Care Providers & Services – 0.30%
|
|||||||
|
McKesson Corp.
|
|||||||
|
150,000
|
2.70%, 12/15/2022
|
153,300
|
|||||
The accompanying notes are an integral part of these financial statements.
26
SCHARF MULTI-ASSET OPPORTUNITY FUND
SCHEDULE OF INVESTMENTS at September 30, 2021, Continued
|
Principal
|
|||||||
|
Amount
|
CORPORATE BONDS – 7.04%, Continued
|
Value
|
|||||
|
Internet & Direct Marketing Retail – 0.64%
|
|||||||
|
Amazon.com, Inc.
|
|||||||
|
$
|
150,000
|
5.20%, 12/3/2025
|
$
|
174,417
|
|||
|
eBay, Inc.
|
|||||||
|
150,000
|
2.60%, 7/15/2022
|
151,860
|
|||||
|
326,277
|
|||||||
|
IT Services – 0.36%
|
|||||||
|
International Business Machines Corp.
|
|||||||
|
150,000
|
7.00%, 10/30/2025
|
184,717
|
|||||
|
Life Sciences Tools & Services – 0.33%
|
|||||||
|
Thermo Fisher Scientific, Inc.
|
|||||||
|
150,000
|
4.133%, 3/25/2025
|
165,038
|
|||||
|
Petroleum and Coal
|
|||||||
|
Products Manufacturing – 1.15%
|
|||||||
|
Murphy Oil USA, Inc.
|
|||||||
|
557,000
|
5.625%, 5/1/2027
|
583,006
|
|||||
|
Pharmaceutical and
|
|||||||
|
Medicine Manufacturing – 0.34%
|
|||||||
|
Wyeth LLC
|
|||||||
|
150,000
|
6.45%, 2/1/2024
|
170,095
|
|||||
|
Road & Rail – 0.54%
|
|||||||
|
Bestfoods, Inc.
|
|||||||
|
150,000
|
7.25%, 12/15/2026
|
194,681
|
|||||
|
Burlington Northern Santa Fe LLC
|
|||||||
|
75,000
|
3.05%, 9/1/2022
|
76,421
|
|||||
|
271,102
|
|||||||
|
Securities and Commodity Contracts
|
|||||||
|
Intermediation and Brokerage – 1.96%
|
|||||||
|
Goldman Sachs Group, Inc.
|
|||||||
|
1,001,000
|
4.00%, (3 Month LIBOR + 0.7675%), 6/1/2043 (c)
|
990,205
|
|||||
|
Specialty Retail – 0.32%
|
|||||||
|
Advance Auto Parts, Inc.
|
|||||||
|
150,000
|
4.50%, 12/1/2023
|
160,359
|
|||||
|
TOTAL CORPORATE BONDS
|
|||||||
|
(Cost $3,254,709)
|
3,557,551
|
||||||
The accompanying notes are an integral part of these financial statements.
27
SCHARF MULTI-ASSET OPPORTUNITY FUND
SCHEDULE OF INVESTMENTS at September 30, 2021, Continued
|
Principal
|
|||||||
|
Amount
|
MUNICIPAL BONDS – 4.20%
|
Value
|
|||||
|
California Health Facilities Financing Authority,
|
|||||||
|
Revenue Bonds, Chinese Hospital Association
|
|||||||
|
$
|
10,000
|
3.00%, 6/1/2024, Series 2012
|
$
|
10,167
|
|||
|
California Health Facilities Financing Authority,
|
|||||||
|
Revenue Bonds, Persons with
|
|||||||
|
Developmental Disabilities
|
|||||||
|
145,000
|
7.875%, 2/1/2026, Series 2011B
|
145,745
|
|||||
|
California State, General Obligation,
|
|||||||
|
Highway Safety, Traffic Reduction,
|
|||||||
|
Air Quality and Port Security Bonds
|
|||||||
|
90,000
|
6.509%, 4/1/2039, Series 2009B
|
90,175
|
|||||
|
California State, General Obligation, Various Purpose
|
|||||||
|
370,000
|
6.65%, 3/1/2022, Series 2010
|
379,780
|
|||||
|
City of New York, General Obligation,
|
|||||||
|
Build America Bonds
|
|||||||
|
75,000
|
5.887%, 12/1/2024
|
86,281
|
|||||
|
35,000
|
5.424%, 3/1/2025
|
40,006
|
|||||
|
Commonwealth of Massachusetts,
|
|||||||
|
Build America Bonds
|
|||||||
|
110,000
|
4.20%, 12/1/2021
|
110,698
|
|||||
|
Dana Point California Community
|
|||||||
|
Facilities Taxable – Series B
|
|||||||
|
120,000
|
1.017%, 9/1/2022
|
120,257
|
|||||
|
San Francisco Bay Area Toll Authority,
|
|||||||
|
Revenue Bonds
|
|||||||
|
100,000
|
2.128%, 4/1/2022
|
100,979
|
|||||
|
100,000
|
2.234%, 4/1/2023
|
102,923
|
|||||
|
75,000
|
6.793%, 4/1/2030
|
92,338
|
|||||
|
Santa Clara Valley Transportation Authority,
|
|||||||
|
Sales Tax Revenue, Build America Bonds
|
|||||||
|
75,000
|
4.899%, 4/1/2022
|
76,691
|
|||||
|
State of California, Build America Bonds
|
|||||||
|
35,000
|
5.70%, 11/1/2021
|
35,147
|
|||||
|
15,000
|
4.988%, 4/1/2039
|
15,975
|
|||||
|
State of Connecticut, Build America Bonds
|
|||||||
|
240,000
|
5.20%, 12/1/2022
|
253,619
|
|||||
|
25,000
|
5.30%, 12/1/2023
|
27,552
|
|||||
The accompanying notes are an integral part of these financial statements.
28
SCHARF MULTI-ASSET OPPORTUNITY FUND
SCHEDULE OF INVESTMENTS at September 30, 2021, Continued
|
Principal
|
|||||||
|
Amount
|
MUNICIPAL BONDS – 4.20%, Continued
|
Value
|
|||||
|
State of Georgia, School Construction Bonds
|
|||||||
|
$
|
15,000
|
4.35%, 2/1/2029
|
$
|
15,655
|
|||
|
State of Hawaii, Build America Bonds, Taxable
|
|||||||
|
25,000
|
5.10%, 2/1/2024
|
27,613
|
|||||
|
State of Oregon, General Obligation,
|
|||||||
|
Board of Higher Educations – Taxable
|
|||||||
|
5,000
|
5.742%, 8/1/2024
|
5,481
|
|||||
|
Toledo City School District, General
|
|||||||
|
Obligation Bond, Taxable
|
|||||||
|
225,000
|
5.00%, 12/1/2024
|
254,083
|
|||||
|
University of California, Build America Bonds
|
|||||||
|
100,000
|
6.296%, 5/15/2050
|
130,625
|
|||||
|
TOTAL MUNICIPAL BONDS
|
|||||||
|
(Cost $2,092,063)
|
2,121,790
|
||||||
|
OTHER SECURITIES – 0.74%
|
|||||||
|
Independent Power and Renewable
|
|||||||
|
Electricity Producers – 0.74%
|
|||||||
|
13,475
|
Tennessee Valley Authority, Series D,
|
||||||
|
PAARS, Power Bond
|
373,797
|
||||||
|
2.134%, (reset annually @ CMT 30 year index average
|
|||||||
|
+ 94 bps if lower than current rate), 6/1/2028 (c)
|
|||||||
|
TOTAL OTHER SECURITIES
|
|||||||
|
(Cost $344,147)
|
373,797
|
||||||
The accompanying notes are an integral part of these financial statements.
29
SCHARF MULTI-ASSET OPPORTUNITY FUND
SCHEDULE OF INVESTMENTS at September 30, 2021, Continued
|
Shares
|
MONEY MARKET FUND – 8.66%
|
||||||
|
4,378,126
|
First American Treasury Obligations
|
||||||
|
Fund, Class Z, 0.01% (e)
|
$
|
4,378,126
|
|||||
|
TOTAL MONEY MARKET FUND
|
|||||||
|
(Cost $4,378,126)
|
4,378,126
|
||||||
|
Total Investments in Securities
|
|||||||
|
(Cost $38,399,189) – 99.89%
|
50,485,506
|
||||||
|
Other Assets in Excess of Liabilities – 0.11%
|
57,075
|
||||||
|
TOTAL NET ASSETS – 100.00%
|
$
|
50,542,581
|
|||||
|
ADR
|
American Depository Receipt
|
|
CMT
|
Constant Maturity
|
|
LIBOR
|
London Interbank Offered Rate
|
|
(a)
|
Non–income producing security.
|
|
(b)
|
Foreign issuer.
|
|
(c)
|
Variable rate security. Rate shown reflects the rate in effect as of September 30, 2021.
|
|
(d)
|
Security purchased within the terms of a private placement memorandum, exempt from registration under Rule 144A of the Securities Act of 1933, as amended, and may be sold only to dealers in the
program or other “qualified institutional buyers.” As of September 30, 2021, the value of these investments was $153,104 or 0.30% of total net assets.
|
|
(e)
|
Rate shown is the 7–day annualized yield as of September 30, 2021.
|
The Global Industry Classification Standard (GICS®) was developed by and/or is the exclusive property of MSCI, Inc. and
Standard & Poor’s Financial Services LLC (“S&P”). GICS is a service mark of MSCI and S&P and has been licensed for use by U.S. Bancorp Fund Services, LLC.
The accompanying notes are an integral part of these financial statements.
30
SCHARF GLOBAL OPPORTUNITY FUND
SCHEDULE OF INVESTMENTS at September 30, 2021
|
Shares
|
COMMON STOCKS – 91.09%
|
Value
|
|||||
|
Aerospace and Defense – 3.57%
|
|||||||
|
2,653
|
Lockheed Martin Corp.
|
$
|
915,550
|
||||
|
Auto Components – 0.17%
|
|||||||
|
10,108
|
Nexen Corp. (b)
|
43,027
|
|||||
|
Automobiles – 3.26%
|
|||||||
|
84,399
|
Porsche Automobil Holding SE – ADR
|
834,706
|
|||||
|
Beverages – 1.61%
|
|||||||
|
3,958
|
Heineken N.V. (b)
|
413,543
|
|||||
|
Building Products – 1.96%
|
|||||||
|
9,026
|
Masco Corp.
|
501,394
|
|||||
|
Chemicals – 1.84%
|
|||||||
|
15,120
|
Valvoline, Inc.
|
471,442
|
|||||
|
Commercial Services & Supplies – 1.95%
|
|||||||
|
13,300
|
Herman Miller, Inc.
|
500,878
|
|||||
|
Diversified Financial Services – 3.81%
|
|||||||
|
3,577
|
Berkshire Hathaway, Inc. – Class B (a)
|
976,306
|
|||||
|
Health Care Providers & Services – 13.43%
|
|||||||
|
16,453
|
Centene Corp. (a)
|
1,025,187
|
|||||
|
16,299
|
CVS Health Corp.
|
1,383,133
|
|||||
|
5,190
|
McKesson Corp.
|
1,034,782
|
|||||
|
3,443,102
|
|||||||
|
Hotels, Restaurants & Leisure – 3.84%
|
|||||||
|
184,655
|
Domino’s Pizza Group plc (b)
|
985,762
|
|||||
|
Household Durables – 3.49%
|
|||||||
|
8,094
|
Sony Corp. – ADR (a)
|
895,035
|
|||||
|
Insurance – 6.35%
|
|||||||
|
46,890
|
AIA Group, Ltd. (b)
|
541,804
|
|||||
|
908
|
Markel Corp. (a)
|
1,085,178
|
|||||
|
1,626,982
|
|||||||
|
Interactive Media & Services – 6.31%
|
|||||||
|
6,622
|
Baidu, Inc. – ADR (a)
|
1,018,133
|
|||||
|
10,135
|
Tencent Holdings, Ltd. (b)
|
600,706
|
|||||
|
1,618,839
|
|||||||
The accompanying notes are an integral part of these financial statements.
31
SCHARF GLOBAL OPPORTUNITY FUND
SCHEDULE OF INVESTMENTS at September 30, 2021, Continued
|
Shares
|
COMMON STOCKS – 91.09%, Continued
|
Value
|
|||||
|
IT Services – 5.12%
|
|||||||
|
7,750
|
Cognizant Technology Solutions Corp. – Class A
|
$
|
575,128
|
||||
|
6,800
|
Fiserv, Inc. (a)
|
737,800
|
|||||
|
1,312,928
|
|||||||
|
Media – 11.73%
|
|||||||
|
15,637
|
Comcast Corp. – Class A
|
874,577
|
|||||
|
120,414
|
Grupo Televisa S.A.B. – ADR
|
1,322,146
|
|||||
|
4,703
|
Liberty Broadband Corp. – Class C (a)
|
812,208
|
|||||
|
3,008,931
|
|||||||
|
Metals & Mining – 3.18%
|
|||||||
|
45,128
|
Barrick Gold Corp. – ADR (b)
|
814,560
|
|||||
|
Personal Products – 2.69%
|
|||||||
|
12,744
|
Unilever plc – ADR
|
690,980
|
|||||
|
Pharmaceuticals – 7.65%
|
|||||||
|
9,488
|
AstraZeneca plc – ADR
|
569,849
|
|||||
|
2,849
|
Johnson & Johnson
|
460,113
|
|||||
|
11,402
|
Novartis AG – ADR
|
932,456
|
|||||
|
1,962,418
|
|||||||
|
Software – 5.09%
|
|||||||
|
1,882
|
Microsoft Corp.
|
530,574
|
|||||
|
8,894
|
Oracle Corp.
|
774,934
|
|||||
|
1,305,508
|
|||||||
|
Specialty Retail – 4.04%
|
|||||||
|
4,955
|
Advance Auto Parts, Inc.
|
1,035,050
|
|||||
|
TOTAL COMMON STOCKS
|
|||||||
|
(Cost $19,015,510)
|
23,356,941
|
||||||
|
PREFERRED STOCKS – 7.14%
|
|||||||
|
Auto Components – 0.38%
|
|||||||
|
14,157
|
Nexen Corp., 3.02% (b)
|
42,029
|
|||||
|
19,025
|
Nexen Tire Corp., 3.72% (b)
|
56,882
|
|||||
|
98,911
|
|||||||
|
Capital Markets – 0.40%
|
|||||||
|
1,800
|
Korea Investment Holdings Co., Ltd., 4.74% (b)
|
101,554
|
|||||
The accompanying notes are an integral part of these financial statements.
32
SCHARF GLOBAL OPPORTUNITY FUND
SCHEDULE OF INVESTMENTS at September 30, 2021, Continued
|
Shares
|
PREFERRED STOCKS – 7.14%, Continued
|
Value
|
|||||
|
Containers & Packaging – 0.06%
|
|||||||
|
5,450
|
NPC, 4.53% (b)
|
$
|
14,569
|
||||
|
Personal Products – 0.26%
|
|||||||
|
1,870
|
AMOREPACIFIC Group, 1.07% (b)
|
30,561
|
|||||
|
65
|
LG Household & Health Care, Ltd., 1.60% (b)
|
35,245
|
|||||
|
65,806
|
|||||||
|
Technology Hardware,
|
|||||||
|
Storage & Peripherals – 6.04%
|
|||||||
|
26,375
|
Samsung Electronics Co., Ltd., 3.59% (b)
|
1,550,422
|
|||||
|
TOTAL PREFERRED STOCKS
|
|||||||
|
(Cost $814,766)
|
1,831,262
|
||||||
|
MONEY MARKET FUND – 3.17%
|
|||||||
|
813,508
|
First American Treasury Obligations
|
||||||
|
Fund, Class Z, 0.01% (c)
|
813,508
|
||||||
|
TOTAL MONEY MARKET FUND
|
|||||||
|
(Cost $813,508)
|
813,508
|
||||||
|
Total Investments in Securities
|
|||||||
|
(Cost $20,643,784) – 101.40%
|
26,001,711
|
||||||
|
Liabilities in Excess of Other Assets – (1.40)%
|
(359,049
|
)
|
|||||
|
TOTAL NET ASSETS – 100.00%
|
$
|
25,642,662
|
|||||
|
ADR
|
American Depository Receipt
|
|
(a)
|
Non–income producing security.
|
|
(b)
|
Foreign issuer.
|
|
(c)
|
Rate shown is the 7–day annualized yield as of September 30, 2021.
|
The Global Industry Classification Standard (GICS®) was developed by and/or is the exclusive property of MSCI, Inc. and
Standard & Poor’s Financial Services LLC (“S&P”). GICS is a service mark of MSCI and S&P and has been licensed for use by U.S. Bancorp Fund Services, LLC.
The accompanying notes are an integral part of these financial statements.
33
SCHARF GLOBAL OPPORTUNITY FUND
SCHEDULE OF INVESTMENTS at September 30, 2021, Continued
|
COUNTRY ALLOCATION
|
|||||
|
Country
|
% of Net Assets
|
||||
|
United States
|
55.5
|
%
|
|||
|
China
|
6.4
|
%
|
|||
|
Republic of Korea
|
6.3
|
%
|
|||
|
United Kingdom
|
6.2
|
%
|
|||
|
Mexico
|
5.2
|
%
|
|||
|
Netherlands
|
4.4
|
%
|
|||
|
Switzerland
|
3.7
|
%
|
|||
|
Japan
|
3.6
|
%
|
|||
|
Germany
|
3.3
|
%
|
|||
|
Canada
|
3.2
|
%
|
|||
|
Hong Kong
|
2.2
|
%
|
|||
|
100.0
|
%
|
||||
The accompanying notes are an integral part of these financial statements.
34
SCHARF ALPHA OPPORTUNITY FUND
SCHEDULE OF INVESTMENTS at September 30, 2021
|
Shares
|
COMMON STOCKS – 96.01%
|
Value
|
|||||
|
Aerospace and Defense – 3.78%
|
|||||||
|
721
|
Lockheed Martin Corp.
|
$
|
248,817
|
||||
|
Beverages – 2.26%
|
|||||||
|
1,423
|
Heineken N.V. (b)
|
148,679
|
|||||
|
Building Products – 3.93%
|
|||||||
|
4,647
|
Masco Corp.
|
258,141
|
|||||
|
Chemicals – 4.23%
|
|||||||
|
8,921
|
Valvoline, Inc.
|
278,157
|
|||||
|
Commercial Services & Supplies – 1.95%
|
|||||||
|
3,400
|
Herman Miller, Inc.
|
128,044
|
|||||
|
Construction & Engineering – 1.04%
|
|||||||
|
517
|
Jacobs Engineering Group, Inc.
|
68,518
|
|||||
|
Diversified Financial Services – 5.98%
|
|||||||
|
1,440
|
Berkshire Hathaway, Inc. – Class B (a) (d)
|
393,033
|
|||||
|
Health Care Providers & Services – 14.74%
|
|||||||
|
3,869
|
Centene Corp. (a)
|
241,077
|
|||||
|
3,875
|
CVS Health Corp. (d)
|
328,833
|
|||||
|
1,626
|
McKesson Corp. (d)
|
324,192
|
|||||
|
509
|
Quest Diagnostics, Inc.
|
73,963
|
|||||
|
968,065
|
|||||||
|
Insurance – 7.09%
|
|||||||
|
253
|
Markel Corp. (a)
|
302,368
|
|||||
|
1,803
|
Progressive Corp.
|
162,973
|
|||||
|
465,341
|
|||||||
|
Interactive Media & Services – 1.79%
|
|||||||
|
766
|
Baidu, Inc. – ADR (a)
|
117,773
|
|||||
|
IT Services – 6.91%
|
|||||||
|
2,780
|
Cognizant Technology Solutions Corp. – Class A (d)
|
206,304
|
|||||
|
2,280
|
Fiserv, Inc. (a)
|
247,380
|
|||||
|
453,684
|
|||||||
|
Media – 9.30%
|
|||||||
|
5,985
|
Comcast Corp. – Class A (d)
|
334,740
|
|||||
|
1,600
|
Liberty Broadband Corp. (a)
|
276,320
|
|||||
|
611,060
|
|||||||
The accompanying notes are an integral part of these financial statements.
35
SCHARF ALPHA OPPORTUNITY FUND
SCHEDULE OF INVESTMENTS at September 30, 2021, Continued
|
Shares
|
COMMON STOCKS – 96.01%, Continued
|
Value
|
|||||
|
Personal Products – 2.59%
|
|||||||
|
3,141
|
Unilever plc – ADR
|
$
|
170,305
|
||||
|
Pharmaceuticals – 7.82%
|
|||||||
|
1,676
|
AstraZeneca plc – ADR
|
100,661
|
|||||
|
1,394
|
Johnson & Johnson
|
225,131
|
|||||
|
2,293
|
Novartis AG – ADR (d)
|
187,521
|
|||||
|
513,313
|
|||||||
|
Road & Rail – 1.47%
|
|||||||
|
356
|
Kansas City Southern (d)
|
96,348
|
|||||
|
Software – 12.48%
|
|||||||
|
1,820
|
Microsoft Corp. (d)
|
513,093
|
|||||
|
3,531
|
Oracle Corp. (d)
|
307,656
|
|||||
|
820,749
|
|||||||
|
Specialty Retail – 5.15%
|
|||||||
|
1,620
|
Advance Auto Parts, Inc. (d)
|
338,402
|
|||||
|
Technology Hardware,
|
|||||||
|
Storage & Peripherals – 3.50%
|
|||||||
|
147
|
Samsung Electronics Co., Ltd. – ADR
|
229,688
|
|||||
|
TOTAL COMMON STOCKS
|
|||||||
|
(Cost $4,459,406)
|
6,308,117
|
||||||
|
EXCHANGE–TRADED FUND – 0.78%
|
|||||||
|
2,500
|
iShares Silver Trust (a)
|
51,300
|
|||||
|
TOTAL EXCHANGE–TRADED FUND
|
|||||||
|
(Cost $41,590)
|
51,300
|
||||||
The accompanying notes are an integral part of these financial statements.
36
SCHARF ALPHA OPPORTUNITY FUND
SCHEDULE OF INVESTMENTS at September 30, 2021, Continued
|
Shares
|
MONEY MARKET FUND – 1.47%
|
Value
|
|||||
|
96,305
|
First American Treasury Obligations
|
||||||
|
Fund, Class Z, 0.01% (c)
|
$
|
96,305
|
|||||
|
TOTAL MONEY MARKET FUND
|
|||||||
|
(Cost $96,305)
|
96,305
|
||||||
|
Total Investments in Securities
|
|||||||
|
(Cost $4,597,301) – 98.26%
|
6,455,722
|
||||||
|
Other Assets in Excess of Liabilities – 1.74%
|
114,206
|
||||||
|
TOTAL NET ASSETS – 100.00%
|
$
|
6,569,928
|
|||||
|
ADR
|
American Depository Receipt
|
|
(a)
|
Non–income producing security.
|
|
(b)
|
Foreign issuer.
|
|
(c)
|
Rate shown is the 7–day annualized yield as of September 30, 2021.
|
|
(d)
|
All or a portion of the security has been segregated for open short positions.
|
SCHEDULE OF SECURITIES SOLD SHORT at September 30, 2021
|
Shares
|
SECURITIES SOLD SHORT – 39.73%
|
Value
|
|||||
|
Exchange–Traded Funds – 39.73%
|
|||||||
|
4,251
|
Invesco QQQ Trust Series 1
|
$
|
1,521,688
|
||||
|
2,536
|
SPDR S&P 500 ETF Trust
|
1,088,299
|
|||||
|
TOTAL SECURITIES SOLD SHORT
|
|||||||
|
(Proceeds $1,577,007)
|
$
|
2,609,987
|
|||||
|
ETF
|
Exchange–Traded Fund
|
The Global Industry Classification Standard (GICS®) was developed by and/or is the exclusive property of MSCI, Inc. and
Standard & Poor’s Financial Services LLC (“S&P”). GICS is a service mark of MSCI and S&P and has been licensed for use by U.S. Bancorp Fund Services, LLC.
The accompanying notes are an integral part of these financial statements.
37
SCHARF FUNDS
STATEMENTS OF ASSETS AND LIABILITIES at September 30, 2021
|
Scharf Multi-Asset
|
||||||||
|
Scharf Fund
|
Opportunity Fund
|
|||||||
|
ASSETS
|
||||||||
|
Investments in securities, at value (identified cost
|
||||||||
|
$280,986,572 and $38,399,189, respectively)
|
$
|
400,091,774
|
$
|
50,485,506
|
||||
|
Receivables:
|
||||||||
|
Fund shares issued
|
396,143
|
—
|
||||||
|
Dividends and interest
|
251,322
|
104,023
|
||||||
|
Dividend tax reclaim
|
422,093
|
29,055
|
||||||
|
Prepaid expenses
|
18,263
|
9,717
|
||||||
|
Total assets
|
$
|
401,179,595
|
$
|
50,628,301
|
||||
|
LIABILITIES
|
||||||||
|
Payables:
|
||||||||
|
Fund shares redeemed
|
133,217
|
—
|
||||||
|
Advisory fees
|
236,649
|
22,111
|
||||||
|
Administration and fund accounting fees
|
35,944
|
10,647
|
||||||
|
Audit fees
|
22,500
|
22,500
|
||||||
|
12b-1 distribution fees
|
46,844
|
2,985
|
||||||
|
Chief Compliance Officer fee
|
1,875
|
1,875
|
||||||
|
Custody fees
|
6,545
|
3,484
|
||||||
|
Legal fees
|
553
|
1,703
|
||||||
|
Shareholder reporting
|
8,759
|
1,228
|
||||||
|
Shareholder servicing fees
|
63,331
|
16,023
|
||||||
|
Transfer agent fees and expenses
|
5,943
|
2,503
|
||||||
|
Accrued other expenses
|
1,263
|
661
|
||||||
|
Total liabilities
|
563,423
|
85,720
|
||||||
|
NET ASSETS
|
$
|
400,616,172
|
$
|
50,542,581
|
||||
|
CALCULATION OF NET ASSET VALUE PER SHARE
|
||||||||
|
Institutional Shares
|
||||||||
|
Net assets applicable to shares outstanding
|
$
|
328,885,515
|
$
|
43,737,881
|
||||
|
Shares issued and outstanding [unlimited number of shares
|
||||||||
|
(par value$0.01) authorized]
|
6,003,213
|
1,146,830
|
||||||
|
Net asset value, offering and redemption price per share
|
$
|
54.78
|
$
|
38.14
|
||||
|
Retail Shares
|
||||||||
|
Net assets applicable to shares outstanding
|
$
|
71,730,657
|
$
|
6,804,700
|
||||
|
Shares issued and outstanding [unlimited number of shares
|
||||||||
|
(par value $0.01) authorized]
|
1,317,538
|
178,982
|
||||||
|
Net asset value, offering and redemption price per share
|
$
|
54.44
|
$
|
$38.02
|
||||
|
COMPOSITION OF NET ASSETS
|
||||||||
|
Paid–in capital
|
$
|
247,421,582
|
$
|
34,347,311
|
||||
|
Total distributable earnings
|
153,194,590
|
16,195,270
|
||||||
|
Net assets
|
$
|
400,616,172
|
$
|
50,542,581
|
||||
The accompanying notes are an integral part of these financial statements.
38
SCHARF FUNDS
STATEMENTS OF ASSETS AND LIABILITIES at September 30, 2021
|
Scharf Global
|
Scharf Alpha
|
|||||||
|
Opportunity Fund
|
Opportunity Fund
|
|||||||
|
ASSETS
|
||||||||
|
Investments in securities, at value (identified cost
|
||||||||
|
$20,643,784 and $4,597,301, respectively)
|
$
|
26,001,711
|
$
|
6,455,722
|
||||
|
Cash
|
—
|
1,382
|
||||||
|
Deposits at broker for short securities
|
—
|
2,733,380
|
||||||
|
Receivables:
|
||||||||
|
Dividends and interest
|
15,660
|
3,215
|
||||||
|
Dividend tax reclaim
|
12,241
|
9,641
|
||||||
|
Due from Adviser (Note 4)
|
1,568
|
9,157
|
||||||
|
Prepaid expenses
|
16,229
|
13,069
|
||||||
|
Total assets
|
26,047,409
|
9,225,566
|
||||||
|
LIABILITIES
|
||||||||
|
Securities sold short (proceeds $0
|
||||||||
|
and $1,577,007, respectively)
|
—
|
2,609,987
|
||||||
|
Payables:
|
||||||||
|
Dividends on short positions
|
—
|
5,381
|
||||||
|
Fund shares redeemed
|
18,125
|
—
|
||||||
|
Investments purchased
|
320,823
|
—
|
||||||
|
Audit fees
|
21,000
|
21,000
|
||||||
|
Shareholder servicing fees
|
10,539
|
1,870
|
||||||
|
12b-1 distribution fees
|
15,638
|
—
|
||||||
|
Administration and fund accounting fees
|
7,140
|
7,031
|
||||||
|
Legal fees
|
1,853
|
1,703
|
||||||
|
Chief Compliance Officer fee
|
1,875
|
1,874
|
||||||
|
Custody fees
|
4,385
|
3,646
|
||||||
|
Transfer agent fees and expenses
|
1,351
|
1,374
|
||||||
|
Shareholder reporting
|
565
|
759
|
||||||
|
Accrued other expenses
|
1,453
|
1,013
|
||||||
|
Total liabilities
|
404,747
|
2,655,638
|
||||||
|
NET ASSETS
|
$
|
25,642,662
|
$
|
6,569,928
|
||||
|
CALCULATION OF NET ASSET VALUE PER SHARE
|
||||||||
|
Retail Shares
|
||||||||
|
Net assets applicable to shares outstanding
|
$
|
25,642,662
|
$
|
6,569,928
|
||||
|
Shares issued and outstanding [unlimited number of shares
|
||||||||
|
(par value $0.01) authorized]
|
707,436
|
253,947
|
||||||
|
Net asset value, offering and
|
||||||||
|
redemption price per share
|
$
|
36.25
|
$
|
$25.87
|
||||
|
COMPOSITION OF NET ASSETS
|
||||||||
|
Paid–in capital
|
$
|
17,739,197
|
$
|
5,568,384
|
||||
|
Total distributable earnings
|
7,903,465
|
1,001,544
|
||||||
|
Net assets
|
$
|
25,642,662
|
$
|
6,569,928
|
||||
The accompanying notes are an integral part of these financial statements.
39
SCHARF FUNDS
STATEMENTS OF OPERATIONS For the Year Ended September 30, 2021
|
Scharf Multi-Asset
|
||||||||
|
Scharf Fund
|
Opportunity Fund
|
|||||||
|
INVESTMENT INCOME
|
||||||||
|
Income
|
||||||||
|
Dividends (net of foreign tax withheld and issuance
|
||||||||
|
fees of $349,236 and $35,271, respectively)
|
$
|
6,230,707
|
$
|
691,933
|
||||
|
Interest
|
951
|
190,591
|
||||||
|
Total income
|
6,231,658
|
882,524
|
||||||
|
Expenses
|
||||||||
|
Advisory fees (Note 4)
|
3,040,492
|
501,698
|
||||||
|
Shareholder servicing fees – Institutional Class (Note 6)
|
218,970
|
39,971
|
||||||
|
Shareholder servicing fees – Retail Class (Note 6)
|
71,509
|
7,407
|
||||||
|
12b-1 distribution fees – Retail Class (Note 5)
|
179,154
|
18,516
|
||||||
|
Administration and fund accounting fees (Note 4)
|
169,872
|
62,712
|
||||||
|
Custody fees (Note 4)
|
38,255
|
13,656
|
||||||
|
Registration fees
|
37,197
|
31,508
|
||||||
|
Transfer agent fees and expenses (Note 4)
|
35,879
|
14,498
|
||||||
|
Audit fees
|
22,501
|
22,501
|
||||||
|
Trustee fees and expenses
|
17,078
|
14,141
|
||||||
|
Reports to shareholders
|
15,437
|
5,019
|
||||||
|
Chief Compliance Officer fee (Note 4)
|
10,687
|
10,688
|
||||||
|
Miscellaneous expenses
|
10,324
|
6,356
|
||||||
|
Legal fees
|
6,413
|
6,954
|
||||||
|
Insurance expense
|
6,049
|
2,596
|
||||||
|
Interest expense
|
672
|
—
|
||||||
|
Total expenses
|
3,880,489
|
758,221
|
||||||
|
Less: advisory fee waiver (Note 4)
|
(331,385
|
)
|
(246,375
|
)
|
||||
|
Net expenses
|
3,549,104
|
511,846
|
||||||
|
Net investment income
|
2,682,554
|
370,678
|
||||||
|
REALIZED AND UNREALIZED GAIN/(LOSS) ON
|
||||||||
|
INVESTMENTS AND FOREIGN CURRENCY
|
||||||||
|
Net realized gain/(loss) on:
|
||||||||
|
Investments
|
38,414,239
|
4,426,537
|
||||||
|
Foreign currency
|
(8,212
|
)
|
(957
|
)
|
||||
|
Net change in unrealized appreciation/(depreciation) on:
|
||||||||
|
Investments
|
37,547,732
|
2,755,260
|
||||||
|
Foreign currency
|
(4,092
|
)
|
(386
|
)
|
||||
|
Net realized and unrealized gain on
|
||||||||
|
investments and foreign currency
|
75,949,667
|
7,180,454
|
||||||
|
Net Increase in Net Assets
|
||||||||
|
Resulting from Operations
|
$
|
78,632,221
|
$
|
7,551,132
|
||||
The accompanying notes are an integral part of these financial statements.
40
SCHARF FUNDS
STATEMENTS OF OPERATIONS For the Year Ended September 30, 2021
|
Scharf Global
|
Scharf Alpha
|
|||||||
|
Opportunity Fund
|
Opportunity Fund
|
|||||||
|
INVESTMENT INCOME
|
||||||||
|
Income
|
||||||||
|
Dividends (net of foreign tax withheld and issuance
|
||||||||
|
fees of $45,252 and $5,037, respectively)
|
$
|
400,831
|
$
|
108,866
|
||||
|
Interest
|
43
|
11
|
||||||
|
Total income
|
400,874
|
108,877
|
||||||
|
Expenses
|
||||||||
|
Advisory fees (Note 4)
|
235,711
|
69,640
|
||||||
|
Administration and fund accounting fees (Note 4)
|
41,641
|
41,173
|
||||||
|
12b-1 distribution fees – Retail Class (Note 5)
|
33,714
|
11,070
|
||||||
|
Audit fees
|
21,001
|
21,001
|
||||||
|
Registration fees
|
19,451
|
19,753
|
||||||
|
Shareholder servicing fees – Retail Class (Note 6)
|
19,132
|
5,033
|
||||||
|
Custody fees (Note 4)
|
14,312
|
13,616
|
||||||
|
Trustee fees and expenses
|
13,887
|
13,778
|
||||||
|
Chief Compliance Officer fee (Note 4)
|
10,687
|
10,687
|
||||||
|
Miscellaneous expenses
|
7,914
|
12,133
|
||||||
|
Transfer agent fees and expenses (Note 4)
|
7,713
|
6,399
|
||||||
|
Legal fees
|
7,404
|
6,954
|
||||||
|
Reports to shareholders
|
4,289
|
3,793
|
||||||
|
Insurance expense
|
2,321
|
2,246
|
||||||
|
Interest expense
|
125
|
175
|
||||||
|
Total expenses before dividends
|
||||||||
|
on short positions
|
439,302
|
237,451
|
||||||
|
Dividends on short positions
|
—
|
71,761
|
||||||
|
Total expenses before advisory fee waiver
|
||||||||
|
and expense reimbursement
|
439,302
|
309,212
|
||||||
|
Less: advisory fee waiver and
|
||||||||
|
expense reimbursement (Note 4)
|
(257,887
|
)
|
(175,626
|
)
|
||||
|
Net expenses
|
181,415
|
133,586
|
||||||
|
Net investment income/(loss)
|
219,459
|
(24,709
|
)
|
|||||
|
REALIZED AND UNREALIZED GAIN/(LOSS)
|
||||||||
|
ON INVESTMENTS, FOREIGN CURRENCY
|
||||||||
|
AND SECURITIES SOLD SHORT
|
||||||||
|
Net realized gain/(loss) on:
|
||||||||
|
Investments
|
2,401,682
|
1,755,459
|
||||||
|
Foreign currency
|
(1,195
|
)
|
(34
|
)
|
||||
|
Securities sold short
|
—
|
(1,080,419
|
)
|
|||||
|
Net change in unrealized appreciation/(depreciation) on:
|
||||||||
|
Investments
|
2,363,420
|
(402,922
|
)
|
|||||
|
Foreign currency
|
(242
|
)
|
(112
|
)
|
||||
|
Securities sold short
|
—
|
303,194
|
||||||
|
Net realized and unrealized gain on investments,
|
||||||||
|
foreign currency and securities sold short
|
4,763,665
|
575,166
|
||||||
|
Net Increase in Net Assets
|
||||||||
|
Resulting from Operations
|
$
|
4,983,124
|
$
|
550,457
|
||||
The accompanying notes are an integral part of these financial statements.
41
SCHARF FUND
STATEMENTS OF CHANGES IN NET ASSETS
|
Year Ended
|
Year Ended
|
|||||||
|
September 30, 2021
|
September 30, 2020
|
|||||||
|
INCREASE/(DECREASE) IN NET ASSETS FROM:
|
||||||||
|
OPERATIONS
|
||||||||
|
Net investment income
|
$
|
2,682,554
|
$
|
2,491,530
|
||||
|
Net realized gain/(loss) from:
|
||||||||
|
Investments
|
38,414,239
|
14,383,281
|
||||||
|
Foreign currency
|
(8,212
|
)
|
(4,770
|
)
|
||||
|
Net change in unrealized appreciation/(depreciation) on:
|
||||||||
|
Investments
|
37,547,732
|
9,038,828
|
||||||
|
Foreign currency
|
(4,092
|
)
|
6,248
|
|||||
|
Net increase in net assets resulting from operations
|
78,632,221
|
25,915,117
|
||||||
|
DISTRIBUTIONS TO SHAREHOLDERS
|
||||||||
|
Net dividends and distributions to shareholders –
|
||||||||
|
Institutional Class shares
|
(10,685,640
|
)
|
(23,633,870
|
)
|
||||
|
Net dividends and distributions to shareholders –
|
||||||||
|
Retail Class shares
|
(2,293,886
|
)
|
(5,863,332
|
)
|
||||
|
Total distributions to shareholders
|
(12,979,526
|
)
|
(29,497,202
|
)
|
||||
|
CAPITAL SHARE TRANSACTIONS
|
||||||||
|
Net decrease in net assets derived
|
||||||||
|
from net change in outstanding shares (a)
|
(14,313,106
|
)
|
(17,878,968
|
)
|
||||
|
Total increase/(decrease) in net assets
|
51,339,589
|
(21,461,053
|
)
|
|||||
|
NET ASSETS
|
||||||||
|
Beginning of year
|
349,276,583
|
370,737,636
|
||||||
|
End of year
|
$
|
400,616,172
|
$
|
349,276,583
|
||||
The accompanying notes are an integral part of these financial statements.
42
SCHARF FUND
STATEMENTS OF CHANGES IN NET ASSETS, Continued
|
(a)
|
A summary of share transactions is as follows:
|
Institutional Class
|
Year Ended
|
Year Ended
|
||||||||||||||||
|
September 30, 2021
|
September 30, 2020
|
||||||||||||||||
|
Shares
|
Paid-in Capital
|
Shares
|
Paid-in Capital
|
||||||||||||||
|
Shares sold
|
802,759
|
$
|
42,343,492
|
1,167,709
|
$
|
49,569,097
|
|||||||||||
|
Shares issued on
|
|||||||||||||||||
|
reinvestments of distributions
|
222,392
|
10,645,906
|
517,328
|
23,455,656
|
|||||||||||||
|
Shares redeemed*
|
(1,166,051
|
)
|
(60,339,692
|
)
|
(1,990,615
|
)
|
(86,112,244
|
)
|
|||||||||
|
Net decrease
|
(140,900
|
)
|
$
|
(7,350,294
|
)
|
(305,578
|
)
|
$
|
(13,087,491
|
)
|
|||||||
|
* Net of redemption fees of
|
$
|
3,643
|
$
|
5,833
|
|||||||||||||
Retail Class
|
Year Ended
|
Year Ended
|
||||||||||||||||
|
September 30, 2021
|
September 30, 2020
|
||||||||||||||||
|
Shares
|
Paid-in Capital
|
Shares
|
Paid-in Capital
|
||||||||||||||
|
Shares sold
|
28,398
|
$
|
1,492,831
|
62,738
|
$
|
2,610,158
|
|||||||||||
|
Shares issued on
|
|||||||||||||||||
|
reinvestments of distributions
|
48,096
|
2,293,220
|
129,801
|
5,861,794
|
|||||||||||||
|
Shares redeemed*
|
(213,599
|
)
|
(10,748,863
|
)
|
(320,187
|
)
|
(13,263,429
|
)
|
|||||||||
|
Net decrease
|
(137,105
|
)
|
$
|
(6,962,812
|
)
|
(127,648
|
)
|
$
|
(4,791,477
|
)
|
|||||||
|
* Net of redemption fees of
|
$
|
824
|
$
|
6,027
|
|||||||||||||
The accompanying notes are an integral part of these financial statements.
43
SCHARF MULTI-ASSET OPPORTUNITY FUND
STATEMENTS OF CHANGES IN NET ASSETS
|
Year Ended
|
Year Ended
|
|||||||
|
September 30, 2021
|
September 30, 2020
|
|||||||
|
INCREASE/(DECREASE) IN NET ASSETS FROM:
|
||||||||
|
OPERATIONS
|
||||||||
|
Net investment income
|
$
|
370,678
|
$
|
442,548
|
||||
|
Net realized gain/(loss) from:
|
||||||||
|
Investments
|
4,426,537
|
2,222,942
|
||||||
|
Foreign currency
|
(957
|
)
|
(295
|
)
|
||||
|
Net change in unrealized appreciation/(depreciation) on:
|
||||||||
|
Investments
|
2,755,260
|
1,393,457
|
||||||
|
Foreign currency
|
(386
|
)
|
591
|
|||||
|
Net increase in net assets resulting from operations
|
7,551,132
|
4,059,243
|
||||||
|
DISTRIBUTIONS TO SHAREHOLDERS
|
||||||||
|
Net dividends and distributions to shareholders –
|
||||||||
|
Institutional Class
|
(1,548,665
|
)
|
(2,923,716
|
)
|
||||
|
Net dividends and distributions to shareholders –
|
||||||||
|
Retail Class
|
(258,219
|
)
|
(403,881
|
)
|
||||
|
Total distributions to shareholders
|
(1,806,884
|
)
|
(3,327,597
|
)
|
||||
|
CAPITAL SHARE TRANSACTIONS
|
||||||||
|
Net decrease in net assets derived
|
||||||||
|
from net change in outstanding shares (a)
|
(3,010,853
|
)
|
(2,661,637
|
)
|
||||
|
Total increase/(decrease) in net assets
|
2,733,395
|
(1,929,991
|
)
|
|||||
|
NET ASSETS
|
||||||||
|
Beginning of year
|
47,809,186
|
49,739,177
|
||||||
|
End of year
|
$
|
50,542,581
|
$
|
47,809,186
|
||||
The accompanying notes are an integral part of these financial statements.
44
SCHARF MULTI-ASSET OPPORTUNITY FUND
STATEMENTS OF CHANGES IN NET ASSETS, Continued
|
(a)
|
A summary of share transactions is as follows:
|
Institutional Class
|
Year Ended
|
Year Ended
|
||||||||||||||||
|
September 30, 2021
|
September 30, 2020
|
||||||||||||||||
|
Shares
|
Paid-in Capital
|
Shares
|
Paid-in Capital
|
||||||||||||||
|
Shares sold
|
60,444
|
$
|
2,297,678
|
123,817
|
$
|
4,061,436
|
|||||||||||
|
Shares issued on
|
|||||||||||||||||
|
reinvestments of distributions
|
44,293
|
1,532,089
|
87,938
|
2,894,053
|
|||||||||||||
|
Shares redeemed
|
(147,401
|
)
|
(5,430,203
|
)
|
(329,741
|
)
|
(11,023,151
|
)
|
|||||||||
|
Net decrease
|
(42,664
|
)
|
$
|
(1,600,436
|
)
|
(117,986
|
)
|
$
|
(4,067,662
|
)
|
|||||||
Retail Class
|
Year Ended
|
Year Ended
|
||||||||||||||||
|
September 30, 2021
|
September 30, 2020
|
||||||||||||||||
|
Shares
|
Paid-in Capital
|
Shares
|
Paid-in Capital
|
||||||||||||||
|
Shares sold
|
13,527
|
$
|
490,410
|
76,772
|
$
|
2,508,843
|
|||||||||||
|
Shares issued on
|
|||||||||||||||||
|
reinvestments of distributions
|
7,472
|
258,218
|
12,280
|
403,882
|
|||||||||||||
|
Shares redeemed*
|
(59,037
|
)
|
(2,159,045
|
)
|
(47,547
|
)
|
(1,506,700
|
)
|
|||||||||
|
Net increase/(decrease)
|
(38,038
|
)
|
$
|
(1,410,417
|
)
|
41,505
|
$
|
1,406,025
|
|||||||||
|
* Net of redemption fees of
|
$
|
—
|
$
|
756
|
|||||||||||||
The accompanying notes are an integral part of these financial statements.
45
SCHARF GLOBAL OPPORTUNITY FUND
STATEMENTS OF CHANGES IN NET ASSETS
|
Year Ended
|
Year Ended
|
|||||||
|
September 30, 2021
|
September 30, 2020
|
|||||||
|
INCREASE/(DECREASE) IN NET ASSETS FROM:
|
||||||||
|
OPERATIONS
|
||||||||
|
Net investment income
|
$
|
219,459
|
$
|
157,417
|
||||
|
Net realized gain/(loss) from:
|
||||||||
|
Investments
|
2,401,682
|
506,696
|
||||||
|
Foreign currency
|
(1,195
|
)
|
(1,669
|
)
|
||||
|
Net change in unrealized appreciation/(depreciation) on:
|
||||||||
|
Investments
|
2,363,420
|
573,658
|
||||||
|
Foreign currency
|
(242
|
)
|
98
|
|||||
|
Net increase in net assets resulting from operations
|
4,983,124
|
1,236,200
|
||||||
|
DISTRIBUTIONS TO SHAREHOLDERS
|
||||||||
|
Net dividends and distributions to shareholders
|
(448,307
|
)
|
(1,748,951
|
)
|
||||
|
Total distributions to shareholders
|
(448,307
|
)
|
(1,748,951
|
)
|
||||
|
CAPITAL SHARE TRANSACTIONS
|
||||||||
|
Net increase in net assets derived
|
||||||||
|
from net change in outstanding shares (a)
|
2,401,597
|
1,456,109
|
||||||
|
Total increase in net assets
|
6,936,414
|
943,358
|
||||||
|
NET ASSETS
|
||||||||
|
Beginning of year
|
18,706,248
|
17,762,890
|
||||||
|
End of year
|
$
|
25,642,662
|
$
|
18,706,248
|
||||
|
(a)
|
A summary of share transactions is as follows:
|
|
Year Ended
|
Year Ended
|
||||||||||||||||
|
September 30, 2021
|
September 30, 2020
|
||||||||||||||||
|
Shares
|
Paid-in Capital
|
Shares
|
Paid-in Capital
|
||||||||||||||
|
Shares sold
|
127,274
|
$
|
4,352,999
|
155,180
|
$
|
4,276,959
|
|||||||||||
|
Shares issued on
|
|||||||||||||||||
|
reinvestments of distributions
|
14,227
|
448,307
|
58,221
|
1,748,951
|
|||||||||||||
|
Shares redeemed
|
(72,125
|
)
|
(2,399,709
|
)
|
(167,736
|
)
|
(4,569,801
|
)
|
|||||||||
|
Net increase
|
69,376
|
$
|
2,401,597
|
45,665
|
$
|
1,456,109
|
|||||||||||
The accompanying notes are an integral part of these financial statements.
46
SCHARF ALPHA OPPORTUNITY FUND
STATEMENTS OF CHANGES IN NET ASSETS
|
Year Ended
|
Year Ended
|
|||||||
|
September 30, 2021
|
September 30, 2020
|
|||||||
|
INCREASE/(DECREASE) IN NET ASSETS FROM:
|
||||||||
|
OPERATIONS
|
||||||||
|
Net investment income/(loss)
|
$
|
(24,709
|
)
|
$
|
5,709
|
|||
|
Net realized gain/(loss) from:
|
||||||||
|
Investments
|
1,755,459
|
1,800,924
|
||||||
|
Foreign currency
|
(34
|
)
|
(188
|
)
|
||||
|
Securities sold short
|
(1,080,419
|
)
|
(1,996,291
|
)
|
||||
|
Net change in unrealized appreciation/(depreciation) on:
|
||||||||
|
Investments
|
(402,922
|
)
|
(750,774
|
)
|
||||
|
Foreign currency
|
(112
|
)
|
239
|
|||||
|
Securities sold short
|
303,194
|
10,493
|
||||||
|
Net increase/(decrease) in net assets
|
||||||||
|
resulting from operations
|
550,457
|
(929,888
|
)
|
|||||
|
DISTRIBUTIONS TO SHAREHOLDERS
|
||||||||
|
Net dividends and distributions to shareholders
|
(5,521
|
)
|
(60,850
|
)
|
||||
|
Total distributions to shareholders
|
(5,521
|
)
|
(60,850
|
)
|
||||
|
CAPITAL SHARE TRANSACTIONS
|
||||||||
|
Net decrease in net assets derived
|
||||||||
|
from net change in outstanding shares (a)
|
(3,831,396
|
)
|
(7,613,141
|
)
|
||||
|
Total decrease in net assets
|
(3,286,460
|
)
|
(8,603,879
|
)
|
||||
|
NET ASSETS
|
||||||||
|
Beginning of year
|
9,856,388
|
18,460,267
|
||||||
|
End of year
|
$
|
6,569,928
|
$
|
9,856,388
|
||||
|
(a)
|
A summary of share transactions is as follows:
|
|
Year Ended
|
Year Ended
|
||||||||||||||||
|
September 30, 2021
|
September 30, 2020
|
||||||||||||||||
|
Shares
|
Paid-in Capital
|
Shares
|
Paid-in Capital
|
||||||||||||||
|
Shares sold
|
4,275
|
$
|
116,285
|
10,574
|
$
|
265,356
|
|||||||||||
|
Shares issued on
|
|||||||||||||||||
|
reinvestments of distributions
|
226
|
5,521
|
1,797
|
46,337
|
|||||||||||||
|
Shares redeemed
|
(163,878
|
)
|
(3,953,202
|
)
|
(325,085
|
)
|
(7,924,834
|
)
|
|||||||||
|
Net decrease
|
(159,377
|
)
|
$
|
(3,831,396
|
)
|
(312,714
|
)
|
$
|
(7,613,141
|
)
|
|||||||
The accompanying notes are an integral part of these financial statements.
47
SCHARF ALPHA OPPORTUNITY FUND
STATEMENT OF CASH FLOWS For the Year Ended September 30, 2021
|
Increase/(decrease) in cash —
|
||||
|
Cash flows from operating activities:
|
||||
|
Net increase in net assets from operations
|
$
|
550,457
|
||
|
Adjustments to reconcile net increase/(decrease) in
|
||||
|
net assets from operations to net cash provided by operating activities:
|
||||
|
Purchases of investment securities
|
(2,126,880
|
)
|
||
|
Proceeds for sales of investment securities
|
6,613,890
|
|||
|
Proceeds on securities sold short
|
213,826
|
|||
|
Closed short sale transactions
|
(3,057,538
|
)
|
||
|
Proceeds for short-term investments, net
|
148,275
|
|||
|
Increase in dividends and interest receivable
|
(2,138
|
)
|
||
|
Decrease in due from Adviser
|
82
|
|||
|
Increase in prepaid expenses and other assets
|
(6,444
|
)
|
||
|
Decrease in payable for securities purchased
|
(17,246
|
)
|
||
|
Decrease in payable for dividends on short positions
|
(2,586
|
)
|
||
|
Increase in accrued administration fees
|
105
|
|||
|
Decrease in 12b-1 distribution and service fees
|
(3,541
|
)
|
||
|
Increase in compliance fees
|
374
|
|||
|
Increase in custody fees
|
638
|
|||
|
Decrease in transfer agent fees and expenses
|
(454
|
)
|
||
|
Decrease in other accrued expenses
|
(366
|
)
|
||
|
Unrealized depreciation on securities
|
99,728
|
|||
|
Net realized gain on investments
|
(675,040
|
)
|
||
|
Proceeds received through merger
|
47,341
|
|||
|
Net cash provided by operating activizes
|
1,782,483
|
|||
|
Cash flows from financing activities:
|
||||
|
Proceeds from shares sold
|
116,285
|
|||
|
Payment on shares redeemed
|
(3,953,202
|
)
|
||
|
Net cash used in financing activizes
|
(3,836,917
|
)
|
||
|
Net decrease in cash
|
(2,054,434
|
)
|
||
|
Cash and deposits held at broker:
|
||||
|
Beginning balance
|
4,789,196
|
|||
|
Ending balance
|
$
|
2,734,762
|
||
|
Supplemental information:
|
||||
|
Non-cash financing activities not included herein consists of dividend
|
||||
|
reinvestment of dividends and distributions
|
$
|
5,521
|
||
|
Cash paid for interest
|
$
|
175
|
||
The accompanying notes are an integral part of these financial statements.
48
SCHARF FUND
FINANCIAL HIGHLIGHTS For a share outstanding throughout each year
Institutional Class
|
Year Ended September 30,
|
||||||||||||||||||||
|
2021
|
2020
|
2019
|
2018
|
2017
|
||||||||||||||||
|
Net asset value,
|
||||||||||||||||||||
|
beginning of year
|
$
|
46.02
|
$
|
46.21
|
$
|
46.72
|
$
|
44.08
|
$
|
40.47
|
||||||||||
|
Income from
|
||||||||||||||||||||
|
investment operations:
|
||||||||||||||||||||
|
Net investment income^
|
0.39
|
0.34
|
0.23
|
0.26
|
0.09
|
|||||||||||||||
|
Net realized and unrealized
|
||||||||||||||||||||
|
gain on investments
|
||||||||||||||||||||
|
and foreign currency
|
10.14
|
3.35
|
2.99
|
3.61
|
3.59
|
|||||||||||||||
|
Total from investment operations
|
10.53
|
3.69
|
3.22
|
3.87
|
3.68
|
|||||||||||||||
|
Less distributions:
|
||||||||||||||||||||
|
From net investment income
|
(0.37
|
)
|
(0.24
|
)
|
(0.39
|
)
|
(0.08
|
)
|
(0.07
|
)
|
||||||||||
|
From net realized
|
||||||||||||||||||||
|
gain on investments
|
(1.40
|
)
|
(3.64
|
)
|
(3.34
|
)
|
(1.15
|
)
|
—
|
|||||||||||
|
Total distributions
|
(1.77
|
)
|
(3.88
|
)
|
(3.73
|
)
|
(1.23
|
)
|
(0.07
|
)
|
||||||||||
|
Paid–in capital from
|
||||||||||||||||||||
|
redemption fees^#
|
0.00
|
0.00
|
0.00
|
0.00
|
0.00
|
|||||||||||||||
|
Net asset value, end of year
|
$
|
54.78
|
$
|
46.02
|
$
|
46.21
|
$
|
46.72
|
$
|
44.08
|
||||||||||
|
Total return
|
23.43
|
%
|
8.12
|
%
|
7.61
|
%
|
8.93
|
%
|
9.10
|
%
|
||||||||||
|
Ratios/supplemental data:
|
||||||||||||||||||||
|
Net assets, end of year (thousands)
|
$
|
328,886
|
$
|
282,746
|
$
|
298,028
|
$
|
350,205
|
$
|
488,084
|
||||||||||
|
Ratio of expenses
|
||||||||||||||||||||
|
to average net assets:
|
||||||||||||||||||||
|
Before fee waivers
|
0.94
|
%
|
1.00
|
%
|
1.06
|
%
|
1.08
|
%
|
1.20
|
%
|
||||||||||
|
After fee waivers
|
0.86
|
%
|
0.90
|
%
|
0.96
|
%
|
0.96
|
%
|
1.07
|
%
|
||||||||||
|
Ratio of net investment income
|
||||||||||||||||||||
|
to average net assets:
|
||||||||||||||||||||
|
Before fee waivers
|
0.66
|
%
|
0.68
|
%
|
0.44
|
%
|
0.47
|
%
|
0.09
|
%
|
||||||||||
|
After fee waivers
|
0.74
|
%
|
0.78
|
%
|
0.54
|
%
|
0.59
|
%
|
0.22
|
%
|
||||||||||
|
Portfolio turnover rate
|
29.21
|
%
|
52.15
|
%
|
47.87
|
%
|
39.71
|
%
|
21.63
|
%
|
||||||||||
|
^
|
Based on average shares outstanding.
|
|
#
|
Amount is less than $0.01.
|
The accompanying notes are an integral part of these financial statements.
49
SCHARF FUND
FINANCIAL HIGHLIGHTS For a share outstanding throughout each year
Retail Class
|
Year Ended September 30,
|
||||||||||||||||||||
|
2021
|
2020
|
2019
|
2018
|
2017
|
||||||||||||||||
|
Net asset value,
|
||||||||||||||||||||
|
beginning of year
|
$
|
45.74
|
$
|
45.95
|
$
|
46.43
|
$
|
43.87
|
$
|
40.32
|
||||||||||
|
Income from
|
||||||||||||||||||||
|
investment operations:
|
||||||||||||||||||||
|
Net investment income/(loss)^
|
0.24
|
0.22
|
0.11
|
0.12
|
(0.02
|
)
|
||||||||||||||
|
Net realized and unrealized
|
||||||||||||||||||||
|
gain on investments
|
||||||||||||||||||||
|
and foreign currency
|
10.09
|
3.33
|
2.98
|
3.59
|
3.57
|
|||||||||||||||
|
Total from investment operations
|
10.33
|
3.55
|
3.09
|
3.71
|
3.55
|
|||||||||||||||
|
Less distributions:
|
||||||||||||||||||||
|
From net investment income
|
(0.23
|
)
|
(0.12
|
)
|
(0.23
|
)
|
—
|
—
|
||||||||||||
|
From net realized
|
||||||||||||||||||||
|
gain on investments
|
(1.40
|
)
|
(3.64
|
)
|
(3.34
|
)
|
(1.15
|
)
|
—
|
|||||||||||
|
Total distributions
|
(1.63
|
)
|
(3.76
|
)
|
(3.57
|
)
|
(1.15
|
)
|
—
|
|||||||||||
|
Paid–in capital from
|
||||||||||||||||||||
|
redemption fees^#
|
0.00
|
0.00
|
0.00
|
0.00
|
0.00
|
|||||||||||||||
|
Net asset value, end of year
|
$
|
54.44
|
$
|
45.74
|
$
|
45.95
|
$
|
46.43
|
$
|
43.87
|
||||||||||
|
Total return
|
23.08
|
%
|
7.83
|
%
|
7.32
|
%
|
8.58
|
%
|
8.80
|
%
|
||||||||||
|
Ratios/supplemental data:
|
||||||||||||||||||||
|
Net assets, end of year (thousands)
|
$
|
71,730
|
$
|
66,531
|
$
|
72,710
|
$
|
70,365
|
$
|
88,843
|
||||||||||
|
Ratio of expenses
|
||||||||||||||||||||
|
to average net assets:
|
||||||||||||||||||||
|
Before fee waivers
|
1.22
|
%
|
1.29
|
%
|
1.34
|
%
|
1.39
|
%
|
1.47
|
%
|
||||||||||
|
After fee waivers
|
1.14
|
%
|
1.19
|
%
|
1.24
|
%
|
1.27
|
%
|
1.34
|
%
|
||||||||||
|
Ratio of net investment income/(loss)
|
||||||||||||||||||||
|
to average net assets:
|
||||||||||||||||||||
|
Before fee waivers
|
0.38
|
%
|
0.39
|
%
|
0.16
|
%
|
0.16
|
%
|
(0.17
|
)%
|
||||||||||
|
After fee waivers
|
0.46
|
%
|
0.49
|
%
|
0.26
|
%
|
0.28
|
%
|
(0.04
|
)%
|
||||||||||
|
Portfolio turnover rate
|
29.21
|
%
|
52.15
|
%
|
47.87
|
%
|
39.71
|
%
|
21.63
|
%
|
||||||||||
|
^
|
Based on average shares outstanding.
|
|
#
|
Amount is less than $0.01.
|
The accompanying notes are an integral part of these financial statements.
50
SCHARF MULTI-ASSET OPPORTUNITY FUND
FINANCIAL HIGHLIGHTS For a share outstanding throughout each year
Institutional Class
|
Year Ended September 30,
|
||||||||||||||||||||
|
2021
|
2020
|
2019
|
2018
|
2017
|
||||||||||||||||
|
Net asset value,
|
||||||||||||||||||||
|
beginning of year
|
$
|
34.01
|
$
|
33.55
|
$
|
33.58
|
$
|
32.27
|
$
|
30.60
|
||||||||||
|
Income from
|
||||||||||||||||||||
|
investment operations:
|
||||||||||||||||||||
|
Net investment income^
|
0.28
|
0.33
|
0.38
|
0.34
|
0.15
|
|||||||||||||||
|
Net realized and unrealized
|
||||||||||||||||||||
|
gain on investments
|
||||||||||||||||||||
|
and foreign currency
|
5.18
|
2.60
|
1.70
|
1.67
|
1.94
|
|||||||||||||||
|
Total from investment operations
|
5.46
|
2.93
|
2.08
|
2.01
|
2.09
|
|||||||||||||||
|
Less distributions:
|
||||||||||||||||||||
|
From net investment income
|
(0.31
|
)
|
(0.43
|
)
|
(0.49
|
)
|
(0.07
|
)
|
(0.20
|
)
|
||||||||||
|
From net realized
|
||||||||||||||||||||
|
gain on investments
|
(1.02
|
)
|
(2.04
|
)
|
(1.62
|
)
|
(0.63
|
)
|
(0.22
|
)
|
||||||||||
|
Total distributions
|
(1.33
|
)
|
(2.47
|
)
|
(2.11
|
)
|
(0.70
|
)
|
(0.42
|
)
|
||||||||||
|
Paid–in capital from
|
||||||||||||||||||||
|
redemption fees
|
—
|
—
|
—
|
—
|
0.00
|
^# | ||||||||||||||
|
Net asset value, end of year
|
$
|
38.14
|
$
|
34.01
|
$
|
33.55
|
$
|
33.58
|
$
|
32.27
|
||||||||||
|
Total return
|
16.46
|
%
|
8.99
|
%
|
6.89
|
%
|
6.32
|
%
|
6.94
|
%
|
||||||||||
|
Ratios/supplemental data:
|
||||||||||||||||||||
|
Net assets, end of year (thousands)
|
$
|
43,738
|
$
|
40,450
|
$
|
43,865
|
$
|
46,366
|
$
|
60,061
|
||||||||||
|
Ratio of expenses
|
||||||||||||||||||||
|
to average net assets:
|
||||||||||||||||||||
|
Before fee waivers
|
1.46
|
%
|
1.47
|
%
|
1.45
|
%
|
1.44
|
%
|
1.47
|
%
|
||||||||||
|
After fee waivers
|
0.97
|
%
|
0.96
|
%
|
0.98
|
%
|
0.97
|
%
|
1.02
|
%
|
||||||||||
|
Ratio of net investment income
|
||||||||||||||||||||
|
to average net assets:
|
||||||||||||||||||||
|
Before fee waivers
|
0.28
|
%
|
0.50
|
%
|
0.71
|
%
|
0.59
|
%
|
0.04
|
%
|
||||||||||
|
After fee waivers
|
0.77
|
%
|
1.01
|
%
|
1.18
|
%
|
1.06
|
%
|
0.49
|
%
|
||||||||||
|
Portfolio turnover rate
|
28.67
|
%
|
48.02
|
%
|
45.52
|
%
|
36.29
|
%
|
30.04
|
%
|
||||||||||
|
^
|
Based on average shares outstanding.
|
|
#
|
Amount is less than $0.01.
|
The accompanying notes are an integral part of these financial statements.
51
SCHARF MULTI-ASSET OPPORTUNITY FUND
FINANCIAL HIGHLIGHTS For a share outstanding throughout each year
Retail Class
|
Year Ended September 30,
|
||||||||||||||||||||
|
2021
|
2020
|
2019
|
2018
|
2017
|
||||||||||||||||
|
Net asset value,
|
||||||||||||||||||||
|
beginning of year
|
$
|
33.91
|
$
|
33.47
|
$
|
33.44
|
$
|
32.16
|
$
|
30.54
|
||||||||||
|
Income from
|
||||||||||||||||||||
|
investment operations:
|
||||||||||||||||||||
|
Net investment income^
|
0.19
|
0.24
|
0.29
|
0.26
|
0.07
|
|||||||||||||||
|
Net realized and unrealized
|
||||||||||||||||||||
|
gain on investments
|
||||||||||||||||||||
|
and foreign currency
|
5.17
|
2.59
|
1.72
|
1.65
|
1.94
|
|||||||||||||||
|
Total from investment operations
|
5.36
|
2.83
|
2.01
|
1.91
|
2.01
|
|||||||||||||||
|
Less distributions:
|
||||||||||||||||||||
|
From net investment income
|
(0.23
|
)
|
(0.35
|
)
|
(0.36
|
)
|
(0.00
|
)
|
(0.17
|
)
|
||||||||||
|
From net realized
|
||||||||||||||||||||
|
gain on investments
|
(1.02
|
)
|
(2.04
|
)
|
(1.62
|
)
|
(0.63
|
)
|
(0.22
|
)
|
||||||||||
|
Total distributions
|
(1.25
|
)
|
(2.39
|
)
|
(1.98
|
)
|
(0.63
|
)
|
(0.39
|
)
|
||||||||||
|
Paid–in capital from
|
||||||||||||||||||||
|
redemption fees
|
—
|
0.00
|
^# |
—
|
—
|
—
|
||||||||||||||
|
Net asset value, end of year
|
$
|
38.02
|
$
|
33.91
|
$
|
33.47
|
$
|
33.44
|
$
|
32.16
|
||||||||||
|
Total return
|
16.18
|
%
|
8.68
|
%
|
6.66
|
%
|
6.00
|
%
|
6.68
|
%
|
||||||||||
|
Ratios/supplemental data:
|
||||||||||||||||||||
|
Net assets, end of year (thousands)
|
$
|
6,805
|
$
|
7,359
|
$
|
5,874
|
$
|
7,361
|
$
|
8,998
|
||||||||||
|
Ratio of expenses
|
||||||||||||||||||||
|
to average net assets:
|
||||||||||||||||||||
|
Before fee waivers
|
1.72
|
%
|
1.74
|
%
|
1.70
|
%
|
1.70
|
%
|
1.73
|
%
|
||||||||||
|
After fee waivers
|
1.23
|
%
|
1.23
|
%
|
1.23
|
%
|
1.23
|
%
|
1.28
|
%
|
||||||||||
|
Ratio of net investment income/(loss)
|
||||||||||||||||||||
|
to average net assets:
|
||||||||||||||||||||
|
Before fee waivers
|
0.03
|
%
|
0.23
|
%
|
0.45
|
%
|
0.33
|
%
|
(0.21
|
)%
|
||||||||||
|
After fee waivers
|
0.52
|
%
|
0.74
|
%
|
0.92
|
%
|
0.80
|
%
|
0.24
|
%
|
||||||||||
|
Portfolio turnover rate
|
28.67
|
%
|
48.02
|
%
|
45.52
|
%
|
36.29
|
%
|
30.04
|
%
|
||||||||||
|
^
|
Based on average shares outstanding.
|
|
#
|
Amount is less than $0.01.
|
The accompanying notes are an integral part of these financial statements.
52
SCHARF GLOBAL OPPORTUNITY FUND
FINANCIAL HIGHLIGHTS For a share outstanding throughout each year
Retail Class
|
Year Ended September 30,
|
||||||||||||||||||||
|
2021
|
2020
|
2019
|
2018
|
2017
|
||||||||||||||||
|
Net asset value,
|
||||||||||||||||||||
|
beginning of year
|
$
|
29.32
|
$
|
29.98
|
$
|
31.30
|
$
|
29.76
|
$
|
26.89
|
||||||||||
|
Income from
|
||||||||||||||||||||
|
investment operations:
|
||||||||||||||||||||
|
Net investment income
|
0.31
|
0.28
|
0.37
|
0.31
|
0.18
|
^ | ||||||||||||||
|
Net realized and unrealized
|
||||||||||||||||||||
|
gain on investments
|
||||||||||||||||||||
|
and foreign currency
|
7.31
|
2.22
|
0.90
|
3.05
|
3.03
|
|||||||||||||||
|
Total from investment operations
|
7.62
|
2.50
|
1.27
|
3.36
|
3.21
|
|||||||||||||||
|
Less distributions:
|
||||||||||||||||||||
|
From net investment income
|
(0.23
|
)
|
(0.41
|
)
|
(0.28
|
)
|
(0.21
|
)
|
(0.14
|
)
|
||||||||||
|
From net realized
|
||||||||||||||||||||
|
gain on investments
|
(0.46
|
)
|
(2.75
|
)
|
(2.31
|
)
|
(1.61
|
)
|
(0.20
|
)
|
||||||||||
|
Total distributions
|
(0.69
|
)
|
(3.16
|
)
|
(2.59
|
)
|
(1.82
|
)
|
(0.34
|
)
|
||||||||||
|
Paid–in capital from
|
||||||||||||||||||||
|
redemption fees
|
—
|
—
|
—
|
0.00
|
^# |
0.00
|
^# | |||||||||||||
|
Net asset value, end of year
|
$
|
36.25
|
$
|
29.32
|
$
|
29.98
|
$
|
31.30
|
$
|
29.76
|
||||||||||
|
Total return
|
26.33
|
%
|
8.09
|
%
|
4.92
|
%
|
11.72
|
%
|
12.10
|
%
|
||||||||||
|
Ratios/supplemental data:
|
||||||||||||||||||||
|
Net assets, end of year (thousands)
|
$
|
25,643
|
$
|
18,706
|
$
|
17,763
|
$
|
28,353
|
$
|
30,307
|
||||||||||
|
Ratio of expenses
|
||||||||||||||||||||
|
to average net assets:
|
||||||||||||||||||||
|
Before fee waivers and
|
||||||||||||||||||||
|
expense reimbursement
|
1.84
|
%
|
1.99
|
%
|
1.96
|
%
|
1.72
|
%
|
1.90
|
%
|
||||||||||
|
After fee waivers and
|
||||||||||||||||||||
|
expense reimbursement
|
0.76
|
%
|
0.70
|
%
|
0.59
|
%
|
0.52
|
%
|
0.65
|
%
|
||||||||||
|
Ratio of net investment income/(loss)
|
||||||||||||||||||||
|
to average net assets:
|
||||||||||||||||||||
|
Before fee waivers and
|
||||||||||||||||||||
|
expense reimbursement
|
(0.16
|
)%
|
(0.42
|
)%
|
(0.31
|
)%
|
(0.26
|
)%
|
(0.60
|
)%
|
||||||||||
|
After fee waivers and
|
||||||||||||||||||||
|
expense reimbursement
|
0.92
|
%
|
0.87
|
%
|
1.06
|
%
|
0.94
|
%
|
0.65
|
%
|
||||||||||
|
Portfolio turnover rate
|
37.42
|
%
|
60.69
|
%
|
73.90
|
%
|
65.99
|
%
|
75.78
|
%
|
||||||||||
|
^
|
Based on average shares outstanding.
|
|
#
|
Amount is less than $0.01.
|
The accompanying notes are an integral part of these financial statements.
53
SCHARF ALPHA OPPORTUNITY FUND
FINANCIAL HIGHLIGHTS For a share outstanding throughout each year
Retail Class
|
Year Ended September 30,
|
||||||||||||||||||||
|
2021
|
2020
|
2019
|
2018
|
2017
|
||||||||||||||||
|
Net asset value,
|
||||||||||||||||||||
|
beginning of year
|
$
|
23.85
|
$
|
25.43
|
$
|
23.92
|
$
|
24.20
|
$
|
24.52
|
||||||||||
|
Income from
|
||||||||||||||||||||
|
investment operations:
|
||||||||||||||||||||
|
Net investment income/(loss)
|
(0.03
|
)
|
0.02
|
0.09
|
(0.04
|
)
|
(0.19
|
)
|
||||||||||||
|
Net realized and unrealized
|
||||||||||||||||||||
|
gain/(loss) on investments,
|
||||||||||||||||||||
|
foreign currency and
|
||||||||||||||||||||
|
securities sold short
|
2.07
|
(1.51
|
)
|
1.42
|
0.23
|
(0.03
|
)
|
|||||||||||||
|
Total from investment operations
|
2.04
|
(1.49
|
)
|
1.51
|
0.19
|
(0.22
|
)
|
|||||||||||||
|
Less distributions:
|
||||||||||||||||||||
|
From net investment income
|
(0.02
|
)
|
—
|
—
|
—
|
—
|
||||||||||||||
|
From net realized
|
||||||||||||||||||||
|
gain on investments
|
—
|
(0.09
|
)
|
—
|
(0.47
|
)
|
(0.10
|
)
|
||||||||||||
|
Total distributions
|
(0.02
|
)
|
(0.09
|
)
|
—
|
(0.47
|
)
|
(0.10
|
)
|
|||||||||||
|
Paid–in capital from
|
||||||||||||||||||||
|
redemption fees
|
—
|
—
|
—
|
0.00
|
^# |
—
|
||||||||||||||
|
Net asset value, end of year
|
$
|
25.87
|
$
|
23.85
|
$
|
25.43
|
$
|
23.92
|
$
|
24.20
|
||||||||||
|
Total return
|
8.56
|
%
|
-5.90
|
%
|
6.31
|
%
|
0.79
|
%
|
-0.89
|
%
|
||||||||||
|
Ratios/supplemental data:
|
||||||||||||||||||||
|
Net assets, end of year (thousands)
|
$
|
6,570
|
$
|
9,856
|
$
|
18,460
|
$
|
20,994
|
$
|
25,129
|
||||||||||
|
Ratio of expenses
|
||||||||||||||||||||
|
to average net assets:
|
||||||||||||||||||||
|
Before fee waivers and
|
||||||||||||||||||||
|
expense reimbursement
|
4.40
|
%
|
3.28
|
%
|
2.78
|
%
|
2.88
|
%
|
3.15
|
%
|
||||||||||
|
After fee waivers and
|
||||||||||||||||||||
|
expense reimbursement
|
1.90
|
%
|
1.88
|
%
|
1.66
|
%
|
1.84
|
%
|
2.14
|
%
|
||||||||||
|
Ratio of net investment income/(loss)
|
||||||||||||||||||||
|
to average net assets:
|
||||||||||||||||||||
|
Before fee waivers and
|
||||||||||||||||||||
|
expense reimbursement
|
(2.85
|
)%
|
(1.36
|
)%
|
(0.81
|
)%
|
(1.12
|
)%
|
(1.77
|
)%
|
||||||||||
|
After fee waivers and
|
||||||||||||||||||||
|
expense reimbursement
|
(0.35
|
)%
|
0.04
|
%
|
0.31
|
%
|
(0.08
|
)%
|
(0.76
|
)%
|
||||||||||
|
Portfolio turnover rate
|
30.86
|
%
|
50.13
|
%
|
54.42
|
%
|
59.57
|
%
|
27.42
|
%
|
||||||||||
|
^
|
Based on average shares outstanding.
|
|
#
|
Amount is less than $0.01.
|
The accompanying notes are an integral part of these financial statements.
54
SCHARF FUNDS
NOTES TO FINANCIAL STATEMENTS at September 30, 2021
NOTE 1 – ORGANIZATION
The Scharf Fund, the Scharf Multi-Asset Opportunity Fund, the Scharf Global Opportunity Fund, and the Scharf Alpha Opportunity Fund (each a “Fund” and collectively, the “Funds”) are each a diversified
series of Advisors Series Trust (the “Trust”), which is registered under the Investment Company Act of 1940, as amended, (the “1940 Act”) as an open-end management investment company. The Funds follow the investment company accounting and reporting
guidance of the Financial Accounting Standards Board (FASB) Accounting Standard Codification Topic 946 “Financial Services – Investment Companies”.
The investment objective of the Scharf Fund and the Scharf Global Opportunity Fund is to seek long-term capital appreciation. The investment objective of the Scharf Multi-Asset Opportunity Fund is to
seek long-term capital appreciation and income. The investment objective of the Scharf Alpha Opportunity Fund is to seek long-term capital appreciation and to provide returns above inflation while exposing investors to less volatility than typical
equity investments. The Scharf Fund Institutional Class and Retail Class commenced operations on December 30, 2011 and January 28, 2015, respectively. The Scharf Multi-Asset Opportunity Fund Institutional Class and Retail Class commenced operations
on December 31, 2012 and January 21, 2016, respectively. The Scharf Global Opportunity Fund commenced operations on October 14, 2014. The Scharf Alpha Opportunity Fund commenced operations on December 31, 2015.
NOTE 2 – SIGNIFICANT ACCOUNTING POLICIES
The following is a summary of significant accounting policies consistently followed by the Funds. These policies are in conformity with accounting principles generally accepted in the United States of
America.
|
A.
|
Security Valuation: All investments in securities are recorded at their estimated fair value, as described in note 3.
|
|
B.
|
Federal Income Taxes: It is the Funds’ policy to comply with the requirements of Subchapter M of the Internal Revenue Code applicable to regulated
investment companies and to distribute substantially all of its taxable income to its shareholders. Therefore, no Federal income or excise tax provision is required.
|
|
The Funds recognize the tax benefits of uncertain tax positions only where the position is “more likely than not” to be sustained assuming examination by tax authorities. The tax returns of the
Funds prior three fiscal years are open for examination. Management has reviewed all open tax years in major jurisdictions and concluded that there is no impact on the Funds net assets and no tax liability resulting from unrecognized tax
events relating to uncertain income tax positions taken or expected to be taken on a tax return. The Funds
|
55
SCHARF FUNDS
NOTES TO FINANCIAL STATEMENTS at September 30, 2021, Continued
|
identify their major tax jurisdictions as U.S. Federal and the state of Wisconsin; however, the Funds are not aware of any tax positions for which it is reasonably possible that the total
amounts of unrecognized tax benefits will change materially in the next twelve months.
|
|
|
C.
|
Securities Transactions, Income and Distributions: Securities transactions are accounted for on the trade date. Realized gains and losses on securities
sold are calculated on the basis of specified cost. Interest income is recorded on an accrual basis. Discounts and premiums on securities purchased are accreted/amortized over the life of the respective security using the effective interest
method, except for premiums on certain callable debt securities that are amortized to the earliest call date. Dividend income, income and capital gain distributions from underlying funds and distributions to shareholders are recorded on the
ex-dividend date. Withholding taxes on foreign dividends have been provided for in accordance with each Fund’s understanding of the applicable country’s tax rules and rates.
|
|
Investment income, expenses (other than those specific to the class of shares), and realized and unrealized gains and losses on investments are allocated to the separate classes of each Fund
based upon their relative net assets on the date income is earned or expensed and realized and unrealized gains and losses are incurred.
|
|
|
Each Fund is charged for those expenses that are directly attributable to the Fund, such as investment advisory, custody and transfer agent fees. Expenses that are not attributable to a Fund are
typically allocated among the Funds in proportion to their respective net assets. Common expenses of the Trust are typically allocated among the funds in the Trust based on a fund’s respective net assets, or by other equitable means.
|
|
|
The Funds distribute substantially all net investment income, if any, and net realized capital gains, if any, annually. Distributions from net realized gains for book purposes may include
short-term capital gains. All short-term capital gains are included in ordinary income for tax purposes.
|
|
|
The amounts of dividends and distributions to shareholders from net investment income and net realized capital gains is determined in accordance with Federal income tax regulations, which
differs from accounting principles generally accepted in the United States of America. To the extent these book/tax differences are permanent, such amounts are reclassified within the capital accounts based on their Federal tax treatment.
|
|
|
D.
|
Reclassification of Capital Accounts: Accounting principles generally accepted in the United States of America require that certain components of net
assets relating to permanent differences be reclassified between financial and tax reporting. These reclassifications have no effect on net assets or net asset value per share.
|
56
SCHARF FUNDS
NOTES TO FINANCIAL STATEMENTS at September 30, 2021, Continued
|
For the year ended September 30, 2021, the Funds made the following permanent tax adjustments on the statements of assets and liabilities:
|
|
Distributable
|
Paid-in
|
||||||||
|
Earnings
|
Capital
|
||||||||
|
Scharf Fund
|
$
|
(2,491,740
|
)
|
$
|
2,491,740
|
||||
|
Scharf Multi-Asset Opportunity Fund
|
(308,370
|
)
|
308,370
|
||||||
|
Scharf Global Opportunity Fund
|
(102,574
|
)
|
102,574
|
||||||
|
Scharf Alpha Opportunity Fund
|
4,005
|
(4,005
|
)
|
||||||
|
E.
|
Use of Estimates: The preparation of financial statements in conformity with accounting principles generally accepted in the United States of America
requires management to make estimates and assumptions that affect the reported amounts of assets and liabilities at the date of the financial statements and the reported amounts of increases and decreases in net assets during the reporting
period. Actual results could differ from those estimates.
|
|
F.
|
Redemption Fees: The Scharf Fund charges a 2.00% redemption fee to shareholders who redeem shares held for 60 days or less. The Scharf Multi-Asset
Opportunity Fund, the Scharf Global Opportunity Fund, and the Scharf Alpha Opportunity Fund each charge a 2.00% redemption fee to shareholders who redeem shares held for 15 days or less. Such fees are retained by the Funds and accounted for
as an addition to paid-in capital. The redemption fees retained by each Fund are disclosed in the statements of changes.
|
|
G.
|
Foreign Currency: Investment securities and other assets and liabilities denominated in foreign currencies are translated into U.S. dollar amounts at the
date of valuation. Purchases and sales of investment securities and income and expense items denominated in foreign currencies are translated to U.S. dollar amounts on the respective dates of such transactions.
|
|
The Funds do not isolate those portions of the results of operations resulting from changes in foreign exchange rates on investments from the fluctuations arising from changes in market prices
of securities held. Such fluctuations are included with the net realized and unrealized gain or loss from investments.
|
|
|
Reported net realized foreign exchange gains or losses arise from sales of foreign currencies, currency gains or losses realized between the trade and settlement dates on securities
transactions, and the difference between the amounts of dividends, interest, and foreign withholding taxes recorded on the Fund’s books and the U.S. dollar equivalent of the amounts actually received or paid. Net unrealized foreign exchange
gains and losses arise from changes in the fair values of assets and liabilities, other than investments in securities at fiscal period-end, resulting from changes in exchange rates.
|
57
SCHARF FUNDS
NOTES TO FINANCIAL STATEMENTS at September 30, 2021, Continued
|
H.
|
Leverage and Short Sales: The Scharf Alpha Opportunity Fund may use leverage in connection with its investment activities and may affect short sales of
securities. Leverage can increase the investment returns of the Fund if the securities purchased increase in value in an amount exceeding the cost of the borrowing. However, if the securities decrease in value, the Fund will suffer a greater
loss than would have resulted without the use of leverage. A short sale is the sale by the Fund of a security which it does not own in anticipation of purchasing the same security in the future at a lower price to close the short position. A
short sale will be successful if the price of the shorted security decreases. However, if the underlying security goes up in price during the period in which the short position is outstanding, the Fund will realize a loss. The risk on a short
sale is unlimited because the Fund must buy the shorted security at the higher price to complete the transaction. Therefore, short sales may be subject to greater risks than investments in long positions.
|
|
With a long position, the maximum sustainable loss is limited to the amount paid for the security plus the transaction costs, whereas there is no maximum attainable price of the shorted
security. The Fund would also incur increased transaction costs associated with selling securities short. In addition, if the Fund sells securities short, it must maintain a segregated account with its custodian containing cash or high-grade
securities equal to (i) the greater of the current market value of the securities sold short or the market value of such securities at the time they were sold short, less (ii) any collateral deposited with the Fund’s broker (not including the
proceeds from the short sales). The Fund may be required to add to the segregated account as the market price of a shorted security increases. As a result of maintaining and adding to its segregated account, the Fund may maintain higher
levels of cash or liquid assets (for example, U.S. Treasury bills, repurchase agreements, high quality commercial paper and long equity positions) for collateral needs thus reducing its overall managed assets available for trading purposes.
In lieu of maintaining cash or high-grade securities in a segregated account to cover the Fund’s short sale obligations, the Fund may earmark cash or high-grade securities on the Fund’s records or hold offsetting positions.
|
|
|
I.
|
New Accounting Pronouncements: In March 2020, FASB issued ASU 2020-04, Reference Rate Reform: Facilitation of the
Effects of Reference Rate Reform on Financial Reporting. The main objective of the new guidance is to provide relief to companies that will be impacted by the expected change in benchmark interest rates at the end of 2021, when
participating banks will no longer be required to submit London Interbank Offered Rate (“LIBOR”) quotes by the UK Financial Conduct Authority. The new guidance allows companies to, provided the only change to existing contracts are a change
to an approved benchmark
|
58
SCHARF FUNDS
NOTES TO FINANCIAL STATEMENTS at September 30, 2021, Continued
|
interest rate, account for modifications as a continuance of the existing contract without additional analysis. In addition, derivative contracts that qualified for hedge accounting prior to
modification, will be allowed to continue to receive such treatment, even if critical terms change due to a change in the benchmark interest rate. For new and existing contracts, the Funds may elect to apply the amendments as of March 12,
2020 through December 31, 2022. Management is currently assessing the impact of the ASU’s adoption to the Funds’ financial statements and various filings.
|
|
|
In October 2020, the Securities and Exchange Commission (the “SEC”) adopted new regulations governing the use of derivatives by registered investment companies (“Rule 18f-4”). Funds will be
required to implement and comply with Rule 18f-4 by August 19, 2022. Once implemented, Rule 18f-4 will impose limits on the amount of derivatives a fund can enter into, eliminate the asset segregation framework currently used by funds to
comply with Section 18 of the 1940 Act, treat derivatives as senior securities and require funds whose use of derivatives is more than a limited specified exposure amount to establish and maintain a comprehensive derivatives risk management
program and appoint a derivatives risk manager. Management is currently evaluating the potential impact of Rule 18f-4 on the Funds.
|
|
|
In December 2020, the SEC adopted a new rule providing a framework for fund valuation practices (“Rule 2a-5”). Rule 2a-5 establishes requirements for determining fair value in good faith for
purposes of the 1940 Act. Rule 2a-5 will permit fund boards to designate certain parties to perform fair value determinations, subject to board oversight and certain other conditions. Rule 2a-5 also defines when market quotations are
“readily available” for purposes of the 1940 Act and the threshold for determining whether a fund must fair value a security. In connection with Rule 2a-5, the SEC also adopted related recordkeeping requirements and is rescinding previously
issued guidance, including with respect to the role of a board in determining fair value and the accounting and auditing of fund investments. The Funds will be required to comply with the rules by September 8, 2022. Management is currently
assessing the potential impact of the new rules on the Funds’ financial statements.
|
|
|
J.
|
Events Subsequent to the Fiscal Year End: In preparing the financial statements as of September 30, 2021, management considered the impact of subsequent
events for potential recognition or disclosure in the financial statements. Refer to Note 12 for information on a subsequent event related to the Scharf Alpha Opportunity Fund and the Scharf Multi-Asset Opportunity Fund.
|
59
SCHARF FUNDS
NOTES TO FINANCIAL STATEMENTS at September 30, 2021, Continued
NOTE 3 – SECURITIES VALUATION
The Funds have adopted authoritative fair value accounting standards which establish an authoritative definition of fair value and set out a hierarchy for measuring fair value. These standards require
additional disclosures about the various inputs and valuation techniques used to develop the measurements of fair value, a discussion in changes in valuation techniques and related inputs during the period and expanded disclosure of valuation levels
for major security types. These inputs are summarized in the three broad levels listed below:
|
Level 1 –
|
Unadjusted quoted prices in active markets for identical assets or liabilities that the Funds have the ability to access.
|
|
Level 2 –
|
Observable inputs other than quoted prices included in level 1 that are observable for the asset or liability, either directly or indirectly. These inputs may include quoted prices for the
identical instrument on an inactive market, prices for similar instruments, interest rates, prepayment speeds, credit risk, yield curves, default rates and similar data.
|
|
Level 3 –
|
Unobservable inputs for the asset or liability, to the extent relevant observable inputs are not available, representing the Funds’ own assumptions about the assumptions a market participant
would use in valuing the asset or liability, and would be based on the best information available.
|
Following is a description of the valuation techniques applied to the Funds’ major categories of assets and liabilities measured at fair value on a recurring basis.
Each Fund determines the fair value of its investments and computes its net asset value per share as of the close of regular trading on the New York Stock Exchange (4:00 pm EST).
Equity Securities: The Funds’ investments are carried at fair value. Equity securities, including common stocks, preferred stocks and exchange-traded funds that
are primarily traded on a national securities exchange shall be valued at the last sale price on the exchange on which they are primarily traded on the day of valuation or, if there has been no sale on such day, at the mean between the bid and asked
prices. Securities primarily traded in the NASDAQ Global Market System for which market quotations are readily available shall be valued using the NASDAQ Official Closing Price (“NOCP”). If the NOCP is not available, such securities shall be valued
at the last sale price on the day of valuation, or if there has been no sale on such day, at the mean between the bid and asked prices. Over-the-counter securities which are not traded in the NASDAQ Global Market System shall be valued at the most
recent sales price. The values for foreign securities are reported in local currency and converted to U.S. dollars using currency exchange rates. Exchange rates are provided daily by a recognized independent pricing agent. To the extent, these
60
SCHARF FUNDS
NOTES TO FINANCIAL STATEMENTS at September 30, 2021, Continued
securities are actively traded and valuation adjustments are not applied, they are categorized in level 1 of the fair value hierarchy.
Investment Companies: Investments in open-end mutual funds, including money market funds, are generally priced at their net asset value per share provided by the
service agent of the funds and will be classified in level 1 of the fair value hierarchy.
Fixed Income Securities: Debt securities, such as corporate bonds, asset-backed securities, municipal bonds, and U.S. government agency issues are valued at
market on the basis of valuations furnished by an independent pricing service which utilizes both dealer-supplied valuations and formula-based techniques. The pricing service may consider recently executed transactions in securities of the issuer or
comparable issuers, market price quotations (where observable), bond spreads, and fundamental data relating to the issuer. In addition, the model may incorporate market observable data such as reported sales of similar securities, broker quotes,
yields, bids, offers, and reference data. Certain securities are valued principally using dealer quotations. These securities will generally be classified in level 2 of the fair value hierarchy.
Short-Term Securities: Short-term debt securities, including those securities having a maturity of 60 days or less, are valued at the evaluated mean between the
bid and asked prices. To the extent the inputs are observable and timely, these securities would be classified in level 2 of the fair value hierarchy.
Restricted Securities: The Funds’ may invest in securities that are subject to legal or contractual restrictions on resale (“restricted securities”). Restricted
securities may be resold in transactions that are exempt from registration under the Federal securities law. Private placement securities are generally considered to be restricted except for those securities traded between qualified institutional
investors under the provisions of Rule 144A of the Securities Act of 1933. The sale or other disposition of these securities may involve additional expenses and the prompt sale of these securities at an acceptable price may be difficult. At
September 30, 2021, the Scharf Multi-Asset Opportunity Fund held securities issued pursuant to Rule 144A under the Securities Act of 1933. There were no other restricted investments held by the Funds at September 30, 2021.
The Board of Trustees (the “Board”) has delegated day-to-day valuation issues to a Valuation Committee of the Trust which is comprised of representatives from the Funds’ administrator, U.S. Bancorp Fund
Services, LLC, doing business as U.S. Bank Global Fund Services (“Fund Services”). The function of the Valuation Committee is to value securities where current and reliable market quotations are not readily available, or the closing price does not
represent fair value by following procedures approved by the Board. These procedures consider many factors, including the type of security, size of holding, trading volume and news events. All actions taken by the Valuation Committee are reviewed and
ratified by the Board.
61
SCHARF FUNDS
NOTES TO FINANCIAL STATEMENTS at September 30, 2021, Continued
Depending on the relative significance of the valuation inputs, fair valued securities may be classified in either level 2 or level 3 of the fair value hierarchy.
The inputs or methodology used for valuing securities are not an indication of the risk associated with investing in those securities. The following is a summary of the inputs used to value the Funds’
securities as of September 30, 2021:
Scharf Fund
|
Level 1
|
Level 2
|
Level 3
|
Total
|
|||||||||||||
|
Common Stocks
|
||||||||||||||||
|
Communication Services
|
$
|
43,140,912
|
$
|
—
|
$
|
—
|
$
|
43,140,912
|
||||||||
|
Consumer Discretionary
|
20,378,473
|
—
|
—
|
20,378,473
|
||||||||||||
|
Consumer Staples
|
19,606,192
|
—
|
—
|
19,606,192
|
||||||||||||
|
Financials
|
52,874,488
|
—
|
—
|
52,874,488
|
||||||||||||
|
Health Care
|
90,655,241
|
—
|
—
|
90,655,241
|
||||||||||||
|
Industrials
|
48,995,713
|
—
|
—
|
48,995,713
|
||||||||||||
|
Information Technology
|
78,306,568
|
—
|
—
|
78,306,568
|
||||||||||||
|
Materials
|
16,937,288
|
—
|
—
|
16,937,288
|
||||||||||||
|
Total Common Stocks
|
370,894,875
|
—
|
—
|
370,894,875
|
||||||||||||
|
Preferred Stock
|
||||||||||||||||
|
Information Technology
|
13,811,838
|
—
|
—
|
13,811,838
|
||||||||||||
|
Total Preferred Stock
|
13,811,838
|
—
|
—
|
13,811,838
|
||||||||||||
|
Money Market Fund
|
15,385,061
|
—
|
—
|
15,385,061
|
||||||||||||
|
Total Investments
|
||||||||||||||||
|
in Securities
|
$
|
400,091,774
|
$
|
—
|
$
|
—
|
$
|
400,091,774
|
||||||||
62
SCHARF FUNDS
NOTES TO FINANCIAL STATEMENTS at September 30, 2021, Continued
Scharf Multi-Asset Opportunity Fund
|
Level 1
|
Level 2
|
Level 3
|
Total
|
|||||||||||||
|
Common Stocks
|
||||||||||||||||
|
Communication Services
|
$
|
3,717,937
|
$
|
—
|
$
|
—
|
$
|
3,717,937
|
||||||||
|
Consumer Discretionary
|
2,562,605
|
—
|
—
|
2,562,605
|
||||||||||||
|
Consumer Staples
|
1,749,906
|
—
|
—
|
1,749,906
|
||||||||||||
|
Financials
|
4,704,579
|
—
|
—
|
4,704,579
|
||||||||||||
|
Health Care
|
8,072,614
|
—
|
—
|
8,072,614
|
||||||||||||
|
Industrials
|
4,413,839
|
—
|
—
|
4,413,839
|
||||||||||||
|
Information Technology
|
6,922,275
|
—
|
—
|
6,922,275
|
||||||||||||
|
Materials
|
1,504,279
|
—
|
—
|
1,504,279
|
||||||||||||
|
Total Common Stocks
|
33,648,034
|
—
|
—
|
33,648,034
|
||||||||||||
|
Preferred Stocks
|
||||||||||||||||
|
Capital Markets
|
—
|
779,625
|
—
|
779,625
|
||||||||||||
|
Closed-End Fund
|
1,015,681
|
—
|
—
|
1,015,681
|
||||||||||||
|
Information Technology
|
1,553,949
|
—
|
—
|
1,553,949
|
||||||||||||
|
Total Preferred Stocks
|
2,569,630
|
779,625
|
—
|
3,349,255
|
||||||||||||
|
REIT
|
729,675
|
—
|
—
|
729,675
|
||||||||||||
|
Exchange-Trade Funds
|
2,327,278
|
—
|
—
|
2,327,278
|
||||||||||||
|
Fixed Income
|
||||||||||||||||
|
Corporate Bonds
|
—
|
3,557,551
|
—
|
3,557,551
|
||||||||||||
|
Municipal Bonds
|
—
|
2,121,790
|
—
|
2,121,790
|
||||||||||||
|
Total Fixed Income
|
—
|
5,679,341
|
—
|
5,679,341
|
||||||||||||
|
Other Securities
|
373,797
|
—
|
—
|
373,797
|
||||||||||||
|
Money Market Fund
|
4,378,126
|
—
|
—
|
4,378,126
|
||||||||||||
|
Total Investments
|
||||||||||||||||
|
in Securities
|
$
|
44,026,540
|
$
|
6,458,966
|
$
|
—
|
$
|
50,485,506
|
||||||||
63
SCHARF FUNDS
NOTES TO FINANCIAL STATEMENTS at September 30, 2021, Continued
Scharf Global Opportunity Fund
|
Level 1
|
Level 2
|
Level 3
|
Total
|
|||||||||||||
|
Common Stocks
|
||||||||||||||||
|
Communication Services
|
$
|
4,627,770
|
$
|
—
|
$
|
—
|
$
|
4,627,770
|
||||||||
|
Consumer Discretionary
|
3,793,580
|
—
|
—
|
3,793,580
|
||||||||||||
|
Consumer Staples
|
1,104,523
|
—
|
—
|
1,104,523
|
||||||||||||
|
Financials
|
2,603,289
|
—
|
—
|
2,603,289
|
||||||||||||
|
Health Care
|
5,405,520
|
—
|
—
|
5,405,520
|
||||||||||||
|
Industrials
|
1,917,822
|
—
|
—
|
1,917,822
|
||||||||||||
|
Information Technology
|
2,618,435
|
—
|
—
|
2,618,435
|
||||||||||||
|
Materials
|
1,286,002
|
—
|
—
|
1,286,002
|
||||||||||||
|
Total Common Stocks
|
23,356,941
|
—
|
—
|
23,356,941
|
||||||||||||
|
Preferred Stocks
|
||||||||||||||||
|
Consumer Discretionary
|
98,911
|
—
|
—
|
98,911
|
||||||||||||
|
Consumer Staples
|
65,806
|
—
|
—
|
65,806
|
||||||||||||
|
Financials
|
101,554
|
—
|
—
|
101,554
|
||||||||||||
|
Information Technology
|
1,550,422
|
—
|
—
|
1,550,422
|
||||||||||||
|
Materials
|
14,569
|
—
|
—
|
14,569
|
||||||||||||
|
Total Preferred Stocks
|
1,831,262
|
—
|
—
|
1,831,262
|
||||||||||||
|
Money Market Fund
|
813,508
|
—
|
—
|
813,508
|
||||||||||||
|
Total Investments
|
||||||||||||||||
|
in Securities
|
$
|
26,001,711
|
$
|
—
|
$
|
—
|
$
|
26,001,711
|
||||||||
64
SCHARF FUNDS
NOTES TO FINANCIAL STATEMENTS at September 30, 2021, Continued
Scharf Alpha Opportunity Fund
|
Level 1
|
Level 2
|
Level 3
|
Total
|
|||||||||||||
|
Assets:
|
||||||||||||||||
|
Common Stocks
|
||||||||||||||||
|
Communication Services
|
$
|
728,833
|
$
|
—
|
$
|
—
|
$
|
728,833
|
||||||||
|
Consumer Discretionary
|
338,402
|
—
|
—
|
338,402
|
||||||||||||
|
Consumer Staples
|
318,984
|
—
|
—
|
318,984
|
||||||||||||
|
Financials
|
858,374
|
—
|
—
|
858,374
|
||||||||||||
|
Health Care
|
1,481,377
|
—
|
—
|
1,481,377
|
||||||||||||
|
Industrials
|
799,868
|
—
|
—
|
799,868
|
||||||||||||
|
Information Technology
|
1,504,122
|
—
|
—
|
1,504,122
|
||||||||||||
|
Materials
|
278,157
|
—
|
—
|
278,157
|
||||||||||||
|
Total Common Stocks
|
6,308,117
|
—
|
—
|
6,308,117
|
||||||||||||
|
Exchange-Traded Fund
|
51,300
|
—
|
—
|
51,300
|
||||||||||||
|
Money Market Fund
|
96,305
|
—
|
—
|
96,305
|
||||||||||||
|
Total Investments
|
||||||||||||||||
|
in Securities
|
$
|
6,455,722
|
$
|
—
|
$
|
—
|
$
|
6,455,722
|
||||||||
|
Liabilities:
|
||||||||||||||||
|
Securities Sold Short
|
||||||||||||||||
|
Exchange-Traded Funds
|
2,609,987
|
—
|
—
|
2,609,987
|
||||||||||||
|
Total Securities Sold Short
|
$
|
2,609,987
|
$
|
—
|
$
|
—
|
$
|
2,609,987
|
||||||||
Refer to the Funds’ schedule of investments for a detailed break-out of securities by industry classification.
The global outbreak of COVID-19 (commonly referred to as “coronavirus”) has disrupted economic markets and the prolonged economic impact is uncertain. The ultimate economic fallout from the pandemic,
and the long-term impact on economies, markets, industries and individual issuers, are not known. The operational and financial performance of the issuers of securities in which the Funds invest depends on future developments, including the duration
and spread of the outbreak, and such uncertainty may in turn adversely affect the value and liquidity of the Funds’ investments, impair the Funds’ ability to satisfy redemption requests, and negatively impact the Funds’ performance.
NOTE 4 – INVESTMENT ADVISORY FEE AND OTHER TRANSACTIONS WITH AFFILIATES
The Funds have an investment advisory agreement with Scharf Investments, LLC (the “Adviser”) pursuant to which the Adviser is responsible for providing investment management services to the Funds. The
Adviser furnishes all investment
65
SCHARF FUNDS
NOTES TO FINANCIAL STATEMENTS at September 30, 2021, Continued
advice, office space and facilities, and provides most of the personnel needed by each Fund. As compensation for its services, the Adviser is entitled to a fee, computed daily and payable monthly. The
Scharf Fund pays fees calculated at an annual rate of 0.78% based upon the average daily net assets of the Fund. The Scharf Multi-Asset Opportunity Fund, the Scharf Global Opportunity Fund, and the Scharf Alpha Opportunity Fund pay fees calculated at
an annual rate of 0.99% based upon the average daily net assets of each Fund. For the year ended September 30, 2021, the advisory fees incurred by the Funds are disclosed in the statements of operations.
The Funds are responsible for their own operating expenses. The Adviser has contractually agreed to reduce fees payable to it by the Funds and to pay Fund operating expenses (excluding class specific
expenses such as the 0.25% 12b-1 fees applied to the Retail Class and 0.10% shareholder servicing fees applied to both the Institutional Class and Retail Class, acquired fund fees and expenses, interest expense, dividends on securities sold short,
taxes and extraordinary expenses) to the extent necessary to limit the Fund’s aggregate annual operating expenses as follows:
|
Expense Caps
|
||
|
Scharf Fund
|
0.79%
|
|
|
Scharf Multi-Asset Opportunity Fund
|
0.88%
|
|
|
Scharf Global Opportunity Fund
|
0.54%
|
|
|
Scharf Alpha Opportunity Fund
|
0.65%
|
|
|
Percent of average daily net assets of each Fund.
|
Any such reduction made by the Adviser in its fees or payment of expenses which are the Funds’ obligation are subject to reimbursement by the Funds to the Adviser, if so requested by the Adviser, in any
subsequent month in the 36-month period from the date of the management fee reduction and expense payment if the aggregate amount actually paid by the Funds toward the operating expenses for such fiscal year (taking into the account the
reimbursement) will not cause the Fund to exceed the lesser of: (1) the expense limitation in place at the time of the management fee reduction and expense payment: or (2) the expense limitation in place at the time of the reimbursement. Any such
reimbursement is also contingent upon Board of Trustees review and approval at the time the reimbursement is made. Such reimbursement may not be paid prior to the Funds’ payment of current ordinary operating expenses. For the year ended September
30, 2021, the Adviser reduced its fees in the amount of $331,385, $246,375, $257,887, and $175,626, for the Scharf Fund, the Scharf Multi-Asset Opportunity Fund, the Scharf Global Opportunity Fund, and the Scharf Alpha Opportunity Fund, respectively.
66
SCHARF FUNDS
NOTES TO FINANCIAL STATEMENTS at September 30, 2021, Continued
No amounts were recouped by the Adviser. The expense limitation for the Funds will remain in effect through at least January 27, 2022. The Expense Caps may be terminated only by the Board of Trustees
(the “Board”) of the Trust. The Adviser may recapture portions of the amounts shown below no later than the corresponding dates:
|
Scharf Fund
|
Scharf Multi-Asset
Opportunity
Fund
|
Scharf Global
Opportunity
Fund
|
Scharf Alpha
Opportunity
Fund
|
|||||||||||||||
|
Year
|
Amount
|
Year
|
Amount
|
Year
|
Amount
|
Year
|
Amount
|
|||||||||||
|
9/30/22
|
$
|
399,212
|
9/30/22
|
$
|
243,918
|
9/30/22
|
$
|
282,233
|
9/30/22
|
$
|
218,755
|
|||||||
|
9/30/23
|
332,172
|
9/30/23
|
232,919
|
9/30/23
|
233,218
|
9/30/23
|
196,629
|
|||||||||||
|
9/30/24
|
331,385
|
9/30/24
|
246,375
|
9/30/24
|
257,887
|
9/30/24
|
175,626
|
|||||||||||
|
$
|
1,062,769
|
$
|
723,212
|
$
|
773,338
|
$
|
591,010
|
|||||||||||
Fund Services serves as the Funds’ administrator, fund accountant and transfer agent. U.S. Bank N.A. serves as Custodian (the “Custodian”) to the Funds. The Custodian is an affiliate of Fund Services.
Fund Services maintains the Funds’ books and records, calculates the Funds’ NAV, prepares various federal and state regulatory filings, coordinates the payment of fund expenses, reviews expense accruals and prepares materials supplied to the Board of
Trustees. The officers of the Trust, the Deputy Chief Compliance Officer and the Chief Compliance Officer, are employees of Fund Services. Fees paid by the Funds for these services for the year ended September 30, 2021, are disclosed in the
statements of operations.
Quasar Distributors, LLC (“Quasar”) acts as the Funds’ principal underwriter in a continuous public offering of the Funds’ shares. Quasar is a wholly-owned broker-dealer subsidiary of Foreside Financial
Group, LLC. On July 7, 2021, Foreside announced that it had entered into a definitive purchase and sale agreement with Genstar Capital (“Genstar”) such that Genstar would acquire a majority stake in Foreside. The Board approved continuing the
distribution agreement with Quasar at the close of the transaction which occurred on September 30, 2021.
NOTE 5 – 12B-1 DISTRIBUTION FEES
The Retail Class of each Fund has adopted a Distribution Plan pursuant to Rule 12b-1 (the “Plan”). The Plan permits each class to pay for distribution and related expenses up to an annual rate of 0.25%
of its average daily net assets. The expenses covered by the Plan may include the cost in connection with the promotion and distribution of shares and the provision of personal services to shareholders, including, but not necessarily limited to,
advertising, compensation to underwriters, dealers and selling personnel, the printing and mailing of prospectuses to other than current Fund shareholders, and the printing and mailing of sales literature. Payments made pursuant to the Plan will
represent compensation for distribution and service
67
SCHARF FUNDS
NOTES TO FINANCIAL STATEMENTS at September 30, 2021, Continued
activities, not reimbursements for specific expenses incurred. For the year ended September 30, 2021, the 12b-1 fees accrued by each Fund’s Retail Class are disclosed in the statements of operations.
NOTE 6 – SHAREHOLDER SERVICING FEE
The Funds have entered into a Shareholder Servicing Agreement (the “Agreement”) with the Adviser, under which the Funds may pay servicing fees up to an annual rate of 0.10% of the average daily net
assets of each Fund. Payments to the Adviser under the Agreement may reimburse the Adviser for payments it makes to selected brokers, dealers and administrators which have entered into service agreements with the Adviser for services provided to
shareholders of the Funds. The services provided by such intermediaries are primarily designed to assist shareholders of the Funds and include the furnishing of office space and equipment, telephone facilities, personnel and assistance to the Funds
in servicing such shareholders. Services provided by such intermediaries also include the provision of support services to the Funds and include establishing and maintaining shareholders’ accounts and record processing, purchase and redemption
transactions, answering routine client inquiries regarding the Funds, and providing such other personal services to shareholders as the Funds may reasonably request. For the year ended September 30, 2021, the shareholder servicing fees accrued by the
Funds are disclosed in the statements of operations.
NOTE 7 – LINES OF CREDIT
The Scharf Fund, Scharf Multi-Asset Opportunity Fund, Scharf Global Opportunity Fund, and Scharf Alpha Opportunity Fund have secured lines of credit in the amount of $20,000,000, $5,000,000, $2,200,000,
and $1,000,000, respectively. These lines of credit are intended to provide short-term financing, if necessary, subject to certain restrictions, in connection with shareholder redemptions. The credit facility is with the Funds’ custodian, U.S. Bank
N.A. During the year ended September 30, 2021, the Scharf Multi-Asset Opportunity Fund did not draw upon its line of credit. During the year ended September 30, 2021, the Scharf Fund, Scharf Global Opportunity Fund and the Scharf Alpha Opportunity
Fund drew on its line of credit.
The Scharf Fund had an outstanding average balance of $20,397, paid a weighted average interest rate of 3.25%, and incurred interest expense of $672. During the year ended September 30, 2021, the
maximum borrowing by the Fund was $2,551,000.
The Scharf Global Opportunity Fund had an outstanding average balance of $3,364, paid a weighted average interest rate of 3.25%, and incurred interest expense of $125. During the year ended September
30, 2021, the maximum borrowing by the Fund was $377,000.
68
SCHARF FUNDS
NOTES TO FINANCIAL STATEMENTS at September 30, 2021, Continued
The Scharf Alpha Opportunity Fund had an outstanding average balance of $5,310, paid a weighted average interest rate of 3.25%, and incurred interest expense of $175. During the year ended September
30, 2021, the maximum borrowing by the Fund was $320,000.
At September 30, 2021, the Funds had no outstanding loan amounts.
NOTE 8 – PURCHASES AND SALES OF SECURITIES
For the year ended September 30, 2021, the cost of purchases and the proceeds from sales of securities, excluding short-term securities, were as follows:
|
Purchases
|
Sales
|
||||||||
|
Scharf Fund
|
$
|
110,599,305
|
$
|
129,614,279
|
|||||
|
Scharf Multi-Asset Opportunity Fund
|
13,408,678
|
17,060,404
|
|||||||
|
Scharf Global Opportunity Fund
|
10,966,289
|
8,698,127
|
|||||||
|
Scharf Alpha Opportunity Fund
|
2,126,880
|
6,613,889
|
|||||||
During the year ended September 30, 2021, there were no purchases and sales of U.S. Government securities in any of the Funds.
For the year ended September 30, 2021, the Scharf Alpha Opportunity Fund had $213,826 and $3,057,538 of proceeds from short sales and buy cover transactions, respectively.
NOTE 9 – INCOME TAXES AND DISTRIBUTIONS TO SHAREHOLDERS
As of September 30, 2021, the components of accumulated earnings/(losses) on a tax basis were as follows:
|
Scharf
|
||||||||
|
Multi-Asset
|
||||||||
|
Scharf
|
Opportunity
|
|||||||
|
Fund
|
Fund
|
|||||||
|
Cost of investments (a)
|
$
|
283,666,238
|
$
|
38,574,762
|
||||
|
Gross unrealized appreciation
|
124,433,934
|
12,581,848
|
||||||
|
Gross unrealized depreciation
|
(8,008,398
|
)
|
(671,104
|
)
|
||||
|
Net unrealized appreciation (a)
|
116,425,536
|
11,910,744
|
||||||
|
Net unrealized appreciation on foreign currency
|
1,637
|
162
|
||||||
|
Undistributed ordinary income
|
3,930,518
|
631,478
|
||||||
|
Undistributed long-term capital gains
|
32,836,899
|
3,678,367
|
||||||
|
Total distributable earnings
|
36,767,417
|
4,309,845
|
||||||
|
Other accumulated gains/(losses)
|
—
|
(25,481
|
)
|
|||||
|
Total accumulated earnings/(losses)
|
$
|
153,194,590
|
$
|
16,195,270
|
||||
69
SCHARF FUNDS
NOTES TO FINANCIAL STATEMENTS at September 30, 2021, Continued
|
Scharf Global
|
Scharf Alpha
|
|||||||
|
Opportunity
|
Opportunity
|
|||||||
|
Fund
|
Fund
|
|||||||
|
Cost of investments (a)
|
$
|
20,890,192
|
$
|
3,375,125
|
||||
|
Gross unrealized appreciation
|
6,395,257
|
2,228,413
|
||||||
|
Gross unrealized depreciation
|
(1,283,738
|
)
|
(1,757,803
|
)
|
||||
|
Net unrealized appreciation (a)
|
5,111,519
|
470,610
|
||||||
|
Net unrealized appreciation/(depreciation)
|
||||||||
|
on foreign currency
|
(102
|
)
|
127
|
|||||
|
Undistributed ordinary income
|
438,967
|
—
|
||||||
|
Undistributed long-term capital gains
|
2,066,490
|
248,454
|
||||||
|
Total distributable earnings
|
2,505,457
|
248,454
|
||||||
|
Other accumulated gains/(losses)
|
286,591
|
282,353
|
||||||
|
Total accumulated earnings/(losses)
|
$
|
7,903,465
|
$
|
1,001,544
|
||||
|
(a)
|
The difference between book-basis and tax-basis cost and unrealized appreciation is attributable primarily to the tax deferral of losses on wash sales, tax adjustments related to partnerships,
tax equalization and transfer in-kind.
|
At September 30, 2021, the Scharf Alpha Opportunity Fund had a late year loss deferral of $9,216.
The tax character of distributions paid during the years ended September 30, 2021 and September 30, 2020 was as follows:
|
September 30, 2021
|
September 30, 2020
|
||||||||||||||||
|
Ordinary
|
Long-Term
|
Ordinary
|
Long-Term
|
||||||||||||||
|
Income
|
Capital Gains
|
Income
|
Capital Gains
|
||||||||||||||
|
Scharf Fund
|
$
|
2,929,952
|
$
|
10,049,574
|
$
|
1,639,766
|
$
|
27,857,436
|
|||||||||
|
Scharf Multi-Asset
|
|||||||||||||||||
|
Opportunity Fund
|
470,643
|
1,336,241
|
571,880
|
2,755,717
|
|||||||||||||
|
Scharf Global
|
|||||||||||||||||
|
Opportunity Fund
|
148,519
|
299,788
|
265,211
|
1,483,740
|
|||||||||||||
|
Scharf Alpha
|
|||||||||||||||||
|
Opportunity Fund
|
5,521
|
—
|
60,850
|
—
|
|||||||||||||
The Funds designated as long-term capital gain dividend, pursuant to Internal Revenue Code Section 852(b)(3), the amount necessary to reduce the earnings and profits of the Funds related to net capital gain to zero for the tax year ended September 30, 2021.
70
SCHARF FUNDS
NOTES TO FINANCIAL STATEMENTS at September 30, 2021, Continued
NOTE 10 – CONTROL OWNERSHIP
The beneficial ownership, either directly or indirectly, of more than 25% of the voting securities of a fund creates a presumption of control of the fund, under Section 2(a)(9) of the 1940 Act. As of
September 30, 2021, each Fund’s percentage of control ownership positions greater than 25% are as follows:
|
Scharf Fund
|
Retail Class
|
Institutional Class
|
|
Morgan Stanley Smith Barney LLC
|
—
|
47.75%
|
|
National Financial Services LLC
|
89.67%
|
—
|
|
Scharf Multi-Asset Opportunity Fund
|
Retail Class
|
Institutional Class
|
|
Charles Schwab & Co., Inc.
|
79.56%
|
87.63%
|
|
Scharf Global Opportunity Fund
|
Retail Class
|
|
|
Charles Schwab & Co., Inc.
|
53.50%
|
|
|
Brian Alan Krawez and Karen Krawez Trust
|
28.62%
|
|
|
Scharf Alpha Opportunity Fund
|
Retail Class
|
|
|
Charles Schwab & Co., Inc.
|
80.03%
|
NOTE 11 – PRINCIPAL RISKS
Below is a summary of some, but not all, of the principal risks of investing in the Funds, each of which may adversely affect a Fund’s net asset value and total return. The Funds’ most recent prospectus
provides further descriptions of each Fund’s investment objective, principal investment strategies and principal risks.
|
•
|
Foreign and Emerging Market Securities Risk. Investments in foreign currencies and foreign issuers are subject to additional risks, including political
and economic risks, greater volatility, civil conflicts and war, sanctions or other measures by the United States or other governments, liquidity risks, currency fluctuations, higher transaction costs, delayed settlement, possible foreign
controls on investment, expropriation and nationalization risks, and less stringent investor protection and disclosure standards of foreign markets. Events and evolving conditions in certain economies or markets may alter the risks
associated with investments tied to countries or regions that historically were perceived as comparatively stable becoming riskier and more volatile. These risks are magnified in countries in “emerging markets.” Emerging market countries
typically have less-established market economies than developed countries and may face greater social, economic, regulatory and political uncertainties. In addition, emerging markets typically present greater illiquidity and price volatility
concerns due to smaller or limited local capital markets and greater difficulty in determining market valuations of securities due to limited public information on issuers.
|
71
SCHARF FUNDS
NOTES TO FINANCIAL STATEMENTS at September 30, 2021, Continued
|
•
|
Investment Style Risk. The Adviser follows an investing style that favors relatively low valuations. At times when this style is out of favor, the
Funds may underperform funds that use different investing styles.
|
|
|
•
|
Small-and Medium-Sized Company Risk. Small- and medium-sized companies often have less predictable earnings, more limited product lines, markets,
distribution channels or financial resources and the management of such companies may be dependent upon one or few key people. The market movements of equity securities of small- and medium-sized companies may be more abrupt and volatile
than the market movements of equity securities of larger, more established companies or the stock market in general and small-sized companies in particular, are generally less liquid than the equity securities of larger companies.
|
|
|
•
|
Special Situations Risk. There is a risk that the special situation (i.e., spin-off, liquidation, merger, etc.) might not occur, which could have a negative impact on the price of the issuer’s securities and fail to produce gains or produce a loss for a Fund. In addition, investments in special situation
companies may be illiquid and difficult to value, which will require the Fund to employ fair value procedures to value its holdings in such investments.
|
|
|
•
|
Market and Regulatory Risk. Events in the financial markets and economy may cause volatility and uncertainty and adversely impact a Fund’s performance.
Market events may affect a single issuer, industry, sector, or the market as a whole. Traditionally liquid investments may experience periods of diminished liquidity. Governmental and regulatory actions, including tax law changes, may also
impair portfolio management and have unexpected or adverse consequences on particular markets, strategies, or investments. The Funds’ investments may decline in value due to factors affecting individual issuers (such as the results of supply
and demand), or sectors within the securities markets. The value of a security or other investment also may go up or down due to general market conditions that are not specifically related to a particular issuer, such as real or perceived
adverse economic conditions, changes in interest rates or exchange rates, or adverse investor sentiment generally. In addition, unexpected events and their aftermaths, such as the spread of deadly diseases; natural, environmental or man-made
disasters; financial, political or social disruptions; terrorism and war; and other tragedies or catastrophes, can cause investor fear and panic, which can adversely affect the economies of many companies, sectors, nations, regions and the
market in general, in ways that cannot necessarily be foreseen.
|
72
SCHARF FUNDS
NOTES TO FINANCIAL STATEMENTS at September 30, 2021, Continued
|
•
|
Short Sales Risk (Scharf Alpha Opportunity Fund). A short sale is the sale by the Fund of a security which it does not own in anticipation of purchasing
the same security in the future at a lower price to close the short position. A short sale will be successful if the price of the shorted security decreases. However, if the underlying security goes up in price during the period in which
the short position is outstanding, the Fund will realize a loss. The risk on a short sale is unlimited because the Fund must buy the shorted security at the higher price to complete the transaction. Therefore, short sales may be subject to
greater risks than investments in long positions.
|
|
|
•
|
Leverage Risk (Scharf Alpha Opportunity Fund). Leverage is investment exposure which exceeds the initial amount invested. Leverage can cause the
portfolio to lose more than the principal amount invested. Leverage can magnify the portfolio’s gains and losses and therefore increase its volatility.
|
NOTE 12 – SUBSEQUENT EVENT
The Board of Trustees of Advisors Series Trust (the “Trust”) has approved an Agreement and Plan of Reorganization whereby the Scharf Alpha Opportunity Fund (the “Acquired Fund”) will reorganize and
merge into the Scharf Multi-Asset Opportunity Fund (the “Acquiring Fund”), also a series of the Trust (the “Reorganization). The reorganization will be structured as a tax-free reorganization for federal tax purposes.
The Reorganization, which is expected to be tax-free to the shareholders of the Acquired Fund and which is subject to a number of closing conditions, will entail the transfer of all of the assets and
liabilities of the Acquired Fund to the Acquiring Fund, in exchange for shares of the Acquiring Fund. Shareholders of the Acquired Fund will then receive shares of the Acquiring Fund equivalent in aggregate net asset value to the aggregate net asset
value of their shares in the Acquired Fund at the time of the Reorganization. The Acquired Fund will then be dissolved. These events are currently expected to occur on or about the close of business on December 10, 2021.
Refer to the supplement to the summary prospectus dated October 20, 2021.
73
SCHARF FUNDS
REPORT OF INDEPENDENT REGISTERED PUBLIC ACCOUNTING FIRM
To the Board of Trustees Advisors Series Trust and Shareholders of:
Scharf Funds
Opinion on the Financial Statements
We have audited the accompanying statements of assets and liabilities of the Scharf Fund, the Scharf Multi-Asset Opportunity Fund, the Scharf Global Opportunity Fund, and the Scharf Alpha Opportunity
Fund (the “Funds”), each a series of Advisors Series Trust (the “Trust”), including the schedules of investments, as of September 30, 2021, the related statements of operations and cash flow for the year then ended, the statement of changes in net
assets and the financial highlights for each of the periods indicated in the table below, and the related notes (collectively referred to as the “financial statements”). In our opinion, the financial statements and financial highlights referred to
above present fairly, in all material respects, the financial position of the Scharf Fund, the Scharf Multi-Asset Opportunity Fund, the Scharf Global Opportunity Fund, and the Scharf Alpha Opportunity Fund as of September 30, 2021, the results of
their operations, the changes in their net assets and their financial highlights for each of the periods indicated in the table below, in conformity with accounting principles generally accepted in the United States of America.
|
Individual Funds
|
Statements of
|
|||
|
constituting
|
Statement of
|
changes in
|
Statement of
|
|
|
Scharf Funds
|
operations
|
net assets
|
cash flow
|
Financial highlights
|
|
Scharf Fund, the
|
For the
|
For each of the
|
Not Applicable
|
For each of the five years
|
|
Scharf Multi-Asset
|
year ended
|
two years in the
|
in the period ended
|
|
|
Opportunity Fund,
|
September 30,
|
period ended
|
September 30, 2021.
|
|
|
the Scharf Global
|
2021
|
September 30,
|
||
|
Opportunity Fund
|
2021
|
|||
|
Scharf Alpha
|
For the
|
For each of the
|
For the
|
For each of the five years
|
|
Opportunity Fund
|
year ended
|
two years in the
|
year ended
|
in the period ended
|
|
September 30,
|
period ended
|
September 30,
|
September 30, 2021.
|
|
|
2021
|
September 30,
|
2021
|
||
|
2021
|
Basis for Opinion
These financial statements are the responsibility of the Funds’ management. Our responsibility is to express an opinion on the Funds’ financial statements based on our audits. We are a public
accounting firm registered with the Public Company Accounting Oversight Board (United States) (“PCAOB”) and are required to be independent with respect to the Funds in accordance with the U.S. federal securities laws and the applicable rules and
regulations of the Securities and Exchange Commission and the PCAOB. We have served as the auditor of one or more of the funds in the Trust since 2003.
74
SCHARF FUNDS
REPORT OF INDEPENDENT REGISTERED PUBLIC ACCOUNTING FIRM, Continued
We conducted our audits in accordance with the standards of the PCAOB. Those standards require that we plan and perform the audits to obtain reasonable assurance about whether the financial statements
are free of material misstatement, whether due to error or fraud. The Funds are not required to have, nor were we engaged to perform, an audit of the Funds’ internal control over financial reporting. As part of our audits we are required to obtain
an understanding of internal control over financial reporting, but not for the purpose of expressing an opinion on the effectiveness of the Funds’ internal control over financial reporting. Accordingly, we express no such opinion.
Our audits included performing procedures to assess the risks of material misstatement of the financial statements, whether due to error or fraud, and performing procedures that respond to those risks.
Such procedures included examining, on a test basis, evidence regarding the amounts and disclosures in the financial statements. Our audits also included evaluating the accounting principles used and significant estimates made by management, as well
as evaluating the overall presentation of the financial statements. Our procedures included confirmation of securities owned as of September 30, 2021 by correspondence with the custodian and brokers or by other appropriate auditing procedures where
replies were not received. We believe that our audits provide a reasonable basis for our opinion.
TAIT, WELLER & BAKER LLP
Philadelphia, Pennsylvania
November 29, 2021
75
SCHARF FUNDS
NOTICE TO SHAREHOLDERS at September 30, 2021 (Unaudited)
For the year ended September 30, 2021, the Scharf Fund, the Scharf Multi-Asset Opportunity Fund, the Scharf Global Opportunity Fund, and the Scharf Alpha Opportunity Fund designated $2,929,952,
$470,643, $148,519 and $5,521, respectively, as ordinary income. The Scharf Fund, Scharf Multi-Asset Opportunity Fund, the Scharf Global Opportunity Fund, and the Scharf Alpha Opportunity Fund designated $10,049,574, $1,336,241, $299,788 and $0,
respectively, as long-term capital gains for purposes of the dividends paid deduction.
For the year ended September 30, 2021, certain dividends paid by the Funds may be subject to a maximum tax rate of 23.8%, as provided by the Jobs and Growth Tax Relief Reconciliation Act of 2003. The
percentage of dividends declared from net investment income designated as qualified dividend income for the Scharf Fund, the Scharf Multi-Asset Opportunity Fund, the Scharf Global Opportunity Fund, and the Scharf Alpha Opportunity Fund was 100%,
97.51%, 100%, and 100%, respectively.
For corporate shareholders in the Scharf Fund, the Scharf Multi-Asset Opportunity Fund, the Scharf Global Opportunity Fund, and the Scharf Alpha Opportunity Fund the percent of ordinary income
distributions qualifying for the corporate dividends received deduction for the year ended September 30, 2021 was 98.44%, 85.39%, 64.52%, and 100%, respectively.
The percentage of taxable ordinary income distributions that are designated as short-term capital gain distributions under Internal Revenue Section 871(k)(2)(C) for the Scharf Fund, the Scharf
Multi-Asset Opportunity Fund, the Scharf Global Opportunity Fund, and the Scharf Alpha Opportunity Fund was 12.18%, 12.68%, 0%, and 0%, respectively.
How to Obtain a Copy of the Funds’ Proxy Voting Policies
A description of the policies and procedures that the Funds use to determine how to vote proxies relating to portfolio securities is available without charge upon request by calling 1-866-572-4273
(1-866-5SCHARF) or on the U.S. Securities and Exchange Commission’s (“SEC”) website at http://www.sec.gov.
How to Obtain a Copy of the Funds’ Proxy Voting Records for the 12-Month Period Ended June 30
Information regarding how the Funds voted proxies relating to portfolio securities during the most recent 12-month period ended June 30 is available without charge, upon request, by calling
1-866-572-4273 (1-866-5SCHARF). Furthermore, you can obtain the Funds’ proxy voting records on the SEC’s website at http://www.sec.gov.
76
SCHARF FUNDS
NOTICE TO SHAREHOLDERS at September 30, 2021 (Unaudited), Continued
Quarterly Filings on Form N-PORT
The Funds file their complete schedule of portfolio holdings with the SEC for the first and third quarters of each fiscal year on Part F of Form N-PORT. The Funds’ Form N-PORT are available on the SEC’s
website at http://www.sec.gov. Information included in the Funds’ Form N-PORT is also available by calling 1-866-572-4273 (1-866-5SCHARF).
77
SCHARF FUNDS
INFORMATION ABOUT TRUSTEES AND OFFICERS (Unaudited)
This chart provides information about the Trustees and Officers who oversee the Funds. Officers elected by the Trustees manage the day-to-day operations of the Funds and execute policies formulated by
the Trustees.
Independent Trustees(1)
|
Term of
|
Number of
|
||||
|
Office
|
Portfolios
|
Other
|
|||
|
Position
|
and
|
Principal
|
in Fund
|
Directorships
|
|
|
Held
|
Length
|
Occupation
|
Complex
|
Held During
|
|
|
Name, Address
|
with the
|
of Time
|
During Past
|
Overseen by
|
Past Five
|
|
and Age
|
Trust
|
Served*
|
Five Years
|
Trustee(2)
|
Years(3)
|
|
Gail S. Duree
|
Trustee
|
Indefinite
|
Director, Alpha
|
4
|
Trustee,
|
|
(age 75)
|
term; since
|
Gamma Delta Housing
|
Advisors
|
||
|
615 E. Michigan Street
|
March
|
Corporation (collegiate
|
Series Trust
|
||
|
Milwaukee, WI 53202
|
2014.
|
housing management)
|
(for series not
|
||
|
(2012 to July 2019);
|
affiliated with
|
||||
|
Trustee and Chair (2000
|
the Funds).
|
||||
|
to 2012), New Covenant
|
|||||
|
Mutual Funds (1999 to
|
|||||
|
2012); Director and
|
|||||
|
Board Member, Alpha
|
|||||
|
Gamma Delta Foundation
|
|||||
|
(philanthropic
|
|||||
|
organization)
|
|||||
|
(2005 to 2011).
|
|||||
|
David G. Mertens
|
Trustee
|
Indefinite
|
Partner and Head of
|
4
|
Trustee,
|
|
(age 61)
|
term; since
|
Business Development
|
Advisors
|
||
|
615 E. Michigan Street
|
March
|
Ballast Equity
|
Series Trust
|
||
|
Milwaukee, WI 53202
|
2017.
|
Management, LLC
|
(for series not
|
||
|
(a privately-held
|
affiliated with
|
||||
|
investment advisory firm)
|
the Funds).
|
||||
|
(February 2019 to present);
|
|||||
|
Managing Director and
|
|||||
|
Vice President, Jensen
|
|||||
|
Investment Management,
|
|||||
|
Inc. (a privately-held
|
|||||
|
investment advisory
|
|||||
|
firm) (2002 to 2017).
|
78
SCHARF FUNDS
INFORMATION ABOUT TRUSTEES AND OFFICERS (Unaudited), Continued
|
Term of
|
Number of
|
||||
|
Office
|
Portfolios
|
Other
|
|||
|
Position
|
and
|
Principal
|
in Fund
|
Directorships
|
|
|
Held
|
Length
|
Occupation
|
Complex
|
Held During
|
|
|
Name, Address
|
with the
|
of Time
|
During Past
|
Overseen by
|
Past Five
|
|
and Age
|
Trust
|
Served*
|
Five Years
|
Trustee(2)
|
Years(3)
|
|
Joe D. Redwine
|
Trustee
|
Indefinite
|
Retired; formerly
|
4
|
Trustee,
|
|
(age 74)
|
term; since
|
Manager, President,
|
Advisors
|
||
|
615 E. Michigan Street
|
September
|
CEO, U.S. Bancorp Fund
|
Series Trust
|
||
|
Milwaukee, WI 53202
|
2008.
|
Services, LLC and its
|
(for series not
|
||
|
predecessors (May 1991
|
affiliated with
|
||||
|
to July 2017).
|
the Funds).
|
||||
|
Raymond B. Woolson
|
Chairman
|
Indefinite
|
President, Apogee
|
4
|
Trustee,
|
|
(age 62)
|
of the
|
term; since
|
Group, Inc. (financial
|
Advisors
|
|
|
615 E. Michigan Street
|
Board
|
January
|
consulting firm)
|
Series Trust
|
|
|
Milwaukee, WI 53202
|
2020.
|
(1998 to present).
|
(for series not
|
||
|
affiliated with
|
|||||
|
Trustee
|
Indefinite
|
the Funds);
|
|||
|
term; since
|
Independent
|
||||
|
January
|
Trustee,
|
||||
|
2016.
|
DoubleLine
|
||||
|
Funds Trust
|
|||||
|
(an open-end
|
|||||
|
investment
|
|||||
|
company with
|
|||||
|
20 portfolios),
|
|||||
|
DoubleLine
|
|||||
|
Opportunistic
|
|||||
|
Credit Fund,
|
|||||
|
DoubleLine
|
|||||
|
Selective
|
|||||
|
Credit Fund
|
|||||
|
and
|
|||||
|
DoubleLine
|
|||||
|
Income
|
|||||
|
Solutions
|
|||||
|
Fund, from
|
|||||
|
2010 to
|
|||||
|
present.
|
79
SCHARF FUNDS
INFORMATION ABOUT TRUSTEES AND OFFICERS (Unaudited), Continued
Officers
|
Term of Office
|
|||
|
Name, Address
|
Position Held
|
and Length of
|
Principal Occupation
|
|
and Age
|
with the Trust
|
Time Served
|
During Past Five Years
|
|
Jeffrey T. Rauman
|
President, Chief
|
Indefinite
|
Senior Vice President, Compliance and
|
|
(age 52)
|
Executive Officer
|
term; since
|
Administration, U.S. Bank Global Fund
|
|
615 E. Michigan Street
|
and Principal
|
December 2018.
|
Services (February 1996 to present).
|
|
Milwaukee, WI 53202
|
Executive Officer
|
||
|
Cheryl L. King
|
Vice President,
|
Indefinite
|
Vice President, Compliance and
|
|
(age 60)
|
Treasurer and
|
term; since
|
Administration, U.S. Bank Global Fund
|
|
615 E. Michigan Street
|
Principal
|
December 2007.
|
Services (October 1998 to present).
|
|
Milwaukee, WI 53202
|
Financial Officer
|
||
|
Kevin J. Hayden
|
Assistant
|
Indefinite
|
Vice President, Compliance
|
|
(age 50)
|
Treasurer
|
term; since
|
and Administration, U.S. Bank Global
|
|
615 E. Michigan Street
|
September 2013.
|
Fund Services (June 2005 to present).
|
|
|
Milwaukee, WI 53202
|
|||
|
Richard R. Conner
|
Assistant
|
Indefinite
|
Assistant Vice President, Compliance
|
|
(age 39)
|
Treasurer
|
term; since
|
and Administration, U.S. Bank Global
|
|
615 E. Michigan Street
|
December 2018.
|
Fund Services (July 2010 to present).
|
|
|
Milwaukee, WI 53202
|
|||
|
Michael L. Ceccato
|
Vice President,
|
Indefinite
|
Senior Vice President, U.S. Bank
|
|
(age 64)
|
Chief Compliance
|
term; since
|
Global Fund Services and Vice
|
|
615 E. Michigan Street
|
Officer and
|
September 2009.
|
President, U.S. Bank N.A. (February
|
|
Milwaukee, WI 53202
|
AML Officer
|
2008 to present).
|
|
|
Michelle L.
|
Deputy Chief
|
Indefinite
|
Vice President, U.S. Bank
|
|
Sanville-Seebold
|
Compliance
|
term; since
|
Global Fund Services
|
|
(age 49)
|
Officer
|
September
|
(August 2014 to present).
|
|
615 E. Michigan Street
|
2021
|
||
|
Milwaukee, WI 53202
|
80
SCHARF FUNDS
INFORMATION ABOUT TRUSTEES AND OFFICERS (Unaudited), Continued
|
Term of Office
|
|||
|
Name, Address
|
Position Held
|
and Length of
|
Principal Occupation
|
|
and Age
|
with the Trust
|
Time Served
|
During Past Five Years
|
|
Elaine E. Richards, Esq.
|
Vice President
|
Indefinite
|
Senior Vice President, U.S. Bank
|
|
(age 53)
|
and Secretary
|
term; since
|
Global Fund Services (July 2007 to
|
|
2020 East Financial Way,
|
September 2019.
|
present).
|
|
|
Suite 100
|
|||
|
Glendora, CA 91741
|
|
*
|
The Trustees have designated a mandatory retirement age of 75, such that each Trustee, serving as such on the date he or she reaches the age of 75, shall submit his or her resignation not later
than the last day of the calendar year in which his or her 75th birthday occurs (“Retiring Trustee”). Upon request, the Board may, by vote of a majority of Trustees eligible to vote on such matter, determine whether or not to extend such
Retiring Trustee’s term and on the length of a one-time extension of up to three additional years.
|
|
(1)
|
The Trustees of the Trust who are not “interested persons” of the Trust as defined under the 1940 Act (“Independent Trustees”).
|
|
(2)
|
As of September 30, 2021, the Trust was comprised of 36 active portfolios managed by unaffiliated investment advisers. The term “Fund Complex” applies only to the Funds. The Funds do not hold
themselves out as related to any other series within the Trust for investment purposes, nor does it share the same investment adviser with any other series.
|
|
(3)
|
“Other Directorships Held” includes only directorships of companies required to register or file reports with the SEC under the Securities Exchange Act of 1934, as amended, (that is, “public
companies”) or other investment companies registered under the 1940 Act.
|
The Statement of Additional Information includes additional information about the Funds’ Trustees and Officers and is available, without charge, upon request by calling 1-866-572-4273.
81
SCHARF FUNDS
HOUSEHOLDING
In an effort to decrease costs, the Funds will reduce the number of duplicate prospectuses, supplements, and certain other shareholder documents that you receive by sending only one copy of each to
those addresses shown by two or more accounts. Please call the Funds’ transfer agent toll free at 1-866-572-4273 (1-866-5SCHARF) to request individual copies of these documents. The Funds will begin sending individual copies 30 days after receiving
your request. This policy does not apply to account statements.
82
SCHARF FUNDS
PRIVACY NOTICE
The Funds collect non-public information about you from the following sources:
• Information we receive about you on
applications or other forms;
• Information you give us orally;
and/or
• Information about your transactions
with us or others.
We do not disclose any non-public personal information about our customers or former customers without the customer’s authorization, except as permitted by law or in response to inquiries from
governmental authorities. We may share information with affiliated and unaffiliated third parties with whom we have contracts for servicing the Funds. We will provide unaffiliated third parties with only the information necessary to carry out their
assigned responsibilities. We maintain physical, electronic and procedural safeguards to guard your non-public personal information and require third parties to treat your personal information with the same high degree of confidentiality.
In the event that you hold shares of the Funds through a financial intermediary, including, but not limited to, a broker-dealer, bank, or trust company, the privacy policy of your financial intermediary
would govern how your non-public personal information would be shared by those entities with unaffiliated third parties.
83
(This Page Intentionally Left Blank.)
Investment Adviser
Scharf Investments, LLC
16450 Los Gatos Blvd., Suite 207
Los Gatos, CA 95032
Distributor
Quasar Distributors, LLC
111 East Kilbourn Avenue, Suite 2200
Milwaukee, WI 53202
Custodian
U.S. Bank National Association
Custody Operations
1555 North RiverCenter Drive, Suite 302
Milwaukee, WI 53212
Transfer Agent
U.S. Bank Global Fund Services
615 East Michigan Street
Milwaukee, WI 53202
(866) 572-4273
Independent Registered Public Accounting Firm
Tait, Weller & Baker LLP
Two Liberty Place
50 South 16th Street, Suite 2900
Philadelphia, PA 19102
Legal Counsel
Sullivan & Worcester LLP
1633 Broadway, 32nd Floor
New York, NY 10019
This report is intended for shareholders of the Funds and may not be used as sales literature unless preceded or accompanied by a current prospectus. For a current prospectus please call
(866)-5SCHARF. Statements and other information herein are dated and are subject to change.
(b) Not Applicable
Item 2. Code of Ethics.
The registrant has adopted a code of ethics that applies to the registrant’s principal executive officer and principal financial officer. The registrant has not made any substantive amendments to its code of ethics during the period covered by
this report. The registrant has not granted any waivers from any provisions of the code of ethics during the period covered by this report.
A copy of the registrant’s Code of Ethics is filed herewith.
Item 3. Audit Committee Financial Expert.
The registrant’s Board of Trustees has determined that there is at least one audit committee financial expert serving on its audit committee. Ms. Gail S. Duree is the “audit committee financial expert” and is considered to be “independent” as
each term is defined in Item 3 of Form N‑CSR.
Item 4. Principal Accountant Fees and Services.
The registrant has engaged its principal accountant to perform audit services, audit-related services, tax services and other services during the past two fiscal years. “Audit services” refer to performing an audit of the registrant's annual
financial statements or services that are normally provided by the accountant in connection with statutory and regulatory filings or engagements for those fiscal years. “Audit-related services” refer to the assurance and related services by the
principal accountant that are reasonably related to the performance of the audit. “Tax services” refer to professional services rendered by the principal accountant for tax compliance, tax advice, and tax planning. There were no “other services”
provided by the principal accountant. The following table details the aggregate fees billed or expected to be billed for each of the last two fiscal years for audit fees, audit-related fees, tax fees and other fees by the principal accountant.
|
FYE 9/30/2021
|
FYE 9/30/2020
|
|
|
Audit Fees
|
$72,600
|
$72,600
|
|
Audit-Related Fees
|
N/A
|
N/A
|
|
Tax Fees
|
$14,400
|
$14,400
|
|
All Other Fees
|
N/A
|
N/A
|
The audit committee has adopted pre-approval policies and procedures that require the audit committee to pre‑approve all audit and non‑audit services of the registrant, including services provided to any entity affiliated with the registrant.
The percentage of fees billed by Tait, Weller, & Baker LLP applicable to non-audit services pursuant to waiver of pre-approval requirement were as follows:
|
FYE 9/30/2021
|
FYE 9/30/2020
|
|
|
Audit-Related Fees
|
0%
|
0%
|
|
Tax Fees
|
0%
|
0%
|
|
All Other Fees
|
0%
|
0%
|
All of the principal accountant’s hours spent on auditing the registrant’s financial statements were attributed to work performed by full‑time permanent employees of the principal accountant.
The following table indicates the non-audit fees billed or expected to be billed by the registrant’s accountant for services to the registrant and to the registrant’s investment adviser (and any other
controlling entity, etc.—not sub-adviser) for the last two years. The audit committee of the board of trustees/directors has considered whether the provision of non-audit services that were rendered to the registrant's investment adviser is
compatible with maintaining the principal accountant's independence and has concluded that the provision of such non-audit services by the accountant has not compromised the accountant’s independence.
|
Non-Audit Related Fees
|
FYE 9/30/2021
|
FYE 9/30/2020
|
|
Registrant
|
N/A
|
N/A
|
|
Registrant’s Investment Adviser
|
N/A
|
N/A
|
The registrant has not been identified by the U.S. Securities and Exchange Commission as having filed an annual report issued by a registered public accounting firm branch or office that is
located in a foreign jurisdiction where the Public Company Accounting Oversight Board is unable to inspect or completely investigate because of a position taken by an authority in that jurisdiction.
The registrant is not a foreign issuer.
Item 5. Audit Committee of Listed Registrants.
(a) Not applicable to registrants who are not listed issuers (as defined in Rule 10A-3 under the Securities Exchange Act of 1934).
(b) Not applicable.
Item 6. Investments.
(a) Schedule of Investments is included as part of the report to shareholders filed under Item 1 of this Form.
(b) Not applicable.
Item 7. Disclosure of Proxy Voting Policies and Procedures for Closed-End Management Investment Companies.
Not applicable to open-end investment companies.
Item 8. Portfolio Managers of Closed-End Management Investment Companies.
Not applicable to open-end investment companies.
Item 9. Purchases of Equity Securities by Closed‑End Management Investment Company and Affiliated Purchasers.
Not applicable to open-end investment companies.
Item 10. Submission of Matters to a Vote of Security Holders.
There have been no material changes to the procedures by which shareholders may recommend nominees to the Registrant’s Board of Trustees.
Item 11. Controls and Procedures.
|
(a)
|
The Registrant’s President/Chief Executive Officer/Principal Executive Officer and Vice President/Treasurer/Principal Financial Officer have reviewed the Registrant's disclosure controls and procedures (as defined in Rule 30a-3(c)
under the Investment Company Act of 1940, as amended, (the “Act”)) as of a date within 90 days of the filing of this report, as required by Rule 30a-3(b) under the Act and Rules 13a-15(b) or 15d‑15(b) under the Securities Exchange Act of
1934. Based on their review, such officers have concluded that the disclosure controls and procedures are effective in ensuring that information required to be disclosed in this report is appropriately recorded, processed, summarized and
reported and made known to them by others within the Registrant and by the Registrant’s service provider.
|
|
(b)
|
There were no changes in the Registrant's internal control over financial reporting (as defined in Rule 30a-3(d) under the Act) that occurred during the period covered by this report that has materially affected, or is reasonably
likely to materially affect, the Registrant's internal control over financial reporting.
|
Item 12. Disclosure of Securities Lending Activities for Closed-End Management Investment Companies.
Not applicable to open-end investment companies.
Item 13. Exhibits.
(3) Any written solicitation to purchase securities under Rule 23c‑1 under the Act sent or given during the period covered by the report by or on behalf of the registrant to 10 or
more persons. Not applicable to open-end investment companies.
(4) Change in the registrant’s independent public accountant. There was no change in the registrant’s independent public accountant for the period covered by this report.
SIGNATURES
Pursuant to the requirements of the Securities Exchange Act of 1934 and the Investment Company Act of 1940, as amended, the registrant has duly caused this report to be signed on its behalf by the undersigned,
thereunto duly authorized.
(Registrant) Advisors Series Trust
By (Signature and Title)* /s/ Jeffrey T. Rauman
Jeffrey T. Rauman, President/Chief Executive Officer/Principal
Executive Officer
Date 12/1/2021
Pursuant to the requirements of the Securities Exchange Act of 1934 and the Investment Company Act of 1940, as amended, this report has been signed below by the following persons on behalf of the registrant and in the
capacities and on the dates indicated.
By (Signature and Title)* /s/ Jeffrey T. Rauman
Jeffrey T. Rauman, President/Chief Executive Officer/Principal
Executive Officer
Date 12/1/2021
By (Signature and Title)* /s/ Cheryl L. King
Cheryl L. King, Vice President/Treasurer/Principal Financial
Officer
Date 12/2/2021
* Print the name and title of each signing officer under his or her signature.
Exhibit A
ADVISORS SERIES TRUST
Code of Ethics
For Principal Executive Officer & Principal Financial Officer
This Code of Ethics is designed to comply with Section 406 of the Sarbanes-Oxley Act of 2002 and the rules promulgated by the Securities
and Exchange Commission (the “SEC”) thereunder. This Code of Ethics is in addition to, not in replacement of, the Advisors Series Trust (the “Trust”) Code of Ethics for access persons (the “Investment Company Code of Ethics”), adopted pursuant to
Rule 17j-1 under the Investment Company Act of 1940, as amended (the “Investment Company Act”). The persons covered by this Code of Ethics may also be subject to the Investment Company Code of Ethics.
The Trust requires its Principal Executive Officer, Principal Financial Officer, or other Trust officers performing similar functions (the
“Principal Officers”), to maintain the highest ethical and legal standards while performing their duties and responsibilities to the Trust and each of its series (each a “Fund,” collectively the “Funds”), with particular emphasis on those duties that
relate to the preparation and reporting of the financial information of the Funds. The following principles and responsibilities shall govern the professional conduct of the Principal Officers:
|
1.
|
HONEST AND ETHICAL CONDUCT.
|
The Principal Officers shall act with honesty and integrity, avoiding actual or apparent conflicts of interest in personal and professional
relationships, and shall report any material transaction or relationship that reasonably could be expected to give rise to such conflict between their interests and those of a Fund to the Audit Committee, the full Board of Trustees of the Trust, and,
in addition, to any other appropriate person or entity that may reasonably be expected to deal with any conflict of interest in timely and expeditious manner.
The Principal Officers shall act in good faith, responsibly, with due care, competence and diligence, without misrepresenting material
facts or allowing their independent judgment to be subordinated or compromised.
|
2.
|
FINANCIAL RECORDS AND REPORTING
|
The Principal Officers shall provide full, fair, accurate, timely and understandable disclosure in the reports and/or other documents to be
filed with or submitted to the SEC or other applicable body by a Fund, or that is otherwise publicly disclosed or communicated. The Principal Officers shall comply with applicable rules and regulations of federal, state, and local governments, and
other appropriate private and public regulatory agencies.
The Principal Officers shall respect the confidentiality of information acquired in the course of their work and shall not disclose such
information except when authorized or legally obligated to disclose. The Principal Officers will not use confidential information acquired in the course of their duties as Principal Officers.
The Principal Officers shall share knowledge and maintain skills important and relevant to the Trust’s needs; shall proactively promote
ethical behavior of the Trust’s employees and as a partner with industry peers and associates; and shall maintain control over and responsibly manage assets and resources employed or entrusted to them by the Trust.
|
3.
|
COMPLIANCE WITH LAWS, RULES AND REGULATIONS
|
The Principal Officers shall establish and maintain mechanisms to oversee the compliance of the Funds with applicable federal, state or
local law, regulation or administrative rule, and to identify, report and correct in a swift and certain manner, any detected deviations from applicable federal, state or local law regulation or rule.
|
4.
|
COMPLIANCE WITH THIS CODE OF ETHICS
|
The Principal Officers shall promptly report any violations of this Code of Ethics to the Audit Committee as well as the full Board of
Trustees of the Trust and shall be held accountable for strict adherence to this Code of Ethics. A proven failure to uphold the standards stated herein shall be grounds for such sanctions as shall be reasonably imposed by the Board of Trustees of
the Trust.
|
5.
|
AMENDMENT AND WAIVER
|
This Code of Ethics may only be amended or modified by approval of the Board of Trustees. Any substantive amendment that is not
technical or administrative in nature or any material waiver, implicit or otherwise, of any provision of this Code of Ethics, shall be communicated publicly in accordance with Item 2 of Form N-CSR under the Investment Company Act.
Adopted by the Board of Trustees on March 18, 2010
CERTIFICATIONS
I, Jeffrey T. Rauman, certify that:
|
1.
|
I have reviewed this report on Form N-CSR of Advisors Series Trust;
|
|
2.
|
Based on my knowledge, this report does not contain any untrue statement of a material fact or omit to state a material fact necessary to make the statements made, in light of the circumstances under which such statements were made, not
misleading with respect to the period covered by this report;
|
|
3.
|
Based on my knowledge, the financial statements, and other financial information included in this report, fairly present in all material respects the financial condition, results of operations, changes in net assets, and cash flows (if
the financial statements are required to include a statement of cash flows) of the registrant as of, and for, the periods presented in this report;
|
|
4.
|
The registrant’s other certifying officer(s) and I are responsible for establishing and maintaining disclosure controls and procedures (as defined in Rule 30a-3(c) under the Investment Company Act of 1940) and internal control over
financial reporting (as defined in Rule 30a-3(d) under the Investment Company Act of 1940) for the registrant and have:
|
|
(a)
|
Designed such disclosure controls and procedures, or caused such disclosure controls and procedures to be designed under our supervision, to ensure that material information relating to the registrant, including its consolidated
subsidiaries, is made known to us by others within those entities, particularly during the period in which this report is being prepared;
|
|
(b)
|
Designed such internal control over financial reporting, or caused such internal control over financial reporting to be designed under our supervision, to provide reasonable assurance regarding the reliability of financial reporting and
the preparation of financial statements for external purposes in accordance with generally accepted accounting principles;
|
|
(c)
|
Evaluated the effectiveness of the registrant's disclosure controls and procedures and presented in this report our conclusions about the effectiveness of the disclosure controls and procedures, as of a date within 90 days prior to the
filing date of this report based on such evaluation; and
|
|
(d)
|
Disclosed in this report any change in the registrant’s internal control over financial reporting that occurred during the period covered by this report that has materially affected, or is reasonably likely to materially affect, the
registrant’s internal control over financial reporting; and
|
|
5.
|
The registrant’s other certifying officer(s) and I have disclosed to the registrant’s auditors and the audit committee of the registrant’s board of directors (or persons performing the equivalent functions):
|
|
(a)
|
All significant deficiencies and material weaknesses in the design or operation of internal control over financial reporting which are reasonably likely to adversely affect the registrant’s ability to record, process, summarize, and
report financial information; and
|
|
(b)
|
Any fraud, whether or not material, that involves management or other employees who have a significant role in the registrant’s internal control over financial reporting.
|
|
Date: 12/1/2021
|
/s/ Jeffrey T. Rauman
Jeffrey T. Rauman President/Chief Executive Officer/Principal Executive Officer |
CERTIFICATIONS
I, Cheryl L. King, certify that:
|
1.
|
I have reviewed this report on Form N-CSR of Advisors Series Trust;
|
|
2.
|
Based on my knowledge, this report does not contain any untrue statement of a material fact or omit to state a material fact necessary to make the statements made, in light of the circumstances under which such statements were made, not
misleading with respect to the period covered by this report;
|
|
3.
|
Based on my knowledge, the financial statements, and other financial information included in this report, fairly present in all material respects the financial condition, results of operations, changes in net assets, and cash flows (if
the financial statements are required to include a statement of cash flows) of the registrant as of, and for, the periods presented in this report;
|
|
4.
|
The registrant’s other certifying officer(s) and I are responsible for establishing and maintaining disclosure controls and procedures (as defined in Rule 30a-3(c) under the Investment Company Act of 1940) and internal control over
financial reporting (as defined in Rule 30a-3(d) under the Investment Company Act of 1940) for the registrant and have:
|
|
(a)
|
Designed such disclosure controls and procedures, or caused such disclosure controls and procedures to be designed under our supervision, to ensure that material information relating to the registrant, including its consolidated
subsidiaries, is made known to us by others within those entities, particularly during the period in which this report is being prepared;
|
|
(b)
|
Designed such internal control over financial reporting, or caused such internal control over financial reporting to be designed under our supervision, to provide reasonable assurance regarding the reliability of financial reporting and
the preparation of financial statements for external purposes in accordance with generally accepted accounting principles;
|
|
(c)
|
Evaluated the effectiveness of the registrant’s disclosure controls and procedures and presented in this report our conclusions about the effectiveness of the disclosure controls and procedures, as of a date within 90 days prior to the
filing date of this report based on such evaluation; and
|
|
(d)
|
Disclosed in this report any change in the registrant’s internal control over financial reporting that occurred during the period covered by this report that has materially affected, or is reasonably likely to materially affect, the
registrant’s internal control over financial reporting; and
|
|
5.
|
The registrant’s other certifying officer(s) and I have disclosed to the registrant’s auditors and the audit committee of the registrant’s board of directors (or persons performing the equivalent functions):
|
|
(a)
|
All significant deficiencies and material weaknesses in the design or operation of internal control over financial reporting which are reasonably likely to adversely affect the registrant’s ability to record, process, summarize, and
report financial information; and
|
|
(b)
|
Any fraud, whether or not material, that involves management or other employees who have a significant role in the registrant’s internal control over financial reporting.
|
|
Date: 12/2/2021
|
/s/ Cheryl L. King
Cheryl L. King Vice President/Treasurer/Principal Financial Officer
|
Certification Pursuant to Section 906 of the Sarbanes-Oxley Act
Pursuant to Section 906 of the Sarbanes-Oxley Act of 2002, each of the undersigned officers of the Advisors Series Trust, does hereby certify, to such officer’s knowledge, that the report on Form N-CSR of the Advisors
Series Trust for the year ended September 30, 2021 fully complies with the requirements of Section 13(a) or 15(d) of the Securities Exchange Act of 1934, as applicable, and that the information contained in the Form N-CSR fairly presents, in all
material respects, the financial condition and results of operations of the Advisors Series Trust for the stated period.
|
/s/ Jeffrey T. Rauman
Jeffrey T. Rauman
President/Chief Executive Officer/Principal Executive Officer
Advisors Series Trust
|
/s/ Cheryl L. King
Cheryl L. King
Vice President/Treasurer/Principal Financial Officer
Advisors Series Trust
|
|
Dated: 12/1/2021
|
Dated: 12/2/2021
|
This statement accompanies this report on Form N-CSR pursuant to Section 906 of the Sarbanes-Oxley Act of 2002 and shall not be deemed as filed by Advisors Series Trust for purposes of Section 18 of the Securities Exchange Act of 1934.
Serious News for Serious Traders! Try StreetInsider.com Premium Free!
You May Also Be Interested In
- GA-ASI Selected to Build CCA for AFLCMC
- SHAREHOLDER ACTION ALERT: The Schall Law Firm Encourages Investors in Compass Minerals International, Inc. with Losses to Contact the Firm
- Loar Announces Pricing of Initial Public Offering
Create E-mail Alert Related Categories
SEC FilingsSign up for StreetInsider Free!
Receive full access to all new and archived articles, unlimited portfolio tracking, e-mail alerts, custom newswires and RSS feeds - and more!
