

Form N-CSR AB CAP FUND, INC. For: Jul 31
 Tweet
Tweet Share
Share
UNITED STATES
SECURITIES AND EXCHANGE COMMISSION
WASHINGTON, D.C. 20549
FORM N-CSR
CERTIFIED SHAREHOLDER REPORT OF REGISTERED
MANAGEMENT INVESTMENT COMPANIES
Investment Company Act file number: 811-01716
AB CAP FUND, INC.
(Exact name of registrant as specified in charter)
1345 Avenue of the Americas, New York, New York 10105
(Address of principal executive offices) (Zip code)
Joseph J. Mantineo
AllianceBernstein L.P.
1345 Avenue of the Americas
New York, New York 10105
(Name and address of agent for service)
Registrant’s telephone number, including area code: (800) 221-5672
Date of fiscal year end: July 31, 2022
Date of reporting period: July 31, 2022
| ITEM 1. | REPORTS TO STOCKHOLDERS. |
JUL 07.31.22

ANNUAL REPORT
AB SMALL CAP GROWTH PORTFOLIO

| Investment Products Offered | • Are Not FDIC Insured • May Lose Value • Are Not Bank Guaranteed | |
Investors should consider the investment objectives, risks, charges and expenses of the Fund carefully before investing. For copies of our prospectus or summary prospectus, which contain this and other information, visit us online at www.abfunds.com or contact your AB representative. Please read the prospectus and/or summary prospectus carefully before investing.
This shareholder report must be preceded or accompanied by the Fund’s prospectus for individuals who are not current shareholders of the Fund.
You may obtain a description of the Fund’s proxy voting policies and procedures, and information regarding how the Fund voted proxies relating to portfolio securities during the most recent 12-month period ended June 30, without charge. Simply visit AB’s website at www.abfunds.com, or go to the Securities and Exchange Commission’s (the “Commission”) website at www.sec.gov, or call AB at (800) 227 4618.
The Fund files its complete schedule of portfolio holdings with the Commission for the first and third quarters of each fiscal year as an exhibit to its reports on Form N-PORT. The Fund’s Form N-PORT reports are available on the Commission’s website at www.sec.gov. AB publishes full portfolio holdings for the Fund monthly at www.abfunds.com.
AllianceBernstein Investments, Inc. (ABI) is the distributor of the AB family of mutual funds. ABI is a member of FINRA and is an affiliate of AllianceBernstein L.P., the Adviser of the funds.
The [A/B] logo is a registered service mark of AllianceBernstein and AllianceBernstein® is a registered service mark used by permission of the owner, AllianceBernstein L.P.
| FROM THE PRESIDENT |

|
Dear Shareholder,
We’re pleased to provide this report for the AB Small Cap Growth Portfolio (the “Fund”). Please review the discussion of Fund performance, the market conditions during the reporting period and the Fund’s investment strategy.
At AB, we’re striving to help our clients achieve better outcomes by:
| + | Fostering diverse perspectives that give us a distinctive approach to navigating global capital markets |
| + | Applying differentiated investment insights through a connected global research network |
| + | Embracing innovation to design better ways to invest and leading-edge mutual-fund solutions |
Whether you’re an individual investor or a multibillion-dollar institution, we’re putting our knowledge and experience to work for you every day.
For more information about AB’s comprehensive range of products and shareholder resources, please log on to www.abfunds.com.
Thank you for your investment in AB mutual funds—and for placing your trust in our firm.
Sincerely,

Onur Erzan
President and Chief Executive Officer, AB Mutual Funds
| abfunds.com | AB SMALL CAP GROWTH PORTFOLIO | 1 | |
ANNUAL REPORT
September 2, 2022
This report provides management’s discussion of fund performance for the AB Small Cap Growth Portfolio for the annual reporting period ended July 31, 2022.
The Fund’s investment objective is long-term growth of capital.
NAV RETURNS AS OF JULY 31, 2022 (unaudited)
| 6 Months | 12 Months | |||||||
| AB SMALL CAP GROWTH PORTFOLIO | ||||||||
| Class A Shares | -18.46% | -30.61% | ||||||
| Class C Shares | -18.75% | -31.12% | ||||||
| Advisor Class Shares1 | -18.35% | -30.43% | ||||||
| Class R Shares1 | -18.58% | -30.84% | ||||||
| Class K Shares1 | -18.41% | -30.54% | ||||||
| Class I Shares1 | -18.32% | -30.40% | ||||||
| Class Z Shares1 | -18.29% | -30.34% | ||||||
| Russell 2000 Growth Index | -9.41% | -23.18% | ||||||
| 1 | Please note that these share classes are for investors purchasing shares through accounts established under certain fee-based programs sponsored and maintained by certain broker-dealers and financial intermediaries, institutional pension plans and/or investment advisory clients of, and certain other persons associated with, the Adviser and its affiliates or the Fund. |
INVESTMENT RESULTS
The table above shows the Fund’s performance compared to its benchmark, the Russell 2000 Growth Index, for the six- and 12-month periods ended July 31, 2022.
All share classes of the Fund underperformed the benchmark for both periods, before sales charges. During the 12-month period, security selection drove underperformance, relative to the benchmark. Selection within the industrials and health-care sectors detracted the most, while selection within financials and energy contributed. Sector selection was positive, particularly underweights to communication services and health care, while underweights to energy and consumer staples detracted.
For the six-month period, security selection detracted, particularly selection within industrials and health care. Sector selection also detracted. An overweight to energy and an underweight to consumer staples detracted, while underweights to real estate and communication services offset some of these losses.
The Fund did not utilize derivatives during either period.
| 2 | AB SMALL CAP GROWTH PORTFOLIO |
abfunds.com | |
MARKET REVIEW AND INVESTMENT STRATEGY
US, international and emerging-market stocks declined during the 12-month period ended July 31, 2022. Early in the period, equity markets were supported by accommodative monetary policy, which underpinned an accelerating global economic recovery. Widespread volatility increased as persistently high inflation set off a global wave of tighter monetary policy led by the US Federal Reserve (the “Fed”), which precipitated recessionary fears. China’s pledge to enforce its zero-COVID policy and Russia’s invasion of Ukraine—which caused energy and agricultural prices to surge—worsened supply-chain disruptions. In an effort to aggressively harness inflation, the Fed raised interest rates four times during the period, including two consecutive 0.75% increases in June and July. At the end of the period, equity markets rallied as some early signs of easing inflationary pressures in the US lifted investor confidence that policy rates might peak at lower levels than had previously been thought. Against a backdrop of rising rates, growth stocks came under pressure later in the period, triggering a rotation into value-oriented stocks. Within large-cap markets, both growth and value stocks declined in absolute terms, but value stocks outperformed growth stocks significantly. Small-cap stocks outperformed large-cap stocks on a relative basis, but both declined in absolute terms.
The Fund continues to be built from the bottom up, with an emphasis on companies that the Fund’s Senior Investment Management Team (the “Team”) believes will deliver fundamental outperformance, even against a backdrop of higher input prices and supply-chain disruptions. Cognizant that rapidly rising interest rates will likely lead to slowing economic activity and heightened risk of a recession, the Team remains focused on identifying companies that it believes can continue to deliver stronger-than-expected growth. The Team seeks companies that have strong pricing power or possess unique secular growth drivers that could help navigate through this challenging environment. At the end of the reporting period, consumer discretionary, financials and technology reflected the Fund’s largest overweights, while health care, materials and real estate were notable underweights, relative to the benchmark.
INVESTMENT POLICIES
The Fund invests primarily in a diversified portfolio of equity securities of issuers with relatively smaller capitalizations as compared to the overall US market. Under normal circumstances, the Fund invests at least 80% of its net assets in equity securities of smaller companies. For these purposes, “smaller companies” are those that, at the time of investment, fall within the lowest 20% of the total US equity market capitalization (excluding, for purposes of this calculation, companies with market capitalizations of less than $10 million). Because the
(continued on next page)
| abfunds.com | AB SMALL CAP GROWTH PORTFOLIO | 3 | |
Fund’s definition of smaller companies is dynamic, the limits on market capitalization will change with the markets.
The Fund may invest in any company and industry and in any type of equity security with potential for capital appreciation. It invests in well-known and established companies and in new and less-seasoned companies. The Fund’s investment policies emphasize investments in companies that are demonstrating improving financial results and a favorable earnings outlook. The Fund may invest in foreign securities. The Fund may periodically invest in the securities of companies that are expected to appreciate due to a development particularly or uniquely applicable to that company regardless of general business conditions or movements of the market as a whole.
The Fund invests primarily in equity securities but may also invest in other types of securities, such as preferred stocks. The Fund, at times, invests in shares of exchange-traded funds (“ETFs”) in lieu of making direct investments in securities. ETFs may provide more efficient and economical exposure to the types of companies and geographic locations in which the Fund seeks to invest than direct investments. The Fund may also invest up to 20% of its total assets in rights or warrants.
The Fund may enter into derivatives transactions, such as options, futures contracts, forwards and swaps. The Fund may use options strategies involving the purchase and/or writing of various combinations of call and/or put options, including on individual securities and stock indices, futures contracts (including futures contracts on individual securities and stock indices) or shares of ETFs. These transactions may be used, for example, in an effort to earn extra income, to adjust exposure to individual securities or markets, or to protect all or a portion of the Fund’s portfolio from a decline in value, sometimes within certain ranges.
| 4 | AB SMALL CAP GROWTH PORTFOLIO |
abfunds.com | |
DISCLOSURES AND RISKS
Benchmark Disclosure
The Russell 2000® Growth Index is unmanaged and does not reflect fees and expenses associated with the active management of a mutual fund portfolio. The Russell 2000 Growth Index represents the performance of small-cap growth companies within the US. An investor cannot invest directly in an index, and its results are not indicative of the performance for any specific investment, including the Fund.
A Word About Risk
Market Risk: The value of the Fund’s assets will fluctuate as the stock or bond market fluctuates. The value of its investments may decline, sometimes rapidly and unpredictably, simply because of economic changes or other events, including public health crises (including the occurrence of a contagious disease or illness) and regional and global conflicts, that affect large portions of the market. It includes the risk that a particular style of investing, such as growth, may underperform the market generally.
Sector Risk: The Fund may have more risk because it may invest to a significant extent in one or more particular market sectors, such as the information-technology or health-care sector. To the extent it does so, market or economic factors affecting the relevant sector(s) could have a major effect on the value of the Fund’s investments.
Capitalization Risk: Investments in small- and mid-capitalization companies may be more volatile than investments in large-capitalization companies. Investments in small-capitalization companies may have additional risks because these companies have limited product lines, markets or financial resources.
Foreign (Non-US) Risk: Investments in securities of non-US issuers may involve more risk than those of US issuers. These securities may fluctuate more widely in price and may be more difficult to trade due to adverse market, economic, political, regulatory or other factors.
Management Risk: The Fund is subject to management risk because it is an actively managed investment fund. The Adviser will apply its investment techniques and risk analyses in making investment decisions for the Fund, but there is no guarantee that its techniques will produce the intended results. Some of these techniques may incorporate, or rely upon, quantitative models, but there is no guarantee that these models will generate accurate forecasts, reduce risk or otherwise perform as expected.
These risks are fully discussed in the Fund’s prospectus. As with all investments, you may lose money by investing in the Fund.
| abfunds.com | AB SMALL CAP GROWTH PORTFOLIO | 5 | |
DISCLOSURES AND RISKS (continued)
An Important Note About Historical Performance
The investment return and principal value of an investment in the Fund will fluctuate, so that shares, when redeemed, may be worth more or less than their original cost. Performance shown in this report represents past performance and does not guarantee future results. Current performance may be lower or higher than the performance information shown. You may obtain performance information current to the most recent month-end by visiting www.abfunds.com.
All fees and expenses related to the operation of the Fund have been deducted. Net asset value (“NAV”) returns do not reflect sales charges; if sales charges were reflected, the Fund’s quoted performance would be lower. SEC returns reflect the applicable sales charges for each share class: a 4.25% maximum front-end sales charge for Class A shares and a 1% 1-year contingent deferred sales charge for Class C shares. Returns for the different share classes will vary due to different expenses associated with each class. Performance assumes reinvestment of distributions and does not account for taxes.
| 6 | AB SMALL CAP GROWTH PORTFOLIO |
abfunds.com | |
HISTORICAL PERFORMANCE
GROWTH OF A $10,000 INVESTMENT IN THE FUND (unaudited)
7/31/2012 TO 7/31/2022
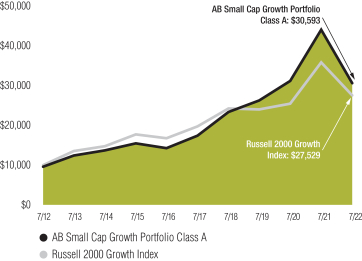
This chart illustrates the total value of an assumed $10,000 investment in AB Small Cap Growth Portfolio Class A shares (from 7/31/2012 to 7/31/2022) as compared to the performance of the Fund’s benchmark. The chart reflects the deduction of the maximum 4.25% sales charge from the initial $10,000 investment in the Fund and assumes the reinvestment of dividends and capital gains distributions.
| abfunds.com | AB SMALL CAP GROWTH PORTFOLIO | 7 | |
HISTORICAL PERFORMANCE (continued)
AVERAGE ANNUAL RETURNS AS OF JULY 31, 2022 (unaudited)
| NAV Returns | SEC Returns (reflects applicable |
|||||||
| CLASS A SHARES | ||||||||
| 1 Year | -30.61% | -33.56% | ||||||
| 5 Years | 11.93% | 10.96% | ||||||
| 10 Years | 12.32% | 11.83% | ||||||
| CLASS C SHARES | ||||||||
| 1 Year | -31.12% | -31.69% | ||||||
| 5 Years | 11.09% | 11.09% | ||||||
| 10 Years1 | 11.48% | 11.48% | ||||||
| ADVISOR CLASS SHARES2 | ||||||||
| 1 Year | -30.43% | -30.43% | ||||||
| 5 Years | 12.21% | 12.21% | ||||||
| 10 Years | 12.60% | 12.60% | ||||||
| CLASS R SHARES2 | ||||||||
| 1 Year | -30.84% | -30.84% | ||||||
| 5 Years | 11.50% | 11.50% | ||||||
| 10 Years | 11.94% | 11.94% | ||||||
| CLASS K SHARES2 | ||||||||
| 1 Year | -30.54% | -30.54% | ||||||
| 5 Years | 12.00% | 12.00% | ||||||
| 10 Years | 12.37% | 12.37% | ||||||
| CLASS I SHARES2 | ||||||||
| 1 Year | -30.40% | -30.40% | ||||||
| 5 Years | 12.21% | 12.21% | ||||||
| 10 Years | 12.65% | 12.65% | ||||||
| CLASS Z SHARES2 | ||||||||
| 1 Year | -30.34% | -30.34% | ||||||
| 5 Years | 12.31% | 12.31% | ||||||
| Since Inception3 | 10.41% | 10.41% | ||||||
The Fund’s current prospectus fee table shows the Fund’s total annual operating expense ratios as 1.09%, 1.84%, 0.84%, 1.49%, 1.03%, 0.84% and 0.75% for Class A, Class C, Advisor Class, Class R, Class K, Class I and Class Z shares, respectively. The Financial Highlights section of this report sets forth expense ratio data for the current reporting period; the expense ratios shown above may differ from the expense ratios in the Financial Highlights section since they are based on different time periods.
| 1 | Assumes conversion of Class C shares into Class A shares after eight years. |
| 2 | These share classes are offered at NAV to eligible investors and their SEC returns are the same as their NAV returns. Please note that these share classes are for investors purchasing shares through accounts established under certain fee-based programs sponsored and maintained by certain broker-dealers and financial intermediaries, institutional pension plans and/or investment advisory clients of, and certain other persons associated with, the Adviser and its affiliates or the Fund. |
| 3 | Inception date: 6/30/2015. |
| 8 | AB SMALL CAP GROWTH PORTFOLIO |
abfunds.com | |
HISTORICAL PERFORMANCE (continued)
SEC AVERAGE ANNUAL RETURNS
AS OF THE MOST RECENT CALENDAR QUARTER-END
JUNE 30, 2022 (unaudited)
| SEC Returns (reflects applicable |
||||
| CLASS A SHARES | ||||
| 1 Year | -40.75% | |||
| 5 Years | 8.88% | |||
| 10 Years | 10.65% | |||
| CLASS C SHARES | ||||
| 1 Year | -39.09% | |||
| 5 Years | 9.01% | |||
| 10 Years1 | 10.30% | |||
| ADVISOR CLASS SHARES2 | ||||
| 1 Year | -37.96% | |||
| 5 Years | 10.10% | |||
| 10 Years | 11.41% | |||
| CLASS R SHARES2 | ||||
| 1 Year | -38.35% | |||
| 5 Years | 9.40% | |||
| 10 Years | 10.75% | |||
| CLASS K SHARES2 | ||||
| 1 Year | -38.07% | |||
| 5 Years | 9.89% | |||
| 10 Years | 11.18% | |||
| CLASS I SHARES2 | ||||
| 1 Year | -37.95% | |||
| 5 Years | 10.10% | |||
| 10 Years | 11.46% | |||
| CLASS Z SHARES2 | ||||
| 1 Year | -37.90% | |||
| 5 Years | 10.20% | |||
| Since Inception3 | 8.89% | |||
| 1 | Assumes conversion of Class C shares into Class A shares after eight years. |
| 2 | Please note that these share classes are for investors purchasing shares through accounts established under certain fee-based programs sponsored and maintained by certain broker-dealers and financial intermediaries, institutional pension plans and/or investment advisory clients of, and certain other persons associated with, the Adviser and its affiliates or the Fund. |
| 3 | Inception date: 6/30/2015. |
| abfunds.com | AB SMALL CAP GROWTH PORTFOLIO | 9 | |
EXPENSE EXAMPLE
(unaudited)
As a shareholder of the Fund, you incur two types of costs: (1) transaction costs, including sales charges (loads) on purchase payments, contingent deferred sales charges on redemptions and (2) ongoing costs, including management fees; distribution (12b-1) fees; and other Fund expenses. This example is intended to help you understand your ongoing costs (in dollars) of investing in the Fund and to compare these costs with the ongoing costs of investing in other mutual funds.
The Example is based on an investment of $1,000 invested at the beginning of the period and held for the entire period as indicated below.
Actual Expenses
The table below provides information about actual account values and actual expenses. You may use the information, together with the amount you invested, to estimate the expenses that you paid over the period. Simply divide your account value by $1,000 (for example, an $8,600 account value divided by $1,000 = 8.6), then multiply the result by the number under the heading entitled “Expenses Paid During Period” to estimate the expenses you paid on your account during this period.
Hypothetical Example for Comparison Purposes
The table below also provides information about hypothetical account values and hypothetical expenses based on the Fund’s actual expense ratio and an assumed annual rate of return of 5% before expenses, which is not the Fund’s actual return. The hypothetical account values and expenses may not be used to estimate the actual ending account balance or expenses you paid for the period. You may use this information to compare the ongoing costs of investing in the Fund and other funds by comparing this 5% hypothetical example with the 5% hypothetical examples that appear in the shareholder reports of other funds.
Please note that the expenses shown in the table are meant to highlight your ongoing costs only and do not reflect any transactional costs, such as sales charges (loads), or contingent deferred sales charges on redemptions. Therefore, the hypothetical example is useful in comparing ongoing costs only, and will not help you determine the relative total costs of owning different funds. In addition, if these transactional costs were included, your costs would have been higher.
| 10 | AB SMALL CAP GROWTH PORTFOLIO |
abfunds.com | |
EXPENSE EXAMPLE (continued)
| Beginning Account Value February 1, 2022 |
Ending Account Value July 31, 2022 |
Expenses Paid During Period* |
Annualized Expense Ratio* |
|||||||||||||
| Class A | ||||||||||||||||
| Actual |
$ | 1,000 | $ | 815.40 | $ | 5.27 | 1.17 | % | ||||||||
| Hypothetical** |
$ | 1,000 | $ | 1,018.99 | $ | 5.86 | 1.17 | % | ||||||||
| Class C | ||||||||||||||||
| Actual |
$ | 1,000 | $ | 812.50 | $ | 8.63 | 1.92 | % | ||||||||
| Hypothetical** |
$ | 1,000 | $ | 1,015.27 | $ | 9.59 | 1.92 | % | ||||||||
| Advisor Class | ||||||||||||||||
| Actual |
$ | 1,000 | $ | 816.50 | $ | 4.14 | 0.92 | % | ||||||||
| Hypothetical** |
$ | 1,000 | $ | 1,020.23 | $ | 4.61 | 0.92 | % | ||||||||
| Class R | ||||||||||||||||
| Actual |
$ | 1,000 | $ | 814.20 | $ | 6.79 | 1.51 | % | ||||||||
| Hypothetical** |
$ | 1,000 | $ | 1,017.31 | $ | 7.55 | 1.51 | % | ||||||||
| Class K | ||||||||||||||||
| Actual |
$ | 1,000 | $ | 815.90 | $ | 4.73 | 1.05 | % | ||||||||
| Hypothetical** |
$ | 1,000 | $ | 1,019.59 | $ | 5.26 | 1.05 | % | ||||||||
| Class I | ||||||||||||||||
| Actual |
$ | 1,000 | $ | 816.80 | $ | 3.87 | 0.86 | % | ||||||||
| Hypothetical** |
$ | 1,000 | $ | 1,020.53 | $ | 4.31 | 0.86 | % | ||||||||
| Class Z | ||||||||||||||||
| Actual |
$ | 1,000 | $ | 817.10 | $ | 3.51 | 0.78 | % | ||||||||
| Hypothetical** |
$ | 1,000 | $ | 1,020.93 | $ | 3.91 | 0.78 | % | ||||||||
| * | Expenses are equal to the classes’ annualized expense ratios, multiplied by the average account value over the period, multiplied by 181/365 (to reflect the one-half year period). |
| ** | Assumes 5% annual return before expenses. |
| abfunds.com | AB SMALL CAP GROWTH PORTFOLIO | 11 | |
PORTFOLIO SUMMARY
July 31, 2022 (unaudited)
PORTFOLIO STATISTICS
Net Assets ($mil): $4,388.3
TEN LARGEST HOLDINGS2
| Company | U.S. $ Value | Percent of Net Assets |
||||||
| Matador Resources Co. | $ | 86,290,559 | 2.0 | % | ||||
| Saia, Inc. | 80,517,933 | 1.8 | ||||||
| Fox Factory Holding Corp. | 76,359,477 | 1.7 | ||||||
| Novanta, Inc. | 75,349,676 | 1.7 | ||||||
| iRhythm Technologies, Inc. | 74,888,855 | 1.7 | ||||||
| Herc Holdings, Inc. | 74,368,593 | 1.7 | ||||||
| Hilton Grand Vacations, Inc. | 72,931,333 | 1.7 | ||||||
| Driven Brands Holdings, Inc. | 71,993,765 | 1.6 | ||||||
| First Financial Bankshares, Inc. | 71,972,754 | 1.6 | ||||||
| Manhattan Associates, Inc. | 70,761,230 | 1.6 | ||||||
| $ | 755,434,175 | 17.1 | % | |||||
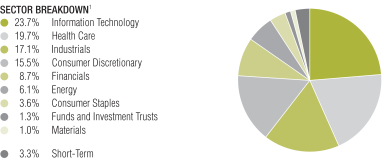
| 1 | All data are as of July 31, 2022. The Fund’s sector breakdown is expressed as a percentage of total investments (excluding security lending collateral) and may vary over time. |
| 2 | Long-term investments. |
Please note: The sector classifications presented herein are based on the Global Industry Classification Standard (GICS) which was developed by Morgan Stanley Capital International and Standard & Poor’s. The components are divided into sector, industry group, and industry sub-indices as classified by the GICS for each of the market capitalization indices in the broad market. These sector classifications are broadly defined. The “Portfolio of Investments” section of the report reflects more specific industry information and is consistent with the investment restrictions discussed in the Fund’s prospectus.
| 12 | AB SMALL CAP GROWTH PORTFOLIO |
abfunds.com | |
PORTFOLIO OF INVESTMENTS
July 31, 2022
| Company | Shares | U.S. $ Value | ||||||
|
|
||||||||
| COMMON STOCKS – 96.5% |
||||||||
| Information Technology – 24.0% |
||||||||
| Electronic Equipment, Instruments & Components – 4.0% |
||||||||
| Allegro MicroSystems, Inc.(a) |
1,831,402 | $ | 45,473,711 | |||||
| Littelfuse, Inc. |
198,687 | 55,407,844 | ||||||
| Novanta, Inc.(a)(b) |
488,649 | 75,349,676 | ||||||
|
|
|
|||||||
| 176,231,231 | ||||||||
|
|
|
|||||||
| IT Services – 3.3% |
||||||||
| BigCommerce Holdings, Inc.(a)(b) |
1,879,093 | 29,407,806 | ||||||
| DigitalOcean Holdings, Inc.(a) |
895,110 | 36,681,608 | ||||||
| Shift4 Payments, Inc. – Class A(a)(b) |
925,635 | 33,720,883 | ||||||
| Switch, Inc. – Class A |
1,282,235 | 43,352,365 | ||||||
|
|
|
|||||||
| 143,162,662 | ||||||||
|
|
|
|||||||
| Semiconductors & Semiconductor Equipment – 6.8% |
||||||||
| Lattice Semiconductor Corp.(a) |
930,935 | 57,252,503 | ||||||
| MACOM Technology Solutions Holdings, Inc.(a) |
1,210,635 | 70,144,192 | ||||||
| Onto Innovation, Inc.(a) |
499,400 | 41,575,050 | ||||||
| Semtech Corp.(a) |
557,053 | 34,721,113 | ||||||
| Silicon Laboratories, Inc.(a)(b) |
358,751 | 52,908,597 | ||||||
| Synaptics, Inc.(a) |
297,324 | 43,097,114 | ||||||
|
|
|
|||||||
| 299,698,569 | ||||||||
|
|
|
|||||||
| Software – 9.9% |
||||||||
| Blackline, Inc.(a) |
799,919 | 50,570,879 | ||||||
| Braze, Inc. – Class A(a)(b) |
1,139,325 | 49,526,458 | ||||||
| Elastic NV(a) |
618,140 | 49,383,204 | ||||||
| Enfusion, Inc. – Class A(a) |
1,524,672 | 17,533,728 | ||||||
| Five9, Inc.(a) |
416,660 | 45,049,279 | ||||||
| Manhattan Associates, Inc.(a) |
503,030 | 70,761,230 | ||||||
| Monday.com Ltd.(a) |
340,890 | 35,019,630 | ||||||
| Rapid7, Inc.(a)(b) |
789,141 | 50,481,350 | ||||||
| Smartsheet, Inc. – Class A(a) |
1,203,737 | 36,184,334 | ||||||
| Varonis Systems, Inc.(a) |
1,179,239 | 29,988,048 | ||||||
|
|
|
|||||||
| 434,498,140 | ||||||||
|
|
|
|||||||
| 1,053,590,602 | ||||||||
|
|
|
|||||||
| Health Care – 19.9% |
||||||||
| Biotechnology – 7.2% |
||||||||
| ADC Therapeutics SA(a)(b) |
1,039,636 | 7,703,703 | ||||||
| Arrowhead Pharmaceuticals, Inc.(a) |
824,620 | 35,071,089 | ||||||
| Ascendis Pharma A/S (ADR)(a) |
222,484 | 19,029,056 | ||||||
| Blueprint Medicines Corp.(a)(b) |
541,929 | 27,670,895 | ||||||
| Coherus Biosciences, Inc.(a)(b) |
2,258,281 | 19,127,640 | ||||||
| Erasca, Inc.(a)(b) |
1,431,364 | 10,792,484 | ||||||
| Insmed, Inc.(a)(b) |
1,351,591 | 29,897,193 | ||||||
| Intellia Therapeutics, Inc.(a) |
496,686 | 32,165,385 | ||||||
| abfunds.com | AB SMALL CAP GROWTH PORTFOLIO | 13 | |
PORTFOLIO OF INVESTMENTS (continued)
| Company | Shares | U.S. $ Value | ||||||
|
|
||||||||
| Legend Biotech Corp. (ADR)(a) |
452,742 | $ | 21,387,532 | |||||
| Recursion Pharmaceuticals, Inc. – Class A(a)(b) |
2,137,388 | 18,082,302 | ||||||
| Relay Therapeutics, Inc.(a)(b) |
936,938 | 17,820,561 | ||||||
| Ultragenyx Pharmaceutical, Inc.(a) |
368,000 | 19,607,040 | ||||||
| Vir Biotechnology, Inc.(a) |
678,447 | 18,867,611 | ||||||
| Y-mAbs Therapeutics, Inc.(a)(b) |
1,247,135 | 19,442,835 | ||||||
| Zentalis Pharmaceuticals, Inc.(a)(b) |
755,214 | 22,052,249 | ||||||
|
|
|
|||||||
| 318,717,575 | ||||||||
|
|
|
|||||||
| Health Care Equipment & Supplies – 7.0% |
||||||||
| AtriCure, Inc.(a) |
1,309,700 | 64,712,277 | ||||||
| iRhythm Technologies, Inc.(a) |
484,310 | 74,888,855 | ||||||
| Lantheus Holdings, Inc.(a) |
381,265 | 29,250,651 | ||||||
| Silk Road Medical, Inc.(a)(b) |
1,113,053 | 50,655,042 | ||||||
| Tandem Diabetes Care, Inc.(a) |
786,470 | 52,072,179 | ||||||
| Treace Medical Concepts, Inc.(a)(b) |
2,013,806 | 34,073,597 | ||||||
|
|
|
|||||||
| 305,652,601 | ||||||||
|
|
|
|||||||
| Health Care Providers & Services – 2.5% |
||||||||
| Certara, Inc.(a)(b) |
1,863,941 | 42,852,004 | ||||||
| Inari Medical, Inc.(a)(b) |
852,392 | 66,128,571 | ||||||
|
|
|
|||||||
| 108,980,575 | ||||||||
|
|
|
|||||||
| Health Care Technology – 1.0% |
||||||||
| Health Catalyst, Inc.(a)(b) |
2,602,590 | 43,567,357 | ||||||
|
|
|
|||||||
| Life Sciences Tools & Services – 1.3% |
||||||||
| Repligen Corp.(a) |
280,045 | 59,750,401 | ||||||
|
|
|
|||||||
| Pharmaceuticals – 0.9% |
||||||||
| Intra-Cellular Therapies, Inc.(a) |
714,870 | 38,688,765 | ||||||
|
|
|
|||||||
| 875,357,274 | ||||||||
|
|
|
|||||||
| Industrials – 17.2% |
||||||||
| Aerospace & Defense – 2.5% |
||||||||
| Axon Enterprise, Inc.(a) |
550,215 | 60,628,191 | ||||||
| Curtiss-Wright Corp. |
350,920 | 50,335,965 | ||||||
|
|
|
|||||||
| 110,964,156 | ||||||||
|
|
|
|||||||
| Building Products – 2.3% |
||||||||
| AZEK Co., Inc. (The)(a) |
1,621,262 | 33,527,698 | ||||||
| Simpson Manufacturing Co., Inc. |
445,376 | 45,998,433 | ||||||
| Zurn Elkay Water Solutions Corp. |
661,610 | 19,153,610 | ||||||
|
|
|
|||||||
| 98,679,741 | ||||||||
|
|
|
|||||||
| Commercial Services & Supplies – 1.4% |
||||||||
| Tetra Tech, Inc. |
413,833 | 63,428,184 | ||||||
|
|
|
|||||||
| Construction & Engineering – 0.8% |
||||||||
| Hayward Holdings, Inc.(a)(b) |
2,873,256 | 33,530,897 | ||||||
|
|
|
|||||||
| Machinery – 4.0% |
||||||||
| ITT, Inc. |
692,116 | 51,929,464 | ||||||
| 14 | AB SMALL CAP GROWTH PORTFOLIO |
abfunds.com | |
PORTFOLIO OF INVESTMENTS (continued)
| Company | Shares | U.S. $ Value | ||||||
|
|
||||||||
| John Bean Technologies Corp. |
604,909 | $ | 67,937,330 | |||||
| Middleby Corp. (The)(a) |
375,654 | 54,353,377 | ||||||
|
|
|
|||||||
| 174,220,171 | ||||||||
|
|
|
|||||||
| Professional Services – 1.6% |
||||||||
| Insperity, Inc. |
632,709 | 69,433,486 | ||||||
|
|
|
|||||||
| Road & Rail – 1.8% |
||||||||
| Saia, Inc.(a)(b) |
338,524 | 80,517,933 | ||||||
|
|
|
|||||||
| Trading Companies & Distributors – 2.8% |
||||||||
| Herc Holdings, Inc. |
599,650 | 74,368,593 | ||||||
| SiteOne Landscape Supply, Inc.(a)(b) |
357,824 | 49,855,618 | ||||||
|
|
|
|||||||
| 124,224,211 | ||||||||
|
|
|
|||||||
| 754,998,779 | ||||||||
|
|
|
|||||||
| Consumer Discretionary – 15.7% |
||||||||
| Auto Components – 1.7% |
||||||||
| Fox Factory Holding Corp.(a)(b) |
806,671 | 76,359,477 | ||||||
|
|
|
|||||||
| Diversified Consumer Services – 0.8% |
||||||||
| European Wax Center, Inc. – Class A(b) |
1,686,846 | 35,288,818 | ||||||
|
|
|
|||||||
| Hotels, Restaurants & Leisure – 5.7% |
||||||||
| Hilton Grand Vacations, Inc.(a) |
1,788,848 | 72,931,333 | ||||||
| Life Time Group Holdings, Inc.(a)(b) |
3,023,214 | 43,836,603 | ||||||
| Planet Fitness, Inc. – Class A(a) |
852,675 | 67,199,317 | ||||||
| Texas Roadhouse, Inc. |
736,030 | 64,196,536 | ||||||
|
|
|
|||||||
| 248,163,789 | ||||||||
|
|
|
|||||||
| Household Durables – 2.2% |
||||||||
| Lovesac Co. (The)(a)† |
913,819 | 28,474,600 | ||||||
| Skyline Champion Corp.(a) |
1,072,916 | 67,915,583 | ||||||
|
|
|
|||||||
| 96,390,183 | ||||||||
|
|
|
|||||||
| Multiline Retail – 1.6% |
||||||||
| Driven Brands Holdings, Inc.(a)(b) |
2,369,775 | 71,993,765 | ||||||
|
|
|
|||||||
| Specialty Retail – 3.7% |
||||||||
| Five Below, Inc.(a) |
255,657 | 32,486,335 | ||||||
| Floor & Decor Holdings, Inc. – Class A(a) |
466,089 | 37,552,791 | ||||||
| Lithia Motors, Inc.(b) |
200,513 | 53,192,088 | ||||||
| National Vision Holdings, Inc.(a)(b) |
1,286,713 | 37,494,817 | ||||||
|
|
|
|||||||
| 160,726,031 | ||||||||
|
|
|
|||||||
| 688,922,063 | ||||||||
|
|
|
|||||||
| Financials – 8.8% |
||||||||
| Banks – 1.6% |
||||||||
| First Financial Bankshares, Inc.(b) |
1,629,080 | 71,972,754 | ||||||
|
|
|
|||||||
| Capital Markets – 4.2% |
||||||||
| Houlihan Lokey, Inc. |
685,606 | 57,974,843 | ||||||
| P10, Inc. – Class A(b) |
1,775,836 | 21,008,140 | ||||||
| abfunds.com | AB SMALL CAP GROWTH PORTFOLIO | 15 | |
PORTFOLIO OF INVESTMENTS (continued)
| Company | Shares | U.S. $ Value | ||||||
|
|
||||||||
| StepStone Group, Inc. – Class A(b) |
1,867,917 | $ | 49,761,309 | |||||
| Stifel Financial Corp. |
905,964 | 54,185,707 | ||||||
|
|
|
|||||||
| 182,929,999 | ||||||||
|
|
|
|||||||
| Consumer Finance – 0.4% |
||||||||
| Fisker, Inc.(a)(b) |
1,937,365 | 18,559,957 | ||||||
|
|
|
|||||||
| Insurance – 2.6% |
||||||||
| Ryan Specialty Holdings, Inc.(a)(b) |
1,522,653 | 65,839,516 | ||||||
| Trupanion, Inc.(a)(b) |
745,810 | 47,008,404 | ||||||
|
|
|
|||||||
| 112,847,920 | ||||||||
|
|
|
|||||||
| 386,310,630 | ||||||||
|
|
|
|||||||
| Energy – 6.2% |
||||||||
| Energy Equipment & Services – 2.7% |
||||||||
| ChampionX Corp. |
2,803,764 | 58,570,630 | ||||||
| Helmerich & Payne, Inc. |
1,266,420 | 58,635,246 | ||||||
|
|
|
|||||||
| 117,205,876 | ||||||||
|
|
|
|||||||
| Oil, Gas & Consumable Fuels – 3.5% |
||||||||
| Magnolia Oil & Gas Corp. – Class A(b) |
2,753,084 | 66,431,917 | ||||||
| Matador Resources Co. |
1,493,433 | 86,290,559 | ||||||
|
|
|
|||||||
| 152,722,476 | ||||||||
|
|
|
|||||||
| 269,928,352 | ||||||||
|
|
|
|||||||
| Consumer Staples – 3.7% |
||||||||
| Food & Staples Retailing – 2.2% |
||||||||
| Chefs’ Warehouse, Inc. (The)(a) |
1,663,631 | 57,578,269 | ||||||
| Grocery Outlet Holding Corp.(a) |
920,860 | 39,339,139 | ||||||
|
|
|
|||||||
| 96,917,408 | ||||||||
|
|
|
|||||||
| Food Products – 1.5% |
||||||||
| Freshpet, Inc.(a)(b) |
864,815 | 46,215,714 | ||||||
| Vital Farms, Inc.(a)(b) |
1,453,214 | 17,147,925 | ||||||
|
|
|
|||||||
| 63,363,639 | ||||||||
|
|
|
|||||||
| 160,281,047 | ||||||||
|
|
|
|||||||
| Materials – 1.0% |
||||||||
| Chemicals – 1.0% |
||||||||
| Element Solutions, Inc. |
2,292,436 | 45,298,535 | ||||||
|
|
|
|||||||
| Total Common Stocks |
4,234,687,282 | |||||||
|
|
|
|||||||
| INVESTMENT COMPANIES – 1.2% |
||||||||
| Funds and Investment Trusts – 1.2% |
||||||||
| iShares Russell 2000 Growth ETF(b)(c) |
242,939 | 55,781,224 | ||||||
|
|
|
|||||||
| SHORT-TERM INVESTMENTS – 3.4% |
||||||||
| Investment Companies – 3.4% |
||||||||
| AB Fixed Income Shares, Inc. – Government Money Market Portfolio – Class AB, 1.72%(c)(d)(e) |
148,375,491 | 148,375,491 | ||||||
|
|
|
|||||||
| 16 | AB SMALL CAP GROWTH PORTFOLIO |
abfunds.com | |
PORTFOLIO OF INVESTMENTS (continued)
| Company | Shares | U.S. $ Value | ||||||
|
|
||||||||
| Total Investments Before Security Lending Collateral for
Securities |
$ | 4,438,843,997 | ||||||
|
|
|
|||||||
| INVESTMENTS OF CASH COLLATERAL FOR SECURITIES LOANED – 1.9% |
||||||||
| Investment Companies – 1.9% |
||||||||
| AB Fixed Income Shares, Inc. – Government Money Market Portfolio – Class AB, 1.72%(c)(d)(e) |
83,268,617 | 83,268,617 | ||||||
|
|
|
|||||||
| Total Investments – 103.0% |
4,522,112,614 | |||||||
| Other assets less liabilities – (3.0)% |
(133,822,956 | ) | ||||||
|
|
|
|||||||
| Net Assets – 100.0% |
$ | 4,388,289,658 | ||||||
|
|
|
|||||||
| † | Deemed an affiliated company as defined by the Investment Company Act of 1940 since the Company owns 5% or more of the outstanding voting securities. |
| (a) | Non-income producing security. |
| (b) | Represents entire or partial securities out on loan. See Note E for securities lending information. |
| (c) | To obtain a copy of the fund’s shareholder report, please go to the Securities and Exchange Commission’s website at www.sec.gov. Additionally, shareholder reports for AB funds can be obtained by calling AB at (800) 227-4618. |
| (d) | Affiliated investments. |
| (e) | The rate shown represents the 7-day yield as of period end. |
Glossary:
ADR – American Depositary Receipt
ETF – Exchange Traded Fund
See notes to financial statements.
| abfunds.com | AB SMALL CAP GROWTH PORTFOLIO | 17 | |
STATEMENT OF ASSETS & LIABILITIES
July 31, 2022
| Assets | ||||
| Investments in securities, at value |
||||
| Unaffiliated issuers (cost $4,384,669,611) |
$ | 4,261,993,906 | (a) | |
| Affiliated issuers (cost $268,678,057—including investment of cash collateral for securities loaned of $83,268,617) |
260,118,708 | |||
| Receivable for investment securities sold |
17,669,296 | |||
| Receivable for capital stock sold |
12,772,444 | |||
| Unaffiliated dividends receivable |
332,640 | |||
| Affiliated dividends receivable |
161,350 | |||
|
|
|
|||
| Total assets |
4,553,048,344 | |||
|
|
|
|||
| Liabilities | ||||
| Payable for collateral received on securities loaned |
83,164,857 | |||
| Payable for investment securities purchased |
66,700,743 | |||
| Payable for capital stock redeemed |
11,345,220 | |||
| Advisory fee payable |
2,526,310 | |||
| Distribution fee payable |
211,004 | |||
| Transfer Agent fee payable |
163,656 | |||
| Collateral due to securities lending agent |
103,760 | |||
| Administrative fee payable |
34,106 | |||
| Directors’ fees payable |
6,316 | |||
| Accrued expenses |
502,714 | |||
|
|
|
|||
| Total liabilities |
164,758,686 | |||
|
|
|
|||
| Net Assets |
$ | 4,388,289,658 | ||
|
|
|
|||
| Composition of Net Assets | ||||
| Capital stock, at par |
$ | 7,839 | ||
| Additional paid-in capital |
4,900,343,697 | |||
| Accumulated loss |
(512,061,878 | ) | ||
|
|
|
|||
| Net Assets |
$ | 4,388,289,658 | ||
|
|
|
Net Asset Value Per Share—27 billion shares of capital stock authorized, $.0001 par value
| Class | Net Assets | Outstanding | Value | |||||||||
|
|
||||||||||||
| A | $ | 715,328,510 | 14,113,920 | $ | 50.68 | * | ||||||
|
|
||||||||||||
| C | $ | 33,191,481 | 1,467,403 | $ | 22.62 | |||||||
|
|
||||||||||||
| Advisor | $ | 1,814,969,042 | 31,120,769 | $ | 58.32 | |||||||
|
|
||||||||||||
| R | $ | 34,853,375 | 735,679 | $ | 47.38 | |||||||
|
|
||||||||||||
| K | $ | 135,550,446 | 2,568,078 | $ | 52.78 | |||||||
|
|
||||||||||||
| I | $ | 597,940,854 | 10,316,414 | $ | 57.96 | |||||||
|
|
||||||||||||
| Z | $ | 1,056,455,950 | 18,068,447 | $ | 58.47 | |||||||
|
|
||||||||||||
| (a) | Includes securities on loan with a value of $324,154,407 (see Note E). |
| * | The maximum offering price per share for Class A shares was $52.93 which reflects a sales charge of 4.25%. |
See notes to financial statements.
| 18 | AB SMALL CAP GROWTH PORTFOLIO |
abfunds.com | |
STATEMENT OF OPERATIONS
Year Ended July 31, 2022
| Investment Income | ||||||||
| Dividends |
||||||||
| Unaffiliated issuers |
$ | 14,730,433 | ||||||
| Affiliated issuers |
356,035 | |||||||
| Securities lending income |
2,356,932 | $ | 17,443,400 | |||||
|
|
|
|||||||
| Expenses | ||||||||
| Advisory fee (see Note B) |
35,982,545 | |||||||
| Distribution fee—Class A |
2,312,030 | |||||||
| Distribution fee—Class C |
460,645 | |||||||
| Distribution fee—Class R |
222,095 | |||||||
| Distribution fee—Class K |
338,841 | |||||||
| Transfer agency—Class A |
1,276,235 | |||||||
| Transfer agency—Class C |
63,675 | |||||||
| Transfer agency—Advisor Class |
3,050,272 | |||||||
| Transfer agency—Class R |
106,546 | |||||||
| Transfer agency—Class K |
67,768 | |||||||
| Transfer agency—Class I |
833,766 | |||||||
| Transfer agency—Class Z |
347,019 | |||||||
| Registration fees |
451,635 | |||||||
| Printing |
389,922 | |||||||
| Custody and accounting |
243,876 | |||||||
| Administrative |
100,965 | |||||||
| Directors’ fees |
81,816 | |||||||
| Legal |
67,806 | |||||||
| Audit and tax |
54,503 | |||||||
| Miscellaneous |
93,442 | |||||||
|
|
|
|||||||
| Total expenses |
46,545,402 | |||||||
| Less: expenses waived and reimbursed by the Adviser (see Notes B & E) |
(93,019 | ) | ||||||
|
|
|
|||||||
| Net expenses |
46,452,383 | |||||||
|
|
|
|||||||
| Net investment loss |
(29,008,983 | ) | ||||||
|
|
|
|||||||
| Realized and Unrealized Loss on Investment Transactions | ||||||||
| Net realized gain (loss) on: |
||||||||
| Affiliated issuers(a) |
2,099,058 | |||||||
| Investment transactions(b) |
(305,455,318 | ) | ||||||
| Net change in unrealized appreciation/depreciation of: |
||||||||
| Affiliated issuers |
(30,100,374 | ) | ||||||
| Investment transactions |
(1,509,953,186 | ) | ||||||
|
|
|
|||||||
| Net loss on investment transactions |
(1,843,409,820 | ) | ||||||
|
|
|
|||||||
| Contributions from Affiliates (see Note B) |
230,446 | |||||||
|
|
|
|||||||
| Net Decrease in Net Assets from Operations |
$ | (1,872,188,357 | ) | |||||
|
|
|
| (a) | On November 1, 2021, the Portfolio had a redemption-in-kind with total proceeds in the amount of $400,501. The realized gain of $242,088, resulting from redemption-in-kind, will not be recognized for tax purposes. |
| (b) | On November 1, 2021, the Portfolio had a redemption-in-kind with total proceeds in the amount of $35,544,694. The realized gain of $7,241,190, resulting from redemption-in-kind, will not be recognized for tax purposes. |
See notes to financial statements.
| abfunds.com | AB SMALL CAP GROWTH PORTFOLIO | 19 | |
STATEMENT OF CHANGES IN NET ASSETS
| Year Ended July 31, 2022 |
Year Ended July 31, 2021 |
|||||||
| Increase (Decrease) in Net Assets from Operations | ||||||||
| Net investment loss |
$ | (29,008,983 | ) | $ | (29,270,969 | ) | ||
| Net realized gain (loss) on investment transactions |
(303,356,260 | ) | 797,075,481 | |||||
| Net change in unrealized appreciation/depreciation of investments |
(1,540,053,560 | ) | 587,409,993 | |||||
| Contributions from Affiliates (see Note B) |
230,446 | – 0 | – | |||||
|
|
|
|
|
|||||
| Net increase (decrease) in net assets from operations |
(1,872,188,357 | ) | 1,355,214,505 | |||||
| Distributions to Shareholders |
||||||||
| Class A |
(91,037,529 | ) | (95,498,453 | ) | ||||
| Class C |
(9,467,036 | ) | (8,444,586 | ) | ||||
| Advisor Class |
(185,604,563 | ) | (123,053,417 | ) | ||||
| Class R |
(4,488,204 | ) | (3,647,382 | ) | ||||
| Class K |
(11,535,678 | ) | (6,663,102 | ) | ||||
| Class I |
(61,185,430 | ) | (64,644,139 | ) | ||||
| Class Z |
(92,102,328 | ) | (65,906,155 | ) | ||||
| Capital Stock Transactions | ||||||||
| Net increase |
1,289,331,710 | 1,300,471,197 | ||||||
|
|
|
|
|
|||||
| Total increase (decrease) |
(1,038,277,415 | ) | 2,287,828,468 | |||||
| Net Assets | ||||||||
| Beginning of period |
5,426,567,073 | 3,138,738,605 | ||||||
|
|
|
|
|
|||||
| End of period |
$ | 4,388,289,658 | $ | 5,426,567,073 | ||||
|
|
|
|
|
|||||
See notes to financial statements.
| 20 | AB SMALL CAP GROWTH PORTFOLIO |
abfunds.com | |
NOTES TO FINANCIAL STATEMENTS
July 31, 2022
NOTE A
Significant Accounting Policies
AB Cap Fund, Inc. (the “Company”) is registered under the Investment Company Act of 1940 as an open-end management investment company. The Company, which is a Maryland corporation, operates as a series company comprised of 12 portfolios currently in operation. Each portfolio is considered to be a separate entity for financial reporting and tax purposes. This report relates only to the AB Small Cap Growth Portfolio (the “Fund”), a diversified portfolio. The Fund has authorized the issuance of Class A, Class C, Advisor Class, Class R, Class K, Class I, Class Z and Class T shares. Class B and Class T shares have not been issued. Class A shares are sold with a front-end sales charge of up to 4.25% for purchases not exceeding $1,000,000. With respect to purchases of $1,000,000 or more, Class A shares redeemed within one year of purchase may be subject to a contingent deferred sales charge of 1%. Class C shares are subject to a contingent deferred sales charge of 1% on redemptions made within the first year after purchase, and 0% after the first year of purchase. Effective May 31, 2021, Class C shares automatically convert to Class A shares eight years after the end of the calendar month of purchase. Prior to May 31, 2021, Class C shares automatically converted to Class A shares 10 years after the end of the calendar month of purchase. Class R and Class K shares are sold without an initial or contingent deferred sales charge. Advisor Class, Class I and Class Z shares are sold without an initial or contingent deferred sales charge and are not subject to ongoing distribution expenses. All nine classes of shares have identical voting, dividend, liquidation and other rights, except that the classes bear different distribution and transfer agency expenses. Each class has exclusive voting rights with respect to its distribution plan. Effective February 1, 2013, the Fund was closed to new investors, subject to certain exceptions. Effective June 1, 2016, with the exception of Class B shares, the Fund reopened to new investors. The financial statements have been prepared in conformity with U.S. generally accepted accounting principles (“U.S. GAAP”), which require management to make certain estimates and assumptions that affect the reported amounts of assets and liabilities in the financial statements and amounts of income and expenses during the reporting period. Actual results could differ from those estimates. The Fund is an investment company under U.S. GAAP and follows the accounting and reporting guidance applicable to investment companies. The following is a summary of significant accounting policies followed by the Fund.
1. Security Valuation
Portfolio securities are valued at their current market value determined on the basis of market quotations or, if market quotations are not readily
| abfunds.com | AB SMALL CAP GROWTH PORTFOLIO | 21 | |
NOTES TO FINANCIAL STATEMENTS (continued)
available or are deemed unreliable, at “fair value” as determined in accordance with procedures established by and under the general supervision of the Company’s Board of Directors (the “Board”).
In general, the market values of securities which are readily available and deemed reliable are determined as follows: securities listed on a national securities exchange (other than securities listed on the NASDAQ Stock Market, Inc. (“NASDAQ”)) or on a foreign securities exchange are valued at the last sale price at the close of the exchange or foreign securities exchange. If there has been no sale on such day, the securities are valued at the last traded price from the previous day. Securities listed on more than one exchange are valued by reference to the principal exchange on which the securities are traded; securities listed only on NASDAQ are valued in accordance with the NASDAQ Official Closing Price; listed or over the counter (“OTC”) market put or call options are valued at the mid level between the current bid and ask prices. If either a current bid or current ask price is unavailable, AllianceBernstein L.P. (the “Adviser”) will have discretion to determine the best valuation (e.g., last trade price in the case of listed options); open futures are valued using the closing settlement price or, in the absence of such a price, the most recent quoted bid price. If there are no quotations available for the day of valuation, the last available closing settlement price is used; U.S. Government securities and any other debt instruments having 60 days or less remaining until maturity are generally valued at market by an independent pricing vendor, if a market price is available. If a market price is not available, the securities are valued at amortized cost. This methodology is commonly used for short term securities that have an original maturity of 60 days or less, as well as short term securities that had an original term to maturity that exceeded 60 days. In instances when amortized cost is utilized, the Valuation Committee (the “Committee”) must reasonably conclude that the utilization of amortized cost is approximately the same as the fair value of the security. Factors the Committee will consider include, but are not limited to, an impairment of the creditworthiness of the issuer or material changes in interest rates. Fixed-income securities, including mortgage-backed and asset-backed securities, may be valued on the basis of prices provided by a pricing service or at a price obtained from one or more of the major broker-dealers. In cases where broker-dealer quotes are obtained, the Adviser may establish procedures whereby changes in market yields or spreads are used to adjust, on a daily basis, a recently obtained quoted price on a security. Swaps and other derivatives are valued daily, primarily using independent pricing services, independent pricing models using market inputs, as well as third party broker-dealers or counterparties. Open-end mutual funds are valued at the closing net asset value per share, while exchange traded funds are valued at the closing market price per share.
| 22 | AB SMALL CAP GROWTH PORTFOLIO |
abfunds.com | |
NOTES TO FINANCIAL STATEMENTS (continued)
Securities for which market quotations are not readily available (including restricted securities) or are deemed unreliable are valued at fair value as deemed appropriate by the Adviser. Factors considered in making this determination may include, but are not limited to, information obtained by contacting the issuer, analysts, analysis of the issuer’s financial statements or other available documents. In addition, the Fund may use fair value pricing for securities primarily traded in non-U.S. markets because most foreign markets close well before the Fund values its securities at 4:00 p.m., Eastern Time. The earlier close of these foreign markets gives rise to the possibility that significant events, including broad market moves, may have occurred in the interim and may materially affect the value of those securities. To account for this, the Fund generally values many of its foreign equity securities using fair value prices based on third party vendor modeling tools to the extent available.
2. Fair Value Measurements
In accordance with U.S. GAAP regarding fair value measurements, fair value is defined as the price that the Fund would receive to sell an asset or pay to transfer a liability in an orderly transaction between market participants at the measurement date. U.S. GAAP establishes a framework for measuring fair value, and a three-level hierarchy for fair value measurements based upon the transparency of inputs to the valuation of an asset or liability (including those valued based on their market values as described in Note A.1 above). Inputs may be observable or unobservable and refer broadly to the assumptions that market participants would use in pricing the asset or liability. Observable inputs reflect the assumptions market participants would use in pricing the asset or liability based on market data obtained from sources independent of the Fund. Unobservable inputs reflect the Fund’s own assumptions about the assumptions that market participants would use in pricing the asset or liability based on the best information available in the circumstances. Each investment is assigned a level based upon the observability of the inputs which are significant to the overall valuation. The three-tier hierarchy of inputs is summarized below.
| • | Level 1—quoted prices in active markets for identical investments |
| • | Level 2—other significant observable inputs (including quoted prices for similar investments, interest rates, prepayment speeds, credit risk, etc.) |
| • | Level 3—significant unobservable inputs (including the Fund’s own assumptions in determining the fair value of investments) |
Where readily available market prices or relevant bid prices are not available for certain equity investments, such investments may be valued based on similar publicly traded investments, movements in relevant indices since
| abfunds.com | AB SMALL CAP GROWTH PORTFOLIO | 23 | |
NOTES TO FINANCIAL STATEMENTS (continued)
last available prices or based upon underlying company fundamentals and comparable company data (such as multiples to earnings or other multiples to equity). Where an investment is valued using an observable input, such as another publicly traded security, the investment will be classified as Level 2. If management determines that an adjustment is appropriate based on restrictions on resale, illiquidity or uncertainty, and such adjustment is a significant component of the valuation, the investment will be classified as Level 3. An investment will also be classified as Level 3 where management uses company fundamentals and other significant inputs to determine the valuation.
The following table summarizes the valuation of the Fund’s investments by the above fair value hierarchy levels as of July 31, 2022:
| Investments in |
Level 1 | Level 2 | Level 3 | Total | ||||||||||||
| Assets: |
||||||||||||||||
| Common Stocks(a) |
$ | 4,234,687,282 | $ | – 0 | – | $ | – 0 | – | $ | 4,234,687,282 | ||||||
| Investment Companies |
55,781,224 | – 0 | – | – 0 | – | 55,781,224 | ||||||||||
| Short-Term Investments |
148,375,491 | – 0 | – | – 0 | – | 148,375,491 | ||||||||||
| Investments of Cash Collateral for Securities Loaned in Affiliated Money Market Fund |
83,268,617 | – 0 | – | – 0 | – | 83,268,617 | ||||||||||
|
|
|
|
|
|
|
|
|
|||||||||
| Total Investments in Securities |
4,522,112,614 | – 0 | – | – 0 | – | 4,522,112,614 | ||||||||||
| Other Financial Instruments(b) |
– 0 | – | – 0 | – | – 0 | – | – 0 | – | ||||||||
|
|
|
|
|
|
|
|
|
|||||||||
| Total |
$ | 4,522,112,614 | $ | – 0 | – | $ | – 0 | – | $ | 4,522,112,614 | ||||||
|
|
|
|
|
|
|
|
|
|||||||||
| (a) | See Portfolio of Investments for sector classifications. |
| (b) | Other financial instruments are derivative instruments, such as futures, forwards and swaps, which are valued at the unrealized appreciation/(depreciation) on the instrument. Other financial instruments may also include swaps with upfront premiums, options written and swaptions written which are valued at market value. |
3. Currency Translation
Assets and liabilities denominated in foreign currencies and commitments under forward currency exchange contracts are translated into U.S. dollars at the mean of the quoted bid and ask prices of such currencies against the U.S. dollar. Purchases and sales of portfolio securities are translated into U.S. dollars at the rates of exchange prevailing when such securities were acquired or sold. Income and expenses are translated into U.S. dollars at rates of exchange prevailing when accrued.
Net realized gain or loss on foreign currency transactions represents foreign exchange gains and losses from sales and maturities of foreign fixed income investments, holding of foreign currencies, currency gains or losses realized between the trade and settlement dates on foreign investment transactions, and the difference between the amounts of dividends,
| 24 | AB SMALL CAP GROWTH PORTFOLIO |
abfunds.com | |
NOTES TO FINANCIAL STATEMENTS (continued)
interest and foreign withholding taxes recorded on the Fund’s books and the U.S. dollar equivalent amounts actually received or paid. Net unrealized currency gains and losses from valuing foreign currency denominated assets and liabilities at period end exchange rates are reflected as a component of net unrealized appreciation or depreciation of foreign currency denominated assets and liabilities.
4. Taxes
It is the Fund’s policy to meet the requirements of the Internal Revenue Code applicable to regulated investment companies and to distribute all of its investment company taxable income and net realized gains, if any, to shareholders. Therefore, no provisions for federal income or excise taxes are required. The Fund may be subject to taxes imposed by countries in which it invests. Such taxes are generally based on income and/or capital gains earned or repatriated. Taxes are accrued and applied to net investment income, net realized gains and net unrealized appreciation/depreciation as such income and/or gains are earned.
In accordance with U.S. GAAP requirements regarding accounting for uncertainties in income taxes, management has analyzed the Fund’s tax positions taken or expected to be taken on federal and state income tax returns for all open tax years (the current and the prior three tax years) and has concluded that no provision for income tax is required in the Fund’s financial statements.
5. Investment Income and Investment Transactions
Dividend income is recorded on the ex-dividend date or as soon as the Fund is informed of the dividend. Interest income is accrued daily. Investment transactions are accounted for on the date the securities are purchased or sold. Investment gains or losses are determined on the identified cost basis. The Fund amortizes premiums and accretes discounts as adjustments to interest income. The Fund accounts for distributions received from REIT investments or from regulated investment companies as dividend income, realized gain, or return of capital based on information provided by the REIT or the investment company.
6. Class Allocations
All income earned and expenses incurred by the Fund are borne on a pro-rata basis by each outstanding class of shares, based on the proportionate interest in the Fund represented by the net assets of such class, except for class specific expenses which are allocated to the respective class. Expenses of the Company are charged proportionately to each portfolio or based on other appropriate methods. Realized and unrealized gains and losses are allocated among the various share classes based on respective net assets.
| abfunds.com | AB SMALL CAP GROWTH PORTFOLIO | 25 | |
NOTES TO FINANCIAL STATEMENTS (continued)
7. Dividends and Distributions
Dividends and distributions to shareholders, if any, are recorded on the ex-dividend date. Income dividends and capital gains distributions are determined in accordance with federal tax regulations and may differ from those determined in accordance with U.S. GAAP. To the extent these differences are permanent, such amounts are reclassified within the capital accounts based on their federal tax basis treatment; temporary differences do not require such reclassification.
NOTE B
Advisory Fee and Other Transactions with Affiliates
Under the terms of the investment advisory agreement, the Fund pays the Adviser an advisory fee at an annual rate of .75% of the first $2.5 billion, .65% of the excess over $2.5 billion up to $5 billion and .60% of the excess over $5 billion as a percentage of the Fund’s average daily net assets. The fee is accrued daily and paid monthly.
Pursuant to the investment advisory agreement, the Fund may reimburse the Adviser for certain legal and accounting services provided to the Fund by the Adviser. For the year ended July 31, 2022, the reimbursement for such services amounted to $100,965.
The Fund compensates AllianceBernstein Investor Services, Inc. (“ABIS”), a wholly-owned subsidiary of the Adviser, under a Transfer Agency Agreement for providing personnel and facilities to perform transfer agency services for the Fund. ABIS may make payments to intermediaries that provide omnibus account services, sub-accounting services and/or networking services. Such compensation retained by ABIS amounted to $1,620,914 for the year ended July 31, 2022.
AllianceBernstein Investments, Inc. (the “Distributor”), a wholly-owned subsidiary of the Adviser, serves as the distributor of the Fund’s shares. The Distributor has advised the Fund that it has retained front-end sales charges of $24,006 from the sale of Class A shares and received $9,611 and $13,213 in contingent deferred sales charges imposed upon redemptions by shareholders of Class A and Class C shares, respectively, for the year ended July 31, 2022.
The Fund may invest in AB Government Money Market Portfolio (the “Government Money Market Portfolio”) which has a contractual annual advisory fee rate of .20% of the portfolio’s average daily net assets and bears its own expenses. The Adviser has contractually agreed to waive .10% of the advisory fee of Government Money Market Portfolio (resulting in a net advisory fee of .10%) until August 31, 2023. In connection with the investment by the Fund in Government Money Market Portfolio, the
| 26 | AB SMALL CAP GROWTH PORTFOLIO |
abfunds.com | |
NOTES TO FINANCIAL STATEMENTS (continued)
Adviser has contractually agreed to waive its advisory fee from the Fund in an amount equal to the Fund’s pro rata share of the effective advisory fee of Government Money Market Portfolio, as borne indirectly by the Fund as an acquired fund fee and expense. For the year ended July 31, 2022, such waiver amounted to $82,771.
A summary of the Fund’s transactions in affiliated issuers for the year ended July 31, 2022 is as follows:
| Fund | Market Value 7/31/21 (000) |
Purchases at Cost (000) |
Sales Proceeds (000) |
Realized Gain (000) |
Change in Unrealized Appr./ (Depr.) (000) |
Market Value 7/31/22 (000) |
Dividend Income (000) |
|||||||||||||||||||||
| Government Money Market Portfolio |
$ | 117,127 | $ | 1,392,532 | $ | 1,361,284 | $ | – 0 | – | $ | – 0 | – | $ | 148,375 | $ | 356 | ||||||||||||
| Government Money Market Portfolio* |
131,341 | 1,134,181 | 1,182,253 | – 0 | – | – 0 | – | 83,269 | 123 | |||||||||||||||||||
| Lovesac Co. (The) |
42,297 | 19,638 | 5,459 | 2,099 | (30,100 | ) | 28,475 | – 0 | – | |||||||||||||||||||
|
|
|
|
|
|
|
|
|
|||||||||||||||||||||
| Total |
$ | 2,099 | $ | (30,100 | ) | $ | 260,119 | $ | 479 | |||||||||||||||||||
|
|
|
|
|
|
|
|
|
|||||||||||||||||||||
| * | Investments of cash collateral for securities lending transactions (see Note E). |
During the year ended July 31, 2022, the Adviser reimbursed the Fund $230,446 for trading losses incurred due to a trade entry error.
NOTE C
Distribution Services Agreement
The Fund has adopted a Distribution Services Agreement (the “Agreement”) pursuant to Rule 12b-1 under the Investment Company Act of 1940. Under the Agreement, the Fund pays distribution and servicing fees to the Distributor at an annual rate of up to .30% of the Fund’s average daily net assets attributable to Class A shares, 1% of the Fund’s average daily net assets attributable to Class C shares, .50% of the Fund’s average daily net assets attributable to Class R shares and .25% of the Fund’s average daily net assets attributable to Class K shares. There are no distribution and servicing fees on the Advisor Class, Class I and Class Z shares. The fees are accrued daily and paid monthly. Payments under the Agreement in respect of Class A shares are currently limited to an annual rate of .25% of Class A shares’ average daily net assets. The Agreement provides that the Distributor will use such payments in their entirety for distribution assistance and promotional activities. Since the commencement of the Fund’s operations, the Distributor has incurred expenses in excess of the distribution costs reimbursed by the Fund in the amounts of
| abfunds.com | AB SMALL CAP GROWTH PORTFOLIO | 27 | |
NOTES TO FINANCIAL STATEMENTS (continued)
$2,974,500, $917,329 and $1,167,376 for Class C, Class R and Class K shares, respectively. While such costs may be recovered from the Fund in future periods so long as the Agreement is in effect, the rate of the distribution and servicing fees payable under the Agreement may not be increased without a shareholder vote. In accordance with the Agreement, there is no provision for recovery of unreimbursed distribution costs incurred by the Distributor beyond the current fiscal year for Class A shares. The Agreement also provides that the Adviser may use its own resources to finance the distribution of the Fund’s shares.
NOTE D
Investment Transactions
Purchases and sales of investment securities (excluding short-term investments) for the year ended July 31, 2022 were as follows:
| Purchases | Sales | |||||||
| Investment securities (excluding U.S. government securities) |
$ | 3,582,131,180 | $ | 2,754,619,722 | ||||
| U.S. government securities |
– 0 | – | – 0 | – | ||||
The cost of investments for federal income tax purposes, gross unrealized appreciation and unrealized depreciation are as follows:
| Cost |
$ | 4,758,077,870 | ||
|
|
|
|||
| Gross unrealized appreciation |
$ | 489,546,469 | ||
| Gross unrealized depreciation |
(725,511,725 | ) | ||
|
|
|
|||
| Net unrealized depreciation |
$ | ( 235,965,256 | ) | |
|
|
|
1. Derivative Financial Instruments
The Fund may use derivatives in an effort to earn income and enhance returns, to replace more traditional direct investments, to obtain exposure to otherwise inaccessible markets (collectively, “investment purposes”), or to hedge or adjust the risk profile of its portfolio.
The Fund did not engage in derivatives transactions for the year ended July 31, 2022.
2. Currency Transactions
The Fund may invest in non-U.S. Dollar-denominated securities on a currency hedged or unhedged basis. The Fund may seek investment opportunities by taking long or short positions in currencies through the use of currency-related derivatives, including forward currency exchange contracts, futures and options on futures, swaps, and other options. The Fund may enter into transactions for investment opportunities when it anticipates that a foreign currency will appreciate or depreciate in value but securities denominated in that currency are not held by the Fund and do not present
| 28 | AB SMALL CAP GROWTH PORTFOLIO |
abfunds.com | |
NOTES TO FINANCIAL STATEMENTS (continued)
attractive investment opportunities. Such transactions may also be used when the Adviser believes that it may be more efficient than a direct investment in a foreign currency-denominated security. The Fund may also conduct currency exchange contracts on a spot basis (i.e., for cash at the spot rate prevailing in the currency exchange market for buying or selling currencies).
NOTE E
Securities Lending
The Fund may enter into securities lending transactions. Under the Fund’s securities lending program, all loans of securities will be collateralized continually by cash collateral and/or non-cash collateral. Non-cash collateral will include only securities issued or guaranteed by the U.S. government or its agencies or instrumentalities. The Fund cannot sell or repledge any non-cash collateral, such collateral will not be reflected in the portfolio of investments. If a loan is collateralized by cash, the Fund will be compensated for the loan from a portion of the net return from the income earned on cash collateral after a rebate is paid to the borrower (in some cases, this rebate may be a “negative rebate” or fee paid by the borrower to the Fund in connection with the loan), and payments are made for fees of the securities lending agent and for certain other administrative expenses. If the Fund receives non-cash collateral, the Fund will receive a fee from the borrower generally equal to a negotiated percentage of the market value of the loaned securities. The Fund will have the right to call a loan and obtain the securities loaned at any time on notice to the borrower within the normal and customary settlement time for the securities. While the securities are on loan, the borrower is obligated to pay the Fund amounts equal to any dividend income or other distributions from the securities; however, these distributions will not be afforded the same preferential tax treatment as qualified dividends. The Fund will not be able to exercise voting rights with respect to any securities during the existence of a loan, but will have the right to regain ownership of loaned securities in order to exercise voting or other ownership rights. Collateral received and securities loaned are marked to market daily to ensure that the securities loaned are secured by collateral. The lending agent currently invests the cash collateral received in Government Money Market Portfolio, an eligible money market vehicle, in accordance with the investment restrictions of the Fund, and as approved by the Board. The collateral received on securities loaned is recorded as an asset as well as a corresponding liability in the statement of assets and liabilities. The collateral will be adjusted the next business day to maintain the required collateral amount. The amounts of securities lending income from the borrowers and Government Money Market Portfolio are reflected in the statement of operations. When the Fund earns net securities lending income from Government Money Market Portfolio, the income is inclusive of a rebate expense paid to the borrower. In connection with the cash
| abfunds.com | AB SMALL CAP GROWTH PORTFOLIO | 29 | |
NOTES TO FINANCIAL STATEMENTS (continued)
collateral investment by the Fund in Government Money Market Portfolio, the Adviser has agreed to waive a portion of the Fund’s share of the advisory fees of Government Money Market Portfolio, as borne indirectly by the Fund as an acquired fund fee and expense. When the Fund lends securities, its investment performance will continue to reflect changes in the value of the securities loaned. A principal risk of lending portfolio securities is that the borrower may fail to return the loaned securities upon termination of the loan and that the collateral will not be sufficient to replace the loaned securities. The lending agent has agreed to indemnify the Fund in the case of default of any securities borrower.
A summary of the Fund’s transactions surrounding securities lending for the year ended July 31, 2022 is as follows:
| Government Money Market Portfolio |
||||||||||||||||||||||
| Market Value of Securities on Loan* |
Cash Collateral* |
Market Value of Non-Cash Collateral* |
Income from Borrowers |
Income Earned |
Advisory Fee Waived |
|||||||||||||||||
| $ | 324,154,407 | $ | 83,268,617 | $ | 249,933,203 | $ | 2,233,535 | $ | 123,397 | $ | 10,248 | |||||||||||
| * | As of July 31, 2022. |
NOTE F
Capital Stock
Each class consists of 3,000,000,000 authorized shares. Transactions in capital shares for each class were as follows:
| Shares | Amount | |||||||||||||||||||||||
| Year Ended July 31, 2022 |
Year Ended July 31, 2021 |
Year Ended July 31, 2022 |
Year Ended July 31, 2021 |
|||||||||||||||||||||
|
|
|
|||||||||||||||||||||||
| Class A |
|
|||||||||||||||||||||||
| Shares sold |
3,046,291 | 3,044,585 | $ | 198,973,175 | $ | 230,429,868 | ||||||||||||||||||
|
|
||||||||||||||||||||||||
| Shares issued in reinvestment of distributions |
1,035,561 | 1,082,499 | 79,023,658 | 76,954,511 | ||||||||||||||||||||
|
|
||||||||||||||||||||||||
| Shares converted from Class C |
30,665 | 140,050 | 2,081,934 | 10,625,960 | ||||||||||||||||||||
|
|
||||||||||||||||||||||||
| Shares redeemed |
(3,707,150 | ) | (4,878,125 | ) | (238,626,849 | ) | (358,717,142 | ) | ||||||||||||||||
|
|
||||||||||||||||||||||||
| Net increase (decrease) |
405,367 | (610,991 | ) | $ | 41,451,918 | $ | (40,706,803 | ) | ||||||||||||||||
|
|
||||||||||||||||||||||||
| 30 | AB SMALL CAP GROWTH PORTFOLIO |
abfunds.com | |
NOTES TO FINANCIAL STATEMENTS (continued)
| Shares | Amount | |||||||||||||||||||||||
| Year Ended July 31, 2022 |
Year Ended July 31, 2021 |
Year Ended July 31, 2022 |
Year Ended July 31, 2021 |
|||||||||||||||||||||
|
|
|
|||||||||||||||||||||||
| Class C |
|
|||||||||||||||||||||||
| Shares sold |
341,335 | 608,845 | $ | 10,848,241 | $ | 23,298,471 | ||||||||||||||||||
|
|
||||||||||||||||||||||||
| Shares issued in reinvestment of distributions |
252,944 | 218,739 | 8,655,749 | 7,730,232 | ||||||||||||||||||||
|
|
||||||||||||||||||||||||
| Shares converted to Class A |
(66,129 | ) | (281,306 | ) | (2,081,934 | ) | (10,625,960 | ) | ||||||||||||||||
|
|
||||||||||||||||||||||||
| Shares redeemed |
(427,499 | ) | (231,931 | ) | (11,785,771 | ) | (8,767,416 | ) | ||||||||||||||||
|
|
||||||||||||||||||||||||
| Net increase |
100,651 | 314,347 | $ | 5,636,285 | $ | 11,635,327 | ||||||||||||||||||
|
|
||||||||||||||||||||||||
| Advisor Class |
|
|||||||||||||||||||||||
| Shares sold |
19,808,226 | 14,137,354 | $ | 1,471,923,638 | $ | 1,213,475,458 | ||||||||||||||||||
|
|
||||||||||||||||||||||||
| Shares issued in reinvestment of distributions |
1,631,713 | 1,161,487 | 143,052,303 | 93,627,499 | ||||||||||||||||||||
|
|
||||||||||||||||||||||||
| Shares redeemed |
(14,289,328 | ) | (6,422,314 | ) | (970,195,982 | ) | (546,384,818 | ) | ||||||||||||||||
|
|
||||||||||||||||||||||||
| Net increase |
7,150,611 | 8,876,527 | $ | 644,779,959 | $ | 760,718,139 | ||||||||||||||||||
|
|
||||||||||||||||||||||||
| Class R |
|
|||||||||||||||||||||||
| Shares sold |
249,731 | 421,691 | $ | 15,109,636 | $ | 30,737,134 | ||||||||||||||||||
|
|
||||||||||||||||||||||||
| Shares issued in reinvestment of distributions |
62,191 | 54,260 | 4,446,031 | 3,647,367 | ||||||||||||||||||||
|
|
||||||||||||||||||||||||
| Shares redeemed |
(287,008 | ) | (261,487 | ) | (18,425,340 | ) | (18,478,914 | ) | ||||||||||||||||
|
|
||||||||||||||||||||||||
| Net increase |
24,914 | 214,464 | $ | 1,130,327 | $ | 15,905,587 | ||||||||||||||||||
|
|
||||||||||||||||||||||||
| Class K |
|
|||||||||||||||||||||||
| Shares sold |
1,563,633 | 1,008,540 | $ | 109,841,852 | $ | 77,481,737 | ||||||||||||||||||
|
|
||||||||||||||||||||||||
| Shares issued in reinvestment of distributions |
145,249 | 90,408 | 11,535,664 | 6,663,086 | ||||||||||||||||||||
|
|
||||||||||||||||||||||||
| Shares redeemed |
(608,162 | ) | (311,985 | ) | (40,616,336 | ) | (24,132,452 | ) | ||||||||||||||||
|
|
||||||||||||||||||||||||
| Net increase |
1,100,720 | 786,963 | $ | 80,761,180 | $ | 60,012,371 | ||||||||||||||||||
|
|
||||||||||||||||||||||||
| Class I |
|
|||||||||||||||||||||||
| Shares sold |
3,064,106 | 3,167,972 | $ | 223,855,754 | $ | 266,550,012 | ||||||||||||||||||
|
|
||||||||||||||||||||||||
| Shares issued in reinvestment of distributions |
702,468 | 806,783 | 61,185,005 | 64,639,450 | ||||||||||||||||||||
|
|
||||||||||||||||||||||||
| Shares redeemed |
(2,630,328 | ) | (3,670,140 | ) | (194,859,844 | ) | (305,091,267 | ) | ||||||||||||||||
|
|
||||||||||||||||||||||||
| Net increase |
1,136,246 | 304,615 | $ | 90,180,915 | $ | 26,098,195 | ||||||||||||||||||
|
|
||||||||||||||||||||||||
| Class Z |
|
|||||||||||||||||||||||
| Shares sold |
9,582,171 | 7,899,600 | $ | 709,015,766 | $ | 669,707,797 | ||||||||||||||||||
|
|
||||||||||||||||||||||||
| Shares issued in reinvestment of distributions |
1,042,278 | 813,978 | 91,532,838 | 65,655,418 | ||||||||||||||||||||
|
|
||||||||||||||||||||||||
| Shares redeemed |
(4,917,190 | ) | (3,151,673 | ) | (375,157,478 | ) | (268,554,834 | ) | ||||||||||||||||
|
|
||||||||||||||||||||||||
| Net increase |
5,707,259 | 5,561,905 | $ | 425,391,126 | $ | 466,808,381 | ||||||||||||||||||
|
|
||||||||||||||||||||||||
| abfunds.com | AB SMALL CAP GROWTH PORTFOLIO | 31 | |
NOTES TO FINANCIAL STATEMENTS (continued)
NOTE G
Risks Involved in Investing in the Fund
Market Risk—The value of the Fund’s assets will fluctuate as the stock or bond market fluctuates. The value of its investments may decline, sometimes rapidly and unpredictably, simply because of economic changes or other events, including public health crises (including the occurrence of a contagious disease or illness) and regional and global conflicts, that affect large portions of the market. It includes the risk that a particular style of investing, such as growth, may underperform the market generally.
Sector Risk—The Fund may have more risk because it may invest to a significant extent in one or more particular market sectors, such as the information technology or health care sector. To the extent it does so, market or economic factors affecting the relevant sector(s) could have a major effect on the value of the Fund’s investments.
Capitalization Risk—Investments in small- and mid-capitalization companies may be more volatile than investments in large-capitalization companies. Investments in small-capitalization companies may have additional risks because these companies have limited product lines, markets or financial resources.
Foreign (Non-U.S.) Risk—Investments in securities of non-U.S. issuers may involve more risk than those of U.S. issuers. These securities may fluctuate more widely in price and may be more difficult to trade due to adverse market, economic, political, regulatory or other factors.
LIBOR Transition and Associated Risk—A Fund may be exposed to debt securities, derivatives or other financial instruments that utilize the London Interbank Offered Rate, or “LIBOR,” as a “benchmark” or “reference rate” for various interest rate calculations. In 2017, the United Kingdom Financial Conduct Authority (“FCA”), which regulates LIBOR, announced a desire to phase out the use of LIBOR by the end of 2021. The FCA and LIBOR’s administrator, ICE Benchmark Administration, have since announced that most LIBOR settings (which reflect LIBOR rates quoted in different currencies over various time periods) will no longer be published after the end of 2021 but that the most widely used U.S. Dollar LIBOR settings will continue to be published until June 30, 2023. However, banks were strongly encouraged to cease entering into agreements with counterparties referencing LIBOR by the end of 2021. It is possible that a subset of LIBOR settings will be published after these dates on a “synthetic” basis, but any such publications would be considered non-representative of the underlying market. Since 2018 the Federal Reserve Bank of New York has published the secured overnight funding rate (referred to as SOFR), which is intended to replace U.S. Dollar LIBOR.
| 32 | AB SMALL CAP GROWTH PORTFOLIO |
abfunds.com | |
NOTES TO FINANCIAL STATEMENTS (continued)
SOFR is a broad measure of the cost of borrowing cash overnight collateralized by U.S. Treasury securities in the repurchase agreement (repo) market and has been used increasingly on a voluntary basis in new instruments and transactions. In addition, on March 15, 2022, the Adjustable Interest Rate Act was signed into law. This law provides a statutory fallback mechanism to replace LIBOR with a benchmark rate that is selected by the Federal Reserve Board and based on SOFR for certain contracts that reference LIBOR without adequate fallback provisions.
The elimination of LIBOR or changes to other reference rates or any other changes or reforms to the determination or supervision of reference rates could have an adverse impact on the market for, or value of, any securities or payments linked to those reference rates, which may adversely affect a Fund’s performance and/or net asset value. Uncertainty and risk also remain regarding the willingness and ability of issuers and lenders to include revised provisions in new and existing contracts or instruments. Consequently, the transition from LIBOR to other reference rates may lead to increased volatility and illiquidity in markets that are tied to LIBOR, fluctuations in values of LIBOR-related investments or investments in issuers that utilize LIBOR, increased difficulty in borrowing or refinancing and diminished effectiveness of hedging strategies, potentially adversely affecting a Fund’s performance. Furthermore, the risks associated with the expected discontinuation of LIBOR and transition may be exacerbated if the work necessary to effect an orderly transition to an alternative reference rate is not completed in a timely manner. Neither the effect of the LIBOR transition process nor its ultimate success can yet be known.
Indemnification Risk—In the ordinary course of business, the Fund enters into contracts that contain a variety of indemnifications. The Fund’s maximum exposure under these arrangements is unknown. However, the Fund has not had prior claims or losses pursuant to these indemnification provisions and expects the risk of loss thereunder to be remote. Therefore, the Fund has not accrued any liability in connection with these indemnification provisions.
Management Risk—The Fund is subject to management risk because it is an actively-managed investment fund. The Adviser will apply its investment techniques and risk analyses in making investment decisions for the Fund, but there is no guarantee that its techniques will produce the intended results. Some of these techniques may incorporate, or rely upon, quantitative models, but there is no guarantee that these models will generate accurate forecasts, reduce risk or otherwise perform as expected.
| abfunds.com | AB SMALL CAP GROWTH PORTFOLIO | 33 | |
NOTES TO FINANCIAL STATEMENTS (continued)
NOTE H
Joint Credit Facility
A number of open-end mutual funds managed by the Adviser, including the Fund, participate in a $325 million revolving credit facility (the “Facility”) intended to provide short-term financing related to redemptions and other short term liquidity requirements, subject to certain restrictions. Commitment fees related to the Facility are paid by the participating funds and are included in miscellaneous expenses in the statement of operations. The Fund did not utilize the Facility during the year ended July 31, 2022.
NOTE I
Distributions to Shareholders
The tax character of distributions paid during the fiscal years ended July 31, 2022 and July 31, 2021 were as follows:
| 2022 | 2021 | |||||||
| Distributions paid from: |
||||||||
| Ordinary income |
$ | 113,889,911 | $ | 29,025,651 | ||||
| Net long-term capital gains |
341,530,857 | 338,831,583 | ||||||
|
|
|
|
|
|||||
| Total taxable distributions paid |
$ | 455,420,768 | $ | 367,857,234 | ||||
|
|
|
|
|
|||||
As of July 31, 2022, the components of accumulated earnings/(deficit) on a tax basis were as follows:
| Accumulated capital losses |
$ | (248,748,950 | )(a) | |
| Other losses |
(27,347,671 | )(b) | ||
| Unrealized appreciation/(depreciation) |
(235,965,256 | )(c) | ||
|
|
|
|||
| Total accumulated earnings/(deficit |
$ | (512,061,877 | ) | |
|
|
|
| (a) | As of July 31, 2022, the Fund had a net capital loss carryforward of $248,748,950. |
| (b) | As of July 31, 2022, the Fund had a qualified late-year ordinary loss deferral of $27,347,671. |
| (c) | The differences between book-basis and tax-basis unrealized appreciation/(depreciation) are attributable primarily to the tax treatment of passive foreign investment companies (PFICs) and the tax deferral of losses on wash sales. |
For tax purposes, net realized capital losses may be carried over to offset future capital gains, if any. Funds are permitted to carry forward capital losses for an indefinite period, and such losses will retain their character as either short-term or long-term capital losses. As of July 31, 2022, the Fund had a net short-term capital loss carryforward of $248,748,950, which may be carried forward for an indefinite period.
During the current fiscal year, permanent differences primarily due to the utilization of earnings and profits distributed to shareholders on redemption of shares, the tax treatment of distributions from Real Estate Investments Trusts, the tax treatment of gains from redemptions-in-kind, the disallowance of a net operating loss, and contributions from Affiliates resulted
| 34 | AB SMALL CAP GROWTH PORTFOLIO |
abfunds.com | |
NOTES TO FINANCIAL STATEMENTS (continued)
in a net increase in accumulated loss and a net increase in additional paid-in capital. These reclassifications had no effect on net assets.
NOTE J
Recent Accounting Pronouncements
In March 2020, the Financial Accounting Standards Board issued an Accounting Standards Update, ASU 2020-04, “Reference Rate Reform (Topic 848) – Facilitation of the Effects of Reference Rate Reform on Financial Reporting.” ASU 2020-04 provides optional guidance to ease the potential accounting burden due to the discontinuation of the LIBOR and other interbank-offered based reference rates. ASU 2020-04 is effective as of March 12, 2020 through December 31, 2022. Management is currently evaluating the impact, if any, of applying ASU 2020-04.
NOTE K
Subsequent Events
Management has evaluated subsequent events for possible recognition or disclosure in the financial statements through the date the financial statements are issued. Management has determined that there are no material events that would require disclosure in the Fund’s financial statements through this date.
| abfunds.com | AB SMALL CAP GROWTH PORTFOLIO | 35 | |
FINANCIAL HIGHLIGHTS
Selected Data For A Share Of Capital Stock Outstanding Throughout Each Period
| Class A | ||||||||||||||||||||
| Year Ended July 31, | ||||||||||||||||||||
| 2022 | 2021 | 2020 | 2019 | 2018 | ||||||||||||||||
|
|
|
|||||||||||||||||||
| Net asset value, beginning of period |
$ 79.55 | $ 62.17 | $ 57.21 | $ 60.30 | $ 49.25 | |||||||||||||||
|
|
|
|||||||||||||||||||
| Income From Investment Operations |
||||||||||||||||||||
| Net investment loss(a)(b) |
(.51 | ) | (.62 | ) | (.37 | ) | (.36 | ) | (.44 | ) | ||||||||||
| Net realized and unrealized gain (loss) on investment transactions |
(21.59 | ) | 25.33 | 10.19 | 5.75 | 16.28 | ||||||||||||||
| Contributions from Affiliates |
.00 | (c) | – 0 | – | – 0 | – | .00 | (c) | – 0 | – | ||||||||||
|
|
|
|||||||||||||||||||
| Net increase (decrease) in net asset value from operations |
(22.10 | ) | 24.71 | 9.82 | 5.39 | 15.84 | ||||||||||||||
|
|
|
|||||||||||||||||||
| Less: Distributions |
||||||||||||||||||||
| Distributions from net realized gain on investment transactions |
(6.77 | ) | (7.33 | ) | (4.86 | ) | (8.48 | ) | (4.79 | ) | ||||||||||
|
|
|
|||||||||||||||||||
| Net asset value, end of period |
$ 50.68 | $ 79.55 | $ 62.17 | $ 57.21 | $ 60.30 | |||||||||||||||
|
|
|
|||||||||||||||||||
| Total Return |
||||||||||||||||||||
| Total investment return based on net asset value(d)* |
(30.61 | )% | 41.15 | %+ | 18.86 | %+ | 12.63 | % | 33.99 | % | ||||||||||
| Ratios/Supplemental Data |
||||||||||||||||||||
| Net assets, end of period (000’s omitted) |
$715,329 | $1,090,466 | $890,196 | $621,553 | $583,619 | |||||||||||||||
| Ratio to average net assets of: |
||||||||||||||||||||
| Expenses, net of waivers/reimbursements(e)‡ |
1.11 | % | 1.09 | % | 1.16 | % | 1.15 | % | 1.13 | % | ||||||||||
| Expenses, before waivers/reimbursements(e)‡ |
1.11 | % | 1.09 | % | 1.16 | % | 1.16 | % | 1.14 | % | ||||||||||
| Net investment loss(b) |
(.78 | )% | (.83 | )% | (.70 | )% | (.65 | )% | (.80 | )% | ||||||||||
| Portfolio turnover rate |
54 | % | 74 | % | 75 | % | 70 | % | 65 | % | ||||||||||
|
‡ Expense ratios exclude the estimated acquired fund fees of the affiliated/unaffiliated underlying |
| |||||||||||||||||||
| portfolios |
.00 | % | .00 | % | .01 | % | .01 | % | .01 | % | ||||||||||
See footnote summary on page 43.
| 36 | AB SMALL CAP GROWTH PORTFOLIO |
abfunds.com | |
FINANCIAL HIGHLIGHTS (continued)
Selected Data For A Share Of Capital Stock Outstanding Throughout Each Period
| Class C | ||||||||||||||||||||
| Year Ended July 31, | ||||||||||||||||||||
| 2022 | 2021 | 2020 | 2019 | 2018 | ||||||||||||||||
|
|
|
|||||||||||||||||||
| Net asset value, beginning of period |
$ 39.36 | $ 33.92 | $ 33.67 | $ 39.66 | $ 34.08 | |||||||||||||||
|
|
|
|||||||||||||||||||
| Income From Investment Operations |
||||||||||||||||||||
| Net investment loss(a)(b) |
(.47 | ) | (.61 | ) | (.43 | ) | (.47 | ) | (.57 | ) | ||||||||||
| Net realized and unrealized gain (loss) on investment transactions |
(9.50 | ) | 13.38 | 5.54 | 2.96 | 10.94 | ||||||||||||||
| Contributions from Affiliates |
.00 | (c) | – 0 | – | – 0 | – | .00 | (c) | – 0 | – | ||||||||||
|
|
|
|||||||||||||||||||
| Net increase (decrease) in net asset value from operations |
(9.97 | ) | 12.77 | 5.11 | 2.49 | 10.37 | ||||||||||||||
|
|
|
|||||||||||||||||||
| Less: Distributions |
||||||||||||||||||||
| Distributions from net realized gain on investment transactions |
(6.77 | ) | (7.33 | ) | (4.86 | ) | (8.48 | ) | (4.79 | ) | ||||||||||
|
|
|
|||||||||||||||||||
| Net asset value, end of period |
$ 22.62 | $ 39.36 | $ 33.92 | $ 33.67 | $ 39.66 | |||||||||||||||
|
|
|
|||||||||||||||||||
| Total Return |
||||||||||||||||||||
| Total investment return based on net asset value(d)* |
(31.12 | )% | 40.11 | %+ | 17.99 | %+ | 11.79 | % | 32.99 | % | ||||||||||
| Ratios/Supplemental Data |
||||||||||||||||||||
| Net assets, end of period (000’s omitted) |
$33,191 | $53,790 | $35,697 | $35,256 | $31,424 | |||||||||||||||
| Ratio to average net assets of: |
||||||||||||||||||||
| Expenses, net of waivers/reimbursements(e)‡ |
1.86 | % | 1.84 | % | 1.90 | % | 1.91 | % | 1.88 | % | ||||||||||
| Expenses, before waivers/reimbursements(e)‡ |
1.86 | % | 1.84 | % | 1.91 | % | 1.91 | % | 1.89 | % | ||||||||||
| Net investment loss(b) |
(1.53 | )% | (1.59 | )% | (1.44 | )% | (1.40 | )% | (1.55 | )% | ||||||||||
| Portfolio turnover rate |
54 | % | 74 | % | 75 | % | 70 | % | 65 | % | ||||||||||
|
‡ Expense ratios exclude the estimated acquired fund fees of the affiliated/unaffiliated underlying |
| |||||||||||||||||||
| portfolios |
.00 | % | .00 | % | .01 | % | .01 | % | .01 | % | ||||||||||
See footnote summary on page 43.
| abfunds.com | AB SMALL CAP GROWTH PORTFOLIO | 37 | |
FINANCIAL HIGHLIGHTS (continued)
Selected Data For A Share Of Capital Stock Outstanding Throughout Each Period
| Advisor Class | ||||||||||||||||||||
| Year Ended July 31, | ||||||||||||||||||||
| 2022 | 2021 | 2020 | 2019 | 2018 | ||||||||||||||||
|
|
|
|||||||||||||||||||
| Net asset value, beginning of period |
$ 90.34 | $ 69.65 | $ 63.35 | $ 65.62 | $ 53.10 | |||||||||||||||
|
|
|
|||||||||||||||||||
| Income From Investment Operations |
||||||||||||||||||||
| Net investment loss(a)(b) |
(.39 | ) | (.51 | ) | (.27 | ) | (.24 | ) | (.33 | ) | ||||||||||
| Net realized and unrealized gain (loss) on investment transactions |
(24.86 | ) | 28.53 | 11.43 | 6.46 | 17.64 | ||||||||||||||
| Contributions from Affiliates |
.00 | (c) | – 0 | – | – 0 | – | .00 | (c) | – 0 | – | ||||||||||
|
|
|
|||||||||||||||||||
| Net increase (decrease) in net asset value from operations |
(25.25 | ) | 28.02 | 11.16 | 6.22 | 17.31 | ||||||||||||||
|
|
|
|||||||||||||||||||
| Less: Dividends and Distributions |
||||||||||||||||||||
| Dividends from net investment income |
– 0 | – | – 0 | – | – 0 | – | (.01 | ) | – 0 | – | ||||||||||
| Distributions from net realized gain on investment transactions |
(6.77 | ) | (7.33 | ) | (4.86 | ) | (8.48 | ) | (4.79 | ) | ||||||||||
|
|
|
|||||||||||||||||||
| Total dividends and distributions |
(6.77 | ) | (7.33 | ) | (4.86 | ) | (8.49 | ) | (4.79 | ) | ||||||||||
|
|
|
|||||||||||||||||||
| Net asset value, end of period |
$ 58.32 | $ 90.34 | $ 69.65 | $ 63.35 | $ 65.62 | |||||||||||||||
|
|
|
|||||||||||||||||||
| Total Return |
||||||||||||||||||||
| Total investment return based on net asset value(d)* |
(30.43 | )% | 41.51 | %+ | 19.16 | %+ | 12.93 | % | 34.30 | % | ||||||||||
| Ratios/Supplemental Data |
||||||||||||||||||||
| Net assets, end of period (000’s omitted) |
$1,814,970 | $2,165,454 | $1,051,243 | $611,919 | $414,913 | |||||||||||||||
| Ratio to average net assets of: |
||||||||||||||||||||
| Expenses, net of waivers/reimbursements(e)‡ |
.86 | % | .84 | % | .91 | % | .91 | % | .88 | % | ||||||||||
| Expenses, before waivers/reimbursements(e)‡ |
.87 | % | .84 | % | .91 | % | .91 | % | .89 | % | ||||||||||
| Net investment loss(b) |
(.53 | )% | (.60 | )% | (.46 | )% | (.41 | )% | (.55 | )% | ||||||||||
| Portfolio turnover rate |
54 | % | 74 | % | 75 | % | 70 | % | 65 | % | ||||||||||
|
‡ Expense ratios exclude the estimated acquired fund fees of the affiliated/unaffiliated underlying |
| |||||||||||||||||||
| portfolios |
.00 | % | .00 | % | .01 | % | .01 | % | .01 | % | ||||||||||
See footnote summary on page 43.
| 38 | AB SMALL CAP GROWTH PORTFOLIO |
abfunds.com | |
FINANCIAL HIGHLIGHTS (continued)
Selected Data For A Share Of Capital Stock Outstanding Throughout Each Period
| Class R | ||||||||||||||||||||
| Year Ended July 31, | ||||||||||||||||||||
| 2022 | 2021 | 2020 | 2019 | 2018 | ||||||||||||||||
|
|
|
|||||||||||||||||||
| Net asset value, beginning of period |
$ 75.03 | $ 59.19 | $ 54.90 | $ 58.45 | $ 48.05 | |||||||||||||||
|
|
|
|||||||||||||||||||
| Income From Investment Operations |
||||||||||||||||||||
| Net investment loss(a)(b) |
(.69 | ) | (.88 | ) | (.54 | ) | (.54 | ) | (.64 | ) | ||||||||||
| Net realized and unrealized gain (loss) on investment transactions |
(20.19 | ) | 24.05 | 9.69 | 5.47 | 15.83 | ||||||||||||||
| Contributions from Affiliates |
.00 | (c) | – 0 | – | – 0 | – | .00 | (c) | – 0 | – | ||||||||||
|
|
|
|||||||||||||||||||
| Net increase (decrease) in net asset value from operations |
(20.88 | ) | 23.17 | 9.15 | 4.93 | 15.19 | ||||||||||||||
|
|
|
|||||||||||||||||||
| Less: Distributions |
||||||||||||||||||||
| Distributions from net realized gain on investment transactions |
(6.77 | ) | (7.33 | ) | (4.86 | ) | (8.48 | ) | (4.79 | ) | ||||||||||
|
|
|
|||||||||||||||||||
| Net asset value, end of period |
$ 47.38 | $ 75.03 | $ 59.19 | $ 54.90 | $ 58.45 | |||||||||||||||
|
|
|
|||||||||||||||||||
| Total Return |
||||||||||||||||||||
| Total investment return based on net asset value(d)* |
(30.84 | )% | 40.59 | %+ | 18.42 | %+ | 12.20 | % | 33.45 | % | ||||||||||
| Ratios/Supplemental Data |
||||||||||||||||||||
| Net assets, end of period (000’s omitted) |
$34,853 | $53,326 | $29,374 | $30,459 | $33,088 | |||||||||||||||
| Ratio to average net assets of: |
||||||||||||||||||||
| Expenses, net of waivers/reimbursements(e)‡ |
1.46 | % | 1.49 | % | 1.54 | % | 1.53 | % | 1.53 | % | ||||||||||
| Expenses, before waivers/reimbursements(e)‡ |
1.46 | % | 1.49 | % | 1.54 | % | 1.54 | % | 1.55 | % | ||||||||||
| Net investment loss(b) |
(1.13 | )% | (1.24 | )% | (1.07 | )% | (1.03 | )% | (1.20 | )% | ||||||||||
| Portfolio turnover rate |
54 | % | 74 | % | 75 | % | 70 | % | 65 | % | ||||||||||
|
‡ Expense ratios exclude the estimated acquired fund fees of the affiliated/unaffiliated underlying |
| |||||||||||||||||||
| portfolios |
.00 | % | .00 | % | .01 | % | .01 | % | .01 | % | ||||||||||
See footnote summary on page 43.
| abfunds.com | AB SMALL CAP GROWTH PORTFOLIO | 39 | |
FINANCIAL HIGHLIGHTS (continued)
Selected Data For A Share Of Capital Stock Outstanding Throughout Each Period
| Class K | ||||||||||||||||||||
| Year Ended July 31, | ||||||||||||||||||||
| 2022 | 2021 | 2020 | 2019 | 2018 | ||||||||||||||||
|
|
|
|||||||||||||||||||
| Net asset value, beginning of period |
$ 82.50 | $ 64.23 | $ 58.90 | $ 61.77 | $ 50.33 | |||||||||||||||
|
|
|
|||||||||||||||||||
| Income From Investment Operations |
||||||||||||||||||||
| Net investment loss(a)(b) |
(.45 | ) | (.62 | ) | (.34 | ) | (.33 | ) | (.42 | ) | ||||||||||
| Net realized and unrealized gain (loss) on investment transactions |
(22.50 | ) | 26.22 | 10.53 | 5.94 | 16.65 | ||||||||||||||
| Contributions from Affiliates |
.00 | (c) | – 0 | – | – 0 | – | .00 | (c) | – 0 | – | ||||||||||
|
|
|
|||||||||||||||||||
| Net increase (decrease) in net asset value from operations |
(22.95 | ) | 25.60 | 10.19 | 5.61 | 16.23 | ||||||||||||||
|
|
|
|||||||||||||||||||
| Less: Distributions |
||||||||||||||||||||
| Distributions from net realized gain on investment transactions |
(6.77 | ) | (7.33 | ) | (4.86 | ) | (8.48 | ) | (4.79 | ) | ||||||||||
|
|
|
|||||||||||||||||||
| Net asset value, end of period |
$ 52.78 | $ 82.50 | $ 64.23 | $ 58.90 | $ 61.77 | |||||||||||||||
|
|
|
|||||||||||||||||||
| Total Return |
||||||||||||||||||||
| Total investment return based on net asset value(d)* |
(30.54 | )% | 41.22 | %+ | 18.96 | %+ | 12.71 | % | 34.04 | % | ||||||||||
| Ratios/Supplemental Data |
||||||||||||||||||||
| Net assets, end of period (000’s omitted) |
$135,550 | $121,057 | $43,699 | $43,284 | $42,228 | |||||||||||||||
| Ratio to average net assets of: |
||||||||||||||||||||
| Expenses, net of waivers/reimbursements(e)‡ |
1.03 | % | 1.03 | % | 1.08 | % | 1.09 | % | 1.09 | % | ||||||||||
| Expenses, before waivers/reimbursements(e)‡ |
1.03 | % | 1.03 | % | 1.09 | % | 1.09 | % | 1.11 | % | ||||||||||
| Net investment loss(b) |
(.68 | )% | (.80 | )% | (.62 | )% | (.59 | )% | (.76 | )% | ||||||||||
| Portfolio turnover rate |
54 | % | 74 | % | 75 | % | 70 | % | 65 | % | ||||||||||
|
‡ Expense ratios exclude the estimated acquired fund fees of the affiliated/unaffiliated underlying |
| |||||||||||||||||||
| portfolios |
.00 | % | .00 | % | .01 | % | .01 | % | .01 | % | ||||||||||
See footnote summary on page 43.
| 40 | AB SMALL CAP GROWTH PORTFOLIO |
abfunds.com | |
FINANCIAL HIGHLIGHTS (continued)
Selected Data For A Share Of Capital Stock Outstanding Throughout Each Period
| Class I | ||||||||||||||||||||
| Year Ended July 31, | ||||||||||||||||||||
| 2022 | 2021 | 2020 | 2019 | 2018 | ||||||||||||||||
|
|
|
|||||||||||||||||||
| Net asset value, beginning of period |
$ 89.79 | $ 69.27 | $ 63.03 | $ 65.33 | $ 52.89 | |||||||||||||||
|
|
|
|||||||||||||||||||
| Income From Investment Operations |
||||||||||||||||||||
| Net investment loss(a)(b) |
(.37 | ) | (.49 | ) | (.26 | ) | (.24 | ) | (.34 | ) | ||||||||||
| Net realized and unrealized gain (loss) on investment transactions |
(24.69 | ) | 28.34 | 11.36 | 6.43 | 17.57 | ||||||||||||||
| Contributions from Affiliates |
.00 | (c) | – 0 | – | – 0 | – | .00 | (c) | – 0 | – | ||||||||||
|
|
|
|||||||||||||||||||
| Net increase (decrease) in net asset value from operations |
(25.06 | ) | 27.85 | 11.10 | 6.19 | 17.23 | ||||||||||||||
|
|
|
|||||||||||||||||||
| Less: Dividends and Distributions |
||||||||||||||||||||
| Dividends from net investment income |
– 0 | – | – 0 | – | – 0 | – | (.01 | ) | – 0 | – | ||||||||||
| Distributions from net realized gain on investment transactions |
(6.77 | ) | (7.33 | ) | (4.86 | ) | (8.48 | ) | (4.79 | ) | ||||||||||
|
|
|
|||||||||||||||||||
| Total dividends and distributions |
(6.77 | ) | (7.33 | ) | (4.86 | ) | (8.49 | ) | (4.79 | ) | ||||||||||
|
|
|
|||||||||||||||||||
| Net asset value, end of period |
$ 57.96 | $ 89.79 | $ 69.27 | $ 63.03 | $ 65.33 | |||||||||||||||
|
|
|
|||||||||||||||||||
| Total Return |
||||||||||||||||||||
| Total investment return based on net asset value(d)* |
(30.40 | )% | 41.48 | %+ | 19.17 | %+ | 12.93 | % | 34.29 | % | ||||||||||
| Ratios/Supplemental Data |
||||||||||||||||||||
| Net assets, end of period (000’s omitted) |
$597,941 | $824,332 | $614,788 | $494,931 | $448,949 | |||||||||||||||
| Ratio to average net assets of: |
||||||||||||||||||||
| Expenses, net of waivers/reimbursements(e)‡ |
.84 | % | .84 | % | .90 | % | .90 | % | .89 | % | ||||||||||
| Expenses, before waivers/reimbursements(e)‡ |
.84 | % | .84 | % | .90 | % | .90 | % | .91 | % | ||||||||||
| Net investment loss(b) |
(.50 | )% | (.59 | )% | (.44 | )% | (.40 | )% | (.57 | )% | ||||||||||
| Portfolio turnover rate |
54 | % | 74 | % | 75 | % | 70 | % | 65 | % | ||||||||||
|
‡ Expense ratios exclude the estimated acquired fund fees of the affiliated/unaffiliated underlying |
| |||||||||||||||||||
| portfolios |
.00 | % | .00 | % | .01 | % | .01 | % | .01 | % | ||||||||||
See footnote summary on page 43.
| abfunds.com | AB SMALL CAP GROWTH PORTFOLIO | 41 | |
FINANCIAL HIGHLIGHTS (continued)
Selected Data For A Share Of Capital Stock Outstanding Throughout Each Period
| Class Z | ||||||||||||||||||||
| Year Ended July 31, | ||||||||||||||||||||
| 2022 | 2021 | 2020 | 2019 | 2018 | ||||||||||||||||
|
|
|
|||||||||||||||||||
| Net asset value, beginning of period |
$ 90.46 | $ 69.68 | $ 63.31 | $ 65.54 | $ 53.00 | |||||||||||||||
|
|
|
|||||||||||||||||||
| Income From Investment Operations |
||||||||||||||||||||
| Net investment loss(a)(b) |
(.30 | ) | (.43 | ) | (.21 | ) | (.19 | ) | (.28 | ) | ||||||||||
| Net realized and unrealized gain (loss) on investment transactions |
(24.92 | ) | 28.54 | 11.44 | 6.46 | 17.61 | ||||||||||||||
| Contributions from Affiliates |
.00 | (c) | – 0 | – | – 0 | – | .00 | (c) | – 0 | – | ||||||||||
|
|
|
|||||||||||||||||||
| Net increase (decrease) in net asset value from operations |
(25.22 | ) | 28.11 | 11.23 | 6.27 | 17.33 | ||||||||||||||
|
|
|
|||||||||||||||||||
| Less: Dividends and Distributions |
||||||||||||||||||||
| Dividends from net investment income |
– 0 | – | – 0 | – | – 0 | – | (.02 | ) | – 0 | – | ||||||||||
| Distributions from net realized gain on investment transactions |
(6.77 | ) | (7.33 | ) | (4.86 | ) | (8.48 | ) | (4.79 | ) | ||||||||||
|
|
|
|||||||||||||||||||
| Total dividends and distributions |
(6.77 | ) | (7.33 | ) | (4.86 | ) | (8.50 | ) | (4.79 | ) | ||||||||||
|
|
|
|||||||||||||||||||
| Net asset value, end of period |
$ 58.47 | $ 90.46 | $ 69.68 | $ 63.31 | $ 65.54 | |||||||||||||||
|
|
|
|||||||||||||||||||
| Total Return |
||||||||||||||||||||
| Total investment return based on net asset value(d) |
(30.34 | )% | 41.62 | %+ | 19.29 | %+ | 13.03 | % | 34.42 | % | ||||||||||
| Ratios/Supplemental Data |
||||||||||||||||||||
| Net assets, end of period (000’s omitted) |
$1,056,456 | $1,118,142 | $473,742 | $299,807 | $153,533 | |||||||||||||||
| Ratio to average net assets of: |
||||||||||||||||||||
| Expenses, net of waivers/reimbursements(e)‡ |
.76 | % | .75 | % | .81 | % | .81 | % | .80 | % | ||||||||||
| Expenses, before waivers/reimbursements(e)‡ |
.76 | % | .75 | % | .81 | % | .82 | % | .81 | % | ||||||||||
| Net investment loss(b) |
(.41 | )% | (.51 | )% | (.36 | )% | (.32 | )% | (.48 | )% | ||||||||||
| Portfolio turnover rate |
54 | % | 74 | % | 75 | % | 70 | % | 65 | % | ||||||||||
|
‡ Expense ratios exclude the estimated acquired fund fees of the affiliated/unaffiliated underlying |
| |||||||||||||||||||
| portfolios |
.00 | % | .00 | % | .01 | % | .01 | % | .01 | % | ||||||||||
See footnote summary on page 43.
| 42 | AB SMALL CAP GROWTH PORTFOLIO |
abfunds.com | |
FINANCIAL HIGHLIGHTS (continued)
Selected Data For A Share Of Capital Stock Outstanding Throughout Each Period
| (a) | Based on average shares outstanding. |
| (b) | Net of expenses waived/reimbursed by the Adviser. |
| (c) | Amount is less than $.005. |
| (d) | Total investment return is calculated assuming an initial investment made at the net asset value at the beginning of the period, reinvestment of all dividends and distributions at net asset value during the period, and redemption on the last day of the period. Initial sales charges or contingent deferred sales charges are not reflected in the calculation of total investment return. Total return does not reflect the deduction of taxes that a shareholder would pay on fund distributions or the redemption of fund shares. Total investment return calculated for a period of less than one year is not annualized. |
| (e) | In connection with the Fund’s investments in affiliated underlying portfolios, the Fund incurs no direct expenses, but bears proportionate shares of the fees and expenses (i.e., operating, administrative and investment advisory fees) of the affiliated underlying portfolios. The Adviser has contractually agreed to waive its fees from the Fund in an amount equal to the Fund’s pro rata share of certain acquired fund fees and expenses, and for the year ended July 31, 2018, such waiver amounted to .01%. |
| * | Includes the impact of proceeds received and credited to the Fund resulting from class action settlements, which enhanced the Fund’s performance for the years ended July 31, 2019 and July 31, 2018 by .01%, and .03% , respectively. |
| + | The net asset value and total return include adjustments in accordance with accounting principles generally accepted in the United States of America for financial reporting purposes. As such, the net asset value and total return for shareholder transactions may differ from financial statements. |
See notes to financial statements.
| abfunds.com | AB SMALL CAP GROWTH PORTFOLIO | 43 | |
REPORT OF INDEPENDENT REGISTERED
PUBLIC ACCOUNTING FIRM
To the Shareholders and the Board of Directors of
AB Small Cap Growth Portfolio
Opinion on the Financial Statements
We have audited the accompanying statement of assets and liabilities of AB Small Cap Growth Portfolio (the “Fund”), (one of the series constituting AB Cap Fund, Inc. (the “Company”)), including the portfolio of investments, as of July 31, 2022, and the related statement of operations for the year then ended, the statements of changes in net assets for each of the two years in the period then ended, the financial highlights for each of the five years in the period then ended and the related notes (collectively referred to as the “financial statements”). In our opinion, the financial statements present fairly, in all material respects, the financial position of the Fund (one of the series constituting AB Cap Fund, Inc.) at July 31, 2022, the results of its operations for the year then ended, the changes in its net assets for each of the two years in the period then ended and its financial highlights for each of the five years in the period then ended, in conformity with U.S. generally accepted accounting principles.
Basis for Opinion
These financial statements are the responsibility of the Company’s management. Our responsibility is to express an opinion on the Fund’s financial statements based on our audits. We are a public accounting firm registered with the Public Company Accounting Oversight Board (United States) (“PCAOB”) and are required to be independent with respect to the Company in accordance with the U.S. federal securities laws and the applicable rules and regulations of the Securities and Exchange Commission and the PCAOB.
We conducted our audits in accordance with the standards of the PCAOB. Those standards require that we plan and perform the audit to obtain reasonable assurance about whether the financial statements are free of material misstatement, whether due to error or fraud. The Company is not required to have, nor were we engaged to perform, an audit of the Company’s internal control over financial reporting. As part of our audits, we are required to obtain an understanding of internal control over financial reporting but not for the purpose of expressing an opinion on the effectiveness of the Company’s internal control over financial reporting. Accordingly, we express no such opinion.
Our audits included performing procedures to assess the risks of material misstatement of the financial statements, whether due to error or fraud, and performing procedures that respond to those risks. Such procedures included examining, on a test basis, evidence regarding the amounts and
| 44 | AB SMALL CAP GROWTH PORTFOLIO |
abfunds.com | |
REPORT OF INDEPENDENT REGISTERED
PUBLIC ACCOUNTING FIRM (continued)
disclosures in the financial statements. Our procedures included confirmation of securities owned as of July 31, 2022, by correspondence with the custodian and others or by other appropriate auditing procedures where replies from others were not received. Our audits also included evaluating the accounting principles used and significant estimates made by management, as well as evaluating the overall presentation of the financial statements. We believe that our audits provide a reasonable basis for our opinion.

We have served as the auditor of one or more of the AB investment companies since 1968.
New York, New York
September 26, 2022.
| abfunds.com | AB SMALL CAP GROWTH PORTFOLIO | 45 | |
2022 FEDERAL TAX INFORMATION
(unaudited)
For Federal income tax purposes, the following information is furnished with respect to the distributions paid by the Fund during the taxable year ended July 31, 2022. For corporate shareholders, 5.58% of dividends paid qualify for the dividends received deduction. For individual shareholders, the Fund designates 5.57% of dividends paid as qualified dividend income. The Fund designates $341,530,857 of dividends paid as long-term capital gain dividends.
Shareholders should not use the above information to prepare their income tax returns. The information necessary to complete your income tax returns will be included with your Form 1099-DIV which will be sent to you separately in January 2023.
| 46 | AB SMALL CAP GROWTH PORTFOLIO |
abfunds.com | |
BOARD OF DIRECTORS
| Marshall C. Turner, Jr.(1), Chairman Jorge A. Bermudez(1) Michael J. Downey(1) Onur Erzan, President and Chief Executive Officer |
Nancy P. Jacklin(1) Jeanette W. Loeb(1) Carol C. McMullen(1) Garry L. Moody(1) |
OFFICERS
| Bruce K. Aronow(2)*, Senior Vice President Esteban Gomez(2), Vice President Samantha S. Lau(2), Vice President Heather Pavlak(2), Vice President Wen-Tse Tseng(2), Vice President Emilie D. Wrapp, Secretary |
Michael B. Reyes, Senior Vice President Joseph J. Mantineo, Treasurer and Chief Financial Officer Phyllis J. Clarke, Controller Vincent S. Noto, Chief Compliance Officer |
| Custodian and Accounting Agent | Transfer Agent | |
| State Street Bank and Trust Company State Street Corporation CCB/5 1 Iron Street Boston, MA 02210
Principal Underwriter AllianceBernstein Investments, Inc. 501 Commerce Street Nashville, TN 37203
Legal Counsel Seward & Kissel LLP One Battery Park Plaza New York, NY 10004 |
AllianceBernstein Investor P.O. Box 786003 San Antonio, TX 78278 Toll-Free (800) 221-5672
Independent Registered Public Accounting Firm Ernst & Young LLP One Manhattan West New York, NY 10001 |
| 1 | Member of the Audit Committee, the Governance and Nominating Committee and the Independent Directors Committee. |
| 2 | The day-to-day management of, and investment decisions for, the Fund’s portfolio are made by the Adviser’s Small Cap Growth Investment Team. Messrs. Aronow, Gomez and Tseng and Mses. Lau and Pavlak are the investment professionals with the most significant responsibility for the day-to-day management of the Fund’s portfolio. |
| * | Mr. Aronow is expected to retire from the Adviser effective December 31, 2023. |
| abfunds.com | AB SMALL CAP GROWTH PORTFOLIO | 47 | |
MANAGEMENT OF THE FUND
Board of Directors Information
The business and affairs of the Fund are managed under the direction of the Board of Directors. Certain information concerning the Fund’s Directors is set forth below.
| NAME, ADDRESS* AND AGE, (YEAR FIRST ELECTED**) |
PRINCIPAL DURING PAST FIVE YEARS |
PORTFOLIOS IN AB FUND COMPLEX OVERSEEN BY DIRECTOR |
OTHER PUBLIC COMPANY DIRECTORSHIPS CURRENTLY HELD BY DIRECTOR | |||||
| INTERESTED DIRECTOR | ||||||||
| Onur Erzan,# 1345 Avenue of the Americas, New York, NY 10105 46 (2021) |
Senior Vice President of AllianceBernstein L.P. (the “Adviser”), Head of Global Client Group and Head of Private Wealth. He oversees AB’s entire private wealth management business and third-party institutional and retail franchise, where he is responsible for all client services, sales and marketing, as well as product strategy, management and development worldwide. Director, President and Chief Executive Officer of the AB Mutual Funds as of April 1, 2021. Erzan is also a member of the Equitable Holdings Management Committee. Prior to joining the firm in 2021, he spent over 19 years with McKinsey, most recently as a senior partner and co-leader of its Wealth & Asset Management practice. In addition, Erzan co-led McKinsey’s Banking & Securities Solutions (a portfolio of data, analytics and digital assets and capabilities) globally. | 75 | None | |||||
| 48 | AB SMALL CAP GROWTH PORTFOLIO |
abfunds.com | |
MANAGEMENT OF THE FUND (continued)
| NAME, ADDRESS* AND AGE, (YEAR FIRST ELECTED**) |
PRINCIPAL DURING PAST FIVE YEARS |
PORTFOLIOS IN AB FUND COMPLEX OVERSEEN BY DIRECTOR |
OTHER PUBLIC COMPANY DIRECTORSHIPS CURRENTLY HELD BY DIRECTOR | |||||
| DISINTERESTED DIRECTORS | ||||||||
| Marshall C. Turner, Jr.,## Chairman of the Board 80 (2005) |
Private Investor since prior to 2017. Former Chairman and CEO of Dupont Photomasks, Inc. (semi-conductor manufacturing equipment). He was a Director of Xilinx, Inc. (programmable logic semi-conductors and adaptable, intelligent computing) from 2007 through August 2020, and is a former director of 33 other companies and organizations. He has extensive operating leadership and venture capital investing experience, including five interim or full-time CEO roles, and prior service as general partner of institutional venture capital partnerships. He also has extensive non-profit board leadership experience, and currently serves on the board of the George Lucas Educational Foundation. He has served as a director of one AB Fund since 1992, and director or trustee of all AB Funds since 2005. He has been Chairman of the AB Funds since January 2014, and the Chairman of the Independent Directors Committees of the AB Funds since February 2014. | 75 | None | |||||
| abfunds.com | AB SMALL CAP GROWTH PORTFOLIO | 49 | |
MANAGEMENT OF THE FUND (continued)
| NAME, ADDRESS* AND AGE, (YEAR FIRST ELECTED**) |
PRINCIPAL DURING PAST FIVE YEARS |
PORTFOLIOS IN AB FUND COMPLEX OVERSEEN BY DIRECTOR |
OTHER PUBLIC COMPANY DIRECTORSHIPS CURRENTLY HELD BY DIRECTOR | |||||
| DISINTERESTED DIRECTORS (continued) |
||||||||
| Jorge A. Bermudez,## 71 (2020) |
Private Investor since prior to 2017. Formerly, Chief Risk Officer of Citigroup, Inc., a global financial services company, from November 2007 to March 2008, Chief Executive Officer of Citigroup’s Commercial Business Group in North America and Citibank Texas from 2005 to 2007, and a variety of other executive and leadership roles at various businesses within Citigroup prior to then; Chairman (2018) of the Texas A&M Foundation Board of Trustees (Trustee since 2013) and Chairman of the Smart Grid Center Board at Texas A&M University since 2012; director of, among others, Citibank N.A. from 2005 to 2008, the Federal Reserve Bank of Dallas, Houston Branch from 2009 to 2011, the Federal Reserve Bank of Dallas from 2011 to 2017, and the Electric Reliability Council of Texas from 2010 to 2016. He has served as director or trustee of the AB Funds since January 2020. | 75 | Moody’s Corporation since April 2011 | |||||
| Michael J. Downey,## 78 (2005) |
Private Investor since prior to 2017. Formerly, Chairman of the Asia Pacific Fund, Inc. (registered investment company) since prior to 2017 until January 2019. From 1987 until 1993, Chairman and CEO of Prudential Mutual Fund Management, director of the Prudential mutual funds, and member of the Executive Committee of Prudential Securities Inc. He has served as a director or trustee of the AB Funds since 2005. | 75 | None | |||||
| 50 | AB SMALL CAP GROWTH PORTFOLIO |
abfunds.com | |
MANAGEMENT OF THE FUND (continued)
| NAME, ADDRESS* AND AGE, (YEAR FIRST ELECTED**) |
PRINCIPAL DURING PAST FIVE YEARS |
PORTFOLIOS IN AB FUND COMPLEX OVERSEEN BY DIRECTOR |
OTHER PUBLIC COMPANY DIRECTORSHIPS CURRENTLY HELD BY DIRECTOR | |||||
| DISINTERESTED DIRECTORS (continued) |
||||||||
| Nancy P. Jacklin,## 74 (2006) |
Private Investor since prior to 2017. Professorial Lecturer at the Johns Hopkins School of Advanced International Studies (2008-2015). U.S. Executive Director of the International Monetary Fund (which is responsible for ensuring the stability of the international monetary system), (December 2002-May 2006); Partner, Clifford Chance (1992-2002); Sector Counsel, International Banking and Finance, and Associate General Counsel, Citicorp (1985-1992); Assistant General Counsel (International), Federal Reserve Board of Governors (1982-1985); and Attorney Advisor, U.S. Department of the Treasury (1973-1982). Member of the Bar of the District of Columbia and of New York; and member of the Council on Foreign Relations. She has served as a director or trustee of the AB Funds since 2006 and has been Chair of the Governance and Nominating Committees of the AB Funds since August 2014. | 75 | None | |||||
| Jeanette W. Loeb,## 70 (2020) |
Chief Executive Officer of PetCareRx (e-commerce pet pharmacy) from 2002 to 2011 and 2015 to present. Director of New York City Center since 2005. She was a director of AB Multi-Manager Alternative Fund, Inc. (fund of hedge funds) from 2012 to 2018. Formerly, affiliated with Goldman Sachs Group, Inc. (financial services) from 1977 to 1994, including as a partner thereof from 1986 to 1994. She has served as director or trustee of the AB Funds since April 2020. | 75 | Apollo Investment Corp. (business development company) since August 2011 | |||||
| abfunds.com | AB SMALL CAP GROWTH PORTFOLIO | 51 | |
MANAGEMENT OF THE FUND (continued)
| NAME, ADDRESS* AND AGE, (YEAR FIRST ELECTED**) |
PRINCIPAL DURING PAST FIVE YEARS |
PORTFOLIOS IN AB FUND COMPLEX OVERSEEN BY DIRECTOR |
OTHER PUBLIC COMPANY DIRECTORSHIPS CURRENTLY HELD BY DIRECTOR | |||||
| DISINTERESTED DIRECTORS (continued) |
||||||||
| Carol C. McMullen,## 67 (2016) |
Managing Director of Slalom Consulting (consulting) since 2014, private investor and a member of the Advisory Board of Butcher Box (since 2018). Formerly, member, Partners Healthcare Investment Committee (2010-2019); Director of Norfolk & Dedham Group (mutual property and casualty insurance) from 2011 until November 2016; Director of Partners Community Physicians Organization (healthcare) from 2014 until December 2016; and Managing Director of The Crossland Group (consulting) from 2012 until 2013. She has held a number of senior positions in the asset and wealth management industries, including at Eastern Bank (where her roles included President of Eastern Wealth Management), Thomson Financial (Global Head of Sales for Investment Management), and Putnam Investments (where her roles included Chief Investment Officer, Core and Growth and Head of Global Investment Research). She has served on a number of private company and non-profit boards, and as a director or trustee of the AB Funds since June 2016. | 75 | None | |||||
| 52 | AB SMALL CAP GROWTH PORTFOLIO |
abfunds.com | |
MANAGEMENT OF THE FUND (continued)
| NAME, ADDRESS* AND AGE, (YEAR FIRST ELECTED**) |
PRINCIPAL DURING PAST FIVE YEARS |
PORTFOLIOS IN AB FUND COMPLEX OVERSEEN BY DIRECTOR |
OTHER PUBLIC COMPANY DIRECTORSHIPS CURRENTLY HELD BY DIRECTOR | |||||
| DISINTERESTED DIRECTORS (continued) |
||||||||
| Garry L. Moody,## (2008) |
Private Investor since prior to 2017. Formerly, Partner, Deloitte & Touche LLP (1995-2008) where he held a number of senior positions, including Vice Chairman, and U.S. and Global Investment Management Practice Managing Partner; President, Fidelity Accounting and Custody Services Company (1993-1995), where he was responsible for accounting, pricing, custody and reporting for the Fidelity mutual funds; and Partner, Ernst & Young LLP (1975-1993), where he served as the National Director of Mutual Fund Tax Services and Managing Partner of its Chicago Office Tax department. He is a member of the Investment Company Institute’s Board of Governors and the Independent Directors Council’s Governing Council, where he serves as Chairman of its Governance Committee. He has served as a director or trustee, and as Chairman of the Audit Committees, of the AB Funds since 2008. | 75 | None | |||||
| * | The address for each of the Fund’s disinterested Directors is c/o AllianceBernstein L.P., Attention: Legal and Compliance Department—Mutual Fund Legal, 1345 Avenue of the Americas, New York, NY 10105. |
| ** | There is no stated term of office for the Fund’s Directors. |
| *** | The information above includes each Director’s principal occupation during the last five years and other information relating to the experience, attributes, and skills relevant to each Director’s qualifications to serve as a Director, which led to the conclusion that each Director should serve as a Director for the Fund. |
| # | Mr. Erzan is an “interested person” of the Fund, as defined in the 1940 Act, due to his position as a Senior Vice President of the Adviser. |
| ## | Member of the Audit Committee, the Governance and Nominating Committee and Independent Directors Committee. |
| abfunds.com | AB SMALL CAP GROWTH PORTFOLIO | 53 | |
MANAGEMENT OF THE FUND (continued)
Officers Information
Certain information concerning the Fund’s Officers is listed below.
| NAME, ADDRESS* AND AGE |
POSITION(S) HELD WITH FUND |
PRINCIPAL OCCUPATION DURING PAST FIVE YEARS | ||
| Onur Erzan 46 |
President and Chief Executive Officer | See biography above. | ||
| Bruce K. Aronow^ 56 |
Senior Vice President | Senior Vice President of the Adviser**, with which he has been associated since prior to 2017. He is also Chief Investment Officer of Small and SMID Cap Growth Equities. | ||
| Esteban Gomez 39 |
Vice President |
Senior Vice President of the Adviser**, with which he has been associated since prior to 2017. | ||
| Samantha S. Lau 49 |
Vice President | Senior Vice President of the Adviser**, with which she has been associated since prior to 2017. She is also Co-Chief Investment Officer of US Small and SMID Cap Growth Equities. | ||
| Heather Pavlak 38 |
Vice President |
Vice President of the Adviser**, with which she has been associated since 2018. Before joining the Adviser in 2018, she spent four years at Schroders Investment Management as an equity research analyst. | ||
| Wen-Tse Tseng 56 |
Vice President | Senior Vice President of the Adviser**, with which he has been associated since prior to 2017. | ||
| Emilie D. Wrapp 66 |
Secretary | Senior Vice President, Assistant General Counsel and Assistant Secretary of ABI**, with which she has been associated since prior to 2017. | ||
| Michael B. Reyes 46 |
Senior Vice President | Vice President of the Adviser**, with which he has been associated since prior to 2017. | ||
| Joseph J. Mantineo 63 |
Treasurer and Chief Financial Officer | Senior Vice President of AllianceBernstein Investor Services, Inc. (“ABIS”)**, with which he has been associated since prior to 2017. | ||
| Phyllis J. Clarke 61 |
Controller | Vice President of ABIS**, with which she has been associated since prior to 2017. | ||
| Vincent S. Noto 57 |
Chief Compliance Officer | Senior Vice President and Mutual Fund Chief Compliance Officer of the Adviser** since prior to 2017. |
| * | The address for each of the Fund’s Officers is 1345 Avenue of the Americas, New York, NY 10105. |
| ** | The Adviser, ABI and ABIS are affiliates of the Fund. |
The Fund’s Statement of Additional Information (“SAI”) has additional information about the Fund’s Directors and Officers and is available without charge upon request. Contact your financial representative or AllianceBernstein at (800) 227-4618, or visit www.abfunds.com, for a free prospectus or SAI.
| ^ | Mr. Aronow is expected to retire from the Adviser effective December 31, 2023. |
| 54 | AB SMALL CAP GROWTH PORTFOLIO |
abfunds.com | |
Operation and Effectiveness of the Fund’s Liquidity Risk Management Program:
In October 2016, the Securities and Exchange Commission (“SEC”) adopted the open-end fund liquidity rule (the “Liquidity Rule”). In June 2018 the SEC adopted a requirement that funds disclose information about the operation and effectiveness of their Liquidity Risk Management Program (“LRMP”) in their reports to shareholders.
One of the requirements of the Liquidity Rule is for the Fund to designate an Administrator of the Fund’s Liquidity Risk Management Program. The Administrator of the Fund’s LRMP is AllianceBernstein L.P., the Fund’s investment adviser (the “Adviser”). The Adviser has delegated the responsibility to its Liquidity Risk Management Committee (the “Committee”).
Another requirement of the Liquidity Rule is for the Fund’s Board of Directors (the “Fund Board”) to receive an annual written report from the Administrator of the LRMP, which addresses the operation of the Fund’s LRMP and assesses its adequacy and effectiveness. The Adviser provided the Fund Board with such annual report during the first quarter of 2022, which covered the period January 1, 2021 through December 31, 2021 (the “Program Reporting Period”).
The LRMP’s principal objectives include supporting the Fund’s compliance with limits on investments in illiquid assets and mitigating the risk that the Fund will be unable to meet its redemption obligations in a timely manner.
Pursuant to the LRMP, the Fund classifies the liquidity of its portfolio investments into one of the four categories defined by the SEC: Highly Liquid, Moderately Liquid, Less Liquid, and Illiquid. These classifications are reported to the SEC on Form N-PORT.
During the Program Reporting Period, the Committee reviewed whether the Fund’s strategy is appropriate for an open-end structure, incorporating any holdings of less liquid and illiquid assets. If the Fund participated in derivative transactions, the exposure from such transactions were considered in the LRMP.
The Committee also performed an analysis to determine whether the Fund is required to maintain a Highly Liquid Investment Minimum (“HLIM”). The Committee also incorporated the following information when determining the Fund’s reasonably anticipated trading size for purposes of liquidity monitoring: historical net redemption activity, a Fund’s concentration in an issuer, shareholder concentration, investment performance, total net assets, and distribution channels.
The Adviser informed the Fund Board that the Committee believes the Fund’s LRMP is adequately designed, has been implemented as intended, and has operated effectively since its inception. No material exceptions
| abfunds.com | AB SMALL CAP GROWTH PORTFOLIO | 55 | |
have been noted since the implementation of the LRMP. During the Program Reporting Period, liquidity in all markets was significantly recovered and improved compared to the prior reporting period which included extreme levels of price volatility and relative illiquidity beginning in March 2020 with COVID-19 impacts. As such, the program operated in a relatively robust and benign liquidity environment experienced in markets during the Program Reporting Period. There were no liquidity events that impacted the Fund or its ability to timely meet redemptions during the Program Reporting Period.
| 56 | AB SMALL CAP GROWTH PORTFOLIO |
abfunds.com | |
Information Regarding the Review and Approval of the Fund’s Advisory Agreement
The disinterested directors (the “directors”) of AB Cap Fund, Inc. (the “Company”) unanimously approved the continuance of the Company’s Advisory Agreement with the Adviser in respect of AB Small Cap Growth Portfolio (the “Fund”) at a meeting held in-person on May 3-5, 2022 (the “Meeting”).
Prior to approval of the continuance of the Advisory Agreement, the directors had requested from the Adviser, and received and evaluated, extensive materials. They reviewed the proposed continuance of the Advisory Agreement with the Adviser and with experienced counsel who are independent of the Adviser, who advised on the relevant legal standards. The directors also reviewed additional materials, including comparative analytical data prepared by the Senior Vice President for the Fund. The directors also discussed the proposed continuance in private sessions with counsel.
The directors considered their knowledge of the nature and quality of the services provided by the Adviser to the Fund gained from their experience as directors or trustees of most of the registered investment companies advised by the Adviser, their overall confidence in the Adviser’s integrity and competence they have gained from that experience, the Adviser’s initiative in identifying and raising potential issues with the directors and its responsiveness, frankness and attention to concerns raised by the directors in the past, including the Adviser’s willingness to consider and implement organizational and operational changes designed to improve investment results and the services provided to the AB Funds. The directors noted that they have four regular meetings each year, at each of which they review extensive materials and information from the Adviser, including information on the investment performance of the Fund and the money market fund advised by the Adviser in which the Fund invests a portion of its assets.
The directors also considered all factors they believed relevant, including the specific matters discussed below. During the course of their deliberations, the directors evaluated, among other things, the reasonableness of the advisory fee. The directors did not identify any particular information that was all-important or controlling, and different directors may have attributed different weights to the various factors. The directors determined that the selection of the Adviser to manage the Fund and the overall arrangements between the Fund and the Adviser, as provided in the Advisory Agreement, including the advisory fee, were fair and reasonable in light of the services performed, expenses incurred and such other matters as the directors considered relevant in the exercise of their business judgment.
| abfunds.com | AB SMALL CAP GROWTH PORTFOLIO | 57 | |
The material factors and conclusions that formed the basis for the directors’ determinations included the following:
Nature, Extent and Quality of Services Provided
The directors considered the scope and quality of services provided by the Adviser under the Advisory Agreement, including the quality of the investment research capabilities of the Adviser and the other resources it has dedicated to performing services for the Fund. The directors noted that the Adviser from time to time reviews the Fund’s investment strategies and from time to time proposes changes intended to improve the Fund’s relative or absolute performance for the directors’ consideration. They also noted the professional experience and qualifications of the Fund’s portfolio management team and other senior personnel of the Adviser. The directors also considered that the Advisory Agreement provides that the Fund will reimburse the Adviser for the cost to it of providing certain clerical, accounting, administrative and other services to the Fund by employees of the Adviser or its affiliates. Requests for these reimbursements are made on a quarterly basis and subject to approval by the directors. Reimbursements, to the extent requested and paid, result in a higher rate of total compensation from the Fund to the Adviser than the fee rate stated in the Advisory Agreement. The directors noted that the methodology used to determine the reimbursement amounts had been reviewed by an independent consultant at the request of the directors. The quality of administrative and other services, including the Adviser’s role in coordinating the activities of the Fund’s other service providers, also was considered. The directors concluded that, overall, they were satisfied with the nature, extent and quality of services provided to the Fund under the Advisory Agreement.
Costs of Services Provided and Profitability
The directors reviewed a schedule of the revenues and expenses and related notes indicating the profitability of the Fund to the Adviser for calendar years 2020 and 2021 that had been prepared with an expense allocation methodology arrived at in consultation with an independent consultant at the request of the directors. The directors noted the assumptions and methods of allocation used by the Adviser in preparing fund-specific profitability data and understood that there are a number of potentially acceptable allocation methodologies for information of this type. The directors noted that the profitability information reflected all revenues and expenses of the Adviser’s relationship with the Fund, including those relating to its subsidiaries that provide transfer agency, distribution and brokerage services to the Fund. The directors recognized that it is difficult to make comparisons of the profitability of the Advisory Agreement with the profitability of fund advisory contracts for unaffiliated funds because comparative information is not generally publicly available and is affected by numerous factors. The directors focused on the profitability of the Adviser’s relationship with the Fund before taxes and distribution expenses. The directors concluded that the Adviser’s level of profitability from its relationship with the Fund was not unreasonable.
| 58 | AB SMALL CAP GROWTH PORTFOLIO |
abfunds.com | |
Fall-Out Benefits
The directors considered the other benefits to the Adviser and its affiliates from their relationships with the Fund and the money market fund advised by the Adviser in which the Fund invests, including, but not limited to, benefits relating to soft dollar arrangements (whereby investment advisers receive brokerage and research services from brokers that execute agency transactions for their clients); 12b-1 fees and sales charges received by the Fund’s principal underwriter (which is a wholly owned subsidiary of the Adviser) in respect of certain classes of the Fund’s shares; brokerage commissions paid by the Fund to brokers affiliated with the Adviser; and transfer agency fees paid by the Fund to a wholly owned subsidiary of the Adviser. The directors recognized that the Adviser’s profitability would be somewhat lower without these benefits. The directors understood that the Adviser also might derive reputational and other benefits from its association with the Fund.
Investment Results
In addition to the information reviewed by the directors in connection with the Meeting, the directors receive detailed performance information for the Fund at each regular Board meeting during the year.
At the Meeting, the directors reviewed performance information prepared by an independent service provider (the “15(c) service provider”), showing the performance of the Class A Shares of the Fund against a group of similar funds (“peer group”) and a larger group of similar funds (“peer universe”), each selected by the 15(c) service provider, and information prepared by the Adviser showing performance of the Class A Shares against a broad-based securities market index, in each case for the 1-, 3-, 5- and 10-year periods ended February 28, 2022. Based on their review, the directors concluded that the Fund’s investment performance was acceptable.
Advisory Fees and Other Expenses
The directors considered the advisory fee rate payable by the Fund to the Adviser and information prepared by the 15(c) service provider concerning advisory fee rates payable by other funds in the same category as the Fund. The directors recognized that it is difficult to make comparisons of advisory fees because there are variations in the services that are included in the fees paid by other funds. The directors compared the Fund’s contractual effective advisory fee rate with a peer group median and took into account the impact on the advisory fee rate of the administrative expense reimbursement paid to the Adviser in the latest fiscal year.
The directors also considered the Adviser’s fee schedule for other clients utilizing investment strategies similar to those of the Fund. For this purpose, they reviewed the relevant advisory fee information from the Adviser’s Form ADV and in a report from the Fund’s Senior Vice President
| abfunds.com | AB SMALL CAP GROWTH PORTFOLIO | 59 | |
and noted the differences between the Fund’s fee schedule, on the one hand, and the Adviser’s institutional fee schedule and the schedule of fees charged by the Adviser to any offshore funds and for services to any sub-advised funds utilizing investment strategies similar to those of the Fund, on the other. The directors noted that the Adviser may, in some cases, agree to fee rates with large institutional clients that are lower than those reviewed by the directors and that they had previously discussed with the Adviser its policies in respect of such arrangements. The directors also compared the advisory fee rate for the Fund with those for two other funds advised by the Adviser utilizing similar investment strategies.
The Adviser reviewed with the directors the significantly greater scope of the services it provides to the Fund relative to institutional, offshore fund and sub-advised fund clients. In this regard, the Adviser noted, among other things, that, compared to institutional and offshore or sub-advisory accounts, the Fund (i) demands considerably more portfolio management, research and trading resources due to significantly higher daily cash flows; (ii) has more tax and regulatory restrictions and compliance obligations; (iii) must prepare and file or distribute regulatory and other communications about fund operations; and (iv) must provide shareholder servicing to retail investors. The Adviser also reviewed the greater legal risks presented by the large and changing population of Fund shareholders who may assert claims against the Adviser in individual or class actions, and the greater entrepreneurial risk in offering new fund products, which require substantial investment to launch, may not succeed, and generally must be priced to compete with larger, more established funds resulting in lack of profitability to the Adviser until a new fund achieves scale. In light of the substantial differences in services rendered by the Adviser to institutional, offshore fund and sub-advised fund clients as compared to the Fund, and the different risk profile, the directors considered these fee comparisons inapt and did not place significant weight on them in their deliberations.
In connection with their review of the Fund’s advisory fee, the directors also considered the total expense ratio of the Class A shares of the Fund in comparison to a peer group and a peer universe selected by the 15(c) service provider. The Class A expense ratio of the Fund was based on the Fund’s latest fiscal year. The directors noted that it was likely that the expense ratios of some of the other funds in the Fund’s category were lowered by waivers or reimbursements by those funds’ investment advisers, which in some cases might be voluntary or temporary. The directors view expense ratio information as relevant to their evaluation of the Adviser’s services because the Adviser is responsible for coordinating services provided to the Fund by others. Based on their review, the directors concluded that the Fund’s expense ratio was acceptable.
| 60 | AB SMALL CAP GROWTH PORTFOLIO |
abfunds.com | |
Economies of Scale
The directors noted that the advisory fee schedule for the Fund contains breakpoints and that the Fund’s net assets were higher than the breakpoint levels. Accordingly, the Fund’s current effective advisory fee rate reflected a reduction due to the breakpoints and would be further reduced to the extent the net assets of the Fund increase. The directors took into consideration prior presentations by an independent consultant on economies of scale in the mutual fund industry and for the AB Funds, and presentations from time to time by the Adviser concerning certain of its views on economies of scale. The directors also had requested and received from the Adviser certain updates on economies of scale in advance of the Meeting. The directors believe that economies of scale may be realized (if at all) by the Adviser across a variety of products and services, and not only in respect of a single fund. The directors noted that there is no established methodology for setting breakpoints that give effect to the fund-specific services provided by a fund’s adviser and to the economies of scale that an adviser may realize in its overall mutual fund business or those components of it which directly or indirectly affect a fund’s operations. The directors observed that in the mutual fund industry as a whole, as well as among funds similar to the Fund, there is no uniformity or pattern in the fees and asset levels at which breakpoints (if any) apply. The directors also noted that the advisory agreements for many funds do not have breakpoints at all. Having taken these factors into account, the directors concluded that the Fund’s breakpoint arrangements were acceptable and provide a means for sharing any economies of scale.
| abfunds.com | AB SMALL CAP GROWTH PORTFOLIO | 61 | |
This page is not part of the Shareholder Report or the Financial Statements.
AB FAMILY OF FUNDS
US EQUITY
CORE
Core Opportunities Fund
Select US Equity Portfolio
Sustainable US Thematic Portfolio
GROWTH
Concentrated Growth Fund
Discovery Growth Fund
Growth Fund
Large Cap Growth Fund
Small Cap Growth Portfolio
VALUE
Discovery Value Fund
Equity Income Fund
Relative Value Fund
Small Cap Value Portfolio
Value Fund
INTERNATIONAL/ GLOBAL EQUITY
CORE
Global Core Equity Portfolio
International Strategic Core Portfolio
Sustainable Global Thematic Fund
Sustainable International Thematic Fund
Tax-Managed Wealth Appreciation Strategy
Wealth Appreciation Strategy
GROWTH
Concentrated International Growth Portfolio
VALUE
All China Equity Portfolio
International Value Fund
FIXED INCOME
MUNICIPAL
High Income Municipal Portfolio
Intermediate California Municipal Portfolio
Intermediate Diversified Municipal Portfolio
Intermediate New York Municipal Portfolio
Municipal Bond Inflation Strategy
Tax-Aware Fixed Income Opportunities Portfolio
National Portfolio
Arizona Portfolio
California Portfolio
Massachusetts Portfolio
Minnesota Portfolio
New Jersey Portfolio
New York Portfolio
Ohio Portfolio
Pennsylvania Portfolio
Virginia Portfolio
TAXABLE
Bond Inflation Strategy
Global Bond Fund
High Income Fund
High Yield Portfolio
Income Fund
Intermediate Duration Portfolio
Limited Duration High Income Portfolio
Short Duration Income Portfolio
Short Duration Portfolio
Sustainable Thematic Credit Portfolio
Total Return Bond Portfolio
ALTERNATIVES
All Market Real Return Portfolio
Global Real Estate Investment Fund
Select US Long/Short Portfolio
MULTI-ASSET
All Market Income Portfolio
All Market Total Return Portfolio
Emerging Markets Multi-Asset Portfolio
Global Risk Allocation Fund
Sustainable Thematic Balanced Portfolio1
Tax-Managed All Market Income Portfolio
CLOSED-END FUNDS
AllianceBernstein Global High Income Fund
AllianceBernstein National Municipal Income Fund
We also offer Government Money Market Portfolio, which serves as the money market fund exchange vehicle for the AB mutual funds. You could lose money by investing in the Fund. Although the Fund seeks to preserve the value of your investment at $1.00 per share, it cannot guarantee it will do so. The Fund may impose a fee upon sale of your shares or may temporarily suspend your ability to sell shares if the Fund’s liquidity falls below required minimums because of market conditions or other factors. An investment in the Fund is not insured or guaranteed by the Federal Deposit Insurance Corporation or any other government agency. The Fund’s sponsor has no legal obligation to provide financial support to the Fund, and you should not expect that the sponsor will provide financial support to the Fund at any time.
Investors should consider the investment objectives, risks, charges and expenses of the Fund carefully before investing. For copies of our prospectus or summary prospectus, which contain this and other information, visit us online at www.abfunds.com or contact your AB representative. Please read the prospectus and/or summary prospectus carefully before investing.
| 1 | Prior to December 1, 2021, Sustainable Thematic Balanced Portfolio was named Conservative Wealth Strategy. |
| 62 | AB SMALL CAP GROWTH PORTFOLIO |
abfunds.com | |
NOTES
| abfunds.com | AB SMALL CAP GROWTH PORTFOLIO | 63 | |
NOTES
| 64 | AB SMALL CAP GROWTH PORTFOLIO |
abfunds.com | |
AB SMALL CAP GROWTH PORTFOLIO
1345 Avenue of the Americas
New York, NY 10105
800 221 5672
SCG-0151-0722

| ITEM 2. | CODE OF ETHICS. |
(a) The registrant has adopted a code of ethics that applies to its principal executive officer, principal financial officer and principal accounting officer. A copy of the registrant’s code of ethics is filed herewith as Exhibit 12(a)(1).
(b) During the period covered by this report, no material amendments were made to the provisions of the code of ethics adopted in 2(a) above.
(c) During the period covered by this report, no implicit or explicit waivers to the provisions of the code of ethics adopted in 2(a) above were granted.
| ITEM 3. | AUDIT COMMITTEE FINANCIAL EXPERT. |
The registrant’s Board of Directors has determined that independent directors Garry L. Moody, Marshall C. Turner, Jr. and Jorge A. Bermudez qualify as audit committee financial experts.
| ITEM 4. | PRINCIPAL ACCOUNTANT FEES AND SERVICES. |
(a) - (c) The following table sets forth the aggregate fees billed by the independent registered public accounting firm Ernst & Young LLP, for the Fund’s last two fiscal years for professional services rendered for: (i) the audit of the Fund’s annual financial statements included in the Fund’s annual report to stockholders; (ii) assurance and related services that are reasonably related to the performance of the audit of the Fund’s financial statements and are not reported under (i), which include advice and education related to accounting and auditing issues and quarterly press release review (for those Funds which issue press releases), and preferred stock maintenance testing (for those Funds that issue preferred stock); and (iii) tax compliance, tax advice and tax return preparation.
| Audit Fees | Audit-Related Fees |
Tax Fees | ||||||||||||||
| AB Small Cap Growth |
2021 | $ | 32,375 | $ | — | $ | 21,016 | |||||||||
| 2022 | $ | 33,994 | $ | — | $ | 19,416 | ||||||||||
(d) Not applicable.
(e) (1) Beginning with audit and non-audit service contracts entered into on or after May 6, 2003, the Fund’s Audit Committee policies and procedures require the pre-approval of all audit and non-audit services provided to the Fund by the Fund’s independent registered public accounting firm. The Fund’s Audit Committee policies and procedures also require pre-approval of all audit and non-audit services provided to the Adviser and Service Affiliates to the extent that these services are directly related to the operations or financial reporting of the Fund.
(e) (2) All of the amounts for Audit Fees, Audit-Related Fees and Tax Fees in the table under Item 4 (a) – (c) are for services pre-approved by the Fund’s Audit Committee.
(f) Not applicable.
(g) The following table sets forth the aggregate non-audit services provided to the Fund, the Fund’s Adviser and entities that control, are controlled by or under common control with the Adviser that provide ongoing services to the Fund:
| All Fees for Non-Audit Services Provided to the Portfolio, the Adviser and Service Affiliates |
Total Amount of Foregoing Column Pre- approved by the Audit Committee (Portion Comprised of Audit Related Fees) (Portion Comprised of Tax Fees) |
|||||||||||
| AB Small Cap Growth |
2021 | $ | 1,023,276 | $ | 21,016 | |||||||
| $ | — | |||||||||||
| $ | (21,016 | ) | ||||||||||
| 2022 | $ | 1,953,010 | $ | 19,416 | ||||||||
| $ | — | |||||||||||
| $ | (19,416 | ) | ||||||||||
(h) The Audit Committee of the Fund has considered whether the provision of any non-audit services not pre-approved by the Audit Committee provided by the Fund’s independent registered public accounting firm to the Adviser and Service Affiliates is compatible with maintaining the auditor’s independence.
| ITEM 5. | AUDIT COMMITTEE OF LISTED REGISTRANTS. |
Not applicable to the registrant.
| ITEM 6. | INVESTMENTS. |
Please see Schedule of Investments contained in the Report to Shareholders included under Item 1 of this Form N-CSR.
| ITEM 7. | DISCLOSURE OF PROXY VOTING POLICIES AND PROCEDURES FOR CLOSED-END MANAGEMENT INVESTMENT COMPANIES. |
Not applicable to the registrant.
| ITEM 8. | PORTFOLIO MANAGERS OF CLOSED-END MANAGEMENT INVESTMENT COMPANIES. |
Not applicable to the registrant.
| ITEM 9. | PURCHASES OF EQUITY SECURITIES BY CLOSED-END MANAGEMENT INVESTMENT COMPANY AND AFFILIATED PURCHASERS. |
Not applicable to the registrant.
| ITEM 10. | SUBMISSION OF MATTERS TO A VOTE OF SECURITY HOLDERS. |
There have been no material changes to the procedures by which shareholders may recommend nominees to the Fund’s Board of Directors since the Fund last provided disclosure in response to this item.
| ITEM 11. | CONTROLS AND PROCEDURES. |
(a) The registrant’s principal executive officer and principal financial officer have concluded that the registrant’s disclosure controls and procedures (as defined in Rule 30a-2(c) under the Investment Company Act of 1940, as amended) are effective at the reasonable assurance level based on their evaluation of these controls and procedures as of a date within 90 days of the filing date of this document.
(b) There were no changes in the registrant’s internal controls over financial reporting that occurred during the period that has materially affected, or is reasonably likely to materially affect, the registrant’s internal control over financial reporting.
| ITEM 12. | DISCLOSURE OF SECURITIES LENDING ACTIVITIES FOR CLOSED-END MANAGEMENT INVESTMENT COMPANIES. |
Not applicable to the registrant.
| ITEM 13. | EXHIBITS. |
The following exhibits are attached to this Form N-CSR:
SIGNATURES
Pursuant to the requirements of the Securities Exchange Act of 1934 and the Investment Company Act of 1940, the registrant has duly caused this report to be signed on its behalf by the undersigned, thereunto duly authorized.
(Registrant): AB Cap Fund, Inc.
| By: | /s/ Onur Erzan | |
| Onur Erzan | ||
| President | ||
| Date: September 29, 2022 | ||
Pursuant to the requirements of the Securities Exchange Act of 1934 and the Investment Company Act of 1940, this report has been signed below by the following persons on behalf of the registrant and in the capacities and on the dates indicated.
| By: | /s/ Onur Erzan | |
| Onur Erzan | ||
| President | ||
| Date: September 29, 2022 | ||
| By: | /s/ Joseph J. Mantineo | |
| Joseph J. Mantineo | ||
| Treasurer and Chief Financial Officer | ||
| Date: September 29, 2022 | ||
ATTACHMENTS / EXHIBITS
Serious News for Serious Traders! Try StreetInsider.com Premium Free!
You May Also Be Interested In
- Fastwyre Broadband Begins Its Initial Investment in Central Alabama Bringing Its Fiber Optic Network to the Region
- Mediflow's Water Pillow: Clinically Proven to Reduce Pain and Improve Sleep
- AlayaCare Partners with Corus Health to Enhance Family-Centered Care in New Mexico
Create E-mail Alert Related Categories
SEC FilingsSign up for StreetInsider Free!
Receive full access to all new and archived articles, unlimited portfolio tracking, e-mail alerts, custom newswires and RSS feeds - and more!
