

Form DEFA14A AMERICAN VANGUARD CORP
 Tweet
Tweet Share
Share
UNITED STATES
SECURITIES AND EXCHANGE COMMISSION
Washington, D.C. 20549
SCHEDULE 14A
Proxy Statement Pursuant to Section 14(a) of the
Securities Exchange Act of 1934
(Amendment No. )
Filed by the Registrant ☒
Filed by a Party other than the Registrant ☐
Check the appropriate box:
| ☐ | Preliminary Proxy Statement |
| ☐ | Confidential, for Use of the Commission Only (as permitted by Rule 14a-6(e)(2)) |
| ☐ | Definitive Proxy Statement |
| ☒ | Definitive Additional Materials |
| ☐ | Soliciting Material Pursuant to Rule 14a-11(c) or Rule 14a-12 |
AMERICAN VANGUARD CORPORATION
(Name of Registrant as Specified In Its Charter)
(Name of Person(s) Filing Proxy Statement, if other than the Registrant)
Payment of Filing Fee (Check all boxes that apply):
| ☒ | No fee required |
| ☐ | Fee paid previously with preliminary materials |
| ☐ | Fee computed on table in exhibit required by Item 25(b) per Exchange Act Rules 14a-6(i)(1) and 0-11 |
Explanatory Note
The following presentation addresses certain matters relating to the election of directors at the 2022 Annual Meeting of Stockholders (“Meeting”) of American Vanguard Corporation, a Delaware corporation (“Registrant”) for purposes of discussions with investors, proxy advisors, and other interested parties in anticipation of the Meeting. Readers should review the disclosures on Slide 2 in considering the matters discussed herein.

Investor Presentation May 13, 2022

Important Additional Information and Where to Find It American Vanguard (“AVD”) has filed a definitive proxy statement on Schedule 14A, and an accompanying WHITE proxy card, with the Securities and Exchange Commission (“SEC”) in connection with the solicitation of proxies for its 2022 Annual Meeting of Stockholders. STOCKHOLDERS ARE STRONGLY ADVISED TO READ THE COMPANY’S DEFINITIVE PROXY STATEMENT (INCLUDING ANY AMENDMENTS OR SUPPLEMENTS THERETO) AND ANY AND ALL OTHER DOCUMENTS FILED WITH THE SEC WHEN THEY BECOME AVAILABLE, BECAUSE THEY WILL CONTAIN IMPORTANT INFORMATION. Stockholders may obtain a free copy of the proxy statement and accompanying WHITE proxy card, any amendments or supplements to the proxy statement, and other documents that the Company files with the SEC, from the Company’s website, https://www.american-vanguard.com, or from the SEC's website at http://www.sec.gov. These will be available as soon as reasonably practicable after such materials are electronically filed with or furnished to the SEC. Certain Information Regarding Participants to the Solicitation The Company and its directors, executive officers and certain employees and other persons may be deemed to be participants in the solicitation of proxies from the Company’s stockholders in connection with the business to be conducted at the Annual Meeting. Stockholders may obtain information regarding the names, affiliations and interests of the Company’s directors and executive officers included in or incorporated by reference into the Company’s Annual Report on Form 10-K for the fiscal year ended December 31, 2021, which was filed with the SEC on March 14, 2022, or from the Company’s definitive proxy statement filed with the SEC on April 29, 2022. To the extent the holdings of the Company’s securities by the Company’s directors and executive officers have changed since the numbers set forth in the Company’s definitive proxy statement, such changes have been or will be reflected on Statements of Change in Ownership on Form 4 filed with the SEC. Non-GAAP Financial Measures The Company is presenting certain non-GAAP financial measures including adjusted EBITDA. These non-GAAP financial measures are provided to better enable investors and others to assess the Company’s ongoing operating results and compare them with its competitors. This should be considered a supplement to, and not a substitute for, or superior to, financial measures calculated in accordance with GAAP. Forward-Looking Statements Certain information set forth in this release and the accompanying letter may constitute “forward looking statements” within the meaning of federal and applicable state securities laws. All statements herein that are not statements of historical fact are forward looking statements. These statements include statements regarding management’s expectations for future performance, as well as descriptions of plans and strategies and the expected results thereof. Without limiting the generality of the foregoing, statements about our expected ability to continue benefiting from the strategies developed and implemented by the Board and management, and statements about the anticipated outcomes of these strategies, are forward looking in nature and should be interpreted accordingly. These statements reflect the current expectations of American Vanguard’s management based on currently known facts and circumstances, and should not be construed as assurances of performance or as guaranties of the actual outcomes. Without limiting the generality of the foregoing, forward looking statements include expectations about expected revenues, product margins, and net income, as well as factors relating to the effects on the Company’s earnings of the contested proxy solicitation currently underway. Actual results may differ from those expressed in forward looking statements, and those differences may be material and adverse. Factors that could cause actual results to differ from expectations include the ongoing effects of the COVID-19 pandemic and government responses and economic conditions resulting therefrom; the effect of international exchange rates and other local, national and foreign economic conditions; weather and climate conditions; changes in regulatory policy and in specific regulations and permitting processes that affect our products, and other risks as detailed from time-to-time in the Company’s SEC reports and filings. The Company’s Quarterly Report on Form 10-Q for the fiscal Quarter ended March 31, 2022, filed with the SEC on May 4, 2022, contains a list of risk factors that may cause results to differ from expectations. These risk factors will be updated from time to time in accordance with the requirements of the Securities Exchange Act of 1934, as amended, and the regulations thereunder (“Exchange Act”), or otherwise in our Exchange Act filings. The statements in this release speak only as of the date hereof, and the Company undertakes no duty to update such statements to reflect future events or developments. 2
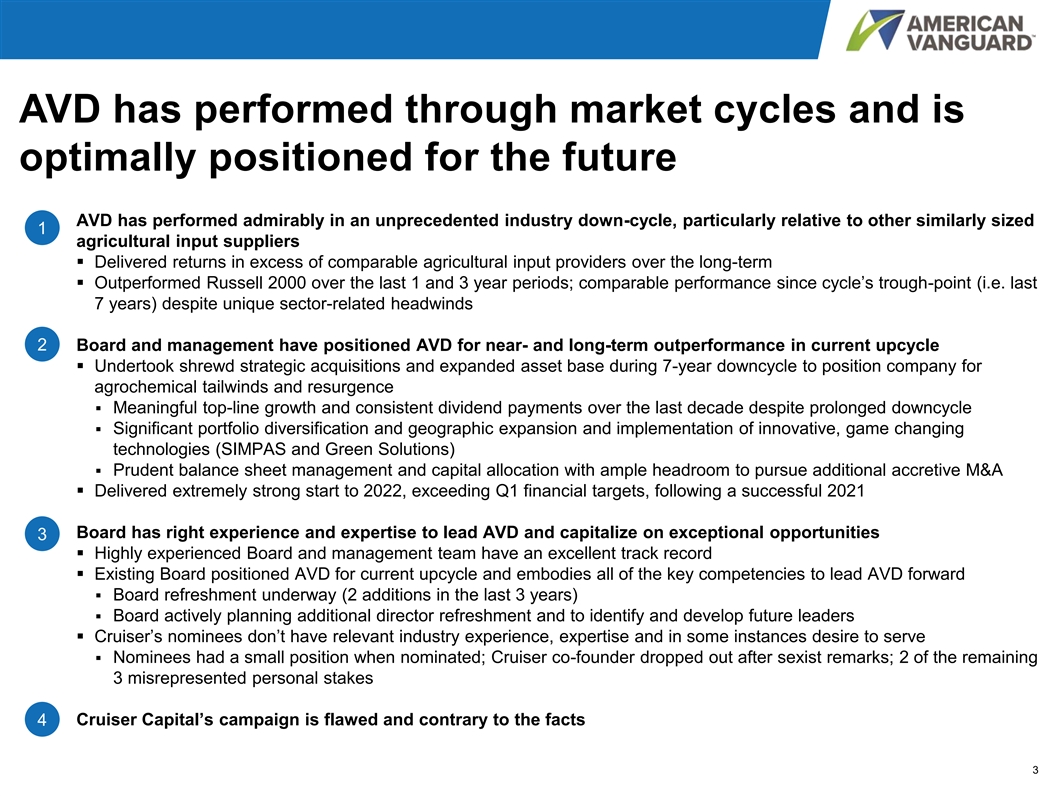
AVD has performed through market cycles and is optimally positioned for the future AVD has performed admirably in an unprecedented industry down-cycle, particularly relative to other similarly sized 1 agricultural input suppliers ▪ Delivered returns in excess of comparable agricultural input providers over the long-term ▪ Outperformed Russell 2000 over the last 1 and 3 year periods; comparable performance since cycle’s trough-point (i.e. last 7 years) despite unique sector-related headwinds 2 Board and management have positioned AVD for near- and long-term outperformance in current upcycle ▪ Undertook shrewd strategic acquisitions and expanded asset base during 7-year downcycle to position company for agrochemical tailwinds and resurgence ▪ Meaningful top-line growth and consistent dividend payments over the last decade despite prolonged downcycle ▪ Significant portfolio diversification and geographic expansion and implementation of innovative, game changing technologies (SIMPAS and Green Solutions) ▪ Prudent balance sheet management and capital allocation with ample headroom to pursue additional accretive M&A ▪ Delivered extremely strong start to 2022, exceeding Q1 financial targets, following a successful 2021 Board has right experience and expertise to lead AVD and capitalize on exceptional opportunities 3 ▪ Highly experienced Board and management team have an excellent track record ▪ Existing Board positioned AVD for current upcycle and embodies all of the key competencies to lead AVD forward ▪ Board refreshment underway (2 additions in the last 3 years) ▪ Board actively planning additional director refreshment and to identify and develop future leaders ▪ Cruiser’s nominees don’t have relevant industry experience, expertise and in some instances desire to serve ▪ Nominees had a small position when nominated; Cruiser co-founder dropped out after sexist remarks; 2 of the remaining 3 misrepresented personal stakes Cruiser Capital’s campaign is flawed and contrary to the facts 4 3
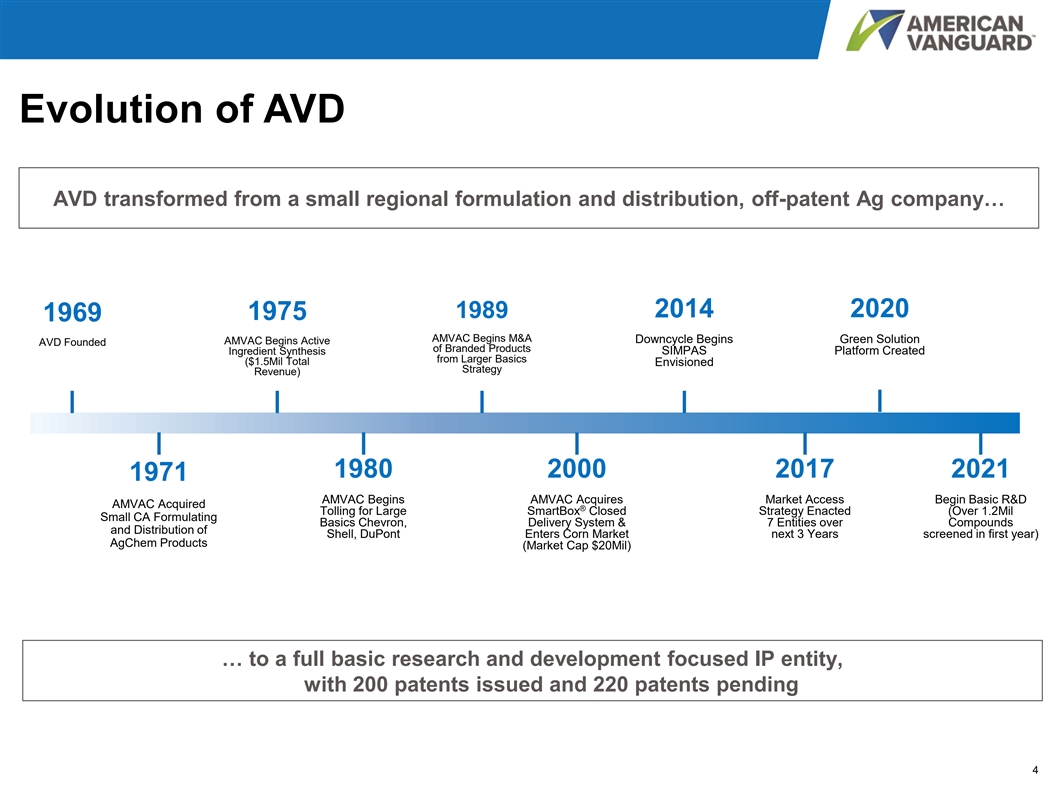
Evolution of AVD AVD transformed from a small regional formulation and distribution, off-patent Ag company… 2014 2020 1989 1975 1969 AMVAC Begins M&A Green Solution AMVAC Begins Active Downcycle Begins AVD Founded of Branded Products Ingredient Synthesis SIMPAS Platform Created from Larger Basics ($1.5Mil Total Envisioned Strategy Revenue) 1980 2000 2017 2021 1971 AMVAC Begins AMVAC Acquires Market Access Begin Basic R&D AMVAC Acquired ® Tolling for Large SmartBox Closed Strategy Enacted (Over 1.2Mil Small CA Formulating Basics Chevron, Delivery System & 7 Entities over Compounds and Distribution of Shell, DuPont Enters Corn Market next 3 Years screened in first year) AgChem Products (Market Cap $20Mil) … to a full basic research and development focused IP entity, with 200 patents issued and 220 patents pending 4

Section 1 AVD has performed admirably in an unprecedented industry down-cycle, particularly relative to other similarly sized agricultural input suppliers 5

Share price ($) AVD share price outperforms the commodity cycle $9.0 $40.00 $8.0 $7.73 $30.00 $7.0 $20.62 $6.0 $20.00 $5.0 $10.00 $4.0 $3.0 $0.00 2006 2007 2008 2009 2010 2011 2012 2013 2014 2015 2016 2017 2018 2019 2020 2021 Corn ($ / bl) American Vanguard Note: Market date as of 5/9/2022 6 Source: Market data Corn ($ / bl)

AVD has performed despite challenging industry dynamics… Total Shareholder Return Since May 2015 (i.e. last 7 years) 250 L7Y L3Y L1Y American Vanguard 48% 38% 3% Russell 2000 Index 57% 16% (22%) Small-Cap Agricultural Inputs (39%) 167% 135% 200 57% 150 48% 100 (39%) 50 0 May-15 Jan-16 Oct-16 Jun-17 Feb-18 Nov-18 Jul-19 Apr-20 Dec-20 Aug-21 May-22 American Vanguard Small-Cap Agricultural Inputs Russell 2000 Index Note: Market date as of 5/9/2022; TSR from 5/9/2015 – 5/9/2022; Small-Cap Agricultural Inputs includes NuFarm, AgroFresh, Itafos, LSB, CVR and Intrepid Source: Market data 7 Total Shareholder Return (%) inexed to 100

…and outperformed all other small-cap agricultural input providers Total Shareholder Return Since May 2015 (i.e. last 7 years) $640 $1,380 $1,710 $1,520 $820 $400 $90 $14,350 $7,670 Large-Cap Agricultural Inputs Average: 146% 153% 140% Small-Cap Agricultural Inputs Average: (39%) 48% 31% (4%) (48%) (53%) (74%) (84%) American Vanguard Small-Cap Fertilizers Small-Cap AgChem Large-Cap Agricultural Inputs ▪ TSR compares favorably to broader Small-Cap Agricultural Inputs peer group for the time period specified by Cruiser ▪ AVD has meaningfully outperformed other Small-Cap AgChem producers (i.e. Nufarm, Agrofresh) ▪ Large-Cap Agricultural Inputs producers less relevant due to relative scale and greater geographic diversity ▪ While AVD continues to diversify its regional presence, it is disproportionately impacted by Americas-specific nuances (e.g. weather, tariffs) ▪ Recent fertilizer performance benefiting from favorable supply / demand dynamics driving abnormal pricing power Note: Market date as of 5/9/2022; Peers defined as other agrochemical producers and small-cap input providers to the agricultural sector; Market cap rounded to nearest $10m (a) TSR from 5/9/2015 – 5/9/2022 8 Source: Company filings, press releases, Market data (a) Total Shareholder Return (%) Equity value ($m)
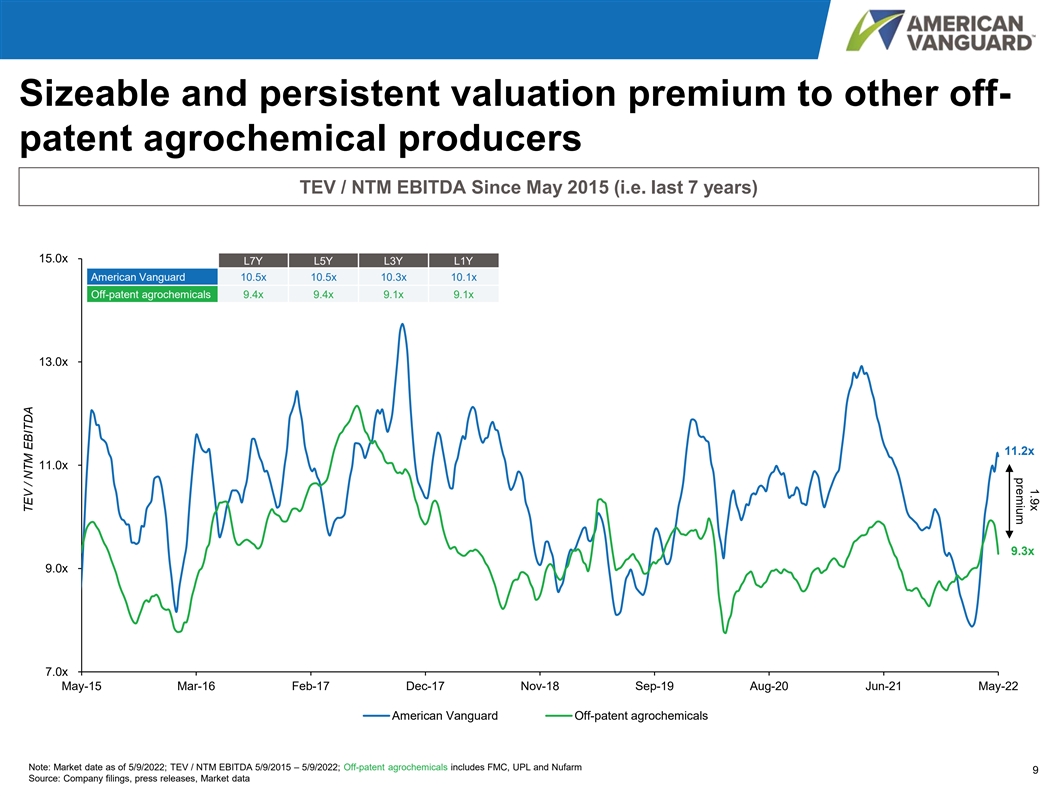
1.9x premium Sizeable and persistent valuation premium to other off- patent agrochemical producers TEV / NTM EBITDA Since May 2015 (i.e. last 7 years) 15.0x L7Y L5Y L3Y L1Y American Vanguard 10.5x 10.5x 10.3x 10.1x Off-patent agrochemicals 9.4x 9.4x 9.1x 9.1x 13.0x 11.2x 11.0x 9.3x 9.0x 7.0x May-15 Mar-16 Feb-17 Dec-17 Nov-18 Sep-19 Aug-20 Jun-21 May-22 American Vanguard Off-patent agrochemicals Note: Market date as of 5/9/2022; TEV / NTM EBITDA 5/9/2015 – 5/9/2022; Off-patent agrochemicals includes FMC, UPL and Nufarm 9 Source: Company filings, press releases, Market data TEV / NTM EBITDA

Section 2 Board and management have positioned AVD for near- and long- term outperformance in current upcycle 10
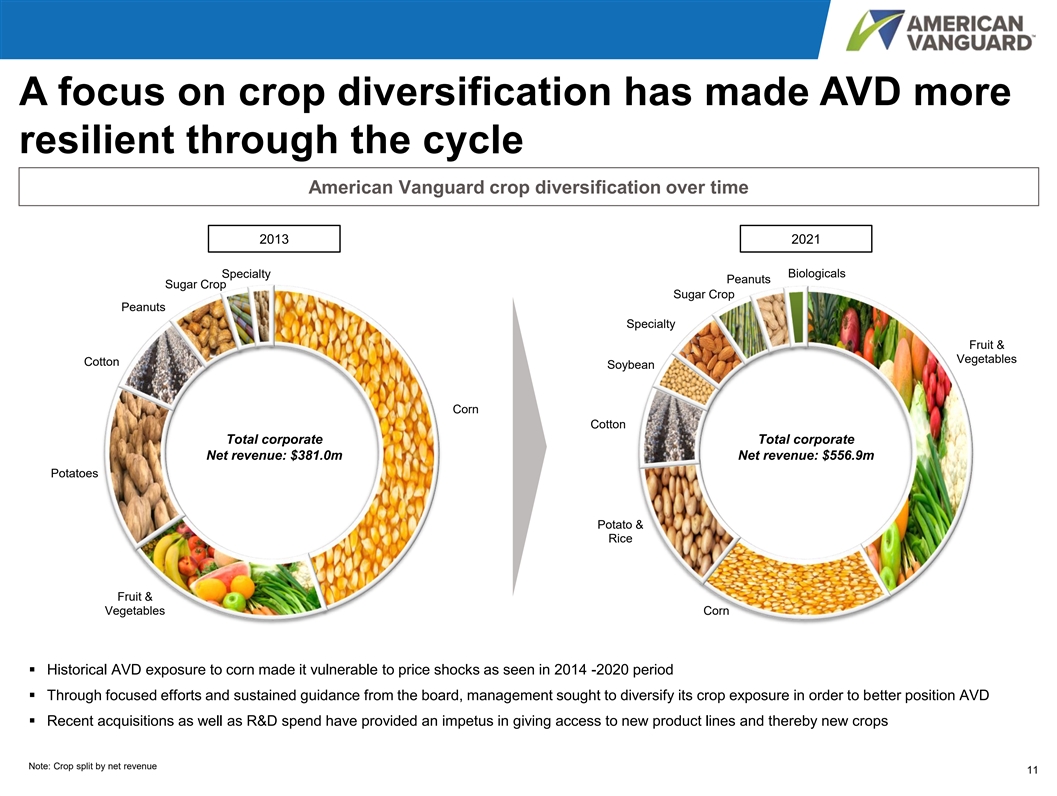
A focus on crop diversification has made AVD more resilient through the cycle American Vanguard crop diversification over time 2013 2021 Biologicals Specialty Peanuts Sugar Crop Sugar Crop Peanuts Specialty Fruit & Vegetables Cotton Soybean Corn Cotton Total corporate Total corporate Net revenue: $381.0m Net revenue: $556.9m Potatoes Potato & Rice Fruit & Vegetables Corn ▪ Historical AVD exposure to corn made it vulnerable to price shocks as seen in 2014 -2020 period ▪ Through focused efforts and sustained guidance from the board, management sought to diversify its crop exposure in order to better position AVD ▪ Recent acquisitions as well as R&D spend have provided an impetus in giving access to new product lines and thereby new crops Note: Crop split by net revenue 11

More diverse geographic footprint enabling greater market access American Vanguard Geographic Positioning Over Time 2012 2021 Non-U.S. 19% Non-U.S. Other 39% Other 10% 12% Latin America 9% Latin America 27% United States 61% United States 81% Total corporate Total corporate Net revenue: $366.2m Net revenue: $556.9m ▪ Historical AVD footprint too levered to the US agricultural market and thus more exposed to specific regional trends ▪ Management sought to expand the geographic profile of AVD in order to: ▪ Provide access to key regions in the context of the agricultural economy (e.g. Latin America) ▪ Mitigate against regulation in the US and increasingly unpredictable weather ▪ Facilitate cross-selling of existing AVD products into new territories ▪ Recent acquisitions have provided a platform for further international expansion Note: Geographic split by net revenue; Latin America includes South America, Central America and Mexico; Other includes Asia, Canada, Australia, Africa, Middle East and Europe 12
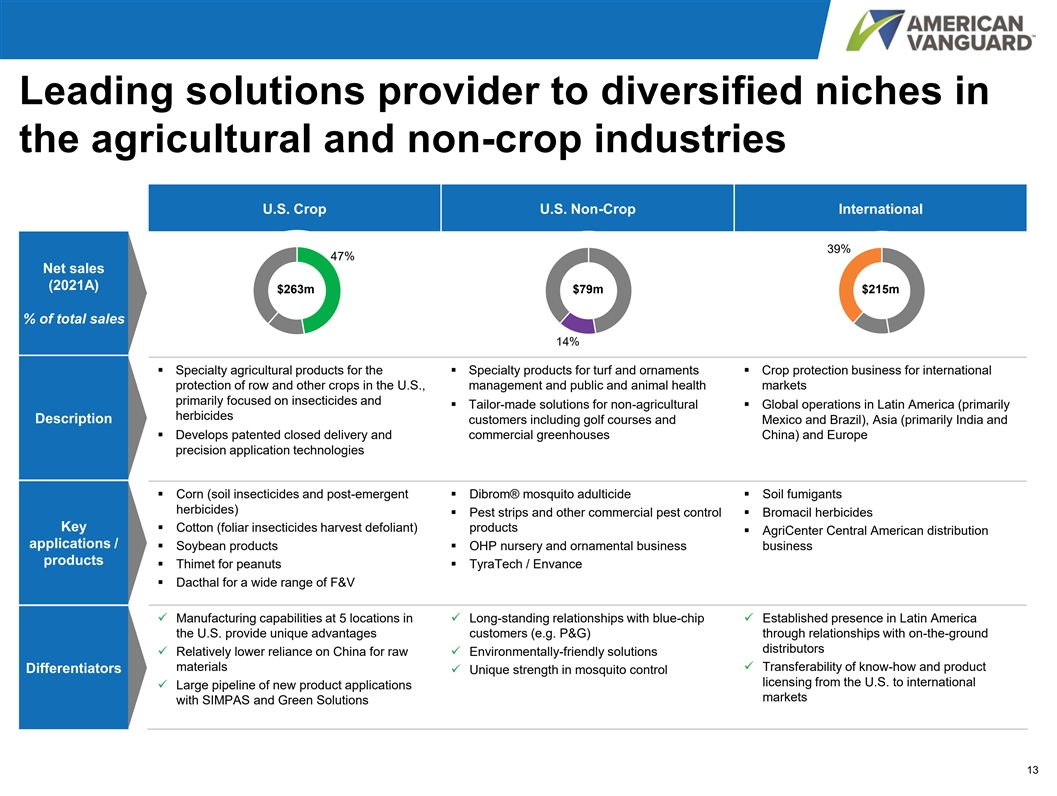
Leading solutions provider to diversified niches in the agricultural and non-crop industries U.S. Crop U.S. Non-Crop International 39% 47% Net sales (2021A) $263m $79m $215m % of total sales 14% ▪ Specialty agricultural products for the ▪ Specialty products for turf and ornaments ▪ Crop protection business for international protection of row and other crops in the U.S., management and public and animal health markets primarily focused on insecticides and ▪ Tailor-made solutions for non-agricultural ▪ Global operations in Latin America (primarily herbicides Description customers including golf courses and Mexico and Brazil), Asia (primarily India and ▪ Develops patented closed delivery and commercial greenhouses China) and Europe precision application technologies ▪ Corn (soil insecticides and post-emergent ▪ Dibrom® mosquito adulticide ▪ Soil fumigants herbicides) ▪ Pest strips and other commercial pest control ▪ Bromacil herbicides Key ▪ Cotton (foliar insecticides harvest defoliant) products ▪ AgriCenter Central American distribution applications / ▪ Soybean products▪ OHP nursery and ornamental business business products ▪ Thimet for peanuts▪ TyraTech / Envance ▪ Dacthal for a wide range of F&V ✓ Manufacturing capabilities at 5 locations in ✓ Long-standing relationships with blue-chip ✓ Established presence in Latin America the U.S. provide unique advantages customers (e.g. P&G) through relationships with on-the-ground distributors ✓ Relatively lower reliance on China for raw ✓ Environmentally-friendly solutions materials✓ Transferability of know-how and product Differentiators ✓ Unique strength in mosquito control licensing from the U.S. to international ✓ Large pipeline of new product applications markets with SIMPAS and Green Solutions 13

Growing Green Solutions Portfolio offering breakthrough technology… 2021 Green Solutions revenue increased to AVD Markets 120+ Green Solutions Globally $40m compared to $22m in 2020 ▪ Driven by a combination of organic growth and the acquisitions of Agrinos and Agnova (2020) Biofertilizers (11) Biostimulants (28) ▪ Net revenue growth of 82% with acquisitions ▪ Microbials to enhance ▪ Seaweed extracts nutrient uptake ▪ Net organic revenue growth of 39% without ▪ Microbials that aid ▪ Nitrogen fixing acquisitions nutrient assimilation bacteria ▪ Organic acids, e.g. ▪ Mobilizers of specific humic and fulvic acids ▪ Latin America and Brazil are key growth geographies nutrients ▪ Excellent momentum in China and India Specialty Biopesticides (32) Other (14) Nutrition (35) ▪ Higher volumes of AMVAC-produced products ▪ Biochemical or ▪ Growing menu of higher margin products Microbial ▪ Essential minerals▪ Solar Protection ▪ Plant Extracts ▪ PGR ▪ Over 100 patents in biologicals▪ Trace elements▪ Adjuvants ▪ Pheromones ▪ Bacteria Note: (#) represents number of solutions 14

…and significant growth prospects $160 Growth Opportunities $140M $140 ▪ R&D pipeline ▪ Licensing & Distribution $120 ▪ SIMPAS channel $100 ▪ M&A $80 ▪ Tolling pipeline $70M $60 Base Business $40M $40 ▪ 2023 – 2025 net revenue CAGR of 20% $20 - 2020 2021 2022 2023 2024 2025 Base Business Growth Opportunities 15 Net revenue ($m)

Game-changing SIMPAS platform gaining meaningful traction ✓ Inkjet Concept ✓ Prescriptive Ag ✓ Higher Yields ✓ Less Pesticide in Field ✓ Less Worker Exposure 16

SIMPAS: U.S. Value Capture Target (4 crops) $120 2022 Commercial SIMPAS $113M Technology Sales ▪ On target to achieve 70 $100 system sales to growers ▪ Sales out pace supply for 2022 $80 2023 SIMPAS Technology Outlook $63M $60 ▪ On track to hit target of 125 systems Commercial Agreements $40 for 2022 $28M ▪ Verdesian – MycroSync $20 IronClad, Aziotic – Envita (Plant N fixing solution), AMVAC = iNvigorate $- 2023 2024 2025 Increase 17 Net revenue ($m)

AVD has executed a carefully considered M&A strategy to further optimize its positioning ▪ In addition to a consistent dividend, AVD has prioritized Country / New product New market Year Target(s) capital allocation towards M&A in situations where a HQ line access highly strategic opportunity exists that offers market 2015 Nemacur, Krovar, Hyvar✓ access and / or a new technology 2015 Scepter / Imazaquin ✓ 2017 The Andersons ✓ ▪ Through seamless and deliberate execution, AVD is now more: 2017 Paraquat, Abamectin, Chlorothalonil ✓ 2017 GESAPAX BRAVO ✓ ▪ Geographically diverse 2017 OHP ✓ ▪ ESG-friendly with a leading bio-solutions platform 2017 AgriCenter ✓ 2018 Quizalofop, Trichlorfon, Bromacil ✓ ▪ More equipped to deploy its proprietary and high growth 2018 TyraTech ✓ SIMPAS technology on an international scale 2019 Defensive and Agrovant ✓ ▪ Relevant to growers with a broader suite of products 2019 Raymat Crop Science ✓ 2019 Classic, First Rate, Python, Hornet ✓ ▪ Better positioned to capitalize on the favorable tailwinds that are currently evident in today’s market 2020 Clean Seed - licensing rights ✓ 2020 AgNova ✓ ▪ Targets acquired at a meaningfully lower trading 2020 Agrinos ✓ multiple (c.7-8x cash / fully burdened EBITDA), thus 2021 Envoke ✓ creating meaningful value for AVD shareholders Note: Table showing publicly available acquisitions and are sorted by year 18

Strong earnings momentum with double-digit earnings growth Q1 2022 Actual 2022 Performance Targets +29% Revenue Growth . . . . . . . . 8% - 11% +41% Gross Profit Margin . . . . . . 38-40% 31% Operating Expenses . . . . . . OPEX as % of Sales (31-33%) $400K vs $950k Interest Expense . . . . . . . . . Similar to 2021 (Down 58%) (a) (a) Debt-to-EBITDA Target . . . <1.0X without Acquisitions 1.3X <2.5X with Acquisitions 224% Net Income . . . . . . . . . . 60 - 70% Increase (a) (a) EBITDA . . . . . . . . . . . . Grow faster than Revenue +65% Outperformed the Ag industry (a) Earnings before interest, taxes, depreciation, amortization and non-cash stock compensation. Adjusted EBITDA is not a financial measure calculated and presented in accordance with U.S. generally accepted accounting principles (GAAP) and should not be considered as an alternative to net income (loss), operating income (loss) or any other financial measures so calculated and presented, nor as an alternative to cash flow from operating activities as a measure of liquidity. We provide these measures because we believe that they provide helpful comparisons to other companies in our industry and peer group. The items excluded from Adjusted EBITDA are detailed in the reconciliation attached to this news release. Other companies (including the Company’s competitors) may define EBITDA differently. Further information with respect to these adjustments can be found in the 19 Company’s earnings release issued March 4, 2022.

$m AVD has a clear vision for the future and well- articulated strategic growth targets AVD’s projected sales evolution $947 $113 $805 $140 $695 $28 $694 $70 $597 2023 2024 2025 Core Business Green Initiatives SIMPAS (a) Performance EBITDA Target 2025: $155m (implied margin of c.16%) (a) Earnings before interest, taxes, depreciation, amortization and non-cash stock compensation. Adjusted EBITDA is not a financial measure calculated and presented in accordance with U.S. generally accepted accounting principles (GAAP) and should not be considered as an alternative to net income (loss), operating income (loss) or any other financial measures so calculated and presented, nor as an alternative to cash flow from operating activities as a measure of liquidity. We provide these measures because we believe that they provide helpful comparisons to other companies in our industry and peer group. The items excluded from Adjusted EBITDA are detailed in the reconciliation attached to this news release. Other companies (including the Company’s competitors) may define EBITDA differently. Further information with respect to these adjustments can be found in the 20 Company’s earnings release issued March 4, 2022.

Section 3 Board has right experience and expertise to lead AVD and capitalize on exceptional opportunities 21

Highly experienced management team and Board of Directors Name, position, Name, position, Experience Experience age, tenure age, tenure ▪ Previously served as EVP at Crompton from 1989-2004▪ Previously served as CEO of RNAgri and was a member of the John Killmer Board of Directors ▪ Also served as the Chairman of Gustafson and CropLife Alfred Ingulli America and was on the Board of PBI / Gordon Lead Independent ▪ Prior to that, he was responsible for Global Marketing, Product Director Director and Supply Chain Management at Arysta LifeSciences ▪ Has over 33 years of experience in the agricultural chemical 80, Since 2010 business with expertise in business finance and operational ▪ Has over 40 years of experience in marketing and product 72, Since 2008 management management including President of Monsanto China ▪ Previously worked as an Independent Consultant for clients ▪ Currently serves on the Board of Bush Brothers & Company such as the USDA’s Foreign Agricultural Service and the FDA’s and NACD Atlanta Chapter Center for Food Safety and Applied Nutrition, among others Debra Edwards Marisol Angelini ▪ Previously served as GM & VP of Global Tea / Water Business ▪ Prior to that, served as Director of the Office of Pesticide Director Director and Chief Marketing Officer at The Coca-Cola Company Programs at the US Environmental Protection Agency ▪ Has over 30 years of experience in the food sector, global 68, Since 2011 60, Since 2021 ▪ Has over 35 years of experience specializing in pesticide management / marketing, new product launching and residue chemistry and human health risk assessment, among governance others ▪ Previously served as Vice President of Environmental, Safety and Health (ESH) at Monsanto▪ Currently a member of the Board of Directors of Skechers USA Emer Gunter Morton Erlich ▪ Prior to that, she served as Director of Manufacturing for Latin ▪ Previously served as Managing Partner of KPMG’s Woodland Director Director America and Asia Pacific at Monsanto Hills office 61, Since 2019 77, Since 2013 ▪ Has over 34 years of experience in manufacturing, international ▪ Has over 34 years of experience in accounting and auditing business operations and ESH ▪ Previously served as Head of Region of Americas, President and CEO of Bayer CropScience USA ▪ Previously served and retired as a litigator for the law firm of ▪ Prior to that, he served in various executive positions including Esmail Zirakparvar Scott Baskin Irell & Manella Head of Portfolio Management at Rhone-Poulenc Agrochemical Director Director▪ Prior to that, he served as assistant instructor at Yale Law and Aventis CropScience School 72, Since 2010 68, Since 2014 ▪ Has over 35 years of experience in product development, ▪ Has 35 years of experience in intellectual property matters project management, agricultural chemical businesses and more 22

Existing Board embodies all of the key competencies to lead AVD forward Board of Directors Essential Competencies Current AVD Board of Directors Cruiser Nominees Eric Alfred Debra Emer Esmail John Marisol Morton Scott Wintemute Ingulli Edwards Gunter Zirakparvar Killmer Angelini Erlich Baskin Tenure (years) 27 11 10 2 11 13 1 8 7 -- Diversity ✓✓✓✓û Sustainable Agriculture ✓✓✓✓✓✓û Marketing in ✓✓✓✓✓û Agricultural space Regulatory expertise ✓✓✓✓✓✓✓✓û Strategy ✓✓✓✓✓✓✓✓ Mergers & acquisitions ✓✓✓✓✓✓✓✓✓ Precision application ✓✓✓✓✓✓✓✓û ESG ✓✓✓✓✓✓✓✓✓û Intellectual ✓✓✓✓✓✓✓✓û Property Supply chain ✓✓✓✓✓✓✓ manufacturing Audit committee ✓û financial expert Denotes directors Cruiser is proposing to replace 23

AVD’s Board benchmarks favorably to peers across several key attributes Contrary to what Cruiser stated, AVD’s average Board compensation was c.7% less than its proxy peers in 2021 (a) AVD’s proxy peers Assessment for AVD Average annual $154 $164 Favorable to benchmark (b) compensation ($000’s) Average tenure (c) 10 / 8 8 In-line with peers (years) Average age 68 62 Broadly in-line with peers (years) Racial diversity 22% 14% Favorable to benchmark (% diverse) Gender diversity 33% 27% Favorable to benchmark (% female) Independence 89% 71% Favorable to benchmark (% independent) Note: Proxy information as of latest filing; Peer group includes AgroFresh, LSB, Intrepid, Quaker, Balchem, Livent, Innospec, Chase, Hawkins, Landec, Trecora and Tredegar (a) Represents FY-20 data of peers where FY-21 data was not available (b) Compensation excludes Eric Wintemute for AVD and all employee directors for the proxy peer group (c) Independent Directors 24 Source: Company filings, press releases, Market data

Alfred Ingulli Chair of the Finance Committee ▪ Since 2015 we closed 16 acquisitions – all of them accretive ▪ Both product line expansion and market access ▪ Robust acquisition process ▪ The most proficient deal company in our space – so we see the deal flow ▪ For every one deal we do, we pass on 10 ▪ Conservative acquisition hurdles ▪ Regularly do a lookback on deals completed in the past 25

John Killmer Lead Director ▪ Lead Director is fully independent ▪ Board agenda - defined by non-management directors ▪ Core strategic issues – one in-depth subject per meeting ▪ Executive session with Chairman/CEO ▪ Full access to management and executive meetings 26
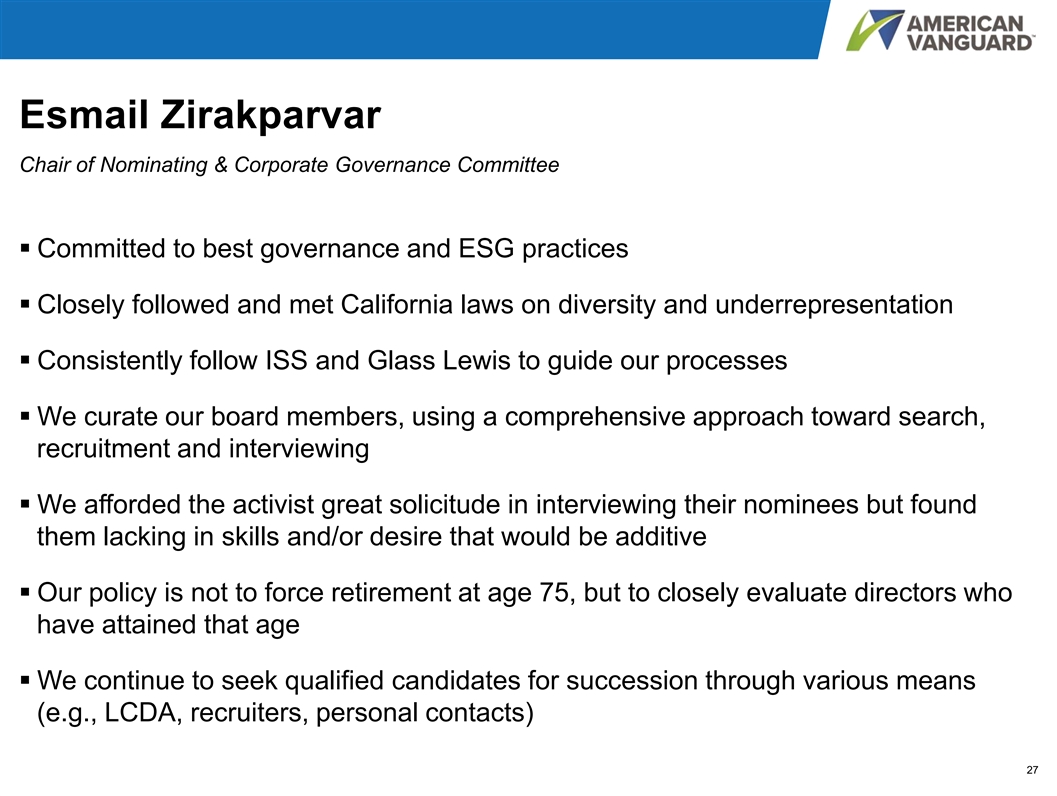
Esmail Zirakparvar Chair of Nominating & Corporate Governance Committee ▪ Committed to best governance and ESG practices ▪ Closely followed and met California laws on diversity and underrepresentation ▪ Consistently follow ISS and Glass Lewis to guide our processes ▪ We curate our board members, using a comprehensive approach toward search, recruitment and interviewing ▪ We afforded the activist great solicitude in interviewing their nominees but found them lacking in skills and/or desire that would be additive ▪ Our policy is not to force retirement at age 75, but to closely evaluate directors who have attained that age ▪ We continue to seek qualified candidates for succession through various means (e.g., LCDA, recruiters, personal contacts) 27

Marisol Angelini Newest Member of the Board ▪ What excited me about joining this Board? ▪ External Factors ▪ Industry Challenges (Regulatory, Complexity, Global Portfolio) ▪ Change with Technology (Environmental, Social, and Governance) ▪ Internal Factors ▪ Vision and Strategy of the Company ▪ Board and Leadership Team ▪ Board Dynamics (Diversity of opinions, Independent Thought, Freedom of Expression) ▪ Learning and Education (Committee Participation and Engagement, On-Boarding) ▪ Selection Process 28

Section 4 Cruiser Capital’s campaign is flawed and contrary to the facts 29

Cruiser Capital’s campaign is flawed and contrary to the facts – Benchmarking American Vanguard (“AVD”) against Specialty Chemicals demonstrates confusion and a lack of understanding of AVD’s fundamental attributes and business drivers Total shareholder return (TSR) – Cruiser portrays a story of TSR underperformance when AVD outperformed several of its Small-Cap Agricultural Inputs peers over the same time period – Cruiser questions returns and suggests implied “core EBITDA contraction” based on a shallow and faulty comparison Capital allocation / – Comparison of EBITDA across a decade neglects inherent earnings volatility and agricultural market headwinds since 2011 M&A – That said, Cruiser acknowledges that AVD is well positioned for the upcycle that materialized in 2022 – which is only possible through the strategic initiatives they questioned – Cruiser is fixated on the “low turnover” of our Board of directors as opposed to focusing on competencies and expertise Lack of turnover at the Board of – Over the years, AVD has been able to attract extraordinarily qualified Board while advancing racial and gender diversity directors – Cruiser Board nominees lack the required competencies and seem less than enthusiastic to join our Board – Cruiser’s narrative on excessive Board compensation and dilutive effect of stock-based compensation is simply equivocate Board and management – In fact, AVD’s average Board compensation and average executive stock-based compensation for FY-21 are c.7% and c.47% compensation lower than its proxy peers, respectively – Cruiser’s proxy background creates a false sense of entrenchment and misrepresents basic facts Board’s lack of – AVD’s engagement with Cruiser has been constructive, robust and fair since the beginning engagement – Our engagement included several meetings with our Chairman and CEO and a thorough interview process of their nominees 30

AVD has performed through market cycles and is optimally positioned for the future AVD has performed admirably in an unprecedented industry down-cycle, particularly relative 1 to other similarly sized agricultural input suppliers Board and management have positioned AVD for near- and long-term outperformance in 2 current upcycle Board has right experience and expertise to lead AVD and capitalize on exceptional 3 opportunities 4 Cruiser Capital’s campaign is flawed and contrary to the facts 31

Appendix Supplemental materials 32

Agricultural market is emerging from a prolonged downcycle Net farmer income in 2021 above 2012 levels for the first time; robust 2022 forecasts will be slightly lower due to raw material inflation $7.51 $6.93 $6.81 $5.78 $5.47 $124 $119 $4.18 $3.88 $3.77 $3.78 $114 $114 $3.70 $3.65 $3.56 $96 $95 $92 $82 $81 $79 $75 $62 2011 2012 2013 2014 2015 2016 2017 2018 2019 2020 2021F 2022F (a) Net farmer Income ($bn) Average Annual Corn Prices ($ / bl) (a) Corn price market date as of 5/9/2022, represents average annual prices for 2011 to 2021 and YTD average prices for 2022 Source: USDA data as of 2/4/2022 33 US net farmer income ($bn)

Commodity prices trading at peak-cycle highs $20 $15.87 $15 $12.91 $10.90 $10.49 $9.40 $10 $7.73 $5.50 $5.42 $5 $4.15 $- 2010 2011 2013 2014 2016 2017 2019 2020 2022 2023 2025 Corn Soybean Wheat Future corn Future soy Future wheat Note: Market date as of 5/9/2022 Source: Market data 34 Price ($ / bl)

Evolution of global crop protection industry 3.6% $70.0 1.9% $68.0 $65.6 $65.0 $61.9 $60.8 $60.0 $59.3 $58.9 $58.2 $56.9 $56.4 $55.9 $54.8 $55.0 $50.0 $45.0 $40.0 2012A 2013A 2014A 2015A 2016A 2017A 2018A 2019A 2020A 2024F 2025F Source: AgbioInvestor 35 Global crop proection market size ($bn)

Despite the down-turn post-2013, AVD has meaningfully expanded the top-line and out-grown the industry Net Revenue Performance Since 2012A Management net $650.0 revenue growth guidance: 8-11% Global crop protection industry has only $61.9 grown 1.3% p.a. since 2012 $60.8 $600.0 $59.3 $58.9 $58.2 $556.9 $56.9 $56.4 $550.0 $55.9 $54.8 $500.0 $468.2 $458.7 $454.3 $450.0 $400.0 $381.0 $366.2 $355.0 $350.0 $312.1 $298.6 $300.0 $289.4 $250.0 $200.0 2012A 2013A 2014A 2015A 2016A 2017A 2018A 2019A 2020A 2021A 2022E AVD net revenue ($m) Global crop protection market size ($bn) Source: Market data, AgBioInvestor 36 $m

Earnings have re-gained momentum following numerous (largely uncontrollable) challenges (a) EBITDA Performance Since 2012A 2021 – 2022: Ag-cycle $100.0 recovery; strategic initiatives (e.g. 2019: Sector SIMPAS, Green 20.7% impacted by tariffs, 2020: COVID-19 $90.0 Solutions) beginning 19.6% supply chain issues pandemic results to take hold and challenging in unique supply / weather in North demand $80.0 America disruptions $75.8 $74.7 13.8% 13.5% 13.3% Double- $70.0 digit growth 11.4% 10.4% 10.3% 10.2% 9.9% $61.1 $60.0 $56.8 2013 – 2018: Broader industry down-turn; margins $48.8 $48.6 $50.0 $47.5 impacted by weaker operating leverage $41.5 $40.0 $32.9 $29.6 $30.0 $20.0 $10.0 $0.0 2012A 2013A 2014A 2015A 2016A 2017A 2018A 2019A 2020A 2021A 2022E (a) (a) AVD EBITDA ($m) % EBITDA margin (a) Earnings before interest, taxes, depreciation, amortization and non-cash stock compensation. Adjusted EBITDA is not a financial measure calculated and presented in accordance with U.S. generally accepted accounting principles (GAAP) and should not be considered as an alternative to net income (loss), operating income (loss) or any other financial measures so calculated and presented, nor as an alternative to cash flow from operating activities as a measure of liquidity. We provide these measures because we believe that they provide helpful comparisons to other companies in our industry and peer group. The items excluded from Adjusted EBITDA are 37 detailed in the reconciliation attached to this news release. Other companies (including the Company’s competitors) may define EBITDA differently. Further information with respect to these adjustments can be found in the Company’s earnings release issued March 4, 2022. $m
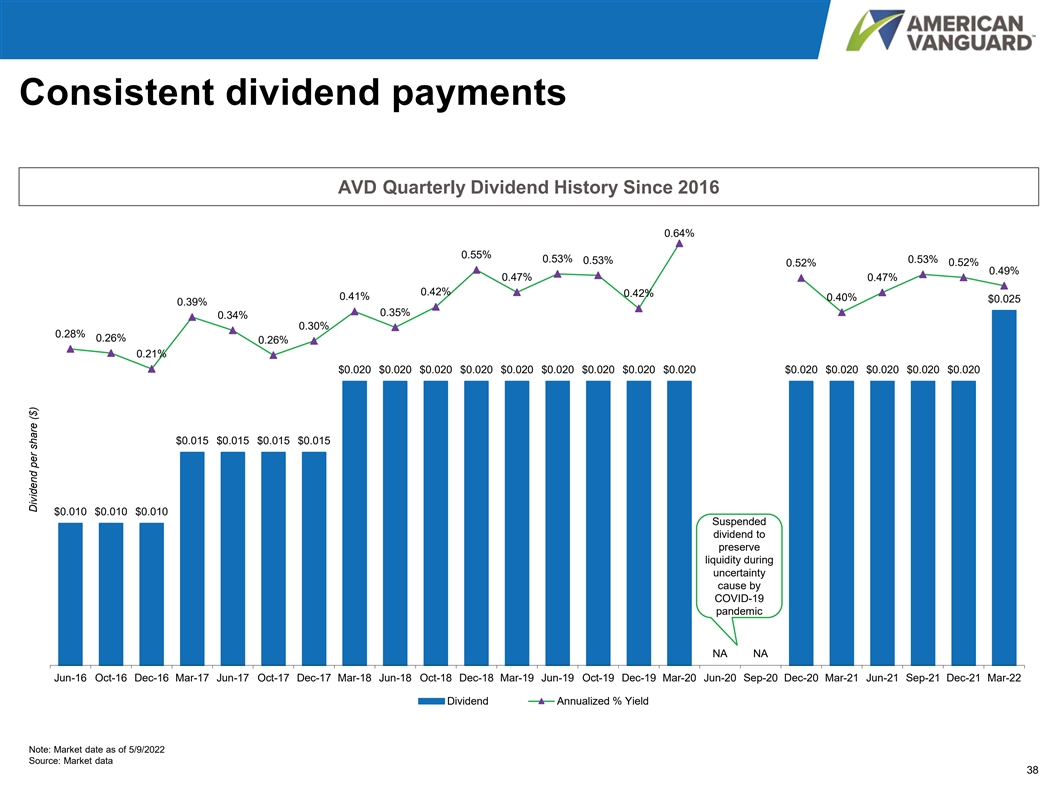
Consistent dividend payments AVD Quarterly Dividend History Since 2016 0.64% 0.55% 0.53% 0.53% 0.53% 0.52% 0.52% 0.49% 0.47% 0.47% 0.42% 0.42% 0.41% 0.40% $0.025 0.39% 0.35% 0.34% 0.30% 0.28% 0.26% 0.26% 0.21% $0.020 $0.020 $0.020 $0.020 $0.020 $0.020 $0.020 $0.020 $0.020 $0.020 $0.020 $0.020 $0.020 $0.020 $0.015 $0.015 $0.015 $0.015 $0.010 $0.010 $0.010 Suspended dividend to preserve liquidity during uncertainty cause by COVID-19 pandemic NA NA Jun-16 Oct-16 Dec-16 Mar-17 Jun-17 Oct-17 Dec-17 Mar-18 Jun-18 Oct-18 Dec-18 Mar-19 Jun-19 Oct-19 Dec-19 Mar-20 Jun-20 Sep-20 Dec-20 Mar-21 Jun-21 Sep-21 Dec-21 Mar-22 Dividend Annualized % Yield Note: Market date as of 5/9/2022 Source: Market data 38 Dividend per share ($)

Game-changing SIMPAS platform gaining meaningful traction SIMPAS Ecosystem Overview 1 Features application equipment based on Agronomist SmartCartridges which are used in conjunction with Field 8 Review 2 field prescriptions As-Applied Data Shape-File Streamed Generation from Field Allows for targeted prescriptive product applications, with the unused product remaining in the SmartCartridges being fully returnable 7 3 SaS Retail Provides an advantage to the grower whereby Field Agent Prescription they will only pay for the actual amount of Invoices Loaded Farmer prescriptively applied product Entered into a strategic collaboration with the 6 4 US-based digital agriculture company, Trimble Learning Report Blocks Generated Created 5 Agent & Following the initial launch in the US, the intent Prescription Linked is to broaden the retail and refilling infrastructure internationally 39
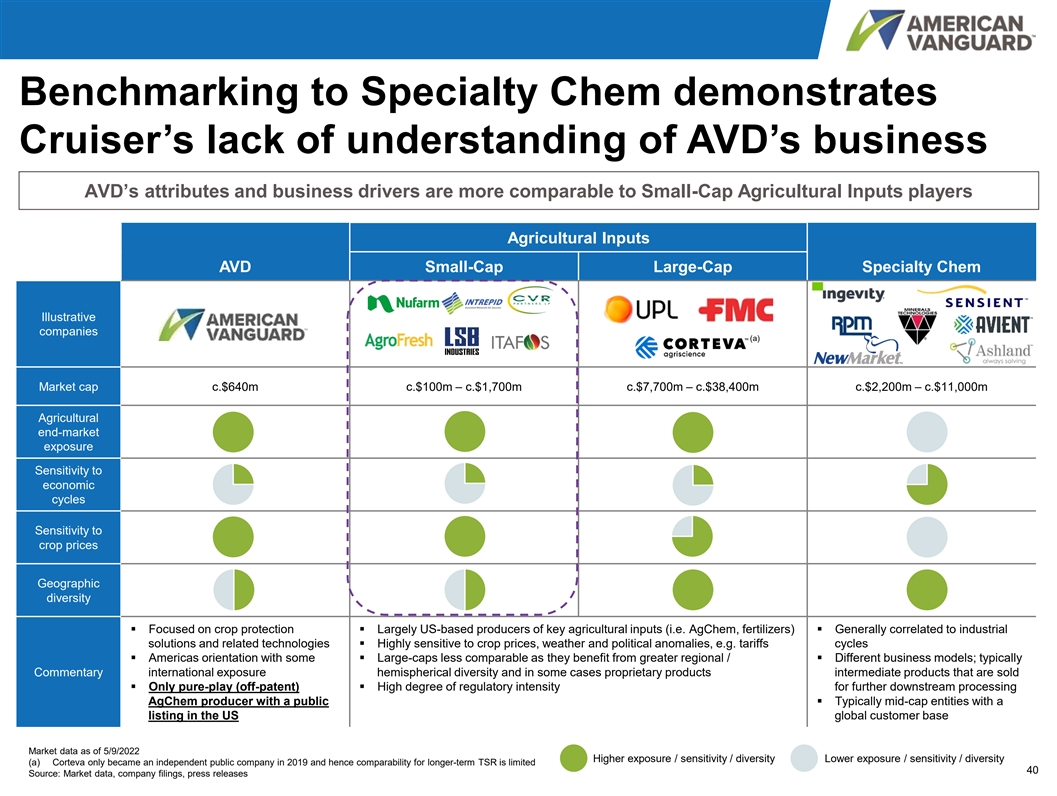
Benchmarking to Specialty Chem demonstrates Cruiser’s lack of understanding of AVD’s business AVD’s attributes and business drivers are more comparable to Small-Cap Agricultural Inputs players Agricultural Inputs AVD Small-Cap Large-Cap Specialty Chem Illustrative companies (a) Market cap c.$640m c.$100m – c.$1,700m c.$7,700m – c.$38,400m c.$2,200m – c.$11,000m Agricultural end-market exposure Sensitivity to economic cycles Sensitivity to crop prices Geographic diversity ▪ Focused on crop protection ▪ Largely US-based producers of key agricultural inputs (i.e. AgChem, fertilizers)▪ Generally correlated to industrial solutions and related technologies▪ Highly sensitive to crop prices, weather and political anomalies, e.g. tariffs cycles ▪ Americas orientation with some ▪ Large-caps less comparable as they benefit from greater regional / ▪ Different business models; typically Commentary international exposure hemispherical diversity and in some cases proprietary products intermediate products that are sold ▪ Only pure-play (off-patent) ▪ High degree of regulatory intensity for further downstream processing AgChem producer with a public ▪ Typically mid-cap entities with a listing in the US global customer base Market data as of 5/9/2022 Higher exposure / sensitivity / diversity Lower exposure / sensitivity / diversity (a) Corteva only became an independent public company in 2019 and hence comparability for longer-term TSR is limited 40 Source: Market data, company filings, press releases
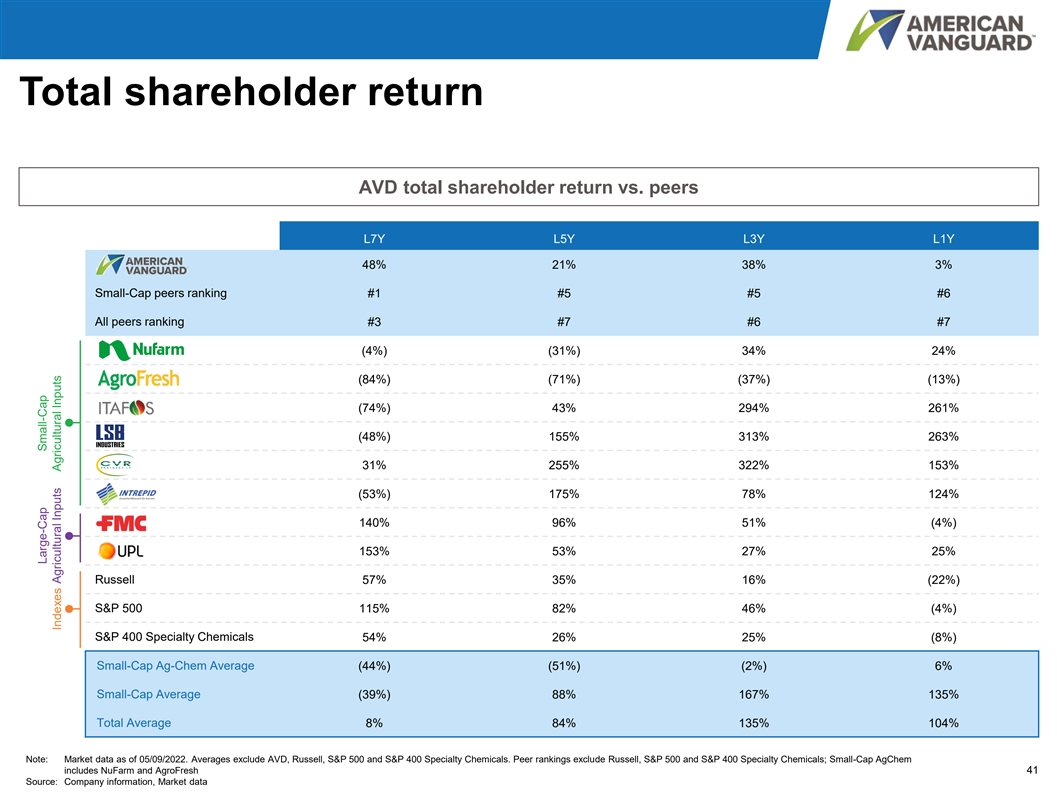
Total shareholder return AVD total shareholder return vs. peers L7Y L5Y L3Y L1Y 48% 21% 38% 3% Small-Cap peers ranking #1 #5 #5 #6 All peers ranking #3 #7 #6 #7 (4%) (31%) 34% 24% (84%) (71%) (37%) (13%) (74%) 43% 294% 261% (48%) 155% 313% 263% 31% 255% 322% 153% (53%) 175% 78% 124% 140% 96% 51% (4%) 153% 53% 27% 25% Russell 57% 35% 16% (22%) S&P 500 115% 82% 46% (4%) S&P 400 Specialty Chemicals 54% 26% 25% (8%) Small-Cap Ag-Chem Average (44%) (51%) (2%) 6% Small-Cap Average (39%) 88% 167% 135% Total Average 8% 84% 135% 104% Note: Market data as of 05/09/2022. Averages exclude AVD, Russell, S&P 500 and S&P 400 Specialty Chemicals. Peer rankings exclude Russell, S&P 500 and S&P 400 Specialty Chemicals; Small-Cap AgChem includes NuFarm and AgroFresh 41 Source: Company information, Market data Large-Cap Small-Cap Indexes Agricultural Inputs Agricultural Inputs

AVD’s management incentives aligned with business performance and shareholder returns AVD’s stock-based compensation c.47% below proxy peer average (a) Average executive stock-based compensation ($000's) ▪ Cash bonuses are tied to achieving the interests $1,882 of stockholders $1,186 ▪ Cash bonus is “at risk” and varies from year to year depending upon many factors in order to $1,131 reward executives’ individual contributions towards company performance $909 ▪ Equity incentives tightly align interests $893 ▪ Includes time-based and performance-based equity awards and holding requirements that give $835 executives a longer-term view of the Company’s financial performance $725 ▪ Tied to growing shareholder value $513 ▪ Based primarily upon objective performance $402 targets such as net sales, net income, EBITDA and SMART goals $305 ▪ Attract, motivate and retain top talent to lead AVD $235 ▪ Ensures that NEOs are paid for performance and $227 includes incentives for retaining key employees for the purpose of building long term stockholder Peer Average: $752 $178 value Note: Represents average stock-based compensation of current executives (a) Represents FY-20 data of peers where FY-21 data was not available 42 Source: Company filings, press releases, Market data
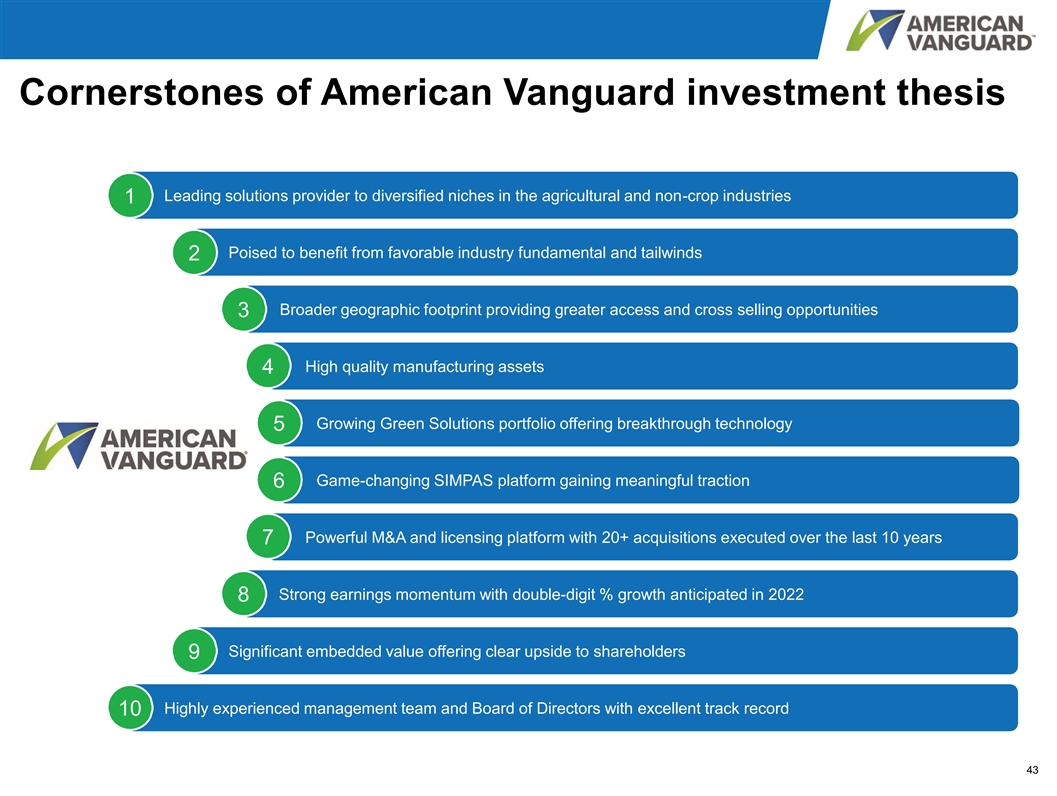
Cornerstones of American Vanguard investment thesis Leading solutions provider to diversified niches in the agricultural and non-crop industries 1 Poised to benefit from favorable industry fundamental and tailwinds 2 Broader geographic footprint providing greater access and cross selling opportunities 3 High quality manufacturing assets 4 Growing Green Solutions portfolio offering breakthrough technology 5 Game-changing SIMPAS platform gaining meaningful traction 6 Powerful M&A and licensing platform with 20+ acquisitions executed over the last 10 years 7 Strong earnings momentum with double-digit % growth anticipated in 2022 8 Significant embedded value offering clear upside to shareholders 9 Highly experienced management team and Board of Directors with excellent track record 10 43

Reconciliation of Net income to EBITDA ($m, 12/31 FYE) 2012 2013 2014 2015 2016 2017 2018 2019 2020 2021 Net income attributable $36.9 $34.4 $4.8 $6.6 $12.8 $20.3 $24.2 $13.6 $15.2 $18.6 to American Vanguard Provision for income $20.0 $18.9 ($0.5) $2.0 $5.5 $4.4 $9.1 $5.2 $3.1 $8.2 taxes Interest expense, net $2.5 $1.9 $3.1 $2.6 $1.6 $1.9 $4.0 $7.2 $5.2 $3.7 Depreciation and $16.4 $19.4 $22.1 $21.7 $21.5 $22.2 $23.8 $22.6 $24.0 $26.4 amortization (a) EBITDA $75.8 $74.7 $29.6 $32.9 $41.5 $48.8 $61.1 $48.6 $47.5 $56.8 (a) Earnings before interest, taxes, depreciation, amortization and non-cash stock compensation. Adjusted EBITDA is not a financial measure calculated and presented in accordance with U.S. generally accepted accounting principles (GAAP) and should not be considered as an alternative to net income (loss), operating income (loss) or any other financial measures so calculated and presented, nor as an alternative to cash flow from operating activities as a measure of liquidity. We provide these measures because we believe that they provide helpful comparisons to other companies in our industry and peer group. The items excluded from Adjusted EBITDA are detailed in the reconciliation attached to this news release. Other companies (including the Company’s competitors) may define EBITDA differently. Further information with respect to these adjustments can be found in the 44 Company’s earnings release issued March 4, 2022.
Create E-mail Alert Related Categories
SEC FilingsRelated Entities
VanguardSign up for StreetInsider Free!
Receive full access to all new and archived articles, unlimited portfolio tracking, e-mail alerts, custom newswires and RSS feeds - and more!
