

Form 8-K ZIONS BANCORPORATION, For: Oct 18
 Tweet
Tweet Share
Share| Zions Bancorporation, N.A. One South Main Salt Lake City, UT 84133 October 18, 2021 |  | ||||
| www.zionsbancorporation.com | |||||
Third Quarter 2021 Financial Results: FOR IMMEDIATE RELEASE
Investor and Media Contact: James Abbott (801) 844-7637
| Zions Bancorporation, N.A. reports: 3Q21 Net Earnings of $234 million, diluted EPS of $1.45 | ||
| compared with 3Q20 Net Earnings of $167 million, diluted EPS of $1.01, and 2Q21 Net Earnings of $345 million, diluted EPS of $2.08 | ||
THIRD QUARTER RESULTS
| $1.45 | $234 million | 2.68% | 10.9% | |||||||||||||||||
Net earnings per diluted common share | Net Earnings | Net interest margin (“NIM”) | Common Equity Tier 1 | |||||||||||||||||
| THIRD QUARTER HIGHLIGHTS¹ | ||||||||
| Net Interest Income and NIM | • | Net interest income remained stable at $555 million | ||||||
• | NIM was 2.68%, compared with 3.06%, and continued to be significantly impacted by low interest rates and higher average money market balances of $12.7 billion, compared with $3.1 billion | |||||||
| Operating Performance | • | Pre-provision net revenue ("PPNR") was $272 million, down 2%, and adjusted PPNR² was $290 million, up 9% | ||||||
• | Noninterest expense was $429 million, down 3%, and adjusted noninterest expense² was $432 million, down 2% | |||||||
• | The efficiency ratio² was 59.8%, compared with 62.2% | |||||||
| Loans and Credit Quality | • | Loans and leases were $50.7 billion, down $4.1 billion, or 7%; excluding PPP, loans and leases were $47.6 billion, down $0.3 billion, or 1% | ||||||
• | Nonperforming assets3 were $324 million, or 0.7%, of loans (ex-PPP), compared with $372 million, or 0.8%, of loans (ex-PPP) | |||||||
• | The provision for credit losses was a negative $46 million, compared with a positive $55 million | |||||||
• | The allowance for credit losses was 1.1% of loans (ex-PPP), compared with 1.9% of loans (ex-PPP) | |||||||
| Capital | • | The CET1 capital ratio was 10.9%, compared with 10.4% | ||||||
• | Common stock repurchases of $325 million, 5.8 million shares, or 3.6% of shares outstanding as of June 30, 2021 | |||||||
| Notable items | • | Net unrealized loss related to SBIC investment in Recursion Pharmaceuticals, Inc. of $24 million ($28 million fair value adjustment less $4 million reversal of an accrued success fee), compared with a net unrealized gain of $54 million ($63 million fair value adjustment less $9 million success fee accrual) in second quarter of 2021 | ||||||
• | About 19,000 PPP loans were forgiven by the SBA, totaling $1.5 billion, which contributed $41 million of interest income through accelerated recognition of net unamortized deferred fees | |||||||
• | Deposits were $77.9 billion, up $10.8 billion, or 16%, resulting in a loan-to-deposit ratio of 65% | |||||||
| CEO COMMENTARY | ||
Harris H. Simmons, Chairman and CEO of Zions Bancorporation, commented, “We are pleased with the quarter’s financial results. Following several quarters of weak loan demand, we’re particularly encouraged by the loan growth we reported during the quarter, which, excluding PPP loans, was 5.6% on an annualized basis. We also reported continued strong deposit growth at an annualized pace of 9.3%. Credit outcomes remained strong, with net recoveries at an annualized 0.01% of total loans, and one of the lowest gross charge-off rates in a number of years. These positive outcomes, together with an improving economic outlook, produced a $46 million reversal of loss reserves into income.” Mr. Simmons continued, “We’re optimistic that, despite lingering supply chain issues and a tight labor market, the economy seems poised for continued growth over the next several quarters as, thanks to a great deal of government stimulus, consumers and most businesses are emerging from the pandemic in relatively strong condition.” | ||
OPERATING PERFORMANCE3 | ||
1 Comparisons noted in the bullet points are calculated for the current quarter versus the same prior-year period, unless otherwise specified.
2 Adjusted PPNR for the third quarter of 2020 included a one-time $30 million charitable contribution, and when excluded, PPNR was $307 million and adjusted PPNR was $297 million. For information on non-GAAP financial measures, see pages 15-17.
3 Does not include banking premises held for sale.
4 EPS calculations assume a 24.5% statutory tax rate.
ZIONS BANCORPORATION, N.A.
Press Release – Page 2
October 18, 2021
Comparisons noted in the sections below are calculated for the current quarter versus the same prior-year period, unless otherwise specified. Growth rates of 100% or more are considered not meaningful (“NM”) as they are generally reflective of a low initial starting point.
RESULTS OF OPERATIONS
Net Interest Income and Margin | |||||||||||||||||||||||||||||||||||||||||
| 3Q21 - 2Q21 | 3Q21 - 3Q20 | ||||||||||||||||||||||||||||||||||||||||
| (In millions) | 3Q21 | 2Q21 | 3Q20 | $ | % | $ | % | ||||||||||||||||||||||||||||||||||
| Interest and fees on loans | $ | 484 | $ | 492 | $ | 505 | $ | (8) | (2) | % | $ | (21) | (4) | % | |||||||||||||||||||||||||||
| Interest on money market investments | 7 | 4 | 2 | 3 | 75 | 5 | NM | ||||||||||||||||||||||||||||||||||
| Interest on securities | 78 | 74 | 74 | 4 | 5 | 4 | 5 | ||||||||||||||||||||||||||||||||||
Total interest income | 569 | 570 | 581 | (1) | — | (12) | (2) | ||||||||||||||||||||||||||||||||||
| Interest on deposits | 7 | 7 | 18 | — | — | (11) | (61) | ||||||||||||||||||||||||||||||||||
| Interest on short- and long-term borrowings | 7 | 8 | 8 | (1) | (13) | (1) | (13) | ||||||||||||||||||||||||||||||||||
Total interest expense | 14 | 15 | 26 | (1) | (7) | (12) | (46) | ||||||||||||||||||||||||||||||||||
Net interest income | $ | 555 | $ | 555 | $ | 555 | $ | — | — | $ | — | — | |||||||||||||||||||||||||||||
| bps | bps | ||||||||||||||||||||||||||||||||||||||||
Yield on interest-earning assets1 | 2.75 | % | 2.86 | % | 3.20 | % | (11) | (45) | |||||||||||||||||||||||||||||||||
Rate paid on total deposits and interest-bearing liabilities1 | 0.07 | % | 0.08 | % | 0.15 | % | (1) | (8) | |||||||||||||||||||||||||||||||||
Cost of total deposits1 | 0.03 | % | 0.04 | % | 0.11 | % | (1) | (8) | |||||||||||||||||||||||||||||||||
Net interest margin1 | 2.68 | % | 2.79 | % | 3.06 | % | (11) | (38) | |||||||||||||||||||||||||||||||||
1 Rates are calculated using amounts in thousands and taxable-equivalent rates are used where applicable.
Net interest income remained stable at $555 million in the third quarter of 2021. Total interest income decreased $12 million, or 2%, primarily due to a $21 million decrease in interest and fees on loans, partially offset by a $5 million increase in interest on money market investments, and a $4 million increase in interest on securities. The decrease in total interest income was primarily attributable to the low interest rate environment. Interest expense decreased $12 million, or 46%, largely due to an $11 million decline in interest paid on deposits, which was also attributable to low interest rates.
The net interest margin was 2.68%, compared with 3.06% in the same prior year period. The yield on average interest-earning assets was 2.75% in the third quarter of 2021, a decrease of 45 basis points, compared with the same prior year quarter. Average money market investments, including short-term deposits held at the Federal Reserve, increased to 15.3% of average interest-earning assets, compared with 4.3% in the same prior year period. This increase had a significant dilutive effect on the net interest margin.
Average interest-earning assets included $3.8 billion of Small Business Administration (“SBA”) Paycheck Protection Program (“PPP”). During the third quarter of 2021, about 19,000 PPP loans, totaling $1.5 billion, received forgiveness by the SBA. Total interest income from PPP loans was $63 million during the third quarter of 2021, of which, $41 million was related to accelerated recognition of net unamortized deferred fees on these loans due to forgiveness. At September 30, 2021, unamortized net origination fees related to the PPP loans totaled approximately $83 million.
The yield on loans increased 14 basis points from the third quarter of 2020, primarily due to accelerated amortization of deferred fees on forgiven PPP loans. Excluding PPP loans, the yield on loans decreased 18 basis points from the third quarter of 2020. The yield on non-PPP loans originated during the third quarter of 2021 was moderately less than the yield on loans maturing or otherwise paying down. The yield on securities decreased 41 basis points from the third quarter of 2020, primarily due to lower yields on re-investment of principal payments and other purchases throughout the previous four quarters.
- more -
ZIONS BANCORPORATION, N.A.
Press Release – Page 3
October 18, 2021
The annualized cost of total deposits for the third quarter of 2021 was 0.03%, compared with 0.11% for the third quarter of 2020. The rate paid on total deposits and interest-bearing liabilities was 0.07%, a decrease from 0.15% during the third quarter of 2020, which was primarily due to low deposit rates and strong noninterest bearing deposit growth. Average noninterest bearing deposits as a percentage of total deposits were 50% for the third quarter of 2021, compared with 46% for the same prior year period.
Noninterest Income | |||||||||||||||||||||||||||||||||||||||||
| 3Q21 - 2Q21 | 3Q21 - 3Q20 | ||||||||||||||||||||||||||||||||||||||||
| (In millions) | 3Q21 | 2Q21 | 3Q20 | $ | % | $ | % | ||||||||||||||||||||||||||||||||||
| Commercial account fees | $ | 34 | $ | 34 | $ | 32 | $ | — | — | % | $ | 2 | 6 | % | |||||||||||||||||||||||||||
| Card fees | 25 | 24 | 21 | 1 | 4 | 4 | 19 | ||||||||||||||||||||||||||||||||||
| Retail and business banking fees | 20 | 18 | 17 | 2 | 11 | 3 | 18 | ||||||||||||||||||||||||||||||||||
| Loan-related fees and income | 27 | 21 | 32 | 6 | 29 | (5) | (16) | ||||||||||||||||||||||||||||||||||
| Capital markets and foreign exchange fees | 17 | 17 | 16 | — | — | 1 | 6 | ||||||||||||||||||||||||||||||||||
| Wealth management fees | 13 | 12 | 10 | 1 | 8 | 3 | 30 | ||||||||||||||||||||||||||||||||||
| Other customer-related fees | 15 | 13 | 11 | 2 | 15 | 4 | 36 | ||||||||||||||||||||||||||||||||||
Customer-related fees | 151 | 139 | 139 | 12 | 9 | 12 | 9 | ||||||||||||||||||||||||||||||||||
| Fair value and nonhedge derivative income (loss) | 2 | (5) | 8 | 7 | NM | (6) | (75) | ||||||||||||||||||||||||||||||||||
| Dividends and other income | 9 | 8 | 6 | 1 | 13 | 3 | 50 | ||||||||||||||||||||||||||||||||||
| Securities gains (losses), net | (23) | 63 | 4 | (86) | NM | (27) | NM | ||||||||||||||||||||||||||||||||||
Total noninterest income | $ | 139 | $ | 205 | $ | 157 | $ | (66) | (32) | $ | (18) | (11) | |||||||||||||||||||||||||||||
Total customer-related fees increased $12 million to $151 million from the prior year quarter, primarily due to improved customer transaction volume, new client activity, and deepening of existing client relationships. Loan-related fees and income decreased $5 million, primarily due to a decline in our residential mortgage originations held for sale.
Securities gains and losses decreased $27 million from the third quarter of 2020, largely as a result of a $28 million unrealized loss (compared with a $63 million unrealized gain in the second quarter of 2021) relating to our SBIC investment in Recursion Pharmaceuticals, Inc. This investment will continue to be marked-to-market until the SBIC fund manager divests of the shares, which are subject to a minimum 180-day lock-up period from the initial offering in April 2021. During the second quarter of 2021, we accrued an associated success fee of $9 million in other noninterest expense, and reversed $4 million of this accrual during the current quarter based on the fair value of the investment.
We recognized a $2 million gain related to a credit valuation adjustment (“CVA”) on client-related interest rate swaps, compared with a $8 million CVA gain in the third quarter of 2020. The CVA gain for the current quarter was primarily due to improvements in the credit quality of our clients with interest rate swaps, as well as changes in interest rates, which decreased the value of, and our credit exposure to, the client-related interest rate swaps.
- more -
ZIONS BANCORPORATION, N.A.
Press Release – Page 4
October 18, 2021
Noninterest Expense | |||||||||||||||||||||||||||||||||||||||||
| 3Q21 - 2Q21 | 3Q21 - 3Q20 | ||||||||||||||||||||||||||||||||||||||||
| (In millions) | 3Q21 | 2Q21 | 3Q20 | $ | % | $ | % | ||||||||||||||||||||||||||||||||||
| Salaries and employee benefits | $ | 285 | $ | 272 | $ | 269 | $ | 13 | 5 | % | $ | 16 | 6 | % | |||||||||||||||||||||||||||
| Occupancy, net | 33 | 33 | 33 | — | — | — | — | ||||||||||||||||||||||||||||||||||
| Furniture, equipment and software, net | 31 | 32 | 32 | (1) | (3) | (1) | (3) | ||||||||||||||||||||||||||||||||||
| Other real estate expense, net | — | — | — | — | — | — | — | ||||||||||||||||||||||||||||||||||
| Credit-related expense | 7 | 6 | 6 | 1 | 17 | 1 | 17 | ||||||||||||||||||||||||||||||||||
| Professional and legal services | 16 | 17 | 12 | (1) | (6) | 4 | 33 | ||||||||||||||||||||||||||||||||||
| Advertising | 4 | 4 | 7 | — | — | (3) | (43) | ||||||||||||||||||||||||||||||||||
| FDIC premiums | 5 | 6 | 7 | (1) | (17) | (2) | (29) | ||||||||||||||||||||||||||||||||||
| Other | 48 | 58 | 76 | (10) | (17) | (28) | (37) | ||||||||||||||||||||||||||||||||||
Total noninterest expense | $ | 429 | $ | 428 | $ | 442 | $ | 1 | — | $ | (13) | (3) | |||||||||||||||||||||||||||||
Adjusted noninterest expense 1 | $ | 432 | $ | 419 | $ | 440 | $ | 13 | 3 | $ | (8) | (2) | |||||||||||||||||||||||||||||
1 For information on non-GAAP financial measures, see pages 15-17.
Noninterest expense declined $13 million, when compared with the third quarter of 2020. The decline was largely attributable to a $28 million decrease in other noninterest expense that was primarily due to a $30 million donation to our charitable foundation during the third quarter of 2020, which was related to the origination fees earned on PPP loans. Salaries and benefits expense increased $16 million, or 6%, primarily due to higher incentive compensation and profit sharing as a result of improved profitability. Professional and legal services expense increased $4 million, or 33%, mainly due to various technology-related and other outsourced services.
Adjusted noninterest expense decreased $8 million, or 2%, to $432 million, compared with $440 million for the same prior year quarter, primarily due to the decrease in other noninterest expense previously discussed. The efficiency ratio was 59.8%, compared with 62.2% for the third quarter of 2020. For information on non-GAAP financial measures, including differences between noninterest expense and adjusted noninterest expense, see pages 15-17.
BALANCE SHEET ANALYSIS
Asset Quality | |||||||||||||||||||||||||||||||||||||||||
| 3Q21 - 2Q21 | 3Q21 - 3Q20 | ||||||||||||||||||||||||||||||||||||||||
| (In millions) | 3Q21 | 2Q21 | 3Q20 | bps | bps | ||||||||||||||||||||||||||||||||||||
Ratio of nonperforming assets1 to loans and leases and other real estate owned | 0.64 | % | 0.60 | % | 0.68 | % | 4 | (4) | |||||||||||||||||||||||||||||||||
Annualized ratio of net loan and lease charge-offs to average loans | (0.01) | % | (0.02) | % | 0.38 | % | 1 | (39) | |||||||||||||||||||||||||||||||||
Ratio of total allowance for credit losses to loans1 and leases outstanding, at period end | 1.04 | % | 1.12 | % | 1.68 | % | (8) | (64) | |||||||||||||||||||||||||||||||||
Ratio of total allowance for credit losses to loans1 and leases outstanding (excluding PPP loans), at period end | 1.11 | % | 1.22 | % | 1.91 | % | (11) | (80) | |||||||||||||||||||||||||||||||||
| $ | % | $ | % | ||||||||||||||||||||||||||||||||||||||
| Classified loans | $ | 1,397 | $ | 1,557 | $ | 1,639 | $ | (160) | (10)% | $ | (242) | (15)% | |||||||||||||||||||||||||||||
Nonperforming assets2 | 324 | 308 | 372 | 16 | 5 | (48) | (13) | ||||||||||||||||||||||||||||||||||
| Net loan and lease charge-offs (recoveries) | (1) | (2) | 52 | 1 | 50 | (53) | NM | ||||||||||||||||||||||||||||||||||
| Provision for credit losses | (46) | (123) | 55 | 77 | 63 | (101) | NM | ||||||||||||||||||||||||||||||||||
1 Does not include loans held for sale.
2 Does not include banking premises held for sale.
- more -
ZIONS BANCORPORATION, N.A.
Press Release – Page 5
October 18, 2021
Net loan and lease recoveries were $1 million in the third quarter of 2021, compared with net charge-offs of $52 million in the prior year quarter. The ratio of nonaccrual loans and accruing loans past due 90 days or more to loans and leases (ex-PPP) was 0.69%, compared with 0.78% for the third quarter of 2020, and the ratio of classified loans to total loans and leases (ex-PPP) was 2.9%, compared with 3.4%, for the prior year quarter.
We recorded a negative $46 million provision for credit losses, compared with a positive $55 million provision for the third quarter of 2020. The allowance for credit losses (“ACL”) was $529 million at September 30, 2021, compared with $917 million at September 30, 2020. The decrease in the ACL was due largely to improvements in economic forecasts and credit quality, compared with the economic stress caused by the COVID-19 pandemic in the prior year period. The ratio of total ACL to total loans and leases (ex-PPP) was 1.11% at September 30, 2021, compared with 1.91% at September 30, 2020.
Loans and Leases | |||||||||||||||||||||||||||||||||||||||||
| 3Q21 - 2Q21 | 3Q21 - 3Q20 | ||||||||||||||||||||||||||||||||||||||||
| (In millions) | 3Q21 | 2Q21 | 3Q20 | $ | % | $ | % | ||||||||||||||||||||||||||||||||||
| Loans held for sale | $ | 67 | $ | 66 | $ | 89 | $ | 1 | 2% | $ | (22) | (25)% | |||||||||||||||||||||||||||||
| Loans and leases: | |||||||||||||||||||||||||||||||||||||||||
Commercial – excluding PPP loans | 25,369 | 24,700 | 24,704 | 669 | 3 | 665 | 3 | ||||||||||||||||||||||||||||||||||
Commercial – PPP loans | 3,080 | 4,461 | 6,810 | (1,381) | (31) | (3,730) | (55) | ||||||||||||||||||||||||||||||||||
Commercial real estate | 12,153 | 12,108 | 12,027 | 45 | — | 126 | 1 | ||||||||||||||||||||||||||||||||||
Consumer | 10,076 | 10,129 | 11,204 | (53) | (1) | (1,128) | (10) | ||||||||||||||||||||||||||||||||||
| Loans and leases, net of unearned income and fees | 50,678 | 51,398 | 54,745 | (720) | (1) | (4,067) | (7) | ||||||||||||||||||||||||||||||||||
Less allowance for loan losses | 491 | 535 | 853 | (44) | (8) | (362) | (42) | ||||||||||||||||||||||||||||||||||
Loans and leases held for investment, net of allowance | $ | 50,187 | $ | 50,863 | $ | 53,892 | $ | (676) | (1) | $ | (3,705) | (7) | |||||||||||||||||||||||||||||
| Unfunded lending commitments and letters of credit | $ | 26,138 | $ | 25,689 | $ | 24,845 | $ | 449 | 2 | $ | 1,293 | 5 | |||||||||||||||||||||||||||||
Loans and leases, net of unearned income and fees, decreased $4.1 billion, or 7%, to $50.7 billion at September 30, 2021, from $54.7 billion at September 30, 2020, primarily due to the forgiveness of PPP loans. Excluding PPP loans, total loans and leases decreased $0.3 billion, or 1%, to $47.6 billion at September 30, 2021. Within commercial loans, a $0.7 billion increase in municipal loans and a $0.3 billion increase in owner occupied loans were partially offset by a $0.3 billion decrease in commercial and industrial loans. Commercial real estate construction and land development loans increased $0.5 billion. Consumer 1-4 family residential mortgage loans decreased $1.1 billion, primarily due to continued refinancing activity. Unfunded lending commitments and letters of credit increased $1.3 billion, or 5%, to $26.1 billion at September 30, 2021, primarily due to growth in our home equity credit line and commercial and industrial loan portfolios as well as a decrease in commitment utilization.
Deposits and Borrowed Funds | |||||||||||||||||||||||||||||||||||||||||
| 3Q21 - 2Q21 | 3Q21 - 3Q20 | ||||||||||||||||||||||||||||||||||||||||
| (In millions) | 3Q21 | 2Q21 | 3Q20 | $ | % | $ | % | ||||||||||||||||||||||||||||||||||
| Noninterest-bearing demand | $ | 39,150 | $ | 38,128 | $ | 31,338 | $ | 1,022 | 3 | % | $ | 7,812 | 25 | % | |||||||||||||||||||||||||||
| Interest-bearing: | |||||||||||||||||||||||||||||||||||||||||
Savings and money market | 37,046 | 36,037 | 32,305 | 1,009 | 3 | 4,741 | 15 | ||||||||||||||||||||||||||||||||||
Time | 1,688 | 1,940 | 3,451 | (252) | (13) | (1,763) | (51) | ||||||||||||||||||||||||||||||||||
| Total deposits | $ | 77,884 | $ | 76,105 | $ | 67,094 | $ | 1,779 | 2 | $ | 10,790 | 16 | |||||||||||||||||||||||||||||
| Borrowed funds: | |||||||||||||||||||||||||||||||||||||||||
| Federal funds purchased and other short-term borrowings | $ | 579 | $ | 741 | $ | 1,252 | $ | (162) | (22) | $ | (673) | (54) | |||||||||||||||||||||||||||||
| Long-term debt | 1,020 | 1,308 | 1,347 | (288) | (22) | (327) | (24) | ||||||||||||||||||||||||||||||||||
| Total borrowed funds | $ | 1,599 | $ | 2,049 | $ | 2,599 | $ | (450) | (22) | $ | (1,000) | (38) | |||||||||||||||||||||||||||||
- more -
ZIONS BANCORPORATION, N.A.
Press Release – Page 6
October 18, 2021
Total deposits increased $10.8 billion, or 16%, to $77.9 billion at September 30, 2021, primarily due to a $7.8 billion increase in noninterest-bearing deposits. Average total deposits increased to $77.4 billion, compared with $66.5 billion for the third quarter of 2020. Average noninterest-bearing deposits increased 24% to $38.3 billion, from $30.8 billion for the prior year quarter, and were 50% and 46% of average total deposits, respectively, for the same periods.
Total borrowed funds decreased $1.0 billion, or 38%, to $1.6 billion at September 30, 2021. Average borrowed funds decreased to $1.8 billion, compared with $2.4 billion for the prior year quarter. The decrease in long-term debt was primarily due to the maturity of $281 million of 3-year, 3.50% senior notes during the current quarter. The decrease in overall borrowed funds continues to reflect less reliance on federal funds purchased and other short-term borrowings due to strong deposit growth, which significantly exceeded earning asset growth over this period.
| Shareholders’ Equity | |||||||||||||||||||||||||||||||||||||||||
| 3Q21 - 2Q21 | 3Q21 - 3Q20 | ||||||||||||||||||||||||||||||||||||||||
| (In millions, except share data) | 3Q21 | 2Q21 | 3Q20 | $ | % | $ | % | ||||||||||||||||||||||||||||||||||
| Shareholders’ equity: | |||||||||||||||||||||||||||||||||||||||||
Preferred stock | $ | 440 | $ | 440 | $ | 566 | $ | — | — | % | $ | (126) | (22) | % | |||||||||||||||||||||||||||
Common stock and additional paid-in capital | 2,245 | 2,565 | 2,680 | (320) | (12) | (435) | (16) | ||||||||||||||||||||||||||||||||||
Retained earnings | 5,025 | 4,853 | 4,090 | 172 | 4 | 935 | 23 | ||||||||||||||||||||||||||||||||||
Accumulated other comprehensive income | 64 | 175 | 332 | (111) | (63) | (268) | (81) | ||||||||||||||||||||||||||||||||||
| Total shareholders' equity | $ | 7,774 | $ | 8,033 | $ | 7,668 | $ | (259) | (3) | $ | 106 | 1 | |||||||||||||||||||||||||||||
| Capital distributions: | |||||||||||||||||||||||||||||||||||||||||
| Common dividends paid | $ | 62 | $ | 56 | $ | 56 | $ | 6 | 11 | $ | 6 | 11 | |||||||||||||||||||||||||||||
| Bank common stock repurchased | 325 | 100 | 50 | 225 | NM | 275 | NM | ||||||||||||||||||||||||||||||||||
| Total capital distributed to common shareholders | $ | 387 | $ | 156 | $ | 106 | $ | 231 | NM | $ | 281 | NM | |||||||||||||||||||||||||||||
| shares | % | shares | % | ||||||||||||||||||||||||||||||||||||||
Weighted average diluted common shares outstanding (in thousands) | 160,480 | 163,054 | 163,779 | (2,574) | (2) | % | (3,299) | (2) | % | ||||||||||||||||||||||||||||||||
| Common shares outstanding, at period end (in thousands) | 156,530 | 162,248 | 164,009 | (5,718) | (4) | (7,479) | (5) | ||||||||||||||||||||||||||||||||||
During the third quarter of 2021, the common stock dividend increased to $0.38 per share, from $0.34 during the prior year quarter. Weighted average diluted shares outstanding decreased 3.3 million from the third quarter of 2020, primarily due to share repurchases. During the third quarter of 2021, we repurchased 5.8 million common shares outstanding for $325 million, which is equivalent to 3.6% of common stock outstanding as of June 30, 2021.
Preferred stock decreased $126 million due to the redemption of the outstanding shares of our 5.75% Series H Non-Cumulative Perpetual Preferred Stock at par value during the second quarter of 2021. Accumulated other comprehensive income decreased $268 million to $64 million at September 30, 2021, primarily due to decreases in the fair value of available-for-sale securities as a result of changes in interest rates.
Tangible book value per common share increased to $40.37 at September 30, 2021, compared with $37.11 at September 30, 2020. Basel III common equity tier 1 (“CET1”) capital was $6.2 billion at September 30, 2021 and $5.8 billion at September 30, 2020. The estimated Basel III CET1 capital ratio was 10.9% at September 30, 2021, compared with 10.4% at September 30, 2020. For information on non-GAAP financial measures, see pages 15-17.
Supplemental Presentation and Conference Call
Zions has posted a supplemental presentation to its website, which will be used to discuss these third quarter results at 5:30 p.m. ET this afternoon (October 18, 2021). Media representatives, analysts, investors, and the public are invited to join this discussion by calling (253) 237-1247 (domestic and international) and entering the passcode 7682874, or via on-demand webcast. A link to the webcast will be available on the Zions Bancorporation website at zionsbancorporation.com. The webcast of the conference call will also be archived and available for 30 days.
- more -
ZIONS BANCORPORATION, N.A.
Press Release – Page 7
October 18, 2021
About Zions Bancorporation, N.A.
Zions Bancorporation, N.A. is one of the nation's premier financial services companies with annual net revenue of $2.8 billion in 2020 and more than $85 billion of total assets. Zions operates under local management teams and distinct brands in 11 western states: Arizona, California, Colorado, Idaho, Nevada, New Mexico, Oregon, Texas, Utah, Washington, and Wyoming. The Bank is a consistent recipient of national and state-wide customer survey awards in small and middle-market banking, as well as a leader in public finance advisory services and Small Business Administration lending, recently ranking as the tenth largest provider in the U.S. of the SBA’s Paycheck Protection Program loans (including both rounds). In addition, Zions is included in the S&P 500 and NASDAQ Financial 100 indices. Investor information and links to local banking brands can be accessed at zionsbancorporation.com.
Forward-Looking Information
This earnings release includes “forward-looking statements” as that term is defined in the Private Securities Litigation Reform Act of 1995. These statements are based on management’s current expectations and assumptions regarding future events or determinations, all of which are subject to known and unknown risks, uncertainties and other factors that may cause our actual results, performance or achievements, industry trends, and results or regulatory outcomes to differ materially from those expressed or implied. Forward-looking statements include, among others:
•statements with respect to the beliefs, plans, objectives, goals, targets, commitments, designs, guidelines, expectations, anticipations, and future financial condition, results of operations and performance of Zions Bancorporation, National Association and its subsidiaries (collectively “Zions Bancorporation, N.A.,” “the Bank,” “we,” “our,” “us”); and
•statements preceded by, followed by, or that include the words “may,” “might,” “can,” “continue,” “could,” “should,” “would,” “believe,” “anticipate,” “estimate,” “forecasts,” “expect,” “intend,” “target,” “commit,” “design,” “plan,” “projects,” “will,” and the negative thereof and similar words and expressions.
These forward-looking statements are not guarantees, nor should they be relied upon as representing management’s
views as of any subsequent date. Actual results and outcomes may differ materially from those presented.
Although this list is not comprehensive, important factors that may cause such material differences include changes
in general economic and industry conditions; changes and uncertainties in legislation and fiscal, monetary,
regulatory, trade and tax policies; changes in interest rates and uncertainty regarding the transition away from the
London Interbank Offered Rate (“LIBOR”) toward other reference rates; the quality and composition of our loan
and securities portfolios; competitive pressures and other factors that may affect aspects of our business, such as
pricing and demand for our products and services; our ability to execute our strategic plans, manage our risks, and
achieve our business objectives; our ability to develop and maintain information security systems and controls
designed to guard against fraud, cyber, and privacy risks; and the effects of the COVID-19 pandemic or other
national or international crises or conflicts that may occur in the future and governmental responses to such matters.
These factors, risks, and uncertainties, among others, are discussed in our 2020 Form 10-K and subsequent filings
with the Securities and Exchange Commission (SEC) and are available at the SEC’s Internet site (https://www.sec.gov/). In addition, you may obtain documents filed with the SEC by the Bank free of charge by contacting: Investor Relations, Zions Bancorporation, N.A., One South Main Street, 16th Floor, Salt Lake City, Utah 84133, (801) 844-7637.
We caution against the undue reliance on forward-looking statements, which reflect our views only as of the date
they are made. Except to the extent required by law, we specifically disclaim any obligation to update any factors or
to publicly announce the revisions to any of the forward-looking statements included herein to reflect future events
or developments.
- more -
ZIONS BANCORPORATION, N.A.
Press Release – Page 8
October 18, 2021
FINANCIAL HIGHLIGHTS
(Unaudited)
| Three Months Ended | |||||||||||||||||||||||||||||
| (In millions, except share, per share, and ratio data) | September 30, 2021 | June 30, 2021 | March 31, 2021 | December 31, 2020 | September 30, 2020 | ||||||||||||||||||||||||
BALANCE SHEET 1 | |||||||||||||||||||||||||||||
| Loans held for investment, net of allowance | $ | 50,187 | $ | 50,863 | $ | 52,826 | $ | 52,699 | $ | 53,892 | |||||||||||||||||||
| Total assets | 88,306 | 87,208 | 85,121 | 81,479 | 78,357 | ||||||||||||||||||||||||
| Deposits | 77,884 | 76,105 | 73,853 | 69,653 | 67,094 | ||||||||||||||||||||||||
| Total shareholders’ equity | 7,774 | 8,033 | 7,933 | 7,886 | 7,668 | ||||||||||||||||||||||||
| STATEMENT OF INCOME | |||||||||||||||||||||||||||||
Net earnings applicable to common shareholders | $ | 234 | $ | 345 | $ | 314 | $ | 275 | $ | 167 | |||||||||||||||||||
| Net interest income | 555 | 555 | 545 | 550 | 555 | ||||||||||||||||||||||||
Taxable-equivalent net interest income 2 | 562 | 562 | 553 | 557 | 562 | ||||||||||||||||||||||||
| Total noninterest income | 139 | 205 | 169 | 166 | 157 | ||||||||||||||||||||||||
| Total noninterest expense | 429 | 428 | 435 | 424 | 442 | ||||||||||||||||||||||||
Adjusted pre-provision net revenue 2 | 290 | 290 | 253 | 280 | 267 | ||||||||||||||||||||||||
| Provision for credit losses | (46) | (123) | (132) | (67) | 55 | ||||||||||||||||||||||||
| SHARE AND PER COMMON SHARE AMOUNTS | |||||||||||||||||||||||||||||
| Net earnings per diluted common share | $ | 1.45 | $ | 2.08 | $ | 1.90 | $ | 1.66 | $ | 1.01 | |||||||||||||||||||
| Dividends | 0.38 | 0.34 | 0.34 | 0.34 | 0.34 | ||||||||||||||||||||||||
Book value per common share 1 | 46.85 | 46.80 | 44.98 | 44.61 | 43.30 | ||||||||||||||||||||||||
Tangible book value per common share 1, 2 | 40.37 | 40.54 | 38.77 | 38.42 | 37.11 | ||||||||||||||||||||||||
| Weighted average share price | 54.78 | 55.86 | 51.34 | 36.86 | 32.09 | ||||||||||||||||||||||||
Weighted average diluted common shares outstanding (in thousands) | 160,480 | 163,054 | 163,887 | 163,900 | 163,779 | ||||||||||||||||||||||||
Common shares outstanding (in thousands) 1 | 156,530 | 162,248 | 163,800 | 164,090 | 164,009 | ||||||||||||||||||||||||
| SELECTED RATIOS AND OTHER DATA | |||||||||||||||||||||||||||||
| Return on average assets | 1.08 | % | 1.65 | % | 1.57 | % | 1.41 | % | 0.89 | % | |||||||||||||||||||
| Return on average common equity | 12.3 | % | 18.6 | % | 17.4 | % | 15.3 | % | 9.4 | % | |||||||||||||||||||
Return on average tangible common equity 2 | 14.2 | % | 21.6 | % | 20.2 | % | 17.8 | % | 11.0 | % | |||||||||||||||||||
| Net interest margin | 2.68 | % | 2.79 | % | 2.86 | % | 2.95 | % | 3.06 | % | |||||||||||||||||||
| Cost of total deposits, annualized | 0.03 | % | 0.04 | % | 0.05 | % | 0.08 | % | 0.11 | % | |||||||||||||||||||
Efficiency ratio 2 | 59.8 | % | 59.1 | % | 63.5 | % | 60.2 | % | 62.2 | % | |||||||||||||||||||
| Effective tax rate | 22.8 | % | 22.2 | % | 21.7 | % | 20.9 | % | 18.6 | % | |||||||||||||||||||
Ratio of nonperforming assets to loans and leases and other real estate owned | 0.64 | % | 0.60 | % | 0.61 | % | 0.69 | % | 0.68 | % | |||||||||||||||||||
| Annualized ratio of net loan and lease charge-offs to average loans | (0.01) | % | (0.02) | % | 0.06 | % | 0.11 | % | 0.38 | % | |||||||||||||||||||
Ratio of total allowance for credit losses to loans and leases outstanding 1 | 1.04 | % | 1.12 | % | 1.30 | % | 1.56 | % | 1.68 | % | |||||||||||||||||||
Full-time equivalent employees | 9,641 | 9,727 | 9,682 | 9,678 | 9,726 | ||||||||||||||||||||||||
CAPITAL RATIOS AND DATA 1 | |||||||||||||||||||||||||||||
Common equity tier 1 capital 3 | $ | 6,236 | $ | 6,383 | $ | 6,206 | $ | 6,013 | $ | 5,804 | |||||||||||||||||||
Risk-weighted assets 3 | 57,459 | 56,339 | 55,402 | 55,866 | 55,654 | ||||||||||||||||||||||||
| Tangible common equity ratio | 7.2 | % | 7.6 | % | 7.6 | % | 7.8 | % | 7.9 | % | |||||||||||||||||||
Common equity tier 1 capital ratio 3 | 10.9 | % | 11.3 | % | 11.2 | % | 10.8 | % | 10.4 | % | |||||||||||||||||||
Tier 1 leverage ratio 3 | 7.6 | % | 8.0 | % | 8.3 | % | 8.3 | % | 8.3 | % | |||||||||||||||||||
Tier 1 risk-based capital ratio 3 | 11.6 | % | 12.1 | % | 12.2 | % | 11.8 | % | 11.4 | % | |||||||||||||||||||
Total risk-based capital ratio 3 | 13.6 | % | 14.2 | % | 14.5 | % | 14.1 | % | 13.7 | % | |||||||||||||||||||
1 At period end.
2 For information on non-GAAP financial measures, see pages 15-17.
3 Current period ratios and amounts represent estimates.
- more -
ZIONS BANCORPORATION, N.A.
Press Release – Page 9
October 18, 2021
CONSOLIDATED BALANCE SHEETS
| (In millions, shares in thousands) | September 30, 2021 | June 30, 2021 | March 31, 2021 | December 31, 2020 | September 30, 2020 | ||||||||||||||||||||||||
| (Unaudited) | (Unaudited) | (Unaudited) | (Unaudited) | ||||||||||||||||||||||||||
| ASSETS | |||||||||||||||||||||||||||||
| Cash and due from banks | $ | 597 | $ | 525 | $ | 576 | $ | 543 | $ | 576 | |||||||||||||||||||
| Money market investments: | |||||||||||||||||||||||||||||
| Interest-bearing deposits | 9,442 | 10,086 | 8,427 | 1,074 | 856 | ||||||||||||||||||||||||
| Federal funds sold and security resell agreements | 1,858 | 1,714 | 1,315 | 5,765 | 2,804 | ||||||||||||||||||||||||
| Investment securities: | |||||||||||||||||||||||||||||
Held-to-maturity1, at amortized cost | 459 | 620 | 583 | 636 | 592 | ||||||||||||||||||||||||
| Available-for-sale, at fair value | 20,461 | 18,170 | 16,644 | 15,731 | 14,662 | ||||||||||||||||||||||||
| Trading account, at fair value | 305 | 181 | 189 | 266 | 198 | ||||||||||||||||||||||||
| Total securities, net of allowance | 21,225 | 18,971 | 17,416 | 16,633 | 15,452 | ||||||||||||||||||||||||
| Loans held for sale | 67 | 66 | 77 | 81 | 89 | ||||||||||||||||||||||||
| Loans and leases, net of unearned income and fees | 50,678 | 51,398 | 53,472 | 53,476 | 54,745 | ||||||||||||||||||||||||
| Less allowance for loan losses | 491 | 535 | 646 | 777 | 853 | ||||||||||||||||||||||||
| Loans held for investment, net of allowance | 50,187 | 50,863 | 52,826 | 52,699 | 53,892 | ||||||||||||||||||||||||
| Other noninterest-bearing investments | 868 | 895 | 815 | 817 | 830 | ||||||||||||||||||||||||
| Premises, equipment and software, net | 1,282 | 1,239 | 1,236 | 1,209 | 1,187 | ||||||||||||||||||||||||
| Goodwill and intangibles | 1,015 | 1,015 | 1,016 | 1,016 | 1,016 | ||||||||||||||||||||||||
| Other real estate owned | 21 | 23 | 3 | 4 | 6 | ||||||||||||||||||||||||
| Other assets | 1,744 | 1,811 | 1,414 | 1,638 | 1,649 | ||||||||||||||||||||||||
| Total assets | $ | 88,306 | $ | 87,208 | $ | 85,121 | $ | 81,479 | $ | 78,357 | |||||||||||||||||||
| LIABILITIES AND SHAREHOLDERS’ EQUITY | |||||||||||||||||||||||||||||
| Deposits: | |||||||||||||||||||||||||||||
| Noninterest-bearing demand | $ | 39,150 | $ | 38,128 | $ | 35,882 | $ | 32,494 | $ | 31,338 | |||||||||||||||||||
| Interest-bearing: | |||||||||||||||||||||||||||||
| Savings and money market | 37,046 | 36,037 | 35,762 | 34,571 | 32,305 | ||||||||||||||||||||||||
| Time | 1,688 | 1,940 | 2,209 | 2,588 | 3,451 | ||||||||||||||||||||||||
| Total deposits | 77,884 | 76,105 | 73,853 | 69,653 | 67,094 | ||||||||||||||||||||||||
Federal funds purchased and other short-term borrowings | 579 | 741 | 1,032 | 1,572 | 1,252 | ||||||||||||||||||||||||
| Long-term debt | 1,020 | 1,308 | 1,299 | 1,336 | 1,347 | ||||||||||||||||||||||||
| Reserve for unfunded lending commitments | 38 | 39 | 49 | 58 | 64 | ||||||||||||||||||||||||
| Other liabilities | 1,011 | 982 | 955 | 974 | 932 | ||||||||||||||||||||||||
| Total liabilities | 80,532 | 79,175 | 77,188 | 73,593 | 70,689 | ||||||||||||||||||||||||
| Shareholders’ equity: | |||||||||||||||||||||||||||||
| Preferred stock, without par value; authorized 4,400 shares | 440 | 440 | 566 | 566 | 566 | ||||||||||||||||||||||||
Common stock2 ($0.001 par value; authorized 350,000 shares) and additional paid-in capital | 2,245 | 2,565 | 2,653 | 2,686 | 2,680 | ||||||||||||||||||||||||
| Retained earnings | 5,025 | 4,853 | 4,566 | 4,309 | 4,090 | ||||||||||||||||||||||||
| Accumulated other comprehensive income | 64 | 175 | 148 | 325 | 332 | ||||||||||||||||||||||||
| Total shareholders’ equity | 7,774 | 8,033 | 7,933 | 7,886 | 7,668 | ||||||||||||||||||||||||
| Total liabilities and shareholders’ equity | $ | 88,306 | $ | 87,208 | $ | 85,121 | $ | 81,479 | $ | 78,357 | |||||||||||||||||||
1 Held-to-maturity (approximate fair value) | $ | 461 | $ | 622 | $ | 584 | $ | 640 | $ | 596 | |||||||||||||||||||
2 Common shares (issued and outstanding) | 156,530 | 162,248 | 163,800 | 164,090 | 164,009 | ||||||||||||||||||||||||
- more -
ZIONS BANCORPORATION, N.A.
Press Release – Page 10
October 18, 2021
CONSOLIDATED STATEMENTS OF INCOME
| (Unaudited) | Three Months Ended | ||||||||||||||||||||||||||||
| (In millions, except share and per share amounts) | September 30, 2021 | June 30, 2021 | March 31, 2021 | December 31, 2020 | September 30, 2020 | ||||||||||||||||||||||||
| Interest income: | |||||||||||||||||||||||||||||
| Interest and fees on loans | $ | 484 | $ | 492 | $ | 488 | $ | 499 | $ | 505 | |||||||||||||||||||
| Interest on money market investments | 7 | 4 | 3 | 3 | 2 | ||||||||||||||||||||||||
| Interest on securities | 78 | 74 | 71 | 69 | 74 | ||||||||||||||||||||||||
| Total interest income | 569 | 570 | 562 | 571 | 581 | ||||||||||||||||||||||||
| Interest expense: | |||||||||||||||||||||||||||||
| Interest on deposits | 7 | 7 | 9 | 13 | 18 | ||||||||||||||||||||||||
| Interest on short- and long-term borrowings | 7 | 8 | 8 | 8 | 8 | ||||||||||||||||||||||||
| Total interest expense | 14 | 15 | 17 | 21 | 26 | ||||||||||||||||||||||||
| Net interest income | 555 | 555 | 545 | 550 | 555 | ||||||||||||||||||||||||
| Provision for credit losses: | |||||||||||||||||||||||||||||
| Provision for loan losses | (45) | (113) | (123) | (61) | 45 | ||||||||||||||||||||||||
| Provision for unfunded lending commitments | (1) | (10) | (9) | (6) | 10 | ||||||||||||||||||||||||
| Total provision for credit losses | (46) | (123) | (132) | (67) | 55 | ||||||||||||||||||||||||
| Net interest income after provision for credit losses | 601 | 678 | 677 | 617 | 500 | ||||||||||||||||||||||||
| Noninterest income: | |||||||||||||||||||||||||||||
| Commercial account fees | 34 | 34 | 32 | 32 | 32 | ||||||||||||||||||||||||
| Card fees | 25 | 24 | 21 | 22 | 21 | ||||||||||||||||||||||||
| Retail and business banking fees | 20 | 18 | 17 | 18 | 17 | ||||||||||||||||||||||||
| Loan-related fees and income | 27 | 21 | 25 | 25 | 32 | ||||||||||||||||||||||||
| Capital markets and foreign exchange fees | 17 | 17 | 15 | 19 | 16 | ||||||||||||||||||||||||
| Wealth management fees | 13 | 12 | 12 | 10 | 10 | ||||||||||||||||||||||||
| Other customer-related fees | 15 | 13 | 11 | 13 | 11 | ||||||||||||||||||||||||
| Customer-related fees | 151 | 139 | 133 | 139 | 139 | ||||||||||||||||||||||||
| Fair value and nonhedge derivative income (loss) | 2 | (5) | 18 | 8 | 8 | ||||||||||||||||||||||||
| Dividends and other income | 9 | 8 | 7 | 7 | 6 | ||||||||||||||||||||||||
| Securities gains (losses), net | (23) | 63 | 11 | 12 | 4 | ||||||||||||||||||||||||
| Total noninterest income | 139 | 205 | 169 | 166 | 157 | ||||||||||||||||||||||||
| Noninterest expense: | |||||||||||||||||||||||||||||
| Salaries and employee benefits | 285 | 272 | 288 | 277 | 269 | ||||||||||||||||||||||||
| Occupancy, net | 33 | 33 | 33 | 33 | 33 | ||||||||||||||||||||||||
| Furniture, equipment and software, net | 31 | 32 | 32 | 30 | 32 | ||||||||||||||||||||||||
| Other real estate expense, net | — | — | — | 1 | — | ||||||||||||||||||||||||
| Credit-related expense | 7 | 6 | 6 | 6 | 6 | ||||||||||||||||||||||||
| Professional and legal services | 16 | 17 | 20 | 19 | 12 | ||||||||||||||||||||||||
| Advertising | 4 | 4 | 5 | 6 | 7 | ||||||||||||||||||||||||
| FDIC premiums | 5 | 6 | 7 | 6 | 7 | ||||||||||||||||||||||||
| Other | 48 | 58 | 44 | 46 | 76 | ||||||||||||||||||||||||
| Total noninterest expense | 429 | 428 | 435 | 424 | 442 | ||||||||||||||||||||||||
| Income before income taxes | 311 | 455 | 411 | 359 | 215 | ||||||||||||||||||||||||
| Income taxes | 71 | 101 | 89 | 75 | 40 | ||||||||||||||||||||||||
| Net income | 240 | 354 | 322 | 284 | 175 | ||||||||||||||||||||||||
| Preferred stock dividends | (6) | (9) | (8) | (9) | (8) | ||||||||||||||||||||||||
| Net earnings applicable to common shareholders | $ | 234 | $ | 345 | $ | 314 | $ | 275 | $ | 167 | |||||||||||||||||||
| Weighted average common shares outstanding during the period: | |||||||||||||||||||||||||||||
| Basic shares (in thousands) | 160,221 | 162,742 | 163,551 | 163,658 | 163,608 | ||||||||||||||||||||||||
| Diluted shares (in thousands) | 160,480 | 163,054 | 163,887 | 163,900 | 163,779 | ||||||||||||||||||||||||
| Net earnings per common share: | |||||||||||||||||||||||||||||
| Basic | $ | 1.45 | $ | 2.08 | $ | 1.90 | $ | 1.66 | $ | 1.01 | |||||||||||||||||||
| Diluted | 1.45 | 2.08 | 1.90 | 1.66 | 1.01 | ||||||||||||||||||||||||
- more -
ZIONS BANCORPORATION, N.A.
Press Release – Page 11
October 18, 2021
Loan Balances Held for Investment by Portfolio Type
(Unaudited)
| (In millions) | September 30, 2021 | June 30, 2021 | March 31, 2021 | December 31, 2020 | September 30, 2020 | ||||||||||||||||||||||||
| Commercial: | |||||||||||||||||||||||||||||
| Commercial and industrial | $ | 13,230 | $ | 12,947 | $ | 12,843 | $ | 13,444 | $ | 13,543 | |||||||||||||||||||
| PPP | 3,080 | 4,461 | 6,465 | 5,572 | 6,810 | ||||||||||||||||||||||||
| Leasing | 293 | 307 | 310 | 320 | 319 | ||||||||||||||||||||||||
| Owner occupied | 8,446 | 8,231 | 8,112 | 8,185 | 8,136 | ||||||||||||||||||||||||
| Municipal | 3,400 | 3,215 | 3,234 | 2,951 | 2,706 | ||||||||||||||||||||||||
| Total commercial | 28,449 | 29,161 | 30,964 | 30,472 | 31,514 | ||||||||||||||||||||||||
| Commercial real estate: | |||||||||||||||||||||||||||||
| Construction and land development | 2,843 | 2,576 | 2,443 | 2,345 | 2,298 | ||||||||||||||||||||||||
| Term | 9,310 | 9,532 | 9,617 | 9,759 | 9,729 | ||||||||||||||||||||||||
| Total commercial real estate | 12,153 | 12,108 | 12,060 | 12,104 | 12,027 | ||||||||||||||||||||||||
| Consumer: | |||||||||||||||||||||||||||||
| Home equity credit line | 2,834 | 2,727 | 2,695 | 2,745 | 2,797 | ||||||||||||||||||||||||
| 1-4 family residential | 6,140 | 6,269 | 6,630 | 6,969 | 7,209 | ||||||||||||||||||||||||
| Construction and other consumer real estate | 584 | 593 | 589 | 630 | 633 | ||||||||||||||||||||||||
| Bankcard and other revolving plans | 395 | 415 | 409 | 432 | 431 | ||||||||||||||||||||||||
| Other | 123 | 125 | 125 | 124 | 134 | ||||||||||||||||||||||||
| Total consumer | 10,076 | 10,129 | 10,448 | 10,900 | 11,204 | ||||||||||||||||||||||||
| Loans and leases, net of unearned income and fees | $ | 50,678 | $ | 51,398 | $ | 53,472 | $ | 53,476 | $ | 54,745 | |||||||||||||||||||
Nonperforming Assets
(Unaudited)
| (In millions) | September 30, 2021 | June 30, 2021 | March 31, 2021 | December 31, 2020 | September 30, 2020 | ||||||||||||||||||||||||
Nonaccrual loans1 | $ | 323 | $ | 307 | $ | 324 | $ | 367 | $ | 366 | |||||||||||||||||||
Other real estate owned2 | 1 | 1 | 3 | 4 | 6 | ||||||||||||||||||||||||
| Total nonperforming assets | $ | 324 | $ | 308 | $ | 327 | $ | 371 | $ | 372 | |||||||||||||||||||
Ratio of nonperforming assets to loans1 and leases and other real estate owned2 | 0.64 | % | 0.60 | % | 0.61 | % | 0.69 | % | 0.68 | % | |||||||||||||||||||
| Accruing loans past due 90 days or more | $ | 4 | $ | 6 | $ | 9 | $ | 12 | $ | 9 | |||||||||||||||||||
Ratio of accruing loans past due 90 days or more to loans1 and leases | 0.01 | % | 0.01 | % | 0.02 | % | 0.02 | % | 0.02 | % | |||||||||||||||||||
Nonaccrual loans and accruing loans past due 90 days or more | $ | 327 | $ | 313 | $ | 333 | $ | 379 | $ | 375 | |||||||||||||||||||
Ratio of nonaccrual loans and accruing loans past due 90 days or more to loans1 and leases | 0.64 | % | 0.61 | % | 0.62 | % | 0.71 | % | 0.68 | % | |||||||||||||||||||
| Accruing loans past due 30-89 days | $ | 114 | $ | 29 | $ | 100 | $ | 112 | $ | 58 | |||||||||||||||||||
| Restructured loans included in nonaccrual loans | 121 | 128 | 134 | 113 | 84 | ||||||||||||||||||||||||
| Restructured loans on accrual | 231 | 330 | 280 | 198 | 197 | ||||||||||||||||||||||||
| Classified loans | 1,397 | 1,557 | 1,660 | 1,641 | 1,639 | ||||||||||||||||||||||||
1 Includes loans held for sale.
2 Does not include banking premises held for sale.
- more -
ZIONS BANCORPORATION, N.A.
Press Release – Page 12
October 18, 2021
Allowance for Credit Losses
(Unaudited)
| Three Months Ended | |||||||||||||||||||||||||||||
| (In millions) | September 30, 2021 | June 30, 2021 | March 31, 2021 | December 31, 2020 | September 30, 2020 | ||||||||||||||||||||||||
| Allowance for Loan Losses | |||||||||||||||||||||||||||||
| Balance at beginning of period | $ | 535 | $ | 646 | $ | 777 | $ | 853 | $ | 860 | |||||||||||||||||||
| Provision for loan losses | (45) | (113) | (123) | (61) | 45 | ||||||||||||||||||||||||
| Loan and lease charge-offs | 8 | 8 | 21 | 21 | 58 | ||||||||||||||||||||||||
| Less: Recoveries | 9 | 10 | 13 | 6 | 6 | ||||||||||||||||||||||||
| Net loan and lease charge-offs | (1) | (2) | 8 | 15 | 52 | ||||||||||||||||||||||||
| Balance at end of period | $ | 491 | $ | 535 | $ | 646 | $ | 777 | $ | 853 | |||||||||||||||||||
Ratio of allowance for loan losses to loans1 and leases, at period end | 0.97 | % | 1.04 | % | 1.21 | % | 1.45 | % | 1.56 | % | |||||||||||||||||||
Ratio of allowance for loan losses to nonaccrual loans1 at period end | 152 | % | 175 | % | 199 | % | 212 | % | 242 | % | |||||||||||||||||||
Annualized ratio of net loan and lease charge-offs to average loans | (0.01) | % | (0.02) | % | 0.06 | % | 0.11 | % | 0.38 | % | |||||||||||||||||||
| Annualized ratio of net loan and lease charge-offs to average loans (excluding PPP loans) | (0.01) | % | (0.02) | % | 0.07 | % | 0.13 | % | 0.43 | % | |||||||||||||||||||
| Reserve for Unfunded Lending Commitments | |||||||||||||||||||||||||||||
| Balance at beginning of period | $ | 39 | $ | 49 | $ | 58 | $ | 64 | $ | 54 | |||||||||||||||||||
| Provision for unfunded lending commitments | (1) | (10) | (9) | (6) | 10 | ||||||||||||||||||||||||
| Balance at end of period | $ | 38 | $ | 39 | $ | 49 | $ | 58 | $ | 64 | |||||||||||||||||||
| Allowance for Credit Losses | |||||||||||||||||||||||||||||
| Allowance for loan losses | $ | 491 | $ | 535 | $ | 646 | $ | 777 | $ | 853 | |||||||||||||||||||
| Reserve for unfunded lending commitments | 38 | 39 | 49 | 58 | 64 | ||||||||||||||||||||||||
| Total allowance for credit losses | $ | 529 | $ | 574 | $ | 695 | $ | 835 | $ | 917 | |||||||||||||||||||
Ratio of total allowance for credit losses to loans1 and leases outstanding, at period end | 1.04 | % | 1.12 | % | 1.30 | % | 1.56 | % | 1.68 | % | |||||||||||||||||||
Ratio of total allowance for credit losses to loans1 and leases outstanding (excluding PPP loans), at period end | 1.11 | % | 1.22 | % | 1.48 | % | 1.74 | % | 1.91 | % | |||||||||||||||||||
1 Does not include loans held for sale.
- more -
ZIONS BANCORPORATION, N.A.
Press Release – Page 13
October 18, 2021
Nonaccrual Loans by Portfolio Type
(Unaudited)
| (In millions) | September 30, 2021 | June 30, 2021 | March 31, 2021 | December 31, 2020 | September 30, 2020 | ||||||||||||||||||||||||
| Loans held for sale | $ | — | $ | 1 | $ | — | $ | — | $ | 14 | |||||||||||||||||||
| Commercial: | |||||||||||||||||||||||||||||
| Commercial and industrial | $ | 157 | $ | 111 | $ | 119 | $ | 140 | $ | 158 | |||||||||||||||||||
| PPP | — | 1 | — | — | — | ||||||||||||||||||||||||
| Leasing | — | — | — | — | 1 | ||||||||||||||||||||||||
| Owner occupied | 67 | 69 | 74 | 76 | 81 | ||||||||||||||||||||||||
| Municipal | — | — | — | — | — | ||||||||||||||||||||||||
| Total commercial | 224 | 181 | 193 | 216 | 240 | ||||||||||||||||||||||||
| Commercial real estate: | |||||||||||||||||||||||||||||
| Construction and land development | — | — | — | — | — | ||||||||||||||||||||||||
| Term | 25 | 28 | 31 | 31 | 37 | ||||||||||||||||||||||||
| Total commercial real estate | 25 | 28 | 31 | 31 | 37 | ||||||||||||||||||||||||
| Consumer: | |||||||||||||||||||||||||||||
| Home equity credit line | 15 | 18 | 19 | 16 | 16 | ||||||||||||||||||||||||
| 1-4 family residential | 58 | 78 | 80 | 103 | 59 | ||||||||||||||||||||||||
| Construction and other consumer real estate | — | — | — | — | — | ||||||||||||||||||||||||
| Bankcard and other revolving plans | 1 | 1 | 1 | 1 | — | ||||||||||||||||||||||||
| Other | — | — | — | — | — | ||||||||||||||||||||||||
| Total consumer | 74 | 97 | 100 | 120 | 75 | ||||||||||||||||||||||||
| Total nonaccrual loans | $ | 323 | $ | 307 | $ | 324 | $ | 367 | $ | 366 | |||||||||||||||||||
Net Charge-Offs by Portfolio Type
(Unaudited)
| (In millions) | September 30, 2021 | June 30, 2021 | March 31, 2021 | December 31, 2020 | September 30, 2020 | ||||||||||||||||||||||||
| Commercial: | |||||||||||||||||||||||||||||
| Commercial and industrial | $ | (2) | $ | (2) | $ | 8 | $ | 15 | $ | 51 | |||||||||||||||||||
| PPP | — | — | — | — | — | ||||||||||||||||||||||||
| Leasing | — | — | — | — | — | ||||||||||||||||||||||||
| Owner occupied | (1) | — | — | — | (1) | ||||||||||||||||||||||||
| Municipal | — | — | — | — | — | ||||||||||||||||||||||||
| Total commercial | (3) | (2) | 8 | 15 | 50 | ||||||||||||||||||||||||
| Commercial real estate: | |||||||||||||||||||||||||||||
| Construction and land development | — | — | — | — | — | ||||||||||||||||||||||||
| Term | — | — | — | — | 1 | ||||||||||||||||||||||||
| Total commercial real estate | — | — | — | — | 1 | ||||||||||||||||||||||||
| Consumer: | |||||||||||||||||||||||||||||
| Home equity credit line | 1 | (1) | (1) | — | — | ||||||||||||||||||||||||
| 1-4 family residential | 1 | — | (1) | (1) | — | ||||||||||||||||||||||||
| Construction and other consumer real estate | — | — | — | — | — | ||||||||||||||||||||||||
| Bankcard and other revolving plans | — | 1 | 1 | — | 1 | ||||||||||||||||||||||||
| Other | — | — | 1 | 1 | — | ||||||||||||||||||||||||
| Total consumer loans | 2 | — | — | — | 1 | ||||||||||||||||||||||||
| Total net charge-offs (recoveries) | $ | (1) | $ | (2) | $ | 8 | $ | 15 | $ | 52 | |||||||||||||||||||
- more -
ZIONS BANCORPORATION, N.A.
Press Release – Page 14
October 18, 2021
CONSOLIDATED AVERAGE BALANCE SHEETS, YIELDS AND RATES
| (Unaudited) | Three Months Ended | ||||||||||||||||||||||||||||||||||
| September 30, 2021 | June 30, 2021 | September 30, 2020 | |||||||||||||||||||||||||||||||||
| (In millions) | Average balance | Average yield/rate 1 | Average balance | Average yield/rate 1 | Average balance | Average yield/rate 1 | |||||||||||||||||||||||||||||
| ASSETS | |||||||||||||||||||||||||||||||||||
| Money market investments | $ | 12,716 | 0.20 | % | $ | 10,253 | 0.17 | % | $ | 3,116 | 0.25 | % | |||||||||||||||||||||||
| Securities: | |||||||||||||||||||||||||||||||||||
| Held-to-maturity | 557 | 2.87 | % | 579 | 2.91 | % | 672 | 3.39 | % | ||||||||||||||||||||||||||
| Available-for-sale | 18,814 | 1.56 | % | 17,041 | 1.63 | % | 14,083 | 1.95 | % | ||||||||||||||||||||||||||
| Trading account | 199 | 4.41 | % | 211 | 4.43 | % | 158 | 4.31 | % | ||||||||||||||||||||||||||
| Total securities | 19,570 | 1.63 | % | 17,831 | 1.71 | % | 14,913 | 2.04 | % | ||||||||||||||||||||||||||
| Loans held for sale | 52 | 3.03 | % | 62 | 2.50 | % | 86 | 4.32 | % | ||||||||||||||||||||||||||
Loans and leases:2 | |||||||||||||||||||||||||||||||||||
| Commercial - excluding PPP loans | 24,854 | 3.76 | % | 24,560 | 3.85 | % | 24,909 | 3.96 | % | ||||||||||||||||||||||||||
| Commercial - PPP loans | 3,795 | 6.66 | % | 5,945 | 4.56 | % | 6,771 | 3.03 | % | ||||||||||||||||||||||||||
| Commercial real estate | 12,144 | 3.42 | % | 12,037 | 3.46 | % | 11,986 | 3.52 | % | ||||||||||||||||||||||||||
| Consumer | 10,058 | 3.38 | % | 10,228 | 3.51 | % | 11,327 | 3.60 | % | ||||||||||||||||||||||||||
| Total loans and leases | 50,851 | 3.82 | % | 52,770 | 3.77 | % | 54,993 | 3.68 | % | ||||||||||||||||||||||||||
| Total interest-earning assets | 83,189 | 2.75 | % | 80,916 | 2.86 | % | 73,108 | 3.20 | % | ||||||||||||||||||||||||||
| Cash and due from banks | 597 | 579 | 583 | ||||||||||||||||||||||||||||||||
| Allowance for credit losses on loans and debt securities | (536) | (647) | (852) | ||||||||||||||||||||||||||||||||
| Goodwill and intangibles | 1,015 | 1,015 | 1,015 | ||||||||||||||||||||||||||||||||
| Other assets | 4,291 | 4,094 | 4,129 | ||||||||||||||||||||||||||||||||
| Total assets | $ | 88,556 | $ | 85,957 | $ | 77,983 | |||||||||||||||||||||||||||||
| LIABILITIES AND SHAREHOLDERS’ EQUITY | |||||||||||||||||||||||||||||||||||
| Interest-bearing deposits: | |||||||||||||||||||||||||||||||||||
| Savings and money market | $ | 37,262 | 0.05 | % | $ | 35,987 | 0.06 | % | $ | 32,111 | 0.11 | % | |||||||||||||||||||||||
| Time | 1,829 | 0.32 | % | 2,108 | 0.42 | % | 3,602 | 0.96 | % | ||||||||||||||||||||||||||
| Total interest-bearing deposits | 39,091 | 0.07 | % | 38,095 | 0.08 | % | 35,713 | 0.20 | % | ||||||||||||||||||||||||||
| Borrowed funds: | |||||||||||||||||||||||||||||||||||
| Federal funds purchased and other short-term borrowings | 630 | 0.08 | % | 834 | 0.06 | % | 1,078 | 0.09 | % | ||||||||||||||||||||||||||
| Long-term debt | 1,204 | 2.34 | % | 1,303 | 2.31 | % | 1,353 | 2.32 | % | ||||||||||||||||||||||||||
| Total borrowed funds | 1,834 | 1.56 | % | 2,137 | 1.43 | % | 2,431 | 1.33 | % | ||||||||||||||||||||||||||
| Total interest-bearing funds | 40,925 | 0.13 | % | 40,232 | 0.15 | % | 38,144 | 0.27 | % | ||||||||||||||||||||||||||
| Noninterest-bearing demand deposits | 38,320 | 36,545 | 30,789 | ||||||||||||||||||||||||||||||||
| Other liabilities | 1,302 | 1,200 | 1,406 | ||||||||||||||||||||||||||||||||
| Total liabilities | 80,547 | 77,977 | 70,339 | ||||||||||||||||||||||||||||||||
| Shareholders’ equity: | |||||||||||||||||||||||||||||||||||
| Preferred equity | 440 | 544 | 566 | ||||||||||||||||||||||||||||||||
| Common equity | 7,569 | 7,436 | 7,078 | ||||||||||||||||||||||||||||||||
| Total shareholders’ equity | 8,009 | 7,980 | 7,644 | ||||||||||||||||||||||||||||||||
| Total liabilities and shareholders’ equity | $ | 88,556 | $ | 85,957 | $ | 77,983 | |||||||||||||||||||||||||||||
| Spread on average interest-bearing funds | 2.62 | % | 2.71 | % | 2.93 | % | |||||||||||||||||||||||||||||
| Impact of net noninterest-bearing sources of funds | 0.06 | % | 0.08 | % | 0.13 | % | |||||||||||||||||||||||||||||
| Net interest margin | 2.68 | % | 2.79 | % | 3.06 | % | |||||||||||||||||||||||||||||
| Memo: total loans and leases, excluding PPP loans | 47,056 | 3.59 | % | 46,825 | 3.67 | % | 48,222 | 3.77 | % | ||||||||||||||||||||||||||
| Memo: total cost of deposits | 0.03 | % | 0.04 | % | 0.11 | % | |||||||||||||||||||||||||||||
| Memo: total deposits and interest-bearing liabilities | 79,245 | 0.07 | % | 76,777 | 0.08 | % | 68,933 | 0.15 | % | ||||||||||||||||||||||||||
1 Rates are calculated using amounts in thousands and a tax rate of 21% for the periods presented.
2 Net of unamortized purchase premiums, discounts, and deferred loan fees and costs.
- more -
ZIONS BANCORPORATION, N.A.
Press Release – Page 15
October 18, 2021
GAAP to Non-GAAP Reconciliations
(Unaudited)
This press release presents non-GAAP financial measures, in addition to GAAP financial measures, to provide investors with additional information. The adjustments to reconcile from the applicable GAAP financial measures to the non-GAAP financial measures are presented in the following schedules. We consider these adjustments to be relevant to ongoing operating results and to provide a meaningful base for period-to-period and company-to-company comparisons. We use these non-GAAP financial measures to assess our performance, financial position, and for presentations of our performance to investors. We believe that presenting these non-GAAP financial measures permits investors to assess our performance on the same basis as that applied by our management and the financial services industry.
Non-GAAP financial measures have inherent limitations and are not necessarily comparable to similar capital measures that may be presented by other financial services companies. Although non-GAAP financial measures are frequently used by stakeholders to evaluate a company, they have limitations as an analytical tool and should not be considered in isolation or as a substitute for analysis of results reported under GAAP.
Tangible Common Equity and Related Measures
Tangible common equity and related measures are non-GAAP measures that exclude the impact of intangible assets and their related amortization. We believe these non-GAAP measures provide useful information about our use of shareholders’ equity and provide a basis for evaluating the performance of a business more consistently, whether acquired or developed internally.
| Three Months Ended | ||||||||||||||||||||||||||||||||
| (Dollar amounts in millions) | September 30, 2021 | June 30, 2021 | March 31, 2021 | December 31, 2020 | September 30, 2020 | |||||||||||||||||||||||||||
| Return on Average Tangible Common Equity | ||||||||||||||||||||||||||||||||
| Net earnings applicable to common shareholders, net of tax | (a) | $ | 234 | $ | 345 | $ | 314 | $ | 275 | $ | 167 | |||||||||||||||||||||
| Average common equity (GAAP) | $ | 7,569 | $ | 7,436 | $ | 7,333 | $ | 7,166 | $ | 7,078 | ||||||||||||||||||||||
| Average goodwill and intangibles | (1,015) | (1,015) | (1,016) | (1,016) | (1,015) | |||||||||||||||||||||||||||
| Average tangible common equity (non-GAAP) | (b) | $ | 6,554 | $ | 6,421 | $ | 6,317 | $ | 6,150 | $ | 6,063 | |||||||||||||||||||||
| Number of days in quarter | (c) | 92 | 91 | 90 | 92 | 92 | ||||||||||||||||||||||||||
| Number of days in year | (d) | 365 | 365 | 365 | 366 | 366 | ||||||||||||||||||||||||||
Return on average tangible common equity (non-GAAP) | (a/b/c)*d | 14.2 | % | 21.6 | % | 20.2 | % | 17.8 | % | 11.0 | % | |||||||||||||||||||||
| (In millions, except shares and per share amounts) | September 30, 2021 | June 30, 2021 | March 31, 2021 | December 31, 2020 | September 30, 2020 | |||||||||||||||||||||||||||
| Tangible Book Value per Common Share | ||||||||||||||||||||||||||||||||
| Total shareholders’ equity (GAAP) | $ | 7,774 | $ | 8,033 | $ | 7,933 | $ | 7,886 | $ | 7,668 | ||||||||||||||||||||||
| Preferred stock | (440) | (440) | (566) | (566) | (566) | |||||||||||||||||||||||||||
| Goodwill and intangibles | (1,015) | (1,015) | (1,016) | (1,016) | (1,016) | |||||||||||||||||||||||||||
| Tangible common equity (non-GAAP) | (a) | $ | 6,319 | $ | 6,578 | $ | 6,351 | $ | 6,304 | $ | 6,086 | |||||||||||||||||||||
| Common shares outstanding (in thousands) | (b) | 156,530 | 162,248 | 163,800 | 164,090 | 164,009 | ||||||||||||||||||||||||||
Tangible book value per common share (non-GAAP) | (a/b) | $ | 40.37 | $ | 40.54 | $ | 38.77 | $ | 38.42 | $ | 37.11 | |||||||||||||||||||||
- more -
ZIONS BANCORPORATION, N.A.
Press Release – Page 16
October 18, 2021
Efficiency Ratio and Adjusted Pre-Provision Net Revenue
The efficiency ratio is a measure of operating expense relative to revenue. We believe the efficiency ratio provides useful information regarding the cost of generating revenue. The methodology of determining the efficiency ratio may differ among companies. We make adjustments to exclude certain items that are not generally expected to recur frequently, as identified in the subsequent schedule, which we believe allow for more consistent comparability among periods. Adjusted noninterest expense provides a measure as to how well we are managing our expenses; adjusted pre-provision net revenue (“PPNR”) enables management and others to assess our ability to generate capital to cover credit losses through a credit cycle. Taxable-equivalent net interest income allows us to assess the comparability of revenue arising from both taxable and tax-exempt sources.
| Three Months Ended | ||||||||||||||||||||||||||||||||
| (In millions) | September 30, 2021 | June 30, 2021 | March 31, 2021 | December 31, 2020 | September 30, 2020 | |||||||||||||||||||||||||||
| Efficiency Ratio | ||||||||||||||||||||||||||||||||
| Noninterest expense (GAAP) | (a) | $ | 429 | $ | 428 | $ | 435 | $ | 424 | $ | 442 | |||||||||||||||||||||
| Adjustments: | ||||||||||||||||||||||||||||||||
| Severance costs | 1 | — | — | 1 | 1 | |||||||||||||||||||||||||||
| Other real estate expense, net | — | — | — | 1 | — | |||||||||||||||||||||||||||
| Restructuring costs | — | — | — | (1) | 1 | |||||||||||||||||||||||||||
| Pension termination-related expense | — | — | (5) | — | — | |||||||||||||||||||||||||||
SBIC investment success fee accrual 1 | (4) | 9 | — | — | — | |||||||||||||||||||||||||||
| Total adjustments | (b) | (3) | 9 | (5) | 1 | 2 | ||||||||||||||||||||||||||
| Adjusted noninterest expense (non-GAAP) | (a-b)=(c) | $ | 432 | $ | 419 | $ | 440 | $ | 423 | $ | 440 | |||||||||||||||||||||
Net interest income (GAAP) | (d) | $ | 555 | $ | 555 | $ | 545 | $ | 550 | $ | 555 | |||||||||||||||||||||
Fully taxable-equivalent adjustments | (e) | 7 | 7 | 8 | 7 | 7 | ||||||||||||||||||||||||||
Taxable-equivalent net interest income (non-GAAP) | (d+e)=(f) | 562 | 562 | 553 | 557 | 562 | ||||||||||||||||||||||||||
| Noninterest income (GAAP) | (g) | 139 | 205 | 169 | 166 | 157 | ||||||||||||||||||||||||||
| Combined income (non-GAAP) | (f+g)=(h) | 701 | 767 | 722 | 723 | 719 | ||||||||||||||||||||||||||
| Adjustments: | ||||||||||||||||||||||||||||||||
| Fair value and nonhedge derivative income (loss) | 2 | (5) | 18 | 8 | 8 | |||||||||||||||||||||||||||
| Securities gains (losses), net | (23) | 63 | 11 | 12 | 4 | |||||||||||||||||||||||||||
| Total adjustments | (i) | (21) | 58 | 29 | 20 | 12 | ||||||||||||||||||||||||||
Adjusted taxable-equivalent revenue (non-GAAP) | (h-i)=(j) | $ | 722 | $ | 709 | $ | 693 | $ | 703 | $ | 707 | |||||||||||||||||||||
Pre-provision net revenue (PPNR) (non-GAAP) | (h)-(a) | $ | 272 | $ | 339 | $ | 287 | $ | 299 | $ | 277 | |||||||||||||||||||||
Adjusted PPNR (non-GAAP) | (j)-(c) | 290 | 290 | 253 | 280 | 267 | ||||||||||||||||||||||||||
Efficiency ratio (non-GAAP) 2 | (c/j) | 59.8 | % | 59.1 | % | 63.5 | % | 60.2 | % | 62.2 | % | |||||||||||||||||||||
1 The success fee accrual is associated with the unrealized gain/(loss) from our SBIC investment in Recursion Pharmaceuticals, Inc., and is adjusted based on the mark-to-market value of the investment. The unrealized gain/(loss) is excluded from the efficiency ratio through securities gains (losses), net.
2 Excluding the $30 million charitable contribution, the efficiency ratio for the three months ended September 30, 2020 would have been 58.0%.
- more -
ZIONS BANCORPORATION, N.A.
Press Release – Page 17
October 18, 2021
| Nine Months Ended | ||||||||||||||
| (In millions) | September 30, 2021 | September 30, 2020 | ||||||||||||
| Efficiency Ratio | ||||||||||||||
| Noninterest expense (GAAP) | (a) | $ | 1,292 | $ | 1,279 | |||||||||
| Adjustments: | ||||||||||||||
| Severance costs | 1 | — | ||||||||||||
| Restructuring costs | — | 2 | ||||||||||||
| Pension termination-related expense | (5) | 28 | ||||||||||||
SBIC investment success fee accrual 1 | 5 | — | ||||||||||||
| Total adjustments | (b) | 1 | 30 | |||||||||||
| Adjusted noninterest expense (non-GAAP) | (a-b)=(c) | $ | 1,291 | $ | 1,249 | |||||||||
| Net interest income (GAAP) | (d) | $ | 1,655 | $ | 1,665 | |||||||||
| Fully taxable-equivalent adjustments | (e) | 22 | 21 | |||||||||||
| Taxable-equivalent net interest income (non-GAAP) | (d+e)=(f) | 1,677 | 1,686 | |||||||||||
| Noninterest income (GAAP) | (g) | 513 | 408 | |||||||||||
| Combined income (non-GAAP) | (f+g)=(h) | 2,190 | 2,094 | |||||||||||
| Adjustments: | ||||||||||||||
| Fair value and nonhedge derivative loss | 15 | (15) | ||||||||||||
| Securities gains, net | 51 | (5) | ||||||||||||
| Total adjustments | (i) | 66 | (20) | |||||||||||
| Adjusted taxable-equivalent revenue (non-GAAP) | (h-i)=(j) | $ | 2,124 | $ | 2,114 | |||||||||
| Pre-provision net revenue (PPNR) | (h)-(a) | $ | 898 | $ | 815 | |||||||||
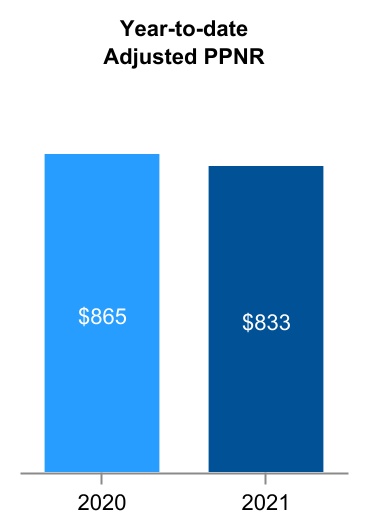
| Adjusted PPNR (non-GAAP) | (j)-(c) | 833 | 865 | |||||||||||
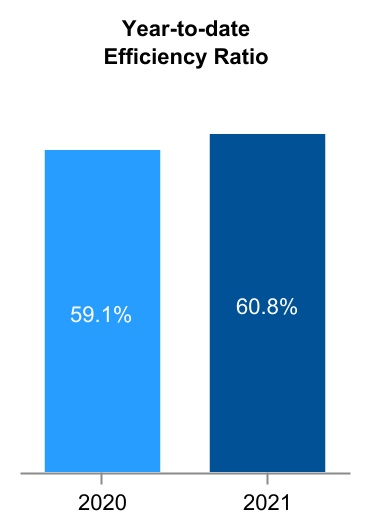
| Efficiency ratio (non-GAAP) | (c/j) | 60.8 | % | 59.1 | % | |||||||||
1 The success fee accrual is associated with the unrealized gain/(loss) from our SBIC investment in Recursion Pharmaceuticals, Inc., and is adjusted based on the mark-to-market value of the investment. The unrealized gain/(loss) is excluded from the efficiency ratio through securities gains (losses), net.
# # #

October 18, 2021 Third Quarter 2021 Financial Review

2 Forward-Looking Statements; Use of Non-GAAP Financial Measures Forward Looking Information This presentation includes “forward-looking statements” as that term is defined in the Private Securities Litigation Reform Act of 1995. These statements are based on management’s current expectations and assumptions regarding future events or determinations, all of which are subject to known and unknown risks, uncertainties and other factors that may cause our actual results, performance or achievements, market trends, industry results or regulatory outcomes to differ materially from those expressed or implied by such forward-looking statements. Forward-looking statements include, among others: ▪ statements with respect to the Bank’s beliefs, plans, objectives, goals, targets, commitments, designs, guidelines, expectations, anticipations, and future financial condition, results of operations and performance; and ▪ statements preceded by, followed by, or that include the words “may,” “might,” “can,” “continue,” “could,” “should,” “would,” “believe,” “anticipate,” “estimate,” “forecasts,” “expect,” “intend,” “target,” “commit,” “design,” “plan,” “projects,” “will,” and the negative thereof and similar words. Forward-looking statements are not guarantees of future performance, nor should they be relied upon as representing management’s views as of any subsequent date. Actual results and outcomes may differ materially from those presented. Important risk factors that may cause such material differences include changes in general economic, regulatory, and industry conditions; changes and uncertainties in fiscal, monetary, regulatory, trade and tax policies and legislative and regulatory changes; changes in interest rates and uncertainty regarding the transition away from the London Interbank Offered Rate ("LIBOR") toward other alternative reference rates; the quality and composition of our loan and securities portfolios; competitive pressures and other factors that may affect aspects of our business, such as pricing and demand for our products and services; our ability to execute our strategic plans, manage our risks, and achieve our business objectives; our ability to develop and maintain information security systems, technologies and controls designed to guard against fraud, cyber and privacy risks; and the effects of the COVID-19 pandemic or other national or international crises or conflicts that may occur in the future and governmental responses to such matters. These factors, among others, are discussed in the Bank’s most recent Annual Report on Form 10-K and Quarterly Report on Form 10-Q, filed with the Securities and Exchange Commission (SEC) and available at the SEC’s Internet site (https://www.sec.gov/). In addition, you may obtain documents filed with the SEC by the Bank free of charge by contacting: Investor Relations, Zions Bancorporation, N.A., One South Main Street, 16th Floor, Salt Lake City, Utah 84133, (801) 844-7637. We caution you against undue reliance on forward-looking statements, which reflect our views only as of the date they are made. Except as may be required by law, Zions Bancorporation, N.A. specifically disclaims any obligation to update any factors or to publicly announce the result of revisions to any of the forward-looking statements included herein to reflect future events or developments. Use of Non-GAAP Financial Measures: This document contains several references to non-GAAP measures, including pre-provision net revenue and the “efficiency ratio,” which are common industry terms used by investors and financial services analysts. Certain of these non-GAAP measures are key inputs into Zions’ management compensation and are used in Zions’ strategic goals that have been and may continue to be articulated to investors. Therefore, the use of such non-GAAP measures are believed by management to be of substantial interest to the consumers of these financial disclosures and are used prominently throughout the disclosures. A full reconciliation of the difference between such measures and GAAP financials is provided within the document, and users of this document are encouraged to carefully review this reconciliation.

▪ Reporting continued strength in deposit growth ▪ We are investing significantly in loans and modest duration securities to generate earnings today ▪ Simultaneously, we are maintaining a strong liquidity profile ▪ Outperforming most peers in credit quality through an ongoing pandemic ▪ Emerging from a challenging operating environment for loan growth ▪ We are countering what has been a challenging loan growth environment with promotional-rate products as a more attractive alternative to money market investments for surplus liquidity resources ▪ We have employed strategies designed to bring new customers to the bank ▪ Promotional products aimed at core small business and affluent clients ▪ >20,000 PPP loans to new to the bank customers ▪ Managing for rising interest rates ▪ We have positioned the bank for future interest rates by carefully managing balance sheet liquidity ▪ An “up 100” interest rate change (+100 basis point parallel interest rate shock) would result in approximately 12% more net interest income (pre-tax ~$250 million annually) ▪ Investing significantly in technology to position the company for improved long-term resiliency, revenue growth and above-average operating leverage 3 Select Themes Key near-term objectives designed to position the bank for superior revenue growth and operating leverage

✓ Earnings and Profitability: ▪ $1.45 diluted earnings/share compared to $2.08 ▪ $272 million Pre-Provision Net Revenue ▪ $290 million Adjusted PPNR(1) ▪ $(46) million provision for credit loss compared to $(123) million ▪ $234 million Net Income Applicable to Common, down from $345 million due to provision for credit loss and securities gains/(losses) ▪ 1.1% Return on Assets (annualized) ▪ 14.2% Return on Average Tangible Common Equity (annualized) ✓ Credit quality (excluding PPP Loans): ▪ 0.69% Nonperforming Assets + loans 90+ days past due / non-PPP loans and leases and other real estate owned ▪ 0.01% net loan recoveries, percent of loans, annualized. Both 2Q and 3Q 2021 experienced net recoveries ▪ Decrease in the allowance for credit loss (“ACL”), to $529 million or 1.11% of non-PPP loans from 1.22% 4 Third Quarter 2021 Financial Highlights Vs. 2Q21, adjusted PPNR was stable, with continue strong increases in deposits and a healthy increase in non-PPP loans Note: For the purposes of comparison in this presentation, we generally use linked-quarter ("LQ"), due to that being the preferred comparison for professional investors and analysts. (1) Adjusted for items such as severance costs, restructuring costs, other real estate expense, pension termination-related expense, securities gains and losses, and accruals for investment and advisory expenses related to the unrealized gain on an SBIC investment. See Appendix for GAAP to non-GAAP reconciliation tables. ✓ Loans and Deposits: Vs. 2Q21, growth rates not annualized ▪ 1.4% decline in period-end loan balances ▪ 1.4% increase in period-end loan balances (excluding PPP loans) ▪ 2.3% increase in period-end deposits ▪ 2.7% increase in period-end total noninterest-bearing deposits ▪ 65% period-end loan-to-deposit ratio ▪ 0.03% cost of total deposits ✓ Capital Strength: ▪ 10.9% Common Equity Tier 1 Ratio (CET1), down from 11.3% ▪ 11.8% (CET1+Allowance for Credit Losses) / Risk-Weighted Assets ▪ $325 million of common stock repurchased during 3Q21

$1.01 $1.66 $1.90 $2.08 $1.45 3Q20 4Q20 1Q21 2Q21 3Q21 Diluted Earnings Per Share Notable Items: ▪ 3Q21: ▪ $(0.12) per share adverse mark-to-market impact from an SBIC investment ▪ $0.01 per share benefit from a credit valuation adjustment on client-related interest rate swaps (“CVA”) ▪ 2Q21: ▪ $0.25 per share benefit from mark-to-market of an SBIC investment ▪ $(0.02) per share adverse effect from CVA ▪ 1Q21: $0.13 per share benefit from securities gains and CVA ▪ 4Q20: $0.09 per share benefit from securities gains and CVA ▪ 3Q20: ▪ $(0.14) per share adverse impact from one-time charitable contribution related to PPP lending activity ▪ $0.06 per share benefit on securities gains and CVA 5 Vs. 2Q21, EPS affected primarily by changes to provision for credit loss and securities gains/(losses) Diluted Earnings per Share Note: EPS calculations assume a 24.5% statutory tax rate $(0.25) $0.31 $0.61 $0.57 $0.22 3Q20 4Q20 1Q21 2Q21 3Q21 EPS Impact of Provision for Credit Losses

0.89% 1.41% 1.57% 1.65% 1.08% 3Q20 4Q20 1Q21 2Q21 3Q21 11.0% 17.8% 20.2% 21.6% 14.2% 3Q20 4Q20 1Q21 2Q21 3Q21 Balance Sheet Profitability 6 Profitability remains healthy; factors that affected EPS also affected balance sheet profitability Return on Assets Return on Tangible Common Equity

7 Credit Quality Ratios Credit quality continues to show improvement, with last 12 months net charge-offs at just 0.04% of average loans Key credit metrics: ▪ Classified loans/loans: 2.9% ▪ NPAs+90(1)/loans + OREO: 0.69% ▪ Annualized net loan losses (recoveries): ▪ (1) basis point in 3Q21 ▪ 0.04% net charge-offs / average loans over the last 12 months Allowance for credit losses: ▪ 1.11% of total loans and leases (1) Nonperforming assets plus accruing loans that were ≥ 90 days past due Note: Net charge-offs / average loans and provision / average loans ratios are annualized for all periods shown Credit Quality 0.0% 0.5% 1.0% 1.5% 2.0% 2.5% 3.0% 3.5% 4.0% 3Q20 4Q20 1Q21 2Q21 3Q21 Classified / Loans NPAs +90/ Loans + OREO ACL / Loans All Ratios Exclude PPP Loans 0.43% 0.13% 0.07% (0.02)% (0.01)% 0.46% (0.56)% (1.11)% (1.05)% (0.39)% NCOs / Loans (ann.) Provision/Avg Loans (ann.)

Capital Strength 8 Our superior risk profile and a healthy, strengthening economy positions us for continued active capital management Common Equity Tier 1 Capital Return of Shareholder Equity Dividends (Common and Preferred(1)) and Share Repurchases 10.4% 10.8% 11.2% 11.3% 10.9% 3Q20 4Q20 1Q21 2Q21 3Q21 $64 $65 $64 $65 $68 $50 $100 $325 3Q20 4Q20 1Q21 2Q21 3Q21 Dividends Buybacks ($ millions) (1) Preferred dividends are expected to be $5.7 million for the first and third quarters of 2022 and $7.8 million for the fourth quarter of 2021 and the second and fourth quarters of 2022.

Adjusted Pre-Provision Net Revenue 9 Adjusted PPNR aided by PPP related revenues (22% of adjusted PPNR in 3Q21) (1) Adjusted for items such as severance costs, restructuring costs, other real estate expense, pension termination-related expense, securities gains and losses, and accruals for investment and advisory expenses related to the unrealized gain on an SBIC investment. This investment will continue to be marked-to-market until the SBIC fund manager divests of the shares, which are subject to a minimum 180-day lock-up period from the initial offering in April 2021. See Appendix for GAAP to non-GAAP reconciliation table. Notable items: ▪ Interest Income from PPP Loans net the professional services expense associated with PPP forgiveness: ▪ 3Q21: $63 million ($63 million income) ▪ 2Q21: $67 million ($68 million less $1 million professional service expense) ▪ 1Q21: $52 million ($60 million less $8 million) ▪ 4Q20: $52 million ($55 million less $3 million) ▪ 3Q20: $52 million ▪ 3Q20: $30 million adverse impact from a one-time charitable contribution related to PPP lending activity $267 $280 $253 $290 $290 $52 $52 $52 $67 $63 3Q20 4Q20 1Q21 2Q21 3Q21 Interest Income from PPP Loans net professional services expense associated with PPP forgiveness Adjusted PPNR (non-GAAP) Adjusted PPNR(1) ($ millions)

Paycheck Protection Program Loans 10 PPP lending success from Zions’ ability to link front line bankers and borrowers with an agile technology deployment Zions PPP Loans Approved New-to- Bank Customers Forgiveness Applications Received(1) Forgiveness Applications Approved by SBA(1) ~77,000 loans ~20,000 ~59,600 ~56,200 $9.9 billion $7.9 billion $6.7 billion Source: SBA PPP Report and internal data. (1) As of September 30, 2021 $6,771 $6,310 $6,135 $5,945 $3,795 3.03% 3.50% 3.98% 4.56% 6.66% 3Q20 4Q20 1Q21 2Q21 3Q21 Average PPP Loans Loan Yields 10th Ranked 10th Nationally for PPP loan dollars originated of consolidated 2020 and 2021 SBA PPP loans ($ millions)

0 5,000 10,000 15,000 20,000 25,000 30,000 35,000 3Q20 4Q20 1Q21 2Q21 3Q21 Existing New Paycheck Protection Program Customers – Enhanced Relationships 11 Growth rate of new services provided to both existing and new-to-bank customers remains steady New Accounts and Services Utilized by PPP Customers New revenue generating services include: ▪ New accounts (checking or loan) ▪ Account analysis / Treasury Internet Banking ▪ ACH and wire transfers / Remote Deposit Capture ▪ Wealth Management / Credit Cards 57,000 20,000 New-to-Bank Customers Existing Customers PPP Loans (Prior to Forgiveness) New accounts and services do not include the PPP loan, or the deposit account required to receive the PPP funds, and includes only products and services that generate revenue Related benefits from PPP customers ▪ Deposit growth exceeding $6 billion ▪ New loans exceeding $550 million ▪ ~50% of PPP (2020 vintage) new-to-bank customers are considered active users of their deposit accounts, rising consistently since origination ▪ Retention rate for new-to-bank customers has been solid

12 Replacing the entire core legacy environment to improve operational resiliency and efficiency • Parameter driven • Real time • One data model • Natively API enabled • Cloud deployable • Modern cyber paradigm • Continuously upgraded & tested • Facilitates automation Modern Architecture Built for Resiliency and Speed • Faster time to market for new products • Unified account opening platform (branch/online/ mobile) • Decreased outage risk • Improves consistency of customer attribute data across numerous apps • 7-day processing (when U.S. adopts) • Real time: Fraud alerts and data entry correction Improved Customer Experience • Intuitive user-friendly front end • Real time data vs. calling the back office • Reduces duplicate data entry • Training simplified Empowered Bankers • General ledger simplification • Credit approval workflow • Loan ops consolidation • Data governance disciplines • Deposit product rationalization • Charter consolidation Driving Modernization FutureCore: A Strategic Technology Advantage for Years to Come Fu tu re C o re as a C at al ys t B e n ef it s o f Fu tu re C o re

Modernized Digital Banking Upgrade Completed for 610,000 Consumers 13 Zions new consumer mobile app ratings jump to third of peers plus five largest U.S. banks Consumer mobile app ratings were taken from the Apple App Store and Google Play App Store on 10/15/2021. ZION rating is the average of six consumer affiliates’ mobile applications: ▪ New digital banking enhances the customer experience by delivering: ▪ Unified platform for online and mobile ▪ Responsive user interface ▪ Robust alert options ▪ New digital banking strengthens Zions competitive position, reduces risk profile ▪ Rapid and continuous deployment capabilities ▪ Advanced security controls ▪ Coming soon: Zions’ small business digital banking upgrade ▪ To be delivered during the first half of 2022 ▪ Builds on digital services already considered by customers to be on par or better than four of the largest U.S. banks (see slide [27] for details) 0.0 0.5 1.0 1.5 2.0 2.5 3.0 3.5 4.0 4.5 5.0 WAL WTFC CMA FHN FNB ASB FRC MTB HBAN BOKF FITB RF PBCT CFG KEY EWBC ZION JPM BAC USB SNV WFC C Average Mobile Banking Ratings Consumer / Retail Banking Stars received, out of five possible Five largest U.S. commercial banks, by assets (avg: 4.7) Zions’ Peers (latest proxy filing; avg: 3.9) Ratings of other banks were calculated with an equal weighting from the Apple App Store and Google Play App Store. App ratings were based on the consumer app for each bank; a single app and associated ratings may cover both consumer and small business. 4.6

$48.2 $47.7 $47.5 $46.8 $47.1 $6.8 $6.3 $6.1 $5.9 $3.8 3.68% 3.71% 3.73% 3.77% 3.82% $0.0 $25.0 $50.0 $75.0 3Q20 4Q20 1Q21 2Q21 3Q21 Average Total Loans Excluding PPP Loans, Yield: 3.59% in 3Q21 Average PPP Loans, Yield: 6.66% in 3Q21 Average Loan and Deposit Growth Average Total Loans Yield on Total Loans Average Total Deposits Cost of Total Deposits 14 Vs. 2Q21, average non-PPP loans increased 0.5% in 3Q21; average deposits increased 3.7% $35.7 $36.2 $37.7 $38.1 $39.1 $30.8 $32.0 $33.7 $36.5 $38.3 0.11% 0.08% 0.05% 0.04% 0.03% $0.0 $25.0 $50.0 $75.0 3Q20 4Q20 1Q21 2Q21 3Q21 Average Noninterest-bearing Deposits Average Interest-bearing Deposits ($ billions) ($ billions)

▪ Interest rate sensitivity reduced through interest rate hedges(1): ▪ $3.6B in securities purchases in 3Q21 with an avg yield of 1.53% ▪ $1.5B in forward-starting interest-rate swaps added in 3Q21 with a weighted average rate of 0.94% 0.00% 2.06% 1.31% 0.00% 0.50% 1.00% 1.50% 2.00% 2.50% $0 $500 $1,000 $1,500 $2,000 $2,500 $3,000 Through the End of 2021 2022 2023–2027 Net Swaps Maturing Average Receive-Fixed Rate (R-Axis) $0 million $(27) million $(41) million Securities, Money Market Investments and Interest Rate Swaps 15 Total Securities Portfolio and Money Market Investments (end of period balances) $15.5 $16.6 $17.4 $19.0 $21.2 $3.7 $6.8 $9.7 $11.8 $11.3 3Q20 4Q20 1Q21 2Q21 3Q21 Total Securities Money Market Investments ($ billions) The securities portfolio increased $2.3 B in 3Q21, absorbing deposit growth ▪ Strong deposit growth has significantly increased the bank’s overall liquidity profile ▪ 3Q21 period-end securities growth was $2.3 billion and accounted for 25% of period-end interest-earning assets ▪ 3Q21 period-end money market investments declined $0.5 billion and accounted for 14% of period-end interest-earning assets ($ millions) Δ in Interest Income assuming no further swap activity (1) Text boxes indicate the annual net interest income reductions from the most recent quarter’s annualized net interest income if no additional swaps were added and if 1M Libor were to remain constant. 26% 30% 34% 37% 39% Percent of earning assets

$555 $550 $545 $555 $555 3.06% 2.95% 2.86% 2.79% 2.68% 3Q20 4Q20 1Q21 2Q21 3Q21 Net Interest Income and Net Interest Margin Net Interest Income Net Interest Margin 16 Net interest income stability assisted by PPP success ($ millions) Net Interest Margin 2Q21 3Q21 Securities Loan Yields Interest Bearing Deposits As of September 30, 2021, unamortized net origination fees related to the PPP loans totaled $83 million, to be amortized over the remaining life of approximately four years or when loans pay down, pay off, or are forgiven by the SBA. Zions’ active efforts to invest the inflow of deposits has helped to limit the compression of the net interest margin. The increase in average securities over the past year (as opposed to leaving it in cash) has supported the NIM by eight (8) basis points in 3Q21. Money market invest- ments Strong deposit growth resulted in strong money market investment and securities portfolio growth

4 9 % 1 4 % 1 0 % 8 % 1 0 % 9 % 3 0 % 1 4 % 1 0 % 9 % 2 6 % 1 1 % ≤ 3m 4-12m 1-2 yrs 2-3 yrs 3-5 yrs > 5 yrs Pe rc en t o f Lo an s Loans: Rate Reset and Cash Flow Profile Loans After Hedging Interest Rate Sensitivity 17 The low interest rate environment and surge in deposits has resulted in increased asset sensitivity Source: Company filings and S&P Global; “Prior Fed Cycle” refers to 3Q15-2Q19, reflecting the lag effect of deposit pricing relative to Fed Funds rates. The “Current Fed Cycle” begins in 3Q19 to present. (1) 12-month simulated impact of an instantaneous and parallel change in interest rates. Loans are assumed to experience prepayments, amortization and maturity events, in addition to interest rate resets in chart on the right. The loan and securities portfolios have durations of 1.8 and 3.0 years, respectively. -6% 12% 25% −100 bps +100 bps +200 bps Net Interest Income Sensitivity (1) A ss u m ed H is to ri ca l In the down 100 scenario, models assume rates do not fall below zero 18% 21% 15% 14% 1% Prior Fed Cycle (+225 bps) Current Fed Cycle (-225 bps) +200 bps +100 bps −100 bps Total Deposit Betas

$139 $139 $133 $139 $151 3Q20 4Q20 1Q21 2Q21 3Q21 Customer-related fee income increased from the prior quarter due to: ▪ $6 million increase in loan-related fees and income, primarily from mortgage banking activities ▪ Incremental increase in retail banking fees, card fees, wealth management and other fees Over the longer term, customer-related fees are benefitting from improved capital markets, wealth management, and mortgage banking activities Noninterest Income 18 Customer-Related Fee Income (1) Total customer-related fee income increased 9% from 2Q21 primarily due to an increase in loan-related fee income (1) Reflects total customer-related noninterest income, which excludes items such as fair value and non-hedge derivative income, securities gains (losses), and other items, as detailed in the Noninterest Income table located in the earnings release. ($ millions)

$ 4 4 2 $ 4 2 4 $ 4 3 5 $ 4 2 8 $ 4 2 9 $ 4 4 0 $ 4 2 3 $ 4 4 0 $ 4 1 9 $ 4 3 2 3Q20 4Q20 1Q21 2Q21 3Q21 NIE (GAAP) Adjusted NIE (Non-GAAP) ($ millions) Noninterest Expense 19 Increase in expense in 3Q21 reflects primarily increased incentive compensation ▪ Total noninterest expense increased slightly over the prior quarter ▪ Total adjusted noninterest expense increased 3% over the prior quarter, predominantly due to increased variable compensation accruals as YTD net income performance has exceeded expectations ▪ Notable items in: ▪ 3Q21: $(4) million success fee reversal related to the IPO of an SBIC investment in 2Q21 ▪ 2Q21: $9 million success fee accrual ▪ 3Q20: $30 million from one-time charitable contribution related PPP lending activity (not reflected in Adjusted NIE) (1) Adjusted for items such as severance, provision for unfunded lending commitments, securities gains and losses and investment, and accruals for investment and advisory expenses related to the unrealized gain on an SBIC investment. See Appendix for GAAP to non-GAAP reconciliation table. Noninterest Expense (NIE) (1)

20 Allowance for Credit Loss (“ACL”) ACL decrease from 2Q21 reflects continued improvement in portfolio mix, credit quality and economic forecasts 526 777 914 917 835 695 574 529 1.08 1.56 1.88 1.91 1.74 1.48 1.22 1.11 1/1/20 CECL 1Q20 2Q20 3Q20 4Q20 1Q21 2Q21 3Q21 Allowance for Credit Loss ACL (%) ex-PPP The change in 3Q21 ACL from 2Q21 reflects: ▪ Overall de-risking of the portfolio through shortened weighted average life and change in portfolio mix ▪ Continued improvement in credit quality and economic conditions • Changes to economic forecasts • Economic uncertainty • Loan portfolio churn • Portfolio mix • Aging of existing loans • Changes in credit quality • Changes in specific reserves CECL Economic Forecast Assumptions • Probability weighting of four economic scenarios • Reasonable and supportable forecast period: 12 months; reversion to long- term average: 12 months • Economic factors vary depending upon the type of loan, but include various combinations of national, state, and MSA-level forecasts for variables such as unemployment, real estate price indices, energy prices, GDP, etc. ($ millions) 3Q21

Financial Outlook (3Q 2022E vs 3Q 2021A) 21 Outlook Comments Moderately Increasing ▪ Moderate growth in the next twelve months, excluding PPP loans Increasing ▪ Assumes no change in interest rates ▪ Excludes PPP loan income Stable to Slightly Increasing ▪ Customer-related fees excludes securities gains and dividends Moderately Increasing ▪ 3Q22 expected to be moderately higher than 3Q21’s $432 million adjusted NIE ▪ Improved confidence in the economic outlook combined with strong capital ratios expected to allow continued active capital management Customer-Related Fees Loan Balances Net Interest Income Capital Management Adjusted Noninterest Expense

▪ Financial results summary ▪ Loan growth by geography and type ▪ Loan loss severity (NCOs as a percentage of nonperforming assets) ▪ Mortgage banking results ▪ GAAP to Non-GAAP reconciliation 22 Appendix

Financial Results Summary 23 Solid and improving fundamental performance Three Months Ended (Dollar amounts in millions, except per share data) September 30, 2021 June 30, 2021 March 31, 2021 Earnings Results: Diluted Earnings Per Share $ 1.45 $ 2.08 $ 1.90 Net Earnings Applicable to Common Shareholders 234 345 314 Net Interest Income 555 555 545 Noninterest Income 139 205 169 Noninterest Expense 429 428 435 Pre-Provision Net Revenue - Adjusted (1) 290 290 253 Provision for Credit Losses (46) (123) (132) Ratios: Return on Assets(2) 1.08 % 1.65 % 1.57 % Return on Common Equity(3) 12.3 % 18.6 % 17.4 % Return on Tangible Common Equity(3) 14.2 % 21.6 % 20.2 % Net Interest Margin 2.68 % 2.79 % 2.86 % Yield on Loans 3.82 % 3.77 % 3.73 % Yield on Securities 1.63 % 1.71 % 1.77 % Average Cost of Total Deposits(4) 0.03 % 0.04 % 0.05 % Efficiency Ratio (1) 59.8 % 59.1 % 63.5 % Effective Tax Rate 22.8 % 22.2 % 21.7 % Ratio of Nonperforming Assets to Loans, Leases and OREO 0.64 % 0.60 % 0.61 % Annualized Ratio of Net Loan and Lease Charge-offs to Average Loans (0.01) % (0.02) % 0.06 % Common Equity Tier 1 Capital Ratio(5) 10.9% 11.3% 11.2% (1) Adjusted for items such as severance costs, restructuring costs, other real estate expense, pension termination-related expense, securities gains and losses and investment and advisory expense related to the successful IPO of the SBIC investment. See Appendix for GAAP to non-GAAP reconciliation tables. (2) Net Income before Preferred Dividends or redemption costs used in the numerator; (3) Net Income Applicable to Common used in the numerator; (4) Includes noninterest-bearing deposits; (5) Current period ratios and amounts represent estimates

24 Loan Growth - by Bank Brand and Loan Type “Other” loans includes municipal and other consumer loan categories. Totals shown above may not foot due to rounding. Period-End Year over Year Loan Growth (3Q21 vs. 3Q20) Period-End Linked Quarter Loan Growth (3Q21 vs. 2Q21) (in millions) Zions Bank Amegy CB&T NBAZ NSB Vectra CBW Other Total C&I (ex-Oil & Gas) 10 145 151 3 (2) 13 5 - 325 SBA PPP (301) (263) (372) (133) (134) (123) (55) - (1,381) Owner occupied 103 (40) - 85 42 11 14 - 215 Energy (Oil & Gas) 18 (36) (2) (18) - (19) 1 - (56) Municipal 82 1 7 20 (14) 26 59 4 185 CRE C&D 13 84 98 20 7 32 13 - 267 CRE Term (38) (166) (36) 48 (12) (5) (13) - (222) 1-4 Family 10 (88) 17 (43) (10) (9) (2) (4) (129) Home Equity 45 16 27 10 4 8 (3) - 107 Other (3) (4) (19) (8) 2 1 (2) 2 (31) Total net loans (61) (351) (129) (16) (117) (65) 17 2 (720) (in millions) Zions Bank Amegy CB&T NBAZ NSB Vectra CBW Other Total C&I (ex-Oil & Gas) (107) 86 218 (117) 40 (17) 20 - 123 SBA PPP (1,082) (720) (712) (437) (360) (209) (210) - (3,730) Owner occupied 137 6 (20) 151 42 (31) 25 - 310 Energy (Oil & Gas) (1) (424) - (17) - (20) - - (462) Municipal 327 75 61 4 (64) 151 90 50 694 CRE C&D 46 131 102 67 19 89 91 - 545 CRE Term (159) (199) (19) 32 (16) (49) (9) - (419) 1-4 Family (207) (498) (20) (150) (92) (80) (11) (11) (1,069) Home Equity 27 41 20 (26) (16) (8) (1) - 37 Other (13) (50) (19) (3) 3 (7) (10) 3 (96) Total net loans (1,032) (1,552) (389) (496) (444) (181) (15) 42 (4,067)

6 % 1 6 % 2 3 % 3 1 % 3 1 % 3 8 % 4 0 % 4 0 % 4 2 % 4 4 % 4 6 % 5 6 % 5 7 % 5 7 % 5 7 % 6 6 % 7 9 % FR C P B C T B O K F A SB ZI O N C M A C FG FH N W A L W TF C FN B EW B C R F SN V K EY H B A N FI TB 3 % 1 2 % 1 2 % 1 5 % 1 6 % 2 1 % 2 8 % 3 0 % 3 2 % 3 7 % 4 6 % 4 7 % 5 1 % 5 3 % 5 3 % 5 3 % 6 4 % FR C W A L P B C T ZI O N FH N B O K F W TF C A SB EW B C C M A C FG K EY FN B SN V H B A N R F FI TB Loan Loss Severity Annualized NCOs / Nonaccrual Loans Five Year Average (2016 – 2020) Annualized NCOs / Nonaccrual Loans Fifteen Year Average (2006 – 2020) 25Source: S&P Global. Calculated using the average of annualized quarterly results. Note: Survivorship bias: some banks that may have been included in Zions’ peer group have been excluded due to their failed or merged status. When problems arise, Zions generally experiences less severe loan losses due to strong collateral

26 Mortgage Banking Successes amid COVID-19 pandemic: very strong mortgage revenue $485 $433 $435 $627 $651 $433 $409 $411 $383 $345 3Q20 4Q20 1Q21 2Q21 3Q21 Strong Mortgage Funding HFI HFS $918 million $996 million ($ millions) $18.2 $10.4 $10.6 $7.8 $11.3 3Q20 4Q20 1Q21 2Q21 3Q21 Loan Sales Revenue 2019 ▪ Roll-out 2020 ▪ Enhanced Digital Fulfillment Process ▪ 87% of all applications taken digitally ▪ 25% reduction in turn-time allowing for record unit production 3Q21 ▪ Funded approximately $1 Billion in mortgage loans for Q3, raising the total YTD to $2.85 Billion ▪ Pipeline of $1.9 Billions will allow for continued strong funding volume through the end of the year. ▪ Mortgage Operations continues to improve turn times as newly released technology and updated processes create efficiencies ▪ Underwriting metrics remain strong: ▪ FICO: average 759 ▪ LTV: average 62% ▪ DTI: average 30%

Middle Market and Small Business Research Feedback Source: 2020 Greenwich Associates Market Tracking Program Nationwide *Major Competitors: JPMorgan, Bank of America Merrill Lynch, US Bank, Wells Fargo ** Excellent Citations are a "5" on a 5 point scale from "5" excellent to "1" poor Zions compares favorably to major competitors (JPMorgan, Bank of America, US Bank, Wells Fargo) 27 Major Competitors* (Average Score %) Closest Competitor's Score % Our Rank (2020) Middle Market (Revenues of $10-$500 million) Overall Satisfaction Overall Satisfaction - Customers 61 45 55 1st Bank You Can Trust 75 61 69 1st Values Long-Term Relationships 70 61 69 1st Ease of Doing Business 65 55 61 1st Digital Product Capabilities 59 55 65 2nd Satisfaction with our Bankers Overall Customer Satisfaction with Relationship Managers 67 64 71 2nd Overall Customer Satisfaction with Cash Management Specialist 69 63 68 1st Credit Process Willingness to Extend Credit 73 70 92 2nd Speed in Responding to a Loan Request 70 66 78 3rd Flexible Terms and Conditions 67 63 80 3rd Net Promoter Score 56 33 48 1st Small Business (Revenues of $1-$10 million) Overall Satisfaction Overall Satisfaction - Customers 70 42 49 1st Bank You Can Trust 78 57 66 1st Values Long Term Relationships 76 53 68 1st Ease of Doing Business 75 55 63 1st Digital Product Capabilities 64 51 60 1st Satisfaction with our Bankers Overall Customer Satisfaction with Relationship Managers 78 60 74 1st Overall Customer Satisfaction with Cash Management Specialist 85 72 94 2nd Credit Process Willingness to Extend Credit 67 55 68 2nd Speed in Responding to a Loan Request 76 53 66 1st Flexible Terms and Conditions 63 48 57 1st Net Promoter Score 55 15 36 1st % of "Excellent" Customer Citations** Greenwich Associates Customer Satisfaction Categories Zions Bancorporation Client Score % % of "Excellent" Customer Citations**

28 GAAP to Non-GAAP Reconciliation In millions, except per share amounts 3Q21 2Q21 1Q21 4Q20 3Q20 Pre-Provision Net Revenue (PPNR) (a) Total noninterest expense $429 $428 $435 $424 $442 LESS adjustments: Severance costs 1 1 1 Other real estate expense 1 - Provision for unfunded lending commitments - - Pension Termination related expense - - Restructuring costs (5) (1) 1 SBIC Investment Success Fee Accrual (4) 9 (b) Total adjustments (3) 9 (5) 1 2 (a-b)=(c) Adjusted noninterest expense 432 419 440 423 440 (d) Net interest income 555 555 545 550 555 (e) Fully taxable-equivalent adjustments 7 7 8 7 7 (d+e)=(f) Taxable-equivalent net interest income (TE NII) 562 562 553 557 562 (g) Noninterest Income 139 205 169 166 157 (f+g)=(h) Combined Income $701 $767 $722 $723 $719 LESS adjustments: Fair value and nonhedge derivative income (loss) 2 (5) 18 8 8 Securities gains (losses), net (23) 63 11 12 4 (i) Total adjustments (21) 58 29 20 12 (h-i)=(j) Adjusted revenue $722 $709 $693 $703 $707 (j-c) Adjusted pre- provision net revenue (PPNR) $290 $290 $253 $280 $267 (c)/(j) Efficiency Ratio 59.8% 59.1% 63.5% 60.2% 62.2%

29 GAAP to Non-GAAP Reconciliation (Continued) In millions, except per share amounts 3Q21 2Q21 1Q21 4Q20 3Q20 Net Earnings Applicable to Common Shareholders (NEAC) (k) Net earnings applicable to common $234 $345 $314 $275 $167 (l) Diluted Shares (average) 160 163 164 164 164 GAAP Diluted EPS 1.45 2.08 1.90 1.66 1.01 PLUS Adjustments: Adjustments to noninterest expense (3) 9 (5) 1 2 Adjustments to revenue 21 (58) (29) (20) (12) Tax effect for adjustments (4) 12 8 5 3 Preferred stock redemption - - - (m) Total adjustments 14 (37) (26) (14) (7) (k+m)=(n) Adjusted net earnings applicable to common (NEAC) 248 308 288 261 160 (n)/(l) Adjusted EPS 1.53 1.85 1.74 1.58 0.97 (o) Average assets 88,556 85,957 83,080 80,060 77,983 (p) Average tangible common equity 6,554 6,421 6,317 6,150 6,063 Balance Sheet Profitability (n)/(o) Adjusted Return on Assets 1.12% 1.44% 1.38% 1.30% 0.82% (n)/(p) Adjusted Return on Tangible Common Equity 15.2% 19.2% 18.2% 16.9% 10.6%
Serious News for Serious Traders! Try StreetInsider.com Premium Free!
You May Also Be Interested In
- Zions Bancorp (ZION) PT Lowered to $45 at UBS
- Amerant Reports First Quarter 2024 Results
- Zions Bancorp (ZION) PT Raised to $42 at Piper Sandler
Create E-mail Alert Related Categories
SEC FilingsSign up for StreetInsider Free!
Receive full access to all new and archived articles, unlimited portfolio tracking, e-mail alerts, custom newswires and RSS feeds - and more!
