

Form 8-K WATERS CORP /DE/ For: May 19
 Tweet
Tweet Share
ShareEXHIBIT 99.1
2022 Analyst & Investor Day May 19, 2022 watersTM
Caspar Tudor Head of Investor Relations watersTM waters
watersTM Cautionary Statements This estimates. presentation For this contains purpose, forward-looking any statements statements that are not regarding statements future of historical results and fact events, may be including deemed financial forward-looking and operational statements. guidance Words and such projected as “may,” conditions “will,” “expect,” or circumstances) “plan,” “anticipate,” are intended “estimate,” to identify “intend” forward-looking , “project” and statements. similar expressions Forward-looking (as well as statements other words are or based expressions on current referencing expectations future and events, products, assumptions and and customer currently trends. available You data should and not are place neither undue predictions reliance nor on forward-looking guarantees of future statements, events or which performance, speak only market as of the growth, date success hereof and of our should not be update relied or upon revise as any representing forward-looking the Company’s statements estimates after they or are views made, as of whether any date as subsequent a result of new to the information, date of this future presentation. events, or We otherwise, do not undertake except as to required by for applicable reference purposes, law. Please only, also and note has that not the been guidance updated provided or reaffirmed herein as with of respect this or any to 2022, other which date. The was Company’s first publicly actual disclosed future on results May 3, may 2022, differ is included risks significantly related from to the the effects results of discussed the ongoing in COVID-19 the forward-looking pandemic statements on our business, within this financial presentation condition, for results a variety of operations of reasons, and including prospects, and without including: limitation, portions of other our reasons global workforce related to being the pandemic, unable to increased work fully and/or risks of effectively cyber-attacks due resulting to working from remotely, our temporary illness, quarantines, remote working government model, disruptions actions, facility in our closures or manufacturing unable to make capabilities timely payments or to our for supply purchases chain, and volatility volatility and in uncertainty demand for in our global products; capital foreign markets exchange limiting rate our ability fluctuations to access potentially capital, affecting customers translation being companies; of the Company’s environmental future non-U. and logistical S. operating obstacles results; affecting fluctuations the distribution in expenditures of products by the Company’s and risks associated customers, with in particular lawsuits and large other pharmaceutical legal actions, sections particularly entitled involving “Forward-Looking claims for infringement Statements” of patents and “Risk and Factors” other intellectual of the Company’s property rights. annual Such report factors on Form and 10-K others for are the discussed year ended more December fully in 31, the 2021 as filed Company’s with the Quarterly Securities Reports and Exchange on Form Commission 10-Q, as well on as February the Company’s 24, 2022, 2021 as Annual updated Report. by the Company’s subsequent filings with the SEC, including the This These presentation measures should contains always certain be non-GAAP considered measures, in conjunction which with are the provided appropriate to assist GAAP in an measure. understanding Reconciliations of the Company’s of non-GAAP business amounts and to its the performance. GAAP amounts filings with are the included SEC. in the Appendix to this presentation, available on the Company’s website at: https://ir.waters.com/, and in the Company’s Form 8-K filings with the SEC. ©2022 Waters Corporation 2
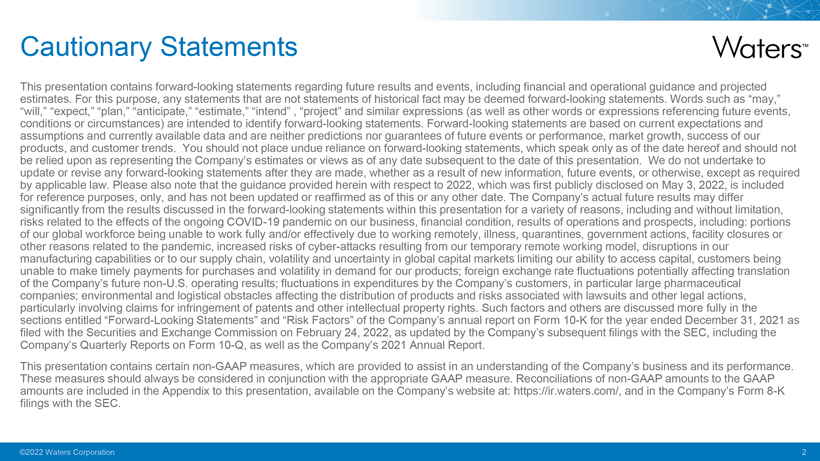
Today’s Agenda watersTM Dr. Udit Batra President & Chief Executive Officer Appointed September 2020; previously CEO of life science business of Merck KGaA B.S. and Ph.D. in Chemical Engineering 1 Waters Value Creation Model 10:00am ET 20 mins Jon Pratt SVP, Waters Division Appointed 2019; previously President of Beckman Coulter Life Sciences B.S. in Chemistry; MBA Jianqing Bennett SVP, TA Instruments Division and Clinical Business Appointed 2021; previously SVP of High Growth Markets, Beckman Coulter Diagnostics B.S. in Biomed. Eng.; MBA Amol Chaubal SVP, Chief Financial Officer Appointed 2021; previously CFO at Quanterix and CFO of Global Ops, Smith & Nephew Masters in Chem. Eng.; MBA Q&A Panel 2 Transformation & Growth 10:20am ET 40 mins 3 Delivering Strong, Consistent Results 11:00am ET 20 mins 4 Q&A Session 11:20am ET 40 mins ©2022 Waters Corporation 3
watersTM Dr. Udit Batra President & Chief Executive Officer
watersTM Key Messages Attractive and Resilient Base Waters Back on Track Executing Growth Plan ©2022 Waters Corporation 5
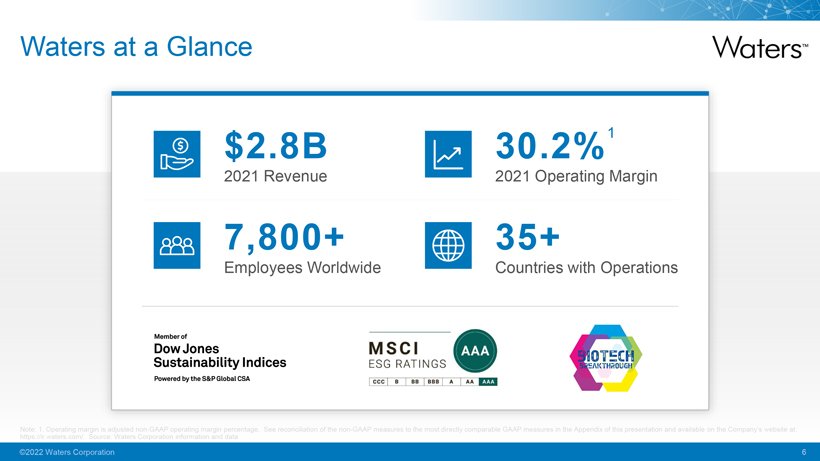
Waters at a Glance watersTM $2.8B 2021 Revenue 30.2%1 2021 Operating Margin 7,800+ Employees Worldwide 35+ Countries with Operations Member of Dow jones sustainability indices powered by the s&p global CSA MSCI AAA ESG RATINGS CCC B BBB A AA AAA BIOTECH BREAKTHROUGH Note: https://ir 1. .Operating waters.com/ margin . Source: is adjusted Waters non Corporation -GAAP operating information margin and percentage data . See reconciliation of the non-GAAP measures to the most directly comparable GAAP measures in the Appendix of this presentation and available on the Company’s website at: ©2022 Waters Corporation 6
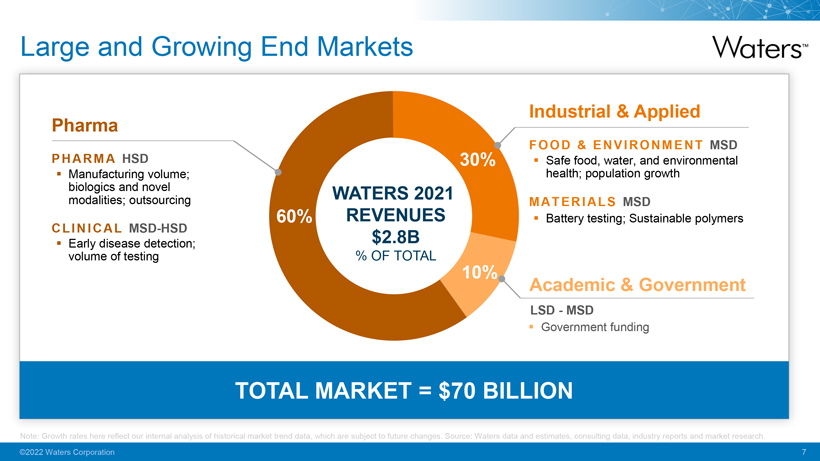
WatersTM Large and Growing End Markets Pharma PHARMA HSD ◾ Manufacturing biologics and novel volume; modalities; outsourcing CLINICAL MSD-HSD ◾ Early volume disease of testing detection; Industrial & Applied FOOD & ENVIRONMENT MSD ◾ health; Safe food, population water, and growth environmental MATERIAL S MSD ◾ Battery testing; Sustainable polymers Academic & Government LSD—MSD ◾ Government funding WATERS 2021 REVENUES $2.8B % OF TOTAL 60% 30% 10% TOTAL MARKET = $70 BILLION Note: Growth rates here reflect our internal analysis of historical market trend data, which are subject to future changes. Source: Waters data and estimates, consulting data, industry reports and market research. ©2022 Waters Corporation 7
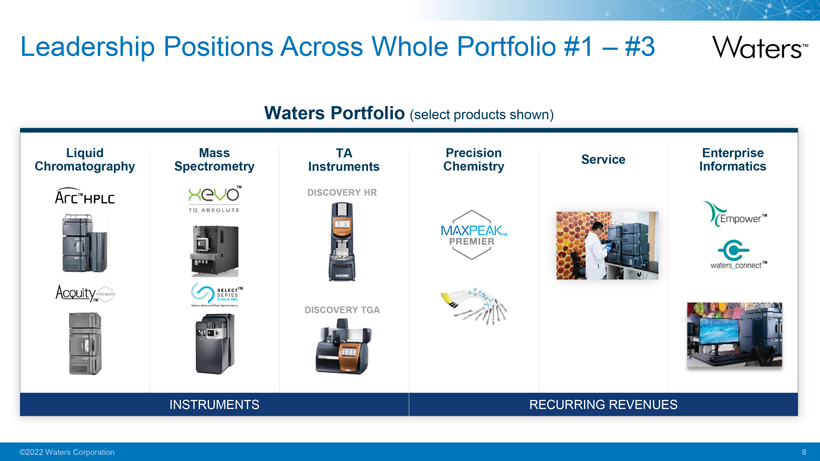
Leadership Positions Across Whole Portfolio #1 – #3 waterTM Waters Portfolio (select products shown) Chromatography Liquid ArcTM HPLC Acquitytm Premier Spectrometry Mass XevoTM TQ ABSOLUTE selectTM series cyclic ims waters advanced mass spectrometry Instruments TA DISCOVERY HR DISCOVERY TGA Chemistry Precision maxpeakTM premier Service Informatics Enterprise empowerTM waters_connectTM INSTRUMENTS RECURRING REVENUES ©2022 Waters Corporation 8
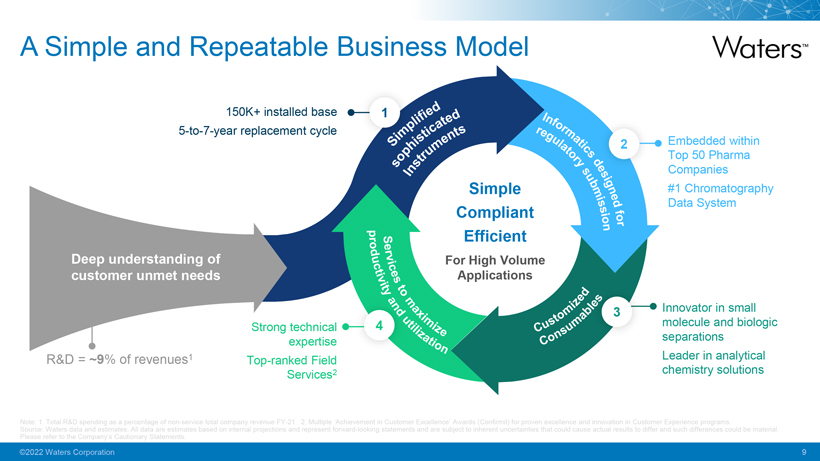
A Simple and Repeatable Business Model watersTM 150K+ installed base 5-to-7-year replacement cycle 1 Deep understanding of customer unmet needs R&D = ~9% of revenues1 Embedded within Top 50 Pharma Companies #1 Chromatography Data System 2 Innovator in small molecule and biologic separations Leader in analytical chemistry solutions Strong technical expertise Top-ranked Field Services2 4 Simplified sophisticated instruments services to maximize productivity and utilization customized consumables informatics designed for regulatory submission simple compliant efficient for high volume applications Source: Note: 1. Waters Total R&D data spending and estimates as a percentage . All data are of estimates non-service based total on company internal revenue projections FY- 21 and 2 represent . Multiple forward ‘Achievement -looking in statements Customer Excellence’ and are subject Awards to inherent (Confirmit) uncertainties for proven that excellence could cause and innovation actual results in Customer to differ and Experience such differences programs could . be material. Please refer to the Company’s Cautionary Statements. ©2022 Waters Corporation 9
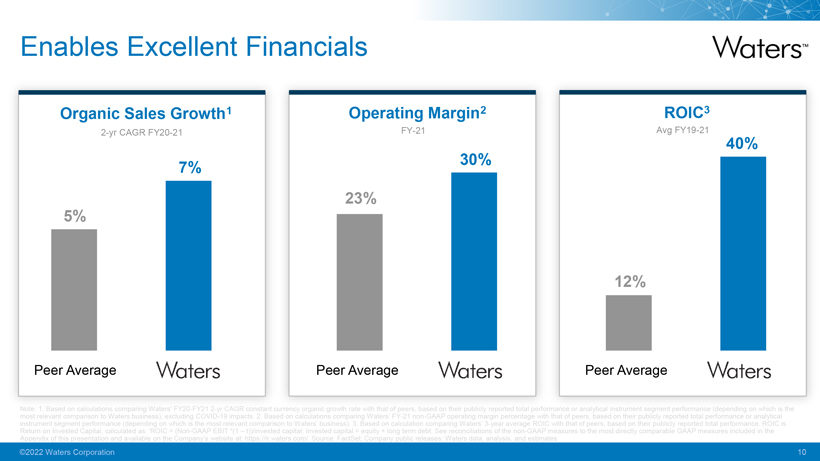
Enables Excellent Financials watersTM Organic Sales Growth1 2-yr CAGR FY20-21 5% Peer Average 7% waters Operating Margin2 FY-21 23% Peer Average 30% waters ROIC3 Avg FY19-21 12% Peer Average 40% waters Note: most relevant 1. Based comparison on calculations to Waters comparing business), Waters’ excluding FY20-FY21 COVID-19 2-yr CAGR impacts. constant 2. Based currency on calculations organic growth comparing rate with Waters’ that of FY-21 peers, non-GAAP based on operating their publicly margin reported percentage total performance with that of or peers, analytical based instrument on their publicly segment reported performance total performance (depending or on analytical which is the Return instrument on Invested segment Capital, performance calculated (depending as: ‘ROIC on which = (Non-GAAP is the most EBIT relevant *(1 – t))/invested comparison capital; to Waters’ Invested business) capital . 3. = Based equity + on long calculation term debt. comparing See reconciliations Waters’ 3-year of the average non-GAAP ROIC measures with that of to peers, the most based directly on their comparable publicly GAAP reported measures total performance. included in ROIC the is Appendix of this presentation and available on the Company’s website at: https://ir.waters.com/. Source: FactSet; Company public releases; Waters data, analysis, and estimates ©2022 Waters Corporation 10
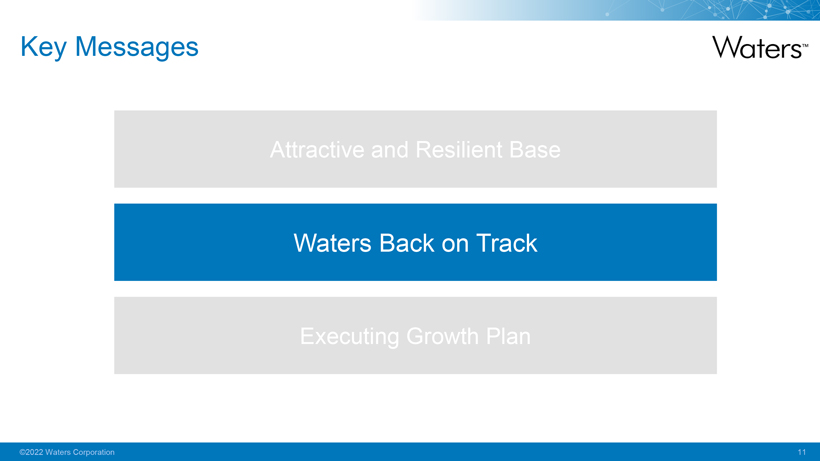
Key Messages watersTM Attractive and Resilient Base Waters Back on Track Executing Growth Plan ©2022 Waters Corporation 11

Transformation on Track WATERSTM Regained Commercial Momentum Built a Strong Team Growth Plan on Track ©2022 Waters Corporation 12

Specific Commercial Initiatives Market+ Growth Drivers 1 Instrument Replacement 2 Service Attachment 3 Contract Organizations 4 eCommerce Adoption 5 Launch Excellence +~100bps average growth 2022–24 ©2022 Waters Corporation 13

Regained Commercial Momentum watersTM Organic Revenue Growth In Constant Currency 6% 4% Market Growth Range 2017 2018 1% 2019 7% 2020 – 21 (2-yr stacked) 7.5 – 9% FY 2022 Guidance year Note: 2022 Showing guidance, Waters’ as year-over-year communicated growth during our rate 1Q22 from 2017 earnings through call on 2019 May then 3, 2022. two year All growth stacked rates analysis organic for years in constant 2020 and currency. 2021 to See adjust reconciliation for the distorting of the non-GAAP effects of the measures Covid-19 to the pandemic, most directly followed comparable by our current GAAP full- measures included in the Appendix of this presentation and available on the Company’s website at: https://ir.waters.com/. Source: Company public releases, Waters Analysis ©2022 Waters Corporation 14

Continuing Strength Q1 2022 Q1 2022 Waters Constant Currency Revenue Growth: +16% Y/Y watersTM Portfolio Instruments +26% Service +9% Chemistry +8% TA +18% Geography Americas +26% Europe +9% China +17% APAC (ex-China) +12% Customer Pharmaceutical +19% Industrial +17% Academic & Govt. +4% Note: https://ir A .reconciliation waters.com/. of APAC these (ex non -China) -GAAP sales measures growth to as the reported most directly was 5% comparable and China GAAP sales growth measures as reported is included was in 18% the Appendix of this presentation and in the Company’s press release dated May 3, 2022, available on the Company’s website at: ©2022 Waters Corporation 15
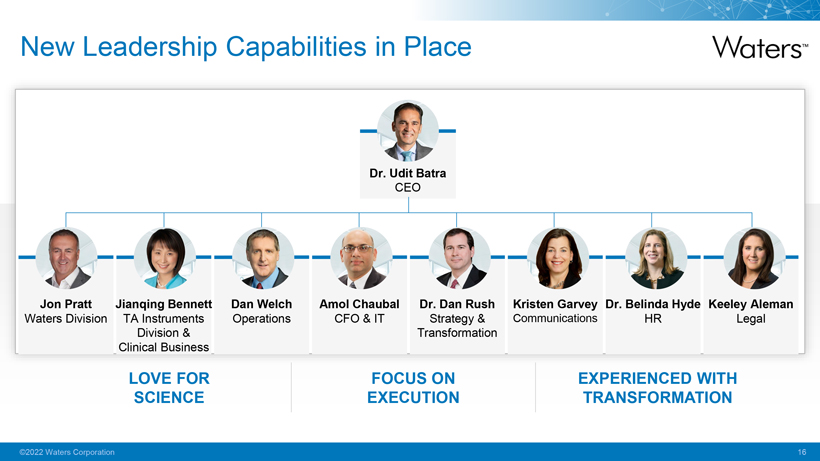
New Leadership Capabilities in Place watersTM Dr. Udit Batra CEO Jon Pratt Waters Division Jianqing Bennett TA Instruments Division & Clinical Business Dan Welch Operations Amol Chaubal CFO & IT Dr. Dan Rush Strategy & Transformation Kristen Garvey Communications Dr. Belinda Hyde HR Keeley Aleman Legal LOVE FOR FOCUS ON EXPERIENCED WITH SCIENCE EXECUTION TRANSFORMATION ©2022 Waters Corporation 16

Innovation Contributing Strongly (1/2) WATERSTM ARCTM HPLC AcquityTM PREMIER MAXPEAKTM PREMIER Note: *1Q22 Unit sales of Arc HPLC and Acquity Premier were over 3x 1Q21 levels Launched June 2020 Launched February 2021 Launched October 2020 Demand grew 3x Y/Y* Fastest column launch in Waters history ©2022 Waters Corporation 17
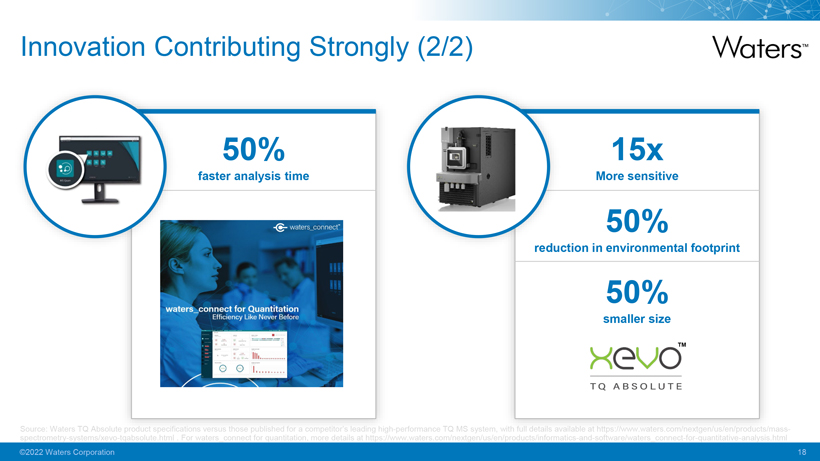
Innovation Contributing Strongly (2/2) watersTM 50% faster analysis time waters_connectTM waters_connect for quantitation efficiency like never before 15x More sensitive 50% reduction in environmental footprint 50% smaller size xevoTM tq absolute Source: spectrometry Waters -systems/xevo TQ Absolute -tqabsolute product specifications .html . For waters versus _connect those published for quantitation, for a competitor’s more details leading at https://www high-performance .waters.com/nextgen/us/en/products/informatics TQ MS system, -and-software/waters_connect-for-quantitative-analysis.html ass-©2022 Waters Corporation 18
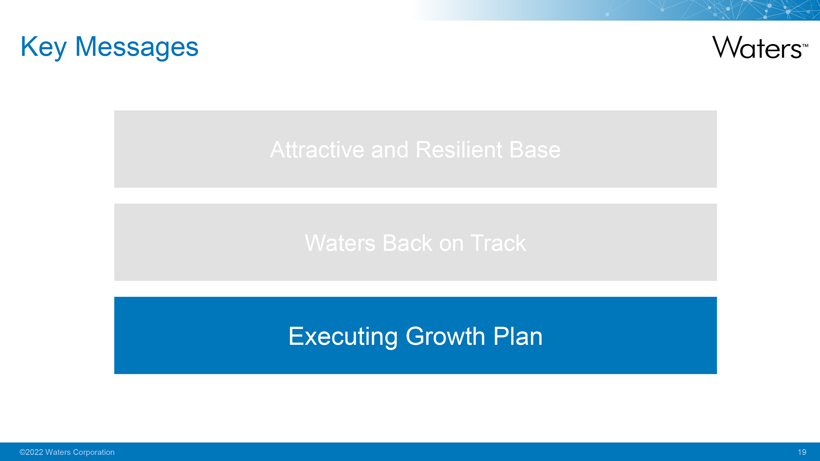
Key Messages
Attractive and Resilient Base
Waters Back on Track
Executing Growth Plan
©2022 Waters Corporation
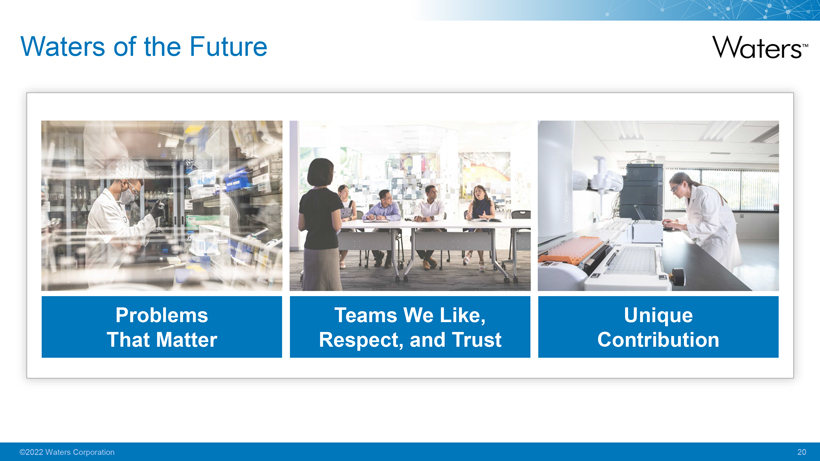
Waters of the Future
Problems That Matter
Teams We Like,
Respect, and Trust
Unique Contribution
©2022 Waters Corporation
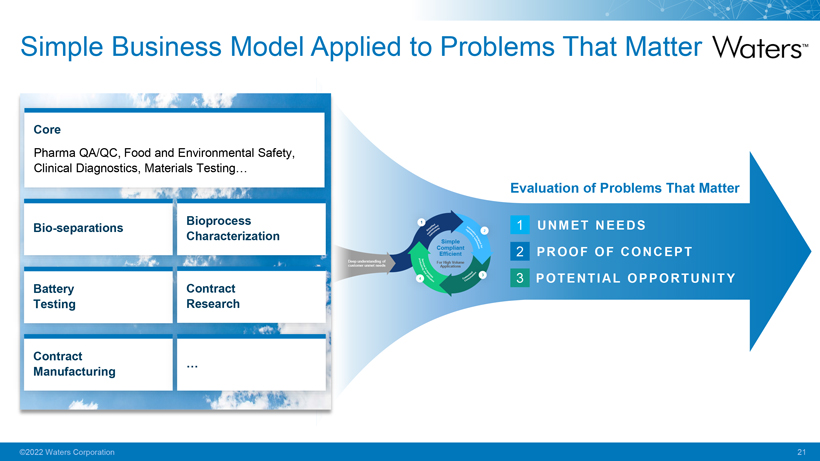
Simple Business Model Applied to Problems That Matter Core Pharma QA/QC, Food and Environmental Safety, Clinical Diagnostics, Materials Testing… Bio-separations Bioprocess Characterization Battery Testing Contract Research Contract Manufacturing Evaluation of Problems That Matter 1 UNMET NEEDS 2 PROOF OF CONCEPT ©2022 Waters Corporation

Access to High-Growth Adjacencies
Market Size
Market Growth
Bio-separations Separating and purifying newer modalities ~$1.2BN HSD—DD
Bioprocess Decoupling the process from the product for
Characterization ~$0.5BN DD+
manufacturing of large molecules
LC-MS in An unbiased, multiplexed, multiomic, and ultra-
Diagnostics high sensitivity diagnostic solution ~$1.2BN HSD—DD
Battery Testing meet
Developing evolving end safety -to-end standards testing capabilities to ~$0.8BN DD
Sustainable Enabling the formulation of more sustainable
Polymers plastics
~$3BN+ HSD
~$7BN+DD
uncertainties Source: IMS/IQVIA that could Clinical cause
Market actual Data; results M&M to differ Report; and Kalorama; such differences BBC Market could Report; be material Waters . Please Corporation refer to information the Company’s and analysis Cautionary . Note: Statements data represents
.. Market forward growth—rates looking estimated statements from and Waters are subject internal to estimates, inherent comprised from consulting data, industry reports and market research.
©2022 Waters Corporation
A Problem Worth Solving
Separating the Process
from the Product
©2022 Waters Corporation
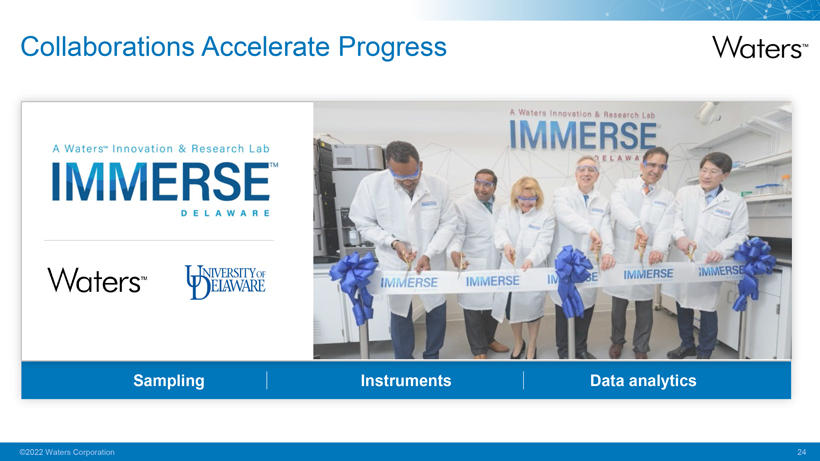
Collaborations Accelerate Progress
Sampling
Instruments
Data analytics
©2022 Waters Corporation
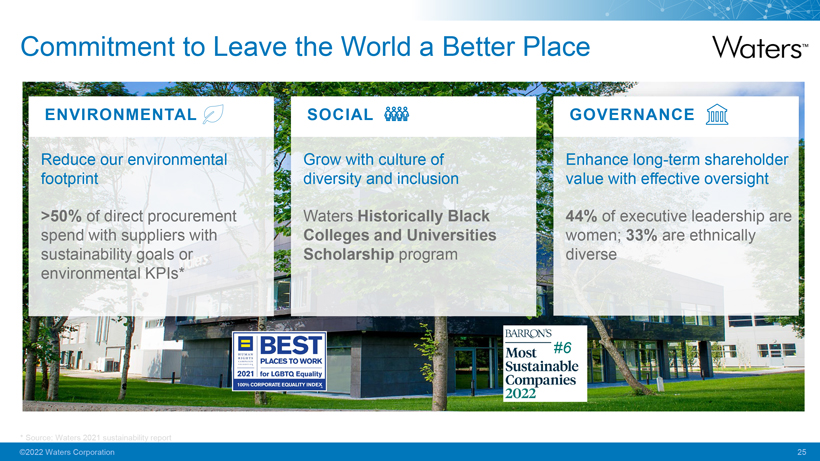
Commitment to Leave the World a Better Place
ENVIRONMENTAL Reduce our environmental footprint >50% of direct procurement spend with suppliers with sustainability goals or environmental KPIs* SOCIAL Grow
with culture of diversity and inclusion Waters Historically Black Colleges and Universities Scholarship program GOVERNANCE Enhance long-term shareholder value with effective oversight 44% of executive leadership are women; 33% are ethnically diverse
* Source: Waters 2021 sustainability report ©2022 Waters Corporation

Key Messages
Attractive and Resilient Base
Waters Back on Track
Executing Growth Plan
©2022 Waters Corporation
Jon Pratt
Senior Vice President, Waters Division
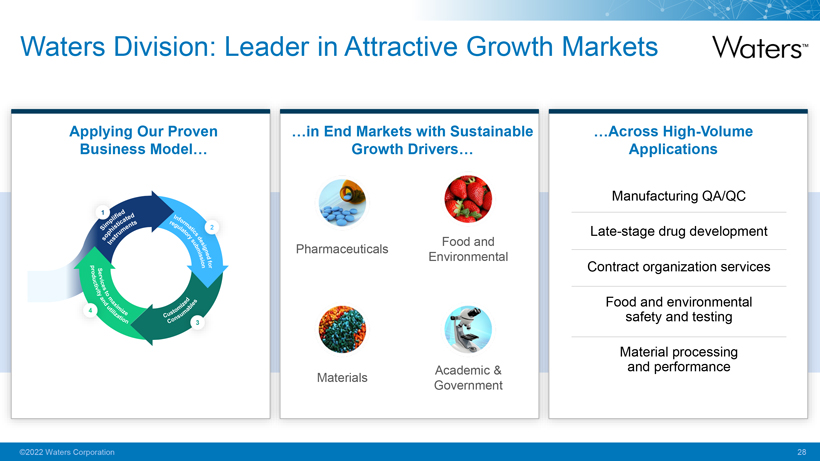
Waters Division: Leader in Attractive Growth Markets
Applying Our Proven Business Model in End Markets with Sustainable Growth Drivers Across High-Volume Applications Pharmaceuticals
Food and Environmental Materials Academic & Government
Manufacturing QA/QC
Late-stage drug development
Contract organization services
Food safety and and environmental testing Material and performance processing
©2022
Waters Corporation 28
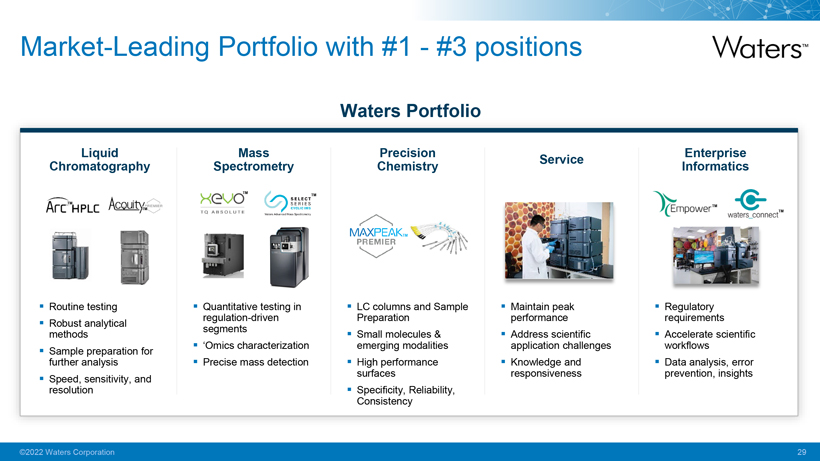
Market-Leading Portfolio with #1—#3 positions
Waters Portfolio
Chromatography Liquid
Spectrometry Mass
Chemistry Precision
Service
Informatics Enterprise
Routine testing Robust methods analytical Sample further analysis preparation for resolution Speed, sensitivity, and
regulation Quantitative -driven testing in segments ‘Omics characterization Precise mass detection
LC Preparation columns and Sample Small emerging molecules modalities & High surfaces performance Specificity, Consistency Reliability,
Maintain performance peak application Address scientific challenges Knowledge responsiveness and
Regulatory requirements Accelerate workflows scientific Data prevention, analysis, insights error ©2022 Waters Corporation 29
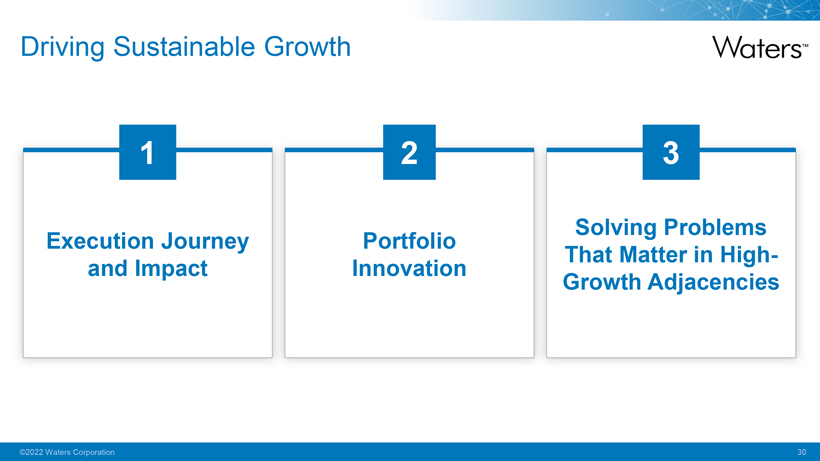
Driving Sustainable Growth Execution Journey and Impact Portfolio Innovation Solving Problems That Matter in High-Growth Adjacencies ©2022 Waters Corporation 30
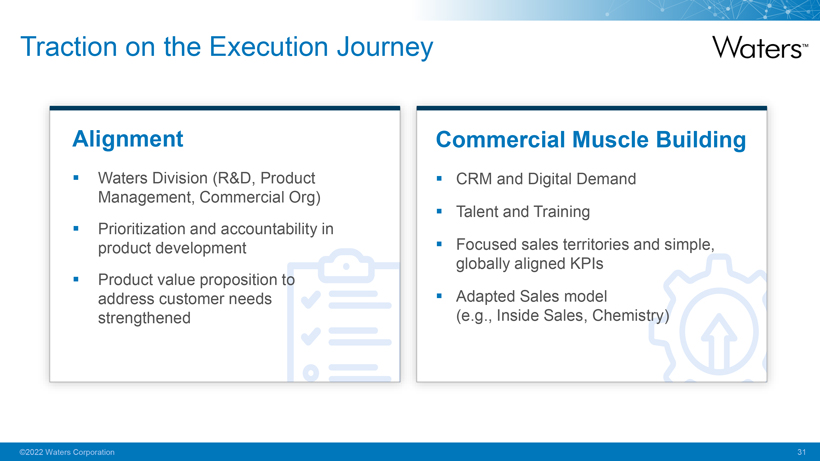
Traction on the Execution Journey
Alignment Waters
Division (R&D, Product Management, Commercial Org) Prioritization and accountability in product development Product value proposition to address customer needs strengthened ©2022 Waters Corporation 31
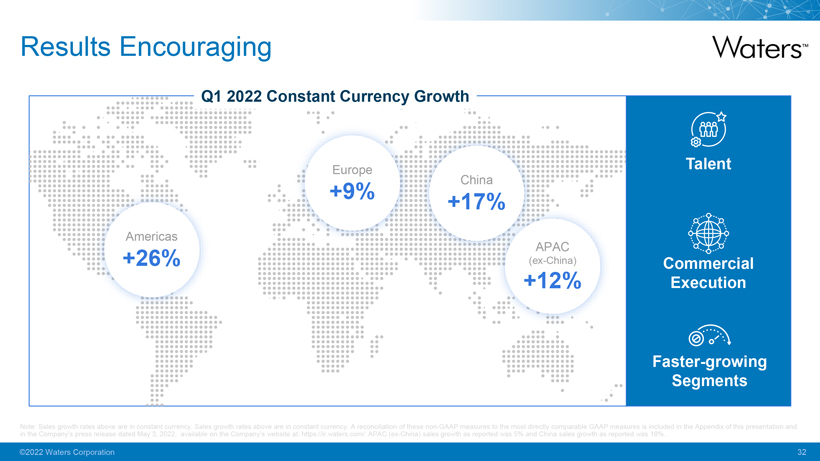
Results Encouraging Q1 2022 Constant Currency Growth Americas +26% Europe +9% +17% APAC +12% (ex-China) Talent Commercial Execution Faster-growing Segments Note: in the Sales Company’s growth press rates release above are dated in constant May 3, 2022, currency. available Sales on growth the Company’s rates above website are in at: constant https://ir. currency. waters. com/. A reconciliation APAC (ex-China) of these sales non-GAAP growth measures as reported to the was most 5% and directly China comparable sales growth GAAP as reported measures was is included 18%. . in the Appendix of this presentation and in the Company’s press release dated May 3, 2022, available on the Company’s website at: https://ir.waters.com/. APAC (ex-China) sales growth as reported was 5% and China sales growth as reported was 18%. ©2022 Waters Corporation 32
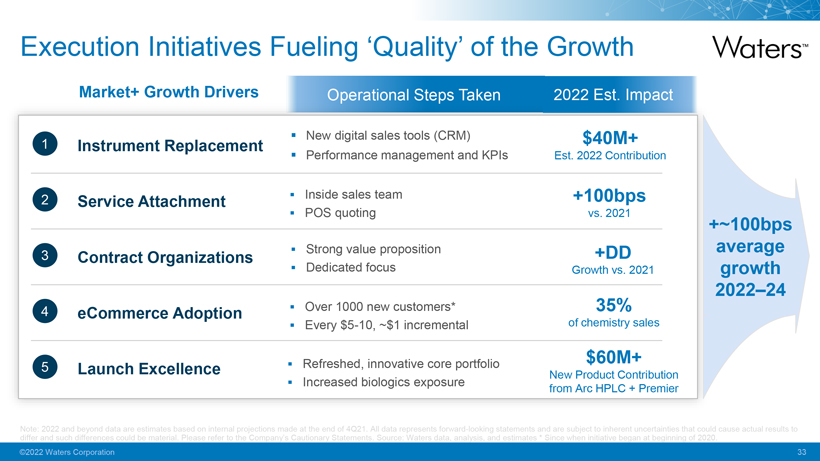
Execution Initiatives Fueling ‘Quality’ of the Growth
Market+ Growth Drivers Operational Steps Taken 2022 Est. Impact
New digital sales tools (CRM)
$40M+1 Instrument Replacement Performance management and KPIs Est. 2022 Contribution2 Service Attachmentï,§ Inside sales team +100bps
POS quoting vs.
20213 Contract Organizations Strong value proposition +DD Dedicated focus Growth vs. 2021 4 eCommerce Adoption Over 1000 new customers* 35%ï,§ Every $5-10, ~$1 incremental of chemistry
salesï,§ Refreshed, innovative core portfolio $60M+5 Launch Excellence New Product Contribution Increased biologics exposure from Arc HPLC + Premier
+~100bps average growth 2022–24
differ Note: and 2022 such and
differences beyond data could are estimates be material. based Please on refer internal to the projections Company’s made Cautionary at the end Statements. of 4Q21. All Source: data represents Waters data, forward-looking analysis, and
statements estimates and * Since are subject when initiative to inherent began uncertainties at beginning that of could 2020. cause actual results to differ and such differences could be material. Please refer to the Company’s Cautionary
Statements. Source: Waters data, analysis, and estimates * Since when initiative began at beginning of 2020. ©2022 Waters Corporation 33
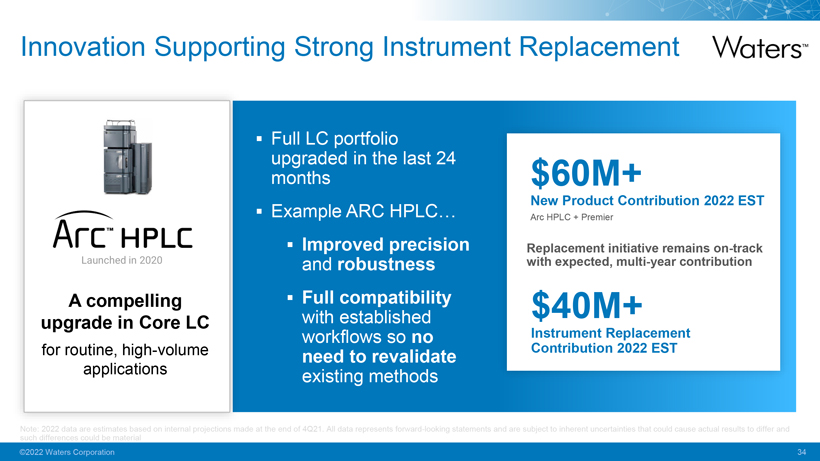
Innovation Supporting Strong Instrument Replacement A compelling upgrade in Core LC for routine, high-volume applications Full LC
portfolio upgraded in the last 24 months Improved robustness precision and Full compatibility with established workflows need to revalidate so no existing methods $60M+ New Product Contribution 2022 EST Arc HPLC + Premier
with Replacement expected, initiative multi-year remains contribution on-track $40M+ Instrument Contribution Replacement 2022 EST
Note: such differences 2022 data are could estimates be material based on internal projections made at the end of 4Q21. All data represents forward-looking
statements and are subject to inherent uncertainties that could cause actual results to differ and such differences could be material
©2022 Waters
Corporation34
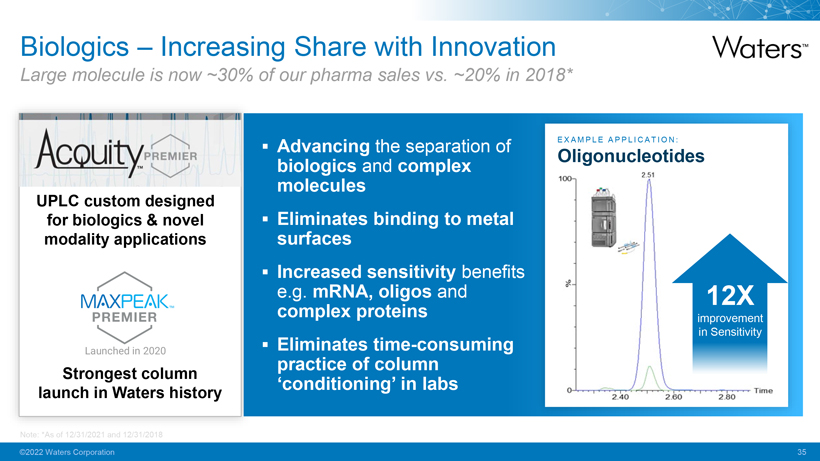
Biologics – Increasing Share with Innovation
Large molecule is now ~30% of our pharma sales vs. ~20% in 2018* UPLC custom designed for biologics & novel modality applications Strongest column launch
in Waters history 353459-003 Advancing biologics the separation of molecules and complex Eliminates surfaces binding to metal Increased sensitivity benefits e complex .g. mRNA, proteins oligos and practice
Eliminates of time column -consuming MAXPEAK PREMIER Launched in 2020 Acouity PREMIER ‘conditioning’ in labs EX Oligonucleotides A M PL E A P P L I C A T I O N : ©2022 Waters Corporation 35
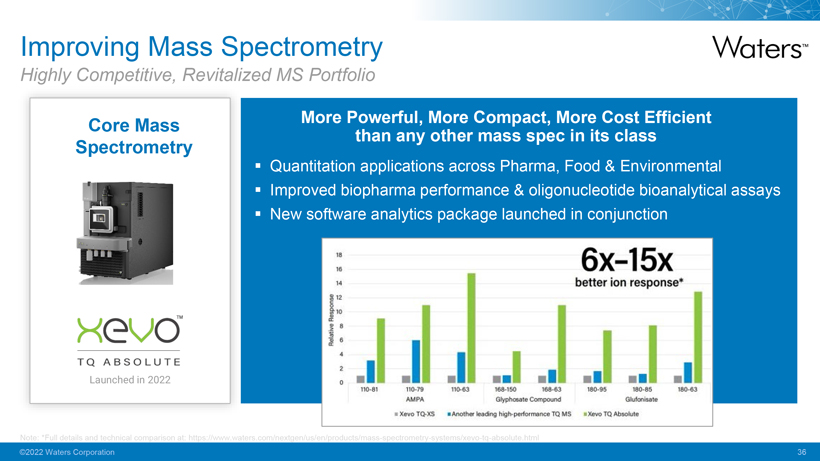
Improving Mass Spectrometry Highly Competitive, Revitalized MS Portfolio Core Mass Spectrometry More Powerful, than any More other Compact, mass spec More in its Cost class Efficient 65X-15X better ion response* Quantitation applications across Pharma, Food & Environmental Improved biopharma performance & oligonucleotide bioanalytical assays New software analytics package launched in conjunction Note: *Full details and technical comparison at: https://www.waters.com/nextgen/us/en/products/mass-spectrometry-systems/xevo-tq-absolute.html ©2022 Waters Corporation 36
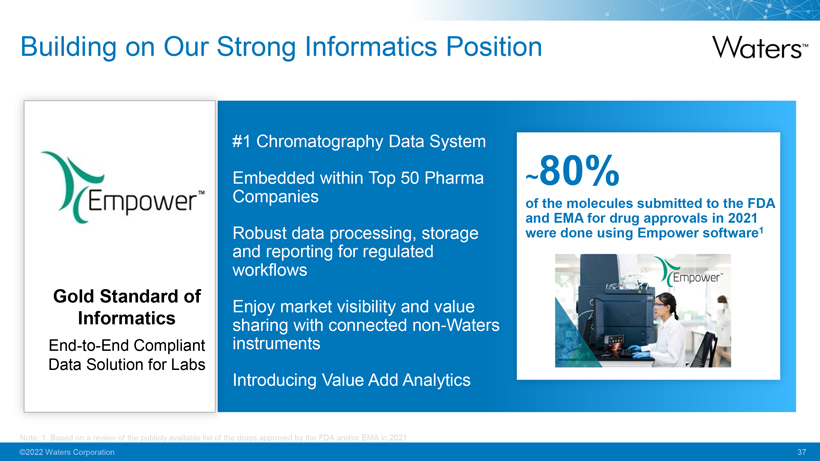
Building on Our Strong Informatics Position
Gold
Standard of Informatics
End-to-End Compliant Data Solution for Labs
#1 Chromatography Data System Embedded within Top 50 Pharma Companies Robust data processing, storage and reporting for regulated workflows Enjoy market visibility and value
sharing with connected non-Waters instruments Introducing Value Add Analytics
~80%
of and the EMA molecules for drug submitted approvals to in the 2021 FDA were done using Empower software1 Empower
Note: 1. Based on a review of the publicly available list of the drugs approved by the FDA and/or EMA in 2021
©2022 Waters Corporation 37
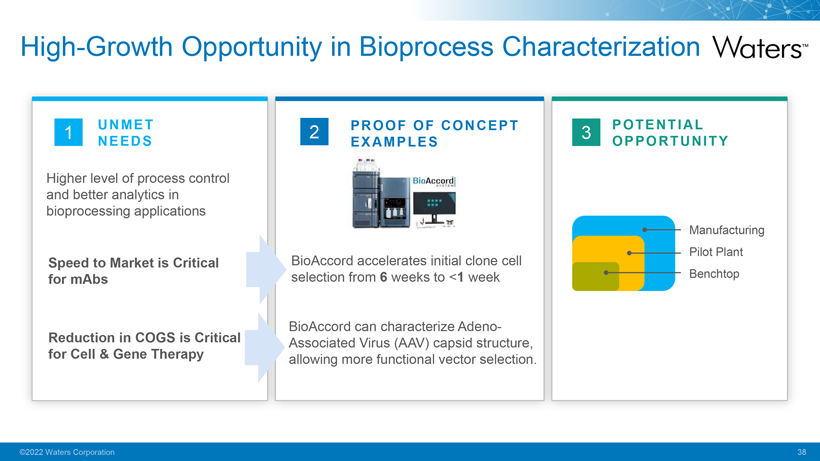
High-Growth Opportunity in Bioprocess Characterization
UNMET NEEDS
Higher level of process control and better analytics in bioprocessing applications
Speed to Market is Critical for mAbs
Reduction in COGS is Critical for
Cell & Gene Therapy
BioAccord accelerates initial clone cell selection from 6 weeks to <1 week
BioAccord can characterize Adeno-Associated Virus (AAV) capsid structure, allowing more functional vector selection.
PROOF OF CONCEPT EXAMPLES
POTENTIAL OPPORTUNITY
Manufacturing Pilot Plant Benchtop
©2022 Waters Corporation38
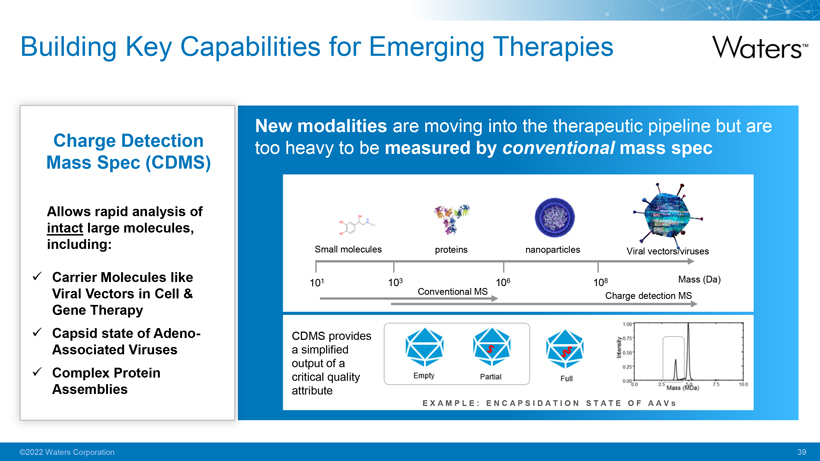
Building Key Capabilities for Emerging Therapies Charge Detection Mass Spec (CDMS) Allows rapid analysis of intact large molecules, including: Carrier Molecules like Viral Vectors in Cell & Gene Therapy Capsid state of Adeno-Associated Viruses Complex Protein Assemblies New modalities are moving into the therapeutic pipeline but are too heavy to be measured by conventional mass spec Small molecules proteins nanoparticles 101 103 106 108 Mass (Da) Charge detection MS CDMS provides a simplified output of a critical quality attribute EXA M PL E: E N C A P S I D A T I O N S T A T E O F A A V s
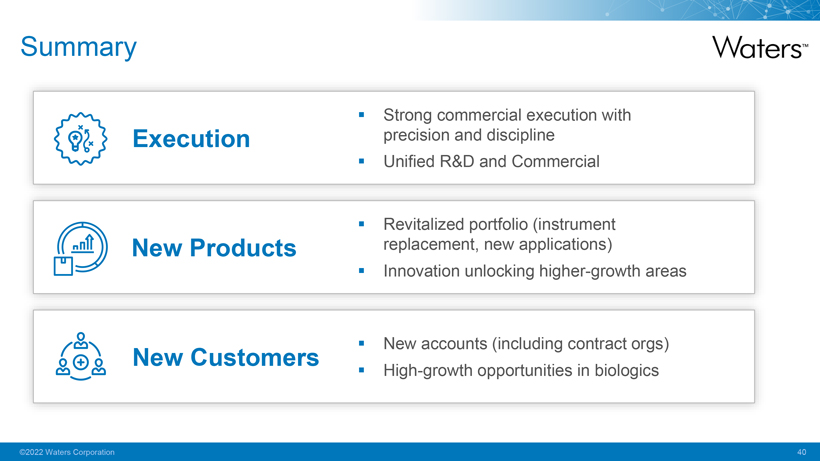
Summary Execution New Products New Customers Strong commercial execution with precision and discipline Unified R&D and Commercial Revitalized portfolio (instrument replacement, new applications) Innovation unlocking higher-growth areas Revitalized portfolio (instrument replacement, new applications) Innovation unlocking higher-growth areas
Jianqing Bennett Senior Vice President, TA Instruments Division & Clinical Business
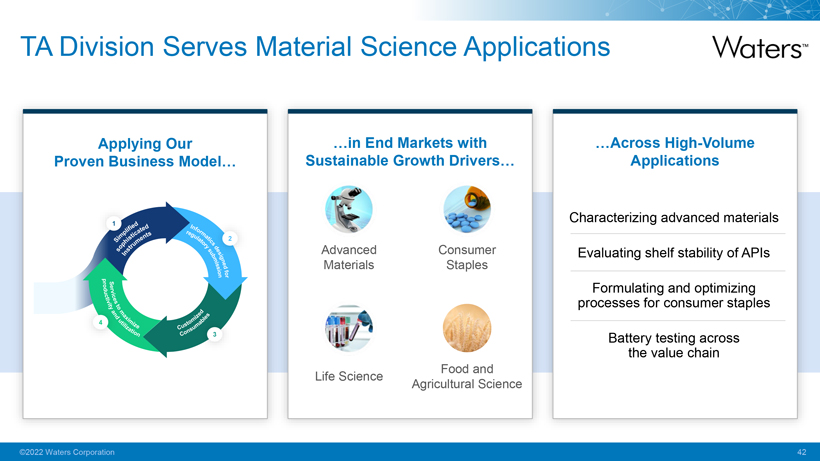
TA Division Serves Material Science Applications Applying Our Proven Business Model… …in End Markets with Sustainable Growth Drivers… Advanced Materials Consumer Staples Life Science Food and Agricultural Science …Across High-Volume Applications Characterizing advanced materials Evaluating shelf stability of APIs processes Formulating for consumer and optimizing staples Battery the value testing chain across
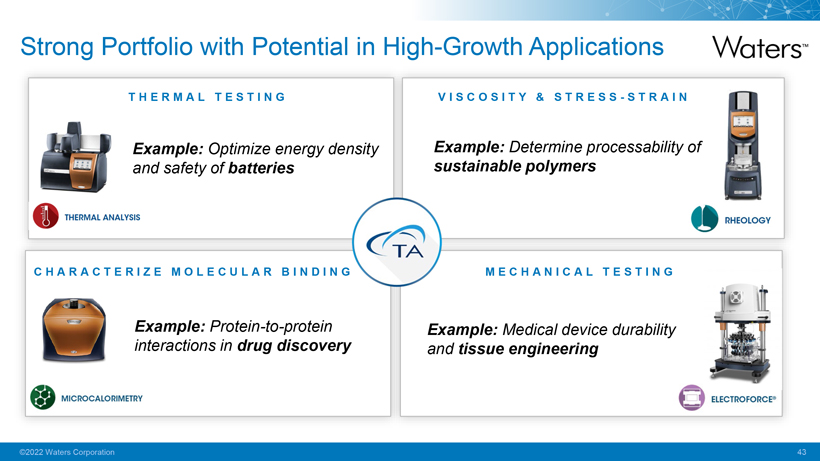
Strong Portfolio with Potential in High-Growth Applications T H E R M A L T E S T I N G Example: Optimize energy density and safety of batteries V I S C O S I T Y & S T R E S S—S T R A I N Example: Determine processability of sustainable polymers CHARACT E RI Z E M O L E C U L A R B I N D I N G Example: Protein-to-protein interactions in drug discovery M E CHANI CAL T E S T I N G Example: Medical device durability and tissue engineering

Increasing Exposure to Fast Growing Segments High Growth—Focus Areas Strong Established Presence DD Batteries & Renewable Energy Advanced Materials Life Sciences Food and Agricultural Science Consumer Staples Energy Storage Electric Vehicles Sustainable Polymers Composites Medical devices Biopharma Food Agricultural products Personal care products Note: internal Growth estimates, rates comprised here reflect from our consulting internal analysis data, industry of historical reports, market and trend market data, research which .are subject to future changes. Please refer to the Company’s Cautionary Statements. Market growth rates estimated from Waters
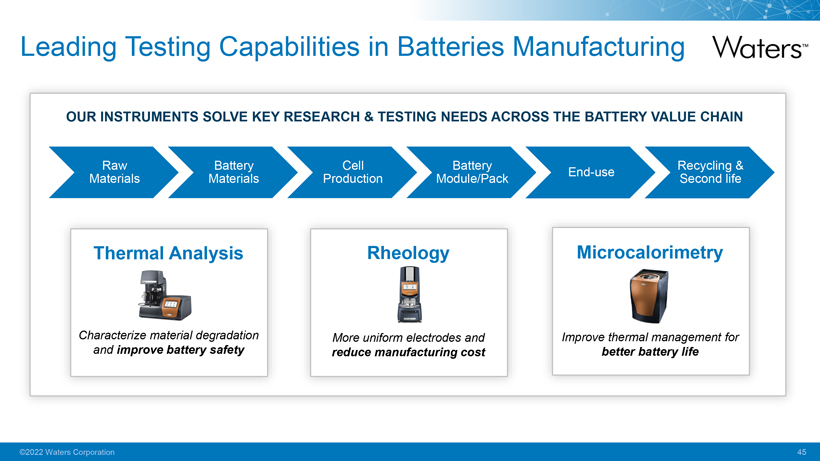
Leading Testing Capabilities in Batteries Manufacturing OUR INSTRUMENTS SOLVE KEY RESEARCH & TESTING NEEDS ACROSS THE BATTERY VALUE CHAIN Materials Raw Mate End-use Recycling Second life & Thermal Analysis Characterize material degradation and improve battery safety Rheology More uniform electrodes and reduce manufacturing cost Microcalorimetry Improve thermal management for better battery life Battery Production Cell Module/Pack Battery
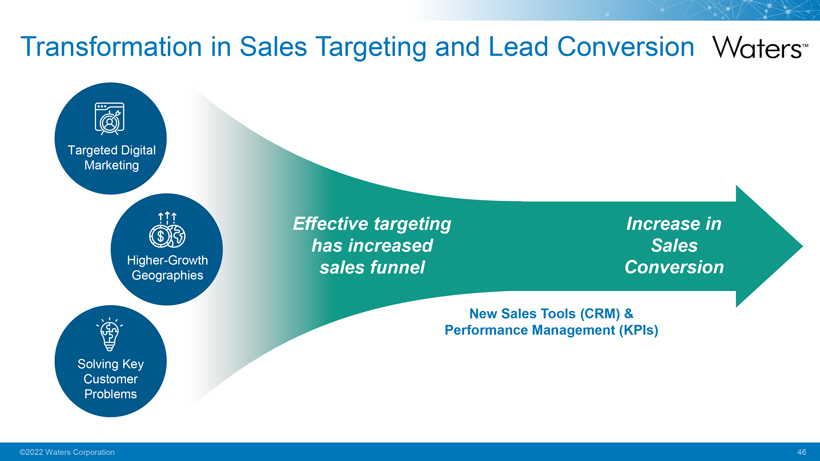
Transformation in Sales Targeting and Lead Conversion Targeted Digital Marketing Higher-Growth Geographie Effective targeting has increased sales funnel Increase in Sales Conversion New Sales Tools (CRM) & Performance Management (KPIs)
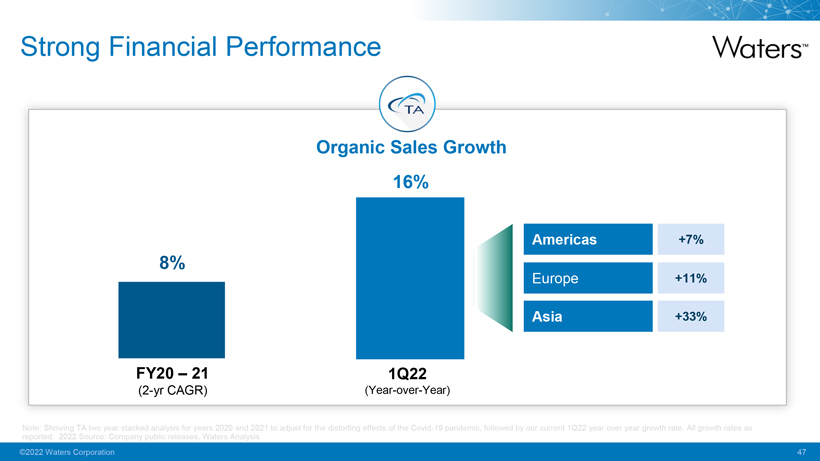
Strong Financial Performance Organic Sales Growth 8% FY20 – 21 (2-yr CAGR) 16% 1Q22 (Year-over-Year) Americas Europe Asia +7% +11% +33% Note: reported Showing . 2022 TA Source: two year Company stacked public analysis releases, for years Waters 2020 Analysis and 2021 to adjust for the distorting effects of the Covid-19 pandemic, followed by our current 1Q22 year over year growth rate. All growth rates as
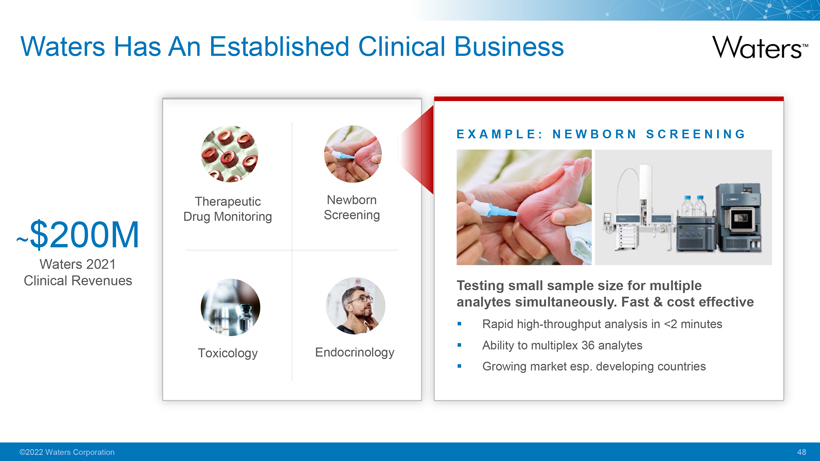
Waters Has An Established Clinical Business ~$200M Waters 2021 Clinical Revenues Therapeutic Drug Monitoring Newborn Screening Toxicology Endocrinology E X AM P L E : N E W B O R N S C R E E N I N G Testing small sample size for multiple analytes simultaneously. Fast & cost effective ◾ Rapid high-throughput analysis in <2 minutes ◾ Ability to multiplex 36 analytes◾ Growing market esp. developing countries
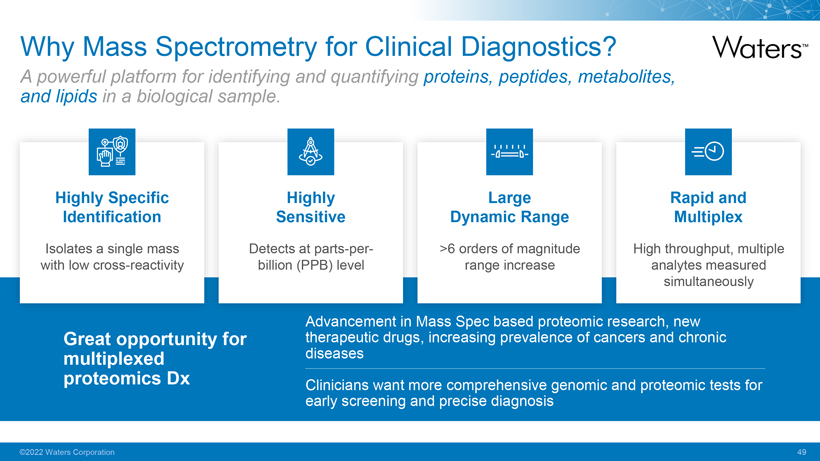
Why Mass Spectrometry for Clinical Diagnostics? A powerful platform for identifying and quantifying proteins, peptides, metabolites, and lipids in a biological sample. Highly Specific Identification Isolates a single mass with low cross-reactivity Highly Sensitive Detects at parts-per-billion (PPB) level Large Dynamic Range >6 orders of magnitude range increase Rapid and Multiplex High throughput, multiple analytes measured simultaneously multiplexed Great opportunity for proteomics Dx Advancement therapeutic drugs, in Mass increasing Spec based prevalence proteomic of cancers research, and new chronic diseases Clinicians early screening want more and precise comprehensive diagnosis genomic and proteomic tests for
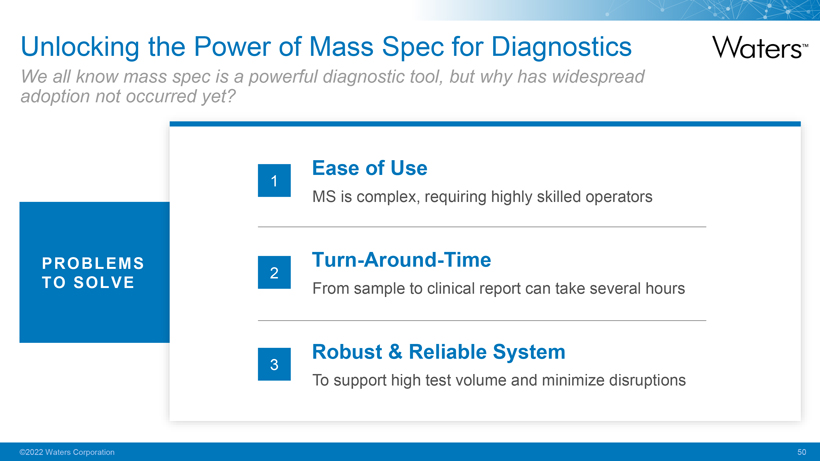
Unlocking the Power of Mass Spec for Diagnostics We all know mass spec is a powerful diagnostic tool, but why has widespread adoption not occurred yet? PROBLEMS TO SOLVE Ease of Use MS is complex, requiring highly skilled operators Turn-Around-Time From sample to clinical report can take several hours Robust & Reliable System To support high test volume and minimize disruptions
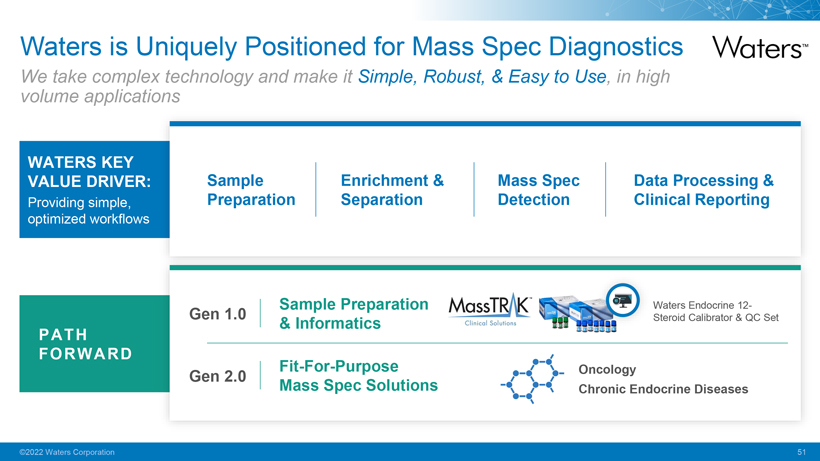
Waters is Uniquely Positioned for Mass Spec Diagnostics We take complex technology and make it Simple, Robust, & Easy to Use, in high volume applications WATERS KEY VALUE DRIVER: Providing simple, optimized workflows PATH FORWARD Sample Preparation Enrichment & Separation Mass Spec Detection Data Processing & Clinical Reporting Gen 1.0 Gen 2.0 Sample Preparation & Informatics Fit-For-Purpose Mass Spec Solutions Waters Endocrine 12-Steroid Calibrator & QC Set Oncology Chronic Endocrine Diseases
Amol Chaubal Senior Vice President, Chief Financial Officer
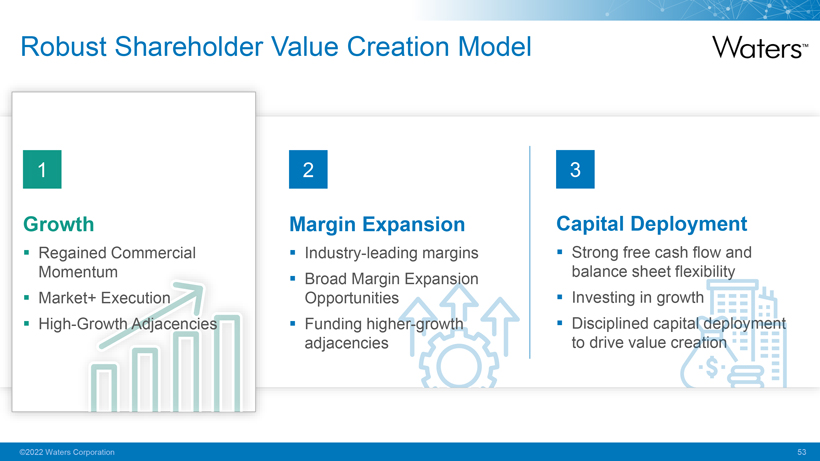
Robust Shareholder Value Creation Model Growth Regained Commercial Momentum◾ Market+ Execution◾ High-Growth Adjacencies Margin Expansion Industry-leading margins Broad Margin Expansion Opportunities Funding higher-growth adjacencies Capital Deployment Strong free cash flow and balance sheet flexibility Investing in growth Disciplined capital deployment to drive value creation
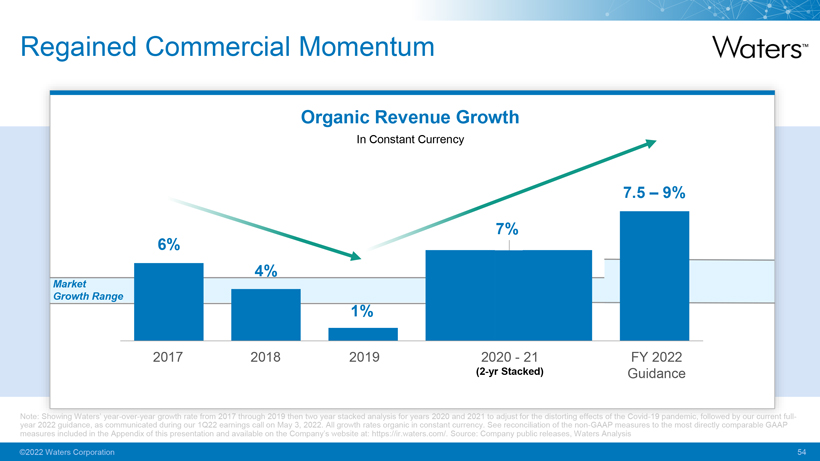
Regained Commercial Momentum Organic Revenue Growth In Constant Currency Market Growth Range Note: year 2022 Showing guidance, Waters’ as year communicated -over-year growth during our rate 1Q22 from 2017 earnings through call on 2019 May then 3, 2022 two year . All growth stacked rates analysis organic for years in constant 2020 and currency 2021. to See adjust reconciliation for the distorting of the non effects -GAAP of the measures Covid- 19 to the pandemic, most directly followed comparable by our current GAAP full -measures included in the Appendix of this presentation and available on the Company’s website at: https://ir.waters.com/. Source: Company public releases, Waters Analysis
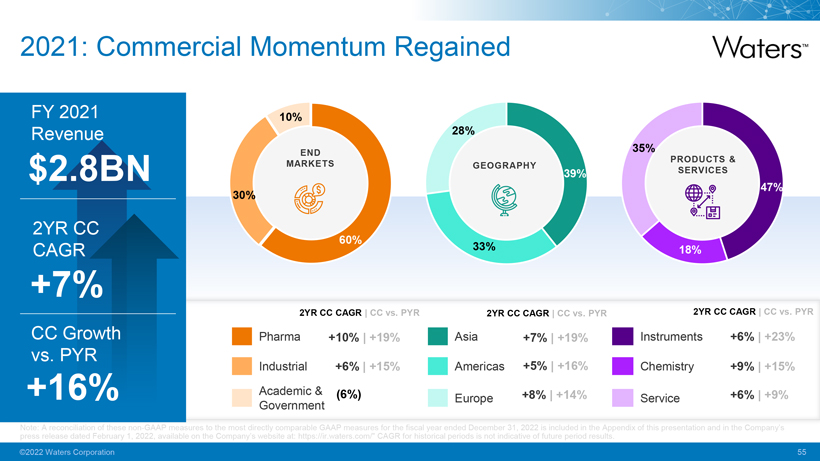
2021: Commercial Momentum Regained FY 2021 Revenue $2.8BN 2YR CC CAGR +7% CC Growth +16% vs. PYR Pharma Industrial Academic & Government 2YR CC CAGR | CC vs. PYR 2YR CC CAGR | CC vs. PYR 2YR CC CAGR | CC vs. PYR +10% +6% (6%) Asia Americas Europe +7% +5% +8% +19% +16% +14% Instruments Chemistry Service +6 +9% +6% +23 +15% +9% Note: press A release reconciliation dated February of these 1, non 2022, -GAAP available measures on the to the Company’s most directly website comparable at: https://ir GAAP .waters measures .com/” CAGR for the for fiscal historical year ended periods December is not indicative 31, 2022 of is future included period in the results Appendix . of this presentation and in the Company’s

Strong Start to 2022 Revenue Q1 2022 $691M Revenue CC Growth vs. PYR +16% +13% As Reported CC: Constant Currency PYR: Prior Year Instruments CC Growth vs. PYR +26% Recurring Revenue CC Growth vs. PY +9 United States CC Growth vs. PYR +28% China CC Growth vs. PYR +17% EPS Q1 2022 Non-GAAP $2.80 Growth vs. PYR +22% Note: presentation Q1 2022 and data in the versus Company’s comparable press time release period dated in the May prior 3, year 2022, for available Q1 2021 on . A the reconciliation Company’s of website these non at: https://ir -GAAP . measures waters.com/” to the CAGR most for directly historical comparable periods is GAAP not indicative measures of is future included period in the results Appendix . of this

Achieving Market+ Growth 2YR Stacked (2020-21) Organic Revenue Growth in Constant Currency 1Q 2022 Y/Y Organic Revenue Growth in Constant Currency Peer Average 7% 5% 16% 10% performance Not or analytical instrument segment performance (depending on which is the most relevant comparison to Waters business), excluding COVID-19 impacts. A reconciliation of these non-GAAP measures to the most FactSet; directly Company comparable public GAAP releases; measures Waters is data, included analysis, in the and Appendix estimates of this presentation and in the Company’s press release dated May 3, 2022, available on the Company’s website at: https://ir.waters.com/” Source:
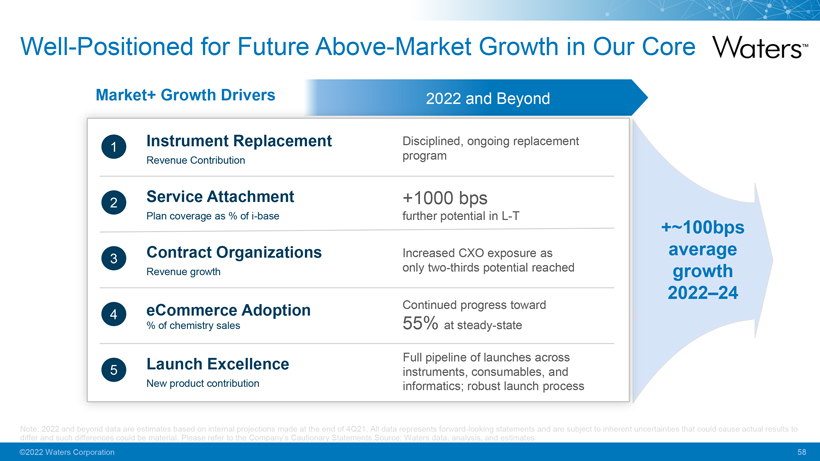
Well-Positioned for Future Above-Market Growth in Our Core Market+ Growth Drivers 2022 and Beyond Instrument Replacement Revenue Contribution Service Attachment Plan coverage as % of i-base Contract Organizations Revenue growth eCommerce Adoption % of chemistry sales New product contribution Disciplined, ongoing replacement program +1000 bps further potential in L-T Increased CXO exposure as only two-thirds potential reached Continued progress toward 55% at steady-state Full pipeline of launches across instruments, consumables, and informatics; robust launch process +~100bps average growth 2022–24 Note: differ and 2022 such and differences beyond data could are estimates be material based . Please on refer internal to the projections Company’s made Cautionary at the end Statements of 4Q21. All .Source: data represents Waters data, forward analysis, -looking and statements estimates and are subject to inherent uncertainties that could cause actual results to
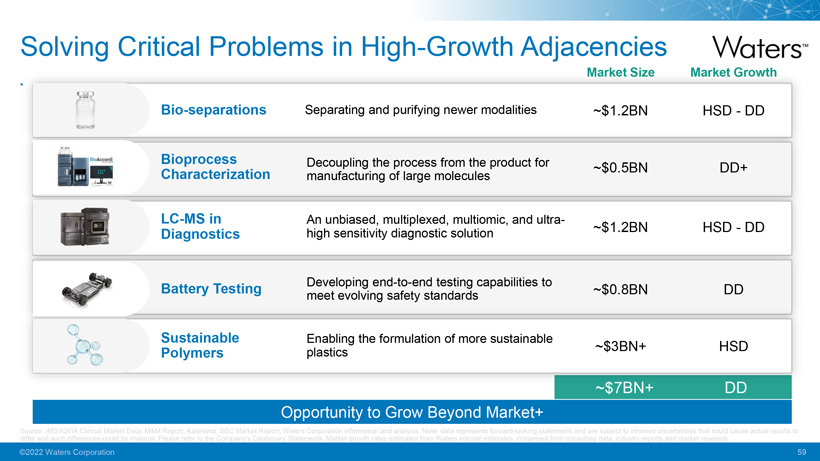
Solving Critical Problems in High-Growth Adjacencies Market Size Market Growth Bio-separations Separating and purifying newer modalities ~$1.2BN HSD – DD Bioprocess Decoupling the process from the product for Characterization ~$0.5BN DD+ manufacturing of large molecules LC-MS in An unbiased, multiplexed, multiomic, and ultra- Diagnostics high sensitivity diagnostic solution ~$1.2BN HSD – DD Battery Testing meet Developing evolving end-to-end safety standards testing capabilities to ~$0.8BN DD Sustainable Enabling the formulation of more sustainable Polymers plastics ~$3BN+ HSD Opportunity to Grow Beyond Market+ Source: differ and IMS/IQVIA such differences Clinical could Market be Data; material. M&M Please Report; refer Kalorama; to the Company’s BBC Market Cautionary Report; Waters Statements. Corporation Market information growth rates and estimated analysis. from Note: Waters data represents internal estimates, forward-looking comprised statements from consulting and are data, subject industry to inherent reports uncertainties and market that research. could cause actual results to differ and such differences could be material. Please refere to the company’s Cautionary Satements. Market growth rate estimates from Waters internal estimates, comprised from consulting data, industry reports and market research.
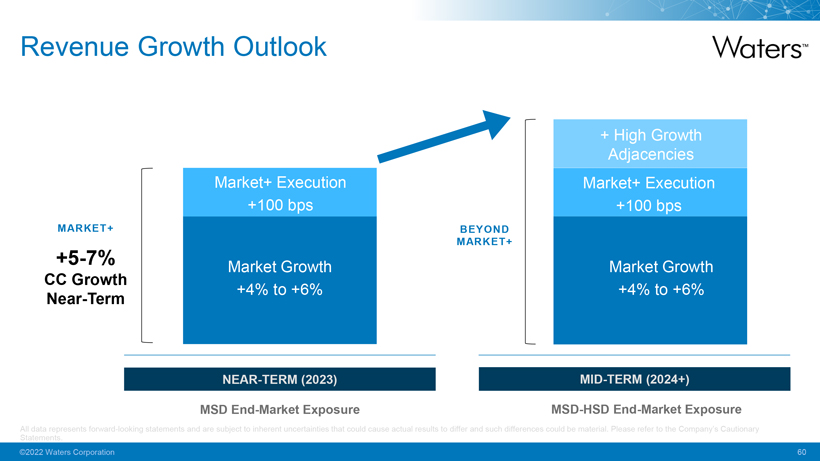
Revenue Growth Outlook + High Growth Adjacencies Market+ Execution Market+ Execution +100 bps +100 bps MARKET+ BEYOND MARKET+ +5-7% Market Growth Market Growth CC Growth +4% to +6% +4% to +6% Near-Term NEAR-TERM (2023) MID-TERM (2024+) MSD End-Market Exposure MSD-HSD End-Market Exposure All Statements. data represents forward-looking statements and are subject to inherent uncertainties that could cause actual results to differ and such differences could be material. Please refer to the Company’s Cautionary All data represents forward-looking statements and are subject to inherent uncertainties that could cause actual results to differ and such differences could be material. Please refer to the Company’s Cautionary Statements. ©2022 Waters Corporation 60
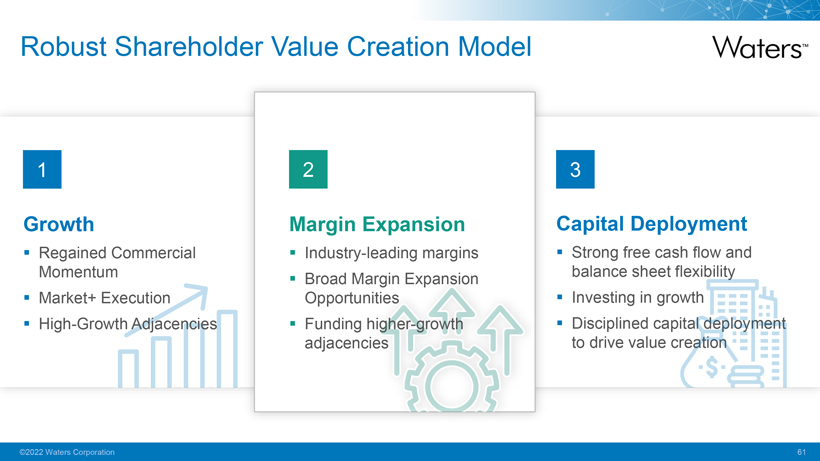
Robust Shareholder Value Creation Model Growth Regained Commercial Momentum Market+ Execution High-Growth Adjacencies Margin Expansion Industry-leading margins Broad Margin Expansion Opportunities Funding higher-growth adjacencies Capital Deployment Strong free cash flow and balance sheet flexibility Investing in growth Disciplined capital deployment to drive value creation
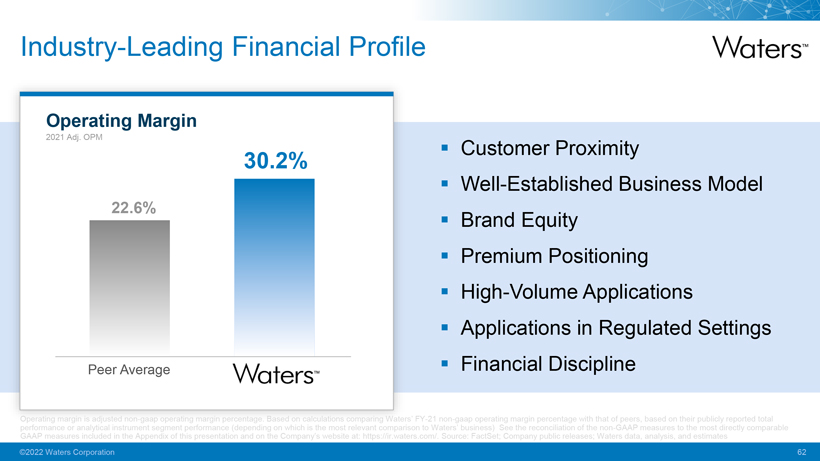
Industry-Leading Financial Profile Operating Margin 2021 Adj. OPM 30.2% 22.6% Peer Average Customer Proximity Well-Established Business Model Brand Equity Premium Positioning High-Volume Applications Applications in Regulated Settings Financial Discipline Operating margin is adjusted non-gaap operating margin percentage. Based on calculations comparing Waters’ FY-21 non-gaap operating margin percentage with that of peers, based on their publicly reported total performance or analytical instrument segment performance (depending on which is the most relevant comparison to Waters’ business) See the reconciliation of the non-GAAP measures to the most directly comparable GAAP measures included in the Appendix of this presentation and on the Company’s website at: https://ir.waters.com/. Source: FactSet; Company public releases; Waters data, analysis, and estimates.
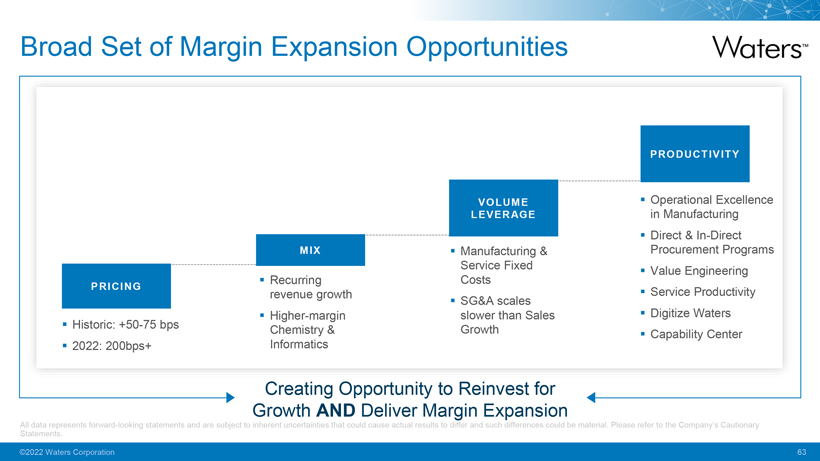
Broad Set of Margin Expansion Opportunities PRICING§ Historic: +50-75 bps§ 2022: 200bps+ § Recurring revenue growth§
Higher-margin Chemistry & Informatics § MIX Recurring revenue growth§ Higher-margin Chemistry & Informatics VOLUME LEVERAGE
§ Manufacturing
& Service Fixed Costs§ SG&A scales slower than Sales Growth § PRODUCTIVITY Operational Excellence in Manufacturing§ Direct & In-Direct Procurement Programs§ Value Engineering§ Service Productivity§ Digitize
Waters§ Capability Center Creating Opportunity to Reinvest for Growth AND Deliver Margin Expansion All Statements. data represents forward-looking statements and are subject to inherent uncertainties that could cause actual results to differ
and such differences could be material. Please refer to the Company’s Cautionary Statements.
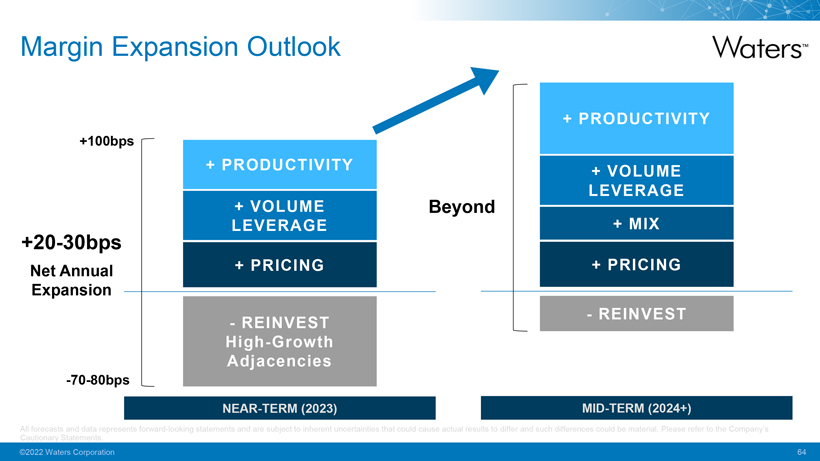
Margin Expansion Outlook +100bps +20-30bps Net Annual Expansion -70-80bps Beyond NEAR-TERM (2023) MID-TERM (2024+) All Cautionary forecasts Statements and data represents . forward-looking statements and are subject to inherent uncertainties that could cause actual results to differ and such differences could be material. Please refer to the Company’s
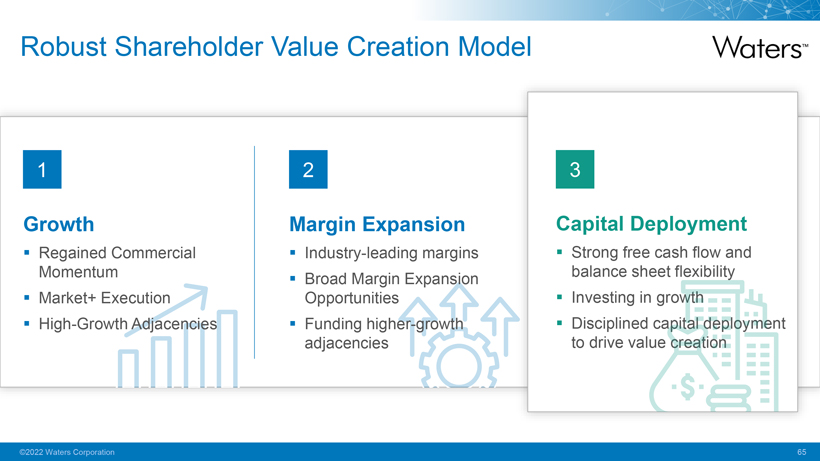
Robust Shareholder Value Creation Model Growth Margin Expansion Capital Deployment ◾ Regained Commercial ◾ Industry-leading margins◾ Strong free cash flow and Momentum balance sheet flexibility◾ Broad Margin Expansion ◾ Market+ Execution Opportunities◾ Investing in growth◾ High-Growth Adjacencies◾ Funding higher-growth ◾ Disciplined capital deployment adjacencies to drive value creation
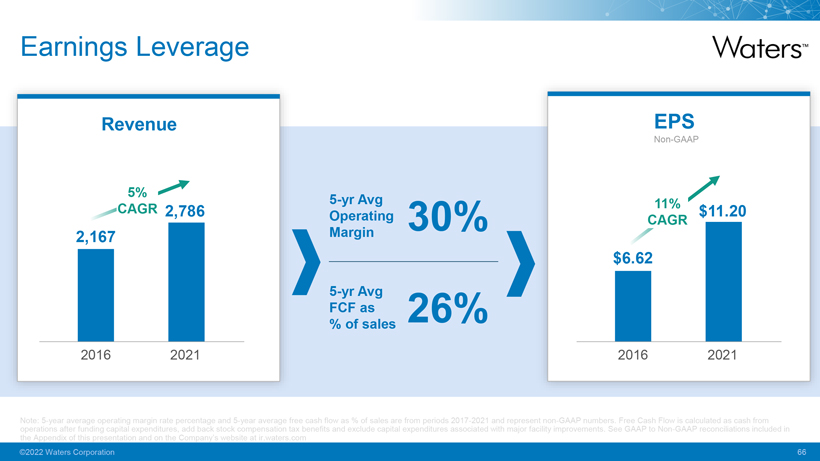
Earnings Leverage Revenue EPS Non-GAAP 5% 5-yr Avg CAGR 2,786 11% $11.20 Operating 30% CAGR 2,167 Margin $6.62 5-yr Avg FCF as 26% % of sales 2016 2021 2016 2021 Note: operations 5-year after average funding operating capital expenditures, margin rate percentage add back stock and 5 compensation -year average tax free benefits cash flow and as exclude % of sales capital are expenditures from periods associated 2017-2021 with and represent major facility non improvements -GAAP numbers . See . Free GAAP Cash to Non Flow—GAAP is calculated reconciliations as cash included from in the Appendix of this presentation and on the Company’s website at ir.waters.com
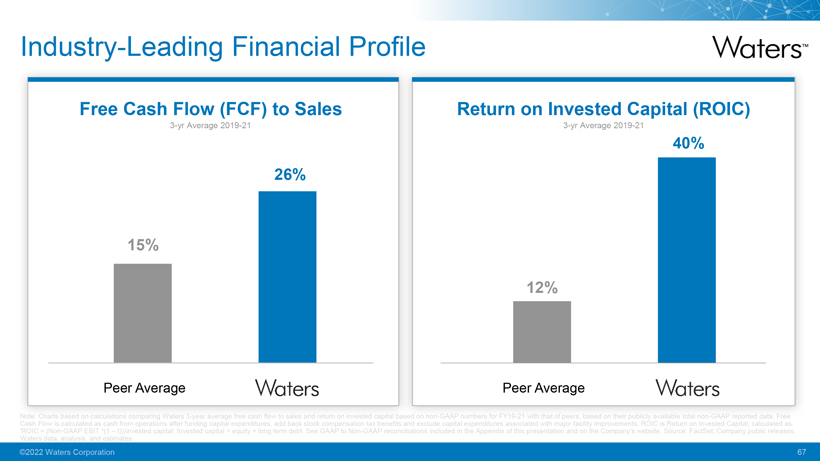
Industry-Leading Financial Profile Free Cash Flow (FCF) to Sales Return on Invested Capital (ROIC) 3-yr Average 2019-21 3-yr Average 2019-21 40% 26% 15% 12% Peer Average Peer Average Note: Cash Flow Charts is based calculated on calculations as cash from comparing operations Waters after funding 3-year average capital expenditures, free cash flow add to sales back and stock return compensation on invested tax capital benefits based and on exclude non-GAAP capital numbers expenditures for FY19 associated -21 with with that major of peers, facility based improvements on their publicly . ROIC available is Return total on non Invested -GAAP Capital, reported calculated data. Free as: ‘ROIC Waters = data, (Non analysis, -GAAP EBIT and *(1 estimates – t))/invested capital; Invested capital = equity + long term debt. See GAAP to Non-GAAP reconciliations included in the Appendix of this presentation and on the Company’s website. Source: FactSet; Company public releases;
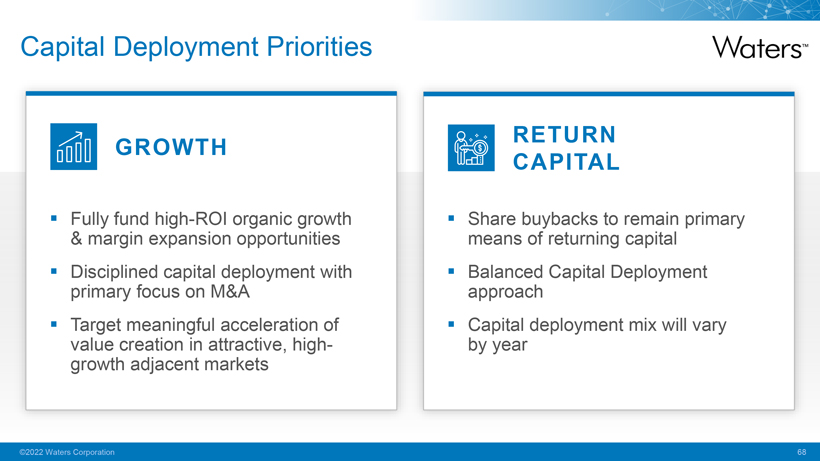
Capital Deployment Priorities RETURN GROWTH CAPITAL ◾ Fully fund high-ROI organic growth ◾ Share buybacks to remain primary & margin expansion opportunities means of returning capital◾ Disciplined capital deployment with ◾ Balanced Capital Deployment primary focus on M&A approach◾ Target meaningful acceleration of ◾ Capital deployment mix will vary value creation in attractive, high- by year growth adjacent markets

EPS Growth Outlook HISTORIC PERFORMANCE NEAR-TERM (2023) MID-TERM (2024+) Cautionary Note: All forecasts Statements and .data represents forward-looking statements and are subject to inherent uncertainties that could cause actual results to differ and such differences could be material. Please refer to the Company’s
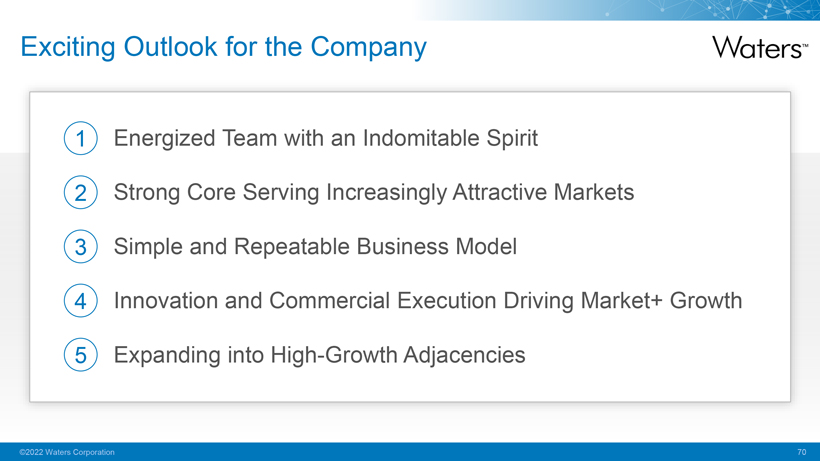
Exciting Outlook for the Company
1 Energized Team
with an Indomitable Spirit
2 Strong Core Serving Increasingly Attractive Markets 3 Simple and Repeatable Business Model
4 Innovation and Commercial Execution Driving Market+ Growth 5 Expanding into High-Growth Adjacencies
Q&A
WatreTM ir.water.com [email protected] Thank you for your continued interest in Waters
Waters
Appendix
GAAP to Non-GAAP Reconciliations
Non-GAAP Financial Measures
This presentation contains financial measures, such as constant currency growth rate, adjusted operating income, adjusted earnings per diluted share and free cash flow, among
others, which are considered “non-GAAP” financial
measures under applicable U.S. Securities and Exchange
Commission rules and regulations. These non-GAAP financial measures should be considered supplemental to and not a substitute for financial information prepared in accordance with generally accepted accounting
principles (GAAP). The Company’s definition of these non-GAAP measures may differ from similarly titled measures used by others. The non-GAAP financial measures
used in this presentation adjust for specified items that can be highly variable or difficult to predict. The Company generally uses these non-GAAP financial measures to facilitate management’s financial
and operational decision-making, including evaluation of Waters Corporation’s historical operating results, comparison to competitors’ operating results and determination of management incentive compensation. These non-GAAP financial measures reflect an additional way of viewing aspects of the Company’s operations that, when viewed with GAAP results and the reconciliations to corresponding GAAP financial measures, may
provide a more complete understanding of factors and trends affecting Waters Corporation’s business. Because non-GAAP financial measures exclude the effect of items that will increase or decrease the
Company’s reported results of operations, management strongly encourages investors to review the Company’s consolidated financial statements and publicly filed reports in their entirety. Reconciliations of the non-GAAP financial measures to the most directly comparable GAAP financial measures are included in this appendix section of the presentation.
Additionally, please refer to the Company’s website or its historical Form 8-K filings with the SEC, for explanations as to why the
Company believes that presentation of these non-GAAP financial measures provide useful information to investors.
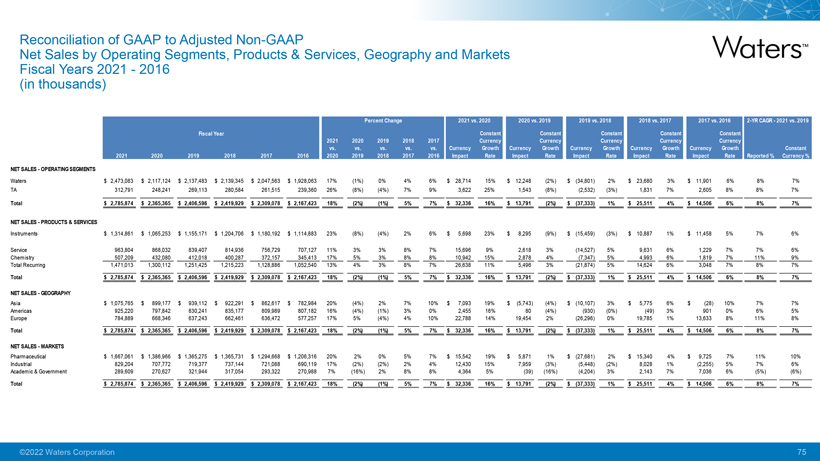
Net Reconciliation Sales by Operating of GAAP Segments, to Adjusted Products Non-GAAP &
Services, Geography and Markets Fiscal (in thousands) Years 2021—2016
NET SALES—OPERATING SEGMENTS
Waters $ 2,473,083 $ 2,117,124 $ 2,137,483 $ 2,139,345 $ 2,047,563 $ 1,928,063 17% (1%) 0% 4% 6% $ 28,714 15% $ 12,248 (2%) $ (34,801) 2% $ 23,680 3% $ 11,901 6% 8% 7%
TA312,791248,241269,113280,584261,515239,360 26% (8%) (4%) 7% 9%3,622 25%1,543 (8%)(2,532) (3%)1,831 7%2,605 8% 8% 7%
Total $ 2,785,874 $ 2,365,365 $ 2,406,596 $
2,419,929 $ 2,309,078 $ 2,167,423 18% (2%) (1%) 5% 7% $ 32,336 16% $ 13,791 (2%) $ (37,333) 1% $ 25,511 4% $ 14,506 6% 8% 7%
NET SALES—PRODUCTS &
SERVICES
Instruments $ 1,314,861 $ 1,065,253 $ 1,155,171 $ 1,204,706 $ 1,180,192 $ 1,114,883 23% (8%) (4%) 2% 6% $5,698 23% $8,295 (9%) $ (15,459) (3%) $ 10,887 1%
$ 11,458 5% 7% 6%
Service963,804868,032839,407814,936756,729707,127 11% 3% 3% 8% 7% 15,696 9%2,618 3% (14,527) 5%9,631 6%1,229 7% 7% 6%
Chemistry507,209432,080412,018400,287372,157345,413 17% 5% 3% 8% 8% 10,942 15%2,878 4%(7,347) 5%4,993 6%1,819 7% 11% 9% Total Recurring 1,471,013 1,300,112 1,251,4251,215,223 1,128,886 1,052,540 13% 4% 3% 8% 7% 26,638 11%5,496 3% (21,874) 5% 14,624
6%3,048 7% 8% 7%
Total $ 2,785,874 $ 2,365,365 $ 2,406,596 $ 2,419,929 $ 2,309,078 $ 2,167,423 18% (2%) (1%) 5% 7% $ 32,336 16% $ 13,791 (2%) $ (37,333) 1% $
25,511 4% $ 14,506 6% 8% 7%
NET SALES—GEOGRAPHY
Asia $ 1,075,765
$899,177 $939,112 $922,291 $862,617 $782,984 20% (4%) 2% 7% 10% $7,093 19% $ (5,743) (4%) $ (10,107) 3% $5,775 6% $(28) 10% 7% 7% Americas925,220797,842830,241835,177809,989807,182 16% (4%) (1%) 3% 0%2,455 16%80 (4%)(930) (0%)(49) 3%901 0% 6% 5%
Europe784,889668,346637,243662,461636,472577,257 17% 5% (4%) 4% 10% 22,788 14% 19,454 2% (26,296) 0% 19,785 1% 13,633 8% 11% 8%
Total $ 2,785,874 $ 2,365,365 $
2,406,596 $ 2,419,929 $ 2,309,078 $ 2,167,423 18% (2%) (1%) 5% 7% $ 32,336 16% $ 13,791 (2%) $ (37,333) 1% $ 25,511 4% $ 14,506 6% 8% 7%
NET SALES—MARKETS
Pharmaceutical $ 1,667,061 $ 1,386,966 $ 1,365,275 $ 1,365,731 $ 1,294,668 $ 1,206,316 20% 2% 0% 5% 7% $ 15,542 19% $5,871 1% $ (27,681) 2% $ 15,340 4% $9,725 7%
11% 10% Industrial829,204707,772719,377737,144721,088690,119 17% (2%) (2%) 2% 4% 12,430 15%7,959 (3%)(5,448) (2%)8,028 1% (2,255) 5% 7% 6% Academic & Government289,609270,627321,944317,054293,322270,988 7% (16%) 2% 8% 8%4,364 5%(39)
(16%)(4,204) 3%2,143 7%7,036 6% (5%) (6%)
Total $ 2,785,874 $ 2,365,365 $ 2,406,596 $ 2,419,929 $ 2,309,078 $ 2,167,423 18% (2%) (1%) 5% 7% $ 32,336 16% $ 13,791
(2%) $ (37,333) 1% $ 25,511 4% $ 14,506 6% 8% 7%
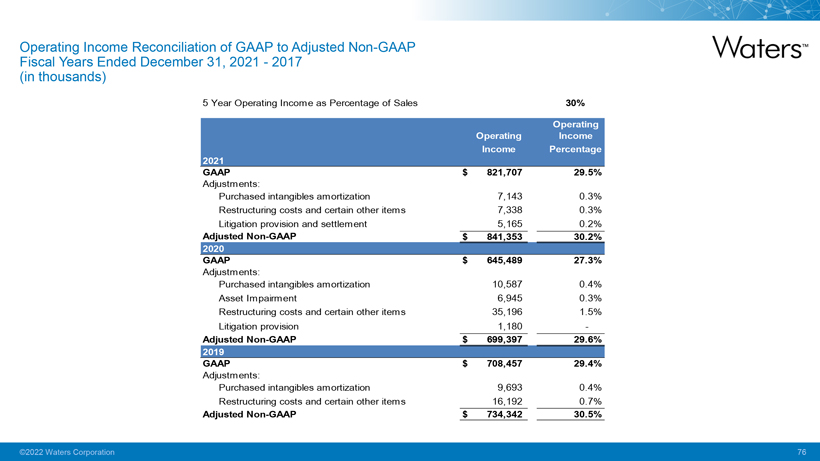
Operating Fiscal Years Income Ended Reconciliation December 31, of 2021 GAAP —2017 to Adjusted
Non-GAAP (in thousands)
5 Year Operating Income as Percentage of Sales 30% GAAP $821,707 29.5%
Adjustments:
Purchased intangibles amortization7,143 0.3% Restructuring costs and certain
other items7,338 0.3% Litigation provision and settlement5,165 0.2%
Adjusted Non-GAAP $841,353 30.2% GAAP $645,489 27.3%
Adjustments:
Purchased intangibles amortization10,587 0.4% Asset
Impairment6,945 0.3% Restructuring costs and certain other items35,196 1.5% Litigation provision1,180-
Adjusted Non-GAAP
$699,397 29.6% GAAP $708,457 29.4%
Adjustments:
Purchased intangibles
amortization9,693 0.4% Restructuring costs and certain other items16,192 0.7%
Adjusted Non-GAAP $734,342 30.5%
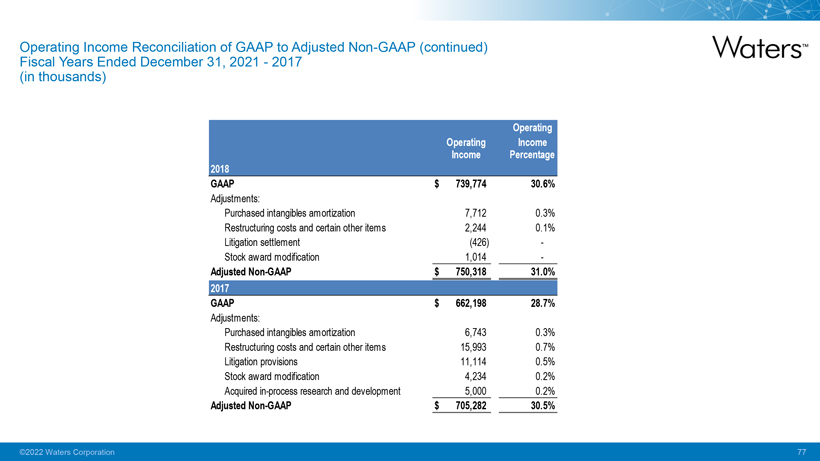
Operating Fiscal Years Income Ended Reconciliation December 31, of
2021 GAAP —2017 to Adjusted Non-GAAP (continued) (in thousands)
GAAP $739,774 30.6%
Adjustments:
Purchased intangibles amortization7,712 0.3% Restructuring costs and certain other items2,244 0.1% Litigation settlement(426)-Stock award modification1,014-
Adjusted Non-GAAP $750,318 31.0% GAAP $662,198 28.7%
Adjustments:
Purchased intangibles amortization6,743 0.3% Restructuring costs
and certain other items15,993 0.7% Litigation provisions11,114 0.5% Stock award modification4,234 0.2% Acquired in-process research and development5,000 0.2%
Adjusted Non-GAAP $705,282 30.5%
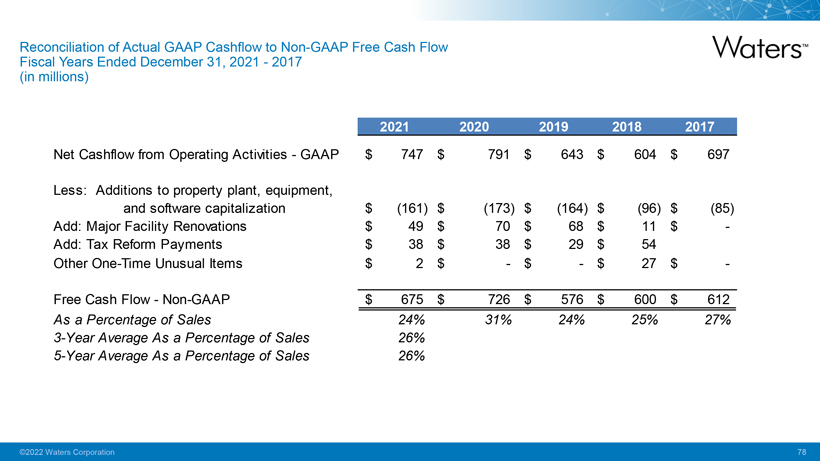
Reconciliation Fiscal Years Ended of Actual December GAAP Cashflow 31, 2021 -to 2017 Non-GAAP Free Cash Flow (in millions)
Net Cashflow from Operating Activities—GAAP $747 $791 $643 $604 $697
Less: Additions to property plant, equipment, and software capitalization $(161) $(173) $(164) $(96) $(85) Add: Major Facility Renovations $49 $70 $68 $11 $ -Add: Tax Reform Payments $38 $38 $29 $54 Other One-Time Unusual Items $2 $—$—$27 $-
Free Cash Flow—Non-GAAP $675 $726 $576 $600 $612
As a Percentage of Sales 24% 31% 24% 25% 27% 3-Year Average As a Percentage of Sales 26%
5-Year Average As a Percentage of Sales 26%
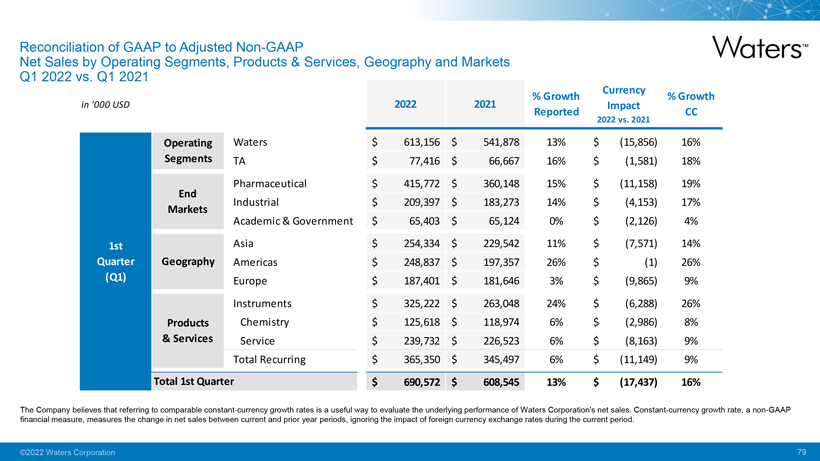
Net Reconciliation Sales by Operating of GAAP Segments, to Adjusted Products Non-GAAP &
Services, Geography and Markets
Q1 2022 vs. Q1 2021 Currency
%
Growth % Growth in ‘000 USD 2022 2021 Impact Reported CC
2022 vs. 2021
Operating Waters $613,156 $541,878 13% $(15,856) 16% Segments TA $77,416 $66,667 16% $(1,581) 18% Pharmaceutical $415,772 $360,148 15% $(11,158) 19%
End
Industrial $209,397 $183,273 14% $(4,153) 17% Markets Academic & Government
$65,403 $65,124 0% $(2,126) 4% Asia $254,334 $229,542 11% $(7,571) 14% Geography Americas $248,837 $197,357 26% $(1) 26% Europe $187,401 $181,646 3% $(9,865) 9% Instruments $325,222 $263,048 24% $(6,288) 26% Products Chemistry $125,618 $118,974 6%
$(2,986) 8%
& Services Service $239,732 $226,523 6% $(8,163) 9% Total Recurring $365,350 $345,497 6% $(11,149) 9%
Total 1st Quarter $690,572 $608,545 13% $(17,437) 16%
The Company believes that referring to
comparable constant-currency growth rates is a useful way to evaluate the underlying performance of Waters Corporation’s net sales. Constant-currency growth rate, a non-GAAP financial measure, measures
the change in net sales between current and prior year periods, ignoring the impact of foreign currency exchange rates during the current period.
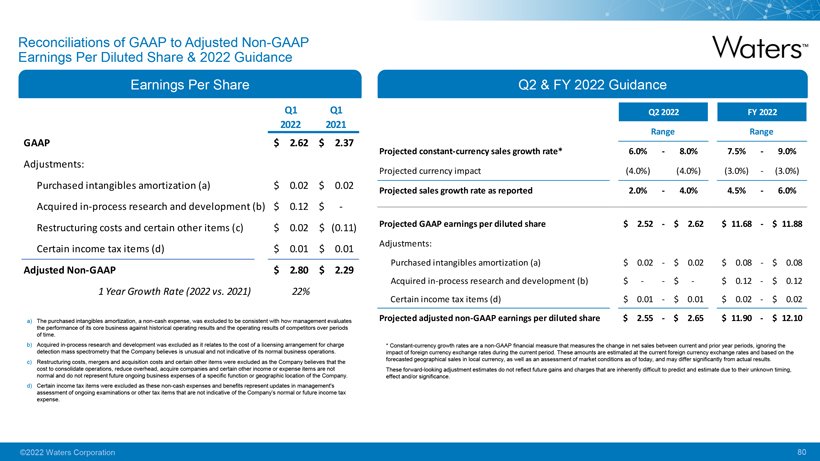
Earnings Reconciliations Per Diluted of GAAP Share to Adjusted & 2022 Guidance Non-GAAP
Q1 Q1 2022 2021 GAAP $2 .62 $2 .37
Adjustments:
Purchased intangibles amortization (a) $0 .02 $0 .02 Acquired in-process research and development (b) $0 .12 $— Restructuring costs and
certain other items (c) $0 .02 $(0.11) Certain income tax items (d) $0 .01 $0 .01
Adjusted Non-GAAP $2 .80 $2 .29
1 Year Growth Rate (2022 vs. 2021) 22%
a) The purchased intangibles
amortization, a non-cash expense, was excluded to be consistent with how management evaluates the performance of its core business against historical operating results and the operating results of competitors
over periods of time. b) Acquired in-process research and development was excluded as it relates to the cost of a licensing arrangement for charge detection mass spectrometry that the Company believes is
unusual and not indicative of its normal business operations. c) Restructuring costs, mergers and acquisition costs and certain other items were excluded as the Company believes that the cost to consolidate operations, reduce overhead, acquire
companies and certain other income or expense items are not normal and do not represent future ongoing business expenses of a specific function or geographic location of the Company. d) Certain income tax items were excluded as these non-cash expenses and benefits represent updates in management’s assessment of ongoing examinations or other tax items that are not indicative of the Company’s normal or future income tax expense.
Range Range Projected constant-currency sales growth rate* 6.0%—8.0% 7.5%—9.0%
Projected currency impact (4.0%) (4.0%) (3.0%)—(3.0%)
Projected sales growth rate as
reported 2.0%—4.0% 4.5%—6.0%
Projected GAAP earnings per diluted share $2 .52—$2 .62 $11.68—$11.88
Adjustments:
Purchased intangibles amortization (a) $0 .02—$0 .02 $0 .08—$0 .08
Acquired in-process research and development (b) $——$— $0 .12—$0 .12 Certain income tax items (d) $0 .01—$0 .01 $0 .02—$0 .02
Projected adjusted non-GAAP earnings per diluted share $2 .55—$2 .65 $11.90—$12.10
* Constant-currency growth rates are a non-GAAP financial measure that measures the change in net sales between current and prior year
periods, ignoring the impact of foreign currency exchange rates during the current period. These amounts are estimated at the current foreign currency exchange rates and based on the forecasted geographical sales in local currency, as well as an
assessment of market conditions as of today, and may differ significantly from actual results.
These forward-looking adjustment estimates do not reflect future
gains and charges that are inherently difficult to predict and estimate due to their unknown timing, effect and/or significance.
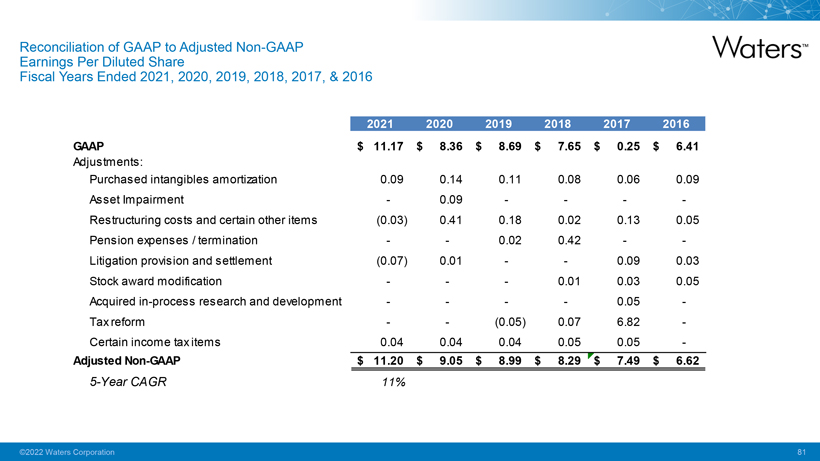
Reconciliation Earnings Per Diluted of GAAP Share to Adjusted Non-GAAP
Fiscal Years Ended 2021, 2020, 2019, 2018, 2017, & 2016
GAAP $11.17 $8.36 $8.69 $7.65
$0.25 $6.41
Adjustments:
Purchased intangibles
amortization0.090.140.110.080.060.09 Asset Impairment—0.09———-Restructuring costs and certain other items(0.03)0.410.180.020.130.05 Pension expenses / termination——0.020.42—-Litigation provision and
settlement(0.07)0.01——0.090.03 Stock award modification———0.010.030.05
Acquired in-process
research and development————0.05 -Tax reform——(0.05)0.076.82-Certain income tax items0.040.040.040.050.05-
Adjusted Non-GAAP $11.20 $9.05 $8.99 $8.29 $7.49 $6.62
5-Year CAGR 11%
Waters
ir.waters.com
[email protected]
Serious News for Serious Traders! Try StreetInsider.com Premium Free!
You May Also Be Interested In
- Waters Corp. (WAT) PT Raised to $319 at Baird
- Catalight Practice Guidelines Reflect a Contemporary Research View of the Dosage Effect and Outcome Measures in Autism Care
- WorkMoney Praises U.S. Department of Labor Rule Increasing Federal Overtime Salary Threshold
Create E-mail Alert Related Categories
SEC FilingsSign up for StreetInsider Free!
Receive full access to all new and archived articles, unlimited portfolio tracking, e-mail alerts, custom newswires and RSS feeds - and more!
