Form 8-K WABASH NATIONAL Corp For: May 19

Wabash 2022 Investor Meeting Changing How the World Reaches YouTM May 19, 2022
2WNC Investor Day | WELCOME & OPENING REMARKS RYAN REED SR DIRECTOR OF CORPORATE DEVELOPMENT & IR
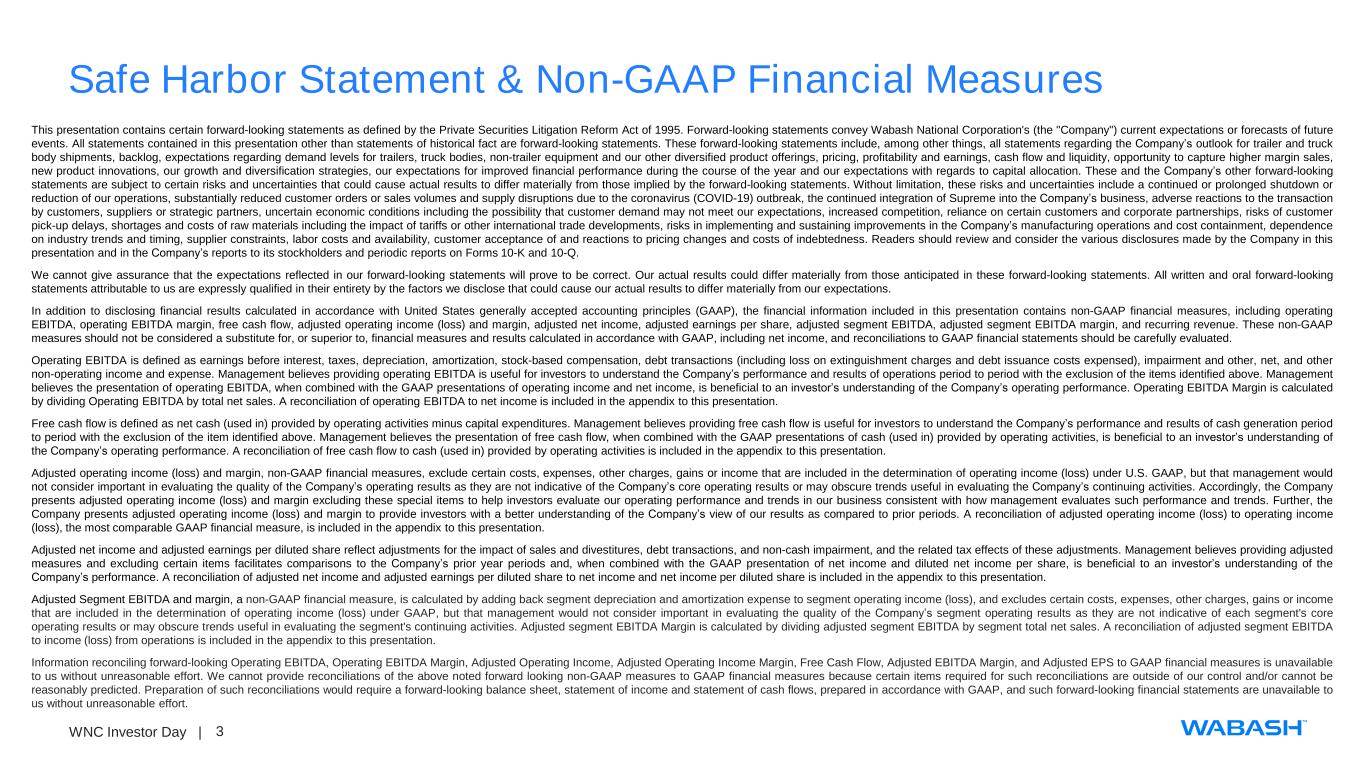
3WNC Investor Day | Safe Harbor Statement & Non-GAAP Financial Measures This presentation contains certain forward-looking statements as defined by the Private Securities Litigation Reform Act of 1995. Forward-looking statements convey Wabash National Corporation's (the "Company") current expectations or forecasts of future events. All statements contained in this presentation other than statements of historical fact are forward-looking statements. These forward-looking statements include, among other things, all statements regarding the Company’s outlook for trailer and truck body shipments, backlog, expectations regarding demand levels for trailers, truck bodies, non-trailer equipment and our other diversified product offerings, pricing, profitability and earnings, cash flow and liquidity, opportunity to capture higher margin sales, new product innovations, our growth and diversification strategies, our expectations for improved financial performance during the course of the year and our expectations with regards to capital allocation. These and the Company’s other forward-looking statements are subject to certain risks and uncertainties that could cause actual results to differ materially from those implied by the forward-looking statements. Without limitation, these risks and uncertainties include a continued or prolonged shutdown or reduction of our operations, substantially reduced customer orders or sales volumes and supply disruptions due to the coronavirus (COVID-19) outbreak, the continued integration of Supreme into the Company’s business, adverse reactions to the transaction by customers, suppliers or strategic partners, uncertain economic conditions including the possibility that customer demand may not meet our expectations, increased competition, reliance on certain customers and corporate partnerships, risks of customer pick-up delays, shortages and costs of raw materials including the impact of tariffs or other international trade developments, risks in implementing and sustaining improvements in the Company’s manufacturing operations and cost containment, dependence on industry trends and timing, supplier constraints, labor costs and availability, customer acceptance of and reactions to pricing changes and costs of indebtedness. Readers should review and consider the various disclosures made by the Company in this presentation and in the Company’s reports to its stockholders and periodic reports on Forms 10-K and 10-Q. We cannot give assurance that the expectations reflected in our forward-looking statements will prove to be correct. Our actual results could differ materially from those anticipated in these forward-looking statements. All written and oral forward-looking statements attributable to us are expressly qualified in their entirety by the factors we disclose that could cause our actual results to differ materially from our expectations. In addition to disclosing financial results calculated in accordance with United States generally accepted accounting principles (GAAP), the financial information included in this presentation contains non-GAAP financial measures, including operating EBITDA, operating EBITDA margin, free cash flow, adjusted operating income (loss) and margin, adjusted net income, adjusted earnings per share, adjusted segment EBITDA, adjusted segment EBITDA margin, and recurring revenue. These non-GAAP measures should not be considered a substitute for, or superior to, financial measures and results calculated in accordance with GAAP, including net income, and reconciliations to GAAP financial statements should be carefully evaluated. Operating EBITDA is defined as earnings before interest, taxes, depreciation, amortization, stock-based compensation, debt transactions (including loss on extinguishment charges and debt issuance costs expensed), impairment and other, net, and other non-operating income and expense. Management believes providing operating EBITDA is useful for investors to understand the Company’s performance and results of operations period to period with the exclusion of the items identified above. Management believes the presentation of operating EBITDA, when combined with the GAAP presentations of operating income and net income, is beneficial to an investor’s understanding of the Company’s operating performance. Operating EBITDA Margin is calculated by dividing Operating EBITDA by total net sales. A reconciliation of operating EBITDA to net income is included in the appendix to this presentation. Free cash flow is defined as net cash (used in) provided by operating activities minus capital expenditures. Management believes providing free cash flow is useful for investors to understand the Company’s performance and results of cash generation period to period with the exclusion of the item identified above. Management believes the presentation of free cash flow, when combined with the GAAP presentations of cash (used in) provided by operating activities, is beneficial to an investor’s understanding of the Company’s operating performance. A reconciliation of free cash flow to cash (used in) provided by operating activities is included in the appendix to this presentation. Adjusted operating income (loss) and margin, non-GAAP financial measures, exclude certain costs, expenses, other charges, gains or income that are included in the determination of operating income (loss) under U.S. GAAP, but that management would not consider important in evaluating the quality of the Company’s operating results as they are not indicative of the Company’s core operating results or may obscure trends useful in evaluating the Company’s continuing activities. Accordingly, the Company presents adjusted operating income (loss) and margin excluding these special items to help investors evaluate our operating performance and trends in our business consistent with how management evaluates such performance and trends. Further, the Company presents adjusted operating income (loss) and margin to provide investors with a better understanding of the Company’s view of our results as compared to prior periods. A reconciliation of adjusted operating income (loss) to operating income (loss), the most comparable GAAP financial measure, is included in the appendix to this presentation. Adjusted net income and adjusted earnings per diluted share reflect adjustments for the impact of sales and divestitures, debt transactions, and non-cash impairment, and the related tax effects of these adjustments. Management believes providing adjusted measures and excluding certain items facilitates comparisons to the Company’s prior year periods and, when combined with the GAAP presentation of net income and diluted net income per share, is beneficial to an investor’s understanding of the Company’s performance. A reconciliation of adjusted net income and adjusted earnings per diluted share to net income and net income per diluted share is included in the appendix to this presentation. Adjusted Segment EBITDA and margin, a non-GAAP financial measure, is calculated by adding back segment depreciation and amortization expense to segment operating income (loss), and excludes certain costs, expenses, other charges, gains or income that are included in the determination of operating income (loss) under GAAP, but that management would not consider important in evaluating the quality of the Company’s segment operating results as they are not indicative of each segment's core operating results or may obscure trends useful in evaluating the segment's continuing activities. Adjusted segment EBITDA Margin is calculated by dividing adjusted segment EBITDA by segment total net sales. A reconciliation of adjusted segment EBITDA to income (loss) from operations is included in the appendix to this presentation. Information reconciling forward-looking Operating EBITDA, Operating EBITDA Margin, Adjusted Operating Income, Adjusted Operating Income Margin, Free Cash Flow, Adjusted EBITDA Margin, and Adjusted EPS to GAAP financial measures is unavailable to us without unreasonable effort. We cannot provide reconciliations of the above noted forward looking non-GAAP measures to GAAP financial measures because certain items required for such reconciliations are outside of our control and/or cannot be reasonably predicted. Preparation of such reconciliations would require a forward-looking balance sheet, statement of income and statement of cash flows, prepared in accordance with GAAP, and such forward-looking financial statements are unavailable to us without unreasonable effort.
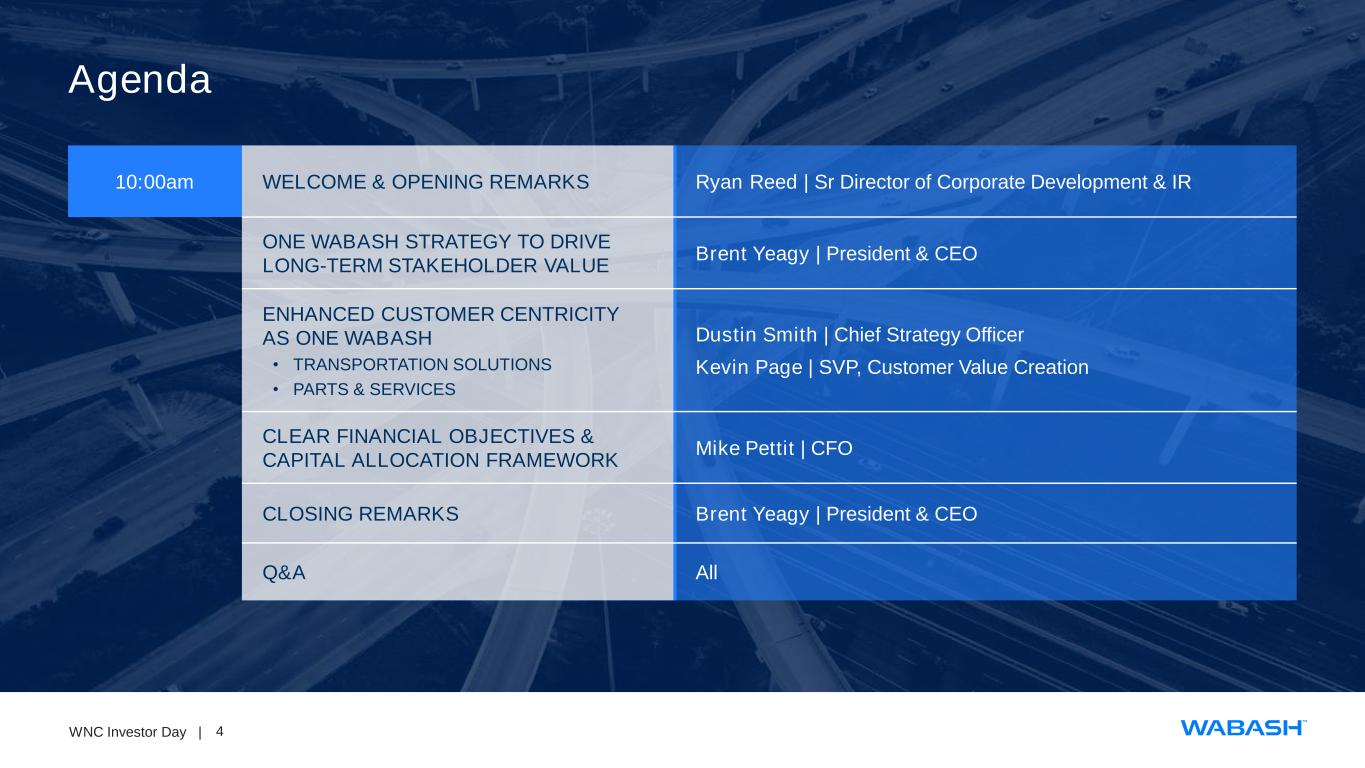
4WNC Investor Day | Agenda 10:00am WELCOME & OPENING REMARKS Ryan Reed | Sr Director of Corporate Development & IR ONE WABASH STRATEGY TO DRIVE LONG-TERM STAKEHOLDER VALUE Brent Yeagy | President & CEO ENHANCED CUSTOMER CENTRICITY AS ONE WABASH • TRANSPORTATION SOLUTIONS • PARTS & SERVICES Dustin Smith | Chief Strategy Officer Kevin Page | SVP, Customer Value Creation CLEAR FINANCIAL OBJECTIVES & CAPITAL ALLOCATION FRAMEWORK Mike Pettit | CFO CLOSING REMARKS Brent Yeagy | President & CEO Q&A All
5WNC Investor Day | ONE WABASH STRATEGY TO DRIVE LONG-TERM STAKEHOLDER VALUE BRENT YEAGY PRESIDENT & CEO
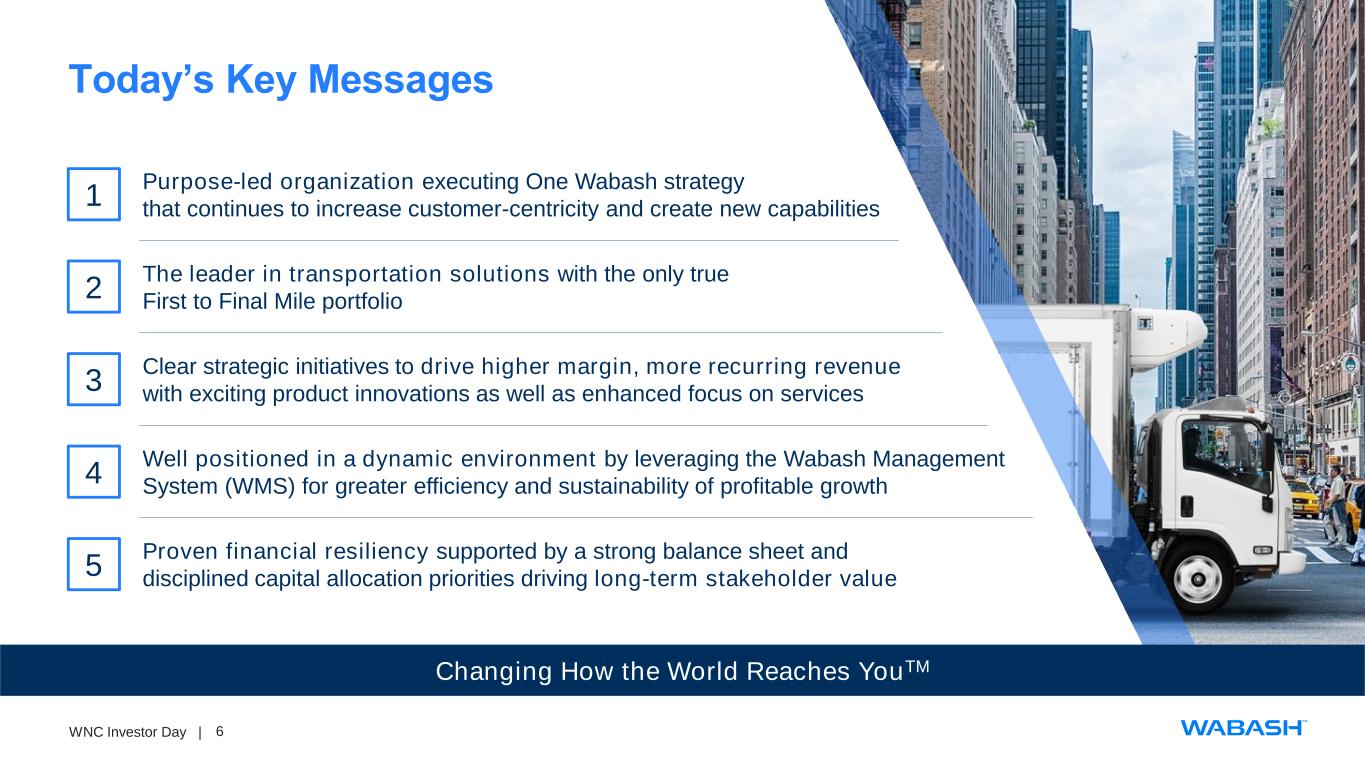
6WNC Investor Day | Today’s Key Messages Changing How the World Reaches YouTM 1 2 3 4 5 Purpose-led organization executing One Wabash strategy that continues to increase customer-centricity and create new capabilities The leader in transportation solutions with the only true First to Final Mile portfolio Clear strategic initiatives to drive higher margin, more recurring revenue with exciting product innovations as well as enhanced focus on services Well positioned in a dynamic environment by leveraging the Wabash Management System (WMS) for greater efficiency and sustainability of profitable growth Proven financial resiliency supported by a strong balance sheet and disciplined capital allocation priorities driving long-term stakeholder value
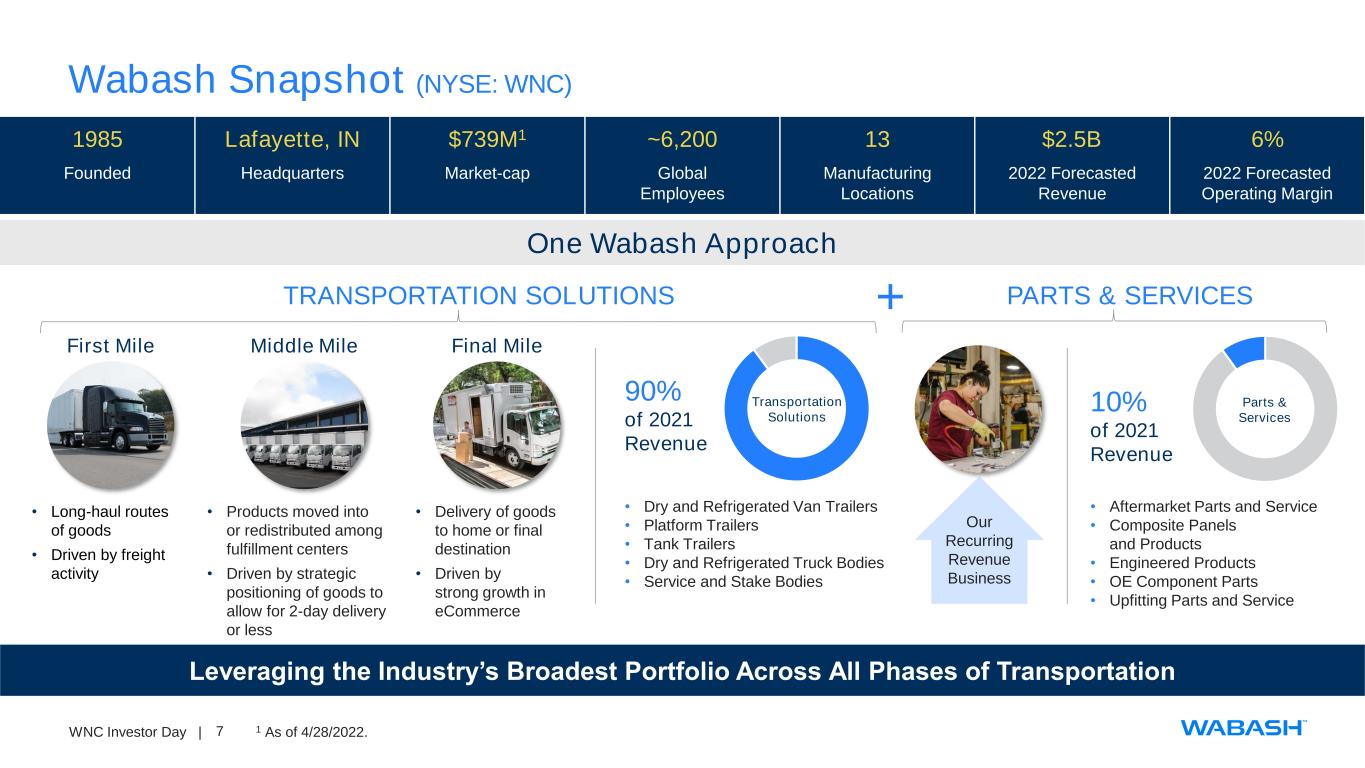
7WNC Investor Day | Wabash Snapshot (NYSE: WNC) Leveraging the Industry’s Broadest Portfolio Across All Phases of Transportation 1985 Lafayette, IN $739M1 ~6,200 13 $2.5B 6% Founded Headquarters Market-cap Global Employees Manufacturing Locations 2022 Forecasted Revenue 2022 Forecasted Operating Margin • Long-haul routes of goods • Driven by freight activity • Products moved into or redistributed among fulfillment centers • Driven by strategic positioning of goods to allow for 2-day delivery or less • Delivery of goods to home or final destination • Driven by strong growth in eCommerce 1 As of 4/28/2022. First Mile Middle Mile Final Mile One Wabash Approach • Dry and Refrigerated Van Trailers • Platform Trailers • Tank Trailers • Dry and Refrigerated Truck Bodies • Service and Stake Bodies TRANSPORTATION SOLUTIONS PARTS & SERVICES+ Transportation Solutions • Aftermarket Parts and Service • Composite Panels and Products • Engineered Products • OE Component Parts • Upfitting Parts and Service Parts & Services Our Recurring Revenue Business 90% of 2021 Revenue 10% of 2021 Revenue
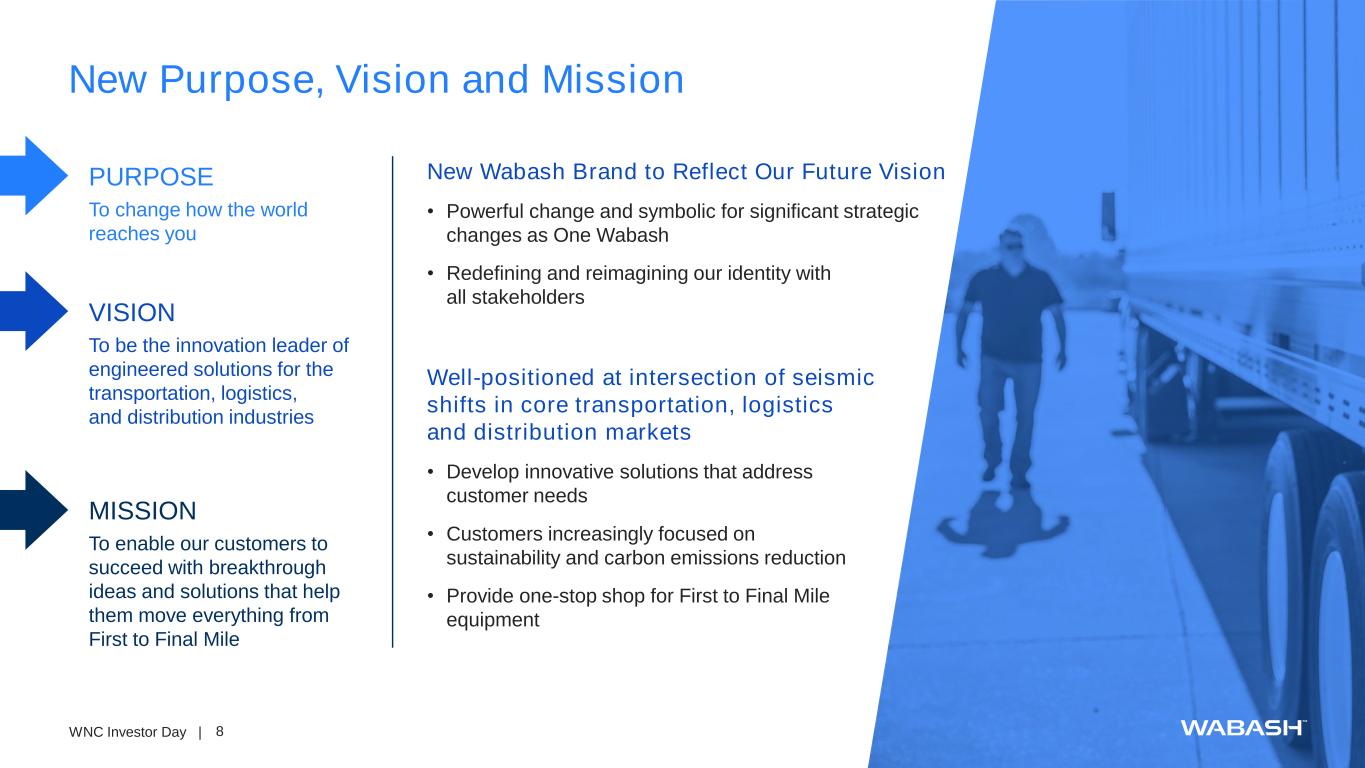
8WNC Investor Day | New Purpose, Vision and Mission PURPOSE To change how the world reaches you VISION To be the innovation leader of engineered solutions for the transportation, logistics, and distribution industries MISSION To enable our customers to succeed with breakthrough ideas and solutions that help them move everything from First to Final Mile New Wabash Brand to Reflect Our Future Vision • Powerful change and symbolic for significant strategic changes as One Wabash • Redefining and reimagining our identity with all stakeholders Well-positioned at intersection of seismic shifts in core transportation, logistics and distribution markets • Develop innovative solutions that address customer needs • Customers increasingly focused on sustainability and carbon emissions reduction • Provide one-stop shop for First to Final Mile equipment
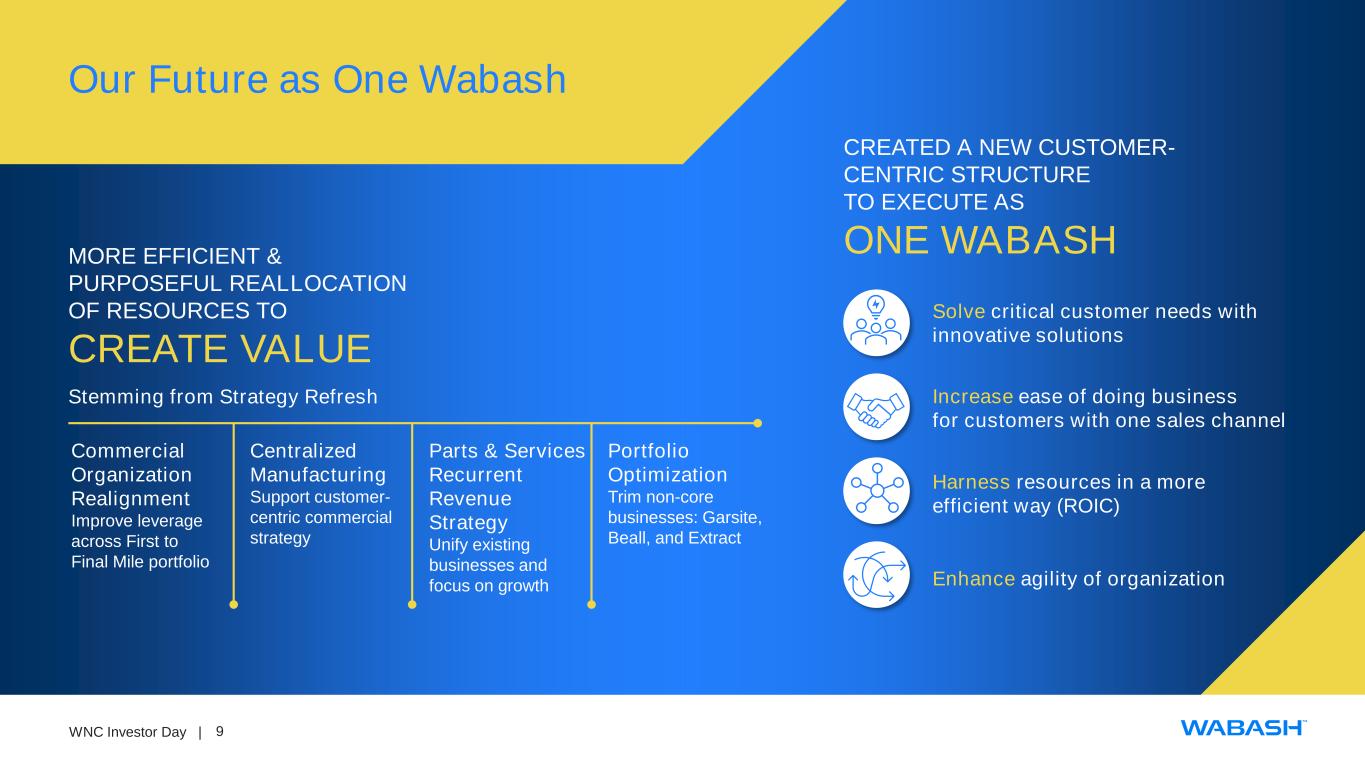
9WNC Investor Day | Our Future as One Wabash Commercial Organization Realignment Improve leverage across First to Final Mile portfolio Centralized Manufacturing Support customer- centric commercial strategy Parts & Services Recurrent Revenue Strategy Unify existing businesses and focus on growth Portfolio Optimization Trim non-core businesses: Garsite, Beall, and Extract MORE EFFICIENT & PURPOSEFUL REALLOCATION OF RESOURCES TO CREATE VALUE Solve critical customer needs with innovative solutions CREATED A NEW CUSTOMER- CENTRIC STRUCTURE TO EXECUTE AS ONE WABASH Stemming from Strategy Refresh Increase ease of doing business for customers with one sales channel Harness resources in a more efficient way (ROIC) Enhance agility of organization
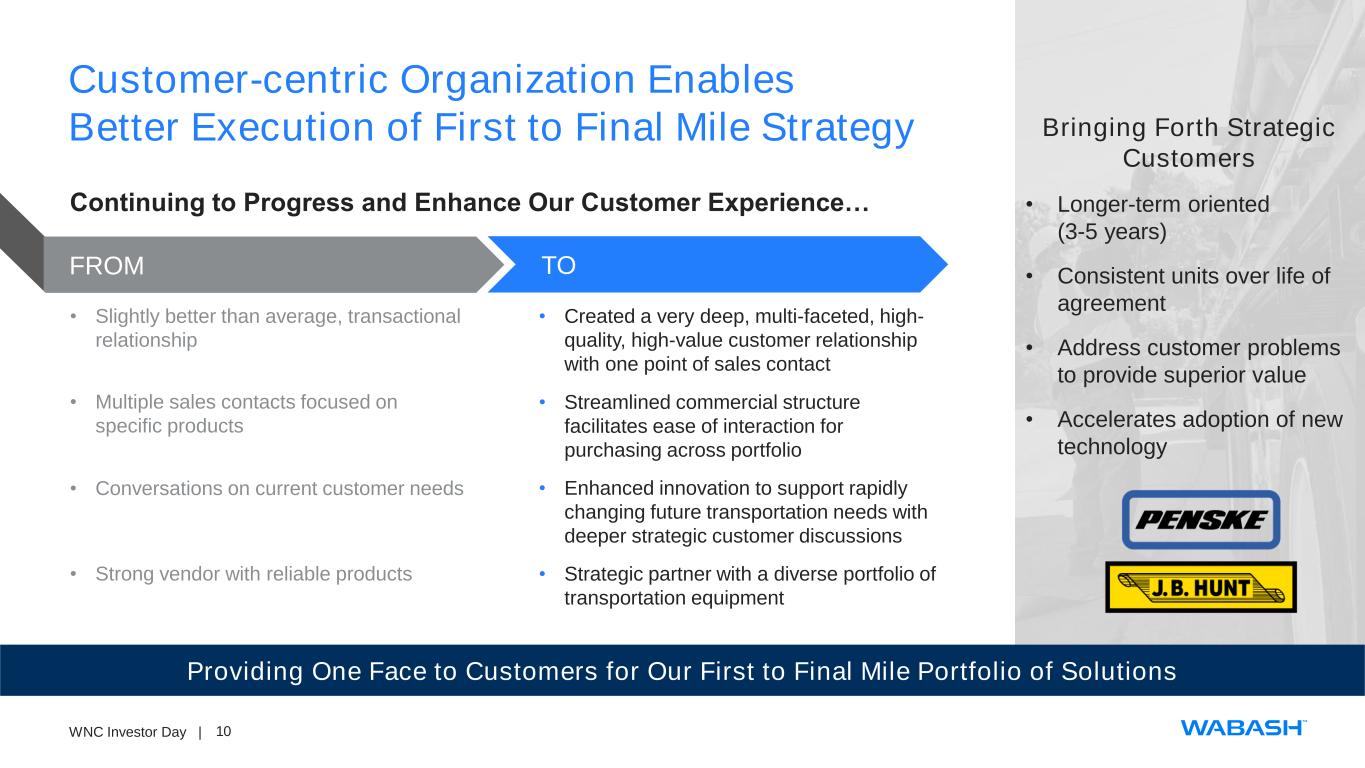
10WNC Investor Day | Customer-centric Organization Enables Better Execution of First to Final Mile Strategy Providing One Face to Customers for Our First to Final Mile Portfolio of Solutions Continuing to Progress and Enhance Our Customer Experience… FROM TO • Slightly better than average, transactional relationship • Created a very deep, multi-faceted, high- quality, high-value customer relationship with one point of sales contact • Streamlined commercial structure facilitates ease of interaction for purchasing across portfolio • Enhanced innovation to support rapidly changing future transportation needs with deeper strategic customer discussions • Strategic partner with a diverse portfolio of transportation equipment • Multiple sales contacts focused on specific products • Conversations on current customer needs • Strong vendor with reliable products Bringing Forth Strategic Customers • Longer-term oriented (3-5 years) • Consistent units over life of agreement • Address customer problems to provide superior value • Accelerates adoption of new technology
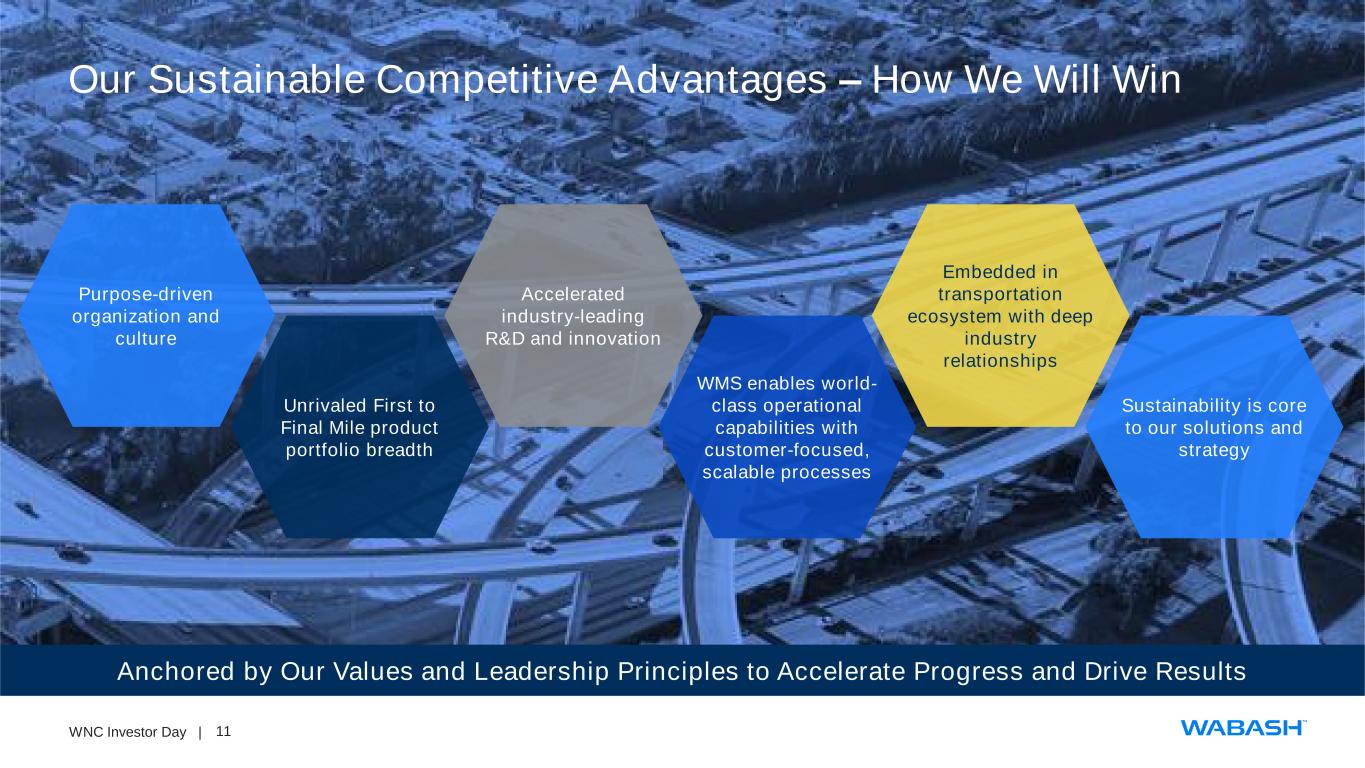
11WNC Investor Day | Our Sustainable Competitive Advantages – How We Will Win Anchored by Our Values and Leadership Principles to Accelerate Progress and Drive Results Purpose-driven organization and culture Unrivaled First to Final Mile product portfolio breadth Accelerated industry-leading R&D and innovation WMS enables world- class operational capabilities with customer-focused, scalable processes Embedded in transportation ecosystem with deep industry relationships Sustainability is core to our solutions and strategy
12WNC Investor Day | Corporate Responsibility Video
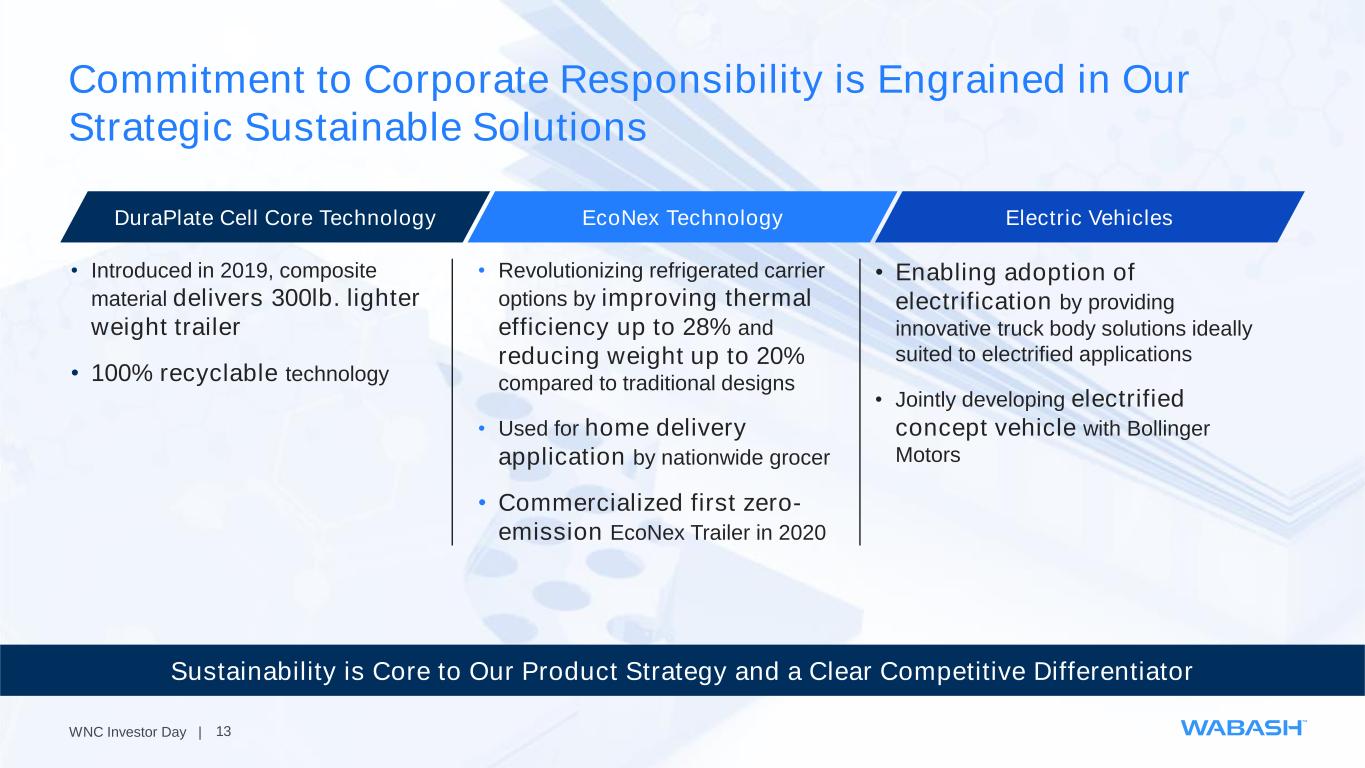
13WNC Investor Day | Commitment to Corporate Responsibility is Engrained in Our Strategic Sustainable Solutions Sustainability is Core to Our Product Strategy and a Clear Competitive Differentiator • Enabling adoption of electrification by providing innovative truck body solutions ideally suited to electrified applications • Jointly developing electrified concept vehicle with Bollinger Motors DuraPlate Cell Core Technology EcoNex Technology Electric Vehicles • Introduced in 2019, composite material delivers 300lb. lighter weight trailer • 100% recyclable technology • Revolutionizing refrigerated carrier options by improving thermal efficiency up to 28% and reducing weight up to 20% compared to traditional designs • Used for home delivery application by nationwide grocer • Commercialized first zero- emission EcoNex Trailer in 2020
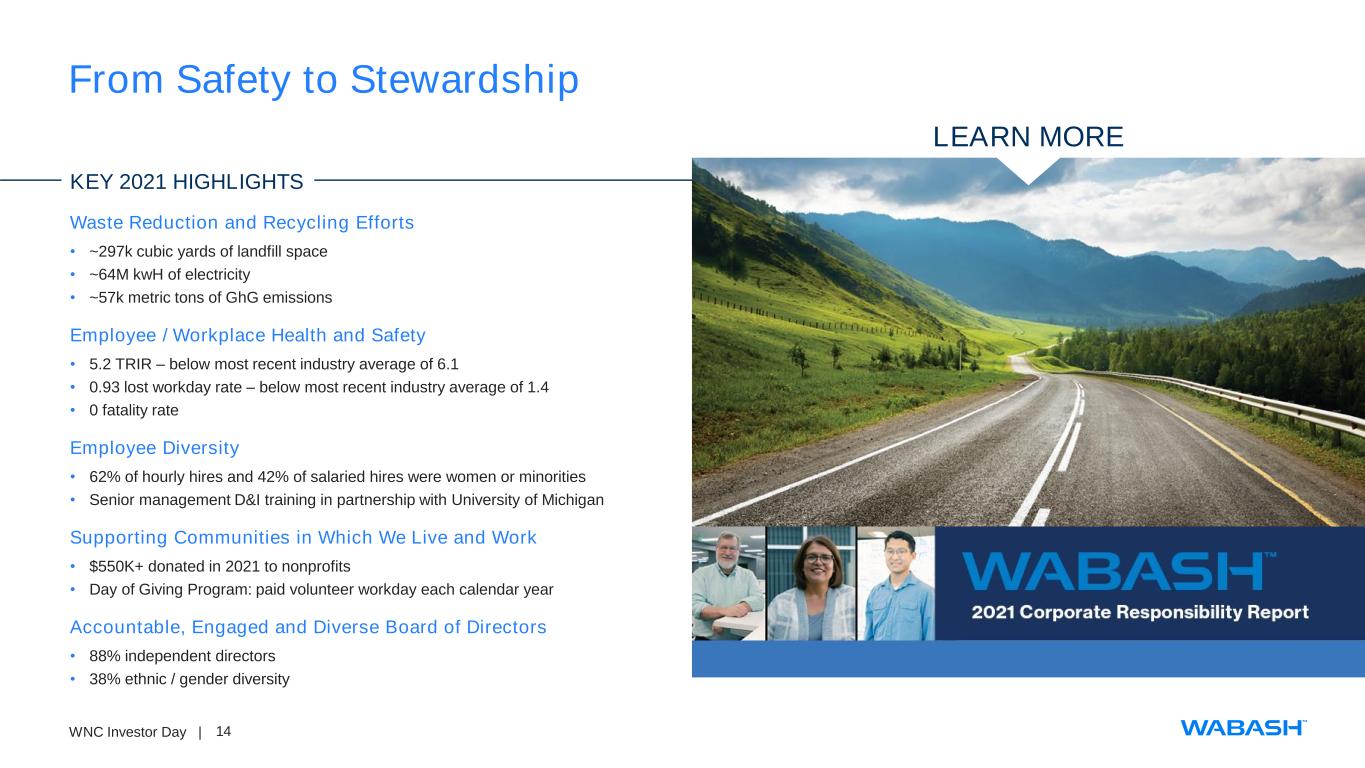
14WNC Investor Day | From Safety to Stewardship KEY 2021 HIGHLIGHTS Waste Reduction and Recycling Efforts • ~297k cubic yards of landfill space • ~64M kwH of electricity • ~57k metric tons of GhG emissions Employee / Workplace Health and Safety • 5.2 TRIR – below most recent industry average of 6.1 • 0.93 lost workday rate – below most recent industry average of 1.4 • 0 fatality rate Employee Diversity • 62% of hourly hires and 42% of salaried hires were women or minorities • Senior management D&I training in partnership with University of Michigan Supporting Communities in Which We Live and Work • $550K+ donated in 2021 to nonprofits • Day of Giving Program: paid volunteer workday each calendar year Accountable, Engaged and Diverse Board of Directors • 88% independent directors • 38% ethnic / gender diversity LEARN MORE
15WNC Investor Day | WMS Video
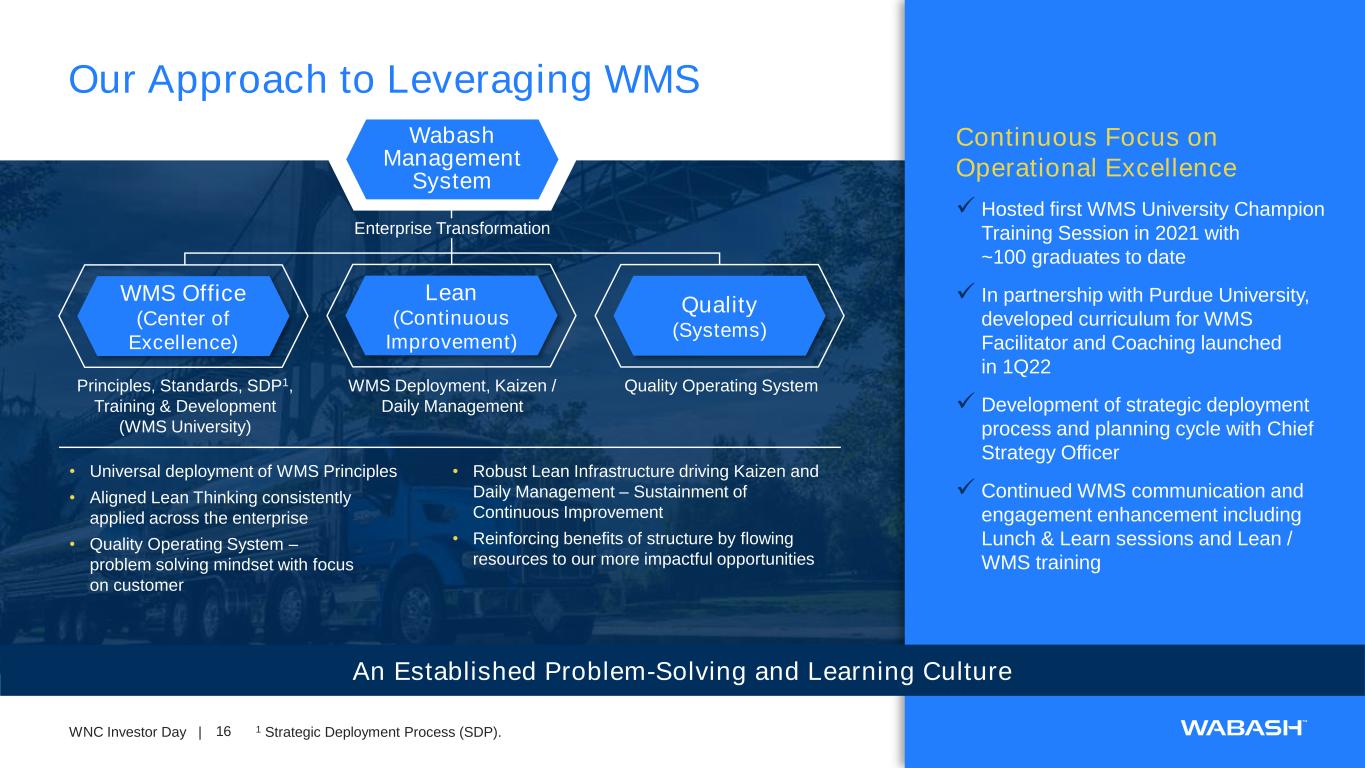
16WNC Investor Day | Our Approach to Leveraging WMS An Established Problem-Solving and Learning Culture Continuous Focus on Operational Excellence ✓ Hosted first WMS University Champion Training Session in 2021 with ~100 graduates to date ✓ In partnership with Purdue University, developed curriculum for WMS Facilitator and Coaching launched in 1Q22 ✓ Development of strategic deployment process and planning cycle with Chief Strategy Officer ✓ Continued WMS communication and engagement enhancement including Lunch & Learn sessions and Lean / WMS training • Universal deployment of WMS Principles • Aligned Lean Thinking consistently applied across the enterprise • Quality Operating System – problem solving mindset with focus on customer • Robust Lean Infrastructure driving Kaizen and Daily Management – Sustainment of Continuous Improvement • Reinforcing benefits of structure by flowing resources to our more impactful opportunities Wabash Management System WMS Office (Center of Excellence) Lean (Continuous Improvement) Quality (Systems) Enterprise Transformation Principles, Standards, SDP1, Training & Development (WMS University) WMS Deployment, Kaizen / Daily Management Quality Operating System 1 Strategic Deployment Process (SDP).
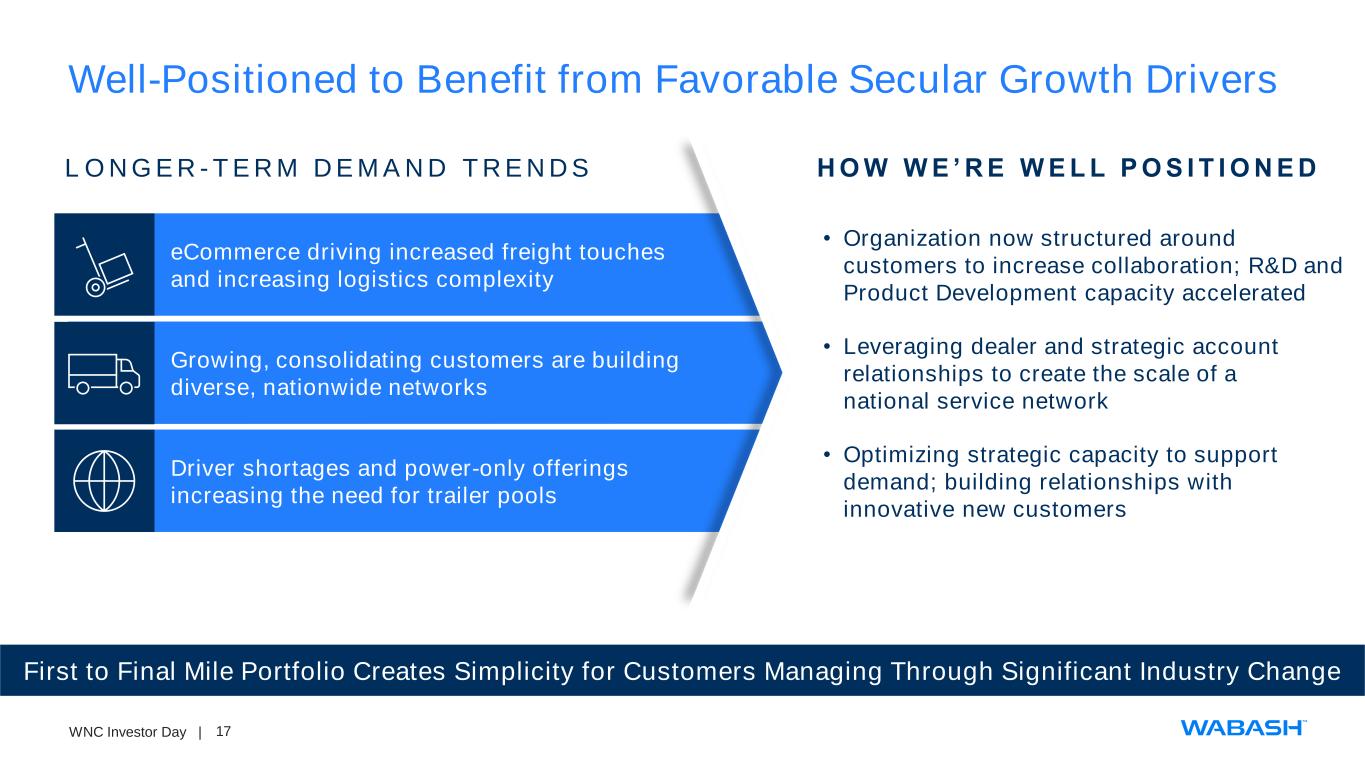
17WNC Investor Day | eCommerce driving increased freight touches and increasing logistics complexity Well-Positioned to Benefit from Favorable Secular Growth Drivers First to Final Mile Portfolio Creates Simplicity for Customers Managing Through Significant Industry Change L O N G E R - T E R M D E M AN D T R E N D S H O W W E ’ R E W E L L P O S I T I O N E D Growing, consolidating customers are building diverse, nationwide networks Driver shortages and power-only offerings increasing the need for trailer pools • Optimizing strategic capacity to support demand; building relationships with innovative new customers • Organization now structured around customers to increase collaboration; R&D and Product Development capacity accelerated • Leveraging dealer and strategic account relationships to create the scale of a national service network
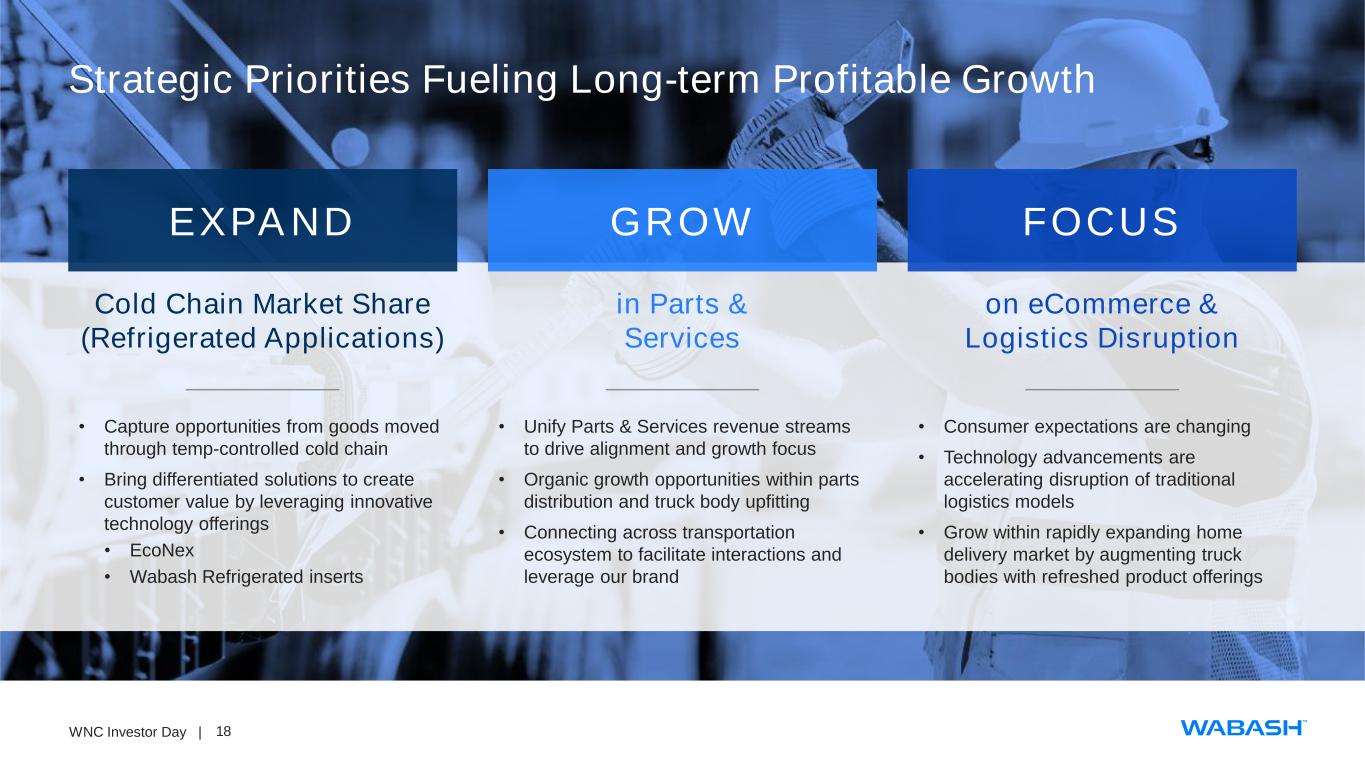
18WNC Investor Day | Strategic Priorities Fueling Long-term Profitable Growth EXPAND GROW FOCUS Cold Chain Market Share (Refrigerated Applications) in Parts & Services on eCommerce & Logistics Disruption • Capture opportunities from goods moved through temp-controlled cold chain • Bring differentiated solutions to create customer value by leveraging innovative technology offerings • EcoNex • Wabash Refrigerated inserts • Unify Parts & Services revenue streams to drive alignment and growth focus • Organic growth opportunities within parts distribution and truck body upfitting • Connecting across transportation ecosystem to facilitate interactions and leverage our brand • Consumer expectations are changing • Technology advancements are accelerating disruption of traditional logistics models • Grow within rapidly expanding home delivery market by augmenting truck bodies with refreshed product offerings
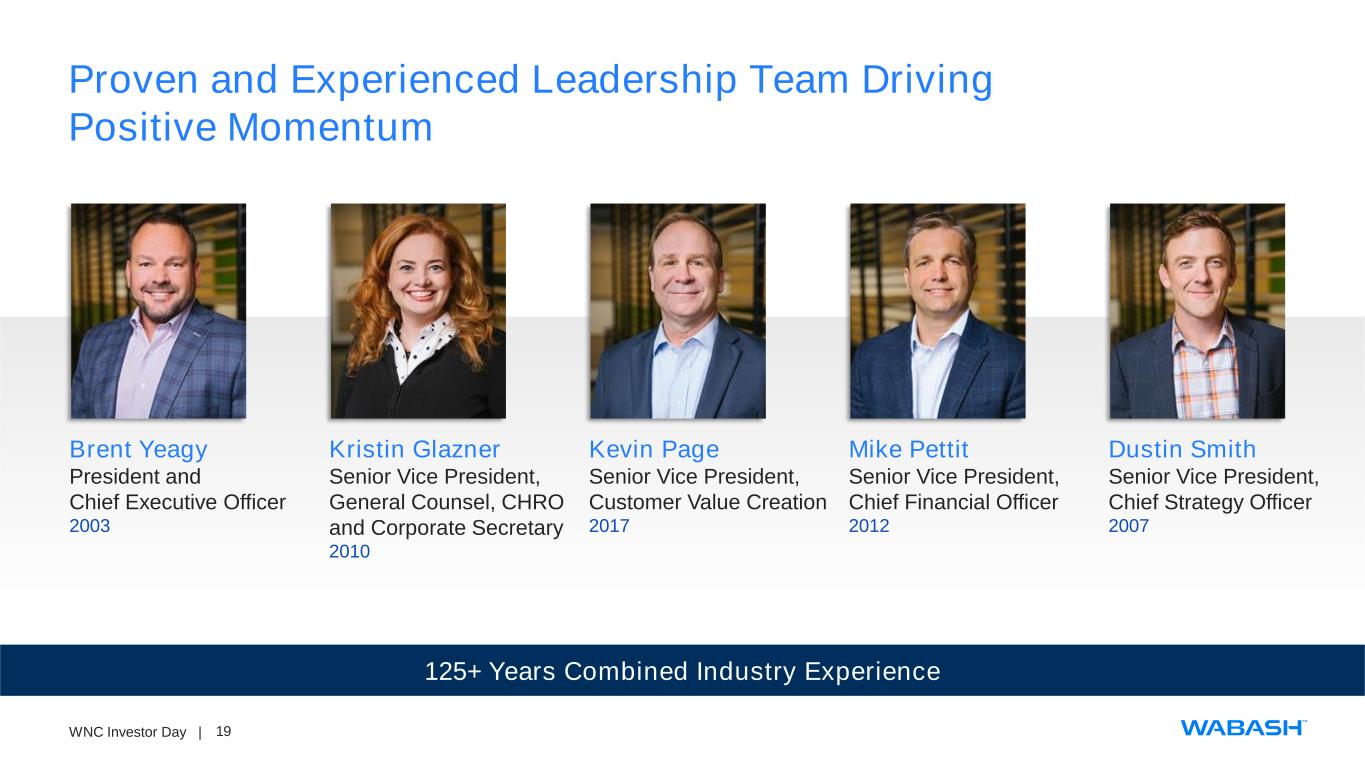
19WNC Investor Day | Proven and Experienced Leadership Team Driving Positive Momentum 125+ Years Combined Industry Experience Dustin Smith Senior Vice President, Chief Strategy Officer 2007 Mike Pettit Senior Vice President, Chief Financial Officer 2012 Kevin Page Senior Vice President, Customer Value Creation 2017 Kristin Glazner Senior Vice President, General Counsel, CHRO and Corporate Secretary 2010 Brent Yeagy President and Chief Executive Officer 2003
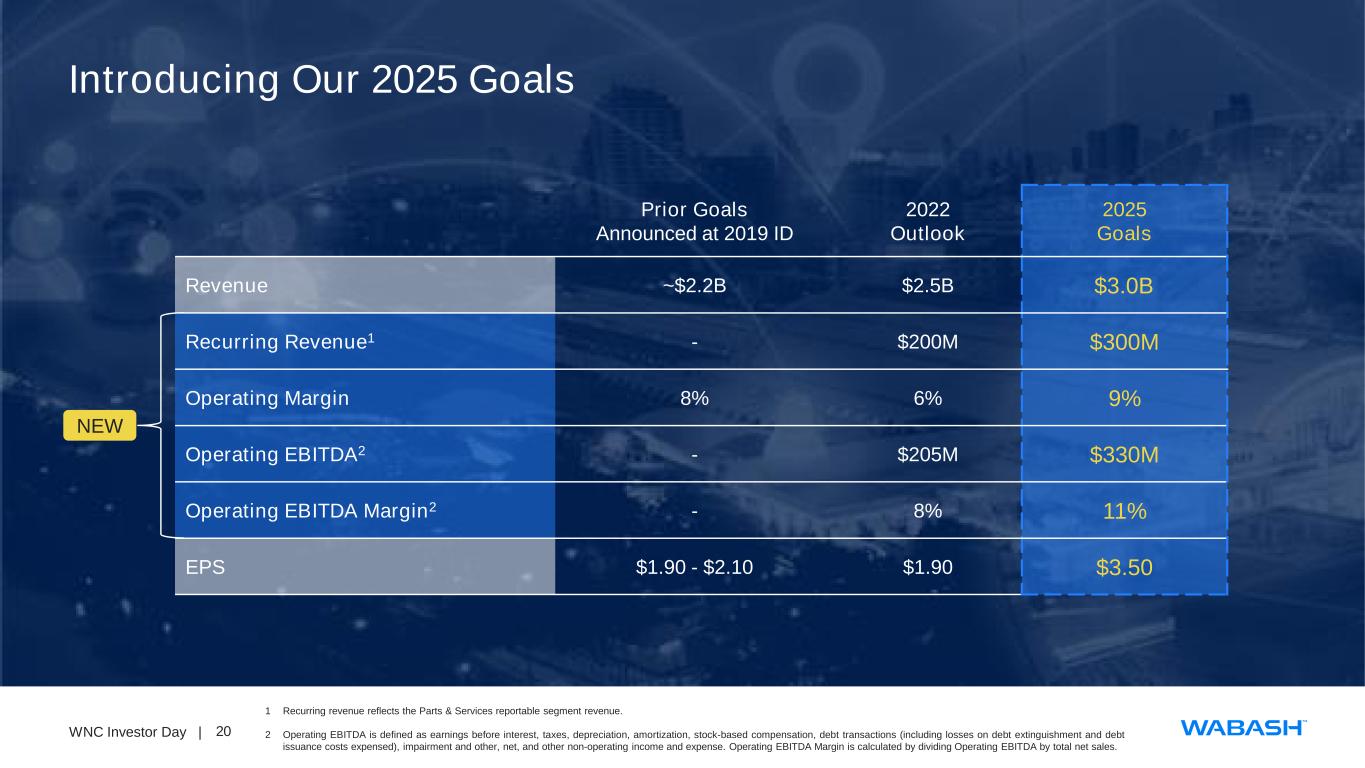
20WNC Investor Day | Introducing Our 2025 Goals Prior Goals Announced at 2019 ID 2022 Outlook 2025 Goals Revenue ~$2.2B $2.5B $3.0B Recurring Revenue1 - $200M $300M Operating Margin 8% 6% 9% Operating EBITDA2 - $205M $330M Operating EBITDA Margin2 - 8% 11% EPS $1.90 - $2.10 $1.90 $3.50 NEW 1 Recurring revenue reflects the Parts & Services reportable segment revenue. 2 Operating EBITDA is defined as earnings before interest, taxes, depreciation, amortization, stock-based compensation, debt transactions (including losses on debt extinguishment and debt issuance costs expensed), impairment and other, net, and other non-operating income and expense. Operating EBITDA Margin is calculated by dividing Operating EBITDA by total net sales.
21WNC Investor Day | DUSTIN SMITH SVP, CHIEF STRATEGY OFFICER ENHANCED CUSTOMER CENTRICITY AS ONE WABASH Transportation Solutions Parts & Services KEVIN PAGE SVP, CUSTOMER VALUE CREATION
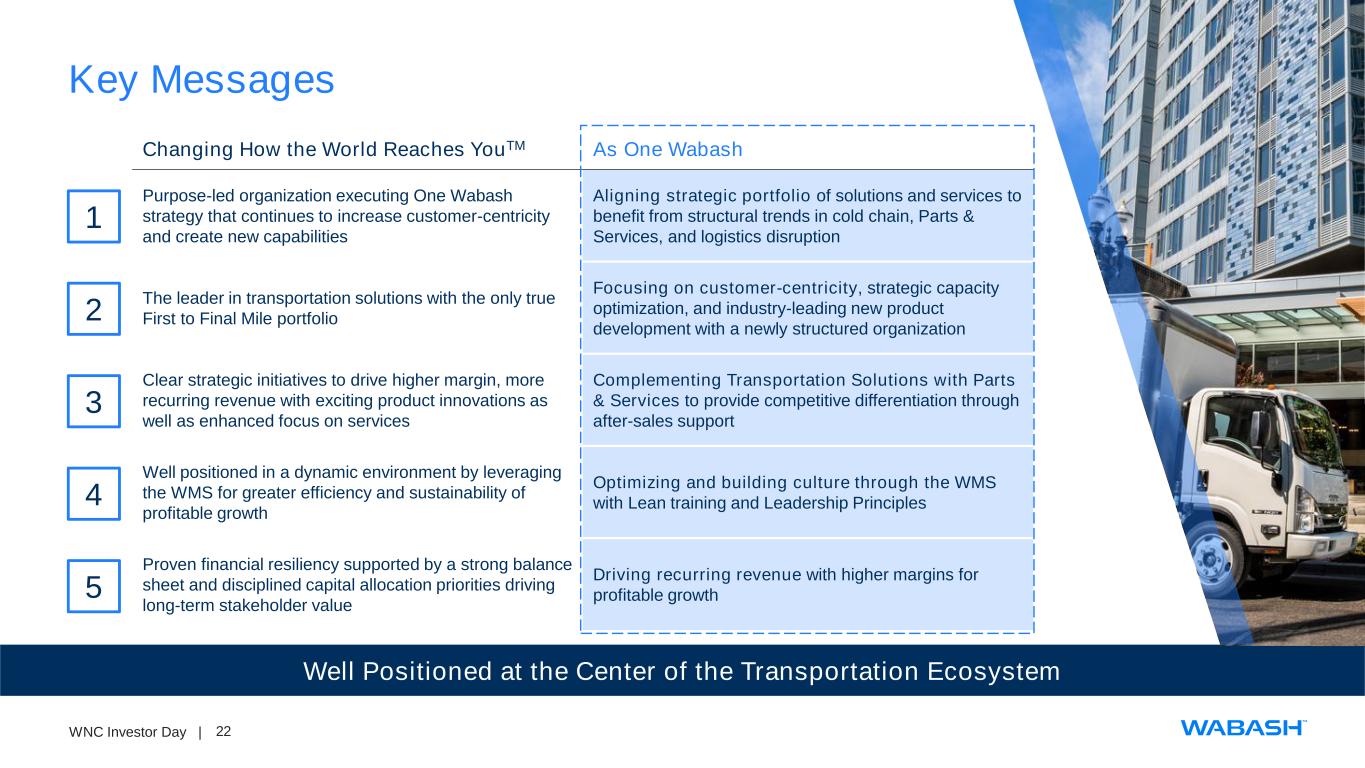
22WNC Investor Day | Key Messages Well Positioned at the Center of the Transportation Ecosystem 1 2 3 4 5 Changing How the World Reaches YouTM As One Wabash Purpose-led organization executing One Wabash strategy that continues to increase customer-centricity and create new capabilities Aligning strategic portfolio of solutions and services to benefit from structural trends in cold chain, Parts & Services, and logistics disruption The leader in transportation solutions with the only true First to Final Mile portfolio Focusing on customer-centricity, strategic capacity optimization, and industry-leading new product development with a newly structured organization Clear strategic initiatives to drive higher margin, more recurring revenue with exciting product innovations as well as enhanced focus on services Complementing Transportation Solutions with Parts & Services to provide competitive differentiation through after-sales support Well positioned in a dynamic environment by leveraging the WMS for greater efficiency and sustainability of profitable growth Optimizing and building culture through the WMS with Lean training and Leadership Principles Proven financial resiliency supported by a strong balance sheet and disciplined capital allocation priorities driving long-term stakeholder value Driving recurring revenue with higher margins for profitable growth
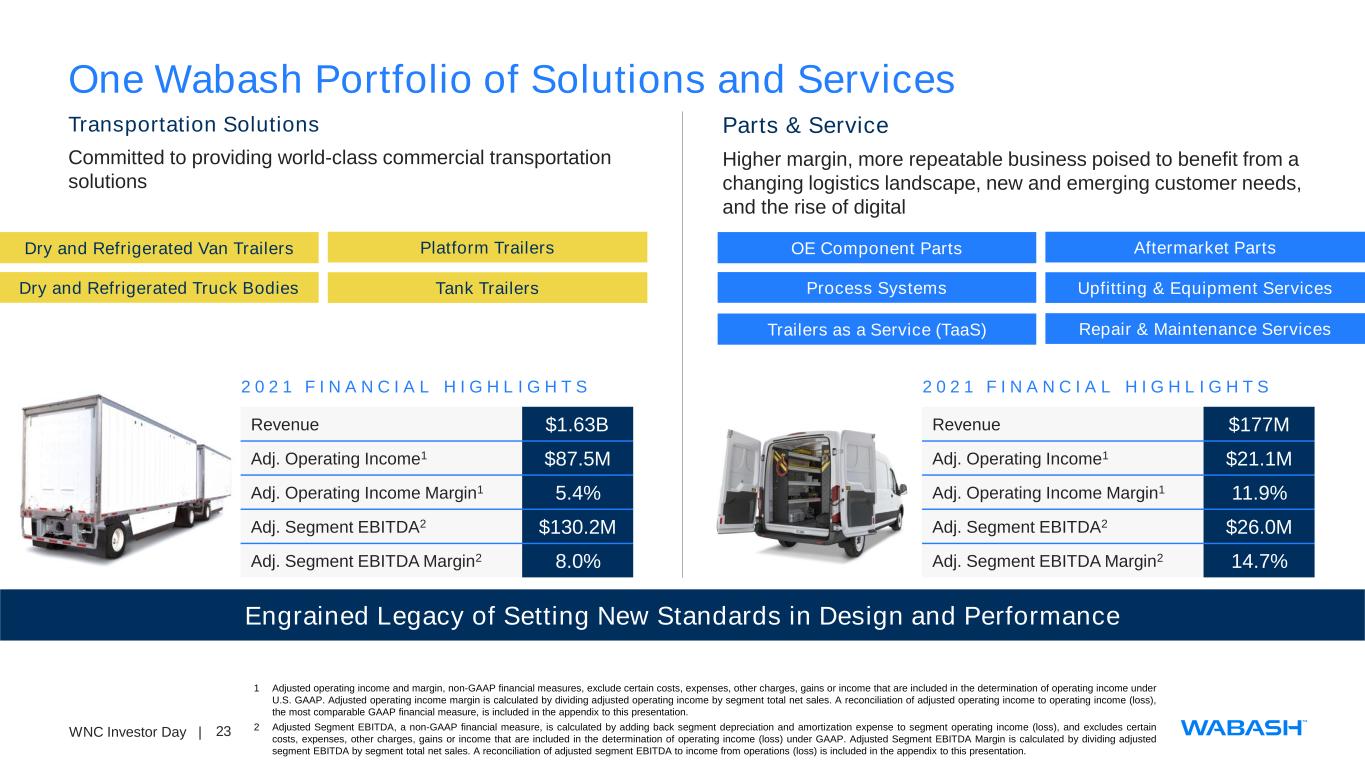
23WNC Investor Day | One Wabash Portfolio of Solutions and Services Engrained Legacy of Setting New Standards in Design and Performance Transportation Solutions Committed to providing world-class commercial transportation solutions 2 0 2 1 F I N A N C I A L H I G H L I G H T S Revenue $1.63B Adj. Operating Income1 $87.5M Adj. Operating Income Margin1 5.4% Adj. Segment EBITDA2 $130.2M Adj. Segment EBITDA Margin2 8.0% Parts & Service Higher margin, more repeatable business poised to benefit from a changing logistics landscape, new and emerging customer needs, and the rise of digital Dry and Refrigerated Van Trailers Dry and Refrigerated Truck Bodies Platform Trailers Tank Trailers 2 0 2 1 F I N A N C I A L H I G H L I G H T S Revenue $177M Adj. Operating Income1 $21.1M Adj. Operating Income Margin1 11.9% Adj. Segment EBITDA2 $26.0M Adj. Segment EBITDA Margin2 14.7% OE Component Parts Process Systems Aftermarket Parts Upfitting & Equipment Services Trailers as a Service (TaaS) Repair & Maintenance Services 1 Adjusted operating income and margin, non-GAAP financial measures, exclude certain costs, expenses, other charges, gains or income that are included in the determination of operating income under U.S. GAAP. Adjusted operating income margin is calculated by dividing adjusted operating income by segment total net sales. A reconciliation of adjusted operating income to operating income (loss), the most comparable GAAP financial measure, is included in the appendix to this presentation. 2 Adjusted Segment EBITDA, a non-GAAP financial measure, is calculated by adding back segment depreciation and amortization expense to segment operating income (loss), and excludes certain costs, expenses, other charges, gains or income that are included in the determination of operating income (loss) under GAAP. Adjusted Segment EBITDA Margin is calculated by dividing adjusted segment EBITDA by segment total net sales. A reconciliation of adjusted segment EBITDA to income from operations (loss) is included in the appendix to this presentation.
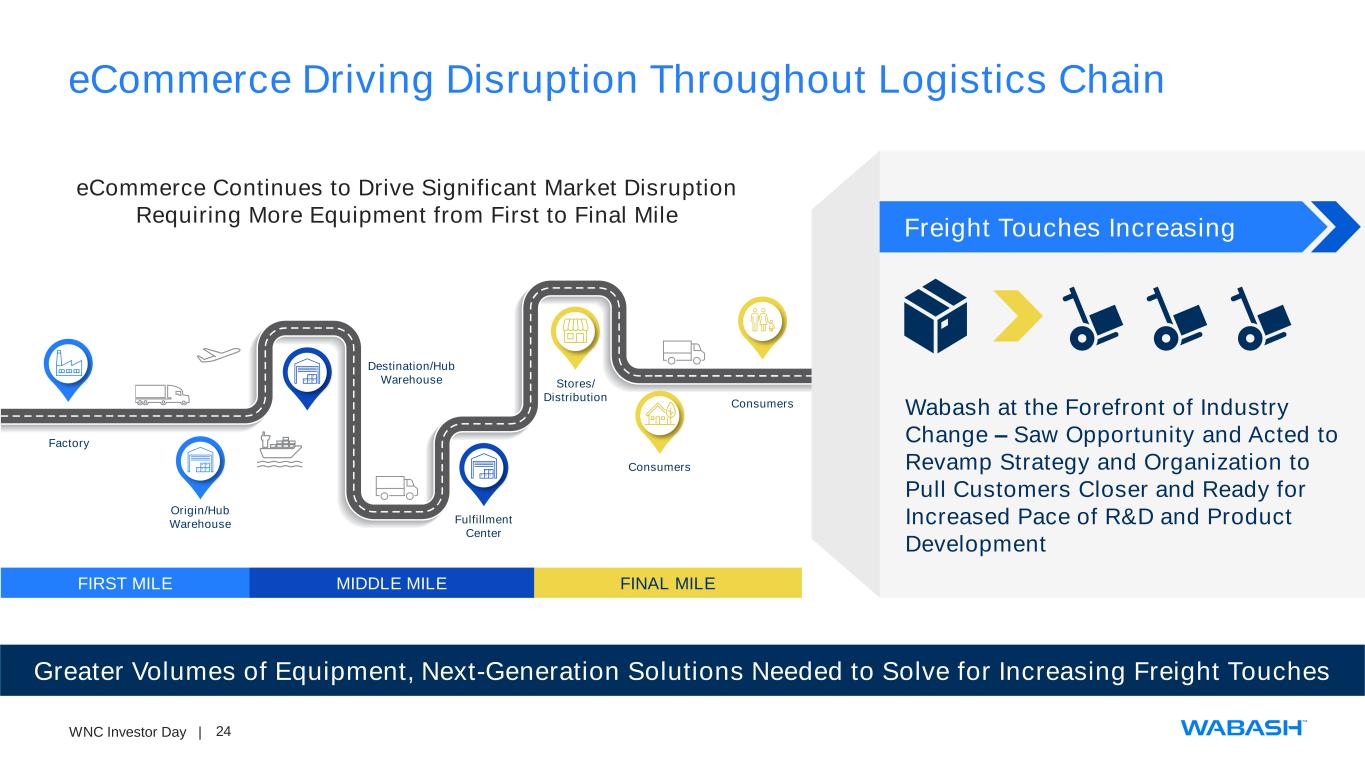
24WNC Investor Day | eCommerce Driving Disruption Throughout Logistics Chain Greater Volumes of Equipment, Next-Generation Solutions Needed to Solve for Increasing Freight Touches Origin/Hub Warehouse Factory Destination/Hub Warehouse Fulfillment Center Stores/ Distribution Consumers Consumers FIRST MILE FINAL MILEMIDDLE MILE eCommerce Continues to Drive Significant Market Disruption Requiring More Equipment from First to Final Mile Freight Touches Increasing Wabash at the Forefront of Industry Change – Saw Opportunity and Acted to Revamp Strategy and Organization to Pull Customers Closer and Ready for Increased Pace of R&D and Product Development
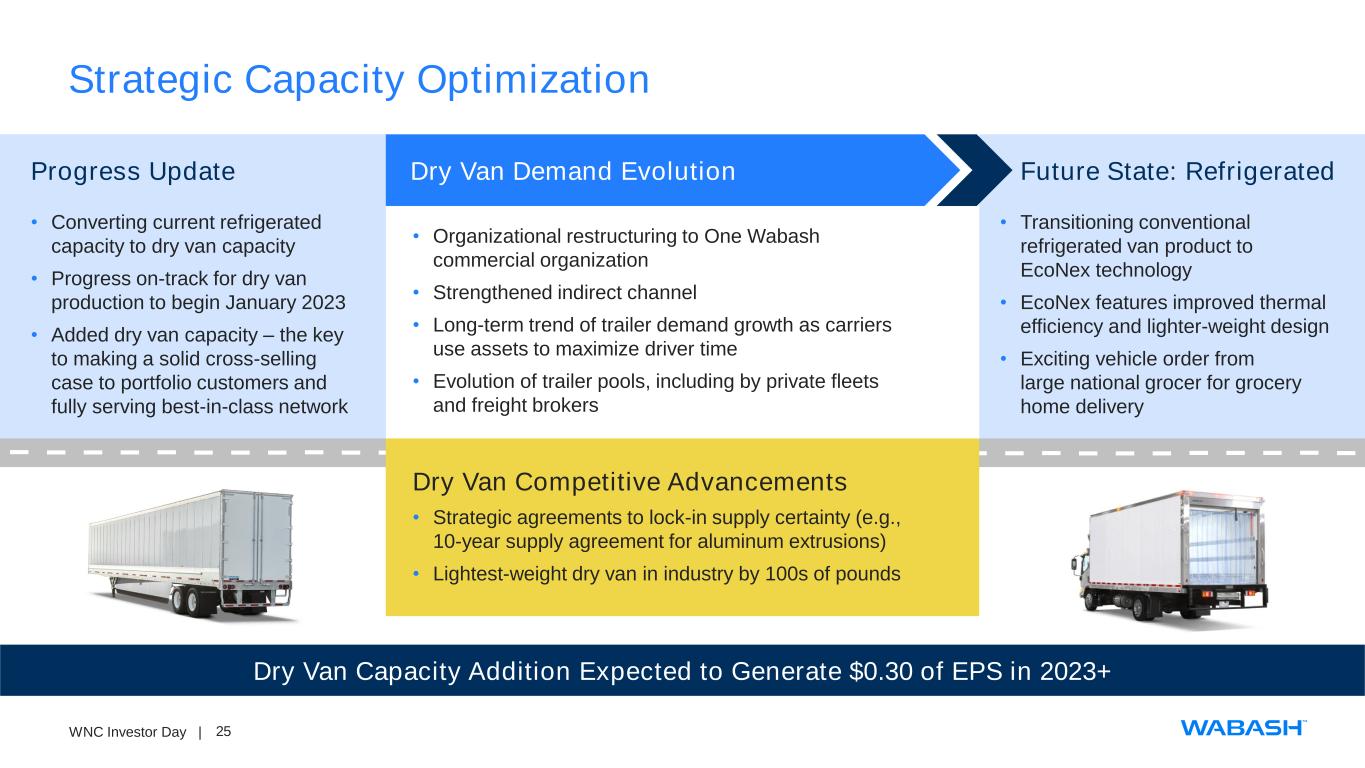
25WNC Investor Day | Strategic Capacity Optimization Dry Van Capacity Addition Expected to Generate $0.30 of EPS in 2023+ Progress Update • Converting current refrigerated capacity to dry van capacity • Progress on-track for dry van production to begin January 2023 • Added dry van capacity – the key to making a solid cross-selling case to portfolio customers and fully serving best-in-class network Dry Van Demand Evolution • Organizational restructuring to One Wabash commercial organization • Strengthened indirect channel • Long-term trend of trailer demand growth as carriers use assets to maximize driver time • Evolution of trailer pools, including by private fleets and freight brokers Future State: Refrigerated • Transitioning conventional refrigerated van product to EcoNex technology • EcoNex features improved thermal efficiency and lighter-weight design • Exciting vehicle order from large national grocer for grocery home delivery Dry Van Competitive Advancements • Strategic agreements to lock-in supply certainty (e.g., 10-year supply agreement for aluminum extrusions) • Lightest-weight dry van in industry by 100s of pounds

26WNC Investor Day | Capacity Progress Highlight Video
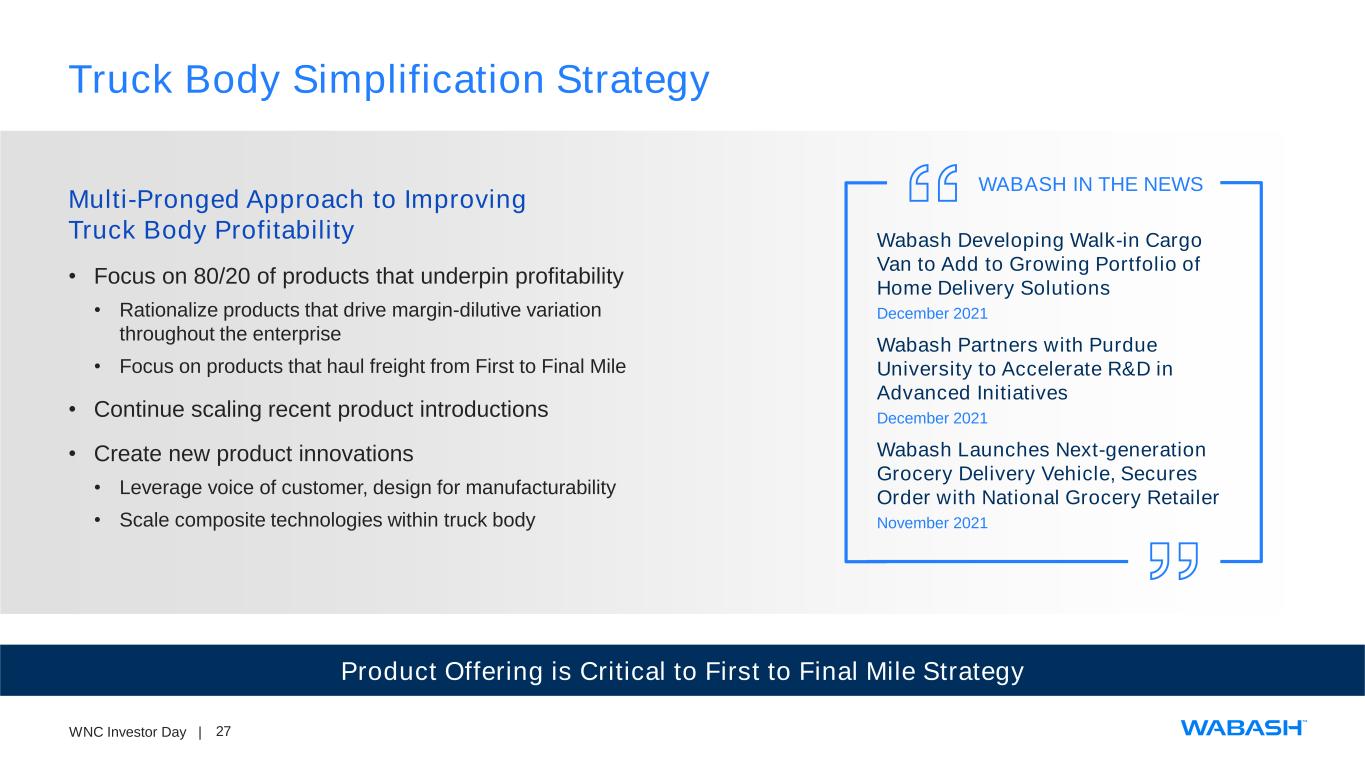
27WNC Investor Day | Truck Body Simplification Strategy Product Offering is Critical to First to Final Mile Strategy Multi-Pronged Approach to Improving Truck Body Profitability • Focus on 80/20 of products that underpin profitability • Rationalize products that drive margin-dilutive variation throughout the enterprise • Focus on products that haul freight from First to Final Mile • Continue scaling recent product introductions • Create new product innovations • Leverage voice of customer, design for manufacturability • Scale composite technologies within truck body Wabash Developing Walk-in Cargo Van to Add to Growing Portfolio of Home Delivery Solutions December 2021 Wabash Launches Next-generation Grocery Delivery Vehicle, Secures Order with National Grocery Retailer November 2021 Wabash Partners with Purdue University to Accelerate R&D in Advanced Initiatives December 2021 WABASH IN THE NEWS
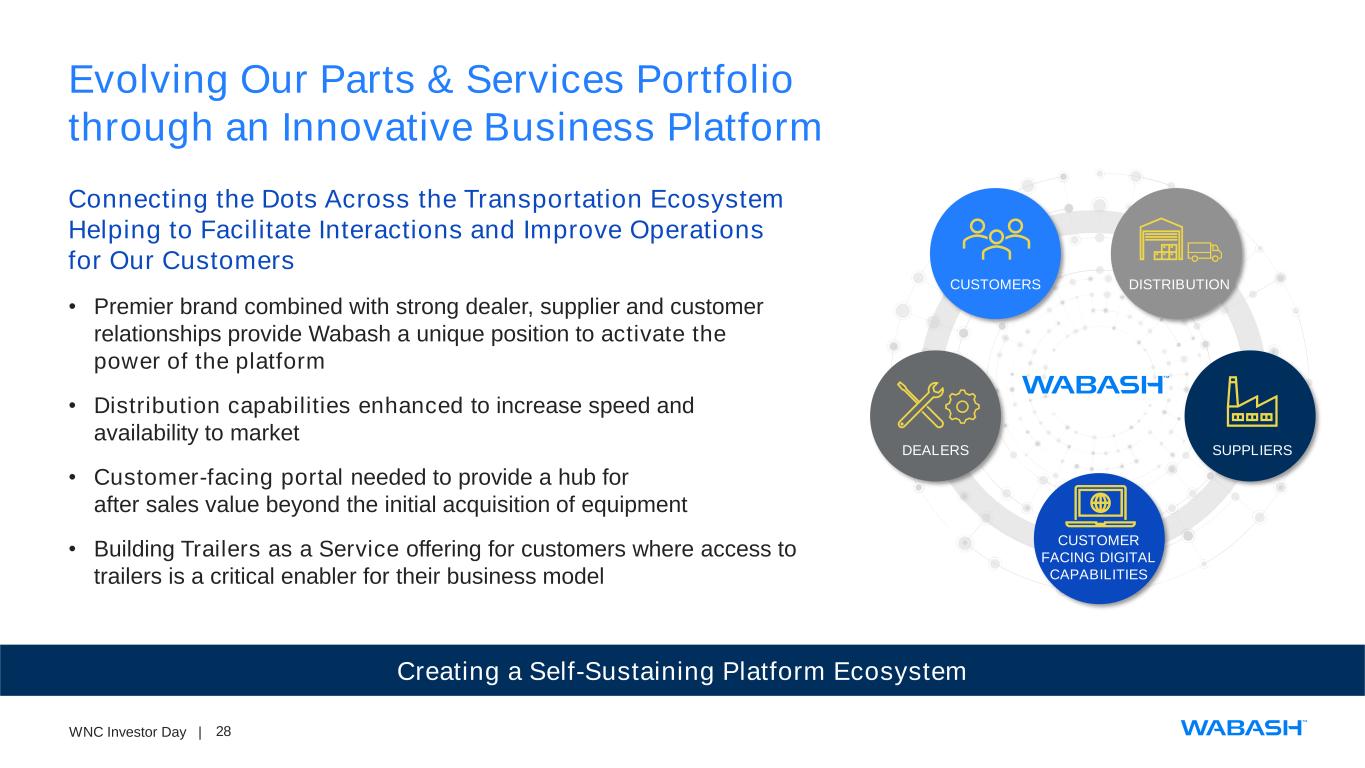
28WNC Investor Day | Evolving Our Parts & Services Portfolio through an Innovative Business Platform Creating a Self-Sustaining Platform Ecosystem DEALERS SUPPLIERS CUSTOMER FACING DIGITAL CAPABILITIES CUSTOMERS DISTRIBUTION Connecting the Dots Across the Transportation Ecosystem Helping to Facilitate Interactions and Improve Operations for Our Customers • Premier brand combined with strong dealer, supplier and customer relationships provide Wabash a unique position to activate the power of the platform • Distribution capabilities enhanced to increase speed and availability to market • Customer-facing portal needed to provide a hub for after sales value beyond the initial acquisition of equipment • Building Trailers as a Service offering for customers where access to trailers is a critical enabler for their business model
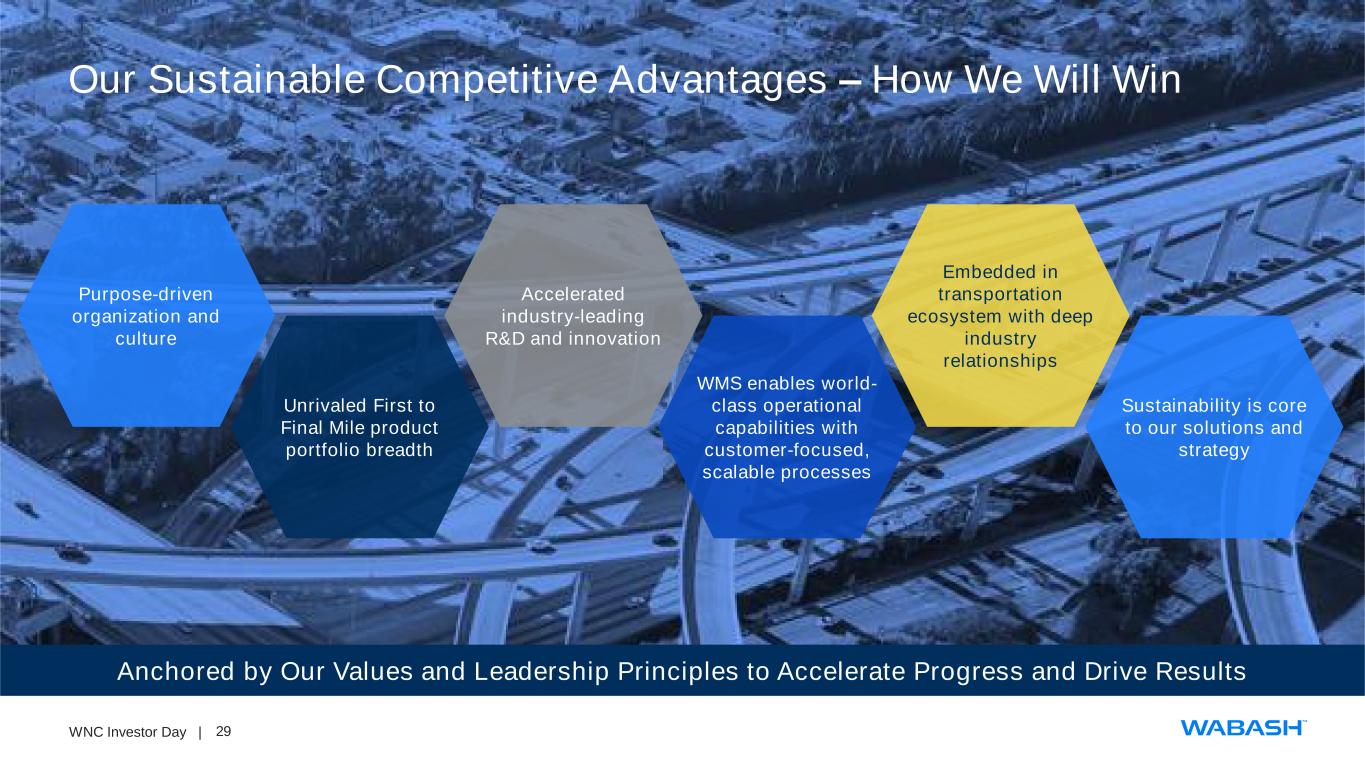
29WNC Investor Day | Our Sustainable Competitive Advantages – How We Will Win Anchored by Our Values and Leadership Principles to Accelerate Progress and Drive Results Purpose-driven organization and culture Unrivaled First to Final Mile product portfolio breadth Accelerated industry-leading R&D and innovation WMS enables world- class operational capabilities with customer-focused, scalable processes Embedded in transportation ecosystem with deep industry relationships Sustainability is core to our solutions and strategy
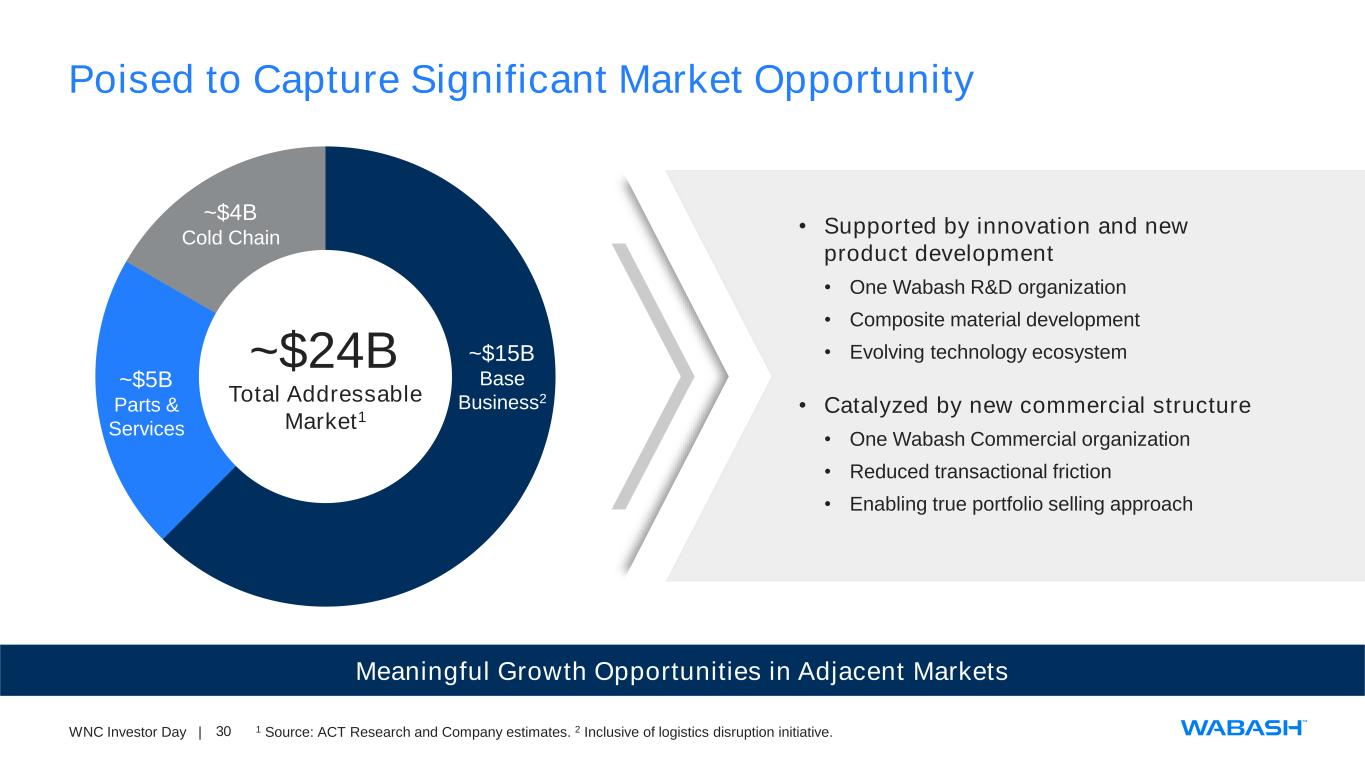
30WNC Investor Day | Poised to Capture Significant Market Opportunity Meaningful Growth Opportunities in Adjacent Markets 1 Source: ACT Research and Company estimates. 2 Inclusive of logistics disruption initiative. ~$15B Base Business2 ~$5B Parts & Services ~$4B Cold Chain ~$24B Total Addressable Market1 • Supported by innovation and new product development • One Wabash R&D organization • Composite material development • Evolving technology ecosystem • Catalyzed by new commercial structure • One Wabash Commercial organization • Reduced transactional friction • Enabling true portfolio selling approach
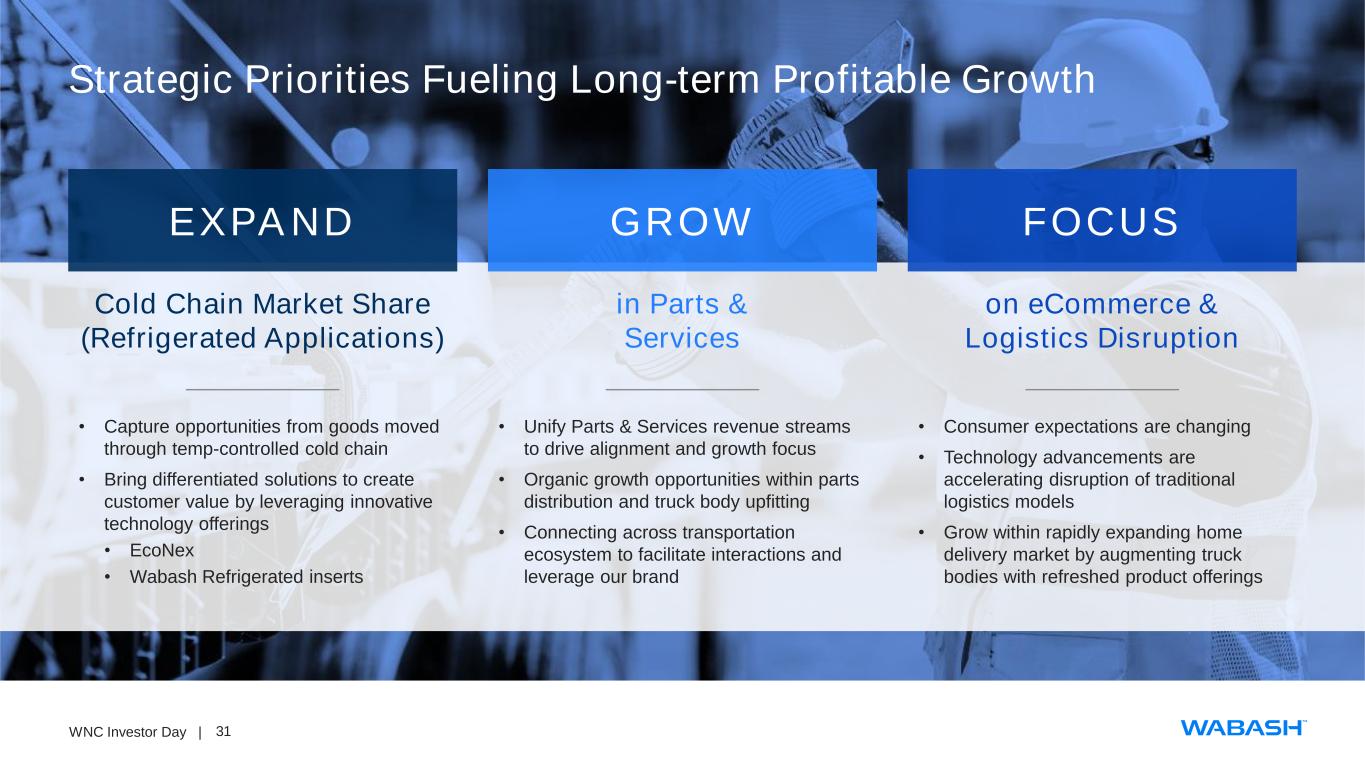
31WNC Investor Day | Strategic Priorities Fueling Long-term Profitable Growth EXPAND GROW FOCUS Cold Chain Market Share (Refrigerated Applications) in Parts & Services on eCommerce & Logistics Disruption • Capture opportunities from goods moved through temp-controlled cold chain • Bring differentiated solutions to create customer value by leveraging innovative technology offerings • EcoNex • Wabash Refrigerated inserts • Unify Parts & Services revenue streams to drive alignment and growth focus • Organic growth opportunities within parts distribution and truck body upfitting • Connecting across transportation ecosystem to facilitate interactions and leverage our brand • Consumer expectations are changing • Technology advancements are accelerating disruption of traditional logistics models • Grow within rapidly expanding home delivery market by augmenting truck bodies with refreshed product offerings
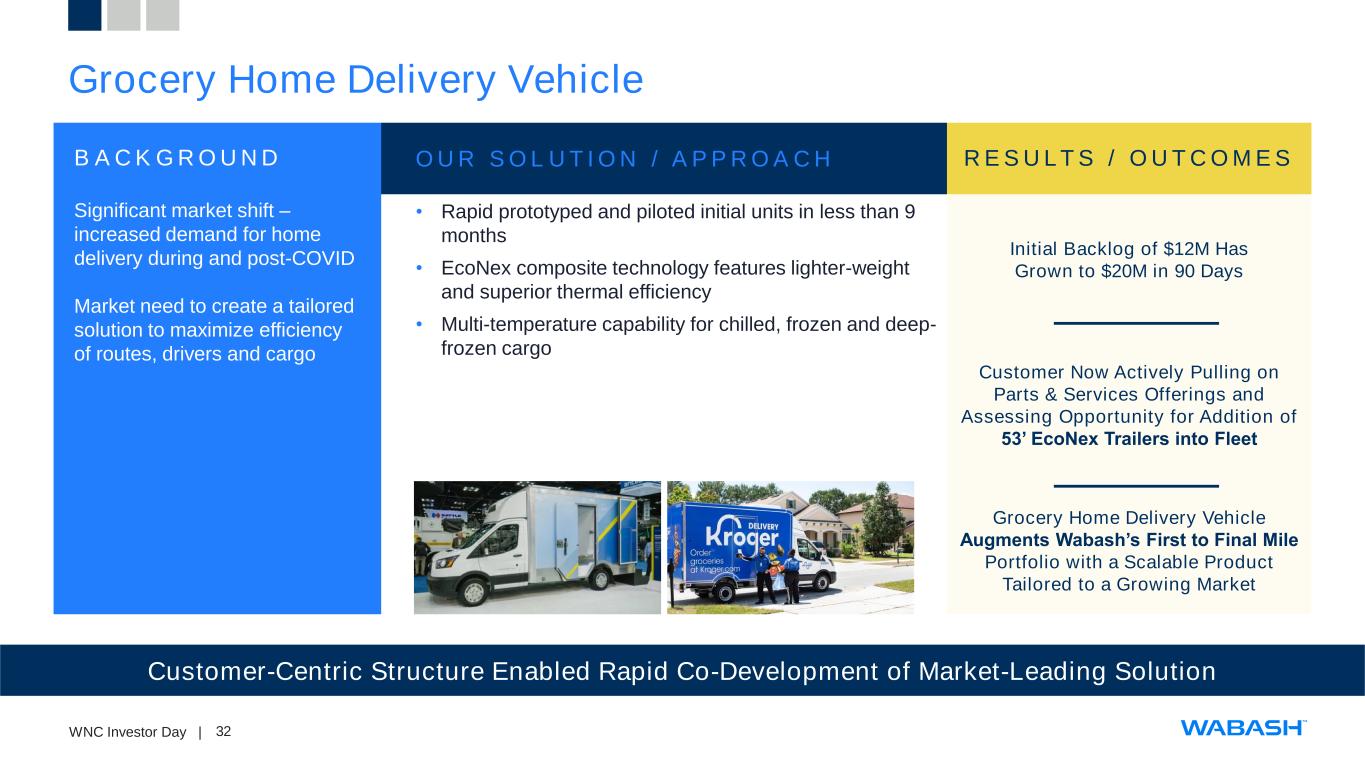
32WNC Investor Day | Grocery Home Delivery Vehicle Customer-Centric Structure Enabled Rapid Co-Development of Market-Leading Solution B A C K G R O U N D Significant market shift – increased demand for home delivery during and post-COVID Market need to create a tailored solution to maximize efficiency of routes, drivers and cargo O U R S O L U T I O N / A P P R O A C H • Rapid prototyped and piloted initial units in less than 9 months • EcoNex composite technology features lighter-weight and superior thermal efficiency • Multi-temperature capability for chilled, frozen and deep- frozen cargo Initial Backlog of $12M Has Grown to $20M in 90 Days R E S U LT S / O U T C O M E S Customer Now Actively Pulling on Parts & Services Offerings and Assessing Opportunity for Addition of 53’ EcoNex Trailers into Fleet Grocery Home Delivery Vehicle Augments Wabash’s First to Final Mile Portfolio with a Scalable Product Tailored to a Growing Market
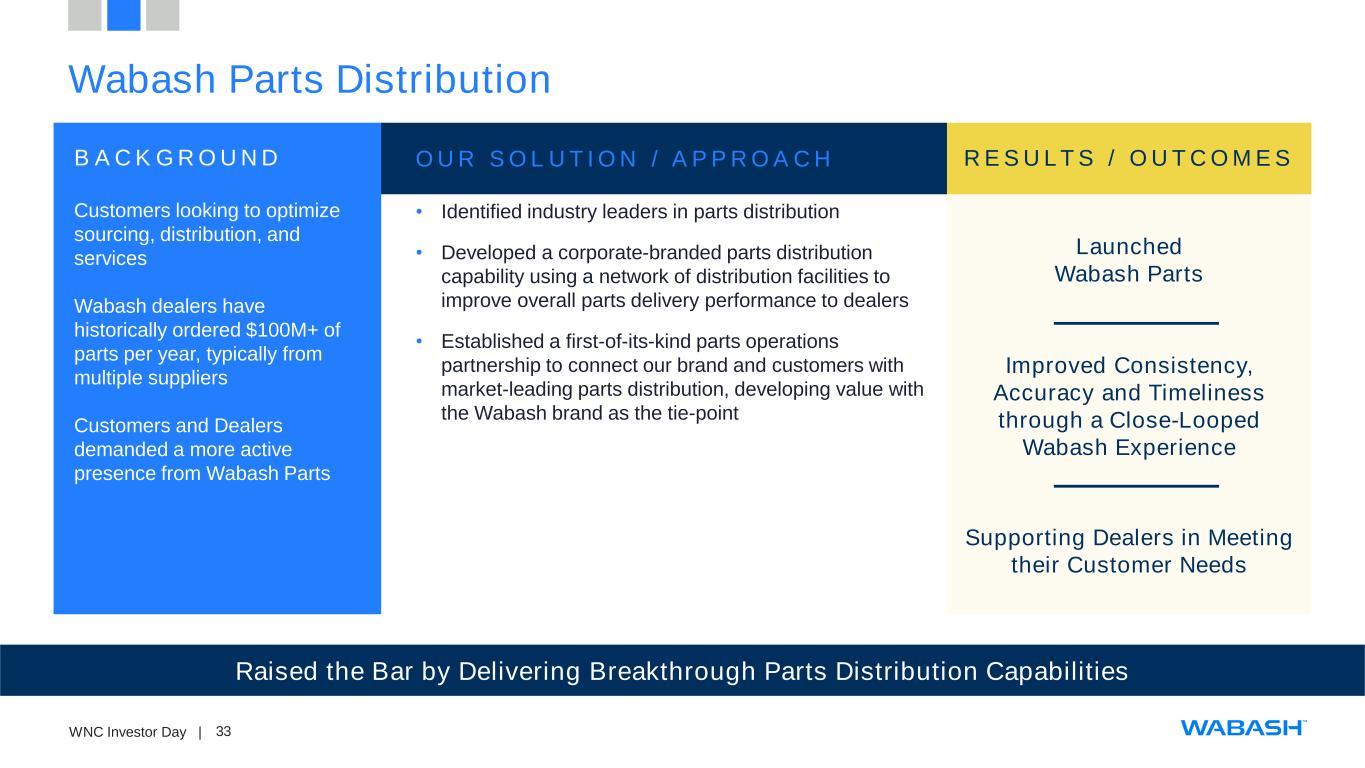
33WNC Investor Day | Wabash Parts Distribution Raised the Bar by Delivering Breakthrough Parts Distribution Capabilities B A C K G R O U N D Customers looking to optimize sourcing, distribution, and services Wabash dealers have historically ordered $100M+ of parts per year, typically from multiple suppliers Customers and Dealers demanded a more active presence from Wabash Parts O U R S O L U T I O N / A P P R O A C H • Identified industry leaders in parts distribution • Developed a corporate-branded parts distribution capability using a network of distribution facilities to improve overall parts delivery performance to dealers • Established a first-of-its-kind parts operations partnership to connect our brand and customers with market-leading parts distribution, developing value with the Wabash brand as the tie-point Launched Wabash Parts R E S U LT S / O U T C O M E S Improved Consistency, Accuracy and Timeliness through a Close-Looped Wabash Experience Supporting Dealers in Meeting their Customer Needs
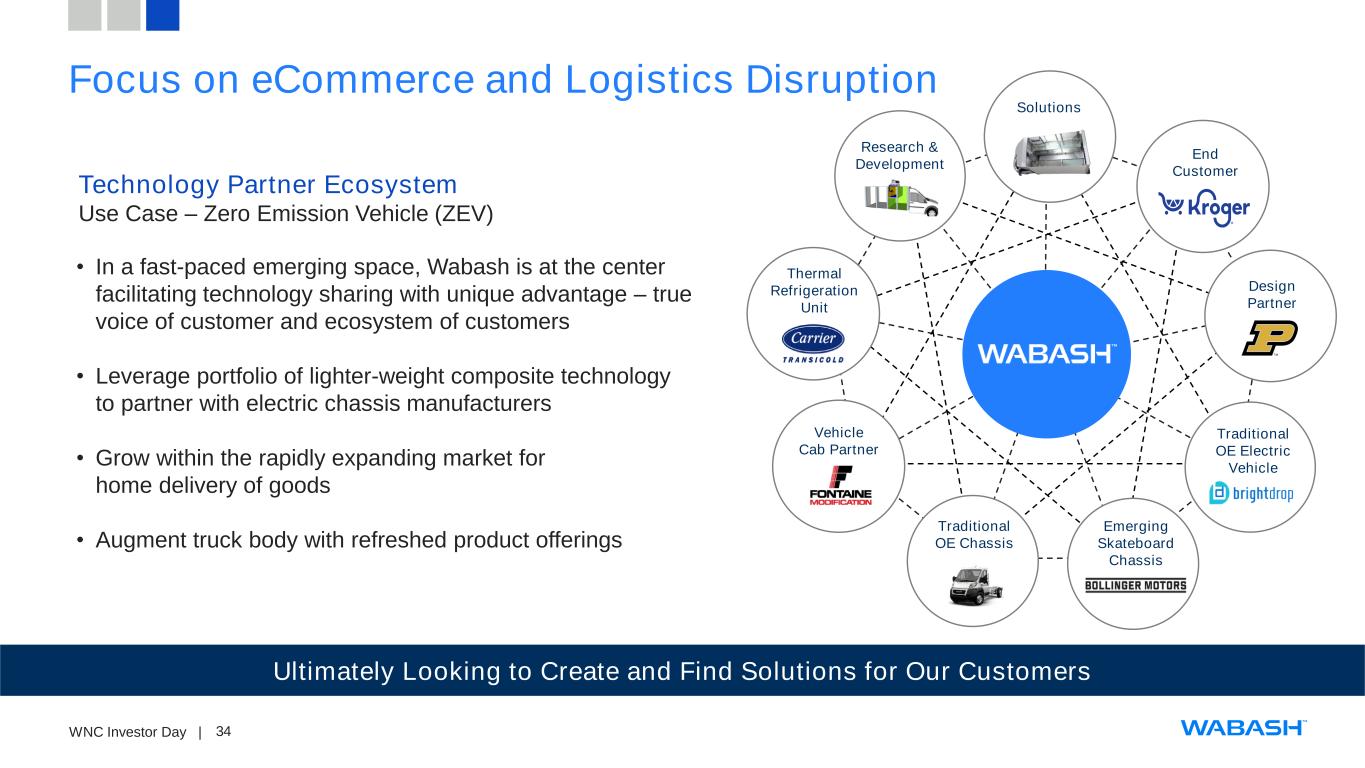
34WNC Investor Day | Focus on eCommerce and Logistics Disruption Ultimately Looking to Create and Find Solutions for Our Customers Technology Partner Ecosystem Use Case – Zero Emission Vehicle (ZEV) • In a fast-paced emerging space, Wabash is at the center facilitating technology sharing with unique advantage – true voice of customer and ecosystem of customers • Leverage portfolio of lighter-weight composite technology to partner with electric chassis manufacturers • Grow within the rapidly expanding market for home delivery of goods • Augment truck body with refreshed product offerings End Customer Design Partner Traditional OE Electric Vehicle Traditional OE Chassis Emerging Skateboard Chassis Vehicle Cab Partner Thermal Refrigeration Unit Research & Development Solutions
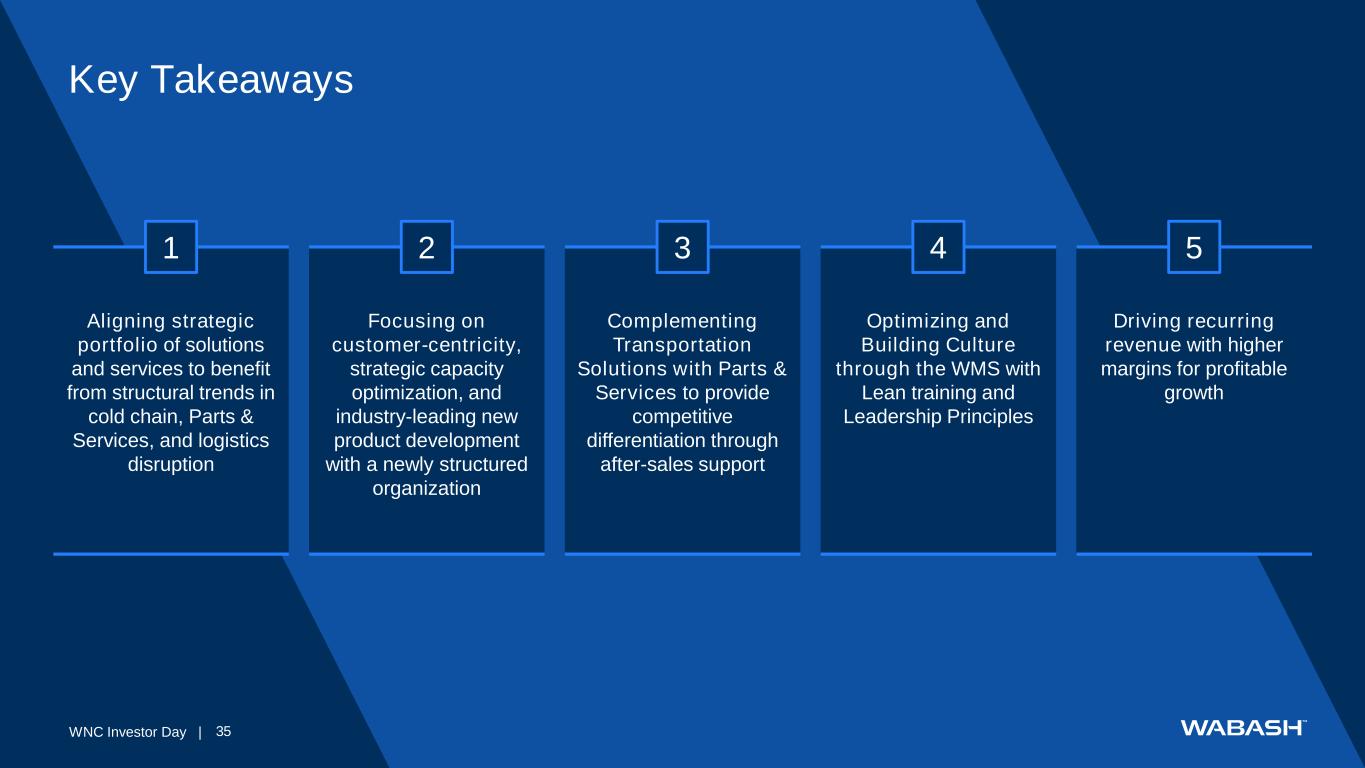
35WNC Investor Day | Key Takeaways Aligning strategic portfolio of solutions and services to benefit from structural trends in cold chain, Parts & Services, and logistics disruption 1 Focusing on customer-centricity, strategic capacity optimization, and industry-leading new product development with a newly structured organization 2 Complementing Transportation Solutions with Parts & Services to provide competitive differentiation through after-sales support 3 Optimizing and Building Culture through the WMS with Lean training and Leadership Principles 4 Driving recurring revenue with higher margins for profitable growth 5
36WNC Investor Day | CLEAR FINANCIAL OBJECTIVES & CAPITAL ALLOCATION FRAMEWORK MIKE PETTIT SVP & CFO
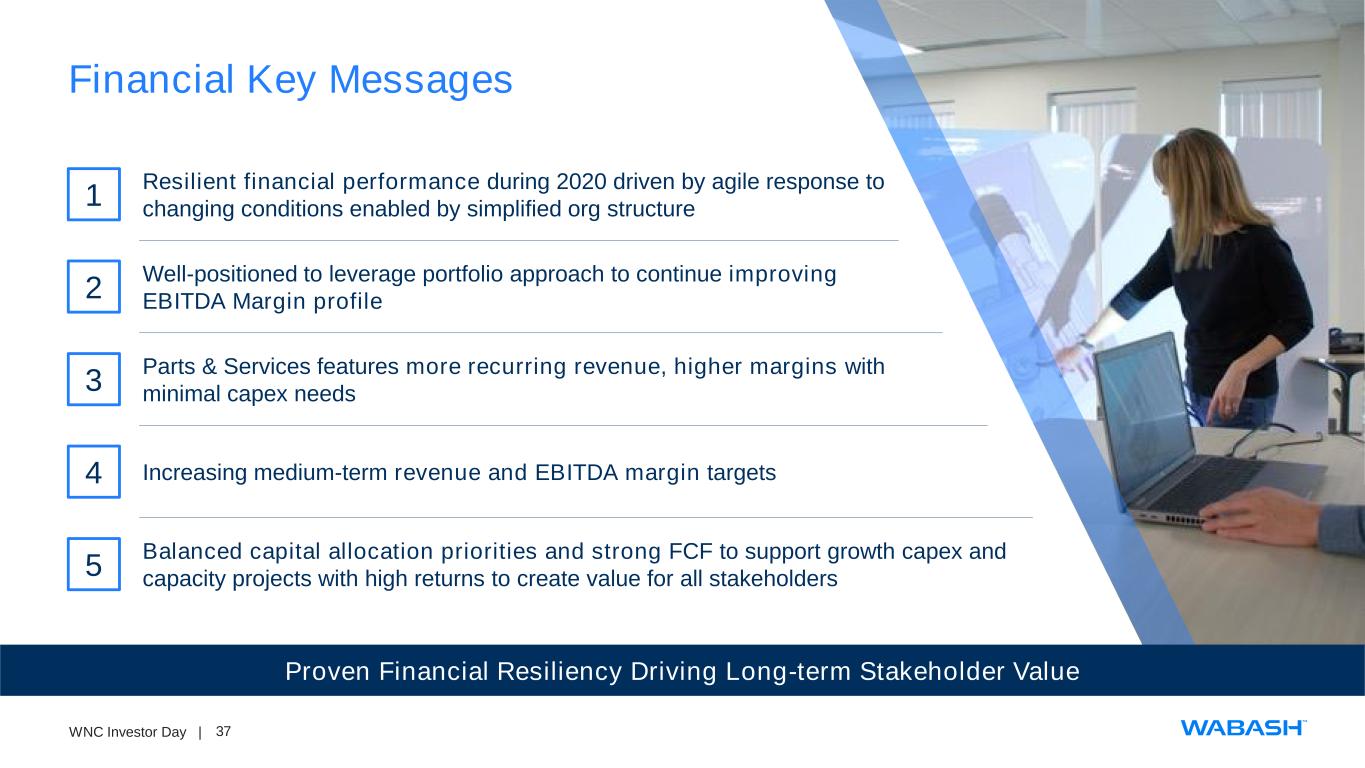
37WNC Investor Day | Financial Key Messages Proven Financial Resiliency Driving Long-term Stakeholder Value 1 2 3 4 5 Resilient financial performance during 2020 driven by agile response to changing conditions enabled by simplified org structure Well-positioned to leverage portfolio approach to continue improving EBITDA Margin profile Parts & Services features more recurring revenue, higher margins with minimal capex needs Increasing medium-term revenue and EBITDA margin targets Balanced capital allocation priorities and strong FCF to support growth capex and capacity projects with high returns to create value for all stakeholders
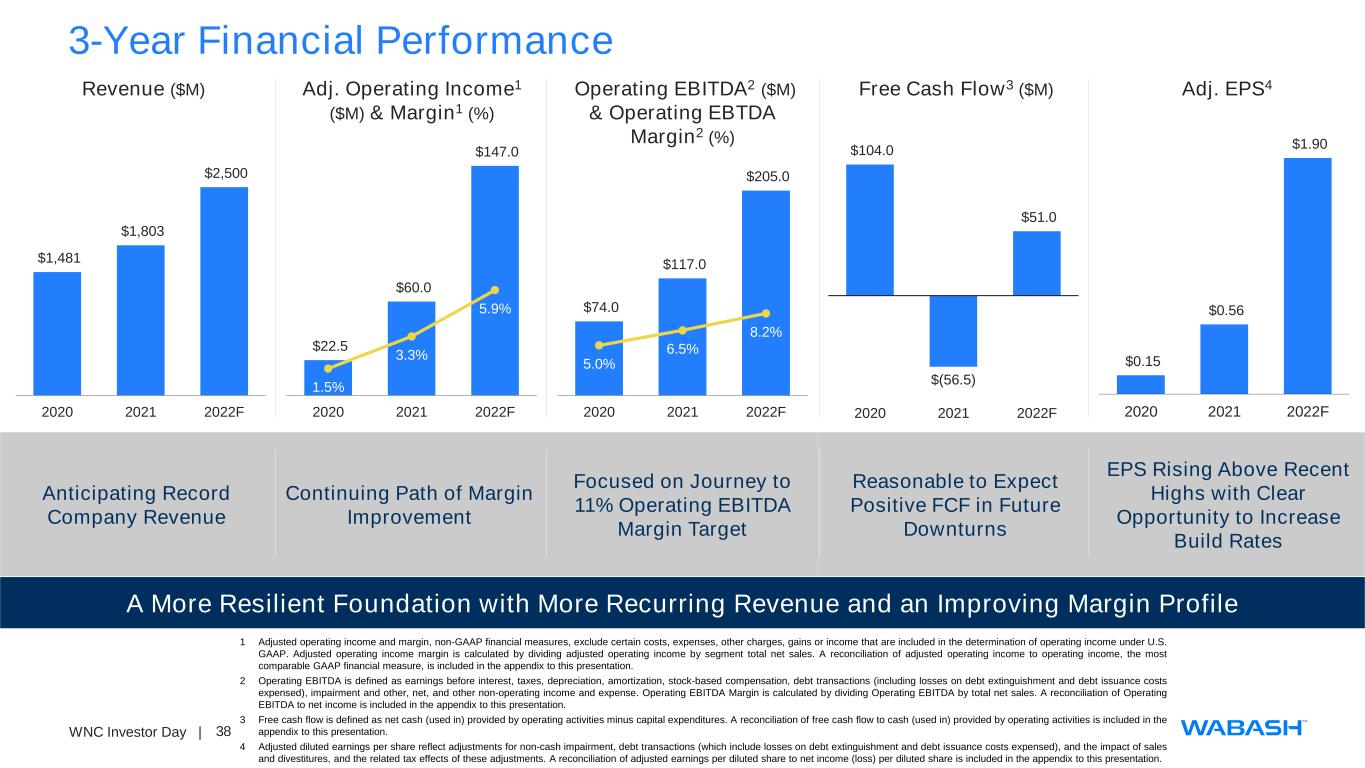
38WNC Investor Day | 3-Year Financial Performance A More Resilient Foundation with More Recurring Revenue and an Improving Margin Profile $1,481 $1,803 $2,500 2020 2021 2022F Revenue ($M) $22.5 $60.0 $147.0 1.5% 3.3% 5.9% 0.0% 2.0% 4.0% 6.0% 8.0% 10.0% 12.0% 14.0% $- $20.0 $40.0 $60.0 $80.0 $100.0 $120.0 $140.0 $160.0 2020 2021 2022F Adj. Operating Income1 ($M) & Margin1 (%) Operating EBITDA2 ($M) & Operating EBTDA Margin2 (%) Free Cash Flow3 ($M) $0.15 $0.56 $1.90 2020 2021 2022F Adj. EPS4 $74.0 $117.0 $205.0 5.0% 6.5% 8.2% 0.0% 5.0% 10.0% 15.0% 20.0% 25.0% $- $50.0 $100.0 $150.0 $200.0 $250.0 2020 2021 2022F $104.0 $(56.5) $51.0 $(80.0) $(60.0) $(40.0) $(20.0) $- $20.0 $40.0 $60.0 $80.0 $100.0 $120.0 2020 2021 2022F Anticipating Record Company Revenue Continuing Path of Margin Improvement Focused on Journey to 11% Operating EBITDA Margin Target Reasonable to Expect Positive FCF in Future Downturns EPS Rising Above Recent Highs with Clear Opportunity to Increase Build Rates 1 Adjusted operating income and margin, non-GAAP financial measures, exclude certain costs, expenses, other charges, gains or income that are included in the determination of operating income under U.S. GAAP. Adjusted operating income margin is calculated by dividing adjusted operating income by segment total net sales. A reconciliation of adjusted operating income to operating income, the most comparable GAAP financial measure, is included in the appendix to this presentation. 2 Operating EBITDA is defined as earnings before interest, taxes, depreciation, amortization, stock-based compensation, debt transactions (including losses on debt extinguishment and debt issuance costs expensed), impairment and other, net, and other non-operating income and expense. Operating EBITDA Margin is calculated by dividing Operating EBITDA by total net sales. A reconciliation of Operating EBITDA to net income is included in the appendix to this presentation. 3 Free cash flow is defined as net cash (used in) provided by operating activities minus capital expenditures. A reconciliation of free cash flow to cash (used in) provided by operating activities is included in the appendix to this presentation. 4 Adjusted diluted earnings per share reflect adjustments for non-cash impairment, debt transactions (which include losses on debt extinguishment and debt issuance costs expensed), and the impact of sales and divestitures, and the related tax effects of these adjustments. A reconciliation of adjusted earnings per diluted share to net income (loss) per diluted share is included in the appendix to this presentation.
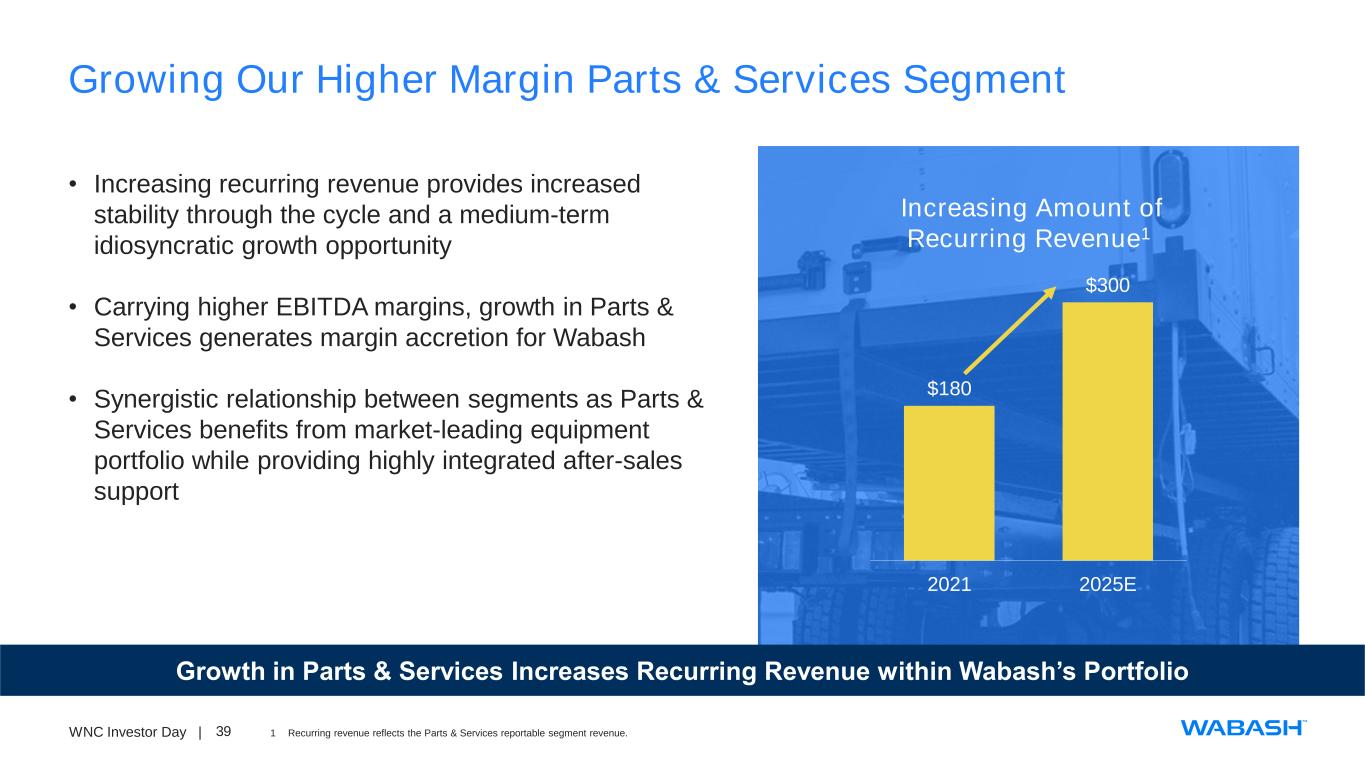
39WNC Investor Day | Growing Our Higher Margin Parts & Services Segment Growth in Parts & Services Increases Recurring Revenue within Wabash’s Portfolio $180 $300 2021 2025E Increasing Amount of Recurring Revenue1 • Increasing recurring revenue provides increased stability through the cycle and a medium-term idiosyncratic growth opportunity • Carrying higher EBITDA margins, growth in Parts & Services generates margin accretion for Wabash • Synergistic relationship between segments as Parts & Services benefits from market-leading equipment portfolio while providing highly integrated after-sales support 1 Recurring revenue reflects the Parts & Services reportable segment revenue.
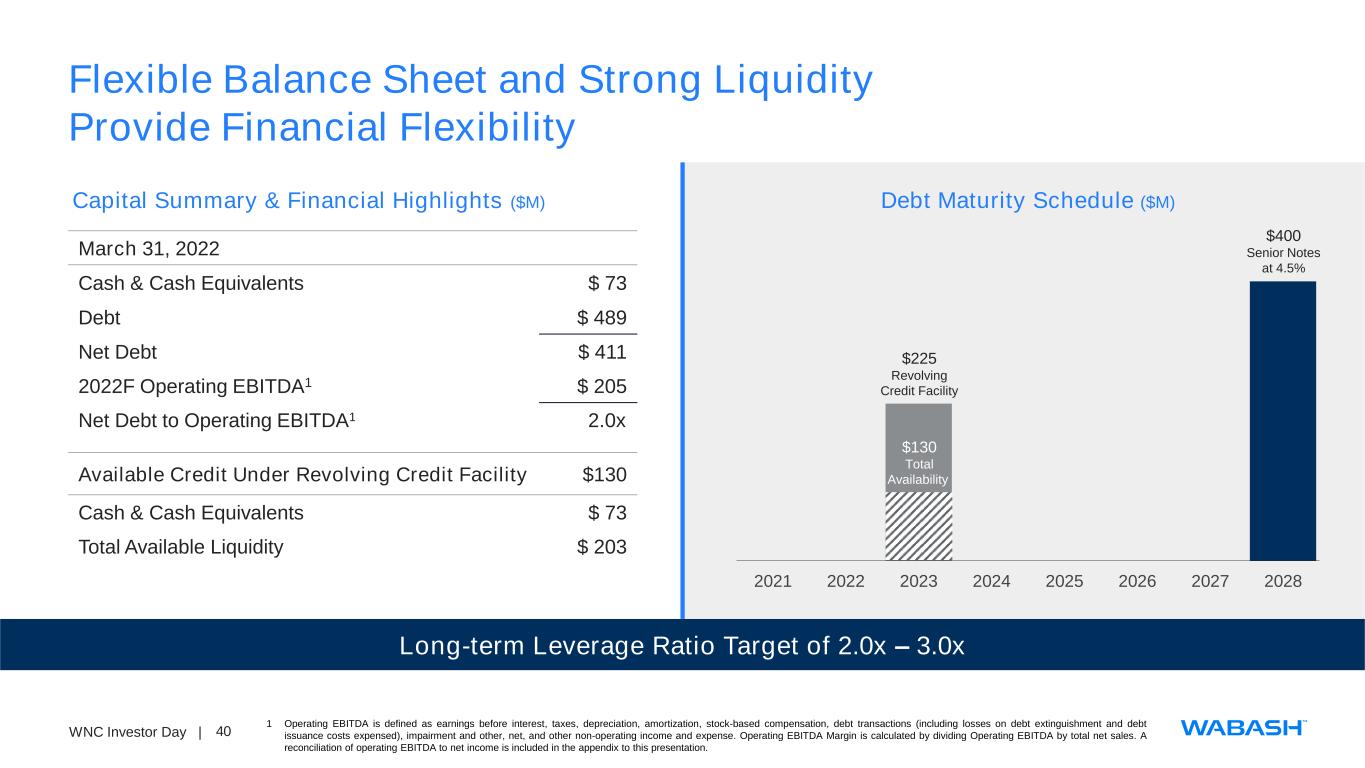
40WNC Investor Day | Flexible Balance Sheet and Strong Liquidity Provide Financial Flexibility Long-term Leverage Ratio Target of 2.0x – 3.0x March 31, 2022 Cash & Cash Equivalents $ 73 Debt $ 489 Net Debt $ 411 2022F Operating EBITDA1 $ 205 Net Debt to Operating EBITDA1 2.0x Available Credit Under Revolving Credit Facility $130 Cash & Cash Equivalents $ 73 Total Available Liquidity $ 203 Capital Summary & Financial Highlights ($M) 2021 2022 2023 2024 2025 2026 2027 2028 $225 Revolving Credit Facility Debt Maturity Schedule ($M) $400 Senior Notes at 4.5% $130 Total Availability 1 Operating EBITDA is defined as earnings before interest, taxes, depreciation, amortization, stock-based compensation, debt transactions (including losses on debt extinguishment and debt issuance costs expensed), impairment and other, net, and other non-operating income and expense. Operating EBITDA Margin is calculated by dividing Operating EBITDA by total net sales. A reconciliation of operating EBITDA to net income is included in the appendix to this presentation.
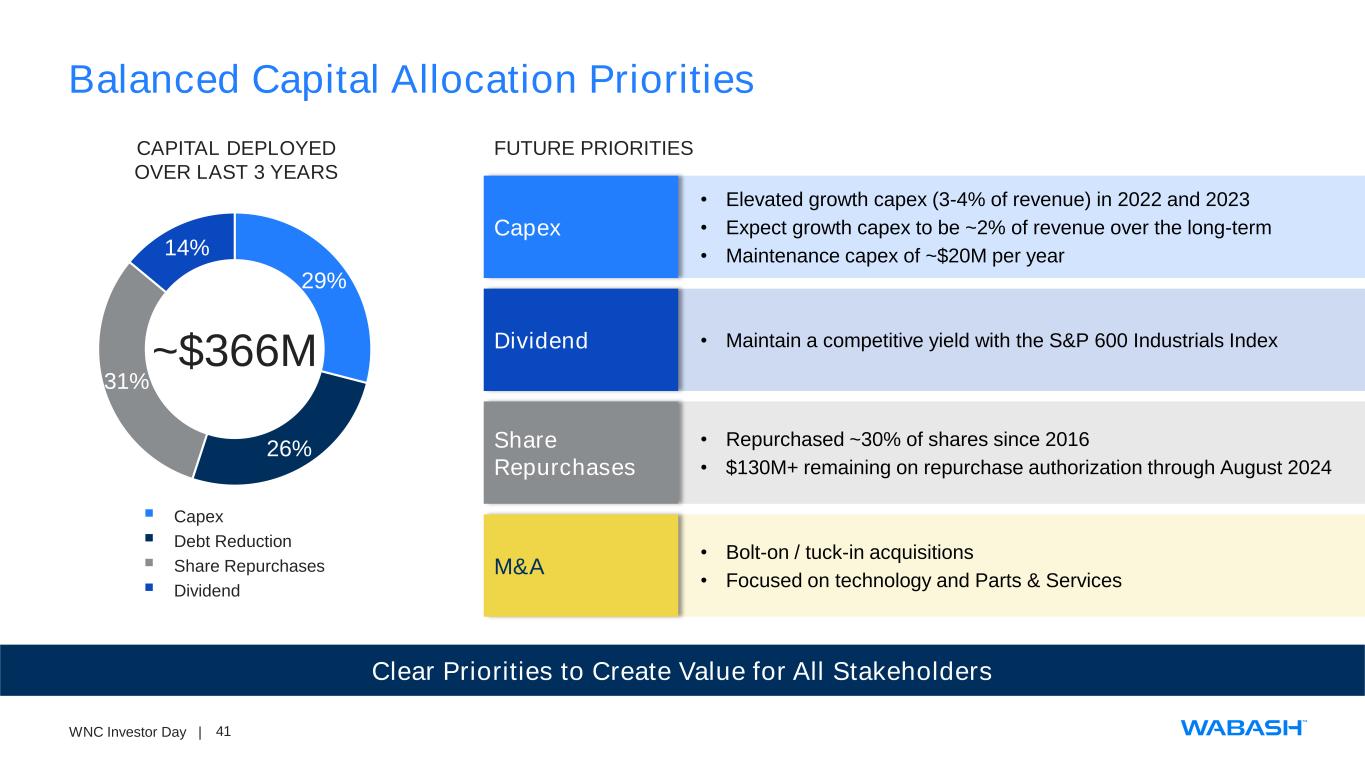
41WNC Investor Day | Balanced Capital Allocation Priorities Clear Priorities to Create Value for All Stakeholders CAPITAL DEPLOYED OVER LAST 3 YEARS ▪ Capex ▪ Debt Reduction ▪ Share Repurchases ▪ Dividend ~$366M • Elevated growth capex (3-4% of revenue) in 2022 and 2023 • Expect growth capex to be ~2% of revenue over the long-term • Maintenance capex of ~$20M per year Capex • Repurchased ~30% of shares since 2016 • $130M+ remaining on repurchase authorization through August 2024 Share Repurchases • Bolt-on / tuck-in acquisitions • Focused on technology and Parts & Services M&A 29% 26% 31% 14% FUTURE PRIORITIES • Maintain a competitive yield with the S&P 600 Industrials IndexDividend
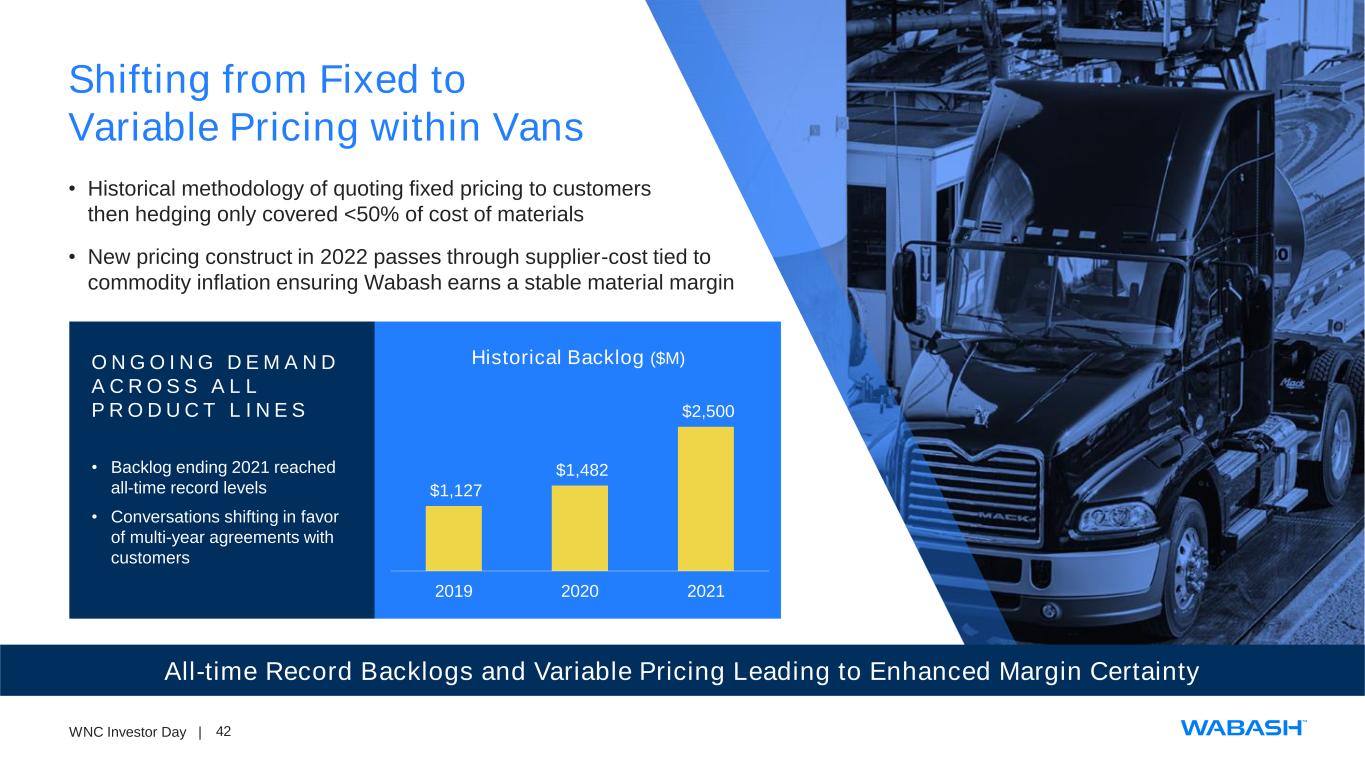
42WNC Investor Day | Shifting from Fixed to Variable Pricing within Vans All-time Record Backlogs and Variable Pricing Leading to Enhanced Margin Certainty O N G O I N G D E M A N D A C R O S S A L L P R O D U C T L I N E S • Backlog ending 2021 reached all-time record levels • Conversations shifting in favor of multi-year agreements with customers $1,127 $1,482 $2,500 2019 2020 2021 Historical Backlog ($M) • Historical methodology of quoting fixed pricing to customers then hedging only covered <50% of cost of materials • New pricing construct in 2022 passes through supplier-cost tied to commodity inflation ensuring Wabash earns a stable material margin
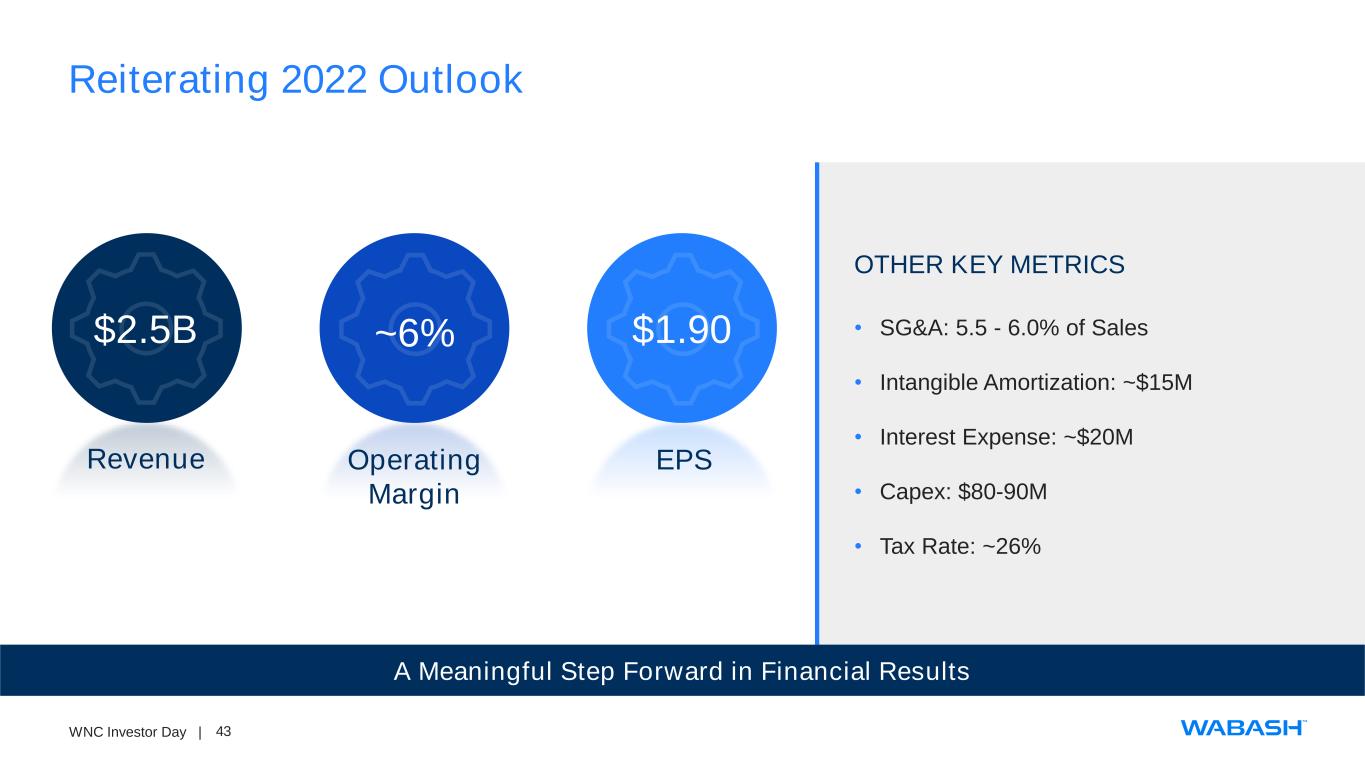
43WNC Investor Day | Reiterating 2022 Outlook A Meaningful Step Forward in Financial Results $2.5B ~6% $1.90 Revenue Operating Margin EPS OTHER KEY METRICS • SG&A: 5.5 - 6.0% of Sales • Intangible Amortization: ~$15M • Interest Expense: ~$20M • Capex: $80-90M • Tax Rate: ~26%
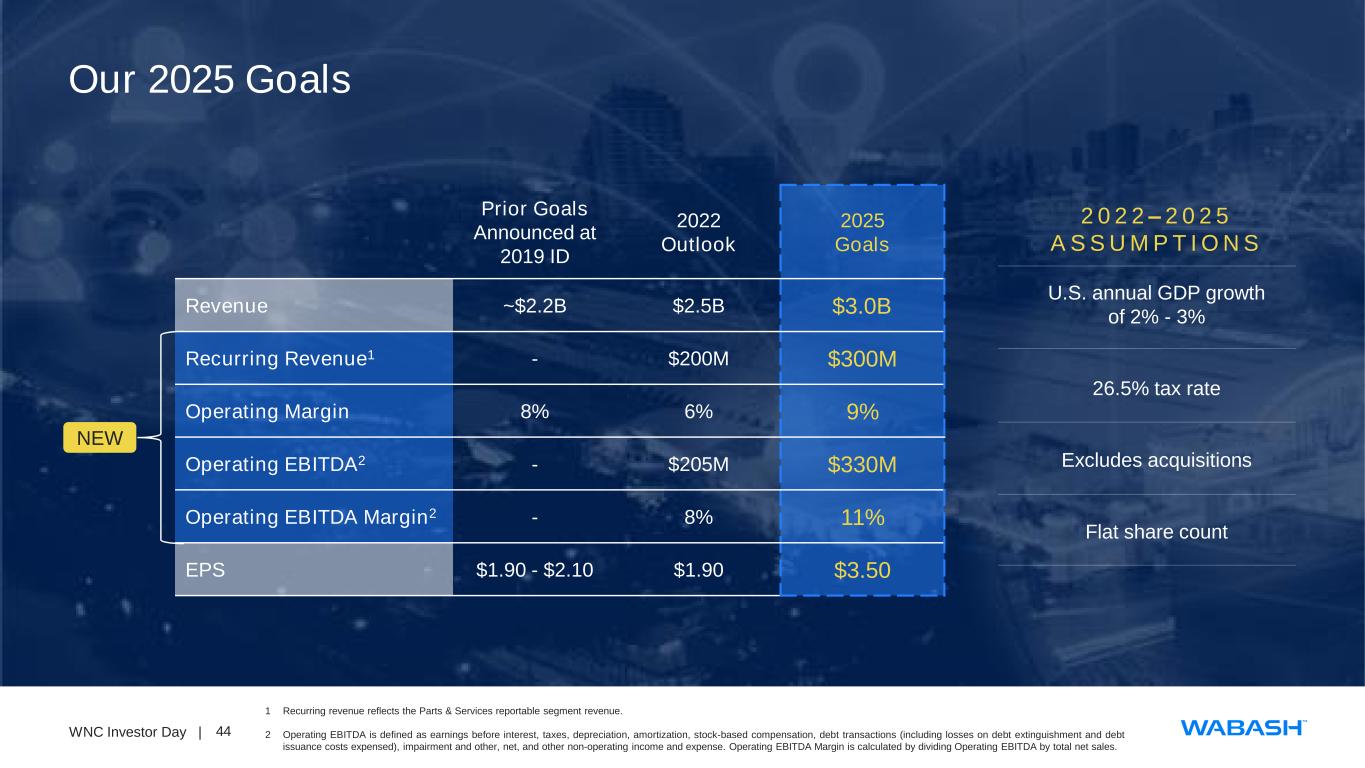
44WNC Investor Day | Our 2025 Goals Prior Goals Announced at 2019 ID 2022 Outlook 2025 Goals Revenue ~$2.2B $2.5B $3.0B Recurring Revenue1 - $200M $300M Operating Margin 8% 6% 9% Operating EBITDA2 - $205M $330M Operating EBITDA Margin2 - 8% 11% EPS $1.90 - $2.10 $1.90 $3.50 NEW U.S. annual GDP growth of 2% - 3% 26.5% tax rate Excludes acquisitions Flat share count 2 0 2 2 – 2 0 2 5 A S S U M P T I O N S 1 Recurring revenue reflects the Parts & Services reportable segment revenue. 2 Operating EBITDA is defined as earnings before interest, taxes, depreciation, amortization, stock-based compensation, debt transactions (including losses on debt extinguishment and debt issuance costs expensed), impairment and other, net, and other non-operating income and expense. Operating EBITDA Margin is calculated by dividing Operating EBITDA by total net sales.
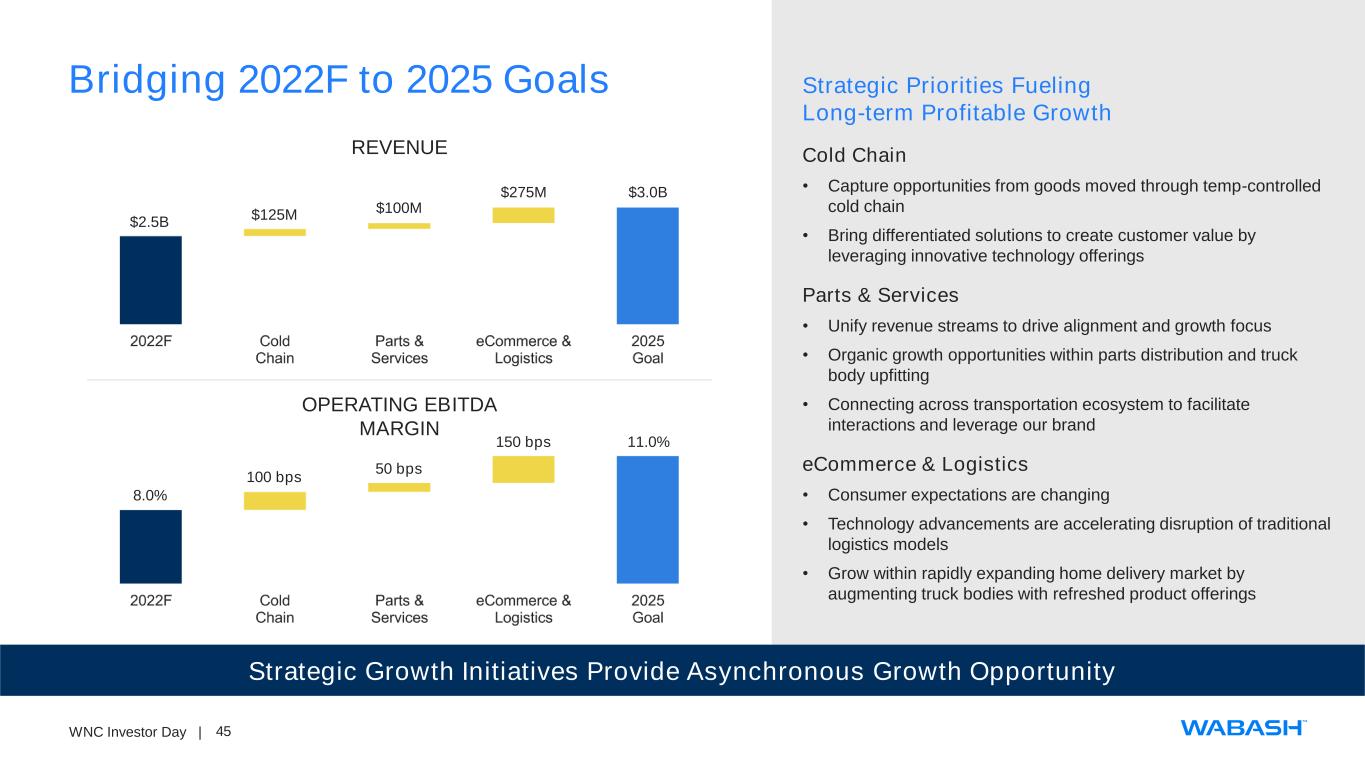
45WNC Investor Day | Bridging 2022F to 2025 Goals Strategic Growth Initiatives Provide Asynchronous Growth Opportunity $2.5B $3.0B$275M $100M$125M 8.0% 11.0%150 bps 50 bps 100 bps OPERATING EBITDA MARGIN REVENUE Strategic Priorities Fueling Long-term Profitable Growth Cold Chain • Capture opportunities from goods moved through temp-controlled cold chain • Bring differentiated solutions to create customer value by leveraging innovative technology offerings Parts & Services • Unify revenue streams to drive alignment and growth focus • Organic growth opportunities within parts distribution and truck body upfitting • Connecting across transportation ecosystem to facilitate interactions and leverage our brand eCommerce & Logistics • Consumer expectations are changing • Technology advancements are accelerating disruption of traditional logistics models • Grow within rapidly expanding home delivery market by augmenting truck bodies with refreshed product offerings
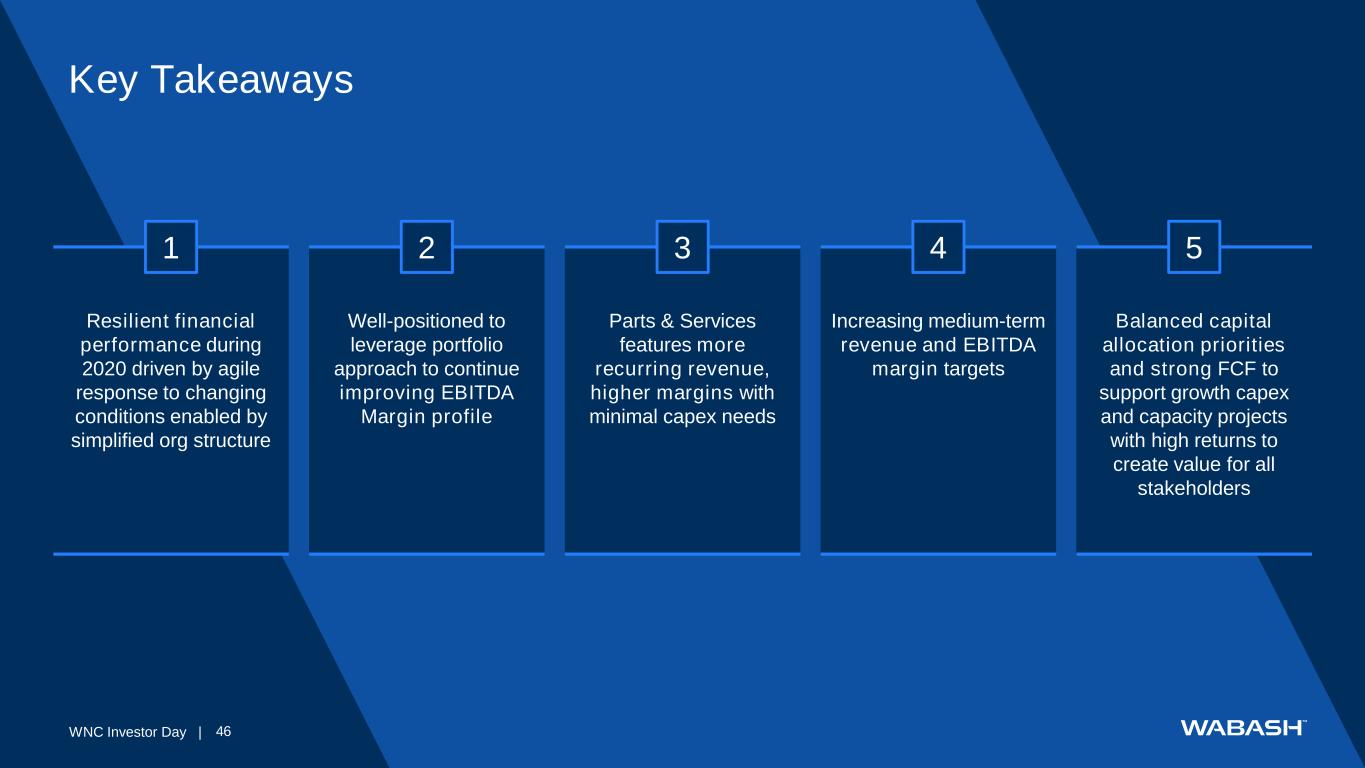
46WNC Investor Day | Key Takeaways Resilient financial performance during 2020 driven by agile response to changing conditions enabled by simplified org structure 1 Well-positioned to leverage portfolio approach to continue improving EBITDA Margin profile 2 Parts & Services features more recurring revenue, higher margins with minimal capex needs 3 Increasing medium-term revenue and EBITDA margin targets 4 Balanced capital allocation priorities and strong FCF to support growth capex and capacity projects with high returns to create value for all stakeholders 5
47WNC Investor Day | CLOSING REMARKS BRENT YEAGY PRESIDENT & CEO
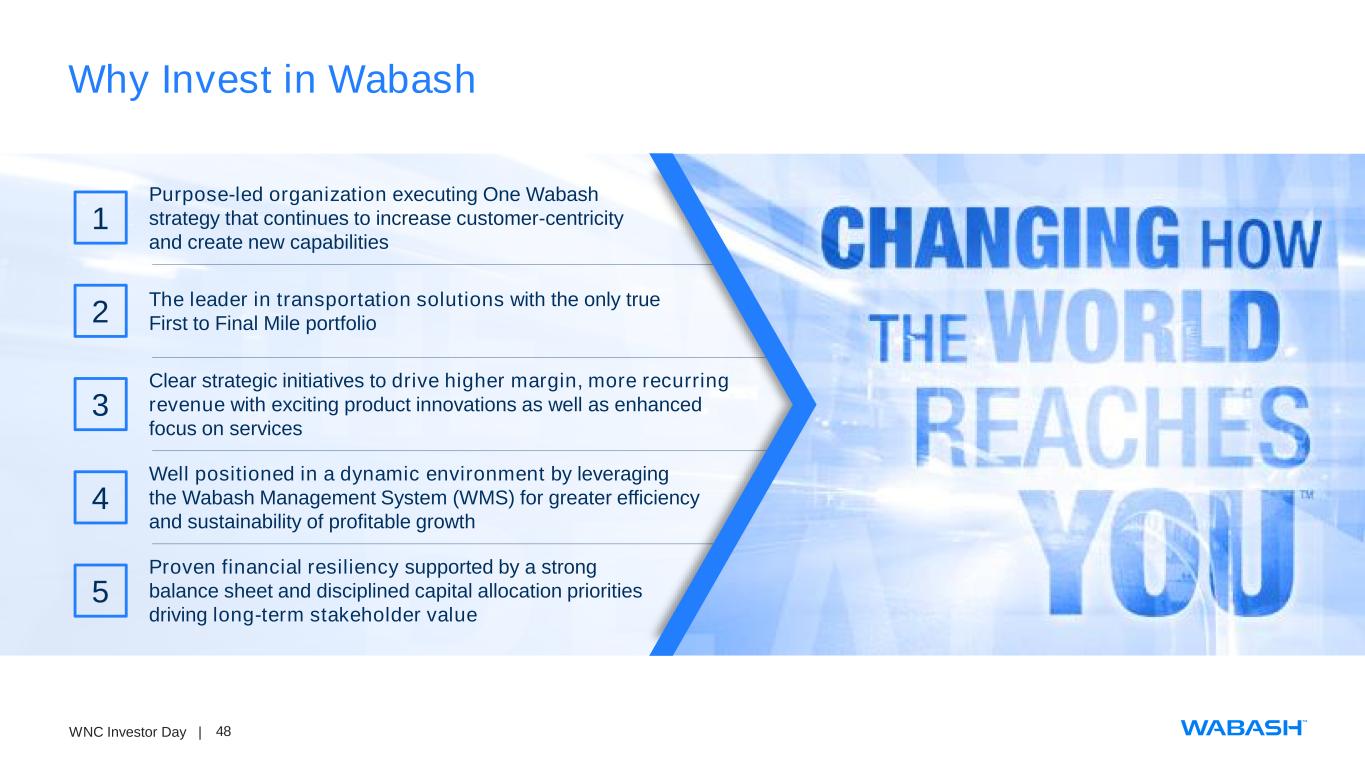
48WNC Investor Day | Why Invest in Wabash 1 2 3 4 5 Purpose-led organization executing One Wabash strategy that continues to increase customer-centricity and create new capabilities The leader in transportation solutions with the only true First to Final Mile portfolio Clear strategic initiatives to drive higher margin, more recurring revenue with exciting product innovations as well as enhanced focus on services Well positioned in a dynamic environment by leveraging the Wabash Management System (WMS) for greater efficiency and sustainability of profitable growth Proven financial resiliency supported by a strong balance sheet and disciplined capital allocation priorities driving long-term stakeholder value

49WNC Investor Day | Q&A SESSION ALL PRESENTERS
50WNC Investor Day | APPENDIX
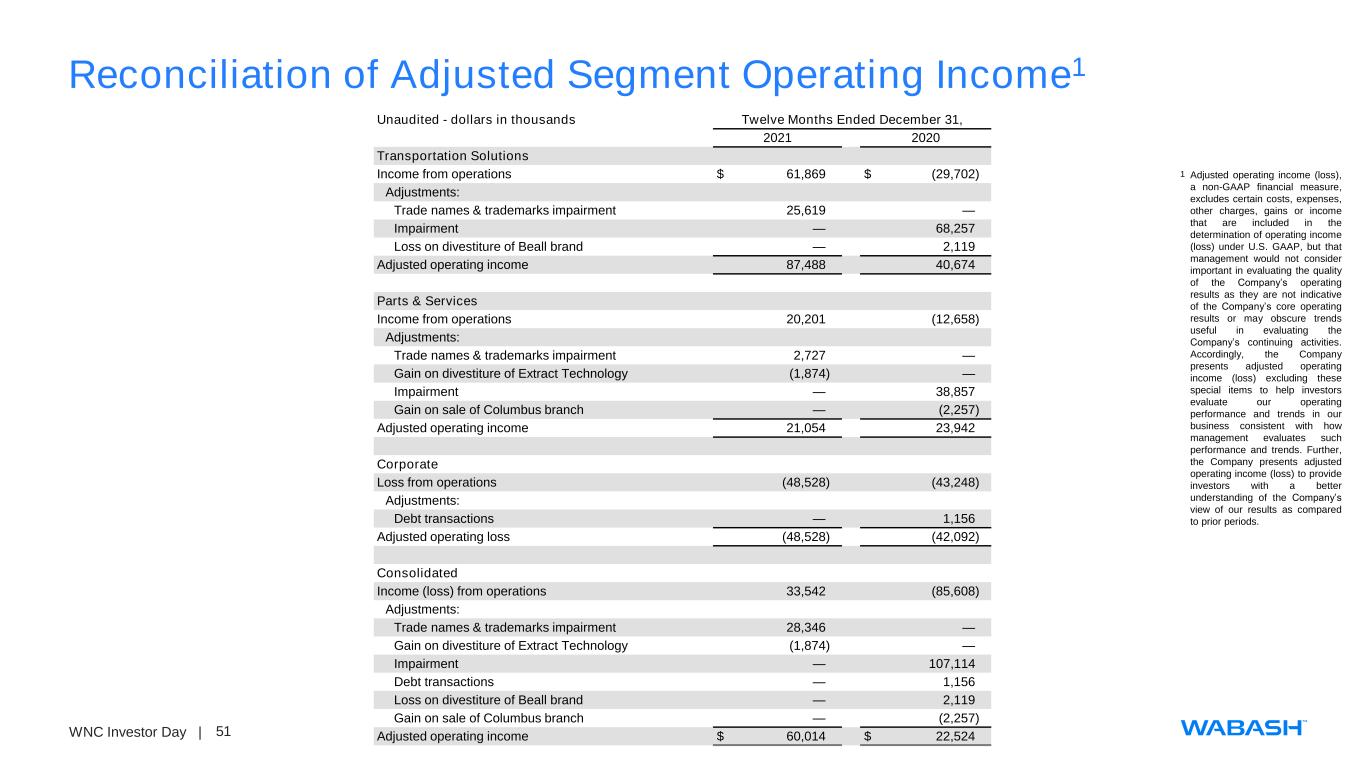
51WNC Investor Day | Reconciliation of Adjusted Segment Operating Income1 Unaudited - dollars in thousands Twelve Months Ended December 31, 2021 2020 Transportation Solutions Income from operations $ 61,869 $ (29,702) Adjustments: Trade names & trademarks impairment 25,619 — Impairment — 68,257 Loss on divestiture of Beall brand — 2,119 Adjusted operating income 87,488 40,674 Parts & Services Income from operations 20,201 (12,658) Adjustments: Trade names & trademarks impairment 2,727 — Gain on divestiture of Extract Technology (1,874) — Impairment — 38,857 Gain on sale of Columbus branch — (2,257) Adjusted operating income 21,054 23,942 Corporate Loss from operations (48,528) (43,248) Adjustments: Debt transactions — 1,156 Adjusted operating loss (48,528) (42,092) Consolidated Income (loss) from operations 33,542 (85,608) Adjustments: Trade names & trademarks impairment 28,346 — Gain on divestiture of Extract Technology (1,874) — Impairment — 107,114 Debt transactions — 1,156 Loss on divestiture of Beall brand — 2,119 Gain on sale of Columbus branch — (2,257) Adjusted operating income $ 60,014 $ 22,524 1 Adjusted operating income (loss), a non-GAAP financial measure, excludes certain costs, expenses, other charges, gains or income that are included in the determination of operating income (loss) under U.S. GAAP, but that management would not consider important in evaluating the quality of the Company’s operating results as they are not indicative of the Company’s core operating results or may obscure trends useful in evaluating the Company’s continuing activities. Accordingly, the Company presents adjusted operating income (loss) excluding these special items to help investors evaluate our operating performance and trends in our business consistent with how management evaluates such performance and trends. Further, the Company presents adjusted operating income (loss) to provide investors with a better understanding of the Company’s view of our results as compared to prior periods.
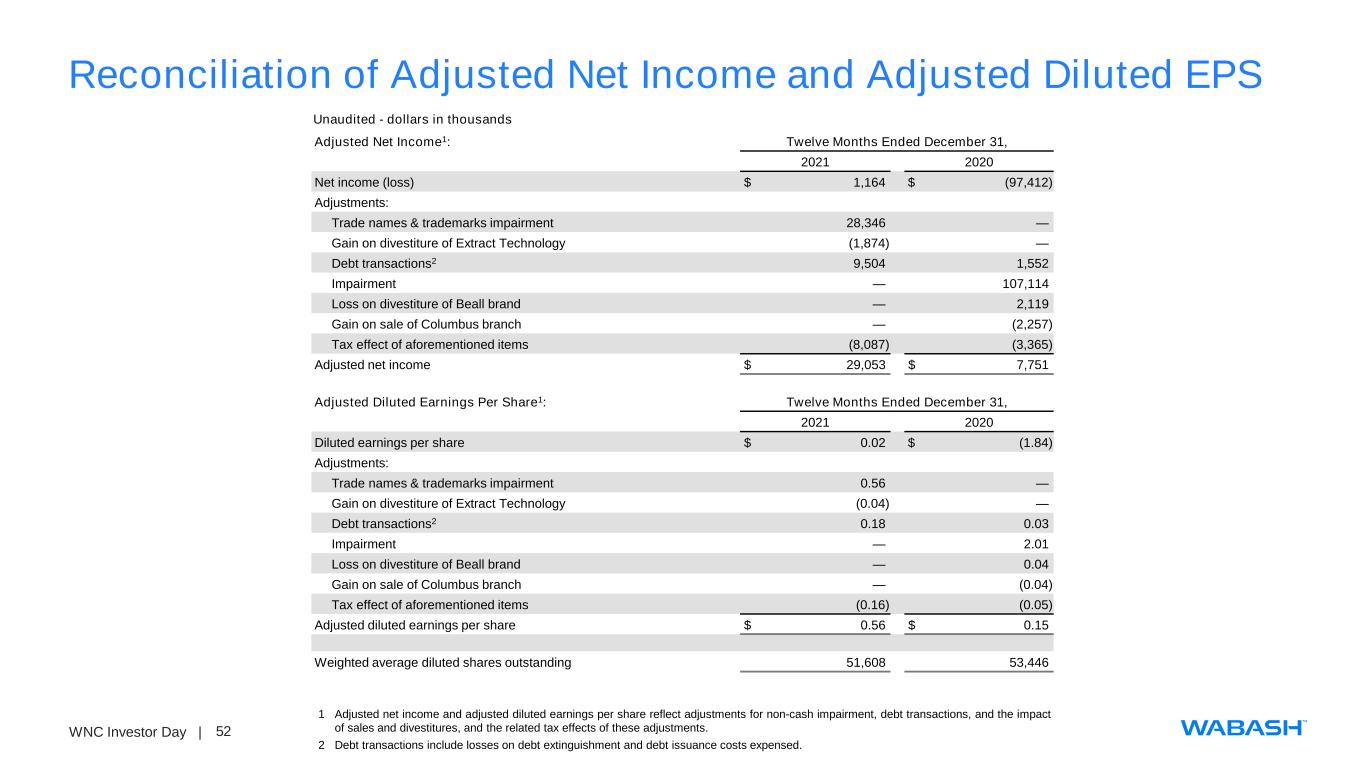
52WNC Investor Day | Reconciliation of Adjusted Net Income and Adjusted Diluted EPS Adjusted Net Income1: Twelve Months Ended December 31, 2021 2020 Net income (loss) $ 1,164 $ (97,412) Adjustments: Trade names & trademarks impairment 28,346 — Gain on divestiture of Extract Technology (1,874) — Debt transactions2 9,504 1,552 Impairment — 107,114 Loss on divestiture of Beall brand — 2,119 Gain on sale of Columbus branch — (2,257) Tax effect of aforementioned items (8,087) (3,365) Adjusted net income $ 29,053 $ 7,751 Adjusted Diluted Earnings Per Share1: Twelve Months Ended December 31, 2021 2020 Diluted earnings per share $ 0.02 $ (1.84) Adjustments: Trade names & trademarks impairment 0.56 — Gain on divestiture of Extract Technology (0.04) — Debt transactions2 0.18 0.03 Impairment — 2.01 Loss on divestiture of Beall brand — 0.04 Gain on sale of Columbus branch — (0.04) Tax effect of aforementioned items (0.16) (0.05) Adjusted diluted earnings per share $ 0.56 $ 0.15 Weighted average diluted shares outstanding 51,608 53,446 Unaudited - dollars in thousands 1 Adjusted net income and adjusted diluted earnings per share reflect adjustments for non-cash impairment, debt transactions, and the impact of sales and divestitures, and the related tax effects of these adjustments. 2 Debt transactions include losses on debt extinguishment and debt issuance costs expensed.
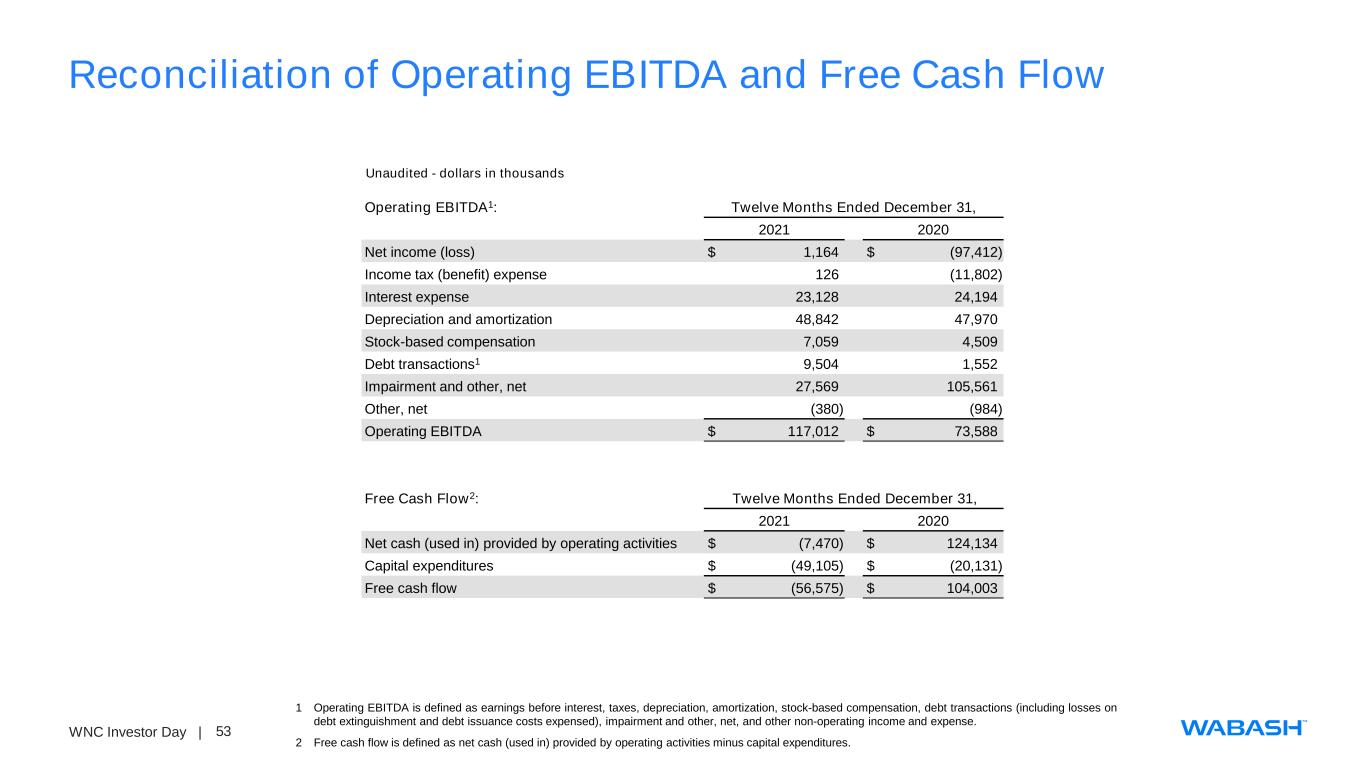
53WNC Investor Day | Reconciliation of Operating EBITDA and Free Cash Flow Operating EBITDA1: Twelve Months Ended December 31, 2021 2020 Net income (loss) $ 1,164 $ (97,412) Income tax (benefit) expense 126 (11,802) Interest expense 23,128 24,194 Depreciation and amortization 48,842 47,970 Stock-based compensation 7,059 4,509 Debt transactions1 9,504 1,552 Impairment and other, net 27,569 105,561 Other, net (380) (984) Operating EBITDA $ 117,012 $ 73,588 Free Cash Flow2: Twelve Months Ended December 31, 2021 2020 Net cash (used in) provided by operating activities $ (7,470) $ 124,134 Capital expenditures $ (49,105) $ (20,131) Free cash flow $ (56,575) $ 104,003 Unaudited - dollars in thousands 1 Operating EBITDA is defined as earnings before interest, taxes, depreciation, amortization, stock-based compensation, debt transactions (including losses on debt extinguishment and debt issuance costs expensed), impairment and other, net, and other non-operating income and expense. 2 Free cash flow is defined as net cash (used in) provided by operating activities minus capital expenditures.
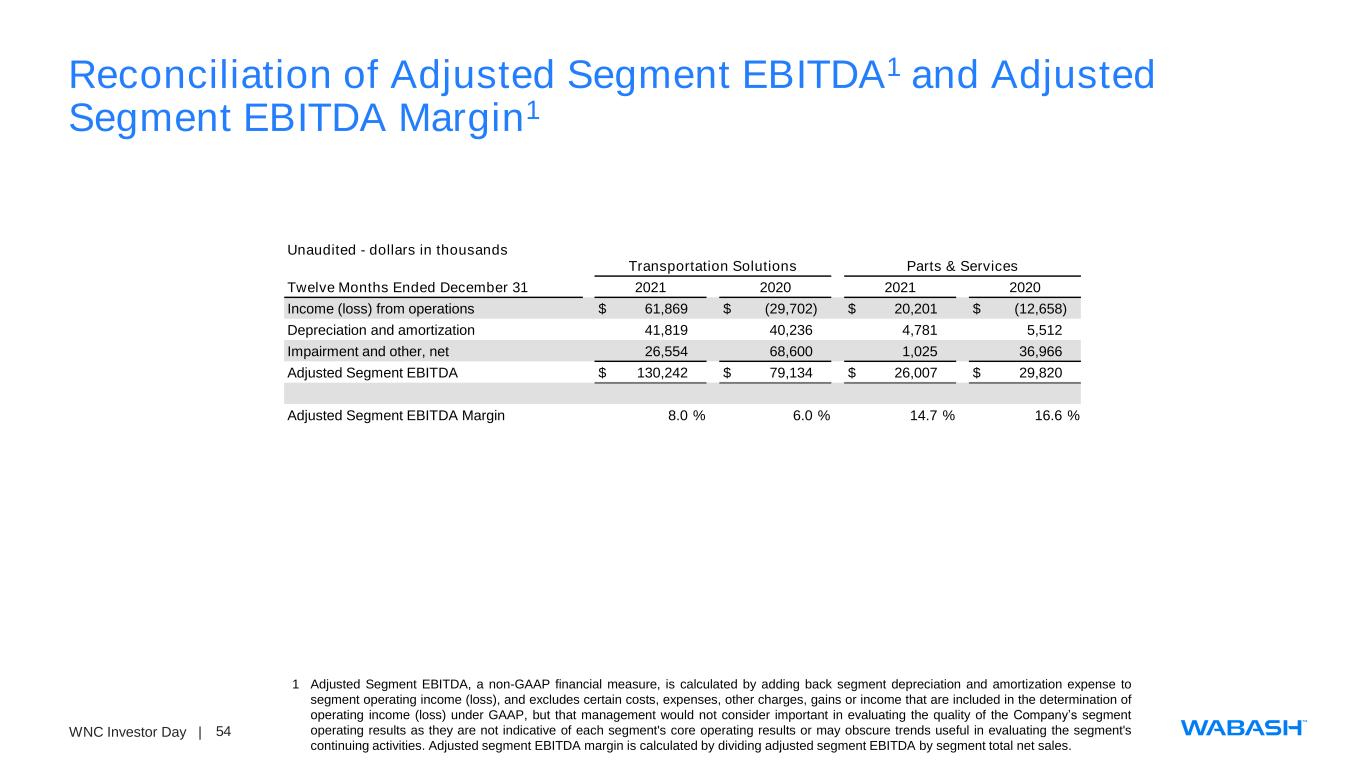
54WNC Investor Day | Reconciliation of Adjusted Segment EBITDA1 and Adjusted Segment EBITDA Margin1 Unaudited - dollars in thousands Transportation Solutions Parts & Services Twelve Months Ended December 31 2021 2020 2021 2020 Income (loss) from operations $ 61,869 $ (29,702) $ 20,201 $ (12,658) Depreciation and amortization 41,819 40,236 4,781 5,512 Impairment and other, net 26,554 68,600 1,025 36,966 Adjusted Segment EBITDA $ 130,242 $ 79,134 $ 26,007 $ 29,820 Adjusted Segment EBITDA Margin 8.0 % 6.0 % 14.7 % 16.6 % 1 Adjusted Segment EBITDA, a non-GAAP financial measure, is calculated by adding back segment depreciation and amortization expense to segment operating income (loss), and excludes certain costs, expenses, other charges, gains or income that are included in the determination of operating income (loss) under GAAP, but that management would not consider important in evaluating the quality of the Company’s segment operating results as they are not indicative of each segment's core operating results or may obscure trends useful in evaluating the segment's continuing activities. Adjusted segment EBITDA margin is calculated by dividing adjusted segment EBITDA by segment total net sales.

55WNC Investor Day | SPEAKER BIOGRAPHIES
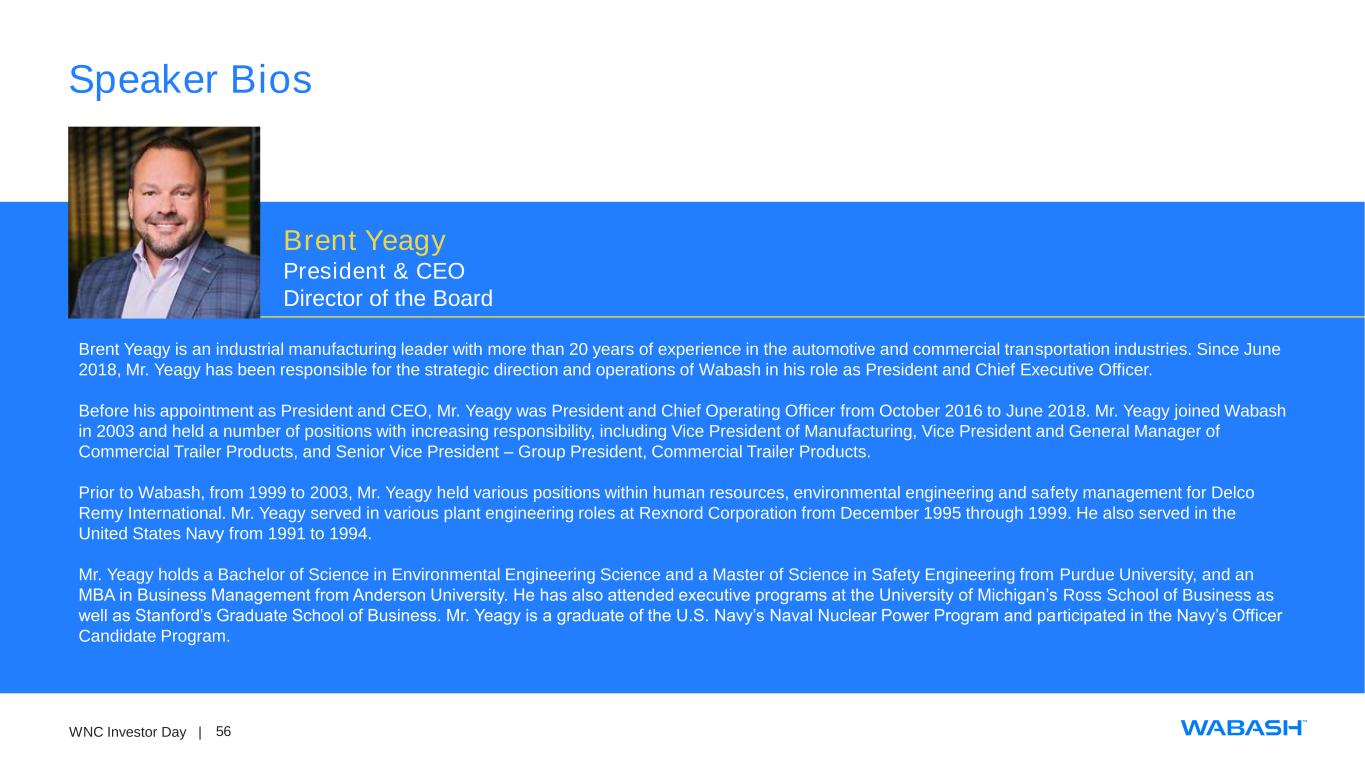
56WNC Investor Day | Speaker Bios Brent Yeagy is an industrial manufacturing leader with more than 20 years of experience in the automotive and commercial transportation industries. Since June 2018, Mr. Yeagy has been responsible for the strategic direction and operations of Wabash in his role as President and Chief Executive Officer. Before his appointment as President and CEO, Mr. Yeagy was President and Chief Operating Officer from October 2016 to June 2018. Mr. Yeagy joined Wabash in 2003 and held a number of positions with increasing responsibility, including Vice President of Manufacturing, Vice President and General Manager of Commercial Trailer Products, and Senior Vice President – Group President, Commercial Trailer Products. Prior to Wabash, from 1999 to 2003, Mr. Yeagy held various positions within human resources, environmental engineering and safety management for Delco Remy International. Mr. Yeagy served in various plant engineering roles at Rexnord Corporation from December 1995 through 1999. He also served in the United States Navy from 1991 to 1994. Mr. Yeagy holds a Bachelor of Science in Environmental Engineering Science and a Master of Science in Safety Engineering from Purdue University, and an MBA in Business Management from Anderson University. He has also attended executive programs at the University of Michigan’s Ross School of Business as well as Stanford’s Graduate School of Business. Mr. Yeagy is a graduate of the U.S. Navy’s Naval Nuclear Power Program and participated in the Navy’s Officer Candidate Program. Brent Yeagy President & CEO Director of the Board
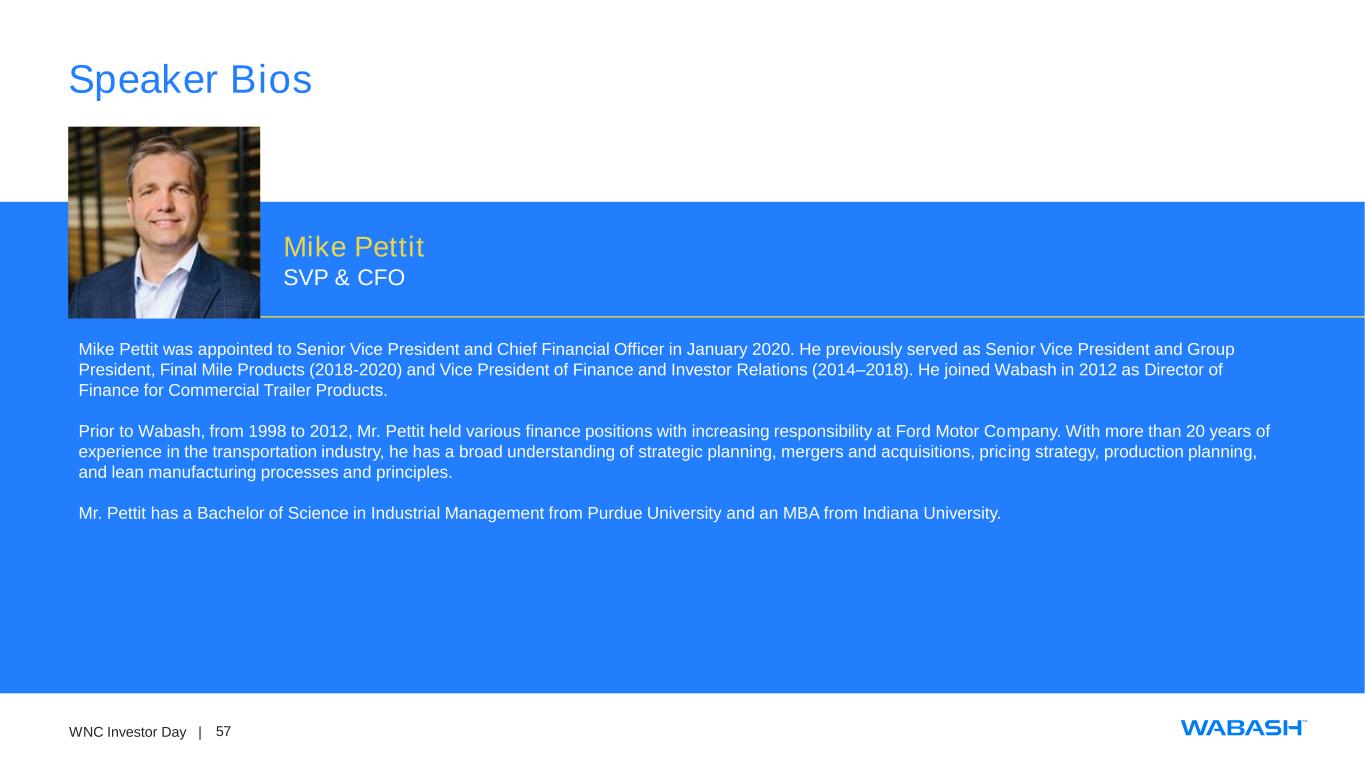
57WNC Investor Day | Speaker Bios Mike Pettit was appointed to Senior Vice President and Chief Financial Officer in January 2020. He previously served as Senior Vice President and Group President, Final Mile Products (2018-2020) and Vice President of Finance and Investor Relations (2014–2018). He joined Wabash in 2012 as Director of Finance for Commercial Trailer Products. Prior to Wabash, from 1998 to 2012, Mr. Pettit held various finance positions with increasing responsibility at Ford Motor Company. With more than 20 years of experience in the transportation industry, he has a broad understanding of strategic planning, mergers and acquisitions, pricing strategy, production planning, and lean manufacturing processes and principles. Mr. Pettit has a Bachelor of Science in Industrial Management from Purdue University and an MBA from Indiana University. Mike Pettit SVP & CFO
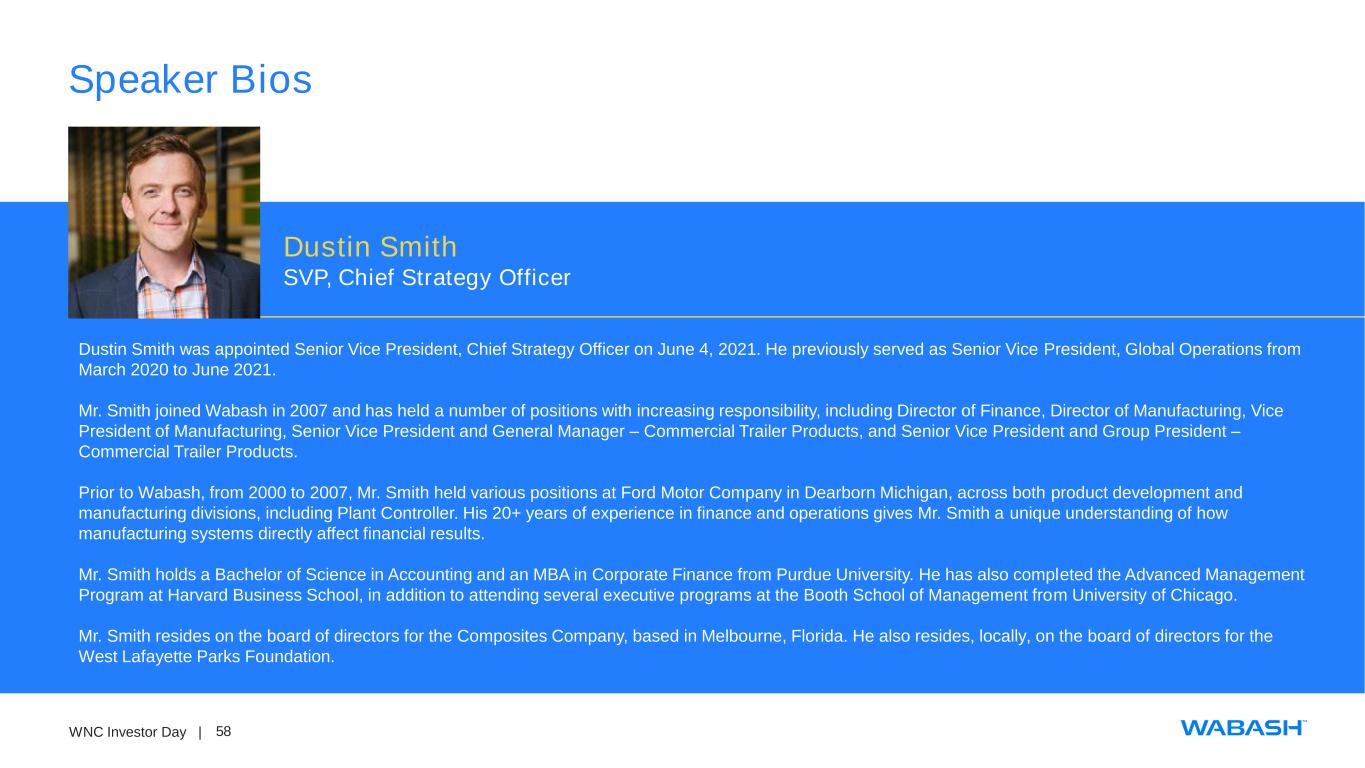
58WNC Investor Day | Speaker Bios Dustin Smith was appointed Senior Vice President, Chief Strategy Officer on June 4, 2021. He previously served as Senior Vice President, Global Operations from March 2020 to June 2021. Mr. Smith joined Wabash in 2007 and has held a number of positions with increasing responsibility, including Director of Finance, Director of Manufacturing, Vice President of Manufacturing, Senior Vice President and General Manager – Commercial Trailer Products, and Senior Vice President and Group President – Commercial Trailer Products. Prior to Wabash, from 2000 to 2007, Mr. Smith held various positions at Ford Motor Company in Dearborn Michigan, across both product development and manufacturing divisions, including Plant Controller. His 20+ years of experience in finance and operations gives Mr. Smith a unique understanding of how manufacturing systems directly affect financial results. Mr. Smith holds a Bachelor of Science in Accounting and an MBA in Corporate Finance from Purdue University. He has also completed the Advanced Management Program at Harvard Business School, in addition to attending several executive programs at the Booth School of Management from University of Chicago. Mr. Smith resides on the board of directors for the Composites Company, based in Melbourne, Florida. He also resides, locally, on the board of directors for the West Lafayette Parks Foundation. Dustin Smith SVP, Chief Strategy Officer
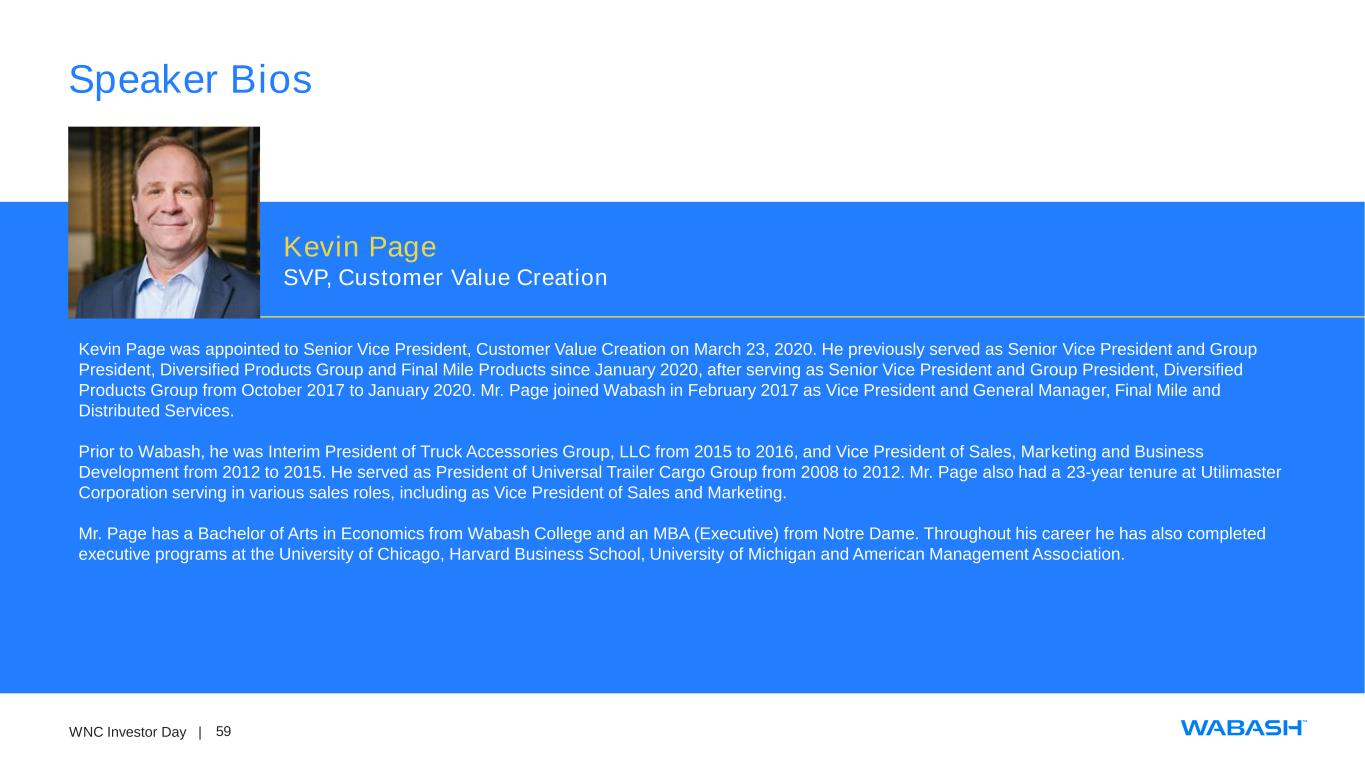
59WNC Investor Day | Speaker Bios Kevin Page was appointed to Senior Vice President, Customer Value Creation on March 23, 2020. He previously served as Senior Vice President and Group President, Diversified Products Group and Final Mile Products since January 2020, after serving as Senior Vice President and Group President, Diversified Products Group from October 2017 to January 2020. Mr. Page joined Wabash in February 2017 as Vice President and General Manager, Final Mile and Distributed Services. Prior to Wabash, he was Interim President of Truck Accessories Group, LLC from 2015 to 2016, and Vice President of Sales, Marketing and Business Development from 2012 to 2015. He served as President of Universal Trailer Cargo Group from 2008 to 2012. Mr. Page also had a 23-year tenure at Utilimaster Corporation serving in various sales roles, including as Vice President of Sales and Marketing. Mr. Page has a Bachelor of Arts in Economics from Wabash College and an MBA (Executive) from Notre Dame. Throughout his career he has also completed executive programs at the University of Chicago, Harvard Business School, University of Michigan and American Management Association. Kevin Page SVP, Customer Value Creation
Media Contact: Dana Stelsel Director, Communications (765) 771-5766 [email protected] Investor Relations: Ryan Reed Sr Director, Corporate Development & Investor Relations (765) 490-5664 [email protected] Wabash Investor Meeting Highlights Refreshed Strategy, Growth Initiatives and 2025 Financial Targets • Wabash successfully executing customer-centric strategy leveraging its First to Final Mile portfolio of solutions to continue to grow sales, margins and recurring revenue. • Strategic growth initiatives target solutions for cold chain, parts and services, and ecommerce and logistics disruption. • The company’s new strategy and initiatives are anticipated to generate $3.0B of revenue and $3.50 of EPS by 2025 – a near doubling of EPS over the period. LAFAYETTE, Ind. – May 19, 2022 – Wabash (NYSE: WNC) the innovation leader of connected solutions for the transportation, logistics and distribution industries, is hosting a virtual investor meeting at 10:00 a.m. EDT today, where members of the leadership team will present the company’s refreshed strategy, growth initiatives and 2025 financial targets. Wabash is announcing the following financial targets for 2025: • Revenue of $3.0B • EBITDA margin of 11% • EPS of $3.50 “We are excited to share how we are executing our refreshed strategy and accompanying growth initiatives,” said President and Chief Executive Officer Brent Yeagy. “Accelerated R&D and product development leveraging the voice of the customer is in the early stages of generating new products that solve our customers’ most important needs. By becoming a holistically more customer-centric organization, we expect to see the customer value we create accrue to our shareholders as our financial performance accelerates.” Leadership presentations will cover how the company is delivering the only true First to Final Mile portfolio; industry-leading R&D activities that poise Wabash to capture significant market opportunity; and how sustainability is at the core of Wabash’s strategy and increases value to its customers.
Wabash’s strategic growth initiatives center on three key areas: • Cold Chain – Wabash’s innovative EcoNex™ Technology offers superior thermal capability, lighter-weight, reduced corrosion and extended asset life – resulting in operational efficiency, while enhancing the sustainability initiatives of our customers. The scalability of EcoNex throughout Wabash’s First to Final Mile portfolio is substantial and evidenced by the success of our recently launched grocery home delivery vehicle. • Recurrent Revenue in Parts and Services – The creation of a new tech-enabled Wabash parts distribution network will unify and expand Wabash’s parts distribution capabilities across all product lines and provides immediate scale to grow. • Ecommerce and Logistics Disruption – Shifting consumer buying patterns have dislocated traditional logistics models, driving a structural increase in the volumes and types of equipment needed from first to final mile. This shift offers an opportunity for Wabash to bring new and refreshed product offerings to market to help customers thrive in a time of rapid change. The presentations, including a question-and-answer session, will begin at 10:00 a.m. EDT and conclude by 12:00 p.m. EDT. Meeting registration, webcast and presentation materials are available at ir.onewabash.com. Wabash: Changing How the World Reaches You™ As the innovation leader of connected solutions for the transportation, logistics and distribution industries, Wabash (NYSE: WNC) is Changing How the World Reaches You™. Headquartered in Lafayette, Indiana, the company’s mission is to enable customers to succeed with breakthrough ideas and solutions that help them move everything from first to final mile. Wabash designs and manufactures a diverse range of products, including: dry freight and refrigerated trailers, platform trailers, tank trailers, dry and refrigerated truck bodies, structural composite panels and products, trailer aerodynamic solutions, and specialty food grade equipment. Learn more at www.onewabash.com. Safe Harbor Statement This press release contains certain forward-looking statements as defined by the Private Securities Litigation Reform Act of 1995. Forward-looking statements convey the Company’s current expectations or forecasts of future events. All statements contained in this press release other than statements of historical fact are forward-looking statements. These forward-looking statements include, among other things, all statements regarding the Company’s outlook for trailer and truck body shipments, backlog, expectations regarding demand levels for trailers, truck bodies, non-trailer equipment and our other diversified product offerings, pricing, profitability and earnings, cash flow and liquidity, opportunity to capture higher margin sales, new product innovations, our growth and diversification strategies, our expectations for improved financial performance during the course of the year and our expectations with regards to capital allocation. These and the Company’s other forward-looking statements are
subject to certain risks and uncertainties that could cause actual results to differ materially from those implied by the forward-looking statements. Without limitation, these risks and uncertainties include a continued or prolonged shutdown or reduction of our operations, substantially reduced customer orders or sales volumes and supply disruptions due to the coronavirus (COVID-19) outbreak, the continued integration of Supreme into the Company’s business, adverse reactions to the transaction by customers, suppliers or strategic partners, uncertain economic conditions including the possibility that customer demand may not meet our expectations, increased competition, reliance on certain customers and corporate partnerships, risks of customer pick-up delays, shortages and costs of raw materials including the impact of tariffs or other international trade developments, risks in implementing and sustaining improvements in the Company’s manufacturing operations and cost containment, dependence on industry trends and timing, supplier constraints, labor costs and availability, customer acceptance of and reactions to pricing changes and costs of indebtedness. Readers should review and consider the various disclosures made by the Company in this press release and in the Company’s reports to its stockholders and periodic reports on Forms 10-K and 10-Q. Non-GAAP Measures In addition to disclosing financial results calculated in accordance with United States generally accepted accounting principles (GAAP), the financial information included in this release contains non-GAAP financial measures, including EBITDA margin. These non-GAAP measures should not be considered a substitute for, or superior to, financial measures and results calculated in accordance with GAAP, including net income margin and operating margin. Information reconciling forward-looking EBITDA margin to a GAAP financial measure is unavailable to us without unreasonable effort. We cannot provide a reconciliation of the above noted forward looking non-GAAP measure to GAAP financial measure because certain items required for such reconciliation are outside of our control and/or cannot be reasonably predicted. Preparation of such reconciliation would require a forward-looking statement of income, prepared in accordance with GAAP, and such forward-looking statement of income is unavailable to us without unreasonable effort.
Serious News for Serious Traders! Try StreetInsider.com Premium Free!
You May Also Be Interested In
- Wabash National (WNC) Misses Q1 EPS by 7c ; Offers Guidance
- Bayer Introduces Iberogast™ in the U.S., Bringing Proven Plant-Based Relief to the Millions Who Experience Gut Health Issues
- Cue Biopharma to Present at the 2024 American Society of Clinical Oncology (ASCO) Annual Meeting
Create E-mail Alert Related Categories
SEC FilingsSign up for StreetInsider Free!
Receive full access to all new and archived articles, unlimited portfolio tracking, e-mail alerts, custom newswires and RSS feeds - and more!


 Tweet
Tweet Share
Share