

Form 8-K TE Connectivity Ltd. For: Jul 28
 Tweet
Tweet Share
ShareExhibit 99.1
|
|
| te.com |
| |


TE Connectivity announces third quarter results for fiscal year 2021
Record sales and strong performance across all segments; EPS exceed company expectations
SCHAFFHAUSEN, Switzerland – July 28, 2021 – TE Connectivity Ltd. (NYSE: TEL) today reported results for the fiscal third quarter ended June 25, 2021.
Third Quarter Highlights
| ● | Net sales were a record $3.8 billion, up 51% on a reported basis, and 45% on an organic basis year over year. |
| ● | Orders of $4.5 billion, consistent with second quarter order levels. |
| ● | GAAP diluted earnings per share (EPS) from continuing operations were $1.74, and adjusted EPS were $1.79, up significantly year over year and a record for the company. |
| ● | Cash flow from operating activities was $682 million and free cash flow was $539 million, with $447 million returned to shareholders. |
“The global strength and diversity of our portfolio, combined with our global manufacturing strategy, positioned us to deliver record results despite broader supply chain challenges. We are continuing to benefit from the growth trends we have strategically positioned TE to capitalize on, as all three of our business segments – Transportation, Industrial and Communications - delivered strong operating performance, both year over year and sequentially,” said TE Connectivity CEO Terrence Curtin. “I am very pleased with our results as well as our team’s ability to deliver record sales growth and earnings that exceeded our expectations. We expect strong performance to continue into the fourth quarter with double digit sales growth and significant EPS growth year over year as we continue to benefit from a recovering economic backdrop, content growth and our leadership positions in long-term technology trends.”
Fourth Quarter Outlook
For the fourth quarter of fiscal 2021, the company expects net sales of approximately $3.8 billion, compared to $3.26 billion in the prior year. GAAP diluted EPS from continuing operations are expected to be approximately $1.55, compared to $0.69 in the prior year. Adjusted EPS are expected to be approximately $1.65, compared to adjusted EPS of $1.16 in the prior year.


For the full year, the company expects net sales of $14.9 billion, up approximately 22% year over year. GAAP diluted EPS from continuing operations are expected to be $5.94, including net restructuring, acquisition-related and other charges of $0.62 and a tax-related benefit of $0.09. The company expects adjusted EPS of $6.47, compared to $4.26 in the prior year, up 52% year over year.
Information about TE Connectivity's use of non-GAAP financial measures is provided below. For reconciliations of these non-GAAP financial measures, see the attached tables.
Conference Call and Webcast
The company will hold a conference call today beginning at 8:30 a.m. ET. The dial-in information is provided here:
| ● | At TE Connectivity's website: investors.te.com |
| ● | By telephone: For both "listen-only" participants and those participants who wish to take part in the question-and-answer portion of the call, the dial-in number in the United States is (866) 211-4092, and for international callers, the dial-in number is (647) 689-6620. |
| ● | A replay of the conference call will be available on TE Connectivity’s investor website at investors.te.com at 11:30 a.m. ET on July 28, 2021. |
About TE Connectivity
TE Connectivity Ltd. (NYSE: TEL) is a global industrial technology leader creating a safer, sustainable, productive, and connected future. Our broad range of connectivity and sensor solutions, proven in the harshest environments, enable advancements in transportation, industrial applications, medical technology, energy, data communications, and the home. With approximately 80,000 employees, including more than 7,500 engineers, working alongside customers in approximately 140 countries, TE ensures that EVERY CONNECTION COUNTS. Learn more at www.te.com and on LinkedIn, Facebook, WeChat and Twitter.
Non-GAAP Financial Measures
We present non-GAAP performance and liquidity measures as we believe it is appropriate for investors to consider adjusted financial measures in addition to results in accordance with accounting principles generally accepted in the U.S. (“GAAP”). These non-GAAP financial measures provide supplemental information and should not be considered replacements for results in accordance with GAAP. Management uses non-GAAP financial measures internally for planning and forecasting purposes and in its decision-making processes related to the operations of our company. We believe these measures provide meaningful information to us and investors because they
enhance the understanding of our operating performance, ability to generate cash, and the trends of our business. Additionally, we believe that investors benefit from having access to the same financial measures that management uses in evaluating our operations. The primary limitation of these measures is that they exclude the financial impact of items that would otherwise either increase or decrease our reported results. This limitation is best addressed by using these non-GAAP financial measures in combination with the most directly comparable GAAP financial measures in order to better understand the amounts, character, and impact of any increase or decrease in reported amounts. These non-GAAP financial measures may not be comparable to similarly-titled measures reported by other companies.
The following provides additional information regarding our non-GAAP financial measures:
Forward-Looking Statements
This release contains certain "forward-looking statements" within the meaning of the U.S. Private Securities Litigation Reform Act of 1995. These statements are based on management's current expectations and are subject to risks, uncertainty and changes in circumstances, which may cause actual results, performance, financial condition or achievements to differ materially from anticipated results, performance, financial condition or achievements. All statements contained herein that are not clearly historical in nature are forward-looking and the words "anticipate," "believe," "expect," "estimate," "plan," and similar expressions are generally intended to identify forward-looking statements. We have no intention and are under no obligation to update or alter (and expressly disclaim any such intention or obligation to do so) our forward-looking statements whether as a result of new information, future events or otherwise, except to the extent required by law. The forward-looking statements in this release include statements addressing our future financial condition and operating results, and the impact on our operations resulting from the coronavirus disease 2019 (“COVID-19”). Examples of factors that could cause actual results to differ materially from those described in the forward-looking statements include, among others, the extent, severity and duration of COVID-19 negatively affecting our business operations; business, economic, competitive and regulatory risks, such as conditions affecting demand for products in the automotive and other industries we serve; competition and pricing pressure; fluctuations in foreign currency exchange rates and commodity prices; natural disasters and political, economic and military instability in countries in which we operate; developments in the credit markets; future goodwill impairment; compliance with current and future environmental and other laws and regulations; and the possible effects on us of changes in tax laws, tax treaties and other legislation, including the effects of Swiss tax reform. In addition, the extent to which COVID-19 will impact our business and our financial results will depend on future developments, which are highly uncertain and cannot be predicted. Such developments may include the
geographic spread of the virus, the severity of the virus, the duration of the outbreak, the impact on our suppliers’ and customers’ supply chains, the actions that may be taken by various governmental authorities in response to the outbreak in jurisdictions in which we operate, and the possible impact on the global economy and local economies in which we operate. More detailed information about these and other factors is set forth in TE Connectivity Ltd.'s Annual Report on Form 10-K for the fiscal year ended Sept. 25, 2020 as well as in our Quarterly Reports on Form 10-Q, Current Reports on Form 8-K and other reports filed by us with the U.S. Securities and Exchange Commission.
# # #
Contacts: | Media Relations: | Investor Relations: |
| Fernando Vivanco | Sujal Shah |
| TE Connectivity | TE Connectivity |
| 610-893-9756 | 610-893-9790 |
|
TE CONNECTIVITY LTD.
CONSOLIDATED STATEMENTS OF OPERATIONS (UNAUDITED)
| For the Quarters Ended | | For the Nine Months Ended | ||||||||
| June 25, | | June 26, | | June 25, | | June 26, | ||||
| 2021 |
| 2020 |
| 2021 |
| 2020 | ||||
| (in millions, except per share data) | ||||||||||
Net sales | $ | 3,845 | | $ | 2,548 | | $ | 11,105 | | $ | 8,911 |
Cost of sales | | 2,577 | | | 1,841 | | | 7,481 | | | 6,145 |
Gross margin | | 1,268 | | | 707 | | | 3,624 | | | 2,766 |
Selling, general, and administrative expenses | | 366 | | | 321 | | | 1,128 | | | 1,040 |
Research, development, and engineering expenses | | 168 | | | 146 | | | 504 | | | 465 |
Acquisition and integration costs | | 9 | | | 8 | | | 23 | | | 27 |
Restructuring and other charges, net | | 11 | | | 98 | | | 195 | | | 144 |
Impairment of goodwill | | — | | | — | | | — | | | 900 |
Operating income | | 714 | | | 134 | | | 1,774 | | | 190 |
Interest income | | 3 | | | 2 | | | 14 | | | 13 |
Interest expense | | (14) | | | (13) | | | (42) | | | (36) |
Other income, net | | 2 | | | 4 | | | 5 | | | 20 |
Income from continuing operations before income taxes | | 705 | | | 127 | | | 1,751 | | | 187 |
Income tax expense | | (124) | | | (185) | | | (290) | | | (674) |
Income (loss) from continuing operations | | 581 | | | (58) | | | 1,461 | | | (487) |
Income (loss) from discontinued operations, net of income taxes | | (1) | | | 17 | | | 6 | | | 16 |
Net income (loss) | $ | 580 | | $ | (41) | | $ | 1,467 | | $ | (471) |
| | | | | | | | | | | |
Basic earnings (loss) per share: | | | | | | | | | | | |
Income (loss) from continuing operations | $ | 1.76 | | $ | (0.18) | | $ | 4.41 | | $ | (1.46) |
Income (loss) from discontinued operations | | — | | | 0.05 | | | 0.02 | | | 0.05 |
Net income (loss) | | 1.76 | | | (0.12) | | | 4.43 | | | (1.41) |
| | | | | | | | | | | |
Diluted earnings (loss) per share: | | | | | | | | | | | |
Income (loss) from continuing operations | $ | 1.74 | | $ | (0.18) | | $ | 4.39 | | $ | (1.46) |
Income (loss) from discontinued operations | | — | | | 0.05 | | | 0.02 | | | 0.05 |
Net income (loss) | | 1.74 | | | (0.12) | | | 4.41 | | | (1.41) |
| | | | | | | | | | | |
Weighted-average number of shares outstanding: | | | | | | | | | | | |
Basic | | 330 | | | 330 | | | 331 | | | 333 |
Diluted | | 333 | | | 330 | | | 333 | | | 333 |
TE CONNECTIVITY LTD.
CONSOLIDATED BALANCE SHEETS (UNAUDITED)
| June 25, | | September 25, | ||
| 2021 | | 2020 | ||
| (in millions, except share data) | ||||
Assets | | | | | |
Current assets: | | | | | |
Cash and cash equivalents | $ | 1,416 | | $ | 945 |
Accounts receivable, net of allowance for doubtful accounts of $41 and $29, respectively | | 2,985 | | | 2,377 |
Inventories | | 2,392 | | | 1,950 |
Prepaid expenses and other current assets | | 601 | | | 512 |
Total current assets | | 7,394 | | | 5,784 |
Property, plant, and equipment, net | | 3,723 | | | 3,650 |
Goodwill | | 5,401 | | | 5,224 |
Intangible assets, net | | 1,516 | | | 1,593 |
Deferred income taxes | | 2,224 | | | 2,178 |
Other assets | | 800 | | | 813 |
Total assets | $ | 21,058 | | $ | 19,242 |
Liabilities, redeemable noncontrolling interests, and shareholders' equity | | | | | |
Current liabilities: | | | | | |
Short-term debt | $ | 505 | | $ | 694 |
Accounts payable | | 1,938 | | | 1,276 |
Accrued and other current liabilities | | 2,219 | | | 1,720 |
Total current liabilities | | 4,662 | | | 3,690 |
Long-term debt | | 3,629 | | | 3,452 |
Long-term pension and postretirement liabilities | | 1,305 | | | 1,336 |
Deferred income taxes | | 149 | | | 143 |
Income taxes | | 299 | | | 252 |
Other liabilities | | 852 | | | 874 |
Total liabilities | | 10,896 | | | 9,747 |
Commitments and contingencies | | | | | |
Redeemable noncontrolling interests | | 116 | | | 112 |
Shareholders' equity: | | | | | |
Common shares, CHF 0.57 par value, 336,099,881 shares authorized and issued, and 338,953,381 shares authorized and issued, respectively | | 148 | | | 149 |
Accumulated earnings | | 10,892 | | | 10,348 |
Treasury shares, at cost, 7,518,936 and 8,295,878 shares, respectively | | (778) | | | (669) |
Accumulated other comprehensive loss | | (216) | | | (445) |
Total shareholders' equity | | 10,046 | | | 9,383 |
Total liabilities, redeemable noncontrolling interests, and shareholders' equity | $ | 21,058 | | $ | 19,242 |
TE CONNECTIVITY LTD.
CONSOLIDATED STATEMENTS OF CASH FLOWS (UNAUDITED)
| For the Quarters Ended | | For the Nine Months Ended | ||||||||
| June 25, | | June 26, | | June 25, | | June 26, | ||||
| 2021 | | 2020 | | 2021 | | 2020 | ||||
| (in millions) | ||||||||||
Cash flows from operating activities: | | | | | | | | | | | |
Net income (loss) | $ | 580 | | $ | (41) | | $ | 1,467 | | $ | (471) |
(Income) loss from discontinued operations, net of income taxes | | 1 | | | (17) | | | (6) | | | (16) |
Income (loss) from continuing operations | | 581 | | | (58) | | | 1,461 | | | (487) |
Adjustments to reconcile income (loss) from continuing operations to net cash provided by operating activities: | | | | | | | | | | | |
Impairment of goodwill | | — | | | — | | | — | | | 900 |
Depreciation and amortization | | 210 | | | 176 | | | 590 | | | 530 |
Deferred income taxes | | (14) | | | 114 | | | (62) | | | 459 |
Non-cash lease cost | | 31 | | | 27 | | | 90 | | | 79 |
Provision for losses on accounts receivable and inventories | | 10 | | | 10 | | | 32 | | | 28 |
Share-based compensation expense | | 24 | | | 17 | | | 73 | | | 54 |
Other | | (25) | | | 29 | | | (45) | | | 40 |
Changes in assets and liabilities, net of the effects of acquisitions and divestitures: | | | | | | | | | | | |
Accounts receivable, net | | (71) | | | 322 | | | (638) | | | 182 |
Inventories | | (270) | | | (191) | | | (482) | | | (342) |
Prepaid expenses and other current assets | | 16 | | | 2 | | | (14) | | | 27 |
Accounts payable | | 136 | | | (130) | | | 646 | | | (81) |
Accrued and other current liabilities | | (15) | | | (24) | | | 110 | | | (204) |
Income taxes | | 27 | | | 19 | | | 61 | | | 20 |
Other | | 42 | | | 67 | | | 80 | | | 67 |
Net cash provided by operating activities | | 682 | | | 380 | | | 1,902 | | | 1,272 |
Cash flows from investing activities: | | | | | | | | | | | |
Capital expenditures | | (170) | | | (130) | | | (454) | | | (439) |
Proceeds from sale of property, plant, and equipment | | 27 | | | 3 | | | 85 | | | 6 |
Acquisition of businesses, net of cash acquired | | (19) | | | 31 | | | (126) | | | (328) |
Other | | (12) | | | 15 | | | (2) | | | 13 |
Net cash used in investing activities | | (174) | | | (81) | | | (497) | | | (748) |
Cash flows from financing activities: | | | | | | | | | | | |
Net decrease in commercial paper | | — | | | — | | | — | | | (219) |
Proceeds from issuance of debt | | — | | | — | | | 661 | | | 593 |
Repayment of debt | | (426) | | | (352) | | | (706) | | | (352) |
Proceeds from exercise of share options | | 11 | | | 2 | | | 130 | | | 29 |
Repurchase of common shares | | (259) | | | (115) | | | (518) | | | (523) |
Payment of common share dividends to shareholders | | (165) | | | (159) | | | (483) | | | (466) |
Other | | (3) | | | (1) | | | (27) | | | (32) |
Net cash used in financing activities | | (842) | | | (625) | | | (943) | | | (970) |
Effect of currency translation on cash | | 2 | | | 4 | | | 9 | | | (7) |
Net increase (decrease) in cash, cash equivalents, and restricted cash | | (332) | | | (322) | | | 471 | | | (453) |
Cash, cash equivalents, and restricted cash at beginning of period | | 1,748 | | | 796 | | | 945 | | | 927 |
Cash, cash equivalents, and restricted cash at end of period | $ | 1,416 | | $ | 474 | | $ | 1,416 | | $ | 474 |
| | | | | | | | | | | |
Supplemental cash flow information: | | | | | | | | | | | |
Interest paid on debt, net | $ | 7 | | $ | 7 | | $ | 40 | | $ | 31 |
Income taxes paid, net of refunds | | 110 | | | 51 | | | 291 | | | 195 |
TE CONNECTIVITY LTD.
RECONCILIATION OF FREE CASH FLOW (UNAUDITED)
| For the Quarters Ended | | For the Nine Months Ended | ||||||||
| June 25, | | June 26, | | June 25, | | June 26, | ||||
| 2021 | | 2020 | | 2021 | | 2020 | ||||
| (in millions) | ||||||||||
Net cash provided by continuing operating activities | $ | 682 | | $ | 380 | | $ | 1,902 | | $ | 1,272 |
Excluding: | | | | | | | | | | | |
Cash (collected) paid pursuant to collateral requirements related to cross-currency swap contracts | | — | | | 27 | | | 12 | | | (5) |
Capital expenditures, net | | (143) | | | (127) | | | (369) | | | (433) |
Free cash flow (1) | $ | 539 | | $ | 280 | | $ | 1,545 | | $ | 834 |
| | | | | | | | | | | |
(1) Free cash flow is a non-GAAP financial measure. See description of non-GAAP financial measures. | |||||||||||
TE CONNECTIVITY LTD.
CONSOLIDATED SEGMENT DATA (UNAUDITED)
| For the Quarters Ended | | | For the Nine Months Ended | | ||||||||||||||||||
| June 25, | | | June 26, | | | June 25, | | | June 26, | | ||||||||||||
| 2021 | | | 2020 | | | 2021 | | | 2020 | | ||||||||||||
| ($ in millions) | | |||||||||||||||||||||
| Net Sales |
| | | | Net Sales |
| | | | Net Sales |
| | | | Net Sales |
| | | ||||
Transportation Solutions | $ | 2,265 | | | | | $ | 1,255 | | | | | $ | 6,776 | | | | | $ | 4,980 | | | |
Industrial Solutions | | 1,002 | | | | | | 865 | | | | | | 2,827 | | | | | | 2,754 | | | |
Communications Solutions | | 578 | | | | | | 428 | | | | | | 1,502 | | | | | | 1,177 | | | |
Total | $ | 3,845 | | | | | $ | 2,548 | | | | | $ | 11,105 | | | | | $ | 8,911 | | | |
| | | | | | | | | | | | | | | | | | | | | | | |
| | | | | | | | | | | | | | | | | | | | | | | |
| Operating | | Operating | | Operating | | Operating | | Operating | | Operating | | Operating | | Operating | ||||||||
| Income | | Margin | | Income (Loss) | | Margin | | Income | | Margin | | Income (Loss) | | Margin | ||||||||
Transportation Solutions | $ | 433 | | 19.1 | % | | $ | (1) | | (0.1) | % | | $ | 1,139 | | 16.8 | % | | $ | (291) | | (5.8) | % |
Industrial Solutions | | 148 | | 14.8 | | | | 70 | | 8.1 | | | | 335 | | 11.9 | | | | 327 | | 11.9 | |
Communications Solutions | | 133 | | 23.0 | | | | 65 | | 15.2 | | | | 300 | | 20.0 | | | | 154 | | 13.1 | |
Total | $ | 714 | | 18.6 | % | | $ | 134 | | 5.3 | % | | $ | 1,774 | | 16.0 | % | | $ | 190 | | 2.1 | % |
| | | | | | | | | | | | | | | | | | | | | | | |
| | | | | | | | | | | | | | | | | | | | | | | |
| Adjusted | | Adjusted | | Adjusted | | Adjusted | | Adjusted | | Adjusted | | Adjusted | | Adjusted | ||||||||
| Operating | | Operating | | Operating | | Operating | | Operating | | Operating | | Operating | | Operating | ||||||||
| Income (1) | | Margin (1) | | Income (1) | | Margin (1) | | Income (1) | | Margin (1) | | Income (1) | | Margin (1) | ||||||||
Transportation Solutions | $ | 440 | | 19.4 | % | | $ | 60 | | 4.8 | % | | $ | 1,284 | | 18.9 | % | | $ | 707 | | 14.2 | % |
Industrial Solutions | | 158 | | 15.8 | | | | 112 | | 12.9 | | | | 395 | | 14.0 | | | | 389 | | 14.1 | |
Communications Solutions | | 136 | | 23.5 | | | | 68 | | 15.9 | | | | 316 | | 21.0 | | | | 165 | | 14.0 | |
Total | $ | 734 | | 19.1 | % | | $ | 240 | | 9.4 | % | | $ | 1,995 | | 18.0 | % | | $ | 1,261 | | 14.2 | % |
| | | | | | | | | | | | | | | | | | | | | | | |
(1) Adjusted operating income and adjusted operating margin are non-GAAP financial measures. See description of non-GAAP financial measures. | | ||||||||||||||||||||||
TE CONNECTIVITY LTD.
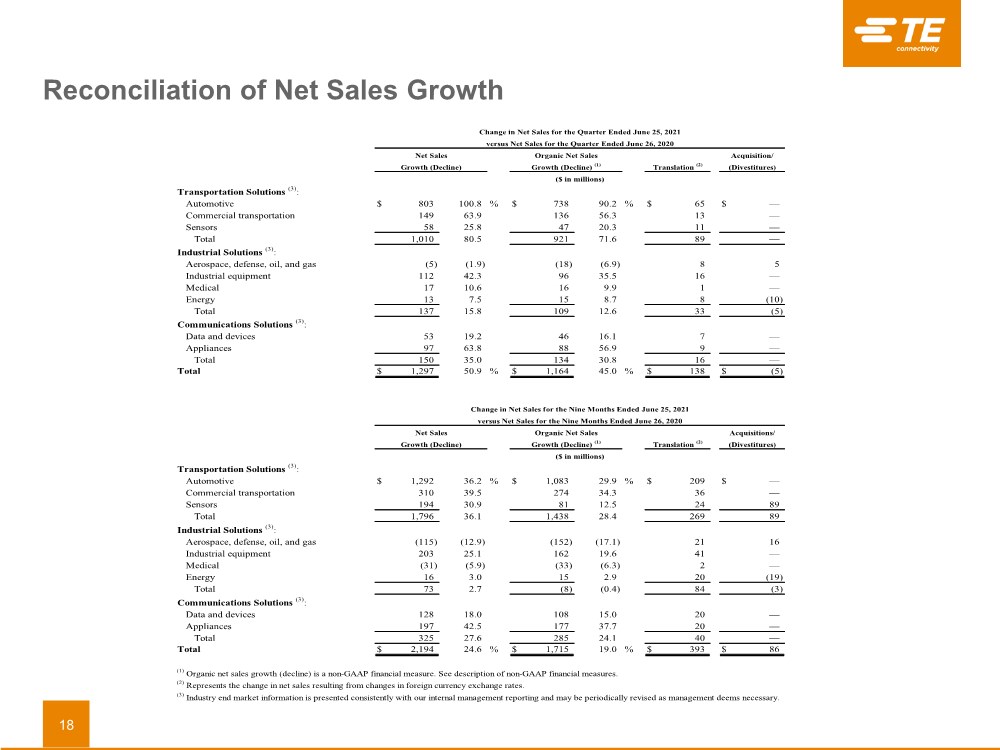
RECONCILIATION OF NET SALES GROWTH (DECLINE) (UNAUDITED)
| Change in Net Sales for the Quarter Ended June 25, 2021 | ||||||||||||||||
| versus Net Sales for the Quarter Ended June 26, 2020 | ||||||||||||||||
| Net Sales | | | Organic Net Sales | | | | | Acquisition/ | ||||||||
| Growth (Decline) | | | Growth (Decline) (1) | | | Translation (2) | | (Divestitures) | ||||||||
| ($ in millions) | ||||||||||||||||
Transportation Solutions (3): | | |
| | | | | |
| | | | | | | | |
Automotive | $ | 803 | | 100.8 | % | | $ | 738 | | 90.2 | % | | $ | 65 | | $ | — |
Commercial transportation | | 149 | | 63.9 | | | | 136 | | 56.3 | | | | 13 | | | — |
Sensors | | 58 | | 25.8 | | | | 47 | | 20.3 | | | | 11 | | | — |
Total | | 1,010 | | 80.5 | | | | 921 | | 71.6 | | | | 89 | | | — |
Industrial Solutions (3): | | | | | | | | | | | | | | | | | |
Aerospace, defense, oil, and gas | | (5) | | (1.9) | | | | (18) | | (6.9) | | | | 8 | | | 5 |
Industrial equipment | | 112 | | 42.3 | | | | 96 | | 35.5 | | | | 16 | | | — |
Medical | | 17 | | 10.6 | | | | 16 | | 9.9 | | | | 1 | | | — |
Energy | | 13 | | 7.5 | | | | 15 | | 8.7 | | | | 8 | | | (10) |
Total | | 137 | | 15.8 | | | | 109 | | 12.6 | | | | 33 | | | (5) |
Communications Solutions (3): | | | | | | | | | | | | | | | | | |
Data and devices | | 53 | | 19.2 | | | | 46 | | 16.1 | | | | 7 | | | — |
Appliances | | 97 | | 63.8 | | | | 88 | | 56.9 | | | | 9 | | | — |
Total | | 150 | | 35.0 | | | | 134 | | 30.8 | | | | 16 | | | — |
Total | $ | 1,297 | | 50.9 | % | | $ | 1,164 | | 45.0 | % | | $ | 138 | | $ | (5) |
| Change in Net Sales for the Nine Months Ended June 25, 2021 | ||||||||||||||||
| versus Net Sales for the Nine Months Ended June 26, 2020 | ||||||||||||||||
| Net Sales | | | Organic Net Sales | | | | | Acquisitions/ | ||||||||
| Growth (Decline) | | | Growth (Decline) (1) | | | Translation (2) | | (Divestitures) | ||||||||
| ($ in millions) | ||||||||||||||||
Transportation Solutions (3): | | |
| | | | | |
| | | | | | | | |
Automotive | $ | 1,292 | | 36.2 | % | | $ | 1,083 | | 29.9 | % | | $ | 209 | | $ | — |
Commercial transportation | | 310 | | 39.5 | | | | 274 | | 34.3 | | | | 36 | | | — |
Sensors | | 194 | | 30.9 | | | | 81 | | 12.5 | | | | 24 | | | 89 |
Total | | 1,796 | | 36.1 | | | | 1,438 | | 28.4 | | | | 269 | | | 89 |
Industrial Solutions (3): | | | | | | | | | | | | | | | | | |
Aerospace, defense, oil, and gas | | (115) | | (12.9) | | | | (152) | | (17.1) | | | | 21 | | | 16 |
Industrial equipment | | 203 | | 25.1 | | | | 162 | | 19.6 | | | | 41 | | | — |
Medical | | (31) | | (5.9) | | | | (33) | | (6.3) | | | | 2 | | | — |
Energy | | 16 | | 3.0 | | | | 15 | | 2.9 | | | | 20 | | | (19) |
Total | | 73 | | 2.7 | | | | (8) | | (0.4) | | | | 84 | | | (3) |
Communications Solutions (3): | | | | | | | | | | | | | | | | | |
Data and devices | | 128 | | 18.0 | | | | 108 | | 15.0 | | | | 20 | | | — |
Appliances | | 197 | | 42.5 | | | | 177 | | 37.7 | | | | 20 | | | — |
Total | | 325 | | 27.6 | | | | 285 | | 24.1 | | | | 40 | | | — |
Total | $ | 2,194 | | 24.6 | % | | $ | 1,715 | | 19.0 | % | | $ | 393 | | $ | 86 |
| | | | | | | | | | | | | | | | | |
(1) Organic net sales growth (decline) is a non-GAAP financial measure. See description of non-GAAP financial measures. | |||||||||||||||||
(2) Represents the change in net sales resulting from changes in foreign currency exchange rates. | |||||||||||||||||
(3) Industry end market information is presented consistently with our internal management reporting and may be periodically revised as management deems necessary. | |||||||||||||||||
TE CONNECTIVITY LTD.
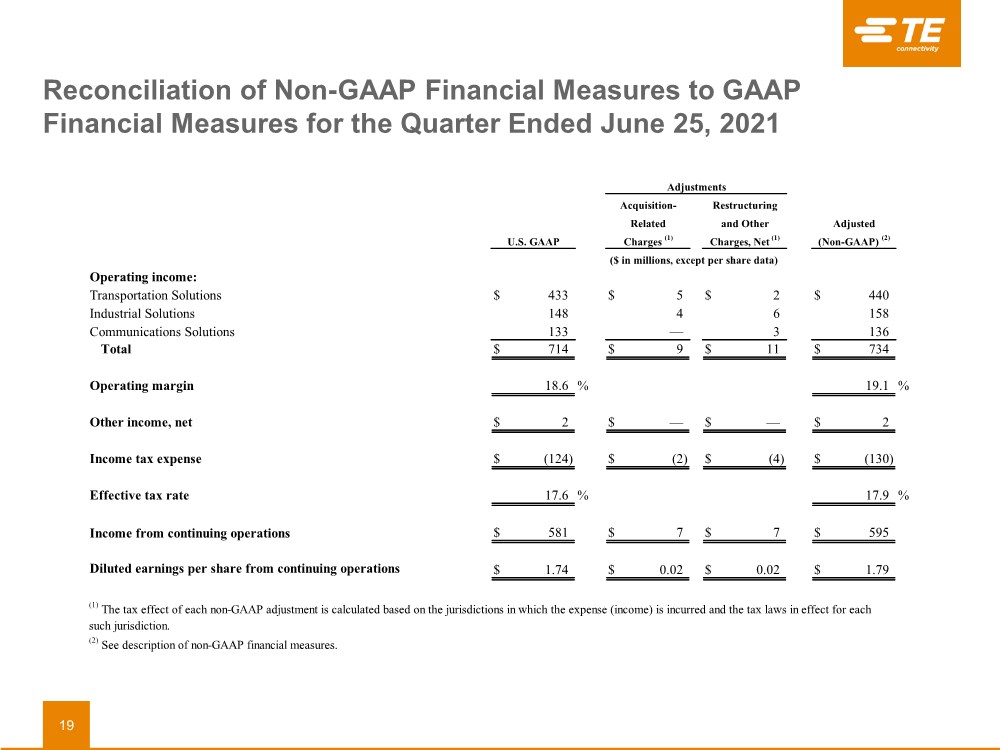
RECONCILIATION OF NON-GAAP FINANCIAL MEASURES TO GAAP FINANCIAL MEASURES
For the Quarter Ended June 25, 2021
(UNAUDITED)
| | | | | Adjustments | | | | | ||||
| | | | Acquisition- | | Restructuring | | | | ||||
| | | | Related | | and Other | | Adjusted | | ||||
| U.S. GAAP | | | Charges (1) | | Charges, Net (1) | | (Non-GAAP) (2) | | ||||
| ($ in millions, except per share data) | | |||||||||||
Operating income: | | | | | | | | | | | | | |
Transportation Solutions | $ | 433 | | | $ | 5 | | $ | 2 | | $ | 440 | |
Industrial Solutions | | 148 | | | | 4 | | | 6 | | | 158 | |
Communications Solutions | | 133 | | | | — | | | 3 | | | 136 | |
Total | $ | 714 | | | $ | 9 | | $ | 11 | | $ | 734 | |
| | | | | | | | | | | | | |
Operating margin | | 18.6 | % | | | | | | | | | 19.1 | % |
| | | | | | | | | | | | | |
Other income, net | $ | 2 | | | $ | — | | $ | — | | $ | 2 | |
| | | | | | | | | | | | | |
Income tax expense | $ | (124) | | | $ | (2) | | $ | (4) | | $ | (130) | |
| | | | | | | | | | | | | |
Effective tax rate | | 17.6 | % | | | | | | | | | 17.9 | % |
| | | | | | | | | | | | | |
Income from continuing operations | $ | 581 | | | $ | 7 | | $ | 7 | | $ | 595 | |
| | | | | | | | | | | | | |
Diluted earnings per share from continuing operations | $ | 1.74 | | | $ | 0.02 | | $ | 0.02 | | $ | 1.79 | |
| | | | | | | | | | | | | |
(1) The tax effect of each non-GAAP adjustment is calculated based on the jurisdictions in which the expense (income) is incurred and the tax laws in effect for each such jurisdiction. | | ||||||||||||
(2) See description of non-GAAP financial measures. | | ||||||||||||
TE CONNECTIVITY LTD.
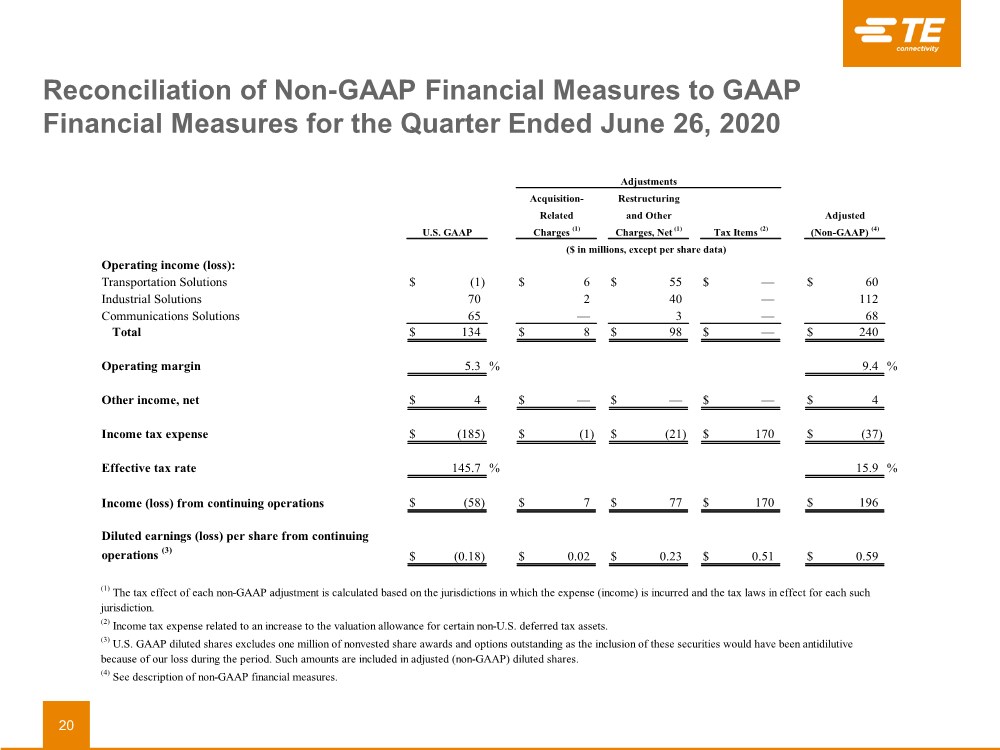
RECONCILIATION OF NON-GAAP FINANCIAL MEASURES TO GAAP FINANCIAL MEASURES
For the Quarter Ended June 26, 2020
(UNAUDITED)
| | | | | Adjustments | | | | | |||||||
| | | | Acquisition- | | Restructuring | | | | | | |||||
| | | | Related | | and Other | | | | Adjusted | | |||||
| U.S. GAAP | | | Charges (1) | | Charges, Net (1) | | Tax Items (2) | | (Non-GAAP) (4) | | |||||
| ($ in millions, except per share data) | | ||||||||||||||
Operating income (loss): | | | | | | | | | | | | | | | | |
Transportation Solutions | $ | (1) | | | $ | 6 | | $ | 55 | | $ | — | | $ | 60 | |
Industrial Solutions | | 70 | | | | 2 | | | 40 | | | — | | | 112 | |
Communications Solutions | | 65 | | | | — | | | 3 | | | — | | | 68 | |
Total | $ | 134 | | | $ | 8 | | $ | 98 | | $ | — | | $ | 240 | |
| | | | | | | | | | | | | | | | |
Operating margin | | 5.3 | % | | | | | | | | | | | | 9.4 | % |
| | | | | | | | | | | | | | | | |
Other income, net | $ | 4 | | | $ | — | | $ | — | | $ | — | | $ | 4 | |
| | | | | | | | | | | | | | | | |
Income tax expense | $ | (185) | | | $ | (1) | | $ | (21) | | $ | 170 | | $ | (37) | |
| | | | | | | | | | | | | | | | |
Effective tax rate | | 145.7 | % | | | | | | | | | | | | 15.9 | % |
| | | | | | | | | | | | | | | | |
Income (loss) from continuing operations | $ | (58) | | | $ | 7 | | $ | 77 | | $ | 170 | | $ | 196 | |
| | | | | | | | | | | | | | | | |
Diluted earnings (loss) per share from continuing operations (3) | $ | (0.18) | | | $ | 0.02 | | $ | 0.23 | | $ | 0.51 | | $ | 0.59 | |
| | | | | | | | | | | | | | | | |
(1) The tax effect of each non-GAAP adjustment is calculated based on the jurisdictions in which the expense (income) is incurred and the tax laws in effect for each such jurisdiction. | | |||||||||||||||
(2) Income tax expense related to an increase to the valuation allowance for certain non-U.S. deferred tax assets. | | |||||||||||||||
(3) U.S. GAAP diluted shares excludes one million of nonvested share awards and options outstanding as the inclusion of these securities would have been antidilutive because of our loss during the period. Such amounts are included in adjusted (non-GAAP) diluted shares. | | |||||||||||||||
(4) See description of non-GAAP financial measures. | | |||||||||||||||
TE CONNECTIVITY LTD.
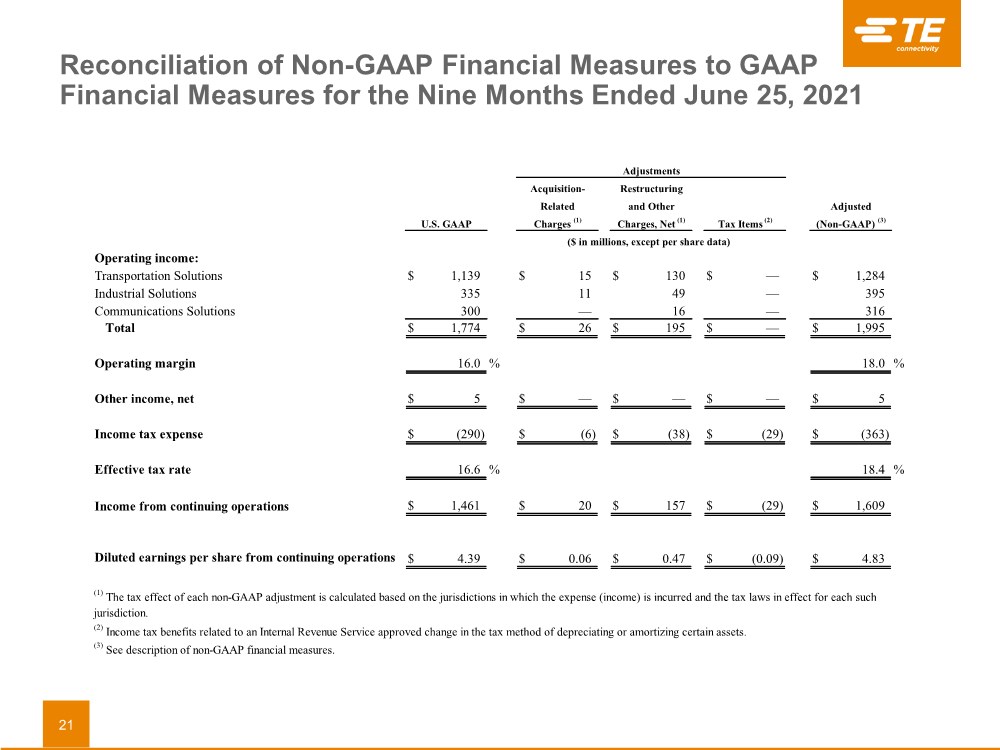
RECONCILIATION OF NON-GAAP FINANCIAL MEASURES TO GAAP FINANCIAL MEASURES
For the Nine Months Ended June 25, 2021
(UNAUDITED)
| | | | | Adjustments | | | | | |||||||
| | | | Acquisition- | | Restructuring | | | | | | |||||
| | | | Related | | and Other | | | | Adjusted | | |||||
| U.S. GAAP | | | Charges (1) | | Charges, Net (1) | | Tax Items (2) | | (Non-GAAP) (3) | | |||||
| ($ in millions, except per share data) | | ||||||||||||||
Operating income: | | | | | | | | | | | | | | | | |
Transportation Solutions | $ | 1,139 | | | $ | 15 | | $ | 130 | | $ | — | | $ | 1,284 | |
Industrial Solutions | | 335 | | | | 11 | | | 49 | | | — | | | 395 | |
Communications Solutions | | 300 | | | | — | | | 16 | | | — | | | 316 | |
Total | $ | 1,774 | | | $ | 26 | | $ | 195 | | $ | — | | $ | 1,995 | |
| | | | | | | | | | | | | | | | |
Operating margin | | 16.0 | % | | | | | | | | | | | | 18.0 | % |
| | | | | | | | | | | | | | | | |
Other income, net | $ | 5 | | | $ | — | | $ | — | | $ | — | | $ | 5 | |
| | | | | | | | | | | | | | | | |
Income tax expense | $ | (290) | | | $ | (6) | | $ | (38) | | $ | (29) | | $ | (363) | |
| | | | | | | | | | | | | | | | |
Effective tax rate | | 16.6 | % | | | | | | | | | | | | 18.4 | % |
| | | | | | | | | | | | | | | | |
Income from continuing operations | $ | 1,461 | | | $ | 20 | | $ | 157 | | $ | (29) | | $ | 1,609 | |
| | | | | | | | | | | | | | | | |
Diluted earnings per share from continuing operations | $ | 4.39 | | | $ | 0.06 | | $ | 0.47 | | $ | (0.09) | | $ | 4.83 | |
| | | | | | | | | | | | | | | | |
(1) The tax effect of each non-GAAP adjustment is calculated based on the jurisdictions in which the expense (income) is incurred and the tax laws in effect for each such jurisdiction. | | |||||||||||||||
(2) Income tax benefits related to an Internal Revenue Service approved change in the tax method of depreciating or amortizing certain assets. | | |||||||||||||||
(3) See description of non-GAAP financial measures. | | |||||||||||||||
TE CONNECTIVITY LTD.
RECONCILIATION OF NON-GAAP FINANCIAL MEASURES TO GAAP FINANCIAL MEASURES
For the Nine Months Ended June 26, 2020
(UNAUDITED)
| | | | | Adjustments | | | | | ||||||||||
| | | | Acquisition- | | Restructuring | | | | | | | | ||||||
| | | | Related | | and Other | | Impairment | | | | Adjusted | | ||||||
| U.S. GAAP | | | Charges (1) | | Charges, Net (1) | | of Goodwill (1) | | Tax Items (2) | | (Non-GAAP) (4) | | ||||||
| ($ in millions, except per share data) | | |||||||||||||||||
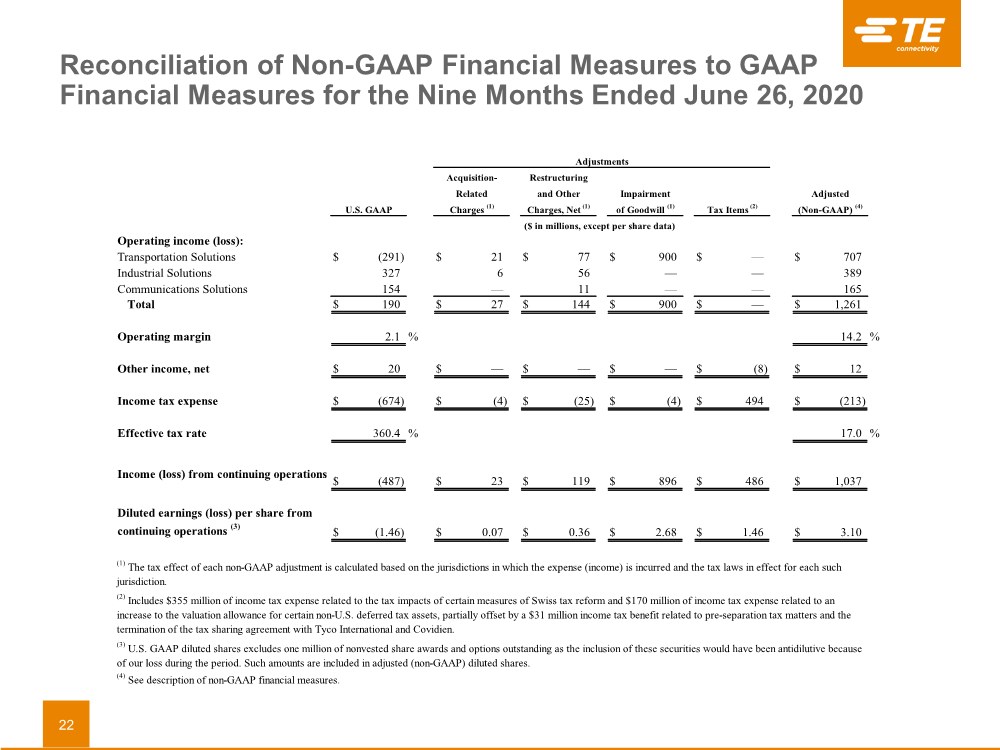
Operating income (loss): | | | | | | | | | | | | | | | | | | | |
Transportation Solutions | $ | (291) | | | $ | 21 | | $ | 77 | | $ | 900 | | $ | — | | $ | 707 | |
Industrial Solutions | | 327 | | | | 6 | | | 56 | | | — | | | — | | | 389 | |
Communications Solutions | | 154 | | | | — | | | 11 | | | — | | | — | | | 165 | |
Total | $ | 190 | | | $ | 27 | | $ | 144 | | $ | 900 | | $ | — | | $ | 1,261 | |
| | | | | | | | | | | | | | | | | | | |
Operating margin | | 2.1 | % | | | | | | | | | | | | | | | 14.2 | % |
| | | | | | | | | | | | | | | | | | | |
Other income, net | $ | 20 | | | $ | — | | $ | — | | $ | — | | $ | (8) | | $ | 12 | |
| | | | | | | | | | | | | | | | | | | |
Income tax expense | $ | (674) | | | $ | (4) | | $ | (25) | | $ | (4) | | $ | 494 | | $ | (213) | |
| | | | | | | | | | | | | | | | | | | |
Effective tax rate | | 360.4 | % | | | | | | | | | | | | | | | 17.0 | % |
| | | | | | | | | | | | | | | | | | | |
Income (loss) from continuing operations | $ | (487) | | | $ | 23 | | $ | 119 | | $ | 896 | | $ | 486 | | $ | 1,037 | |
| | | | | | | | | | | | | | | | | | | |
Diluted earnings (loss) per share from continuing operations (3) | $ | (1.46) | | | $ | 0.07 | | $ | 0.36 | | $ | 2.68 | | $ | 1.46 | | $ | 3.10 | |
| | | | | | | | | | | | | | | | | | | |
(1) The tax effect of each non-GAAP adjustment is calculated based on the jurisdictions in which the expense (income) is incurred and the tax laws in effect for each such jurisdiction. | | ||||||||||||||||||
(2) Includes $355 million of income tax expense related to the tax impacts of certain measures of Swiss tax reform and $170 million of income tax expense related to an increase to the valuation allowance for certain non-U.S. deferred tax assets, partially offset by a $31 million income tax benefit related to pre-separation tax matters and the termination of the tax sharing agreement with Tyco International and Covidien. | | ||||||||||||||||||
(3) U.S. GAAP diluted shares excludes one million of nonvested share awards and options outstanding as the inclusion of these securities would have been antidilutive because of our loss during the period. Such amounts are included in adjusted (non-GAAP) diluted shares. | | ||||||||||||||||||
(4) See description of non-GAAP financial measures. | | ||||||||||||||||||
TE CONNECTIVITY LTD.
RECONCILIATION OF NON-GAAP FINANCIAL MEASURES TO GAAP FINANCIAL MEASURES
For the Quarter Ended September 25, 2020
(UNAUDITED)
| | | | | Adjustments | | | | | |||||||
| | | | Acquisition- | | Restructuring | | | | | | |||||
| | | | Related | | and Other | | | | Adjusted | | |||||
| U.S. GAAP | | | Charges (1) | | Charges, Net (1) | | Tax Items (2) | | (Non-GAAP) (3) | | |||||
| ($ in millions, except per share data) | | ||||||||||||||
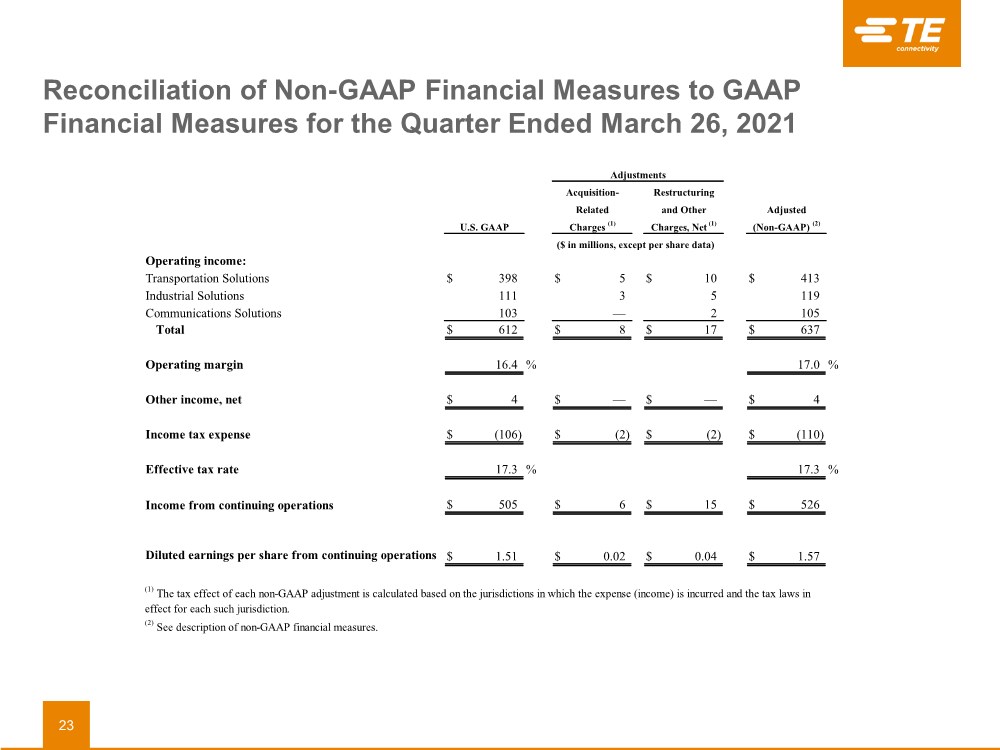
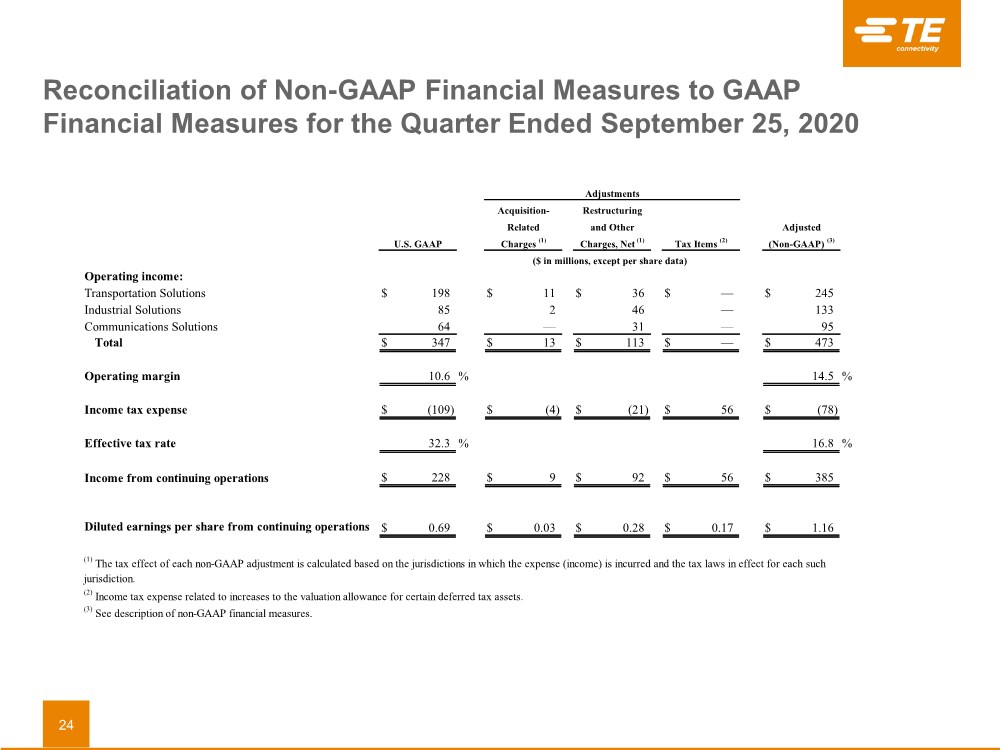
Operating income: | | | | | | | | | | | | | | | | |
Transportation Solutions | $ | 198 | | | $ | 11 | | $ | 36 | | $ | — | | $ | 245 | |
Industrial Solutions | | 85 | | | | 2 | | | 46 | | | — | | | 133 | |
Communications Solutions | | 64 | | | | — | | | 31 | | | — | | | 95 | |
Total | $ | 347 | | | $ | 13 | | $ | 113 | | $ | — | | $ | 473 | |
| | | | | | | | | | | | | | | | |
Operating margin | | 10.6 | % | | | | | | | | | | | | 14.5 | % |
| | | | | | | | | | | | | | | | |
Income tax expense | $ | (109) | | | $ | (4) | | $ | (21) | | $ | 56 | | $ | (78) | |
| | | | | | | | | | | | | | | | |
Effective tax rate | | 32.3 | % | | | | | | | | | | | | 16.8 | % |
| | | | | | | | | | | | | | | | |
Income from continuing operations | $ | 228 | | | $ | 9 | | $ | 92 | | $ | 56 | | $ | 385 | |
| | | | | | | | | | | | | | | | |
Diluted earnings per share from continuing operations | $ | 0.69 | | | $ | 0.03 | | $ | 0.28 | | $ | 0.17 | | $ | 1.16 | |
| | | | | | | | | | | | | | | | |
(1) The tax effect of each non-GAAP adjustment is calculated based on the jurisdictions in which the expense (income) is incurred and the tax laws in effect for each such jurisdiction. | | |||||||||||||||
(2) Income tax expense related to increases to the valuation allowance for certain deferred tax assets. | | |||||||||||||||
(3) See description of non-GAAP financial measures. | | |||||||||||||||
TE CONNECTIVITY LTD.
RECONCILIATION OF NON-GAAP FINANCIAL MEASURES TO GAAP FINANCIAL MEASURES
For the Year Ended September 25, 2020
(UNAUDITED)
| | | | | Adjustments | | | | | ||||||||||
| | | | Acquisition- | | Restructuring | | | | | | | | ||||||
| | | | Related | | and Other | | Impairment | | | | Adjusted | | ||||||
| U.S. GAAP | | | Charges (1) | | Charges, Net (1) | | of Goodwill (1) | | Tax Items (2) | | (Non-GAAP) (4) | | ||||||
| ($ in millions, except per share data) | | |||||||||||||||||
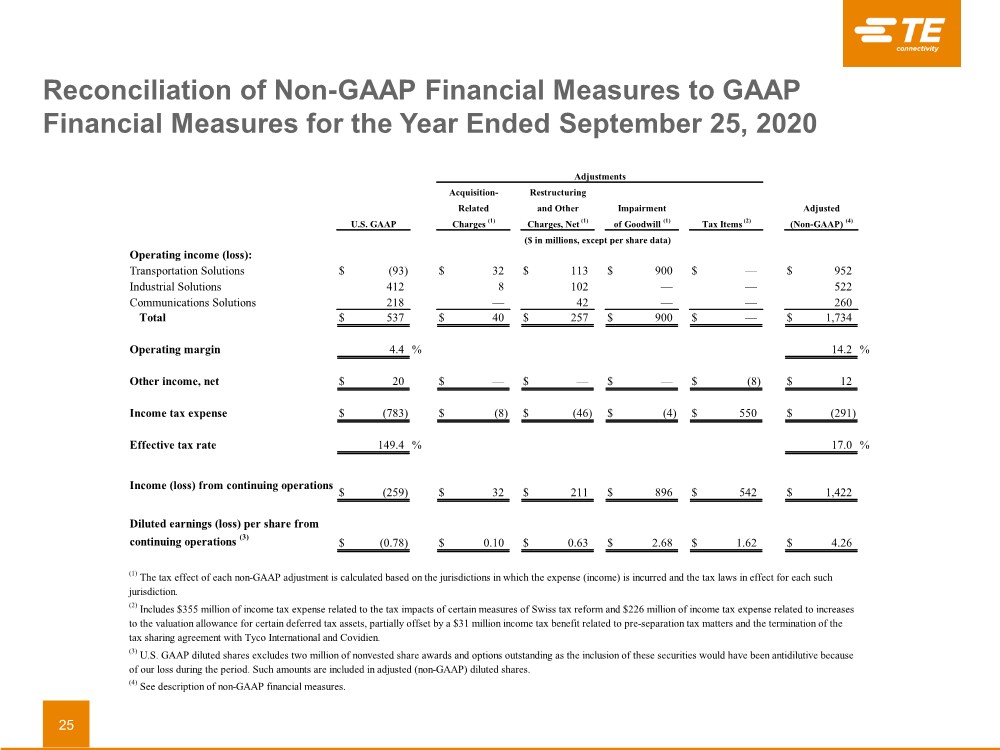
Operating income (loss): | | | | | | | | | | | | | | | | | | | |
Transportation Solutions | $ | (93) | | | $ | 32 | | $ | 113 | | $ | 900 | | $ | — | | $ | 952 | |
Industrial Solutions | | 412 | | | | 8 | | | 102 | | | — | | | — | | | 522 | |
Communications Solutions | | 218 | | | | — | | | 42 | | | — | | | — | | | 260 | |
Total | $ | 537 | | | $ | 40 | | $ | 257 | | $ | 900 | | $ | — | | $ | 1,734 | |
| | | | | | | | | | | | | | | | | | | |
Operating margin | | 4.4 | % | | | | | | | | | | | | | | | 14.2 | % |
| | | | | | | | | | | | | | | | | | | |
Other income, net | $ | 20 | | | $ | — | | $ | — | | $ | — | | $ | (8) | | $ | 12 | |
| | | | | | | | | | | | | | | | | | | |
Income tax expense | $ | (783) | | | $ | (8) | | $ | (46) | | $ | (4) | | $ | 550 | | $ | (291) | |
| | | | | | | | | | | | | | | | | | | |
Effective tax rate | | 149.4 | % | | | | | | | | | | | | | | | 17.0 | % |
| | | | | | | | | | | | | | | | | | | |
Income (loss) from continuing operations | $ | (259) | | | $ | 32 | | $ | 211 | | $ | 896 | | $ | 542 | | $ | 1,422 | |
| | | | | | | | | | | | | | | | | | | |
Diluted earnings (loss) per share from continuing operations (3) | $ | (0.78) | | | $ | 0.10 | | $ | 0.63 | | $ | 2.68 | | $ | 1.62 | | $ | 4.26 | |
| | | | | | | | | | | | | | | | | | | |
(1) The tax effect of each non-GAAP adjustment is calculated based on the jurisdictions in which the expense (income) is incurred and the tax laws in effect for each such jurisdiction. | | ||||||||||||||||||
(2) Includes $355 million of income tax expense related to the tax impacts of certain measures of Swiss tax reform and $226 million of income tax expense related to increases to the valuation allowance for certain deferred tax assets, partially offset by a $31 million income tax benefit related to pre-separation tax matters and the termination of the tax sharing agreement with Tyco International and Covidien. | | ||||||||||||||||||
(3) U.S. GAAP diluted shares excludes two million of nonvested share awards and options outstanding as the inclusion of these securities would have been antidilutive because of our loss during the period. Such amounts are included in adjusted (non-GAAP) diluted shares. | | ||||||||||||||||||
(4) See description of non-GAAP financial measures. | | ||||||||||||||||||
TE CONNECTIVITY LTD.
RECONCILIATION OF FORWARD-LOOKING NON-GAAP FINANCIAL MEASURES
TO FORWARD-LOOKING GAAP FINANCIAL MEASURES
As of July 28, 2021
(UNAUDITED)
| Outlook for | | | | | ||
| Quarter Ending | | | | | ||
| September 24, | | | Outlook for | | ||
| 2021 | | | Fiscal 2021 | | ||
Diluted earnings per share from continuing operations | $ | 1.55 | | | $ | 5.94 | |
Restructuring and other charges, net | | 0.08 | | | | 0.54 | |
Acquisition-related charges | | 0.02 | | | | 0.08 | |
Tax items | | — | | | | (0.09) | |
Adjusted diluted earnings per share from continuing operations (1) | $ | 1.65 | | | $ | 6.47 | |
| | | | | | | |
| | | | | | | |
Net sales growth | | 16.5 | % | | | 22.4 | % |
Translation | | (2.5) | | | | (2.6) | |
(Acquisitions) divestitures, net | | 0.2 | | | | (2.0) | |
Organic net sales growth (1) | | 14.2 | % | | | 17.8 | % |
| | | | | | | |
(1) See description of non-GAAP financial measures. | | ||||||
Exhibit 99.2
| EVERY CONNECTION COUNTS TE Connectivity Third Quarter 2021 Earnings July 28, 2021 |

| Forward-Looking Statements This presentation contains certain "forward-looking statements" within the meaning of the U.S. Private Securities Litigation Reform Act of 1995. These statements are based on management's current expectations and are subject to risks, uncertainty and changes in circumstances, which may cause actual results, performance, financial condition or achievements to differ materially from anticipated results, performance, financial condition or achievements. All statements contained herein that are not clearly historical in nature are forward-looking and the words "anticipate," "believe," "expect," "estimate," "plan," and similar expressions are generally intended to identify forward-looking statements. We have no intention and are under no obligation to update or alter (and expressly disclaim any such intention or obligation to do so) our forward-looking statements whether as a result of new information, future events or otherwise, except to the extent required by law. The forward-looking statements in this presentation include statements addressing our future financial condition and operating results, and the impact on our operations resulting from the coronavirus disease 2019 (“COVID-19”). Examples of factors that could cause actual results to differ materially from those described in the forward-looking statements include, among others, the extent, severity and duration of COVID- 19 negatively affecting our business operations; business, economic, competitive and regulatory risks, such as conditions affecting demand for products in the automotive and other industries we serve; competition and pricing pressure; fluctuations in foreign currency exchange rates and commodity prices; natural disasters and political, economic and military instability in countries in which we operate; developments in the credit markets; future goodwill impairment; compliance with current and future environmental and other laws and regulations; and the possible effects on us of changes in tax laws, tax treaties and other legislation, including the effects of Swiss tax reform. In addition, the extent to which COVID-19 will impact our business and our financial results will depend on future developments, which are highly uncertain and cannot be predicted. Such developments may include the geographic spread of the virus, the severity of the virus, the duration of the outbreak, the impact on our suppliers’ and customers’ supply chains, the actions that may be taken by various governmental authorities in response to the outbreak in jurisdictions in which we operate, and the possible impact on the global economy and local economies in which we operate. More detailed information about these and other factors is set forth in TE Connectivity Ltd.'s Annual Report on Form 10-K for the fiscal year ended Sept. 25, 2020 as well as in our Quarterly Reports on Form 10-Q, Current Reports on Form 8-K and other reports filed by us with the U.S. Securities and Exchange Commission. Non-GAAP Financial Measures Where we have used non-GAAP financial measures, reconciliations to the most comparable GAAP measure are provided, along with a disclosure on the usefulness of the non-GAAP financial measure, in this presentation. Forward-Looking Statements and Non-GAAP Financial Measures 2 |
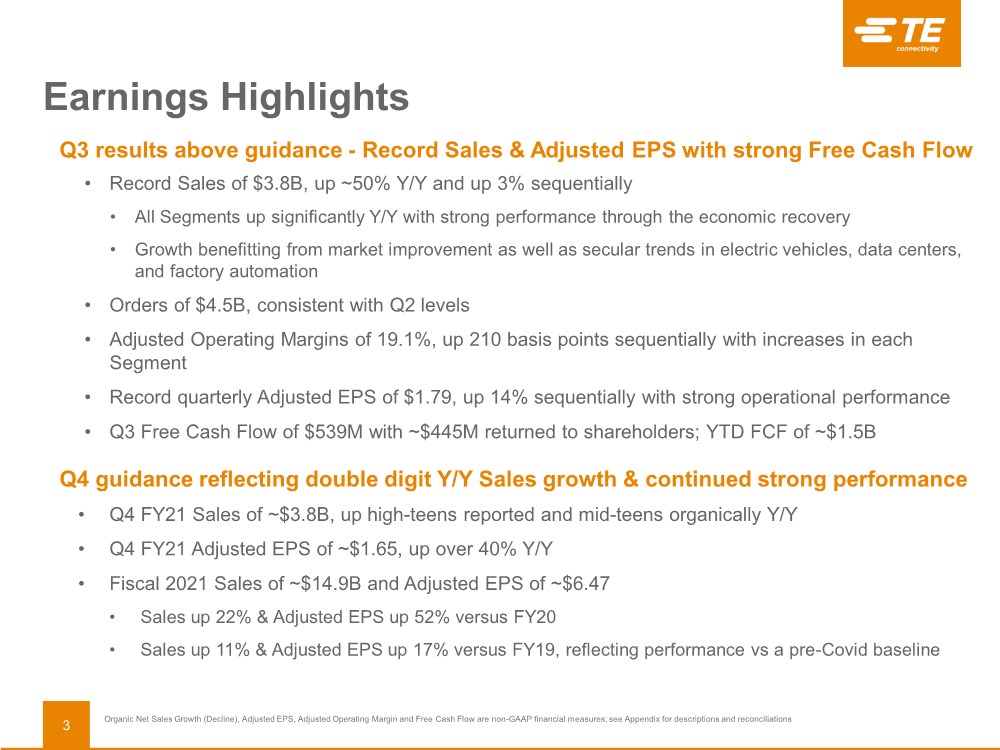
| Earnings Highlights Q3 results above guidance - Record Sales & Adjusted EPS with strong Free Cash Flow • Record Sales of $3.8B, up ~50% Y/Y and up 3% sequentially • All Segments up significantly Y/Y with strong performance through the economic recovery • Growth benefitting from market improvement as well as secular trends in electric vehicles, data centers, and factory automation • Orders of $4.5B, consistent with Q2 levels • Adjusted Operating Margins of 19.1%, up 210 basis points sequentially with increases in each Segment • Record quarterly Adjusted EPS of $1.79, up 14% sequentially with strong operational performance • Q3 Free Cash Flow of $539M with ~$445M returned to shareholders; YTD FCF of ~$1.5B Q4 guidance reflecting double digit Y/Y Sales growth & continued strong performance • Q4 FY21 Sales of ~$3.8B, up high-teens reported and mid-teens organically Y/Y • Q4 FY21 Adjusted EPS of ~$1.65, up over 40% Y/Y • Fiscal 2021 Sales of ~$14.9B and Adjusted EPS of ~$6.47 • Sales up 22% & Adjusted EPS up 52% versus FY20 • Sales up 11% & Adjusted EPS up 17% versus FY19, reflecting performance vs a pre-Covid baseline Organic Net Sales Growth (Decline), Adjusted EPS, Adjusted Operating Margin and Free Cash Flow are non-GAAP financial measures; see Appendix for descriptions and reconciliations 3 |
| Reported FY20 FY21 FY21 Q3 Growth Q3 Q2 Q3 Y/Y Q/Q Transportation 1,178 2,766 2,562 118% (7)% Industrial 824 1,126 1,218 48% 8% Communications 384 678 755 97% 11% Total TE 2,386 4,570 4,535 90% (1)% Book to Bill 0.94 1.22 1.18 Segment Orders Summary ($ in millions) 4 • Y/Y orders growth in all businesses and regions • Transportation orders remain elevated due to market recovery and industry supply chain dynamics • Industrial Segment sequential growth in Industrial Equipment, Energy and Medical, with stabilization in AD&M • Communications sequential growth driven by strength in Data & Devices Order Levels Continue to Reflect Economic Recovery and Supply Chain Dynamics |

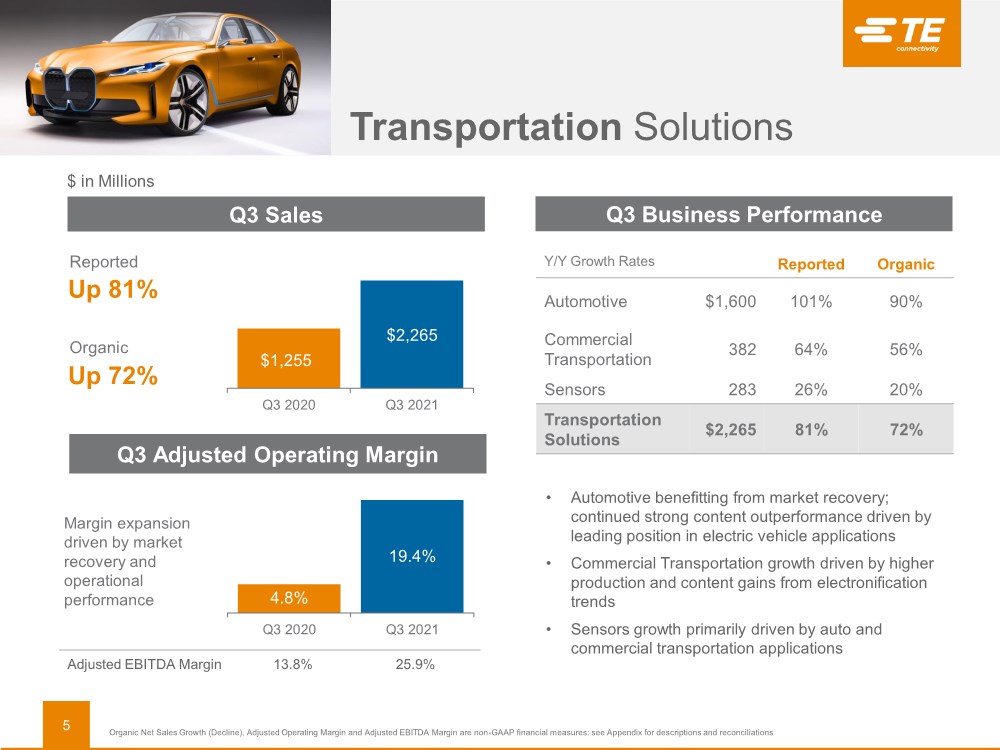
| Transportation Solutions $1,255 $2,265 Q3 2020 Q3 2021 • Automotive benefitting from market recovery; continued strong content outperformance driven by leading position in electric vehicle applications • Commercial Transportation growth driven by higher production and content gains from electronification trends • Sensors growth primarily driven by auto and commercial transportation applications Y/Y Growth Rates Reported Organic Automotive $1,600 101% 90% Commercial Transportation 382 64% 56% Sensors 283 26% 20% Transportation Solutions $2,265 81% 72% Q3 Sales Q3 Business Performance Q3 Adjusted Operating Margin $ in Millions Reported Up 81% Organic Up 72% Margin expansion driven by market recovery and operational performance Adjusted EBITDA Margin 13.8% 25.9% 5 4.8% 19.4% Q3 2020 Q3 2021 Organic Net Sales Growth (Decline), Adjusted Operating Margin and Adjusted EBITDA Margin are non-GAAP financial measures: see Appendix for descriptions and reconciliations |
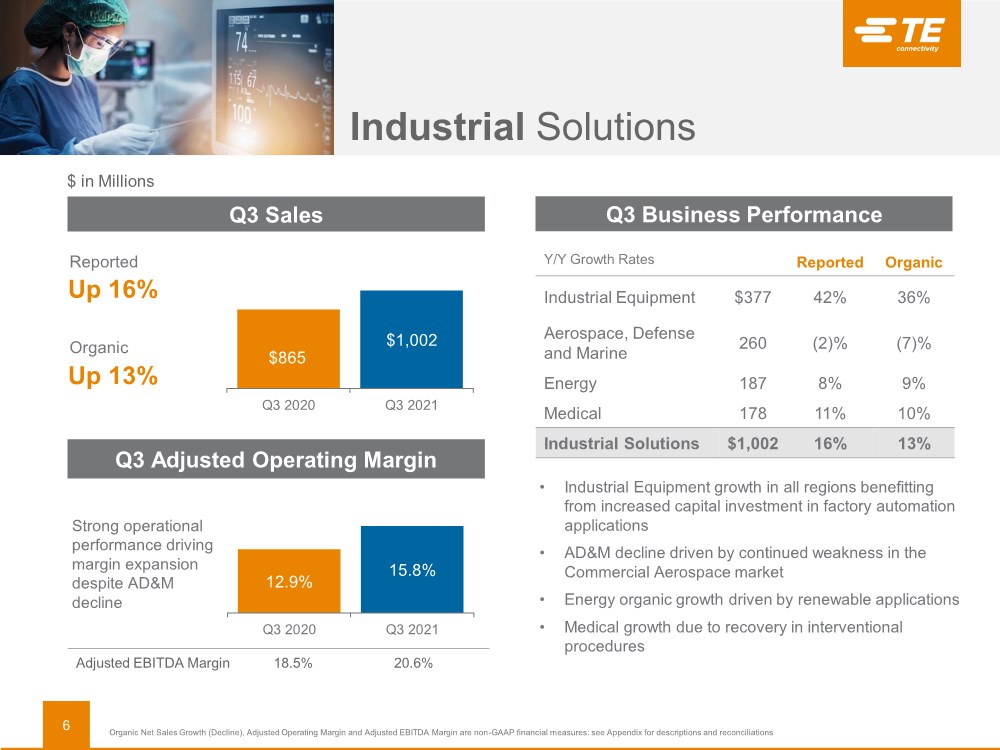
| Industrial Solutions $865 $1,002 Q3 2020 Q3 2021 Y/Y Growth Rates Reported Organic Industrial Equipment $377 42% 36% Aerospace, Defense and Marine 260 (2)% (7)% Energy 187 8% 9% Medical 178 11% 10% Industrial Solutions $1,002 16% 13% Strong operational performance driving margin expansion despite AD&M decline 12.9% 15.8% Q3 2020 Q3 2021 Adjusted EBITDA Margin 18.5% 20.6% • Industrial Equipment growth in all regions benefitting from increased capital investment in factory automation applications • AD&M decline driven by continued weakness in the Commercial Aerospace market • Energy organic growth driven by renewable applications • Medical growth due to recovery in interventional procedures $ in Millions Q3 Sales Q3 Business Performance Q3 Adjusted Operating Margin Reported Up 16% Organic Up 13% 6 Organic Net Sales Growth (Decline), Adjusted Operating Margin and Adjusted EBITDA Margin are non-GAAP financial measures: see Appendix for descriptions and reconciliations |
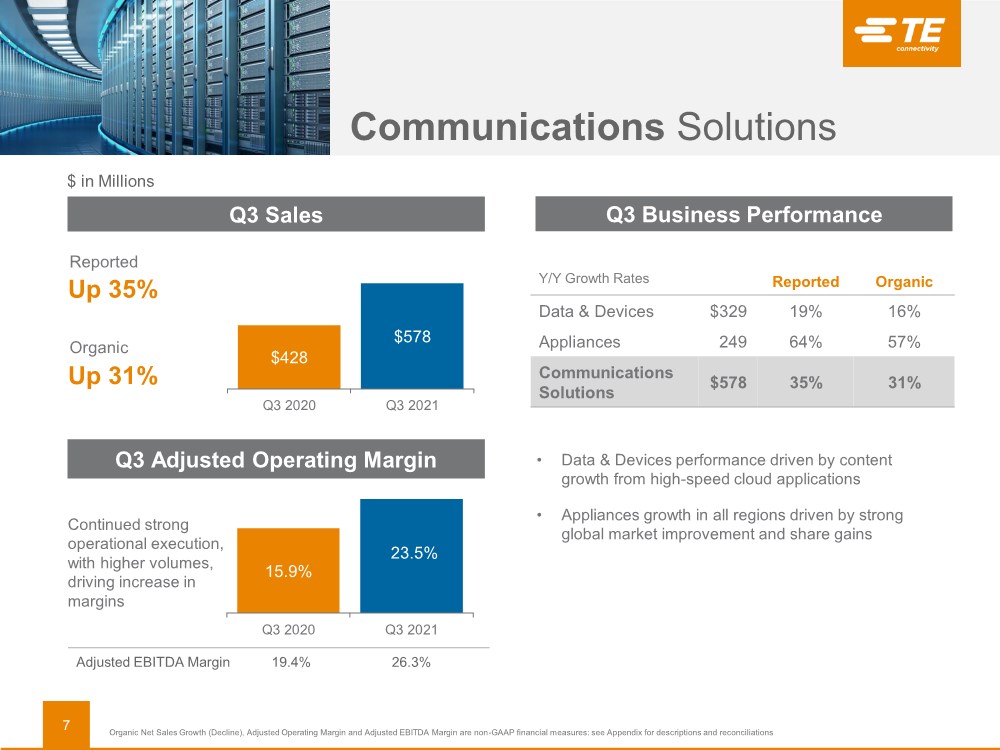
| $428 $578 Q3 2020 Q3 2021 Reported Up 35% Organic Up 31% Y/Y Growth Rates Reported Organic Data & Devices $329 19% 16% Appliances 249 64% 57% Communications Solutions $578 35% 31% •Data & Devices performance driven by content growth from high-speed cloud applications • Appliances growth in all regions driven by strong global market improvement and share gains 15.9% 23.5% Q3 2020 Q3 2021 Continued strong operational execution, with higher volumes, driving increase in margins Organic Net Sales Growth (Decline), Adjusted Operating Margin and Adjusted EBITDA Margin are non-GAAP financial measures: see Appendix for descriptions and reconciliations Communications Solutions Q3 Sales Q3 Adjusted Operating Margin Q3 Business Performance $ in Millions Adjusted EBITDA Margin 19.4% 26.3% 7 |
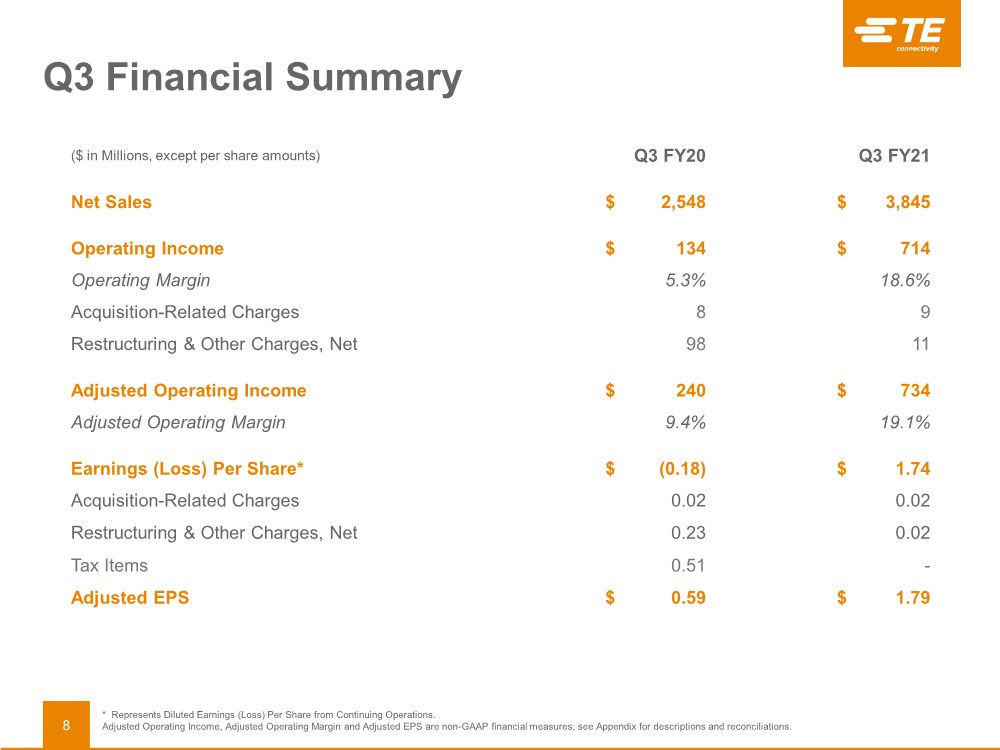
| Q3 Financial Summary ($ in Millions, except per share amounts) Q3 FY20 Q3 FY21 Net Sales $ 2,548 $ 3,845 Operating Income $ 134 $ 714 Operating Margin 5.3% 18.6% Acquisition-Related Charges 8 9 Restructuring & Other Charges, Net 98 11 Adjusted Operating Income $ 240 $ 734 Adjusted Operating Margin 9.4% 19.1% Earnings (Loss) Per Share* $ (0.18) $ 1.74 Acquisition-Related Charges 0.02 0.02 Restructuring & Other Charges, Net 0.23 0.02 Tax Items 0.51 - Adjusted EPS $ 0.59 $ 1.79 * Represents Diluted Earnings (Loss) Per Share from Continuing Operations. Adjusted Operating Income, Adjusted Operating Margin and Adjusted EPS are non-GAAP financial measures; see Appendix for descriptions and reconciliations. 8 |
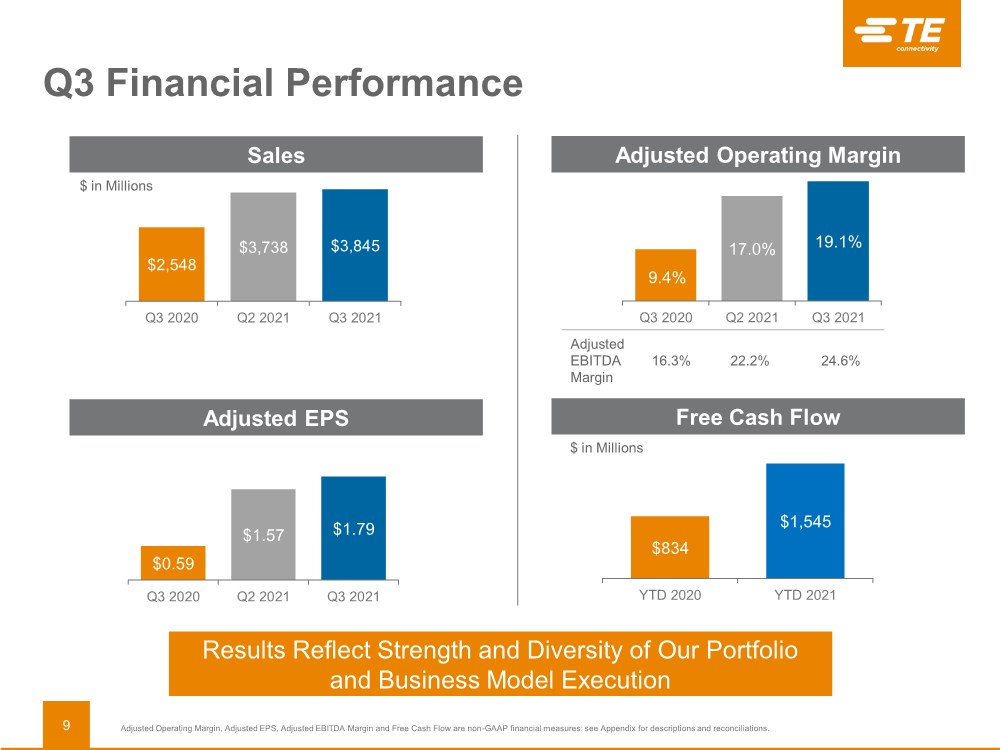
| Q3 Financial Performance $2,548 $3,738 $3,845 Q3 2020 Q2 2021 Q3 2021 $0.59 $1.57 $1.79 Q3 2020 Q2 2021 Q3 2021 Adjusted EBITDA Margin 16.3% 22.2% 24.6% 9.4% 17.0% 19.1% Q3 2020 Q2 2021 Q3 2021 Adjusted Operating Margin, Adjusted EPS, Adjusted EBITDA Margin and Free Cash Flow are non-GAAP financial measures: see Appendix for descriptions and reconciliations. Sales Adjusted Operating Margin Free Cash Flow Adjusted EPS Results Reflect Strength and Diversity of Our Portfolio and Business Model Execution 9 $834 $1,545 YTD 2020 YTD 2021 $ in Millions $ in Millions |
| EVERY CONNECTION COUNTS Additional Information |

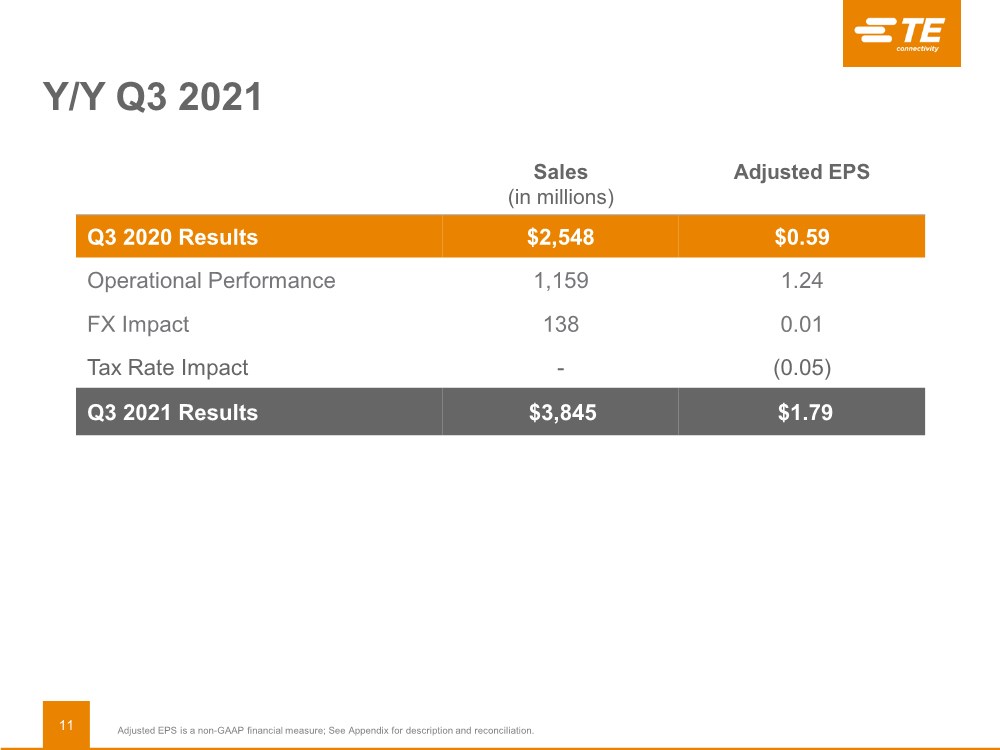
| Y/Y Q3 2021 Adjusted EPS is a non-GAAP financial measure; See Appendix for description and reconciliation. Sales (in millions) Adjusted EPS Q3 2020 Results $2,548 $0.59 Operational Performance 1,159 1.24 FX Impact 138 0.01 Tax Rate Impact -(0.05) Q3 2021 Results $3,845 $1.79 11 |
| Y/Y Q4 2021 Adjusted EPS is a non-GAAP financial measure; See Appendix for description and reconciliation. Sales (in millions) Adjusted EPS Q4 2020 Results $3,261 $1.16 Operational Performance 457 0.52 FX Impact 82 0.03 Tax Rate Impact -(0.06) Q4 2021 Guidance $3,800 $1.65 12 |

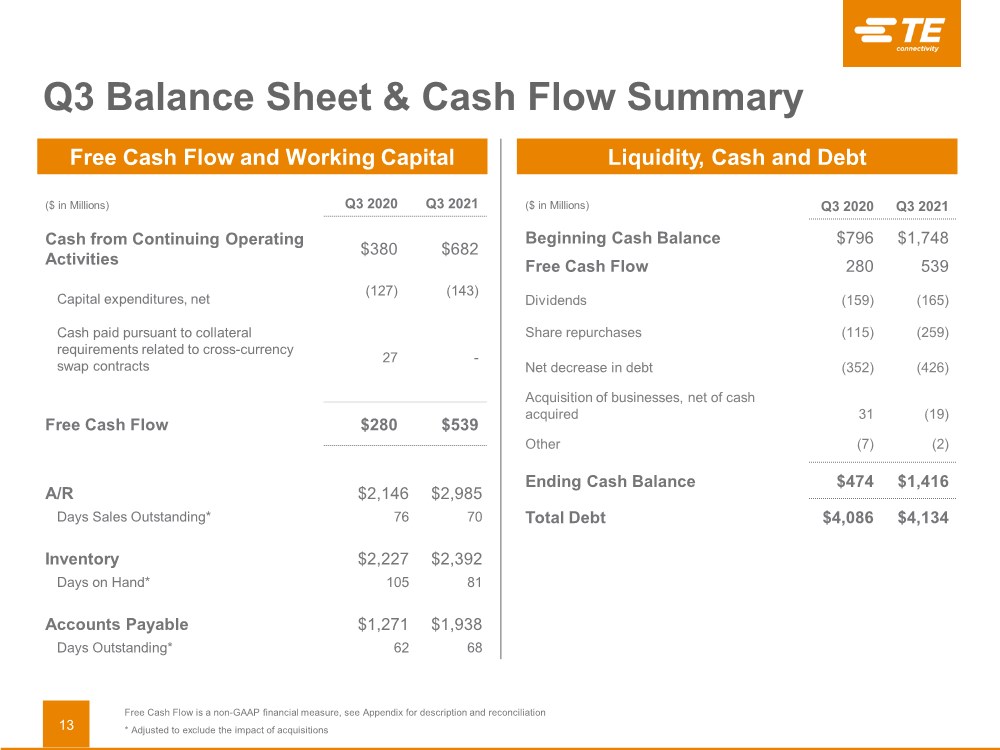
| ($ in Millions) Q3 2020 Q3 2021 Beginning Cash Balance $796 $1,748 Free Cash Flow 280 539 Dividends (159) (165) Share repurchases (115) (259) Net decrease in debt (352) (426) Acquisition of businesses, net of cash acquired 31 (19) Other (7) (2) Ending Cash Balance $474 $1,416 Total Debt $4,086 $4,134 A/R $2,146 $2,985 Days Sales Outstanding* 76 70 Inventory $2,227 $2,392 Days on Hand* 105 81 Accounts Payable $1,271 $1,938 Days Outstanding* 62 68 Free Cash Flow and Working Capital Liquidity, Cash and Debt ($ in Millions) Q3 2020 Q3 2021 Cash from Continuing Operating Activities $380 $682 Capital expenditures, net (127) (143) Cash paid pursuant to collateral requirements related to cross-currency swap contracts 27 - Free Cash Flow $280 $539 Free Cash Flow is a non-GAAP financial measure, see Appendix for description and reconciliation * Adjusted to exclude the impact of acquisitions Q3 Balance Sheet & Cash Flow Summary 13 |
| EVERY CONNECTION COUNTS Appendix |

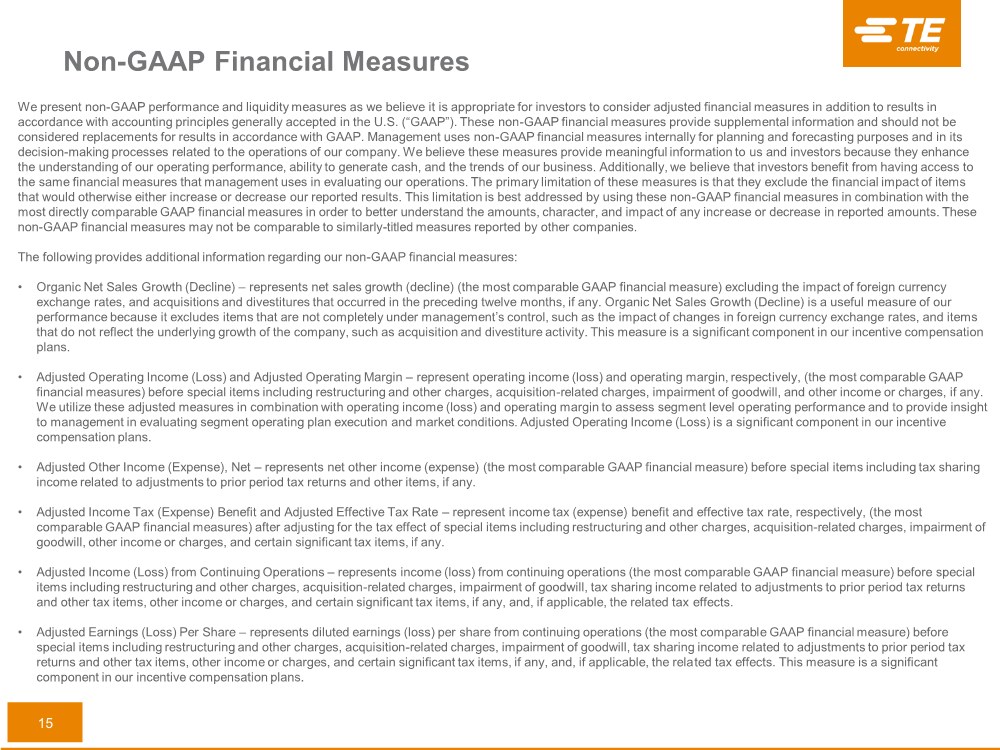
| 15 Non-GAAP Financial Measures We present non-GAAP performance and liquidity measures as we believe it is appropriate for investors to consider adjusted financial measures in addition to results in accordance with accounting principles generally accepted in the U.S. (“GAAP”). These non-GAAP financial measures provide supplemental information and should not be considered replacements for results in accordance with GAAP. Management uses non-GAAP financial measures internally for planning and forecasting purposes and in its decision-making processes related to the operations of our company. We believe these measures provide meaningful information to us and investors because they enhance the understanding of our operating performance, ability to generate cash, and the trends of our business. Additionally, we believe that investors benefit from having access to the same financial measures that management uses in evaluating our operations. The primary limitation of these measures is that they exclude the financial impact of items that would otherwise either increase or decrease our reported results. This limitation is best addressed by using these non-GAAP financial measures in combination with the most directly comparable GAAP financial measures in order to better understand the amounts, character, and impact of any increase or decrease in reported amounts. These non-GAAP financial measures may not be comparable to similarly-titled measures reported by other companies. The following provides additional information regarding our non-GAAP financial measures: • Organic Net Sales Growth (Decline) – represents net sales growth (decline) (the most comparable GAAP financial measure) excluding the impact of foreign currency exchange rates, and acquisitions and divestitures that occurred in the preceding twelve months, if any. Organic Net Sales Growth (Decline) is a useful measure of our performance because it excludes items that are not completely under management’s control, such as the impact of changes in foreign currency exchange rates, and items that do not reflect the underlying growth of the company, such as acquisition and divestiture activity. This measure is a significant component in our incentive compensation plans. • Adjusted Operating Income (Loss) and Adjusted Operating Margin – represent operating income (loss) and operating margin, respectively, (the most comparable GAAP financial measures) before special items including restructuring and other charges, acquisition-related charges, impairment of goodwill, and other income or charges, if any. We utilize these adjusted measures in combination with operating income (loss) and operating margin to assess segment level operating performance and to provide insight to management in evaluating segment operating plan execution and market conditions. Adjusted Operating Income (Loss) is a significant component in our incentive compensation plans. • Adjusted Other Income (Expense), Net – represents net other income (expense) (the most comparable GAAP financial measure) before special items including tax sharing income related to adjustments to prior period tax returns and other items, if any. • Adjusted Income Tax (Expense) Benefit and Adjusted Effective Tax Rate – represent income tax (expense) benefit and effective tax rate, respectively, (the most comparable GAAP financial measures) after adjusting for the tax effect of special items including restructuring and other charges, acquisition-related charges, impairment of goodwill, other income or charges, and certain significant tax items, if any. • Adjusted Income (Loss) from Continuing Operations – represents income (loss) from continuing operations (the most comparable GAAP financial measure) before special items including restructuring and other charges, acquisition-related charges, impairment of goodwill, tax sharing income related to adjustments to prior period tax returns and other tax items, other income or charges, and certain significant tax items, if any, and, if applicable, the related tax effects. • Adjusted Earnings (Loss) Per Share – represents diluted earnings (loss) per share from continuing operations (the most comparable GAAP financial measure) before special items including restructuring and other charges, acquisition-related charges, impairment of goodwill, tax sharing income related to adjustments to prior period tax returns and other tax items, other income or charges, and certain significant tax items, if any, and, if applicable, the related tax effects. This measure is a significant component in our incentive compensation plans. |
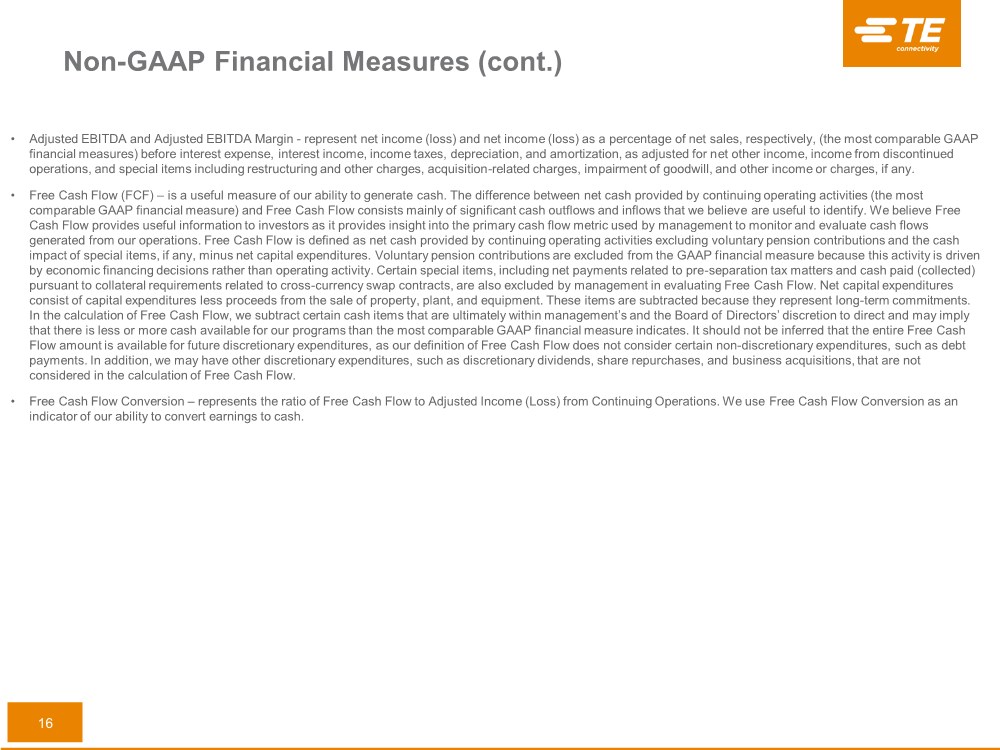
| 16 • Adjusted EBITDA and Adjusted EBITDA Margin - represent net income (loss) and net income (loss) as a percentage of net sales, respectively, (the most comparable GAAP financial measures) before interest expense, interest income, income taxes, depreciation, and amortization, as adjusted for net other income, income from discontinued operations, and special items including restructuring and other charges, acquisition-related charges, impairment of goodwill, and other income or charges, if any. • Free Cash Flow (FCF) – is a useful measure of our ability to generate cash. The difference between net cash provided by continuing operating activities (the most comparable GAAP financial measure) and Free Cash Flow consists mainly of significant cash outflows and inflows that we believe are useful to identify. We believe Free Cash Flow provides useful information to investors as it provides insight into the primary cash flow metric used by management to monitor and evaluate cash flows generated from our operations. Free Cash Flow is defined as net cash provided by continuing operating activities excluding voluntary pension contributions and the cash impact of special items, if any, minus net capital expenditures. Voluntary pension contributions are excluded from the GAAP financial measure because this activity is driven by economic financing decisions rather than operating activity. Certain special items, including net payments related to pre-separation tax matters and cash paid (collected) pursuant to collateral requirements related to cross-currency swap contracts, are also excluded by management in evaluating Free Cash Flow. Net capital expenditures consist of capital expenditures less proceeds from the sale of property, plant, and equipment. These items are subtracted because they represent long-term commitments. In the calculation of Free Cash Flow, we subtract certain cash items that are ultimately within management’s and the Board of Directors’ discretion to direct and may imply that there is less or more cash available for our programs than the most comparable GAAP financial measure indicates. It should not be inferred that the entire Free Cash Flow amount is available for future discretionary expenditures, as our definition of Free Cash Flow does not consider certain non-discretionary expenditures, such as debt payments. In addition, we may have other discretionary expenditures, such as discretionary dividends, share repurchases, and business acquisitions, that are not considered in the calculation of Free Cash Flow. • Free Cash Flow Conversion – represents the ratio of Free Cash Flow to Adjusted Income (Loss) from Continuing Operations. We use Free Cash Flow Conversion as an indicator of our ability to convert earnings to cash. Non-GAAP Financial Measures (cont.) |
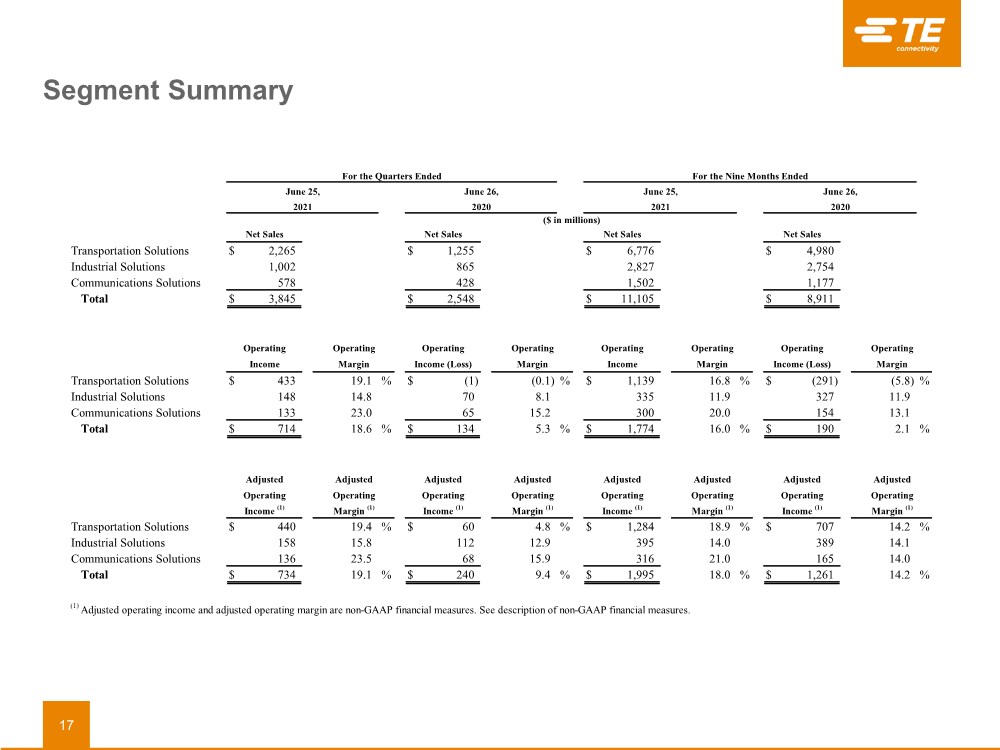
| Segment Summary 17 Transportation Solutions $ 2,265 $ 1,255 $ 6,776 $ 4,980 Industrial Solutions 1,002 865 2,827 2,754 Communications Solutions 578 428 1,502 1,177 Total $ 3,845 $ 2,548 $ 11,105 $ 8,911 Transportation Solutions $ 433 19.1 % $ (1) (0.1) % $ 1,139 16.8 % $ (291) (5.8) % Industrial Solutions 148 14.8 70 8.1 335 11.9 327 11.9 Communications Solutions 133 23.0 65 15.2 300 20.0 154 13.1 Total $ 714 18.6 % $ 134 5.3 % $ 1,774 16.0 % $ 190 2.1 % Transportation Solutions $ 440 19.4 % $ 60 4.8 % $ 1,284 18.9 % $ 707 14.2 % Industrial Solutions 158 15.8 112 12.9 395 14.0 389 14.1 Communications Solutions 136 23.5 68 15.9 316 21.0 165 14.0 Total $ 734 19.1 % $ 240 9.4 % $ 1,995 18.0 % $ 1,261 14.2 % Operating Margin Operating Margin Operating Margin Operating Margin Adjusted Operating Margin (1) Adjusted Operating Margin (1) Adjusted Income (1) (1) Adjusted operating income and adjusted operating margin are non-GAAP financial measures. See description of non-GAAP financial measures. 2021 2020 ($ in millions) Operating Margin (1) Adjusted Operating Margin (1) Adjusted Operating Income (1) Adjusted Operating Adjusted Operating Net Sales Net Sales Net Sales Income (1) Adjusted Operating Income (1) Income Operating Operating Income (Loss) Operating Income Net Sales Operating Income (Loss) For the Quarters Ended June 25, June 26, June 25, June 26, 2021 For the Nine Months Ended 2020 |
| Reconciliation of Net Sales Growth 18 Transportation Solutions (3): Automotive $ 803 100.8 % $ 738 90.2 % $ 65 $ — Commercial transportation 149 63.9 136 56.3 13 — Sensors 58 25.8 47 20.3 11 — Total 1,010 80.5 921 71.6 89 — Industrial Solutions (3): Aerospace, defense, oil, and gas (5) (1.9) (18) (6.9) 8 5 Industrial equipment 112 42.3 96 35.5 16 — Medical 17 10.6 16 9.9 1 — Energy 13 7.5 15 8.7 8 (10) Total 137 15.8 109 12.6 33 (5) Communications Solutions (3): Data and devices 53 19.2 46 16.1 7 — Appliances 97 63.8 88 56.9 9 — Total 150 35.0 134 30.8 16 — Total $ 1,297 50.9 % $ 1,164 45.0 % $ 138 $ (5) Transportation Solutions (3): Automotive $ 1,292 36.2 % $ 1,083 29.9 % $ 209 $ — Commercial transportation 310 39.5 274 34.3 36 — Sensors 194 30.9 81 12.5 24 89 Total 1,796 36.1 1,438 28.4 269 89 Industrial Solutions (3): Aerospace, defense, oil, and gas (115) (12.9) (152) (17.1) 21 16 Industrial equipment 203 25.1 162 19.6 41 — Medical (31) (5.9) (33) (6.3) 2 — Energy 16 3.0 15 2.9 20 (19) Total 73 2.7 (8) (0.4) 84 (3) Communications Solutions (3): Data and devices 128 18.0 108 15.0 20 — Appliances 197 42.5 177 37.7 20 — Total 325 27.6 285 24.1 40 — Total $ 2,194 24.6 % $ 1,715 19.0 % $ 393 $ 86 ($ in millions) Translation (2) Acquisition/ (Divestitures) Growth (Decline) Growth (Decline) (1) Translation (2) (Divestitures) Change in Net Sales for the Nine Months Ended June 25, 2021 versus Net Sales for the Nine Months Ended June 26, 2020 (1) Organic net sales growth (decline) is a non-GAAP financial measure. See description of non-GAAP financial measures. (2) Represents the change in net sales resulting from changes in foreign currency exchange rates. (3) Industry end market information is presented consistently with our internal management reporting and may be periodically revised as management deems necessary. ($ in millions) Net Sales Growth (Decline) Organic Net Sales Growth (Decline) (1) Change in Net Sales for the Quarter Ended June 25, 2021 versus Net Sales for the Quarter Ended June 26, 2020 Net Sales Organic Net Sales Acquisitions/ |
| Reconciliation of Non-GAAP Financial Measures to GAAP Financial Measures for the Quarter Ended June 25, 2021 19 Operating income: Transportation Solutions $ 433 $ 5 $ 2 $ 440 Industrial Solutions 148 4 6 158 Communications Solutions 133 — 3 136 Total $ 714 $ 9 $ 11 $ 734 Operating margin 18.6 % 19.1 % Other income, net $ 2 $ — $ — $ 2 Income tax expense $ (124) $ (2) $ (4) $ (130) Effective tax rate 17.6 % 17.9 % Income from continuing operations $ 581 $ 7 $ 7 $ 595 Diluted earnings per share from continuing operations $ 1.74 $ 0.02 $ 0.02 $ 1.79 and Other Adjusted Related Acquisition- Restructuring Adjustments (2) See description of non-GAAP financial measures. (1) The tax effect of each non-GAAP adjustment is calculated based on the jurisdictions in which the expense (income) is incurred and the tax laws in effect for each such jurisdiction. U.S. GAAP Charges (1) (Non-GAAP) (2) Charges, Net (1) ($ in millions, except per share data) |
| Reconciliation of Non-GAAP Financial Measures to GAAP Financial Measures for the Quarter Ended June 26, 2020 20 Operating income (loss): Transportation Solutions $ (1) $ 6 $ 55 $ — $ 60 Industrial Solutions 70 2 40 — 112 Communications Solutions 65 — 3 — 68 Total $ 134 $ 8 $ 98 $ — $ 240 Operating margin 5.3 % 9.4 % Other income, net $ 4 $ — $ — $ — $ 4 Income tax expense $ (185) $ (1) $ (21) $ 170 $ (37) Effective tax rate 145.7 % 15.9 % Income (loss) from continuing operations $ (58) $ 7 $ 77 $ 170 $ 196 Diluted earnings (loss) per share from continuing operations (3) $ (0.18) $ 0.02 $ 0.23 $ 0.51 $ 0.59 Charges (1) (4) See description of non-GAAP financial measures. (2) Income tax expense related to an increase to the valuation allowance for certain non-U.S. deferred tax assets. (1) The tax effect of each non-GAAP adjustment is calculated based on the jurisdictions in which the expense (income) is incurred and the tax laws in effect for each such jurisdiction. U.S. GAAP (Non-GAAP) (4) ($ in millions, except per share data) Charges, Net (1) Tax Items (2) (3) U.S. GAAP diluted shares excludes one million of nonvested share awards and options outstanding as the inclusion of these securities would have been antidilutive because of our loss during the period. Such amounts are included in adjusted (non-GAAP) diluted shares. Adjustments Adjusted and Other Restructuring Acquisition- Related |
| Reconciliation of Non-GAAP Financial Measures to GAAP Financial Measures for the Nine Months Ended June 25, 2021 21 Operating income: Transportation Solutions $ 1,139 $ 15 $ 130 $ — $ 1,284 Industrial Solutions 335 11 49 — 395 Communications Solutions 300 — 16 — 316 Total $ 1,774 $ 26 $ 195 $ — $ 1,995 Operating margin 16.0 % 18.0 % Other income, net $ 5 $ — $ — $ — $ 5 Income tax expense $ (290) $ (6) $ (38) $ (29) $ (363) Effective tax rate 16.6 % 18.4 % Income from continuing operations $ 1,461 $ 20 $ 157 $ (29) $ 1,609 Diluted earnings per share from continuing operations $ 4.39 $ 0.06 $ 0.47 $ (0.09) $ 4.83 (3) See description of non-GAAP financial measures. ($ in millions, except per share data) (1) The tax effect of each non-GAAP adjustment is calculated based on the jurisdictions in which the expense (income) is incurred and the tax laws in effect for each such jurisdiction. (2) Income tax benefits related to an Internal Revenue Service approved change in the tax method of depreciating or amortizing certain assets. U.S. GAAP Charges (1) Charges, Net (1) Tax Items (2) (Non-GAAP) (3) Related and Other Adjusted Acquisition- Restructuring Adjustments |
| Reconciliation of Non-GAAP Financial Measures to GAAP Financial Measures for the Nine Months Ended June 26, 2020 22 Operating income (loss): Transportation Solutions $ (291) $ 21 $ 77 $ 900 $ — $ 707 Industrial Solutions 327 6 56 — — 389 Communications Solutions 154 — 11 — — 165 Total $ 190 $ 27 $ 144 $ 900 $ — $ 1,261 Operating margin 2.1 % 14.2 % Other income, net $ 20 $ — $ — $ — $ (8) $ 12 Income tax expense $ (674) $ (4) $ (25) $ (4) $ 494 $ (213) Effective tax rate 360.4 % 17.0 % Income (loss) from continuing operations $ (487) $ 23 $ 119 $ 896 $ 486 $ 1,037 Diluted earnings (loss) per share from continuing operations (3) $ (1.46) $ 0.07 $ 0.36 $ 2.68 $ 1.46 $ 3.10 U.S. GAAP (3) U.S. GAAP diluted shares excludes one million of nonvested share awards and options outstanding as the inclusion of these securities would have been antidilutive because of our loss during the period. Such amounts are included in adjusted (non-GAAP) diluted shares. (4) See description of non-GAAP financial measures. ($ in millions, except per share data) Charges (1) Charges, Net (1) of Goodwill (1) Tax Items (2) (Non-GAAP) (4) (1) The tax effect of each non-GAAP adjustment is calculated based on the jurisdictions in which the expense (income) is incurred and the tax laws in effect for each such jurisdiction. (2) Includes $355 million of income tax expense related to the tax impacts of certain measures of Swiss tax reform and $170 million of income tax expense related to an increase to the valuation allowance for certain non-U.S. deferred tax assets, partially offset by a $31 million income tax benefit related to pre-separation tax matters and the termination of the tax sharing agreement with Tyco International and Covidien. Adjusted Related and Other Impairment Acquisition- Restructuring Adjustments |
| Reconciliation of Non-GAAP Financial Measures to GAAP Financial Measures for the Quarter Ended March 26, 2021 23 Operating income: Transportation Solutions $ 398 $ 5 $ 10 $ 413 Industrial Solutions 111 3 5 119 Communications Solutions 103 — 2 105 Total $ 612 $ 8 $ 17 $ 637 Operating margin 16.4 % 17.0 % Other income, net $ 4 $ — $ — $ 4 Income tax expense $ (106) $ (2) $ (2) $ (110) Effective tax rate 17.3 % 17.3 % Income from continuing operations $ 505 $ 6 $ 15 $ 526 Diluted earnings per share from continuing operations $ 1.51 $ 0.02 $ 0.04 $ 1.57 (2) See description of non-GAAP financial measures. (1) The tax effect of each non-GAAP adjustment is calculated based on the jurisdictions in which the expense (income) is incurred and the tax laws in effect for each such jurisdiction. U.S. GAAP Charges (1) (Non-GAAP) (2) Charges, Net (1) ($ in millions, except per share data) Adjustments and Other Adjusted Related Acquisition- Restructuring |
| Reconciliation of Non-GAAP Financial Measures to GAAP Financial Measures for the Quarter Ended September 25, 2020 24 Operating income: Transportation Solutions $ 198 $ 11 $ 36 $ — $ 245 Industrial Solutions 85 2 46 — 133 Communications Solutions 64 — 31 — 95 Total $ 347 $ 13 $ 113 $ — $ 473 Operating margin 10.6 % 14.5 % Income tax expense $ (109) $ (4) $ (21) $ 56 $ (78) Effective tax rate 32.3 % 16.8 % Income from continuing operations $ 228 $ 9 $ 92 $ 56 $ 385 Diluted earnings per share from continuing operations $ 0.69 $ 0.03 $ 0.28 $ 0.17 $ 1.16 (3) See description of non-GAAP financial measures. U.S. GAAP Acquisition- Related Charges (1) Adjustments (1) The tax effect of each non-GAAP adjustment is calculated based on the jurisdictions in which the expense (income) is incurred and the tax laws in effect for each such jurisdiction. (2) Income tax expense related to increases to the valuation allowance for certain deferred tax assets. Restructuring Adjusted (Non-GAAP) (3) ($ in millions, except per share data) Tax Items (2) and Other Charges, Net (1) |
| Reconciliation of Non-GAAP Financial Measures to GAAP Financial Measures for the Year Ended September 25, 2020 25 Operating income (loss): Transportation Solutions $ (93) $ 32 $ 113 $ 900 $ — $ 952 Industrial Solutions 412 8 102 — — 522 Communications Solutions 218 — 42 — — 260 Total $ 537 $ 40 $ 257 $ 900 $ — $ 1,734 Operating margin 4.4 % 14.2 % Other income, net $ 20 $ — $ — $ — $ (8) $ 12 Income tax expense $ (783) $ (8) $ (46) $ (4) $ 550 $ (291) Effective tax rate 149.4 % 17.0 % Income (loss) from continuing operations $ (259) $ 32 $ 211 $ 896 $ 542 $ 1,422 Diluted earnings (loss) per share from continuing operations (3) $ (0.78) $ 0.10 $ 0.63 $ 2.68 $ 1.62 $ 4.26 Impairment of Goodwill (1) (3) U.S. GAAP diluted shares excludes two million of nonvested share awards and options outstanding as the inclusion of these securities would have been antidilutive because of our loss during the period. Such amounts are included in adjusted (non-GAAP) diluted shares. (1) The tax effect of each non-GAAP adjustment is calculated based on the jurisdictions in which the expense (income) is incurred and the tax laws in effect for each such jurisdiction. (2) Includes $355 million of income tax expense related to the tax impacts of certain measures of Swiss tax reform and $226 million of income tax expense related to increases to the valuation allowance for certain deferred tax assets, partially offset by a $31 million income tax benefit related to pre-separation tax matters and the termination of the tax sharing agreement with Tyco International and Covidien. Acquisition- Charges (1) Restructuring and Other Charges, Net (1) Related Tax Items (2) (Non-GAAP) (4) Adjusted (4) See description of non-GAAP financial measures. U.S. GAAP Adjustments ($ in millions, except per share data) |
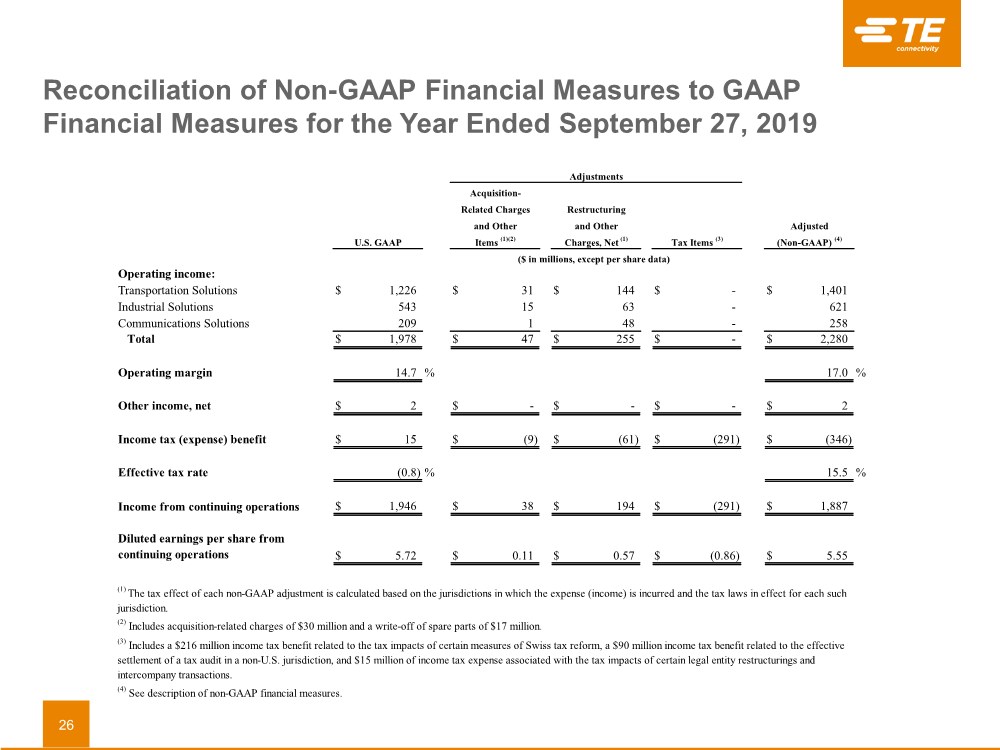
| Reconciliation of Non-GAAP Financial Measures to GAAP Financial Measures for the Year Ended September 27, 2019 26 Operating income: Transportation Solutions $ 1,226 $ 31 $ 144 $ - $ 1,401 Industrial Solutions 543 15 63 - 621 Communications Solutions 209 1 48 - 258 Total $ 1,978 $ 47 $ 255 $ - $ 2,280 Operating margin 14.7 % 17.0 % Other income, net $ 2 $ - $ - $ - $ 2 Income tax (expense) benefit $ 15 $ (9) $ (61) $ (291) $ (346) Effective tax rate (0.8) % 15.5 % Income from continuing operations $ 1,946 $ 38 $ 194 $ (291) $ 1,887 Diluted earnings per share from continuing operations $ 5.72 $ 0.11 $ 0.57 $ (0.86) $ 5.55 Adjustments Acquisition- Related Charges Restructuring and Other and Other Adjusted U.S. GAAP Items (1)(2) Charges, Net (1) Tax Items (3) (Non-GAAP) (4) ($ in millions, except per share data) (1) The tax effect of each non-GAAP adjustment is calculated based on the jurisdictions in which the expense (income) is incurred and the tax laws in effect for each such jurisdiction. (2) Includes acquisition-related charges of $30 million and a write-off of spare parts of $17 million. (3) Includes a $216 million income tax benefit related to the tax impacts of certain measures of Swiss tax reform, a $90 million income tax benefit related to the effective settlement of a tax audit in a non-U.S. jurisdiction, and $15 million of income tax expense associated with the tax impacts of certain legal entity restructurings and intercompany transactions. (4) See description of non-GAAP financial measures. |
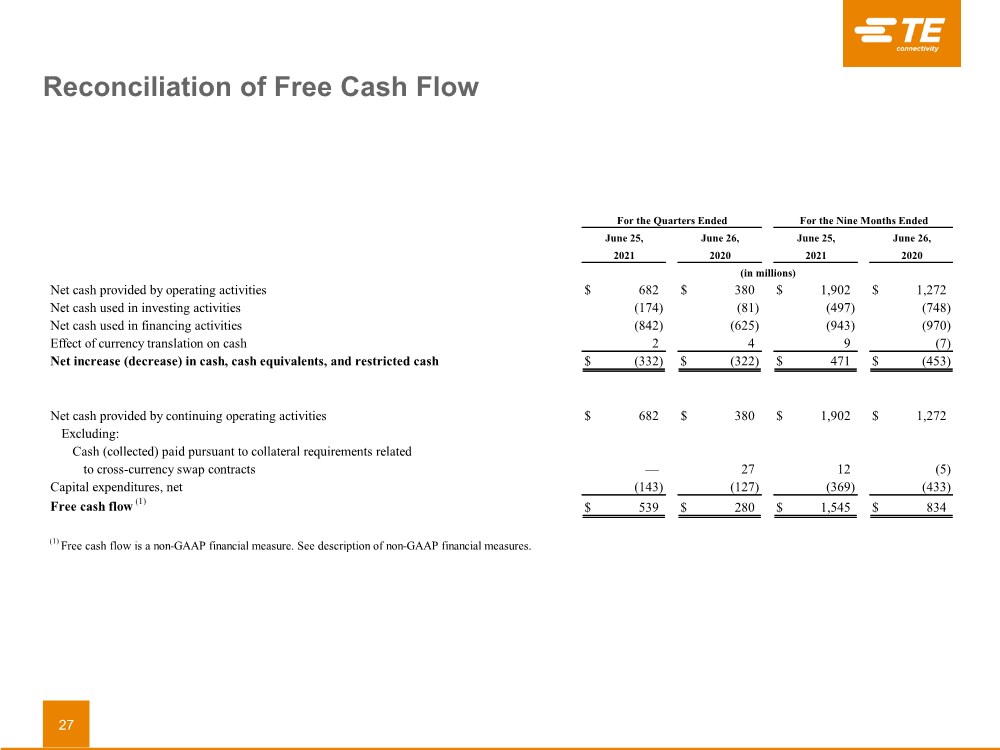
| Reconciliation of Free Cash Flow 27 Net cash provided by operating activities $ 682 $ 380 $ 1,902 $ 1,272 Net cash used in investing activities (174) (81) (497) (748) Net cash used in financing activities (842) (625) (943) (970) Effect of currency translation on cash 2 4 9 (7) Net increase (decrease) in cash, cash equivalents, and restricted cash $ (332) $ (322) $ 471 $ (453) Net cash provided by continuing operating activities $ 682 $ 380 $ 1,902 $ 1,272 Excluding: Cash (collected) paid pursuant to collateral requirements related to cross-currency swap contracts — 27 12 (5) Capital expenditures, net (143) (127) (369) (433) Free cash flow (1) $ 539 $ 280 $ 1,545 $ 834 (in millions) (1) Free cash flow is a non-GAAP financial measure. See description of non-GAAP financial measures. 2021 2020 2021 2020 For the Quarters Ended For the Nine Months Ended June 25, June 26, June 25, June 26, |
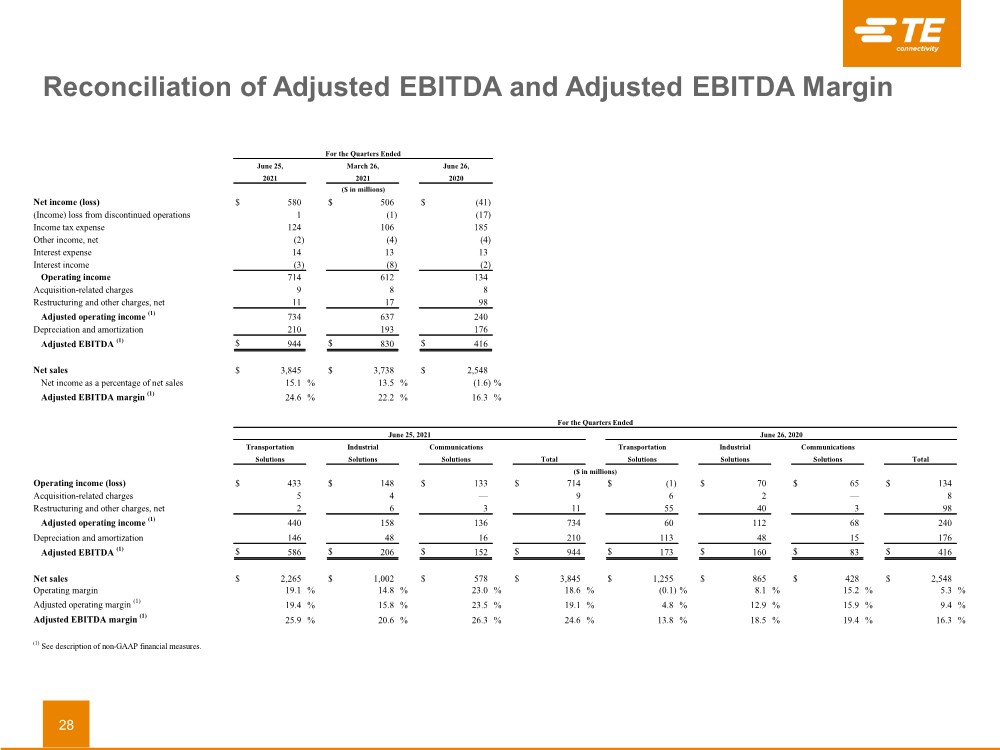
| Reconciliation of Adjusted EBITDA and Adjusted EBITDA Margin 28 Net income (loss) $ 580 $ 506 $ (41) (Income) loss from discontinued operations 1 (1) (17) Income tax expense 124 106 185 Other income, net (2) (4) (4) Interest expense 14 13 13 Interest income (3) (8) (2) Operating income 714 612 134 Acquisition-related charges 9 8 8 Restructuring and other charges, net 11 17 98 Adjusted operating income (1) 734 637 240 Depreciation and amortization 210 193 176 Adjusted EBITDA (1) $ 944 $ 830 $ 416 Net sales $ 3,845 $ 3,738 $ 2,548 Net income as a percentage of net sales 15.1 % 13.5 %(1.6) % Adjusted EBITDA margin (1) 24.6 % 22.2 % 16.3 % Operating income (loss) $ 433 $ 148 $ 133 $ 714 $ (1) $ 70 $ 65 $ 134 Acquisition-related charges 5 4 — 9 6 2 — 8 Restructuring and other charges, net 2 6 3 11 55 40 3 98 Adjusted operating income (1) 440 158 136 734 60 112 68 240 Depreciation and amortization 146 48 16 210 113 48 15 176 Adjusted EBITDA (1) $ 586 $ 206 $ 152 $ 944 $ 173 $ 160 $ 83 $ 416 Net sales $ 2,265 $ 1,002 $ 578 $ 3,845 $ 1,255 $ 865 $ 428 $ 2,548 Operating margin 19.1 % 14.8 % 23.0 % 18.6 %(0.1) % 8.1 % 15.2 % 5.3 % Adjusted operating margin (1) 19.4 % 15.8 % 23.5 % 19.1 % 4.8 % 12.9 % 15.9 % 9.4 % Adjusted EBITDA margin (1) 25.9 % 20.6 % 26.3 % 24.6 % 13.8 % 18.5 % 19.4 % 16.3 % (1) See description of non-GAAP financial measures. Communications Solutions Total ($ in millions) Total Transportation Solutions Industrial Solutions Solutions Transportation Industrial Solutions Solutions Communications For the Quarters Ended June 25, 2021 June 26, 2020 June 25, 2021 2021 March 26, June 26, 2020 ($ in millions) For the Quarters Ended |
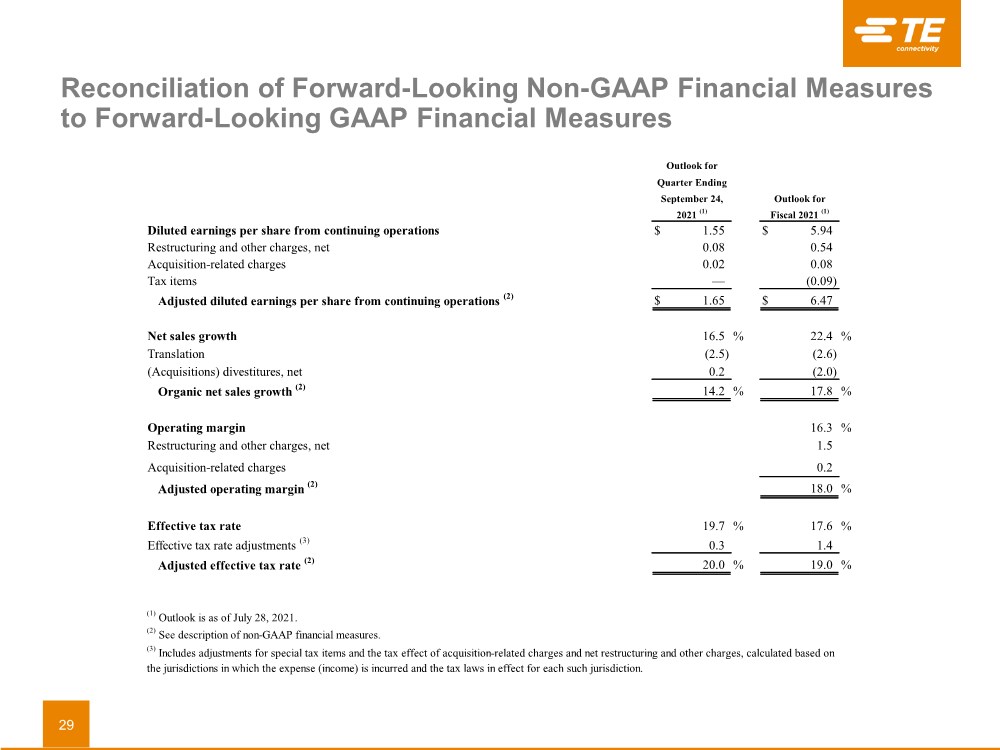
| Reconciliation of Forward-Looking Non-GAAP Financial Measures to Forward-Looking GAAP Financial Measures 29 Diluted earnings per share from continuing operations $ 1.55 $ 5.94 Restructuring and other charges, net 0.08 0.54 Acquisition-related charges 0.02 0.08 Tax items — (0.09) Adjusted diluted earnings per share from continuing operations (2) $ 1.65 $ 6.47 Net sales growth 16.5 % 22.4 % Translation (2.5) (2.6) (Acquisitions) divestitures, net 0.2 (2.0) Organic net sales growth (2) 14.2 % 17.8 % Operating margin 16.3 % Restructuring and other charges, net 1.5 Acquisition-related charges 0.2 Adjusted operating margin (2) 18.0 % Effective tax rate 19.7 % 17.6 % Effective tax rate adjustments (3) 0.3 1.4 Adjusted effective tax rate (2) 20.0 % 19.0 % Quarter Ending Outlook for (2) See description of non-GAAP financial measures. (3) Includes adjustments for special tax items and the tax effect of acquisition-related charges and net restructuring and other charges, calculated based on the jurisdictions in which the expense (income) is incurred and the tax laws in effect for each such jurisdiction. September 24, Outlook for 2021 (1) Fiscal 2021 (1) (1) Outlook is as of July 28, 2021. |
Serious News for Serious Traders! Try StreetInsider.com Premium Free!
You May Also Be Interested In
- TE Connectivity (TEL) PT Lowered to $158 at Baird
- IBM and Burning Glass Institute Report: Green Jobs Go Digital for the Future of Work
- Federal Home Loan Bank of New York Announces First Quarter 2024 Operating Highlights
Create E-mail Alert Related Categories
SEC FilingsSign up for StreetInsider Free!
Receive full access to all new and archived articles, unlimited portfolio tracking, e-mail alerts, custom newswires and RSS feeds - and more!
