

Form 8-K TE Connectivity Ltd. For: Jan 26
 Tweet
Tweet Share
ShareExhibit 99.1
NEWS RELEASE

te.com
TE Connectivity announces first quarter results for fiscal year 2022
Sales and EPS above guidance driven by strong operational performance
SCHAFFHAUSEN, Switzerland – Jan. 26, 2022 – TE Connectivity Ltd. (NYSE: TEL) today reported results for the fiscal first quarter ended Dec. 24, 2021.
First Quarter Highlights
| ● | Net sales were $3.8 billion, up 8% on a reported and organic basis year over year. |
| ● | Orders of $4.3 billion, up 7% year over year. |
| ● | Earnings per share (EPS) were a first quarter record on both a GAAP and an adjusted EPS basis. GAAP diluted EPS from continuing operations were $1.72, up 52% year over year, and adjusted EPS were $1.76, up 20% year over year. |
| ● | Cash flow from operating activities was $532 million and free cash flow was approximately $370 million, with approximately $410 million returned to shareholders. |
| ● | TE named to Dow Jones Sustainability Index for the 10th consecutive year and ranked in the top 20 of Investor Business Daily’s 100 best ESG companies. |
“Our strong first quarter performance reflects the diversity of our portfolio and our global team’s ability to execute and deliver sales and EPS growth that exceeded our expectations. We continue to experience a strong global demand environment and our first quarter sales growth was driven by strong sales performance in our Industrial and Communications segments. We also continue to benefit from the strategic positioning of our portfolio and investment in innovation that is focused on growth and sustainability trends in electric vehicles, factory automation, the cloud, and renewable energy,” said TE Connectivity CEO Terrence Curtin. “We expect to deliver year over year sales and earnings growth in the second quarter as we continue to capitalize on a strong demand environment and our team’s ability to continue to execute well despite ongoing volatility in global supply chains.”
Second Quarter FY22 Outlook
For the second quarter of fiscal 2022, the company expects net sales of approximately $3.8 billion, reflecting an approximate 2% increase on a reported basis and an approximate 3% increase on an organic basis year over year. GAAP EPS from continuing operations are expected to be approximately $1.52 with adjusted EPS of approximately $1.70, up 8% year over year.

Information about TE Connectivity's use of non-GAAP financial measures is provided below. For reconciliations of these non-GAAP financial measures, see the attached tables.
Conference Call and Webcast
The company will hold a conference call today beginning at 8:30 a.m. ET. The dial-in information is provided here:
| ● | At TE Connectivity's website: investors.te.com |
| ● | By telephone: For both "listen-only" participants and those participants who wish to take part in the question-and-answer portion of the call, the dial-in number in the United States is (888) 330-3417, and for international callers, the dial-in number is (646) 960-0804. |
| ● | A replay of the conference call will be available on TE Connectivity’s investor website at investors.te.com at 11:30 a.m. ET on Jan. 26, 2022. |
About TE Connectivity
TE Connectivity Ltd. (NYSE: TEL) is a global industrial technology leader creating a safer, sustainable, productive, and connected future. Our broad range of connectivity and sensor solutions, proven in the harshest environments, enable advancements in transportation, industrial applications, medical technology, energy, data communications, and the home. With more than 85,000 employees, including over 8,000 engineers, working alongside customers in approximately 140 countries, TE ensures that EVERY CONNECTION COUNTS. Learn more at www.te.com and on LinkedIn, Facebook, WeChat and Twitter.
Non-GAAP Financial Measures
We present non-GAAP performance and liquidity measures as we believe it is appropriate for investors to consider adjusted financial measures in addition to results in accordance with accounting principles generally accepted in the U.S. (“GAAP”). These non-GAAP financial measures provide supplemental information and should not be considered replacements for results in accordance with GAAP. Management uses non-GAAP financial measures internally for planning and forecasting purposes and in its decision-making processes related to the operations of our company. We believe these measures provide meaningful information to us and investors because they enhance the understanding of our operating performance, ability to generate cash, and the trends of our business. Additionally, we believe that investors benefit from having access to the same financial measures that management uses in evaluating our operations. The primary limitation of these measures is that they exclude the financial impact of items that would otherwise either increase or decrease our reported results. This limitation is best addressed by using these non-GAAP financial measures in combination with the most directly comparable GAAP financial measures in order to better understand the
amounts, character, and impact of any increase or decrease in reported amounts. These non-GAAP financial measures may not be comparable to similarly-titled measures reported by other companies.
The following provides additional information regarding our non-GAAP financial measures:
Forward-Looking Statements
This release contains certain "forward-looking statements" within the meaning of the U.S. Private Securities Litigation Reform Act of 1995. These statements are based on management's current expectations and are subject to risks, uncertainty and changes in circumstances, which may cause actual results, performance, financial condition or achievements to differ materially from anticipated results, performance, financial condition or achievements. All statements contained herein that are not clearly historical in nature are forward-looking and the words "anticipate," "believe," "expect," "estimate," "plan," and similar expressions are generally intended to identify forward-looking statements. We have no intention and are under no obligation to update or alter (and expressly disclaim any such intention or obligation to do so) our forward-looking statements whether as a result of new information, future events or otherwise, except to the extent required by law. The forward-looking statements in this release include statements addressing our future financial condition and operating results, and the impact on our operations resulting from the coronavirus disease 2019 (“COVID-19”). Examples of factors that could cause actual results to differ materially from those described in the forward-looking statements include, among others, the extent, severity and duration of COVID-19 negatively affecting our business operations; business, economic, competitive and regulatory risks, such as conditions affecting demand for products in the automotive and other industries we serve; competition and pricing pressure; fluctuations in foreign currency exchange rates and commodity prices; natural disasters and political, economic and military instability in countries in which we operate; developments in the credit markets; future goodwill impairment; compliance with current and future environmental and other laws and regulations; and the possible effects on us of changes in tax laws, tax treaties and other legislation, including the effects of Swiss tax reform. In addition, the extent to which COVID-19 will impact our business and our financial results will depend on future developments, which are highly uncertain and cannot be predicted. Such developments may include the geographic spread of the virus, the severity of the virus, the duration of the outbreak, the impact on our suppliers’ and customers’ supply chains, the actions that may be taken by various governmental authorities in response to the outbreak in jurisdictions in which we operate, and the possible impact on the global economy and local economies in which we operate. More detailed information about these and other factors is set forth in TE Connectivity Ltd.'s Annual Report on Form 10-K for the fiscal year ended Sept. 24, 2021 as well as in our Quarterly Reports on Form 10-Q, Current Reports on Form 8-K and other reports filed by us with the U.S. Securities and Exchange Commission.
# # #
Contacts: | Media Relations: Fernando Vivanco TE Connectivity 610-893-9756 | Investor Relations: Sujal Shah TE Connectivity 610-893-9790 |
TE CONNECTIVITY LTD.
CONSOLIDATED STATEMENTS OF OPERATIONS (UNAUDITED)
| For the Quarters Ended | ||||
| December 24, | | December 25, | ||
| 2021 |
| 2020 | ||
| (in millions, except per share data) | ||||
Net sales | $ | 3,818 | | $ | 3,522 |
Cost of sales | | 2,588 | | | 2,376 |
Gross margin | | 1,230 | | | 1,146 |
Selling, general, and administrative expenses | | 363 | | | 361 |
Research, development, and engineering expenses | | 175 | | | 162 |
Acquisition and integration costs | | 8 | | | 8 |
Restructuring and other charges, net | | 12 | | | 167 |
Operating income | | 672 | | | 448 |
Interest income | | 2 | | | 3 |
Interest expense | | (12) | | | (15) |
Other income (expense), net | | 15 | | | (1) |
Income from continuing operations before income taxes | | 677 | | | 435 |
Income tax expense | | (110) | | | (60) |
Income from continuing operations | | 567 | | | 375 |
Income (loss) from discontinued operations, net of income taxes | | (1) | | | 6 |
Net income | $ | 566 | | $ | 381 |
| | | | | |
Basic earnings per share: | | | | | |
Income from continuing operations | $ | 1.73 | | $ | 1.13 |
Income from discontinued operations | | — | | | 0.02 |
Net income | | 1.73 | | | 1.15 |
| | | | | |
Diluted earnings per share: | | | | | |
Income from continuing operations | $ | 1.72 | | $ | 1.13 |
Income from discontinued operations | | — | | | 0.02 |
Net income | | 1.72 | | | 1.14 |
| | | | | |
Weighted-average number of shares outstanding: | | | | | |
Basic | | 327 | | | 331 |
Diluted | | 330 | | | 333 |
TE CONNECTIVITY LTD.
CONSOLIDATED BALANCE SHEETS (UNAUDITED)
| December 24, | | September 24, | ||
| 2021 | | 2021 | ||
| (in millions, except share data) | ||||
Assets | | | | | |
Current assets: | | | | | |
Cash and cash equivalents | $ | 982 | | $ | 1,203 |
Accounts receivable, net of allowance for doubtful accounts of $41 | | 2,844 | | | 2,928 |
Inventories | | 2,845 | | | 2,511 |
Prepaid expenses and other current assets | | 573 | | | 621 |
Total current assets | | 7,244 | | | 7,263 |
Property, plant, and equipment, net | | 3,827 | | | 3,778 |
Goodwill | | 5,503 | | | 5,590 |
Intangible assets, net | | 1,509 | | | 1,549 |
Deferred income taxes | | 2,513 | | | 2,499 |
Other assets | | 813 | | | 783 |
Total assets | $ | 21,409 | | $ | 21,462 |
Liabilities, redeemable noncontrolling interests, and shareholders' equity | | | | | |
Current liabilities: | | | | | |
Short-term debt | $ | 484 | | $ | 503 |
Accounts payable | | 1,964 | | | 1,911 |
Accrued and other current liabilities | | 1,826 | | | 2,242 |
Total current liabilities | | 4,274 | | | 4,656 |
Long-term debt | | 3,519 | | | 3,589 |
Long-term pension and postretirement liabilities | | 1,119 | | | 1,139 |
Deferred income taxes | | 192 | | | 181 |
Income taxes | | 331 | | | 302 |
Other liabilities | | 846 | | | 847 |
Total liabilities | | 10,281 | | | 10,714 |
Commitments and contingencies | | | | | |
Redeemable noncontrolling interests | | 108 | | | 114 |
Shareholders' equity: | | | | | |
Common shares, CHF 0.57 par value, 336,099,881 shares authorized and issued | | 148 | | | 148 |
Accumulated earnings | | 12,285 | | | 11,709 |
Treasury shares, at cost, 9,911,977 and 9,060,919 shares, respectively | | (1,274) | | | (1,055) |
Accumulated other comprehensive loss | | (139) | | | (168) |
Total shareholders' equity | | 11,020 | | | 10,634 |
Total liabilities, redeemable noncontrolling interests, and shareholders' equity | $ | 21,409 | | $ | 21,462 |
TE CONNECTIVITY LTD.
CONSOLIDATED STATEMENTS OF CASH FLOWS (UNAUDITED)
| For the Quarters Ended | ||||
| December 24, | | December 25, | ||
| 2021 | | 2020 | ||
| (in millions) | ||||
Cash flows from operating activities: | | | | | |
Net income | $ | 566 | | $ | 381 |
(Income) loss from discontinued operations, net of income taxes | | 1 | | | (6) |
Income from continuing operations | | 567 | | | 375 |
Adjustments to reconcile income from continuing operations to net cash provided by operating activities: | | | | | |
Depreciation and amortization | | 198 | | | 187 |
Deferred income taxes | | 4 | | | (42) |
Non-cash lease cost | | 31 | | | 30 |
Provision for losses on accounts receivable and inventories | | 33 | | | 6 |
Share-based compensation expense | | 32 | | | 19 |
Other | | (9) | | | 21 |
Changes in assets and liabilities, net of the effects of acquisitions and divestitures: | | | | | |
Accounts receivable, net | | 148 | | | (299) |
Inventories | | (264) | | | (145) |
Prepaid expenses and other current assets | | 52 | | | (87) |
Accounts payable | | 15 | | | 349 |
Accrued and other current liabilities | | (285) | | | 88 |
Income taxes | | 34 | | | 17 |
Other | | (24) | | | 121 |
Net cash provided by operating activities | | 532 | | | 640 |
Cash flows from investing activities: | | | | | |
Capital expenditures | | (172) | | | (142) |
Proceeds from sale of property, plant, and equipment | | 54 | | | 1 |
Acquisition of businesses, net of cash acquired | | (100) | | | (107) |
Proceeds from divestiture of businesses, net of cash retained by businesses sold | | 16 | | | — |
Other | | 3 | | | 2 |
Net cash used in investing activities | | (199) | | | (246) |
Cash flows from financing activities: | | | | | |
Net increase in commercial paper | | 479 | | | — |
Repayment of debt | | (555) | | | (30) |
Proceeds from exercise of share options | | 22 | | | 75 |
Repurchase of common shares | | (304) | | | (119) |
Payment of common share dividends to shareholders | | (163) | | | (159) |
Other | | (31) | | | (19) |
Net cash used in financing activities | | (552) | | | (252) |
Effect of currency translation on cash | | (2) | | | 11 |
Net increase (decrease) in cash, cash equivalents, and restricted cash | | (221) | | | 153 |
Cash, cash equivalents, and restricted cash at beginning of period | | 1,203 | | | 945 |
Cash, cash equivalents, and restricted cash at end of period | $ | 982 | | $ | 1,098 |
| | | | | |
Supplemental cash flow information: | | | | | |
Interest paid on debt, net | $ | 12 | | $ | 4 |
Income taxes paid, net of refunds | | 71 | | | 85 |
TE CONNECTIVITY LTD.
RECONCILIATION OF FREE CASH FLOW (UNAUDITED)
| For the Quarters Ended | ||||
| December 24, | | December 25, | ||
| 2021 | | 2020 | ||
| (in millions) | ||||
Net cash provided by operating activities | $ | 532 | | $ | 640 |
Excluding: | | | | | |
Cash (collected) paid pursuant to collateral requirements related to cross-currency swap contracts | | (41) | | | 30 |
Capital expenditures, net | | (118) | | | (141) |
Free cash flow (1) | $ | 373 | | $ | 529 |
| | | | | |
(1) Free cash flow is a non-GAAP financial measure. See description of non-GAAP financial measures. | |||||
TE CONNECTIVITY LTD.
CONSOLIDATED SEGMENT DATA (UNAUDITED)
| For the Quarters Ended | | |||||||||
| December 24, | | | December 25, | | ||||||
| 2021 | | | 2020 | | ||||||
| ($ in millions) | ||||||||||
| Net Sales |
| | | | Net Sales |
| | | ||
Transportation Solutions | $ | 2,158 | | | | | $ | 2,224 | | | |
Industrial Solutions | | 1,059 | | | | | | 873 | | | |
Communications Solutions | | 601 | | | | | | 425 | | | |
Total | $ | 3,818 | | | | | $ | 3,522 | | | |
| | | | | | | | | | | |
| | | | | | | | | | | |
| Operating | | Operating | | Operating | | Operating | ||||
| Income | | Margin | | Income | | Margin | ||||
Transportation Solutions | $ | 395 | | 18.3 | % | | $ | 308 | | 13.8 | % |
Industrial Solutions | | 123 | | 11.6 | | | | 76 | | 8.7 | |
Communications Solutions | | 154 | | 25.6 | | | | 64 | | 15.1 | |
Total | $ | 672 | | 17.6 | % | | $ | 448 | | 12.7 | % |
| | | | | | | | | | | |
| | | | | | | | | | | |
| Adjusted | | Adjusted | | Adjusted | | Adjusted | ||||
| Operating | | Operating | | Operating | | Operating | ||||
| Income (1) | | Margin (1) | | Income (1) | | Margin (1) | ||||
Transportation Solutions | $ | 392 | | 18.2 | % | | $ | 431 | | 19.4 | % |
Industrial Solutions | | 157 | | 14.8 | | | | 118 | | 13.5 | |
Communications Solutions | | 163 | | 27.1 | | | | 75 | | 17.6 | |
Total | $ | 712 | | 18.6 | % | | $ | 624 | | 17.7 | % |
| | | | | | | | | | | |
(1) Adjusted operating income and adjusted operating margin are non-GAAP financial measures. See description of non-GAAP financial measures. | |||||||||||
TE CONNECTIVITY LTD.
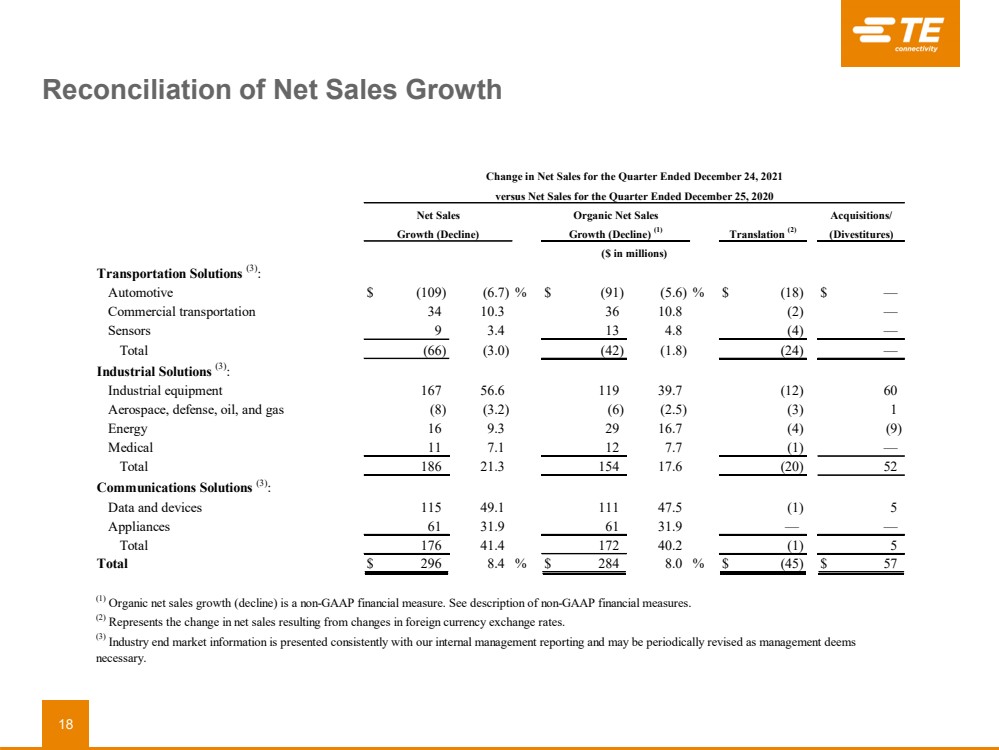
RECONCILIATION OF NET SALES GROWTH (DECLINE) (UNAUDITED)
| Change in Net Sales for the Quarter Ended December 24, 2021 | ||||||||||||||||
| versus Net Sales for the Quarter Ended December 25, 2020 | ||||||||||||||||
| Net Sales | | | Organic Net Sales | | | | | Acquisitions/ | ||||||||
| Growth (Decline) | | | Growth (Decline) (1) | | | Translation (2) | | (Divestitures) | ||||||||
| ($ in millions) | ||||||||||||||||
Transportation Solutions (3): | | |
| | | | | |
| | | | | | | | |
Automotive | $ | (109) | | (6.7) | % | | $ | (91) | | (5.6) | % | | $ | (18) | | $ | — |
Commercial transportation | | 34 | | 10.3 | | | | 36 | | 10.8 | | | | (2) | | | — |
Sensors | | 9 | | 3.4 | | | | 13 | | 4.8 | | | | (4) | | | — |
Total | | (66) | | (3.0) | | | | (42) | | (1.8) | | | | (24) | | | — |
Industrial Solutions (3): | | | | | | | | | | | | | | | | | |
Industrial equipment | | 167 | | 56.6 | | | | 119 | | 39.7 | | | | (12) | | | 60 |
Aerospace, defense, oil, and gas | | (8) | | (3.2) | | | | (6) | | (2.5) | | | | (3) | | | 1 |
Energy | | 16 | | 9.3 | | | | 29 | | 16.7 | | | | (4) | | | (9) |
Medical | | 11 | | 7.1 | | | | 12 | | 7.7 | | | | (1) | | | — |
Total | | 186 | | 21.3 | | | | 154 | | 17.6 | | | | (20) | | | 52 |
Communications Solutions (3): | | | | | | | | | | | | | | | | | |
Data and devices | | 115 | | 49.1 | | | | 111 | | 47.5 | | | | (1) | | | 5 |
Appliances | | 61 | | 31.9 | | | | 61 | | 31.9 | | | | — | | | — |
Total | | 176 | | 41.4 | | | | 172 | | 40.2 | | | | (1) | | | 5 |
Total | $ | 296 | | 8.4 | % | | $ | 284 | | 8.0 | % | | $ | (45) | | $ | 57 |
| | | | | | | | | | | | | | | | | |
(1) Organic net sales growth (decline) is a non-GAAP financial measure. See description of non-GAAP financial measures. | |||||||||||||||||
(2) Represents the change in net sales resulting from changes in foreign currency exchange rates. | |||||||||||||||||
(3) Industry end market information is presented consistently with our internal management reporting and may be periodically revised as management deems necessary. | |||||||||||||||||
TE CONNECTIVITY LTD.
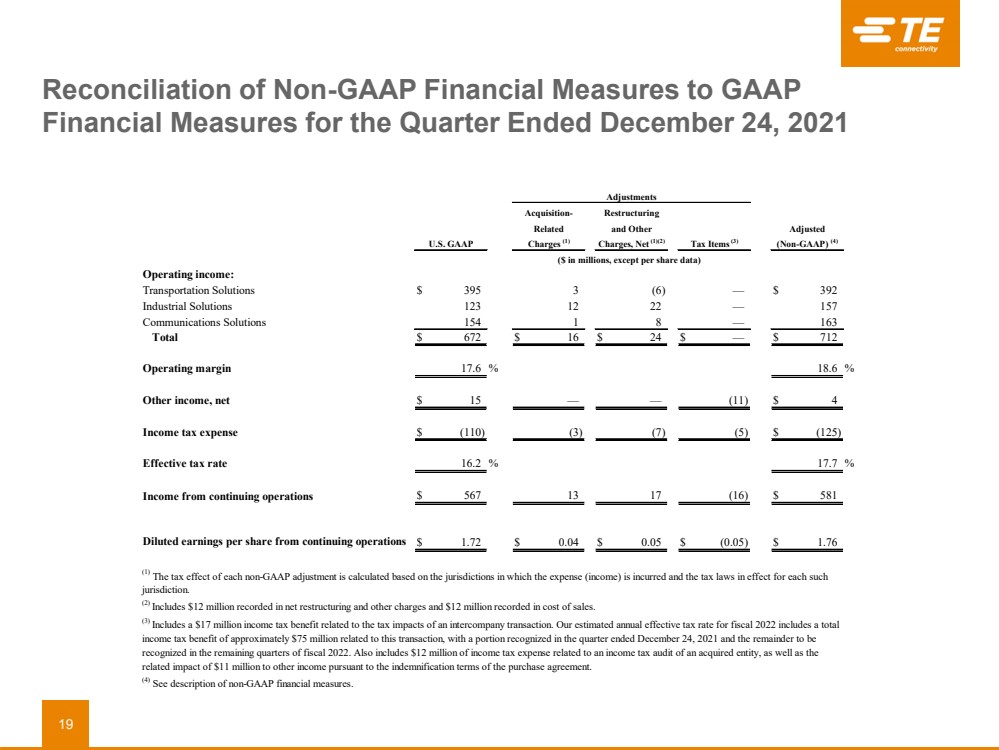
RECONCILIATION OF NON-GAAP FINANCIAL MEASURES TO GAAP FINANCIAL MEASURES
For the Quarter Ended December 24, 2021
(UNAUDITED)
| | | | | Adjustments | | | | | |||||||
| | | | Acquisition- | | Restructuring | | | | | | |||||
| | | | Related | | and Other | | | | Adjusted | | |||||
| U.S. GAAP | | | Charges (1) | | Charges, Net (1)(2) | | Tax Items (3) | | (Non-GAAP) (4) | | |||||
| ($ in millions, except per share data) | | ||||||||||||||
Operating income: | | | | | | | | | | | | | | | | |
Transportation Solutions | $ | 395 | | | | 3 | | | (6) | | | — | | $ | 392 | |
Industrial Solutions | | 123 | | | | 12 | | | 22 | | | — | | | 157 | |
Communications Solutions | | 154 | | | | 1 | | | 8 | | | — | | | 163 | |
Total | $ | 672 | | | $ | 16 | | $ | 24 | | $ | — | | $ | 712 | |
| | | | | | | | | | | | | | | | |
Operating margin | | 17.6 | % | | | | | | | | | | | | 18.6 | % |
| | | | | | | | | | | | | | | | |
Other income, net | $ | 15 | | | | — | | | — | | | (11) | | $ | 4 | |
| | | | | | | | | | | | | | | | |
Income tax expense | $ | (110) | | | | (3) | | | (7) | | | (5) | | $ | (125) | |
| | | | | | | | | | | | | | | | |
Effective tax rate | | 16.2 | % | | | | | | | | | | | | 17.7 | % |
| | | | | | | | | | | | | | | | |
Income from continuing operations | $ | 567 | | | | 13 | | | 17 | | | (16) | | $ | 581 | |
| | | | | | | | | | | | | | | | |
Diluted earnings per share from continuing operations | $ | 1.72 | | | $ | 0.04 | | $ | 0.05 | | $ | (0.05) | | $ | 1.76 | |
| | | | | | | | | | | | | | | | |
(1) The tax effect of each non-GAAP adjustment is calculated based on the jurisdictions in which the expense (income) is incurred and the tax laws in effect for each such jurisdiction. | | |||||||||||||||
(2) Includes $12 million recorded in net restructuring and other charges and $12 million recorded in cost of sales. | ||||||||||||||||
(3) Includes a $17 million income tax benefit related to the tax impacts of an intercompany transaction. Our estimated annual effective tax rate for fiscal 2022 includes a total income tax benefit of approximately $75 million related to this transaction, with a portion recognized in the quarter ended December 24, 2021 and the remainder to be recognized in the remaining quarters of fiscal 2022. Also includes $12 million of income tax expense related to an income tax audit of an acquired entity, as well as the related impact of $11 million to other income pursuant to the indemnification terms of the purchase agreement. | | |||||||||||||||
(4) See description of non-GAAP financial measures. | | |||||||||||||||
TE CONNECTIVITY LTD.
RECONCILIATION OF NON-GAAP FINANCIAL MEASURES TO GAAP FINANCIAL MEASURES
For the Quarter Ended December 25, 2020
(UNAUDITED)
| | | | | Adjustments | | | | | |||||||
| | | | Acquisition- | | Restructuring | | | | | | |||||
| | | | Related | | and Other | | | | Adjusted | | |||||
| U.S. GAAP | | | Charges (1) | | Charges, Net (1) | | Tax Items (2) | | (Non-GAAP) (3) | | |||||
| ($ in millions, except per share data) | | ||||||||||||||
Operating income: | | | | | | | | | | | | | | | | |
Transportation Solutions | $ | 308 | | | $ | 5 | | $ | 118 | | $ | — | | $ | 431 | |
Industrial Solutions | | 76 | | | | 4 | | | 38 | | | — | | | 118 | |
Communications Solutions | | 64 | | | | — | | | 11 | | | — | | | 75 | |
Total | $ | 448 | | | $ | 9 | | $ | 167 | | $ | — | | $ | 624 | |
| | | | | | | | | | | | | | | | |
Operating margin | | 12.7 | % | | | | | | | | | | | | 17.7 | % |
| | | | | | | | | | | | | | | | |
Other expense, net | $ | (1) | | | $ | — | | $ | — | | $ | — | | $ | (1) | |
| | | | | | | | | | | | | | | | |
Income tax expense | $ | (60) | | | $ | (2) | | $ | (32) | | $ | (29) | | $ | (123) | |
| | | | | | | | | | | | | | | | |
Effective tax rate | | 13.8 | % | | | | | | | | | | | | 20.1 | % |
| | | | | | | | | | | | | | | | |
Income from continuing operations | $ | 375 | | | $ | 7 | | $ | 135 | | $ | (29) | | $ | 488 | |
| | | | | | | | | | | | | | | | |
Diluted earnings per share from continuing operations | $ | 1.13 | | | $ | 0.02 | | $ | 0.41 | | $ | (0.09) | | $ | 1.47 | |
| | | | | | | | | | | | | | | | |
(1) The tax effect of each non-GAAP adjustment is calculated based on the jurisdictions in which the expense (income) is incurred and the tax laws in effect for each such jurisdiction. | | |||||||||||||||
(2) Income tax benefits related to an Internal Revenue Service approved change in the tax method of depreciating or amortizing certain assets. | | |||||||||||||||
(3) See description of non-GAAP financial measures. | | |||||||||||||||
TE CONNECTIVITY LTD.
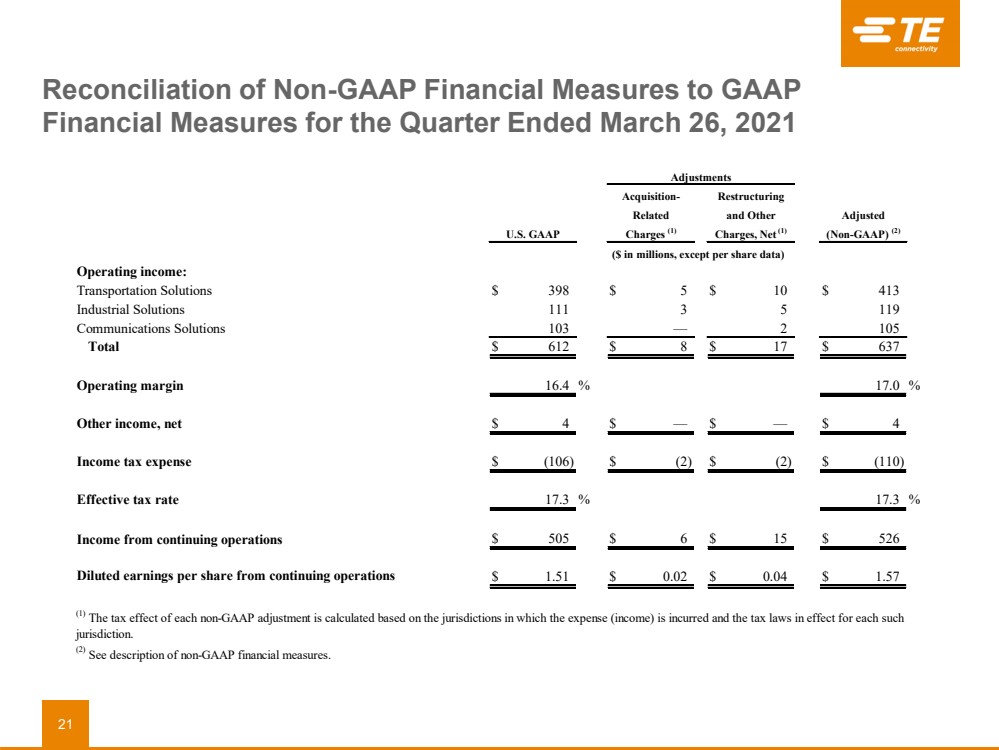
RECONCILIATION OF NON-GAAP FINANCIAL MEASURES TO GAAP FINANCIAL MEASURES
For the Quarter Ended March 26, 2021
(UNAUDITED)
| | | | | Adjustments | | | | | ||||
| | | | Acquisition- | | Restructuring | | | | ||||
| | | | Related | | and Other | | Adjusted | | ||||
| U.S. GAAP | | | Charges (1) | | Charges, Net (1) | | (Non-GAAP) (2) | | ||||
| ($ in millions, except per share data) | | |||||||||||
Operating income: | | | | | | | | | | | | | |
Transportation Solutions | $ | 398 | | | $ | 5 | | $ | 10 | | $ | 413 | |
Industrial Solutions | | 111 | | | | 3 | | | 5 | | | 119 | |
Communications Solutions | | 103 | | | | — | | | 2 | | | 105 | |
Total | $ | 612 | | | $ | 8 | | $ | 17 | | $ | 637 | |
| | | | | | | | | | | | | |
Operating margin | | 16.4 | % | | | | | | | | | 17.0 | % |
| | | | | | | | | | | | | |
Other income, net | $ | 4 | | | $ | — | | $ | — | | $ | 4 | |
| | | | | | | | | | | | | |
Income tax expense | $ | (106) | | | $ | (2) | | $ | (2) | | $ | (110) | |
| | | | | | | | | | | | | |
Effective tax rate | | 17.3 | % | | | | | | | | | 17.3 | % |
| | | | | | | | | | | | | |
Income from continuing operations | $ | 505 | | | $ | 6 | | $ | 15 | | $ | 526 | |
| | | | | | | | | | | | | |
Diluted earnings per share from continuing operations | $ | 1.51 | | | $ | 0.02 | | $ | 0.04 | | $ | 1.57 | |
| | | | | | | | | | | | | |
(1) The tax effect of each non-GAAP adjustment is calculated based on the jurisdictions in which the expense (income) is incurred and the tax laws in effect for each such jurisdiction. | | ||||||||||||
(2) See description of non-GAAP financial measures. | | ||||||||||||
TE CONNECTIVITY LTD.
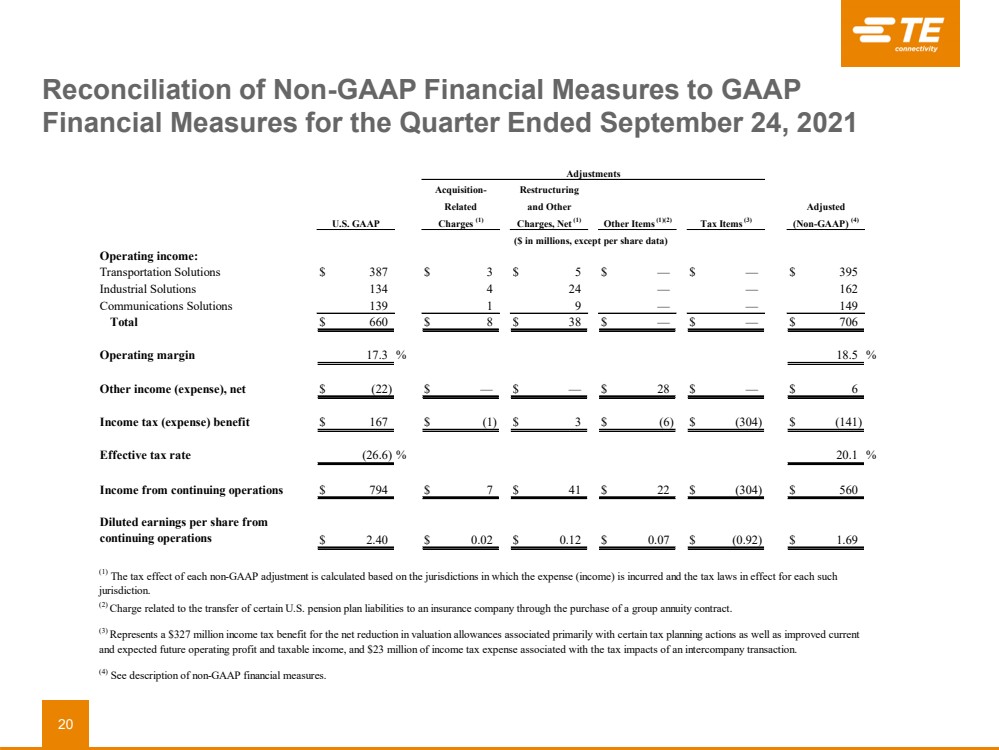
RECONCILIATION OF NON-GAAP FINANCIAL MEASURES TO GAAP FINANCIAL MEASURES
For the Year Ended September 24, 2021
(UNAUDITED)
| | | | | Adjustments | | | | | ||||||||||
| | | | Acquisition- | | Restructuring | | | | | | | | ||||||
| | | | Related | | and Other | | | | | | Adjusted | | ||||||
| U.S. GAAP | | | Charges (1) | | Charges, Net (1) | | Other Items (1)(2) | | Tax Items (3) | | (Non-GAAP) (4) | | ||||||
| ($ in millions, except per share data) | | |||||||||||||||||
Operating income: | | | | | | | | | | | | | | | | | | | |
Transportation Solutions | $ | 1,526 | | | $ | 18 | | $ | 135 | | $ | — | | $ | — | | $ | 1,679 | |
Industrial Solutions | | 469 | | | | 15 | | | 73 | | | — | | | — | | | 557 | |
Communications Solutions | | 439 | | | | 1 | | | 25 | | | — | | | — | | | 465 | |
Total | $ | 2,434 | | | $ | 34 | | $ | 233 | | $ | — | | $ | — | | $ | 2,701 | |
| | | | | | | | | | | | | | | | | | | |
Operating margin | | 16.3 | % | | | | | | | | | | | | | | | 18.1 | % |
| | | | | | | | | | | | | | | | | | | |
Other income (expense), net | $ | (17) | | | $ | — | | $ | — | | $ | 28 | | $ | — | | $ | 11 | |
| | | | | | | | | | | | | | | | | | | |
Income tax expense | $ | (123) | | | $ | (7) | | $ | (35) | | $ | (6) | | $ | (333) | | $ | (504) | |
| | | | | | | | | | | | | | | | | | | |
Effective tax rate | | 5.2 | % | | | | | | | | | | | | | | | 18.9 | % |
| | | | | | | | | | | | | | | | | | | |
Income from continuing operations | $ | 2,255 | | | $ | 27 | | $ | 198 | | $ | 22 | | $ | (333) | | $ | 2,169 | |
| | | | | | | | | | | | | | | | | | | |
Diluted earnings per share from continuing operations | $ | 6.77 | | | $ | 0.08 | | $ | 0.59 | | $ | 0.07 | | $ | (1.00) | | $ | 6.51 | |
| | | | | | | | | | | | | | | | | | | |
(1) The tax effect of each non-GAAP adjustment is calculated based on the jurisdictions in which the expense (income) is incurred and the tax laws in effect for each such jurisdiction. | | ||||||||||||||||||
(2) Charge related to the transfer of certain U.S. pension plan liabilities to an insurance company through the purchase of a group annuity contract. | | ||||||||||||||||||
(3) Represents a $327 million income tax benefit for the net reduction in valuation allowances associated primarily with certain tax planning actions as well as improved current and expected future operating profit and taxable income, $29 million of income tax benefits related to an Internal Revenue Service approved change in the tax method of depreciating or amortizing certain assets, and $23 million of income tax expense associated with the tax impacts of an intercompany transaction. | | ||||||||||||||||||
(4) See description of non-GAAP financial measures. | | ||||||||||||||||||
TE CONNECTIVITY LTD.
RECONCILIATION OF FORWARD-LOOKING NON-GAAP FINANCIAL MEASURES
TO FORWARD-LOOKING GAAP FINANCIAL MEASURES
As of January 26, 2022
(UNAUDITED)
| Outlook for | | |
| Quarter Ending | | |
| March 25, | | |
| 2022 | | |
Diluted earnings per share from continuing operations | $ | 1.52 | |
Restructuring and other charges, net | | 0.12 | |
Acquisition-related charges | | 0.03 | |
Tax items | | 0.03 | |
Adjusted diluted earnings per share from continuing operations (1) | $ | 1.70 | |
| | | |
| | | |
Net sales growth | | 1.7 | % |
Translation | | 3.0 | |
(Acquisitions) divestitures, net | | (2.0) | |
Organic net sales growth (1) | | 2.7 | % |
| | | |
(1) See description of non-GAAP financial measures. | |||
Exhibit 99.2
| EVERY CONNECTION COUNTS TE Connectivity First Quarter 2022 Earnings January 26, 2022 |

| Forward - Looking Statements This presentation contains certain "forward - looking statements" within the meaning of the U.S. Private Securities Litigation Ref orm Act of 1995. These statements are based on management's current expectations and are subject to risks, uncertainty and changes in circumstances, which may cause actual results, performance, financial condition or achievements to differ materially from ant ici pated results, performance, financial condition or achievements. All statements contained herein that are not clearly historical in nature a re forward - looking and the words "anticipate," "believe," "expect," "estimate," "plan," and similar expressions are generally intended to identi fy forward - looking statements. We have no intention and are under no obligation to update or alter (and expressly disclaim any such intention or ob ligation to do so) our forward - looking statements whether as a result of new information, future events or otherwise, except to the extent requ ired by law. The forward - looking statements in this presentation include statements addressing our future financial condition and operating r esults, and the impact on our operations resulting from the coronavirus disease 2019 (“COVID - 19”). Examples of factors that could cause actu al results to differ materially from those described in the forward - looking statements include, among others, the extent, severity and dura tion of COVID - 19 negatively affecting our business operations; business, economic, competitive and regulatory risks, such as conditions aff ect ing demand for products in the automotive and other industries we serve; competition and pricing pressure; fluctuations in foreign curre ncy exchange rates and commodity prices; natural disasters and political, economic and military instability in countries in which we opera te; developments in the credit markets; future goodwill impairment; compliance with current and future environmental and other laws and regula tio ns; and the possible effects on us of changes in tax laws, tax treaties and other legislation, including the effects of Swiss tax reform. In addition, the extent to which COVID - 19 will impact our business and our financial results will depend on future developments, which are highly uncert ain and cannot be predicted. Such developments may include the geographic spread of the virus, the severity of the virus, the duratio n o f the outbreak, the impact on our suppliers’ and customers’ supply chains, the actions that may be taken by various governmental au tho rities in response to the outbreak in jurisdictions in which we operate, and the possible impact on the global economy and local econom ies in which we operate. More detailed information about these and other factors is set forth in TE Connectivity Ltd.'s Annual Report on For m 10 - K for the fiscal year ended Sept. 24, 2021 as well as in our Quarterly Reports on Form 10 - Q, Current Reports on Form 8 - K and other reports filed by us with the U.S. Securities and Exchange Commission. Non - GAAP Financial Measures Where we have used non - GAAP financial measures, reconciliations to the most comparable GAAP measure are provided, along with a disclosure on the usefulness of the non - GAAP financial measure, in this presentation. Forward - Looking Statements and Non - GAAP Financial Measures 2 |
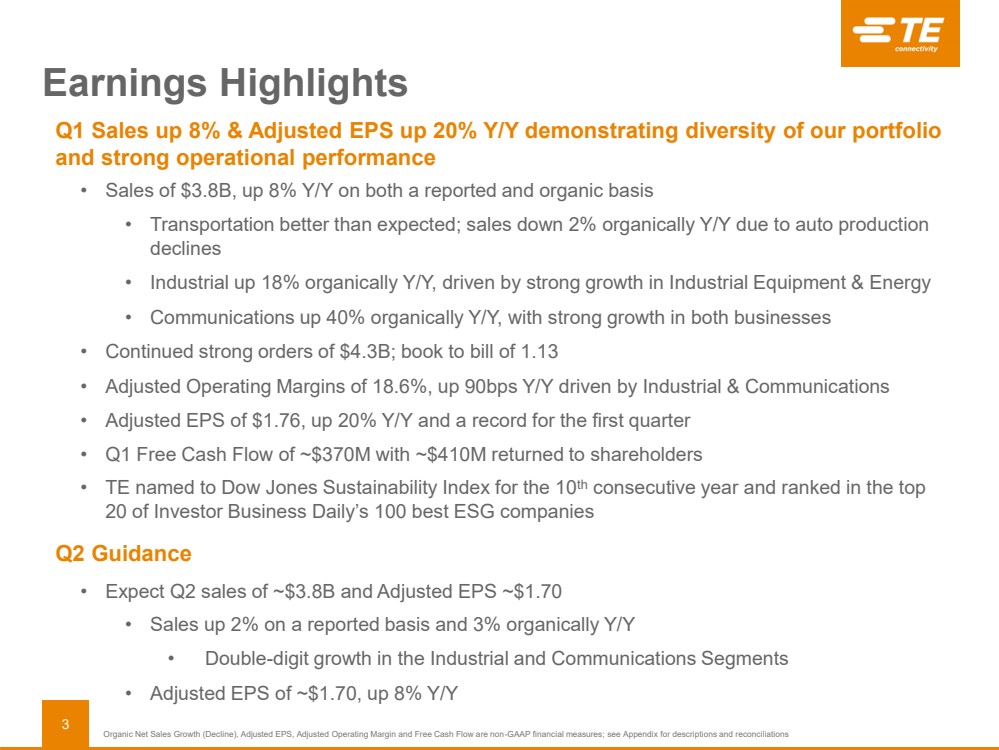
| Earnings Highlights Q1 Sales up 8% & Adjusted EPS up 20% Y/Y demonstrating diversity of our portfolio and strong operational performance • Sales of $3.8B, up 8% Y/Y on both a reported and organic basis • Transportation better than expected; sales down 2% organically Y/Y due to auto production declines • Industrial up 18% organically Y/Y, driven by strong growth in Industrial Equipment & Energy • Communications up 40% organically Y/Y, with strong growth in both businesses • Continued strong orders of $4.3B; book to bill of 1.13 • Adjusted Operating Margins of 18.6%, up 90bps Y/Y driven by Industrial & Communications • Adjusted EPS of $1.76, up 20% Y/Y and a record for the first quarter • Q1 Free Cash Flow of ~$370M with ~$410M returned to shareholders • TE named to Dow Jones Sustainability Index for the 10 th consecutive year and ranked in the top 20 of Investor Business Daily’s 100 best ESG companies Q2 Guidance • Expect Q2 sales of ~$3.8B and Adjusted EPS ~$1.70 • Sales up 2% on a reported basis and 3% organically Y/Y • Double - digit growth in the Industrial and Communications Segments • Adjusted EPS of ~$1.70, up 8% Y/Y Organic Net Sales Growth (Decline), Adjusted EPS, Adjusted Operating Margin and Free Cash Flow are non - GAAP financial measures; see Appendix for descriptions and reconciliations 3 |
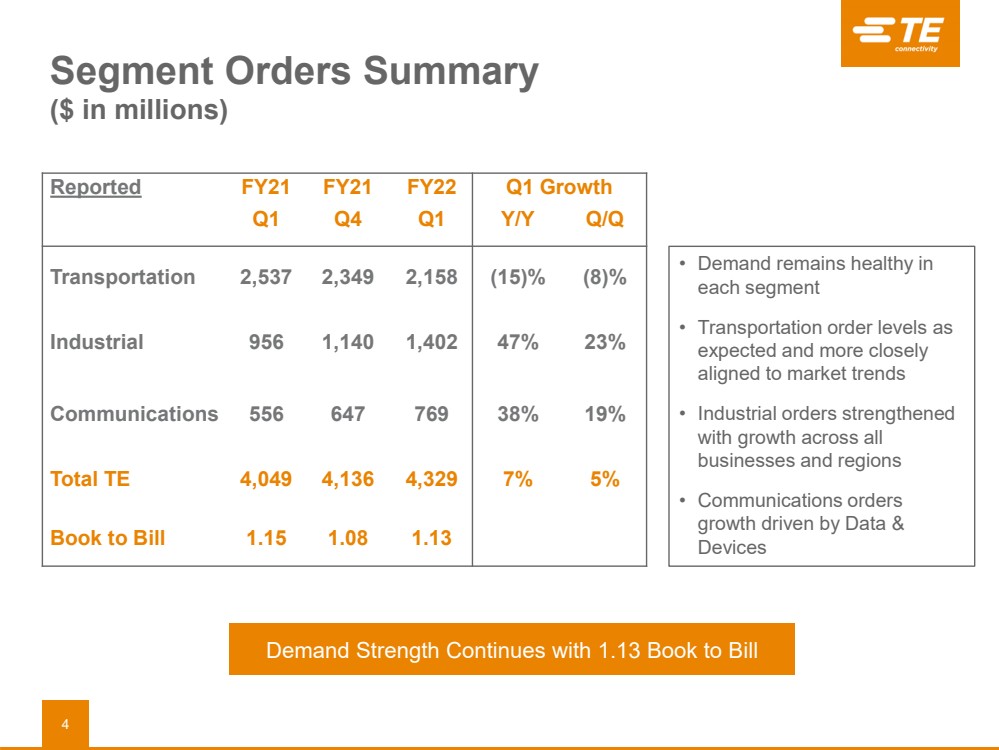
| Reported FY21 FY21 FY22 Q1 Growth Q1 Q4 Q1 Y/Y Q/Q Transportation 2,537 2,349 2,158 (15)% (8)% Industrial 956 1,140 1,402 47% 23% Communications 556 647 769 38% 19% Total TE 4,049 4,136 4,329 7% 5% Book to Bill 1.15 1.08 1.13 Segment Orders Summary ($ in millions) 4 • Demand remains healthy in each segment • Transportation order levels as expected and more closely aligned to market trends • Industrial orders strengthened with growth across all businesses and regions • Communications orders growth driven by Data & Devices Demand Strength Continues with 1.13 Book to Bill |
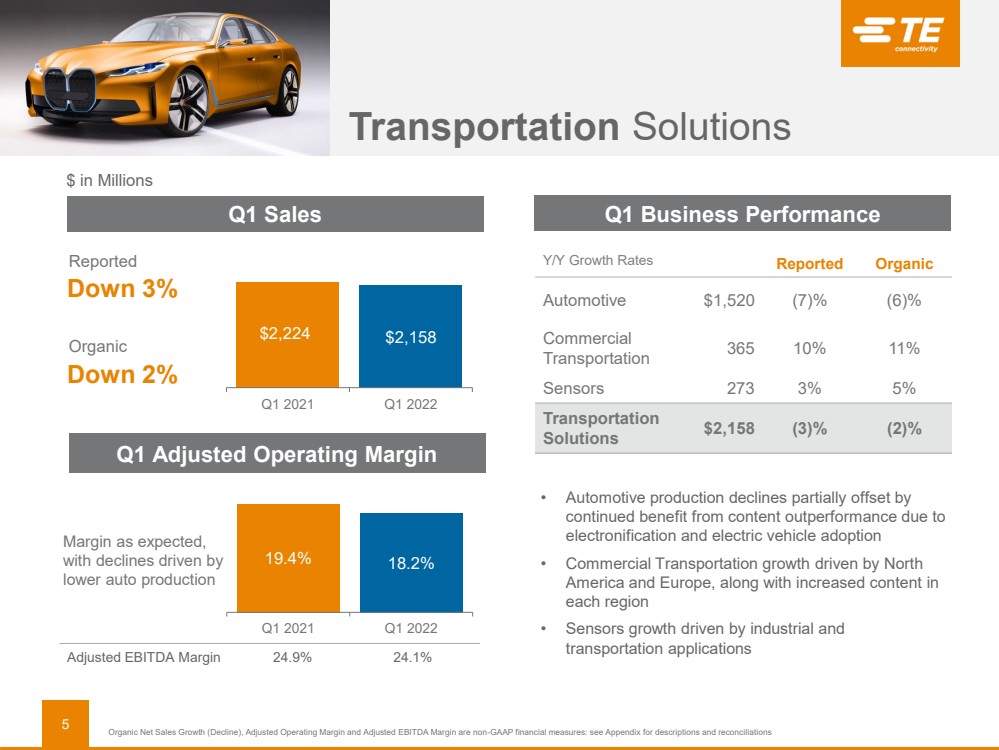
| Transportation Solutions $2,224 $2,158 Q1 2021 Q1 2022 • Automotive production declines partially offset by continued benefit from content outperformance due to electronification and electric vehicle adoption • Commercial Transportation growth driven by North America and Europe, along with increased content in each region • Sensors growth driven by industrial and transportation applications Y/Y Growth Rates Reported Organic Automotive $1,520 (7)% (6)% Commercial Transportation 365 10% 11% Sensors 273 3% 5% Transportation Solutions $2,158 (3)% (2)% Q1 Sales Q1 Business Performance Q1 Adjusted Operating Margin $ in Millions Reported Down 3% Organic Down 2% Margin as expected, with declines driven by lower auto production Adjusted EBITDA Margin 24.9% 24.1% 5 Organic Net Sales Growth (Decline), Adjusted Operating Margin and Adjusted EBITDA Margin are non - GAAP financial measures: see Ap pendix for descriptions and reconciliations 19.4% 18.2% Q1 2021 Q1 2022 |
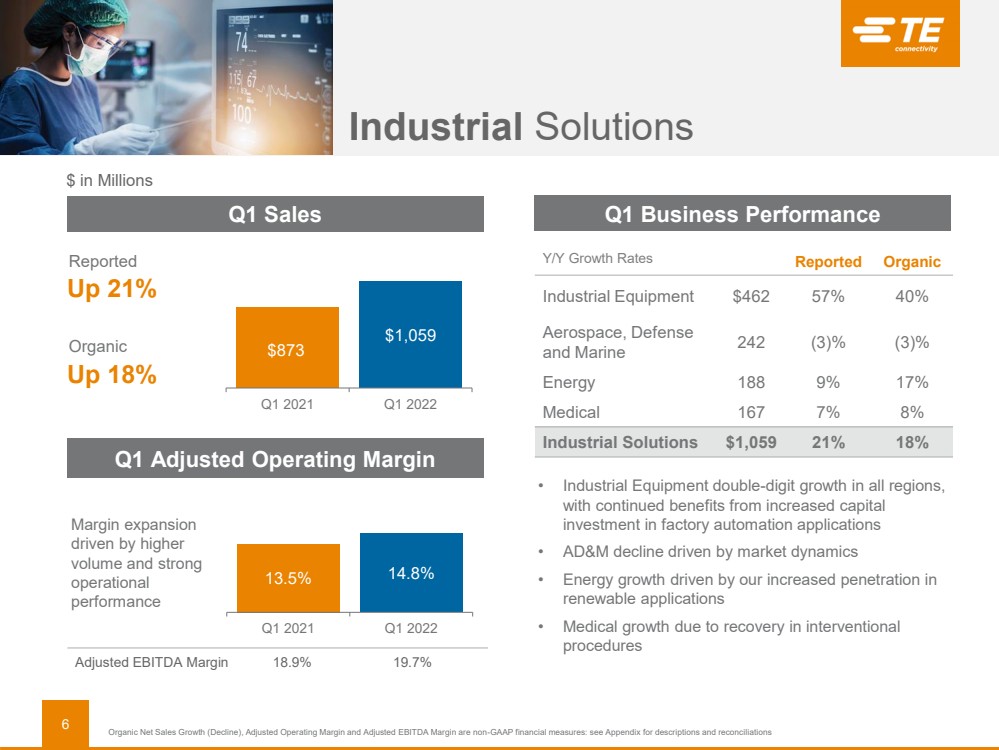
| Industrial Solutions $873 $1,059 Q1 2021 Q1 2022 Y/Y Growth Rates Reported Organic Industrial Equipment $462 57% 40% Aerospace , Defense and Marine 242 (3)% (3)% Energy 188 9% 17% Medical 167 7% 8% Industrial Solutions $1,059 21% 18% Margin expansion driven by higher volume and strong operational performance 13.5% 14.8% Q1 2021 Q1 2022 Adjusted EBITDA Margin 18.9% 19.7% • Industrial Equipment double - digit growth in all regions, with continued benefits from increased capital investment in factory automation applications • AD&M decline driven by market dynamics • Energy growth driven by our increased penetration in renewable applications • Medical growth due to recovery in interventional procedures $ in Millions Q1 Sales Q1 Business Performance Q1 Adjusted Operating Margin Reported Up 21% Organic Up 18% 6 Organic Net Sales Growth (Decline), Adjusted Operating Margin and Adjusted EBITDA Margin are non - GAAP financial measures: see Ap pendix for descriptions and reconciliations |
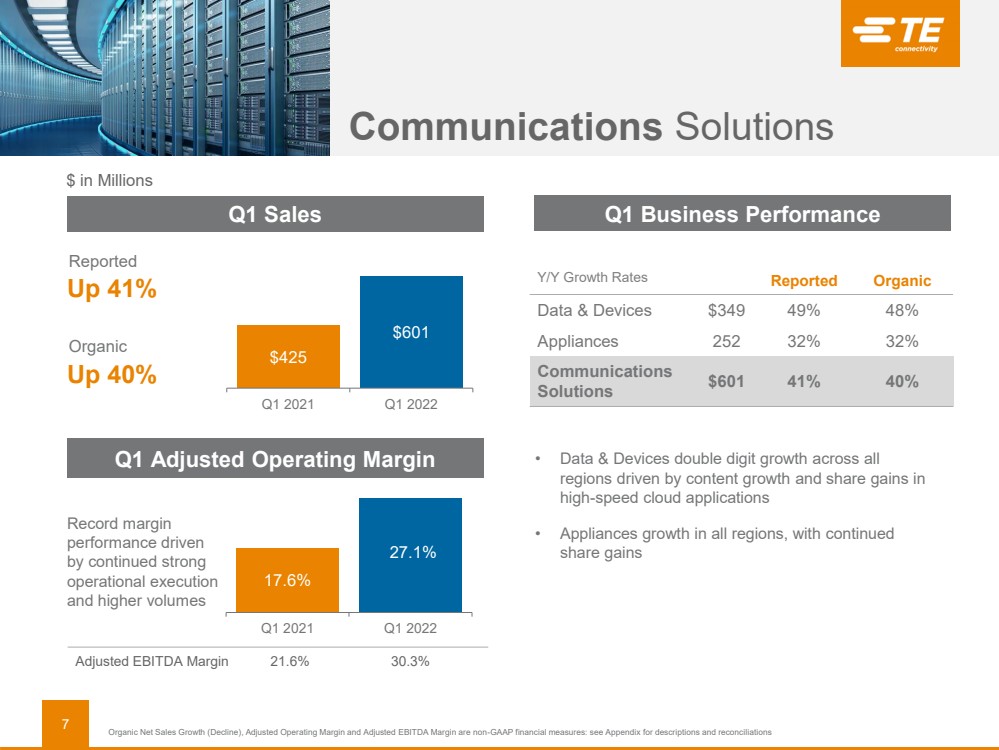
| $425 $601 Q1 2021 Q1 2022 Reported Up 41% Organic Up 40% Y/Y Growth Rates Reported Organic Data & Devices $349 49% 48% Appliances 252 32% 32% Communications Solutions $601 41% 40% • D ata & Devices double digit growth across all regions driven by content growth and share gains in high - speed clou d applications • Appliances growth in all regions, with continued share gains 17.6% 27.1% Q1 2021 Q1 2022 Record margin performance driven by continued strong operational execution and higher volumes Organic Net Sales Growth (Decline), Adjusted Operating Margin and Adjusted EBITDA Margin are non - GAAP financial measures: see Ap pendix for descriptions and reconciliations Communications Solutions Q1 Sales Q1 Adjusted Operating Margin Q1 Business Performance $ in Millions Adjusted EBITDA Margin 21.6% 30.3% 7 |
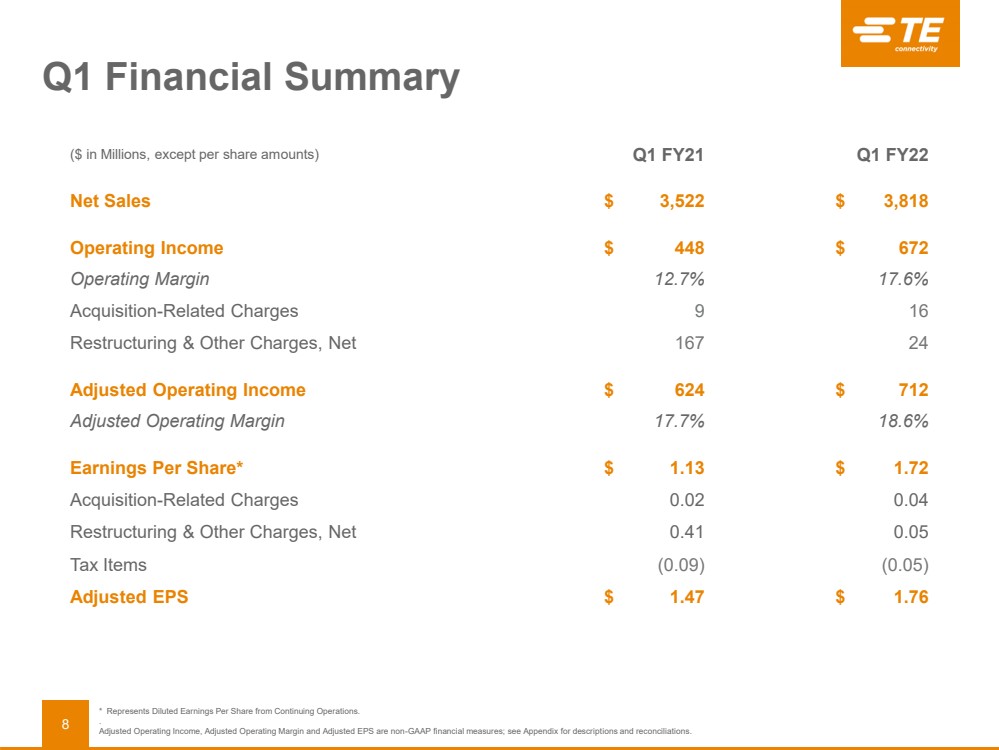
| Q1 Financial Summary ($ in Millions, except per share amounts) Q1 FY21 Q1 FY22 Net Sales $ 3,522 $ 3,818 Operating Income $ 448 $ 672 Operating Margin 12.7% 17.6% Acquisition - Related Charges 9 16 Restructuring & Other Charges, Net 167 24 Adjusted Operating Income $ 624 $ 712 Adjusted Operating Margin 17.7% 18.6% Earnings Per Share* $ 1.13 $ 1.72 Acquisition - Related Charges 0.02 0.04 Restructuring & Other Charges, Net 0.41 0.05 Tax Items (0.09) (0.05) Adjusted EPS $ 1.47 $ 1.76 * Represents Diluted Earnings Per Share from Continuing Operations. .. Adjusted Operating Income, Adjusted Operating Margin and Adjusted EPS are non - GAAP financial measures; see Appendix for descript ions and reconciliations. 8 |
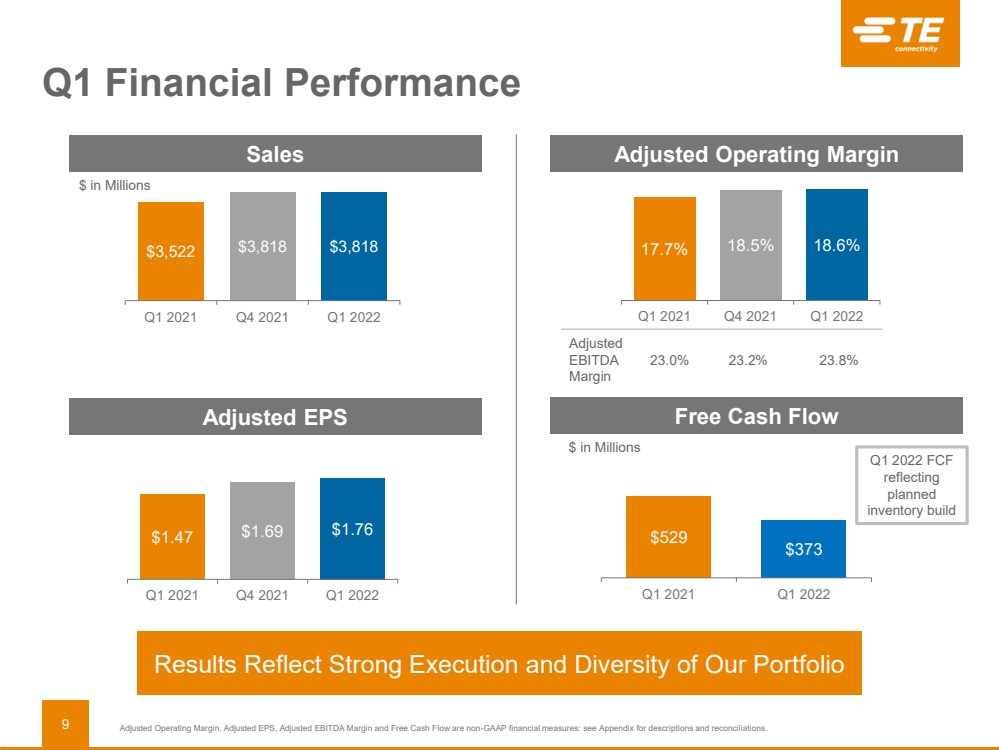
| Q1 Financial Performance $3,522 $3,818 $3,818 Q1 2021 Q4 2021 Q1 2022 $1.47 $1.69 $1.76 Q1 2021 Q4 2021 Q1 2022 Adjusted EBITDA Margin 23.0% 23.2% 23.8% 17.7% 18.5% 18.6% Q1 2021 Q4 2021 Q1 2022 Adjusted Operating Margin, Adjusted EPS, Adjusted EBITDA Margin and Free Cash Flow are non - GAAP financial measures: see Appendix for descriptions and reconciliations. Sales Adjusted Operating Margin Free Cash Flow Adjusted EPS Results Reflect Strong Execution and Diversity of Our Portfolio 9 $529 $373 Q1 2021 Q1 2022 $ in Millions $ in Millions Q1 2022 FCF reflecting planned inventory build |
| EVERY CONNECTION COUNTS Additional Information |

| Y/Y Q1 2022 Adjusted EPS is a non - GAAP financial measure; See Appendix for description and reconciliation. Sales (in millions) Adjusted EPS Q1 2021 Results $3,522 $1.47 Operational Performance 341 0.23 FX Impact (45) 0.01 Tax Rate Impact - 0.05 Q1 2022 Results $3,818 $1.76 11 |

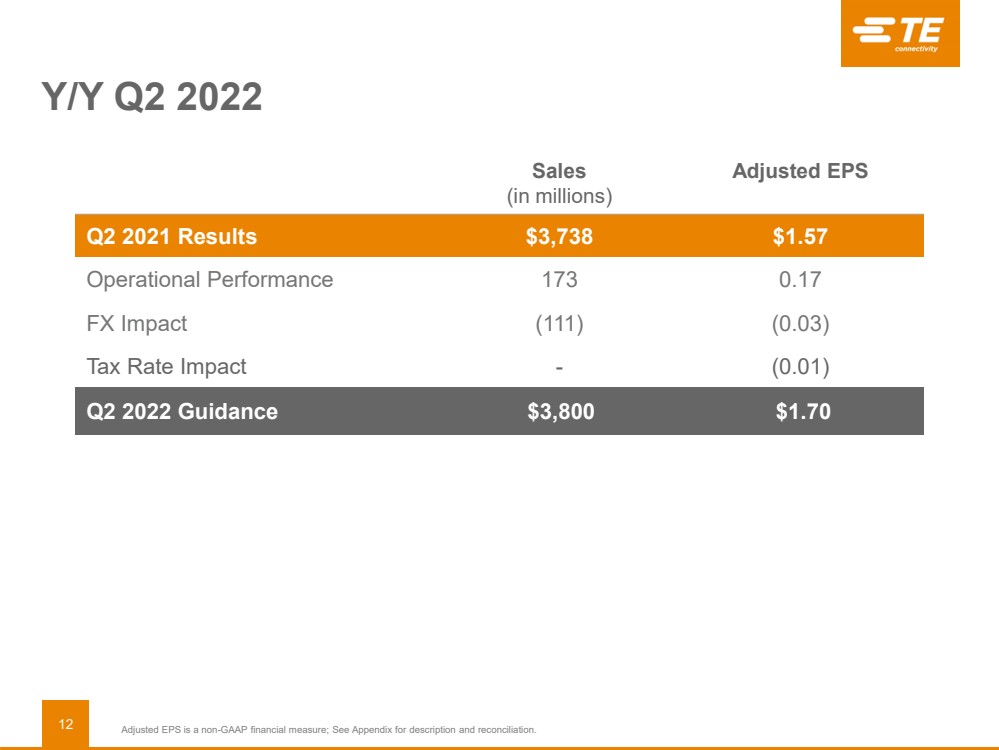
| Y/Y Q2 2022 Adjusted EPS is a non - GAAP financial measure; See Appendix for description and reconciliation. Sales (in millions) Adjusted EPS Q2 2021 Results $3,738 $1.57 Operational Performance 173 0.17 FX Impact (111) (0.03) Tax Rate Impact - (0.01) Q2 2022 Guidance $3,800 $1.70 12 |
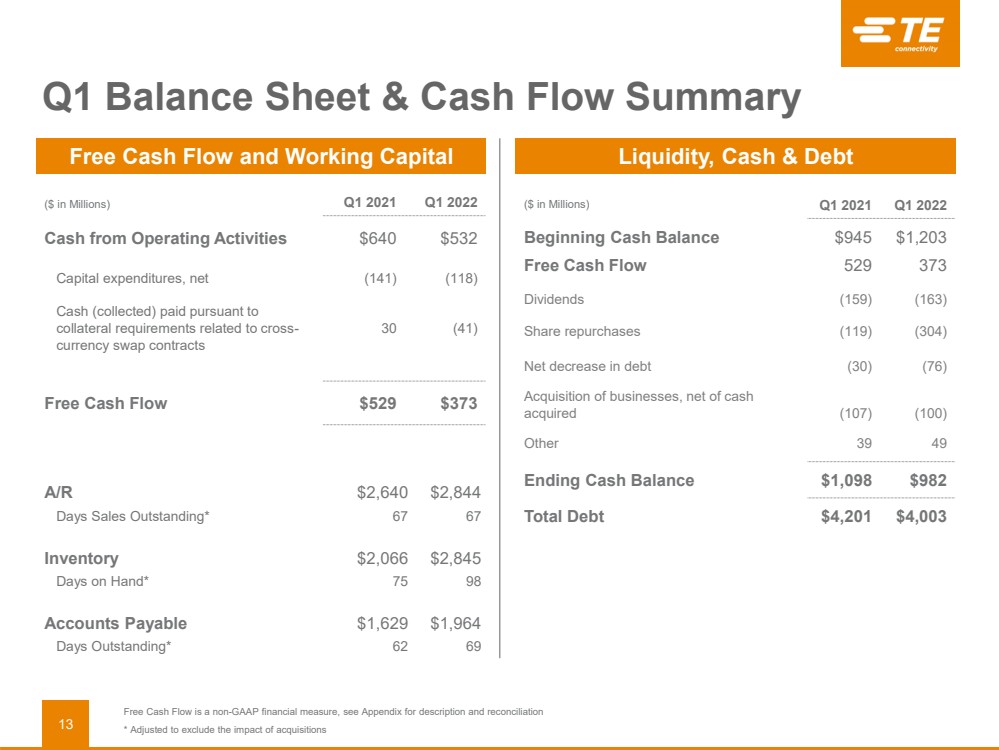
| ($ in Millions) Q1 2021 Q1 2022 Beginning Cash Balance $945 $1,203 Free Cash Flow 529 373 Dividends (159) (163) Share repurchases (119) (304) Net decrease in debt (30) (76) Acquisition of businesses, net of cash acquired (107) (100) Other 39 49 Ending Cash Balance $1,098 $982 Total Debt $4,201 $4,003 A/R $2,640 $2,844 Days Sales Outstanding* 67 67 Inventory $2,066 $2,845 Days on Hand* 75 98 Accounts Payable $1,629 $1,964 Days Outstanding* 62 69 Free Cash Flow and Working Capital Liquidity, Cash & Debt ($ in Millions) Q1 2021 Q1 2022 Cash from Operating Activities $640 $532 Capital expenditures, net Cash (collected) paid pursuant to collateral requirements related to cross - currency swap contracts (141) 30 (118) (41) Free Cash Flow $529 $373 Free Cash Flow is a non - GAAP financial measure, see Appendix for description and reconciliation * Adjusted to exclude the impact of acquisitions Q1 Balance Sheet & Cash Flow Summary 13 |
| EVERY CONNECTION COUNTS Appendix |

| 15 Non - GAAP Financial Measures We present non - GAAP performance and liquidity measures as we believe it is appropriate for investors to consider adjusted financ ial measures in addition to results in accordance with accounting principles generally accepted in the U.S. (“GAAP”). These non - GAAP financial measures provide supplem ental information and should not be considered replacements for results in accordance with GAAP. Management uses non - GAAP financial measures internally for planning and forecasting purposes and in its decision - making processes related to the operations of our company. We believe these measures provide meaningful information to us and investors because they enhance the understanding of our operating performance, ability to generate cash, and the trends of our business. Additionally, we be lie ve that investors benefit from having access to the same financial measures that management uses in evaluating our operations. The primary limitation of these measures is th at they exclude the financial impact of items that would otherwise either increase or decrease our reported results. This limitation is best addressed by using these non - GAAP financial measures in combination with the most directly comparable GAAP financial measures in order to better understand the amounts, character, and impact of any incr eas e or decrease in reported amounts. These non - GAAP financial measures may not be comparable to similarly - titled measures reported by other companies. The following provides additional information regarding our non - GAAP financial measures: • Organic Net Sales Growth (Decline) – represents net sales growth (decline) (the most comparable GAAP financial measure) excludin g the impact of foreign currency exchange rates, and acquisitions and divestitures that occurred in the preceding twelve months, if any. Organic Net Sales Gro wth (Decline) is a useful measure of our performance because it excludes items that are not completely under management’s control, such as the impact of changes in fo rei gn currency exchange rates, and items that do not reflect the underlying growth of the company, such as acquisition and divestiture activity. This measure is a sig nif icant component in our incentive compensation plans. • Adjusted Operating Income and Adjusted Operating Margin – represent operating income and operating margin, respectively, (the mo st comparable GAAP financial measures) before special items including restructuring and other charges, acquisition - related charges, impairment of goodwill, a nd other income or charges, if any. We utilize these adjusted measures in combination with operating income and operating margin to assess segment level operating p erf ormance and to provide insight to management in evaluating segment operating plan execution and market conditions. Adjusted Operating Income is a significant c omp onent in our incentive compensation plans. • Adjusted Other Income (Expense), Net – represents net other income (expense) (the most comparable GAAP financial measure) before special items including tax sharing income related to adjustments to prior period tax returns and other items, if any. • Adjusted Income Tax (Expense) Benefit and Adjusted Effective Tax Rate – represent income tax (expense) benefit and effective tax rate, respectively, (the most comparable GAAP financial measures) after adjusting for the tax effect of special items including restructuring and other cha rge s, acquisition - related charges, impairment of goodwill, other income or charges, and certain significant tax items, if any. • Adjusted Income from Continuing Operations – represents income from continuing operations (the most comparable GAAP financial me asure) before special items including restructuring and other charges, acquisition - related charges, impairment of goodwill, tax sharing income related to adjustments to prior period tax returns and other tax items, other income or charges, and certain significant tax items, if any, and, if applicable, the related tax effects. • Adjusted Earnings Per Share – represents diluted earnings per share from continuing operations (the most comparable GAAP financi al measure) before special items including restructuring and other charges, acquisition - related charges, impairment of goodwill, tax sharing income related to ad justments to prior period tax returns and other tax items, other income or charges, and certain significant tax items, if any, and, if applicable, the related tax effects. T his measure is a significant component in our incentive compensation plans. |

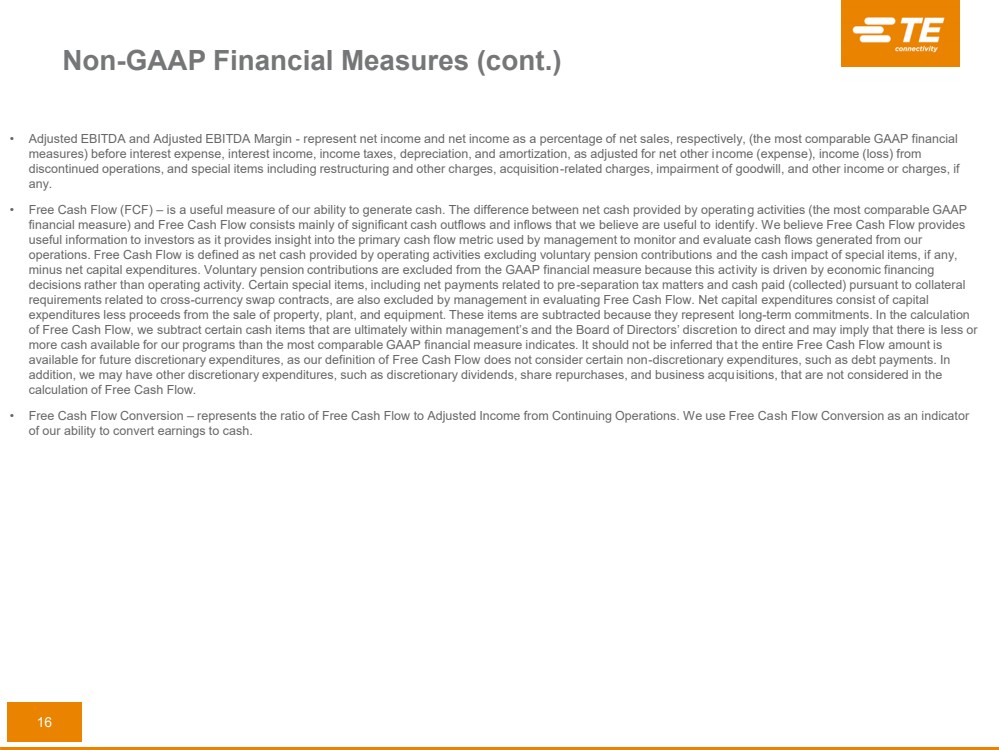
| 16 • Adjusted EBITDA and Adjusted EBITDA Margin - represent net income and net income as a percentage of net sales, respectively, (th e most comparable GAAP financial measures) before interest expense, interest income, income taxes, depreciation, and amortization, as adjusted for net other i nco me (expense), income (loss) from discontinued operations, and special items including restructuring and other charges, acquisition - related charges, impairment of goodwill, and other income or charges, if any. • Free Cash Flow (FCF) – is a useful measure of our ability to generate cash. The difference between net cash provided by operatin g activities (the most comparable GAAP financial measure) and Free Cash Flow consists mainly of significant cash outflows and inflows that we believe are useful to ide ntify. We believe Free Cash Flow provides useful information to investors as it provides insight into the primary cash flow metric used by management to monitor and ev alu ate cash flows generated from our operations. Free Cash Flow is defined as net cash provided by operating activities excluding voluntary pension contributions and the cash impact of special items, if any, minus net capital expenditures. Voluntary pension contributions are excluded from the GAAP financial measure because this act ivi ty is driven by economic financing decisions rather than operating activity. Certain special items, including net payments related to pre - separation tax matters an d cash paid (collected) pursuant to collateral requirements related to cross - currency swap contracts, are also excluded by management in evaluating Free Cash Flow. Net capital expenditures consist of capital expenditures less proceeds from the sale of property, plant, and equipment. These items are subtracted because they represent lo ng - term commitments. In the calculation of Free Cash Flow, we subtract certain cash items that are ultimately within management’s and the Board of Directors’ discret ion to direct and may imply that there is less or more cash available for our programs than the most comparable GAAP financial measure indicates. It should not be inferred tha t t he entire Free Cash Flow amount is available for future discretionary expenditures, as our definition of Free Cash Flow does not consider certain non - discretionary expenditures, such as debt payments. In addition, we may have other discretionary expenditures, such as discretionary dividends, share repurchases, and business acqu isi tions, that are not considered in the calculation of Free Cash Flow. • Free Cash Flow Conversion – represents the ratio of Free Cash Flow to Adjusted Income from Continuing Operations. We use Free Ca sh Flow Conversion as an indicator of our ability to convert earnings to cash. Non - GAAP Financial Measures (cont.) |
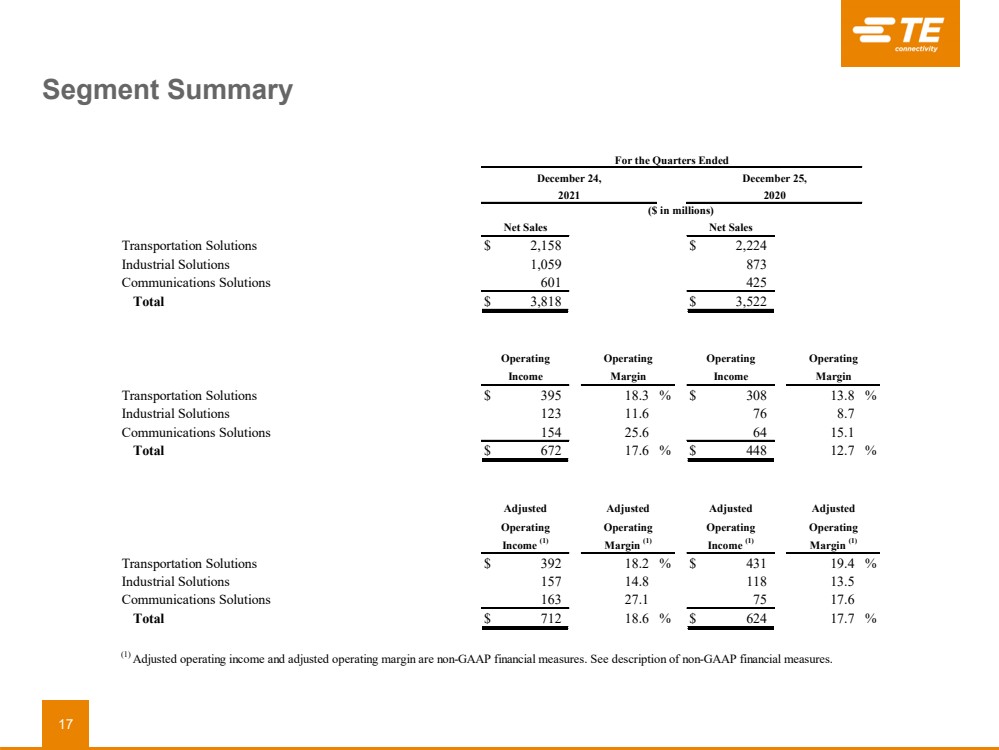
| Segment Summary 17 Transportation Solutions $ 2,158 $ 2,224 Industrial Solutions 1,059 873 Communications Solutions 601 425 Total $ 3,818 $ 3,522 Transportation Solutions $ 395 18.3 % $ 308 13.8 % Industrial Solutions 123 11.6 76 8.7 Communications Solutions 154 25.6 64 15.1 Total $ 672 17.6 % $ 448 12.7 % Transportation Solutions $ 392 18.2 % $ 431 19.4 % Industrial Solutions 157 14.8 118 13.5 Communications Solutions 163 27.1 75 17.6 Total $ 712 18.6 % $ 624 17.7 % Operating Margin Operating Margin Adjusted Operating Margin (1) (1) Adjusted operating income and adjusted operating margin are non-GAAP financial measures. See description of non-GAAP financial measures. 2021 2020 ($ in millions) Adjusted Operating Net Sales Net Sales Income (1) Adjusted Operating Income (1) Income Operating Operating Income Adjusted Operating Margin (1) For the Quarters Ended December 25, December 24, |
| Reconciliation of Net Sales Growth 18 Transportation Solutions (3) : Automotive $ (109) (6.7) % $ (91) (5.6) % $ (18) $ — Commercial transportation 34 10.3 36 10.8 (2) — Sensors 9 3.4 13 4.8 (4) — Total (66) (3.0) (42) (1.8) (24) — Industrial Solutions (3) : Industrial equipment 167 56.6 119 39.7 (12) 60 Aerospace, defense, oil, and gas (8) (3.2) (6) (2.5) (3) 1 Energy 16 9.3 29 16.7 (4) (9) Medical 11 7.1 12 7.7 (1) — Total 186 21.3 154 17.6 (20) 52 Communications Solutions (3) : Data and devices 115 49.1 111 47.5 (1) 5 Appliances 61 31.9 61 31.9 — — Total 176 41.4 172 40.2 (1) 5 Total $ 296 8.4 % $ 284 8.0 % $ (45) $ 57 ($ in millions) Translation (2) Acquisitions/ (Divestitures) (1) Organic net sales growth (decline) is a non-GAAP financial measure. See description of non-GAAP financial measures. (2) Represents the change in net sales resulting from changes in foreign currency exchange rates. (3) Industry end market information is presented consistently with our internal management reporting and may be periodically revised as management deems necessary. Net Sales Growth (Decline) Organic Net Sales Growth (Decline) (1) Change in Net Sales for the Quarter Ended December 24, 2021 versus Net Sales for the Quarter Ended December 25, 2020 |
| Reconciliation of Non - GAAP Financial Measures to GAAP Financial Measures for the Quarter Ended December 24, 2021 19 Operating income: Transportation Solutions $ 395 3 (6) — $ 392 Industrial Solutions 123 12 22 — 157 Communications Solutions 154 1 8 — 163 Total $ 672 $ 16 $ 24 $ — $ 712 Operating margin 17.6 % 18.6 % Other income, net $ 15 — — (11) $ 4 Income tax expense $ (110) (3) (7) (5) $ (125) Effective tax rate 16.2 % 17.7 % Income from continuing operations $ 567 13 17 (16) $ 581 Diluted earnings per share from continuing operations $ 1.72 $ 0.04 $ 0.05 $ (0.05) $ 1.76 and Other Adjusted Related Acquisition- Restructuring Adjustments (4) See description of non-GAAP financial measures. (1) The tax effect of each non-GAAP adjustment is calculated based on the jurisdictions in which the expense (income) is incurred and the tax laws in effect for each such jurisdiction. U.S. GAAP Charges (1) (Non-GAAP) (4) Charges, Net (1)(2) Tax Items (3) ($ in millions, except per share data) (3) Includes a $17 million income tax benefit related to the tax impacts of an intercompany transaction. Our estimated annual effective tax rate for fiscal 2022 includes a total income tax benefit of approximately $75 million related to this transaction, with a portion recognized in the quarter ended December 24, 2021 and the remainder to be recognized in the remaining quarters of fiscal 2022. Also includes $12 million of income tax expense related to an income tax audit of an acquired entity, as well as the related impact of $11 million to other income pursuant to the indemnification terms of the purchase agreement. (2) Includes $12 million recorded in net restructuring and other charges and $12 million recorded in cost of sales. |
| Reconciliation of Non - GAAP Financial Measures to GAAP Financial Measures for the Quarter Ended September 24, 2021 20 Operating income: Transportation Solutions $ 387 $ 3 $ 5 $ — $ — $ 395 Industrial Solutions 134 4 24 — — 162 Communications Solutions 139 1 9 — — 149 Total $ 660 $ 8 $ 38 $ — $ — $ 706 Operating margin 17.3 % 18.5 % Other income (expense), net $ (22) $ — $ — $ 28 $ — $ 6 Income tax (expense) benefit $ 167 $ (1) $ 3 $ (6) $ (304) $ (141) Effective tax rate (26.6) % 20.1 % Income from continuing operations $ 794 $ 7 $ 41 $ 22 $ (304) $ 560 Diluted earnings per share from continuing operations $ 2.40 $ 0.02 $ 0.12 $ 0.07 $ (0.92) $ 1.69 (4) See description of non-GAAP financial measures. (1) The tax effect of each non-GAAP adjustment is calculated based on the jurisdictions in which the expense (income) is incurred and the tax laws in effect for each such jurisdiction. U.S. GAAP Charges (1) (Non-GAAP) (4) Charges, Net (1) Tax Items (3) ($ in millions, except per share data) Other Items (1)(2) (3) Represents a $327 million income tax benefit for the net reduction in valuation allowances associated primarily with certain tax planning actions as well as improved current and expected future operating profit and taxable income, and $23 million of income tax expense associated with the tax impacts of an intercompany transaction. (2) Charge related to the transfer of certain U.S. pension plan liabilities to an insurance company through the purchase of a group annuity contract. Adjustments and Other Adjusted Related Acquisition- Restructuring |
| Reconciliation of Non - GAAP Financial Measures to GAAP Financial Measures for the Quarter Ended March 26, 2021 21 Operating income: Transportation Solutions $ 398 $ 5 $ 10 $ 413 Industrial Solutions 111 3 5 119 Communications Solutions 103 — 2 105 Total $ 612 $ 8 $ 17 $ 637 Operating margin 16.4 % 17.0 % Other income, net $ 4 $ — $ — $ 4 Income tax expense $ (106) $ (2) $ (2) $ (110) Effective tax rate 17.3 % 17.3 % Income from continuing operations $ 505 $ 6 $ 15 $ 526 Diluted earnings per share from continuing operations $ 1.51 $ 0.02 $ 0.04 $ 1.57 ($ in millions, except per share data) (1) The tax effect of each non-GAAP adjustment is calculated based on the jurisdictions in which the expense (income) is incurred and the tax laws in effect for each such jurisdiction. (2) See description of non-GAAP financial measures. Related and Other Adjusted U.S. GAAP Charges (1) Charges, Net (1) (Non-GAAP) (2) Adjustments Acquisition- Restructuring |
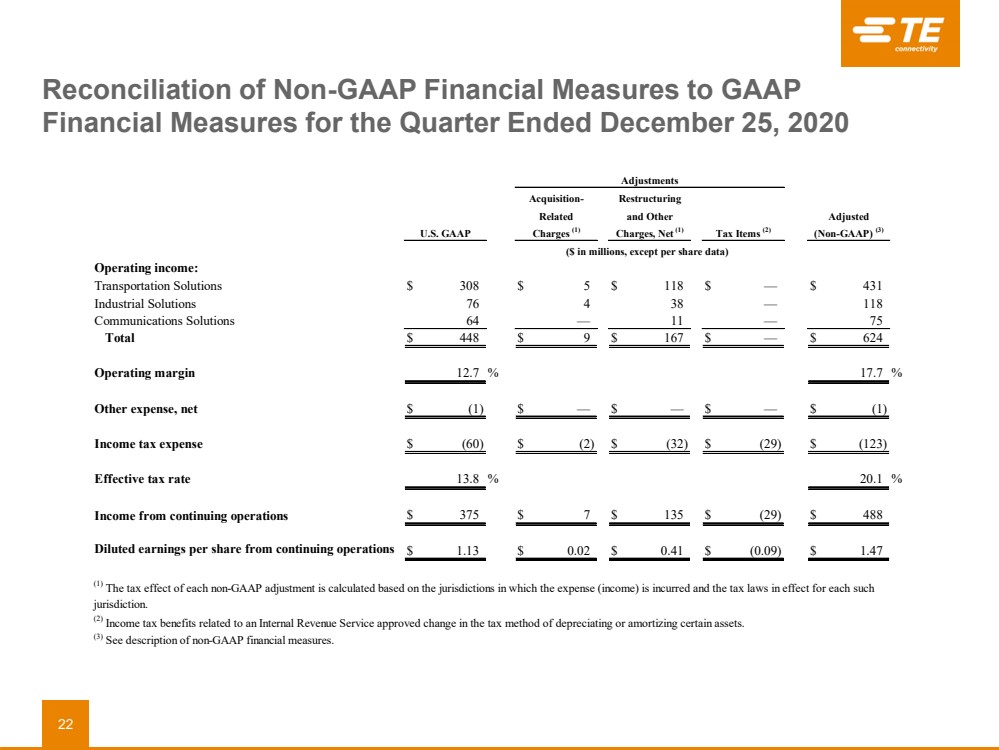
| Reconciliation of Non - GAAP Financial Measures to GAAP Financial Measures for the Quarter Ended December 25, 2020 22 Operating income: Transportation Solutions $ 308 $ 5 $ 118 $ — $ 431 Industrial Solutions 76 4 38 — 118 Communications Solutions 64 — 11 — 75 Total $ 448 $ 9 $ 167 $ — $ 624 Operating margin 12.7 % 17.7 % Other expense, net $ (1) $ — $ — $ — $ (1) Income tax expense $ (60) $ (2) $ (32) $ (29) $ (123) Effective tax rate 13.8 % 20.1 % Income from continuing operations $ 375 $ 7 $ 135 $ (29) $ 488 Diluted earnings per share from continuing operations $ 1.13 $ 0.02 $ 0.41 $ (0.09) $ 1.47 Adjusted (Non-GAAP) (3) ($ in millions, except per share data) Tax Items (2) and Other Charges, Net (1) (3) See description of non-GAAP financial measures. U.S. GAAP Acquisition- Related Charges (1) Adjustments (1) The tax effect of each non-GAAP adjustment is calculated based on the jurisdictions in which the expense (income) is incurred and the tax laws in effect for each such jurisdiction. (2) Income tax benefits related to an Internal Revenue Service approved change in the tax method of depreciating or amortizing certain assets. Restructuring |
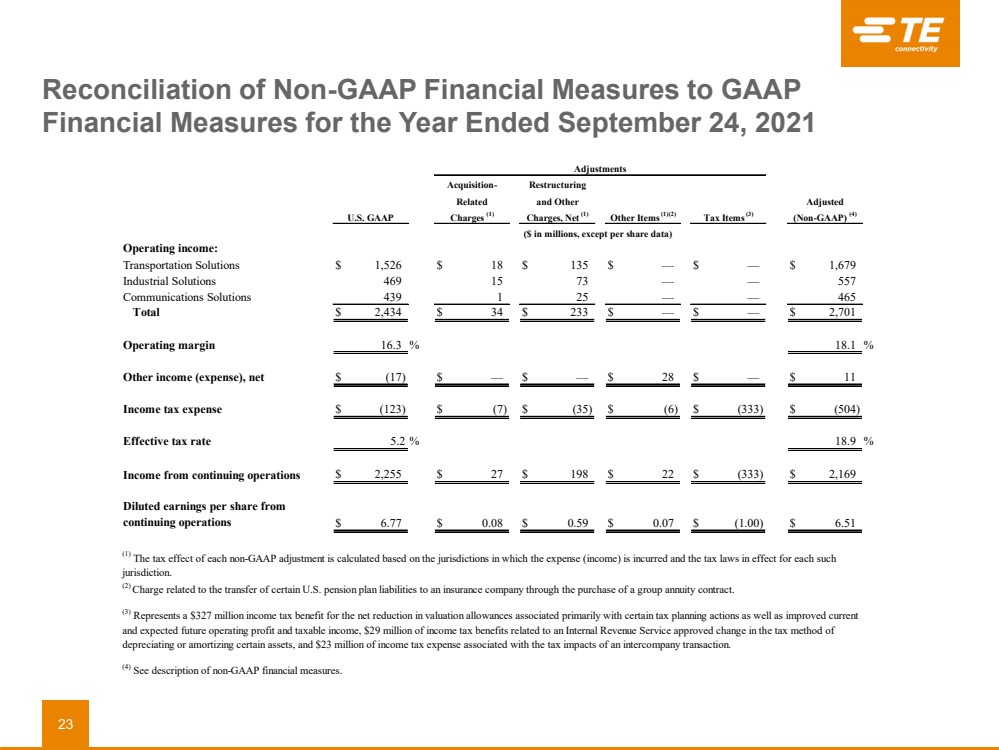
| Reconciliation of Non - GAAP Financial Measures to GAAP Financial Measures for the Year Ended September 24, 2021 23 Operating income: Transportation Solutions $ 1,526 $ 18 $ 135 $ — $ — $ 1,679 Industrial Solutions 469 15 73 — — 557 Communications Solutions 439 1 25 — — 465 Total $ 2,434 $ 34 $ 233 $ — $ — $ 2,701 Operating margin 16.3 % 18.1 % Other income (expense), net $ (17) $ — $ — $ 28 $ — $ 11 Income tax expense $ (123) $ (7) $ (35) $ (6) $ (333) $ (504) Effective tax rate 5.2 % 18.9 % Income from continuing operations $ 2,255 $ 27 $ 198 $ 22 $ (333) $ 2,169 Diluted earnings per share from continuing operations $ 6.77 $ 0.08 $ 0.59 $ 0.07 $ (1.00) $ 6.51 Adjustments Acquisition- Restructuring Related and Other Adjusted U.S. GAAP Charges (1) Charges, Net (1) Tax Items (3) (Non-GAAP) (4) Other Items (1)(2) (4) See description of non-GAAP financial measures. ($ in millions, except per share data) (1) The tax effect of each non-GAAP adjustment is calculated based on the jurisdictions in which the expense (income) is incurred and the tax laws in effect for each such jurisdiction. (3) Represents a $327 million income tax benefit for the net reduction in valuation allowances associated primarily with certain tax planning actions as well as improved current and expected future operating profit and taxable income, $29 million of income tax benefits related to an Internal Revenue Service approved change in the tax method of depreciating or amortizing certain assets, and $23 million of income tax expense associated with the tax impacts of an intercompany transaction. (2) Charge related to the transfer of certain U.S. pension plan liabilities to an insurance company through the purchase of a group annuity contract. |
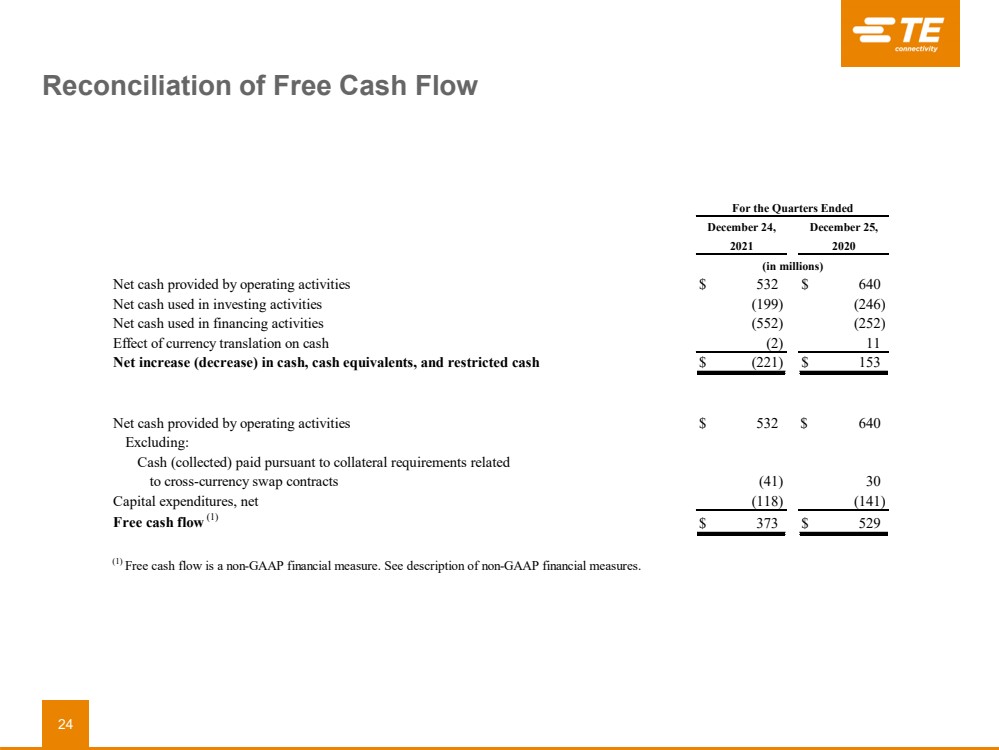
| Reconciliation of Free Cash Flow 24 Net cash provided by operating activities $ 532 $ 640 Net cash used in investing activities (199) (246) Net cash used in financing activities (552) (252) Effect of currency translation on cash (2) 11 Net increase (decrease) in cash, cash equivalents, and restricted cash $ (221) $ 153 Net cash provided by operating activities $ 532 $ 640 Excluding: Cash (collected) paid pursuant to collateral requirements related to cross-currency swap contracts (41) 30 Capital expenditures, net (118) (141) Free cash flow (1) $ 373 $ 529 (1) Free cash flow is a non-GAAP financial measure. See description of non-GAAP financial measures. 2021 2020 (in millions) For the Quarters Ended December 24, December 25, |
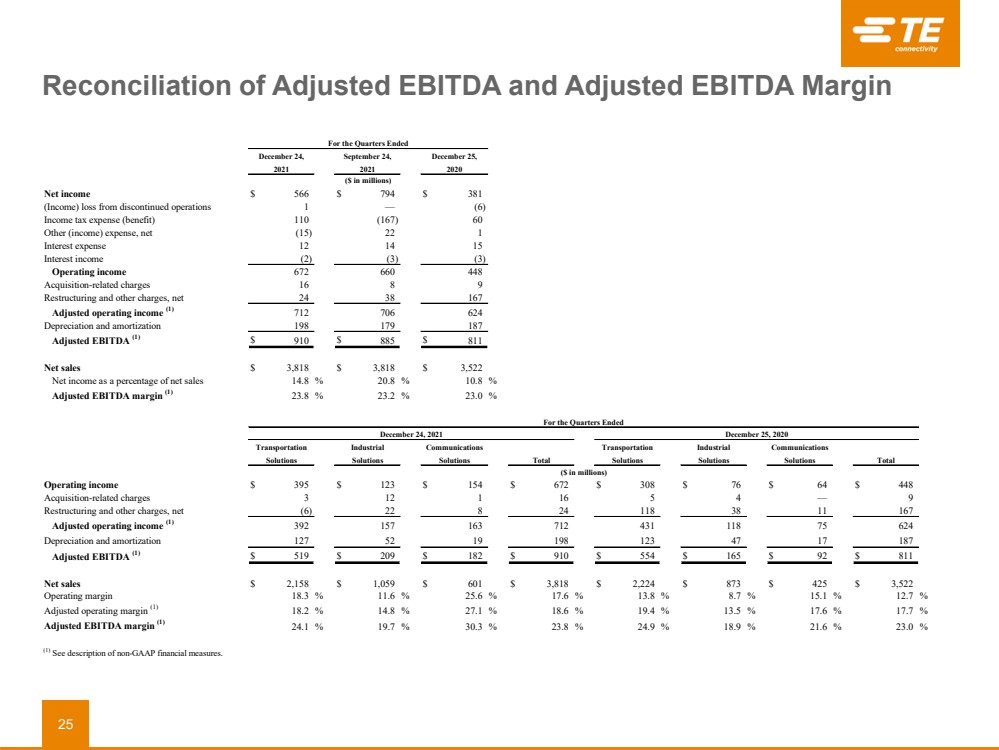
| Reconciliation of Adjusted EBITDA and Adjusted EBITDA Margin 25 Net income $ 566 $ 794 $ 381 (Income) loss from discontinued operations 1 — (6) Income tax expense (benefit) 110 (167) 60 Other (income) expense, net (15) 22 1 Interest expense 12 14 15 Interest income (2) (3) (3) Operating income 672 660 448 Acquisition-related charges 16 8 9 Restructuring and other charges, net 24 38 167 Adjusted operating income (1) 712 706 624 Depreciation and amortization 198 179 187 Adjusted EBITDA (1) $ 910 $ 885 $ 811 Net sales $ 3,818 $ 3,818 $ 3,522 Net income as a percentage of net sales 14.8 % 20.8 % 10.8 % Adjusted EBITDA margin (1) 23.8 % 23.2 % 23.0 % Operating income $ 395 $ 123 $ 154 $ 672 $ 308 $ 76 $ 64 $ 448 Acquisition-related charges 3 12 1 16 5 4 — 9 Restructuring and other charges, net (6) 22 8 24 118 38 11 167 Adjusted operating income (1) 392 157 163 712 431 118 75 624 Depreciation and amortization 127 52 19 198 123 47 17 187 Adjusted EBITDA (1) $ 519 $ 209 $ 182 $ 910 $ 554 $ 165 $ 92 $ 811 Net sales $ 2,158 $ 1,059 $ 601 $ 3,818 $ 2,224 $ 873 $ 425 $ 3,522 Operating margin 18.3 % 11.6 % 25.6 % 17.6 % 13.8 % 8.7 % 15.1 % 12.7 % Adjusted operating margin (1) 18.2 % 14.8 % 27.1 % 18.6 % 19.4 % 13.5 % 17.6 % 17.7 % Adjusted EBITDA margin (1) 24.1 % 19.7 % 30.3 % 23.8 % 24.9 % 18.9 % 21.6 % 23.0 % December 25, 2020 For the Quarters Ended ($ in millions) ($ in millions) Total Transportation Solutions Industrial Solutions Solutions Solutions Transportation Industrial Solutions (1) See description of non-GAAP financial measures. Communications Solutions Communications For the Quarters Ended December 24, 2021 December 25, 2020 December 24, 2021 September 24, 2021 Total |
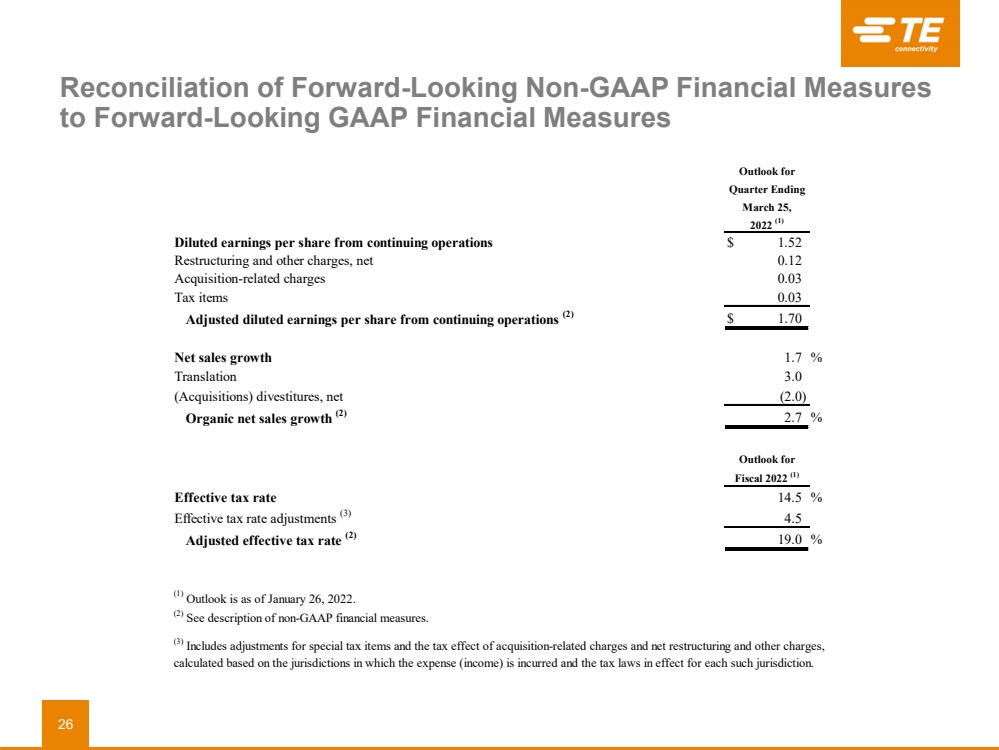
| Reconciliation of Forward - Looking Non - GAAP Financial Measures to Forward - Looking GAAP Financial Measures 26 Diluted earnings per share from continuing operations $ 1.52 Restructuring and other charges, net 0.12 Acquisition-related charges 0.03 Tax items 0.03 Adjusted diluted earnings per share from continuing operations (2) $ 1.70 Net sales growth 1.7 % Translation 3.0 (Acquisitions) divestitures, net (2.0) Organic net sales growth (2) 2.7 % Effective tax rate 14.5 % Effective tax rate adjustments (3) 4.5 Adjusted effective tax rate (2) 19.0 % (3) Includes adjustments for special tax items and the tax effect of acquisition-related charges and net restructuring and other charges, calculated based on the jurisdictions in which the expense (income) is incurred and the tax laws in effect for each such jurisdiction. (1) Outlook is as of January 26, 2022. (2) See description of non-GAAP financial measures. 2022 (1) March 25, Outlook for Fiscal 2022 (1) Quarter Ending Outlook for |
Serious News for Serious Traders! Try StreetInsider.com Premium Free!
You May Also Be Interested In
- TE Connectivity (TEL) PT Lowered to $158 at Baird
- Lincoln Avenue Communities Breaks Ground on Affordable Housing Development in Casa Grande, Arizona
- BUSINESS FIRST Bancshares, INC. to acquire OAKWOOD BANCSHARES, INC. AND OAKWOOD BANK
Create E-mail Alert Related Categories
SEC FilingsSign up for StreetInsider Free!
Receive full access to all new and archived articles, unlimited portfolio tracking, e-mail alerts, custom newswires and RSS feeds - and more!
