

Form 8-K Superior Drilling Produc For: Aug 12
 Tweet
Tweet Share
Share
UNITED STATES
SECURITIES AND EXCHANGE COMMISSION
Washington, DC 20549
FORM
Current Report
PURSUANT TO SECTION 13 OR 15(d) OF THE SECURITIES EXCHANGE ACT OF 1934
DATE OF REPORT (DATE OF EARLIEST EVENT REPORTED):
(Exact name of registrant as specified in its charter)
(State of Incorporation) |
|
(I.R.S. Employer Identification No.) |
| (Address of principal executive offices) | (Zip code) |
Commission
File Number:
Registrant’s
telephone number, including area code:
Check the appropriate box below if the Form 8-K filing is intended to simultaneously satisfy the filing obligation of the registrant under any of the following provisions:
| Written communications pursuant to Rule 425 under the Securities Act (17 CFR 230.425) | |
| Soliciting material pursuant to Rule 14a-12 under the Exchange Act (17 CFR 240.14a-12) | |
| Pre-commencement communications pursuant to Rule 14d-2(b) under the Exchange Act (17 CFR 240.14d-2(b)) | |
| Pre-commencement communications pursuant to Rule 13e-4(c) under the Exchange Act (17 CFR 240.13e-4(c)) |
Securities Registered Pursuant to Section 12(b) of the Exchange Act:
| Title of each class: | Trading Symbol(s) | Name of each exchange on which registered: | ||
Indicate by check mark whether the registrant is an emerging growth company as defined in Rule 405 of the Securities Act of 1933 (§230.405 of this chapter) or Rule 12b-2 of the Securities Exchange Act of 1934 (§240.12b-2 of this chapter).
Emerging
growth company
If an emerging growth company, indicate by check mark if the registrant has elected not to use the extended transition period for complying with any new or revised financial accounting standards provided pursuant to Section 13(a) of the Exchange Act. ☐
| Item 2.02. | Results of Operations and Financial Condition. |
On August 12, 2022, Superior Drilling Products, Inc. issued a press release announcing its financial results for the quarter ended June 30, 2022. A copy of the press release is furnished as Exhibit 99.1 to this report and is incorporated herein by reference. The webcast and slide presentation for the earnings call are available on the Investors page of the Company’s website at www.sdpi.com. Information on the Company’s website is not deemed to be incorporated herein by reference. The slide presentation is furnished herewith as Exhibit 99.2.
In accordance with General Instruction B.2 of Form 8-K, the information set forth in this Item 2.02 and in the attached Exhibits 99.1 and 99.2 shall be deemed to be “furnished” and shall not be deemed to be “filed” for purposes of Section 18 of the Securities Exchange Act of 1934, as amended.
| Item 9.01 | Financial Statements and Exhibits. |
| Exhibit Number | Description | |
| 99.1 | Press release dated August 12, 2022 regarding second quarter 2022 earnings.* | |
| 99.2 | Slide presentation accompanying earnings call.* | |
| 104 | Cover Page Interactive Data File (embedded within the Inline XBRL document) |
*Furnished herewith.
SIGNATURE
Pursuant to the requirements of the Securities Exchange Act of 1934, the registrant has duly caused this report to be signed on its behalf by the undersigned hereunto duly authorized.
Date: August 12, 2022
| SUPERIOR DRILLING PRODUCTS, INC. | |
| /s/ Christopher D. Cashion | |
| Christopher D. Cashion | |
| Chief Financial Officer |
Exhibit 99.1

FOR IMMEDIATE RELEASE
Superior Drilling Products, Inc. Revenue Grew 34% to
$4.5 million in Second Quarter 2022
| ● | Second quarter revenue increased $1.1 million, or 34%, to $4.5 million over the prior-year period | |
| ● | Tool revenue grew 27% over the prior-year period and Contract Services revenue was up 47% | |
| ● | Strengthening balance sheet with $2.8 million in cash and $6.7 million in shareholders’ equity at quarter-end | |
| ● | Secured strategic International channel partner in the Middle East and North Africa | |
| ● | The Company expects 2022 revenue of between $22 million to $25 million and Adjusted EBITDA* of $6 million to $8 million, which includes the impact of the sale of the initial phase of the existing DNR tool fleet to support Middle East demand. |
*Adjusted EBITDA is a non-GAAP measure. See the Forward Looking Non-GAAP Financial Measures discussion in this release.
VERNAL, UT, August 12, 2022 — Superior Drilling Products, Inc. (NYSE American: SDPI) (“SDP” or the “Company”), a designer and manufacturer of drilling tool technologies, today reported financial results for the second quarter ended June 30, 2022.
“Our second quarter revenue growth reflected the continued improvement in the oil & gas industry, our success with obtaining additional business with existing customers, and the increasing market for our flagship tool, the Drill-N-Ream® (“DNR”),” commented Troy Meier, Chairman and CEO. “We have continued to see favorable demand in our North America market, and we are encouraged with the improving market conditions in the Middle East. We believe there is significant demand for the DNR internationally. Our recent announcement that Bin Zayed Petroleum for Investment Ltd, one of the foremost global companies with broad petroleum experience, will market and distribute our DNR to key end markets in the Middle East and North Africa is a game-changing event for us. We expect customers to adopt the technology quickly given our new channel partner’s scale, customer reach and market access.”
Mr. Meier added, “Our contract services business has been very strong as we continue to expand the volume and products we manufacture and refurbish for our long-time legacy customer. Equally exciting, is the number of inquiries and discussions we are having with other major industry players to leverage our state-of-the-art drilling tool fabrication facility and expertise to support their growth initiatives and strategies. Our efforts going forward are focused on talent acquisition and retention, and ensuring we have the necessary manufacturing capacity to capture the incredible demand for our products and manufacturing services.”
| -MORE- |
| Superior Drilling Products, Inc. Revenue Grew 34% to $4.5 million in Second Quarter 2022 |
| August 12, 2022 |
| Page 2 of 8 |
Second Quarter 2022 Review ($ in thousands, except per share amounts) (See at “Definitions” the composition of product/service revenue categories.)
| ($ in thousands) | June 30, 2022 | March 31, 2022 | June 30, 2021 | Change Sequential | Change Year/Year | |||||||||||||||
| North America | 4,021 | 3,745 | 2,941 | 7.4 | % | 36.7 | % | |||||||||||||
| International | 520 | 385 | 458 | 34.9 | % | 13.5 | % | |||||||||||||
| Total Revenue | $ | 4,541 | $ | 4,130 | $ | 3,399 | 9.9 | % | 33.6 | % | ||||||||||
| Tool Sales/Rental | $ | 1,147 | $ | 1,049 | 1,120 | 9.3 | % | 2.4 | % | |||||||||||
| Other Related Tool Revenue | 1,745 | 1,720 | 1,153 | 1.4 | % | 51.3 | % | |||||||||||||
| Tool Revenue | 2,892 | 2,769 | 2,273 | 4.4 | % | 27.2 | % | |||||||||||||
| Contract Services | 1,649 | 1,361 | 1,126 | 21.2 | % | 46.5 | % | |||||||||||||
| Total Revenue | $ | 4,541 | $ | 4,130 | $ | 3,399 | 9.9 | % | 33.6 | % | ||||||||||
Revenue growth reflects the continued recovery in the North America oil & gas industry and continued strong demand for the manufacture and refurbishment of drill bits and other related tools.
For the second quarter of 2022, North America revenue comprised approximately 89% of total revenue, with remaining sales all within the Middle East. Revenue in North America grew year-over-year from increased Tool Revenue and strong growth in Contract Services. Over the last year, International market growth has been at a slower rate compared with the Company’s domestic market due to ongoing pandemic-related restrictions, which have impacted travel, labor recruitment and oil and gas industry investment.
Second Quarter 2022 Operating Costs
| ($ in thousands, except per share amounts) | June 30, 2022 | March 31, 2022 | June 30, 2021 | Change Sequential | Change Year/Year | |||||||||||||||
| Cost of revenue | $ | 2,116 | $ | 1,768 | $ | 1,224 | 19.7 | % | 72.9 | % | ||||||||||
| As a percent of sales | 46.6 | % | 42.8 | % | 36.0 | % | ||||||||||||||
| Selling, general & administrative | $ | 1,894 | $ | 1,647 | $ | 1,473 | 15.0 | % | 28.6 | % | ||||||||||
| As a percent of sales | 41.7 | % | 39.9 | % | 43.3 | % | ||||||||||||||
| Depreciation & amortization | $ | 403 | $ | 411 | $ | 586 | (2.0 | )% | (31.2 | )% | ||||||||||
| Total operating expenses | $ | 4,413 | $ | 3,825 | $ | 3,283 | 15.4 | % | 34.4 | % | ||||||||||
| Operating Income | $ | 128 | $ | 305 | $ | 116 | (58.1 | )% | 9.8 | % | ||||||||||
| As a % of sales | 2.8 | % | 7.4 | % | 3.4 | % | ||||||||||||||
| Other (expense) income including income tax (expense) | $ | (184 | ) | $ | (155 | ) | $ | (183 | ) | 18.8 | % | 0.6 | % | |||||||
| Net (loss) Income | $ | (57 | ) | $ | 150 | $ | (67 | ) | (137.8 | )% | (15.3 | )% | ||||||||
| Diluted (loss) income per share | $ | (0.00 | ) | $ | 0.01 | $ | (0.00 | ) | (137.8 | )% | (22.7 | )% | ||||||||
| Adjusted EBITDA(1) | $ | 831 | $ | 1,014 | $ | 957 | (18.0 | )% | (13.2 | )% | ||||||||||
| As a % of sales | 18.3 | % | 24.5 | % | 28.2 | % | ||||||||||||||
(1) Adjusted EBITDA is a non-GAAP measure defined as earnings before interest, taxes, depreciation, and amortization, non-cash stock compensation expense, and unusual items. See the attached tables for important disclosures regarding SDP’s use of Adjusted EBITDA, as well as a reconciliation of net loss to Adjusted EBITDA.
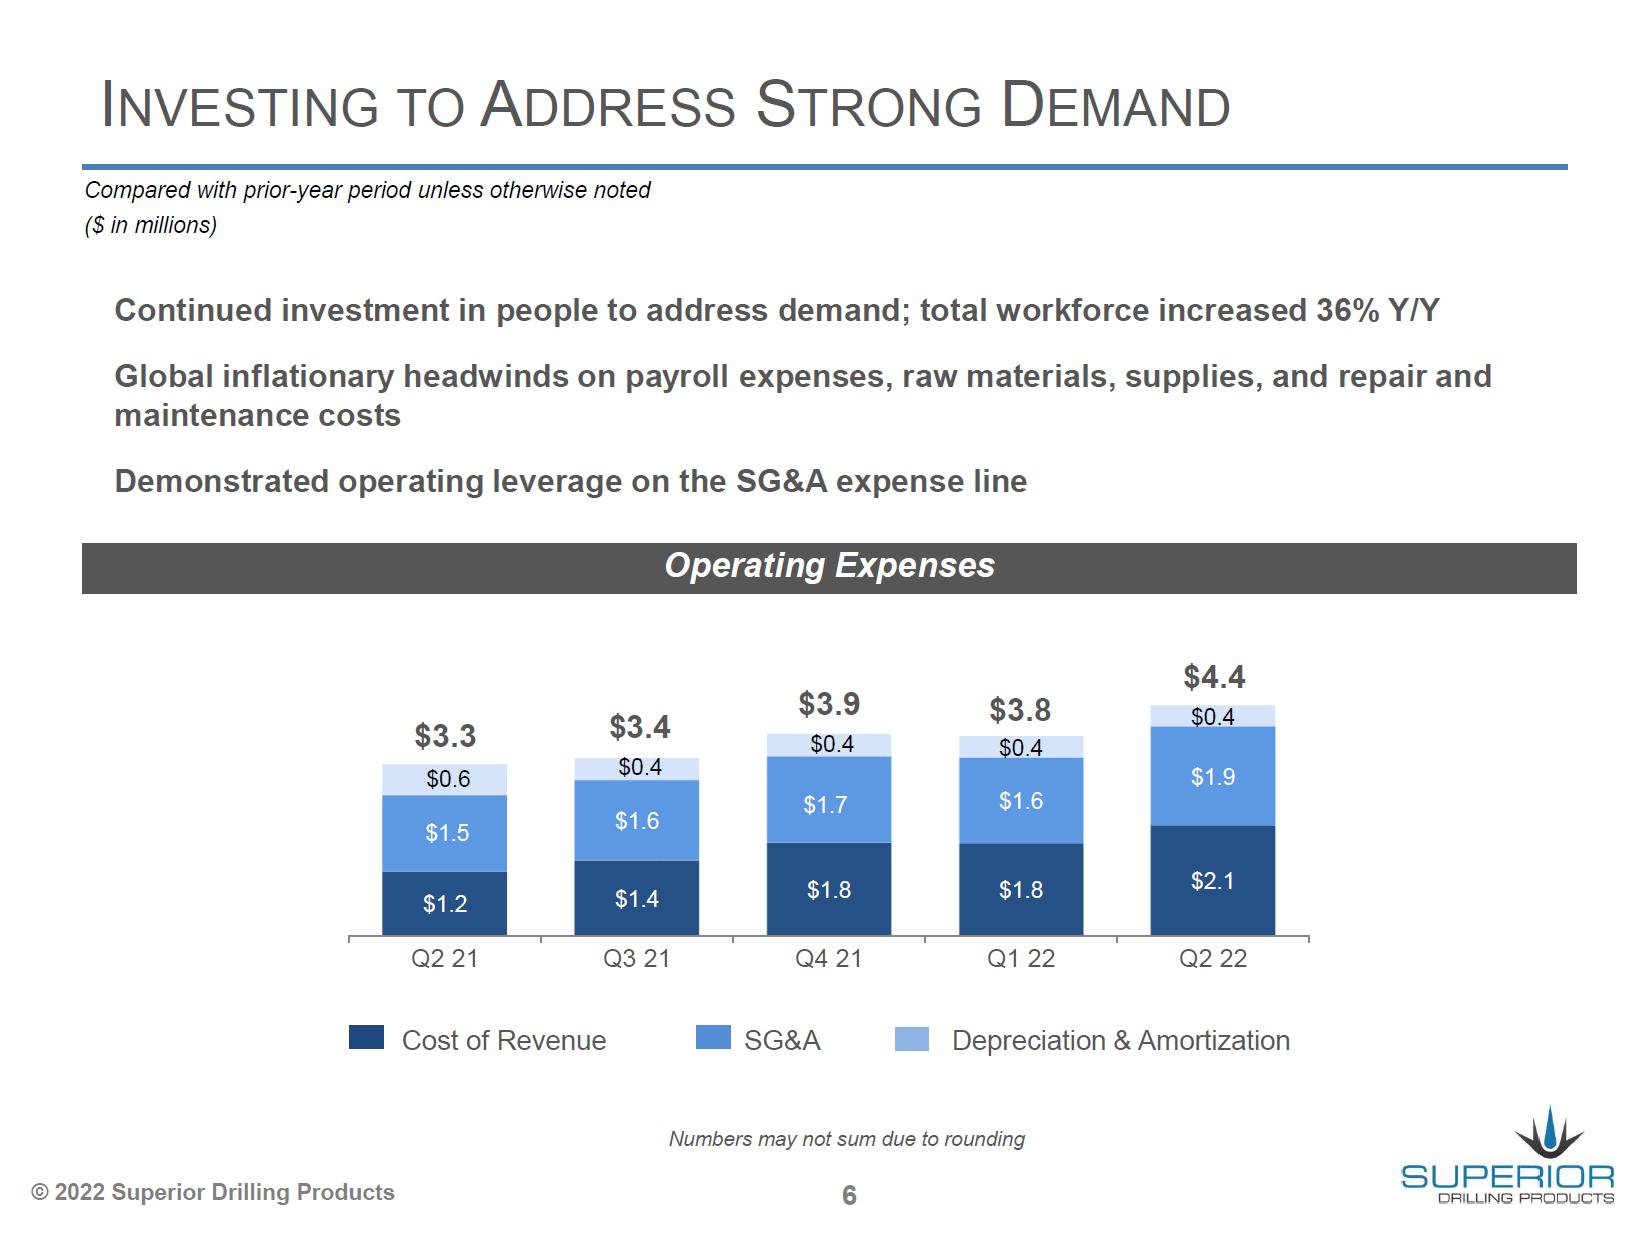
The increase in the cost of revenue as a percent of revenue was the result of global inflationary headwinds that affected payroll expenses, raw material cost, supplies, and repair and maintenance costs. In addition, the Company has expanded its workforce to accommodate for its current and expected growth, with talent being added in operations, quality, safety and general production support areas.
| -MORE- |
| Superior Drilling Products, Inc. Revenue Grew 34% to $4.5 million in Second Quarter 2022 |
| August 12, 2022 |
| Page 3 of 8 |
Selling, general & administrative expenses were 41.7% of revenue, an improvement of 160 basis points from the prior-year period due to the leverage on higher sales volume. On a sequential basis, the change in SG&A as a percent of revenue was unfavorable due to inflation and higher stock-based compensation expense as well an increase in professional fees.
Depreciation and amortization expense decreased approximately 31% year-over-year to $403 thousand as a result of fully amortizing a portion of intangible assets and fully depreciating manufacturing center equipment.
Balance Sheet and Liquidity
Cash at the end of the quarter was $2.8 million, comparable with year-end 2021. Cash generated by operations for the year-to-date period was $1.4 million compared with $335 thousand in the prior-year period, largely reflecting the improvement in net income. Capital expenditures were $1.2 million for the first six months of 2022, which reflected machining capacity expansion, an increase in maintenance, and an increase in the Company’s Middle East DNR rental tool fleet. The comparable period in 2021 had $55 thousand of capital spending. The Company expects capital spending for fiscal 2022 to range between $3 million to $4 million.
Total debt at quarter-end was $2.4 million, down 2% from December 31, 2021. The Company has sufficient cash to pay off, and expects to retire, the Hard Rock Note with its final $750 thousand payment in October 2022.
2022 Outlook and Guidance
The Company’s expectations for 2022 are as follows:
Revenue: $22 million to $25 million
SG&A: $7.0 million to $7.3 million
Adjusted EBITDA: $6 million to $8 million
The full year 2022 expectations reflects the impact from the sale of the $3.8 million stage one MENA DNR fleet to Bin Zayed Petroleum in the third quarter of 2022. The Company expects third quarter 2022 revenue will be $8 million to $9 million and Adjusted EBITDA to range between $3.5 million to
$4.0 million.
Mr. Meier concluded, “We are extremely encouraged with the execution of our channel partner agreement with Bin Zayed for the Middle East and North African markets. We believe this progress, combined with our expanded relationship with our long-term legacy customer, will position us well in the global oil & gas industry as we prepare to move into 2023.”
Webcast and Conference Call
The Company will host a conference call and live webcast today at 10:00 am MT (12:00 pm ET) to review the results of the quarter and discuss its corporate strategy and outlook. The discussion will be accompanied by a slide presentation that will be made available prior to the conference call on SDP’s website at www.sdpi.com/events. A question-and-answer session will follow the formal presentation.
The conference call can be accessed by calling (201) 689-8470. Alternatively, the webcast can be monitored at www.sdpi.com/events. A telephonic replay will be available from 1:00 p.m. MT (3:00 p.m. ET) the day of the teleconference until Friday, August 19, 2022. To listen to the archived call, please call (412) 317-6671 and enter conference ID number 13731267 or access the webcast replay at www.sdpi.com, where a transcript will be posted once available.
| -MORE- |
| Superior Drilling Products, Inc. Revenue Grew 34% to $4.5 million in Second Quarter 2022 |
| August 12, 2022 |
| Page 4 of 8 |
Definitions and Composition of Product/Service Revenue:
Contract Services revenue is comprised of repair and manufacturing services for drill bits and other tools or products for customers.
Other Related Tool Revenue is comprised of royalties and fleet maintenance fees.
Tool Sales/Rental revenue is comprised of revenue from either the sale or rent of tools to customers.
Tool Revenue is the sum of Other Related Tool Revenue and Tool Sales/Rental revenue.
About Superior Drilling Products, Inc.
Superior Drilling Products, Inc. is an innovative, cutting-edge drilling tool technology company providing cost saving solutions that drive production efficiencies for the oil and natural gas drilling industry. The Company designs, manufactures, repairs and sells drilling tools. SDP drilling solutions include the patented Drill-N-Ream® wellbore conditioning tool and the patented Strider™ oscillation system technology. In addition, SDP is a manufacturer and refurbisher of PDC (polycrystalline diamond compact) drill bits for a leading oil field service company. SDP operates a state-of-the-art drill tool fabrication facility, where it manufactures its solutions for the drilling industry, as well as customers’ custom products. The Company’s strategy for growth is to leverage its expertise in drill tool technology and innovative, precision machining in order to broaden its product offerings and solutions for the oil and gas industry.
Additional information about the Company can be found at: www.sdpi.com.
Safe Harbor Regarding Forward Looking Statements
This news release contains forward-looking statements and information that are subject to a number of risks and uncertainties, many of which are beyond our control. All statements, other than statements of historical fact included in this release, including, without limitations, the continued impact of COVID-19 on the business, the Company’s strategy, future operations, success at developing future tools, the Company’s effectiveness at executing its business strategy and plans, financial position, estimated revenue and losses, projected costs, prospects, plans and objectives of management, and ability to outperform are forward-looking statements. The use of words “could,” “believe,” “anticipate,” “intend,” “estimate,” “expect,” “may,” “continue,” “predict,” “potential,” “project”, “forecast,” “should” or “plan, and similar expressions are intended to identify forward-looking statements, although not all forward -looking statements contain such identifying words. These statements reflect the beliefs and expectations of the Company and are subject to risks and uncertainties that may cause actual results to differ materially. These risks and uncertainties include, among other factors, the duration of the COVID-19 pandemic and related impact on the oil and natural gas industry, the effectiveness of success at expansion in the Middle East, options available for market channels in North America, the deferral of the commercialization of the Strider technology, the success of the Company’s business strategy and prospects for growth; the market success of the Company’s specialized tools, effectiveness of its sales efforts, its cash flow and liquidity; financial projections and actual operating results; the amount, nature and timing of capital expenditures; the availability and terms of capital; competition and government regulations; and general economic conditions. These and other factors could adversely affect the outcome and financial effects of the Company’s plans and described herein. The Company undertakes no obligation to revise or update any forward-looking statements to reflect events or circumstances after the date hereof.
Forward Looking Non-GAAP Financial Measures
Forward-looking adjusted EBITDA is a non-GAAP measure. The Company is unable to present a quantitative reconciliation of these forward-looking non-GAAP financial measures to their most directly comparable forward-looking GAAP financial measure because such information is not available, and management cannot reliably predict the necessary components of such GAAP measures without unreasonable effort largely because forecasting or predicting our future operating results is subject to many factors out of our control or not readily predictable. In addition, the Company believes that such reconciliations would imply a degree of precision that would be confusing or misleading to investors. The unavailable information could have a significant impact on the Company’s fiscal 2022 and future financial results. This non-GAAP financial measure is a preliminary estimate and is subject to risks and uncertainties, including, among others, changes in connection with purchase accounting, quarter-end and year-end adjustments. Any variation between the Company’s actual results and preliminary financial data set forth in this presentation may be material.
For more information, contact investor relations:
Deborah K. Pawlowski
Kei Advisors LLC
(716) 843-3908
FINANCIAL TABLES FOLLOW.
| -MORE- |
| Superior Drilling Products, Inc. Revenue Grew 34% to $4.5 million in Second Quarter 2022 |
| August 12, 2022 |
| Page 5 of 8 |
Superior Drilling Products, Inc.
Consolidated Condensed Statements of Operations
(unaudited)
| For the Three Months | For the Six Months | |||||||||||||||
| Ended June 30, | Ended June 30, | |||||||||||||||
| 2022 | 2021 | 2022 | 2021 | |||||||||||||
| Revenue | ||||||||||||||||
| North America | $ | 4,021,118 | $ | 2,941,056 | $ | 7,766,132 | $ | 5,033,255 | ||||||||
| International | 519,724 | 458,053 | 904,874 | 790,506 | ||||||||||||
| Total revenue | $ | 4,540,842 | $ | 3,399,109 | $ | 8,671,007 | $ | 5,823,761 | ||||||||
| Operating cost and expenses | ||||||||||||||||
| Cost of revenue | 2,116,096 | 1,224,179 | 3,883,995 | 2,399,772 | ||||||||||||
| Selling, general, and administrative expenses | 1,894,403 | 1,473,081 | 3,541,051 | 2,988,670 | ||||||||||||
| Depreciation and amortization expense | 402,648 | 585,504 | 813,379 | 1,275,577 | ||||||||||||
| Total operating costs and expenses | 4,413,147 | 3,282,764 | 8,238,425 | 6,664,019 | ||||||||||||
| Operating Income (loss) | 127,695 | 116,345 | 432,582 | (840,258 | ) | |||||||||||
| Other Income (expense) | ||||||||||||||||
| Interest income | 2,978 | 50 | 3,176 | 98 | ||||||||||||
| Interest expense | (132,738 | ) | (145,521 | ) | (256,600 | ) | (283,577 | ) | ||||||||
| Net gain/(loss) on sale or disposition of assets | (22,146 | ) | (11,187 | ) | (22,146 | ) | (1,187 | ) | ||||||||
| Total other expense | (151,906 | ) | (156,658 | ) | (275,570 | ) | (284,666 | ) | ||||||||
| (Loss) Income before income taxes | (24,211 | ) | (40,313 | ) | 157,012 | (1,124,924 | ) | |||||||||
| Income tax expense | (32,299 | ) | (26,468 | ) | (63,752 | ) | (43,649 | ) | ||||||||
| Net (loss) income | $ | (56,510 | ) | $ | (66,781 | ) | $ | 93,260 | $ | (1,168,573 | ) | |||||
| Basic income (loss) per common share | $ | (0.00 | ) | $ | (0.00 | ) | $ | 0.00 | $ | (0.05 | ) | |||||
| Basic weighted average common shares outstanding | 28,235,001 | 25,762,342 | 28,235,001 | 25,762,342 | ||||||||||||
| Diluted income (loss) per common Share | $ | (0.00 | ) | $ | (0.00 | ) | $ | 0.00 | $ | (0.05 | ) | |||||
| Diluted weighted average common shares outstanding | 28,235,001 | 25,762,342 | 28,305,101 | 25,762,342 | ||||||||||||
| -MORE- |
| Superior Drilling Products, Inc. Revenue Grew 34% to $4.5 million in Second Quarter 2022 |
| August 12, 2022 |
| Page 6 of 8 |
Superior Drilling Products, Inc.
Consolidated Condensed Balance Sheets
| June 30, 2022 | December 31, 2021 | |||||||
| (unaudited) | ||||||||
| Assets | ||||||||
| Current assets: | ||||||||
| Cash | $ | 2,827,426 | $ | 2,822,100 | ||||
| Accounts receivable, net | 2,799,480 | 2,871,932 | ||||||
| Prepaid expenses | 643,155 | 435,595 | ||||||
| Inventories | 1,324,724 | 1,174,635 | ||||||
| Other current assets | 88,588 | 55,159 | ||||||
| Total current assets | 7,683,373 | 7,359,421 | ||||||
| Property, plant and equipment, net | 7,426,690 | 6,930,329 | ||||||
| Intangible assets, net | 152,778 | 236,111 | ||||||
| Right of use Asset (net of amortizaton) | 160,301 | 20,518 | ||||||
| Other noncurrent assets | 110,519 | 65,880 | ||||||
| Total assets | $ | 15,533,661 | $ | 14,612,259 | ||||
| Liabilities and Owners’ Equity | ||||||||
| Current liabilities: | ||||||||
| Accounts payable | $ | 1,095,552 | $ | 1,139,091 | ||||
| Accrued expenses | 853,194 | 467,462 | ||||||
| Accrued Income tax | 219,912 | 206,490 | ||||||
| Current portion of Operating Lease Liability | 160,301 | 13,716 | ||||||
| Current portion of Long-term Financial Obligation | 70,025 | 65,678 | ||||||
| Current portion of long-term debt, net of discounts | 2,204,508 | 2,195,759 | ||||||
| Total current liabilities | 4,603,492 | 4,088,196 | ||||||
| Operating Lease Liability | - | 6,802 | ||||||
| Long-term Financial Obligation | 4,075,778 | 4,112,658 | ||||||
| Long-term debt, less current portion, net of discounts | 190,533 | 256,675 | ||||||
| Total liabilities | 8,869,803 | 8,464,331 | ||||||
| Shareholders’ equity | ||||||||
| Common stock (28,235,001 and 25,762,342) | 28,235 | 28,235 | ||||||
| Additional paid-in-capital | 43,493,802 | 43,071,201 | ||||||
| Accumulated deficit | (36,858,248 | ) | (36,951,508 | ) | ||||
| Total shareholders’ equity | 6,663,789 | 6,147,928 | ||||||
| Total liabilities and shareholders’ equity | $ | 15,533,661 | $ | 14,612,259 | ||||
| -MORE- |
| Superior Drilling Products, Inc. Revenue Grew 34% to $4.5 million in Second Quarter 2022 |
| August 12, 2022 |
| Page 7 of 8 |
Superior Drilling Products, Inc.
Consolidated Statements of Cash Flows
(unaudited)
| For the Six Months | ||||||||
| Ended June 30, | ||||||||
| 2022 | 2021 | |||||||
| Cash Flows From Operating Activities | ||||||||
| Net Income (Loss) | $ | 93,329 | $ | (1,168,573 | ) | |||
| Adjustments to reconcile net income to net cash used in operating activities: | ||||||||
| Depreciation and amortization expense | 813,379 | 1,275,575 | ||||||
| Stock-based compensation expense | 422,601 | 334,505 | ||||||
| Loss on sale or dispositon of assets, net | 22,146 | 1,187 | ||||||
| Amortization of deferred loan cost | 9,262 | 9,262 | ||||||
| Changes in operating assets and liabilities: | ||||||||
| Accounts receivable | 72,452 | (584,780 | ) | |||||
| Inventories | (149,223 | ) | (161,566 | ) | ||||
| Prepaid expenses and other current and noncurrent assets | (285,628 | ) | (280,814 | ) | ||||
| Accounts payable and accrued expenses | 342,193 | 877,585 | ||||||
| Income Tax expense | 13,422 | 32,149 | ||||||
| Net Cash Provided By Operating Activities | 1,353,933 | 334,530 | ||||||
| Cash Flows From Investing Activities | ||||||||
| Purchases of propety, plant and equipment | (1,249,419 | ) | 54,780 | |||||
| Proceeds from sale of fixed assets | - | 50,000 | ||||||
| Net Cash Provided By (Used In) Investing Activities | (1,249,419 | ) | 104,780 | |||||
| Cash Flows From Financing Activities | ||||||||
| Principal payments on debt | (281,487 | ) | (266,719 | ) | ||||
| Proceeds received from debt borrowings | 182,318 | - | ||||||
| Payments on revolving loan | (553,650 | ) | (513,897 | ) | ||||
| Proceeds received from revolving loan | 553,631 | 1,068,978 | ||||||
| Net Cash Used In Financing Activities | (99,188 | ) | 288,362 | |||||
| Net change in Cash | 5,326 | 727,672 | ||||||
| Cash at Beginning of Period | 2,822,100 | 1,961,441 | ||||||
| Cash at End of Period | $ | 2,827,426 | $ | 2,689,113 | ||||
| -MORE- |
| Superior Drilling Products, Inc. Revenue Grew 34% to $4.5 million in Second Quarter 2022 |
| August 12, 2022 |
| Page 8 of 8 |
Superior Drilling Products, Inc.
Adjusted EBITDA(1) Reconciliation
(unaudited)
| ($, in thousands) | Three Months Ended | |||||||||||
| June 30, 2022 | June 20, 2021 | March 31, 2022 | ||||||||||
| GAAP net (loss) income | $ | (56,510 | ) | $ | (66,781 | ) | $ | 149,837 | ||||
| Add back: | ||||||||||||
| Depreciation and amortization | 402,648 | 585,504 | 410,733 | |||||||||
| Interest expense, net | 129,760 | 145,471 | 123,664 | |||||||||
| Share-based compensation | 212,469 | 167,033 | 210,133 | |||||||||
| Net non-cash compensation | 88,200 | 88,200 | 88,200 | |||||||||
| Income tax expense | 32,299 | 26,468 | 31,384 | |||||||||
| (Gain) Loss on disposition of assets | 22,146 | 11,187 | - | |||||||||
| Non-GAAP adjusted EBITDA(1) | $ | 831,012 | $ | 957,081 | $ | 1,013,951 | ||||||
| GAAP Revenue | $ | 4,540,842 | $ | 3,399,109 | $ | 4,130,164 | ||||||
| Non-GAAP Adjusted EBITDA Margin | 18.3 | % | 28.2 | % | 24.5 | % | ||||||
(1) Adjusted EBITDA represents net income adjusted for income taxes, interest, depreciation and amortization and other items as noted in the reconciliation table. The Company believes Adjusted EBITDA is an important supplemental measure of operating performance and uses it to assess performance and inform operating decisions. However, Adjusted EBITDA is not a GAAP financial measure. The Company’s calculation of Adjusted EBITDA should not be used as a substitute for GAAP measures of performance, including net cash provided by operations, operating income and net income. The Company’s method of calculating Adjusted EBITDA may vary substantially from the methods used by other companies and investors are cautioned not to rely unduly on it.
| -END- |
Exhibit 99.2


Serious News for Serious Traders! Try StreetInsider.com Premium Free!
You May Also Be Interested In
- Zealand Pharma launches long-term incentive programs for Zealand’s Board of Directors, Corporate Management and employees for 2024
- LeapCharger Selected as Top Innovator for Prestigious Bedayat Program
- EMGS – Annual report for 2023 - ESEF
Create E-mail Alert Related Categories
SEC FilingsSign up for StreetInsider Free!
Receive full access to all new and archived articles, unlimited portfolio tracking, e-mail alerts, custom newswires and RSS feeds - and more!
