

Form 8-K Soluna Holdings, Inc For: May 19
 Tweet
Tweet Share
Share
Exhibit 99.1
Soluna Holdings Announces April Site Level Financials
On Track to Achieve 1.26 EH/s by June 30th; Reiterates 3EH/s Ramp into the Fourth Quarter
ALBANY, N.Y., May 17, 2022 -- Soluna Holdings, Inc. (“SHI” or the “Company”), (NASDAQ: SLNH), the parent company of Soluna Computing, Inc. (“SCI”), a developer of green data centers for cryptocurrency mining and other intensive computing, today announced the release of its April site level financials.
Michael Toporek, CEO of Soluna Holdings stated, “We had a strong month in April and, despite Bitcoin’s average price dropping by almost 25%, are set for a solid May. Our proprietary hash rate in May relative to April will grow by over 60%. Our margins will be solid as our costs are amongst the best in the industry.”
Toporek added, “I am especially proud of this month’s announcement that Spring Lane is investing in our projects. They are deeply experienced green infrastructure investors and believe our projects are one of the few “real green” projects in the sector. Moreover, they deeply diligenced and benchmarked our Dorothy project and believe the economics are amongst the best in the industry. Our team and investors should be proud of their company.”
Key Summary Highlights:
| ● | April was the best month in Soluna’s history |
| ○ | Compared to March, April Cash Contribution dollars increased by 38%* |
| ○ | Proprietary mining revenue grew sequentially by 10%, hashrate by 15%, and BTC equivalent generated by 11% |
| ● | Drivers to margin growth were |
| ○ | Sophie and Marie facilities continue to scale, driving better absorption of fixed costs |
| ○ | Sophie moved to its 83% uptime for power costs of 2.5-2.7 ¢ per kWh |
| ● | Revenue growth continues as hashrate grows |
| ○ | 61%** growth in proprietary hashrate expected from April to May |
| ● | By the end of Q2 2022, tracking to achieve 1.26 EH |
| ○ | As of May 8, 983 PH*** plugged in with 147 PH on the ground for a total of 1.13 EH |
| ○ | By the end of Q2 2022, should have about 1 EH proprietary and 260-280 PH hosted |
*Excludes the impact of tornado and forced shutdowns.
**Includes 147 PH/s
on the ground.
***Peak hash rate.
Revenue & Contribution Margin Summary:
| *all numbers below exclude legacy hosting | |||||||
| ($ in 000s, Unaudited) | Actual | ||||||
| Q1 2021 | Q2 2021 | Q3 2021 | Q4 2021 | FY 21 | Q1 2022 | Apr 2022 | |
| Revenue | $995 | $1,657 | $2,368 | $7,990 | $13,010 | $9,264 | $3,392 |
| Cash Contribution Margin | $744 | $1,261 | $1,703 | $5,179 | $8,888 | $5,206 | $2,596 |
| Annualized Revenue | $3,980 | $6,628 | $9,472 | $31,960 | $13,010 | $37,056 | $40,704 |
| Annualized Contribution Margin | $2,976 | $5,044 | $6,812 | $20,716 | $8,888 | $20,824 | $31,152 |
A presentation and corresponding video is available on the Company’s website at:
http://www.solunacomputing.com/investors/updates/april2022flash/
About Soluna Holdings, Inc.
Soluna Holdings, Inc. (Nasdaq: SLNH), which operates through its subsidiary, Soluna Computing, Inc. is the leading developer of green data centers that convert excess renewable energy into global computing resources. Soluna builds modular, scalable data centers for computing-intensive, batchable applications such as cryptocurrency mining, AI and machine learning. Soluna provides a cost-effective alternative to battery storage or transmission lines. Up to 30% of the power of renewable energy projects can go to waste. Soluna’s data centers enable clean electricity asset owners to ’Sell. Every. Megawatt.’
For more information about Soluna, please visit solunacomputing.com or follow us on LinkedIn and Twitter.
Forward Looking Statements
This communication contains forward-looking statements within the meaning of the Private Securities Litigation Reform Act of 1995. Forward-looking statements reflect management’s current expectations, as of the date of this communication, and involve certain risks and uncertainties. Forward-looking statements include statements herein with respect to the successful execution of the Company’s business strategy. The Company’s actual results could differ materially from those anticipated in these forward-looking statements as a result of various factors. Such risks and uncertainties include, among other things, our ability to establish and maintain the proprietary nature of our technology through the patent process, as well as our ability to possibly license from others patents and patent applications necessary to develop products; the availability of financing; the Company’s ability to implement its long range business plan for various applications of its technology; the Company’s ability to enter into agreements with any necessary partners; the impact of competition, the obtaining and maintenance of any necessary regulatory clearances applicable to applications of the Company’s technology; and management of growth and other risks and uncertainties that may be detailed from time to time in the Company’s reports filed with the Securities and Exchange Commission.
Investor Relations:
Kirin Smith, President
PCG Advisory, Inc.
646.823.8656
[email protected]
Exhibit 99.2

HOLDINGS COMPUTING April 2022 Flash May 2022 1

Preamble The following discussion is completely qualified by the legal disclosures on the several pages following this one Our goal is to share with you some of our strategic thinking and financial analysis we are using to guide the growth of our business The discussion is in line with our principles of being accountable and transparent with shareholders We operate in a hyper dynamic economic environment . That’s a fancy way of saying things change quickly. What we are telling you here is based on our estimates and assumptions which are our best guess. We reserve the right to revise our point of view based on new information and changes in the business environment Despite an uncertain, dynamic environment, we must plan and make operating and investment decisions. This presentation lays some of that out for your review 2

Legal Disclosure & Disclaimer This presentation includes forward-looking statements within the meaning of the Private Securities Litigation Reform Act that reflect our current views with respect to, among other things, our operations, business strategy, interpretation of prior development activities, plans to develop and commercialize our products and services, potential market opportunity, financial performance and needs for additional financing. We have used words like “anticipate,” “believe,” “could,” “estimate,” “expect,” “future,” “intend,” “may,” “plan,” “potential,” “project,” “will,” and similar terms and phrases to identify forward-looking statements in this presentation. The forward-looking statements contained in this presentation are based on management's current expectations and are subject to substantial risks, uncertainty and changes in circumstances. Actual results may differ materially from those expressed by these expectations due to risks and uncertainties, including, among others, those related to our ability to obtain additional capital on favorable terms to us, or at all, the success, timing and cost of ongoing or future operations, the lengthy and unpredictable nature of the project development, and technology process and businesses in which we currently engage or may engage. These risks and uncertainties include, but may not be limited to, those described in our filings with the SEC. Forward-looking statements speak only as of the date of this presentation, and we undertake no obligation to review or update any forward-looking statement except as may be required by applicable law. 3

Legal Disclosure & Disclaimer The material in this presentation has been prepared by Soluna and is general background information about Soluna’s activities, current as at the date of this presentation and is provided for information purposes only. It should be read in conjunction with Soluna’s periodic and continuous disclosure announcements filed with the Securities and Exchange Commission. This presentation provides information in summary form only and is not intended to be complete. Soluna makes no representation or warranty, express or implied, as to the accuracy, completeness, fairness or reliability of any of the information, illustrations, examples, opinions, forecasts, reports, estimates and conclusions contained in this presentation. It is not intended to be relied upon as advice or a recommendation to investors or potential investors and does not take into account the investment objectives, financial situation, taxation situation or needs of any particular investor. Due care and consideration should be undertaken when considering and analyzing Soluna’s future performance and business prospects. THIS PRESENTATION IS NOT INTENDED TO SERVE AS A FORECAST OF ANY SUCH FUTURE PERFORMANCE OR PROSPECTS. An investor must not act on any matter contained in this document but must make its own assessment of Soluna and conduct its own investigations and analysis. Investors should assess their own individual financial circumstances and consider talking to a financial adviser, professional adviser or consultant before making any investment decision. This document does not constitute an offer, invitation, solicitation or recommendation with respect to the purchase or sale of any security in Soluna nor does it constitute financial product advice. This document is not a prospectus, product disclosure statement or other offer document under United States federal or state securities law or under any other law. This document has not been filed, registered or approved by regulatory authorities in any jurisdiction. Any projection, forecast, estimate or other “forward-looking” statement in this presentation only illustrates hypothetical performance under specified assumptions of events or conditions that have been clearly delineated herein. Such projections, forecasts, estimates or other “forward-looking” statements are not reliable indicators of future performance. Hypothetical or illustrative performance information contained in these materials may not be relied upon as a promise, prediction or projection of future performance and are subject to significant assumptions and limitations. In addition, not all relevant events or conditions may have been considered in developing such assumptions. READERS OF THIS DOCUMENT SHOULD UNDERSTAND THE ASSUMPTIONS AND EVALUATE WHETHER THEY ARE APPROPRIATE FOR THEIR PURPOSES. SOME EVENTS OR CONDITIONS MAY NOT HAVE BEEN CONSIDERED IN SUCH ASSUMPTIONS. ACTUAL EVENTS OR CONDITIONS WILL VARY AND MAY DIFFER MATERIALLY FROM SUCH ASSUMPTIONS. READERS SHOULD UNDERSTAND SUCH ASSUMPTIONS AND EVALUATE WHETHER THEY ARE APPROPRIATE FOR THEIR PURPOSES. This presentation may include figures related to past performance or simulated past performance as well as forecasted or simulated future performance. Soluna disclaims any obligation to update their views of such risks and uncertainties or to publicly announce the results of any revision to the forward-looking statements made herein. 4

Legal Disclosure & Disclaimer Use of Projections and Illustrations This presentation contains certain financial forecasts and illustrations. Neither Soluna’s [nor Soluna Holdings] independent auditors have studied, reviewed, compiled or performed any procedures with respect to the projections for the purpose of their inclusion in this presentation. The material in this presentation is for illustrative purposes only and should not be relied upon as being necessarily indicative of future results. To supplement our consolidated financial statements, which are prepared and presented in accordance with GAAP, we use the following non-GAAP financial measures: non-gaap revenue, cash contribution margin, cash contribution margin excluding tornado, adjusted cost of cryptocurrency revenue and adjusted EBITDA contribution. The presentation of this financial information is not intended to be considered in isolation or as a substitute for, or superior to, the financial information prepared and presented in accordance with GAAP. Use of Estimates in Monthly Presentations Numbers presented BEFORE the release of Form 10-Q for second quarter ended June 30th, 2022, are monthly estimates and subject to change upon final accounting adjustments and entries. These monthly estimates are presented as an illustration of management’s review of key metrics that help in understanding the performance of the Company. Readers are strongly encouraged to review this presentation in connection with the Company’s Quarterly Report on Form 10-Q for the period ended March 31, 2022 and the Company’s Annual Report on Form 10-K for the year ended December 31, 2021. 5

Key Operating Principles (1) Calculated as a percent of total undiluted shares 6
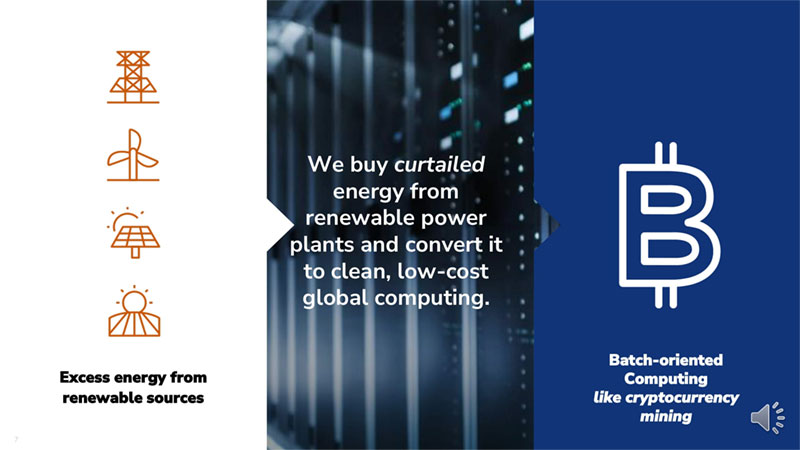
Excess energy from Batch-oriented Computing renewable sources like cryptocurrency mining 7

The opportunity beyond crypto is Batchable Computing $10B Digital currencies $5B Pharma research $40B Scientific research 8

Agenda In this presentation, we will be covering the following items: Business Update Q1 2022 and April 2022 results in detail 9

Business Update 10

Business Summary April was the best month in Soluna’s history o Compared to March, April Cash Contribution dollars increased by 38%* o Proprietary mining revenue grew sequentially by 10%, hashrate by 15%, and BTC equivalent generated by 11% Drivers to margin growth o Sophie and Marie facilities continue to scale, driving better absorption of fixed costs o Sophie moved to its 84% uptime for power costs of 2.5-2.7 ¢ per kWh Revenue growth continues as hashrate grows o 62%** growth in proprietary hashrate expected from April to May By the end of Q2 2022, tracking to achieve 1.26 EH o As of May 8th, 983 PH*** plugged in with 147 PH on the ground for a total of 1.13 EH o By the end of Q2 2022, should have about 1 EH proprietary and 260-280 PH Hosted *Excludes the impact of tornado and forced shutdowns. 11 **Includes 147 PH/s on the ground as of May 8th, 2022. ***Peak hash rate.

Overview of Spring Lane Financing Recently closed a $35 million project financing committed with Spring Lane Ventures This is the first of several we expect to close this year Provides us an opportunity to monetize our intellectual property o Once we return capital and hurdle rate, Soluna keeps a significant portion of the upside 12

Why is Spring Lane Financing Important Provides structural template for additional deals Spring Lane is a well-known green infrastructure investor They conducted diligence of the entire set of investment opportunities and concluded: o Our projects are one of the few real green data centers. Project Dorothy is co-located at a wind farm o After extensive analysis, our projects present one of the best economic opportunities in the sector 13

Capital Expenditures Dynamic crypto ecosystem drives about $100 million capital expenditure budget decrease since January Capital expenditure revised from about $300 million to ~$180-$210 million As crypto prices have declined, so have equipment prices 20% 28% 33% 76% 65% 59% Jan 2022* Current Compute Price** *Note: 2022 Earnings Power Illustration released on January 19th, 2022. Not updated since original publication. Press release and presentation can be viewed here. 14 **Management estimate
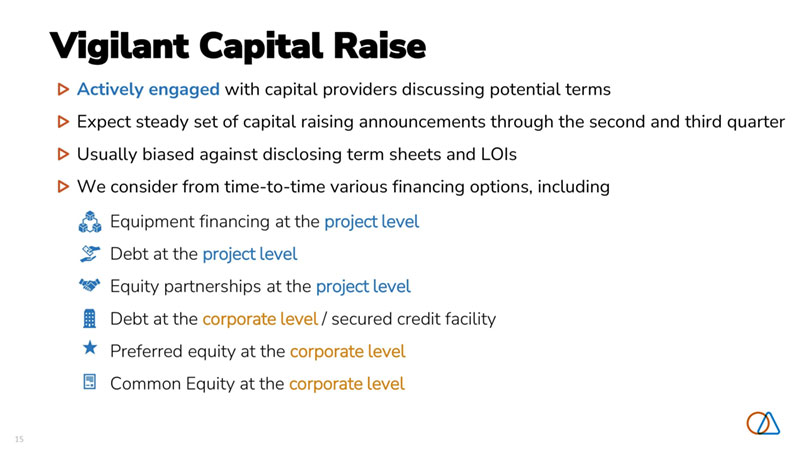
Vigilant Capital Raise Actively engaged with capital providers discussing potential terms Expect steady set of capital raising announcements through the second and third quarter Usually biased against disclosing term sheets and LOIs We consider from time-to-time various financing options, including Equipment financing at the project level Debt at the project level Equity partnerships at the project level Debt at the corporate level / secured credit facility Preferred equity at the corporate level Common Equity at the corporate level 15
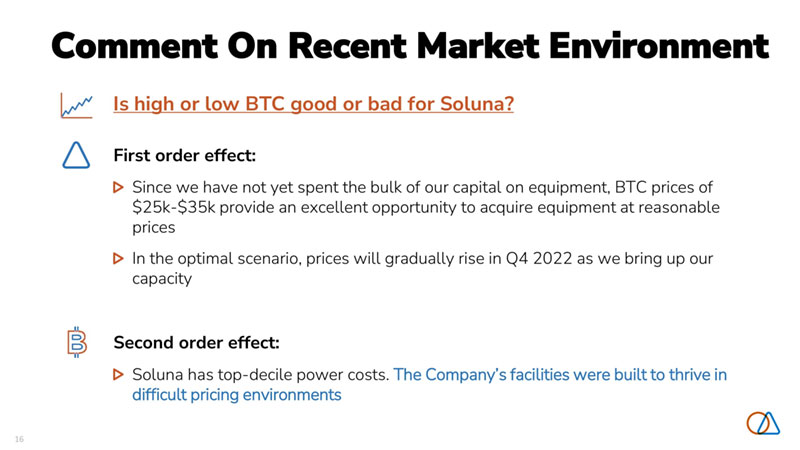
Comment On Recent Market Environment Is high or low BTC good or bad for Soluna? First order effect: Since we have not yet spent the bulk of our capital on equipment, BTC prices of $25k-$35k provide an excellent opportunity to acquire equipment at reasonable prices In the optimal scenario, prices will gradually rise in Q4 2022 as we bring up our capacity Second order effect: Soluna has top -decile power costs. The Company’s facilities were built to thrive in difficult pricing environments 16

Our Targets For 2022 Our Energized Capacity Ramps Over 150 MW Our Hashrate Scales Over 3 EH Note: 2022 Earnings Power Illustration released on January 19th, 2022. Not updated since original publication. Press release and presentation can be viewed here. 17

Driving to 1.261 EH/s by End of June 62% Proprietary hashrate growth expected from April to May* ~147 PH/s on the ground to be installed over the upcoming weeks Consolidated Hashrate (SHA-256, PH/s) 2,001 ~147 PH/s on the ground 983 PH/s installed as of 1,261 1,268 May 8th, 2022 1,130 733 528 616 696 714 567 316 403 22 61 125 July 2021 Aug 2021 Sep 2021 Oct 2021 Nov 2021 Dec 2021 Jan 2022 Feb 2022 Mar 2022 Apr 2022 May 8, 2022* Jun 30, 2022** Sep 30, 2022** Hosted JVProp MiningProp Mining (On The Ground) *May 8th hashrate represents peak hash rate **Our Hosting JV Commitment is fulfilled 18 ***Management Estimate +/- 30 days March estimate of 714 PH/s includes impact of forced shutdown at Marie on average hashrate

Facility Results Review We will review each facility Then look at the consolidated results 19

Edith Continue to optimize equipment mix at mature facility Cash Contribution Margin (Non-GAAP) at $127 thousand for April o BTC equivalent mined increased by 7% from 4.31 in March to 4.60 in April o Average Hashrate and MW deployed increased a bit due to optimizing mix of coins mined As of May 8th, 2022, increased hashrate to 12.5 PH/s o Average April 2022 hashrate was 12.4 PH/s (5%) 7% * (28 days) (31 days) (30 days) 20 Note: Management estimate as of May 8th, 2022. Feb-Apr 2022 Hashrate is average of the month. * Daily average hashrate.
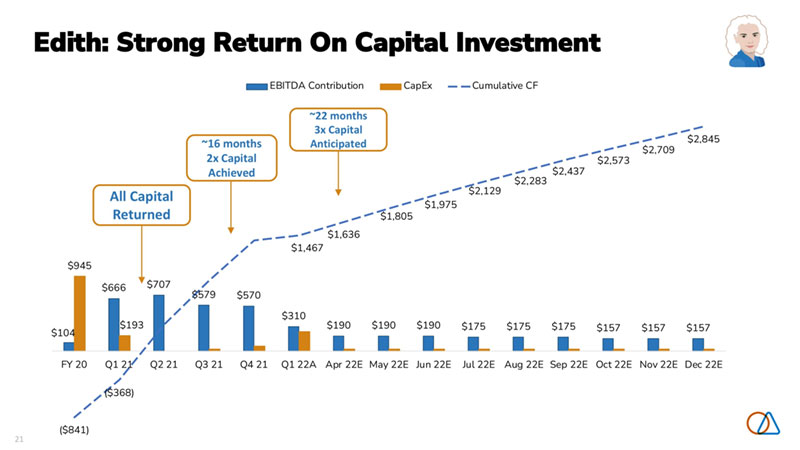
Edith: Strong Return On Capital Investment EBITDA Contribution CapEx Cumulative CF ~22 months 3x Capital $2,845 ~16 months Anticipated $2,709 2x Capital $2,437 $2,573 Achieved $2,129 $2,283 All Capital $1,975 Returned $1,805 $1,636 $1,467 $945 $666 $707 $193 $579 $570 $310 $104 $190 $190 $190 $175 $175 $175 $157 $157 $157 FY 20 Q1 21 Q2 21 Q3 21 Q4 21 Q1 22A Apr 22E May 22E Jun 22E Jul 22E Aug 22E Sep 22E Oct 22E Nov 22E Dec 22E ($368) ($841) 21
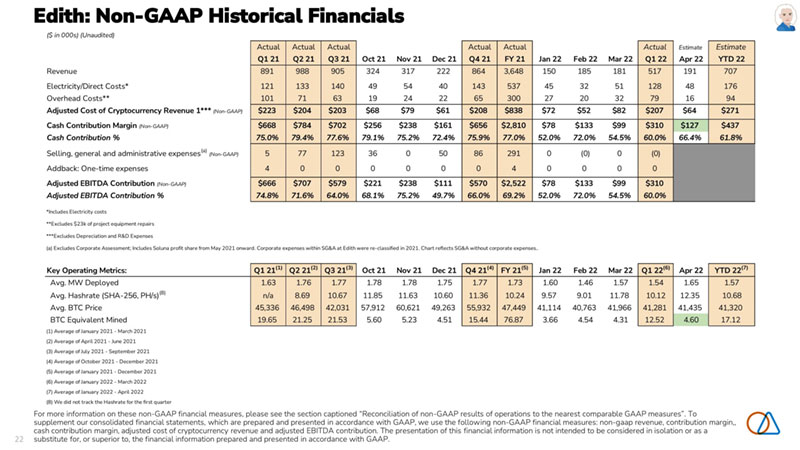
Edith: Non-GAAP Historical Financials ($ in 000s) (Unaudited) Actual Actual Actual Actual Actual Actual Estimate Estimate Q1 21 Q2 21 Q3 21 Oct 21 Nov 21 Dec 21 Q4 21 FY 21 Jan 22 Feb 22 Mar 22 Q1 22 Apr 22 YTD 22 Revenue 891 988 905 324 317 222 864 3,648 150 185 181 517 191 707 Electricity/Direct Costs* 121 133 140 49 54 40 143 537 45 32 51 128 48 176 Overhead Costs** 101 71 63 19 24 22 65 300 27 20 32 79 16 94 Adjusted Cost of Cryptocurrency Revenue 1*** (Non-GAAP) $223 $204 $203 $68 $79 $61 $208 $838 $72 $52 $82 $207 $64 $271 Cash Contribution Margin (Non-GAAP) $668 $784 $702 $256 $238 $161 $656 $2,810 $78 $133 $99 $310 $127 $437 Cash Contribution % 75.0% 79.4% 77.6% 79.1% 75.2% 72.4% 75.9% 77.0% 52.0% 72.0% 54.5% 60.0% 66.4% 61.8% Selling, general and administrative expenses(a) (Non-GAAP) 5 77 123 36 0 50 86 291 0 (0) 0 (0) Addback: One-time expenses 4 0 0 0 0 0 0 4 0 0 0 0 Adjusted EBITDA Contribution (Non-GAAP) $666 $707 $579 $221 $238 $111 $570 $2,522 $78 $133 $99 $310 Adjusted EBITDA Contribution % 74.8% 71.6% 64.0% 68.1% 75.2% 49.7% 66.0% 69.2% 52.0% 72.0% 54.5% 60.0% *Includes Electricity costs **Excludes $23k of project equipment repairs ***Excludes Depreciation and R&D Expenses (a) Excludes Corporate Assessment; Includes Soluna profit share from May 2021 onward. Corporate expenses within SG&A at Edith were re-classified in 2021. Chart reflects SG&A without corporate expenses.. Key Operating Metrics: Q1 21(1) Q2 21(2) Q3 21(3) Oct 21 Nov 21 Dec 21 Q4 21(4) FY 21(5) Jan 22 Feb 22 Mar 22 Q1 22(6) Apr 22 YTD 22(7) Avg. MW Deployed 1.63 1.76 1.77 1.78 1.78 1.75 1.77 1.73 1.60 1.46 1.57 1.54 1.65 1.57 Avg. Hashrate (SHA-256, PH/s)(8) n/a 8.69 10.67 11.85 11.63 10.60 11.36 10.24 9.57 9.01 11.78 10.12 12.35 10.68 Avg. BTC Price 45,336 46,498 42,031 57,912 60,621 49,263 55,932 47,449 41,114 40,763 41,966 41,281 41,435 41,320 BTC Equivalent Mined 19.65 21.25 21.53 5.60 5.23 4.51 15.44 76.87 3.66 4.54 4.31 12.52 4.60 17.12 (1) Average of January 2021 - March 2021 (2) Average of April 2021 - June 2021 (3) Average of July 2021 - September 2021 (4) Average of October 2021 - December 2021 (5) Average of January 2021 - December 2021 (6) Average of January 2022 - March 2022 (7) Average of January 2022 - April 2022 (8) We did not track the Hashrate for the first quarter For more information on these non-GAAP financial measures, please see the section captioned “Reconciliation of non-GAAP results of operations to the nearest comparable GAAP measures”. To supplement our consolidated financial statements, which are prepared and presented in accordance with GAAP, we use the following non-GAAP financial measures: non-gaap revenue, contribution margin,, cash contribution margin, adjusted cost of cryptocurrency revenue and adjusted EBITDA contribution. The presentation of this financial information is not intended to be considered in isolation or as a 22 substitute for, or superior to, the financial information prepared and presented in accordance with GAAP.
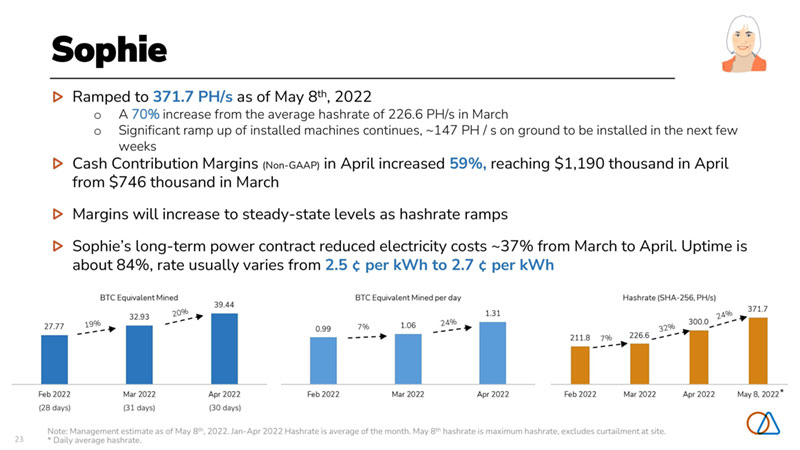
Sophie Ramped to 371.7 PH/s as of May 8th, 2022 o A 70% increase from the average hashrate of 226.6 PH/s in March o Significant ramp up of installed machines continues, ~147 PH / s on ground to be installed in the next few weeks Cash Contribution Margins (Non-GAAP) in April increased 59%, reaching $1,190 thousand in April from $746 thousand in March Margins will increase to steady-state levels as hashrate ramps Sophie’s long-term power contract reduced electricity costs ~37% from March to April. Uptime is about 84%, rate usually varies from 2.5 ¢ per kWh to 2.7 ¢ per kWh * (28 days) (31 days) (30 days) Note: Management estimate as of May 8th, 2022. Jan-Apr 2022 Hashrate is average of the month. May 8th hashrate is maximum hashrate, excludes curtailment at site. 23 * Daily average hashrate.

Sophie: Non-GAAP Historical Financials ($ in 000s) (Unaudited) Actual Actual Actual Estimate Estimate Oct 21 Nov 21 Dec 21 Q4 21 FY 21 Jan 22 Feb 22 Mar 22 Q1 22 Apr 22 YTD 22 Revenue 543 1,048 1,181 2,772 2,772 1,294 1,132 1,382 3,808 1,634 5,442 Electricity/Direct Costs* 284 232 369 884 884 500 531 516 1,546 325 1,872 Overhead Costs 68 77 139 284 307 106 87 117 311 119 430 Adjusted Cost of Cryptocurrency Revenue 1** (Non-GAAP) $352 $310 $507 $1,169 $1,191 $607 $618 $633 $1,857 $445 $2,302 Cash Contribution Margin (Non-GAAP) $192 $738 $674 $1,604 $1,581 $687 $514 $749 $1,950 $1,190 $3,140 Cash Contribution % 35.3% 70.5% 57.0% 57.8% 57.0% 53.1% 45.4% 54.2% 51.2% 72.8% 57.7% Cash Contribution Margin excluding Tornado (Non-GAAP) $192 $738 $775 $1,705 $1,683 $687 $514 $749 $1,950 $1,190 $3,140 Selling, general and administrative expenses(a) (Non-GAAP) 26 5 11 42 354 5 3 9 17 Addback: One-time expenses 21 0 0 21 21 0 0 0 0 Adjusted EBITDA Contribution (Non-GAAP) $186 $733 $765 $1,684 $1,350 $682 $511 $740 $1,933 Adjusted EBITDA Contribution % 34.2% 70.0% 64.8% 60.7% 48.7% 52.7% 45.2% 53.5% 50.8% *Includes Electricity costs **Excludes Depreciation and R&D Expenses (a) Excludes Corporate Assessment Key Operating Metrics: Oct 21 Nov 21 Dec 21 Q4 21(1) FY 21(1) Jan 22 Feb 22 Mar 22 Q1 22(2) Apr 22 YTD 22(3) Avg, MW Deployed 4.43 7.63 10.12 7.39 7.39 13.83 14.10 13.29 13.74 15.24 14.12 Avg. Hashrate (SHA-256, PH/s) 42.32 77.64 157.37 92.44 92.44 205.95 211.78 226.63 214.79 300.03 236.10 Avg. BTC Price 57,912 60,621 49,263 55,932 47,449 41,114 40,763 41,966 41,281 41,435 41,320 BTC Equivalent Mined 9.38 17.29 23.97 49.56 58.42 31.47 27.77 32.93 92.23 39.44 131.70 (1) Average of October 2021 - December 2021 (2) Average of January 2022 - March 2022 (3) Average of January 2022 - April 2022 Note: BTC Price in FY 21 column is the average of January 2021 to December 2021 For more information on these non-GAAP financial measures, please see the section captioned “Reconciliation of non-GAAP results of operations to the nearest comparable GAAP measures”. To supplement our consolidated financial statements, which are prepared and presented in accordance with GAAP, we use the following non-GAAP financial measures: non-gaap revenue, contribution margin, cash contribution margin, adjusted cost of cryptocurrency revenue and adjusted EBITDA contribution. The presentation of this financial information is not intended to be considered in isolation or as a 24 substitute for, or superior to, the financial information prepared and presented in accordance with GAAP.

Marie Prop Mining hashrate increased 37% from average 206.3 PH/s in April to 293.2 PH/s on May 8th o In May, Margins and BTC equivalent mined per day will increase proportionately In March and April, facility experienced a near complete shut down for several days due to failure of electrical infrastructure outside of Soluna’s responsibility and purview o Utilized some of this time to perform planned maintenance and reduce future planned downtime o Some key learnings: The company needs to interject itself to inspect and assure excellence in preventive maintenance of electrical infrastructure that feeds its facilities, even if the infrastructure is not owned or maintained by Soluna o Site is back online, and we continue to maximize our hashrate at this facility * (28 days) (31 days) (30 days) 25 Note: Management estimate as of May 8th, 2022. Jan-Apr 2022 Hashrate is average of the month. * Daily average hashrate.

Marie: Impact of forced shutdown ($ in 000s) Marie - March (5 Days) Marie - April (8 Days) Estimate Shutdown Estimate Estimate Shutdown Estimate Mar 22 Impact* Pro-Forma Mar 22 Impact* Pro-Forma Revenue (Non-GAAP) $1,637 $319 $1,956 $1,567 $531 $2,098 Prop Mining 1,191 249 1,440 1,192 430 1,621 Hosted JV 446 70 515 375 101 477 Cash Contribution Margin (Non-GAAP) $866 $163 $1,030 $1,002 $278 $1,280 Prop Mining 821 149 970 892 258 1,149 Hosted JV 45 14 59 110 20 130 Forced shutdown led to a reduction in revenue of $531 and $319 thousand (12.82 and 7.59 BTC equivalent mined) in April and March, respectively and Cash Contribution Margin of $278 and $163 thousand, respectively A new line was installed to our facility resolving many of the issues. There are a few remaining issues we are seeking to resolve which may require an additional 5 days of down time over the remainder of the year. Marie excludes pass-through revenue and expenses from Legacy Hosting customers. Electricity/Direct Costs reduced by Marie “Prepaid Lease Cost” August 2021 onward. For more information on these non-GAAP financial measures, please see the section captioned “Reconciliation of non -GAAP results of operations to the nearest comparable GAAP measures”. To supplement our consolidated financial statements, which are prepared and presented in accordance with GAAP, we use the following non-GAAP financial measures: non-gaap revenue, contribution margin, cash contribution margin, adjusted cost of cryptocurrency revenue and adjusted EBITDA contribution. The presentation of this financial information is not intended to be considered in isolation or as a substitute for, or superior to, the financial information prepared and presented in accordance with GAAP. 26 *Note: Management estimate

Marie: Non-GAAP Historical Financials(A) ($ in 000s) (Unaudited) Actual Actual Actual Actual Actual Estimate Estimate Q2 21 Q3 21 Oct 21 Nov 21 Dec 21 Q4 21 FY 21 Jan 22 Feb 22 Mar 22 Q1 22 Apr 22 YTD 22 Revenue (Non-GAAP) $668 $1,463 $1,274 $1,267 $1,813 $4,354 $6,589 $1,533 $1,770 $1,637 $4,940 $1,567 $6,507 Prop Mining 668 1,114 793 595 1,238 2,626 4,512 1,032 1,264 1,191 3,488 1,192 4,679 Hosting 0 349 481 672 575 1,729 2,078 501 505 446 1,452 375 1,828 Electricity/Direct Costs* $190 $392 $336 $381 $562 $1,279 $1,884 $581 $590 $654 $1,825 $525 $2,350 Prop Mining 190 208 83 70 236 389 811 249 235 254 739 260 998 Hosting 0 184 253 312 326 890 1,074 332 354 400 1,086 265 1,352 Overhead Costs $0 $54 $59 $112 $118 $290 $345 $127 $89 $117 $333 $41 $373 Prop Mining 0 54 59 112 118 290 345 127 89 117 333 41 373 Hosting 0 0 0 0 0 0 0 0 0 0 0 0 0 Adjusted Cost of Cryptocurrency Revenue 2** (Non-GAAP) $190 $446 $395 $494 $681 $1,569 $2,229 $708 $679 $771 $2,158 $565 $2,723 Prop Mining 190 263 143 182 355 679 1,155 377 324 370 1,071 300 1,371 Hosting 0 184 253 312 326 890 1,074 332 354 400 1,086 265 1,352 Cash Contribution Margin (Non-GAAP) $478 $1,016 $879 $773 $1,132 $2,785 $4,361 $825 $1,091 $866 $2,782 $1,002 $3,784 Prop Mining 478 851 650 413 883 1,946 3,357 655 940 821 2,416 892 3,308 Hosting 0 166 229 360 249 839 1,004 169 151 45 366 110 476 Cash Contribution % (Non-GAAP) 71.6% 69.5% 69.0% 61.0% 62.5% 64.0% 66.2% 53.8% 61.7% 52.9% 56.3% 63.9% 58.2% Prop Mining 71.6% 76.4% 82.0% 69.4% 71.3% 74.1% 74.4% 63.5% 74.4% 68.9% 69.3% 74.8% 70.7% Hosting n/a 47.4% 47.5% 53.6% 43.3% 48.5% 48.3% 33.8% 29.9% 10.2% 25.2% 29.3% 26.0% Cash Contribution Margin excl. Tornado & Shutdown (Non-GAAP) $478 $1,016 $879 $773 $1,166 $2,818 $4,394 $825 $1,091 $1,030 $2,945 $1,280 $4,225 Selling, general and administrative expenses(a) (Non-GAAP) 83 539 65 4 9 77 1,059 4 34 33 72 Addback: One-time expenses 37 486 2 0 8 10 880 0 Adjusted EBITDA Contribution (Non-GAAP) $432 $963 $817 $769 $1,165 $2,752 $4,215 $820 $1,057 $996 $2,874 Adjusted EBITDA Contribution % 64.7% 65.8% 64.1% 60.7% 64.3% 63.2% 64.0% 53.5% 59.8% 60.9% 58.2% *Includes Electricity and Hosting costs **Excludes Depreciation and R&D Expenses (a) Excludes Corporate Assessment (A) Marie excludes pass-through revenue and expenses from Legacy Hosting customers. Electricity/Direct Costs reduced by Marie “Prepaid Lease Cost” August 2021 onward. For details on legacy hosting, see appendix. For more information on these non-GAAP financial measures, please see the section captioned “Reconciliation of non-GAAP results of operations to the nearest comparable GAAP measures”. To supplement our consolidated 27 financial statements, which are prepared and presented in accordance with GAAP, we use the following non-GAAP financial measures: non-gaap revenue, contribution margin, cash contribution margin, adjusted cost of cryptocurrency revenue and adjusted EBITDA contribution. The presentation of this financial information is not intended to be considered in isolation or as a substitute for, or superior to, the financial information prepared and presented in accordance with GAAP.

Marie: Operating Metrics(A) (1) (2) (3) (4) (5) (6) Key Operating Metrics: Q2 21 Q3 21 Oct 21 Nov 21 Dec 21 Q4 21 FY 21 Jan 22 Feb 22 Mar 22 Q1 22 Apr 22 YTD 22 Avg. MW Deployed 1.58 3.09 8.80 10.67 12.45 10.64 7.46 14.75 17.29 15.61 15.88 14.59 15.56 Prop Mining 1.58 1.76 2.50 2.59 4.32 3.14 2.16 6.95 8.79 7.11 7.62 7.70 7.64 Hosted MW (Legacy) - - - - - - - - - - - - - Hosted JV - 1.99 6.30 8.08 8.13 7.50 5.30 7.80 8.50 8.50 8.27 6.89 7.92 Avg. Hashrate (SHA-256, PH/s) 12.80 58.62 262.05 313.53 398.72 324.77 205.06 400.93 475.58 447.90 441.47 421.08 436.37 Prop Mining 12.80 28.25 63.93 36.24 143.98 81.38 40.81 148.73 218.16 213.18 193.36 206.34 196.60 Hosted JV - 45.56 198.12 277.29 254.74 243.38 164.25 252.20 257.42 234.72 248.11 214.74 239.77 Avg. Hashrate (Scrypt, GH/s) 221.90 187.50 177.70 173.13 144.25 165.03 191.48 140.99 141.57 76.76 119.77 146.45 126.44 Avg. BTC Price 46,498 42,031 57,912 60,621 49,263 55,932 47,449 41,114 40,763 41,966 41,281 41,435 41,320 BTC Equivalent Mined 14.37 34.80 22.00 20.90 36.81 77.85 138.87 37.29 43.41 39.01 119.66 37.82 157.47 Prop Mining 14.37 26.49 13.69 9.81 25.13 46.94 95.08 25.10 31.01 28.39 84.48 28.76 113.24 Hosting - 8.31 8.31 11.08 11.68 30.91 43.79 12.19 12.40 10.62 35.18 9.06 44.23 (1) Average of April 2021 - June 2021 (2) Average of July 2021 - September 2021 (3) Average of October 2021 - December 2021 (4) Average of January 2021 - December 2021 (5) Average of January 2022 - March 2022 (6) Average of January 2022 - April 2022 (A) Marie excludes pass-through revenue and expenses from Legacy Hosting customers. Electricity/Direct Costs reduced by Marie “Prepaid Lease Cost” August 2021 onward. For details on legacy hosting, see appendix. For more information on these non-GAAP financial measures, please see the section captioned “Reconciliation of non-GAAP results of operations to the nearest comparable GAAP measures”. To supplement our consolidated 28 financial statements, which are prepared and presented in accordance with GAAP, we use the following non-GAAP financial measures: non-gaap revenue, contribution margin, cash contribution margin, adjusted cost of cryptocurrency revenue and adjusted EBITDA contribution. The presentation of this financial information is not intended to be considered in isolation or as a substitute for, or superior to, the financial information prepared and presented in accordance with GAAP.

Site Consolidation Combined installed hashrate increased by 31% to 959.3 PH/s over average 733.5 PH/s in April Marie forced shutdown negatively impacted revenue and margins but margin impact was more than offset by reduced power costs at Sophie o Issue has been resolved and team proactively managing site, including infrastructure outside of Soluna’s responsibility and purview On track to achieve 1.26 EH/s by the end of Q2 2022 * (28 days) (31 days) (30 days) Note: Management estimate as of May 8th, 2022. Jan-Apr 2022 Hashrate is average of the month. 29 * Daily average hashrate.

Consolidated Soluna Computing Non-GAAP Historical Financials(A) ($ in 000s) (Unaudited) Actual Actual Actual Actual Actual Actual Estimate Estimate Q1 21 Q2 21 Q3 21 Oct 21 Nov 21 Dec 21 Q4 21 FY 21 Jan 22 Feb 22 Mar 22 Q1 22 Apr 22 YTD 22 Revenue (Non-GAAP) $995 $1,657 $2,368 $2,142 $2,632 $3,216 $7,990 $13,010 $2,977 $3,087 $3,200 $9,264 $3,392 $12,656 Prop Mining 995 1,657 2,018 1,661 1,960 2,641 6,261 10,932 2,476 2,581 2,754 7,812 3,017 10,828 Hosting 0 0 349 481 672 575 1,729 2,078 501 505 446 1,452 375 1,828 Electricity/Direct Costs* $143 $324 $532 $669 $668 $971 $2,307 $3,306 $1,127 $1,152 $1,220 $3,499 $898 $4,398 Prop Mining 143 324 348 416 356 645 1,417 2,232 795 798 820 2,413 633 3,046 Hosting 0 0 184 253 312 326 890 1,074 332 354 400 1,086 265 1,352 Overhead Costs $109 $72 $132 $146 $214 $279 $639 $952 $261 $196 $265 $722 $176 $898 Prop Mining 109 72 132 146 214 279 639 952 261 196 265 722 176 898 Hosting 0 0 0 0 0 0 0 0 0 0 0 0 0 0 Adjusted Cost of Cryptocurrency Revenue 2** (Non-GAAP) $251 $396 $664 $815 $882 $1,249 $2,946 $4,258 $1,387 $1,348 $1,486 $4,221 $1,074 $5,295 Prop Mining 251 396 481 562 570 923 2,056 3,184 1,056 994 1,085 3,135 809 3,944 Hosting 0 0 184 253 312 326 890 1,074 332 354 400 1,086 265 1,352 Cash Contribution Margin (Non-GAAP) $744 $1,261 $1,703 $1,327 $1,750 $1,967 $5,044 $8,752 $1,590 $1,739 $1,714 $5,043 $2,318 $7,361 Prop Mining 744 1,261 1,538 1,098 1,390 1,718 4,206 7,748 1,421 1,587 1,669 4,677 2,208 6,885 Hosting 0 0 166 229 360 249 839 1,004 169 151 45 366 110 476 Cash Contribution % (Non-GAAP) 74.8% 76.1% 71.9% 62.0% 66.5% 61.2% 63.1% 67.3% 53.4% 56.3% 53.6% 54.4% 68.3% 58.2% Prop Mining 74.8% 76.1% 76.2% 66.1% 70.9% 65.0% 67.2% 70.9% 57.4% 61.5% 60.6% 59.9% 73.2% 63.6% Hosting n/a n/a 47.4% 47.5% 53.6% 43.3% 48.5% 48.3% 33.8% 29.9% 10.2% 25.2% 29.3% 26.0% Cash Contribution Margin excl. Tornado & Shutdown (Non-GAAP) $744 $1,261 $1,703 $1,327 $1,750 $2,102 $5,179 $8,888 $1,590 $1,739 $1,878 $5,206 $2,596 $7,802 Selling, general and administrative expenses(a) (Non-GAAP) 563 292 1,031 161 297 940 1,398 3,284 387 637 1,067 2,091 Addback: One-time expenses(b) (Non-GAAP) 512 37 649 23 0 347 370 1,568 0 0 0 0 Addback: Non-cash stock compensation 0 0 0 0 0 233 233 233 0 0 0 0 Adjusted EBITDA Contribution (Non-GAAP) $693 $1,006 $1,321 $1,190 $1,453 $1,742 $4,385 $7,405 $1,203 $1,102 $810 $3,115 Adjusted EBITDA Contribution % 69.6% 60.7% 55.8% 55.5% 55.2% 54.2% 54.9% 56.9% 40.4% 35.7% 25.3% 33.6% *Includes Electricity and Hosting costs **Excludes Depreciation and R&D Expenses (a) Excludes Corporate Assessment; (b) Management Estimate (A) Marie excludes pass-through revenue and expenses from Legacy Hosting customers. Electricity/Direct Costs reduced by Marie “Prepaid Lease Cost” August 2021 onward. For details on legacy hosting, see appendix. For more information on these non-GAAP financial measures, please see the section captioned “Reconciliation of non-GAAP results of operations to the nearest comparable GAAP measures”. To supplement our consolidated 30 financial statements, which are prepared and presented in accordance with GAAP, we use the following non-GAAP financial measures: non-gaap revenue, contribution margin, cash contribution margin, adjusted cost of cryptocurrency revenue and adjusted EBITDA contribution. The presentation of this financial information is not intended to be considered in isolation or as a substitute for, or superior to, the financial information prepared and presented in accordance with GAAP.

Consolidated Soluna Computing Operating Metrics(A) (1) (2) (3) (4) (5) (6) Key Operating Metrics: Q1 21 Q2 21 Q3 21 Oct 21 Nov 21 Dec 21 Q4 21 FY 21 Jan 22 Feb 22 Mar 22 Q1 22 Apr 22 YTD 22 Avg. MW Deployed 1.63 3.34 4.85 15.01 20.09 24.31 19.80 9.33 30.18 32.85 30.47 31.17 31.48 31.24 Prop Mining 1.63 3.34 3.52 8.71 12.01 16.18 12.30 6.39 22.38 24.35 21.97 22.90 24.59 23.32 Hosted MW (Legacy) - - - - - - - - - - - - - - Hosted JV - - 1.99 6.30 8.08 8.13 7.50 5.30 7.80 8.50 8.50 8.27 6.89 7.92 Avg. Hashrate (SHA-256, PH/s) - 21.49 69.29 316.22 402.80 566.69 428.57 173.12 616.45 696.37 686.31 666.38 733.46 683.15 Prop Mining - 21.49 38.92 118.10 125.51 311.95 185.19 81.86 364.25 438.95 451.59 418.26 518.72 443.38 Hosted JV - - 45.56 198.12 277.29 254.74 243.38 164.25 252.20 257.42 234.72 248.11 214.74 239.77 Avg. Hashrate (Scrypt, GH/s) - 221.90 187.50 177.70 173.13 144.25 165.03 191.48 140.99 141.57 76.76 119.77 146.45 126.44 Avg. BTC Price 45,336 46,498 42,031 57,912 60,621 49,263 55,932 47,449 41,114 40,763 41,966 41,281 41,435 41,320 BTC Equivalent Mined 21.95 35.64 56.33 36.99 43.42 65.29 142.85 274.18 72.41 75.72 76.25 224.41 81.87 306.29 Prop Mining 21.95 35.64 48.02 28.67 32.33 53.61 111.95 230.39 60.23 63.32 65.63 189.23 72.80 262.06 Hosting - - 8.31 8.31 11.08 11.68 30.91 43.79 12.19 12.40 10.62 35.18 9.06 44.23 (1) Average of April 2021 - June 2021 (2) Average of July 2021 - September 2021 (3) Average of October 2021 - December 2021 (4) Average of January 2021 - December 2021 (5) Average of January 2022 - March 2022 (6) Average of January 2022 - April 2022 (A) Marie excludes pass-through revenue and expenses from Legacy Hosting customers. Electricity/Direct Costs reduced by Marie “Prepaid Lease Cost” August 2021 onward. For details on legacy hosting, see appendix. For more information on these non-GAAP financial measures, please see the section captioned “Reconciliation of non-GAAP results of operations to the nearest comparable GAAP measures”. To supplement our consolidated 31 financial statements, which are prepared and presented in accordance with GAAP, we use the following non-GAAP financial measures: non-gaap revenue, contribution margin, cash contribution margin, adjusted cost of cryptocurrency revenue and adjusted EBITDA contribution. The presentation of this financial information is not intended to be considered in isolation or as a substitute for, or superior to, the financial information prepared and presented in accordance with GAAP.

A Closer Look At SG&A ($ in 000s) Q1 2021 Q2 2021 Q3 2021 Q4 2021 FY 2021 Q1 2022 Selling, general & administrative expenses (“SG&A”) (GAAP $ 1,298 $ 2,503 $ 2,317 $ 4,633 $ 10,752 $ 7,255 Non-recurring cash expenses: Related to sale of Instruments business segment $ - $ - $ 51 $ 57 $ 108 $ 175 Exchange registration expenses $ 250 $ 43 $ - $ - $ 293 $ - Soluna acquisition-related expenses $ - $ 355 $ 73 $ (77) $ 351 $ - Operations & management fees $ 170 $ - $ 482 $ 21 $ 672 $ - Other non-recurring cash expenses(1) $ 309 $ 94 $ 193 $ 442 $ 1,037 $ 417 Total Non-recurring cash expenses $ 729 $ 492 $ 798 $ 443 $ 2,462 $ 592 Non-recurring non-cash expenses: Depreciation & amortization $ - $ - $ 0 $ 1,581 $ 1,581 $ 2,373 Non-cash stock expenses $ 29 $ 999 $ 328 $ 582 $ 1,938 $ 915 Total Non-recurring non-cash expenses $ 29 $ 999 $ 328 $ 2,163 $ 3,519 $ 3,288 Adjusted SG&A (Non-GAAP) $ 541 $ 1,011 $ 1,191 $ 2,027 $ 4,771 $ 3,375 (1) Includes non-recurring cash compensation, consultant fees/expenses, legal fees/expenses 32 Note: Non-recurring expenses are management estimates

Appendix

Repeated From Our Earnings Power Illustration(1) Earnings Power Illustration: Various BTC Prices Note: The three scenarios represent changes in BTC price only (in 000's) Q1-22 Q2-22 Q3-22 Q4-22 FY22 Q1-23 Scenario 1: BTC is $20,000 Total Revenue 6,528 7,450 12,062 20,104 46,145 25,393 Contribution Margin (Non-GAAP) 3,437 3,932 7,344 13,372 28,085 17,483 Contribution Margin % 52.6% 52.8% 60.9% 66.5% 60.9% 68.8% Run-Rate Contribution Margin 13,747 15,728 29,377 53,487 - 69,930 Scenario 2: BTC is $45,000 Total Revenue 10,328 14,612 22,223 35,300 82,462 42,755 Contribution Margin (Non-GAAP) 7,236 11,093 17,505 28,567 64,402 34,845 Contribution Margin % 70.1% 75.9% 78.8% 80.9% 78.1% 81.5% Run-Rate Contribution Margin 28,945 44,374 70,022 114,268 - 139,378 Scenario 3: BTC is $60,000 Total Revenue 12,667 19,220 29,164 46,394 107,445 56,334 Contribution Margin (Non-GAAP) 9,575 15,702 24,446 39,662 89,385 48,424 Contribution Margin % 75.6% 81.7% 83.8% 85.5% 83.2% 86.0% Run-Rate Contribution Margin 38,301 62,808 97,785 158,647 - 193,697 Combined Gross PH/s 1,000 1,261 2,001 3,008 3,008 4,000 (1) 2022 Earnings Power Illustration released on January 19th, 2022. Not updated since original publication. Press release and presentation can be viewed here. 34

Our data centers are named after catalyzers Renamed to TNT Edith Renamed to Anaconda Sophie Renamed to Python Marie Edith Clarke was a pioneer in electrical engineering & power transmission. She was a first in so many ways. The first woman to earn an MSc degree at MIT in 1919. The first woman employed as an electrical engineer at General Electric in 1921. The first full-time electrical engineering professor in 1947, at University of Texas. We’re influenced by Edith’s firsts. It drives us to help make renewable, affordable energy the world’s primary power source. Sophie Wilson is a detailed oriented designer who helped invent and deploy ARM technology. This was key to unlocking the mobile and custom chip revolution. She found ways to use processors in more simple ways. We’re building a data center to help the grid. We’re using Sophie’s methods to blend details and simplicity for our first greenfield project. Marie Curie was a fearless seeker of truth—a pioneer in the field of radioactivity. She won two Nobel Prizes. In pursuit of the truth, Soluna is constructing a data center with complete transparency to help make the grid stable. Why such transparency? So, everyone can see & know what must happen, to do the right things. Including the players that have typically had a dark & controlling influence, making reckless decisions. But no longer. 35

Consolidated Soluna Computing Non-GAAP Historical Financials With Legacy Hosting ($ in 000s) (Unaudited) Actual Actual Actual Actual Actual Actual Estimate Estimate Q1 21 Q2 21 Q3 21 Oct 21 Nov 21 Dec 21 Q4 21 FY 21 Jan 22 Feb 22 Mar 22 Q1 22 Apr 22 YTD 22 Revenue $995 $1,657 $3,124 $2,437 $2,811 $3,321 $8,569 $14,345 $3,029 $3,087 $3,200 $9,316 $3,392 $12,708 Prop Mining 995 1,657 2,018 1,661 1,960 2,641 6,261 10,932 2,476 2,581 2,754 7,812 3,017 10,828 Hosting 0 0 1,106 776 851 680 2,307 3,413 553 505 446 1,504 375 1,879 Electricity/Direct Costs* $143 $324 $1,428 $1,025 $947 $1,191 $3,164 $5,059 $1,285 $1,233 $1,310 $3,827 $882 $4,709 Prop Mining 143 324 479 468 415 710 1,593 2,539 872 889 911 2,671 703 3,374 Hosting 0 0 950 557 532 481 1,570 2,520 413 344 398 1,156 180 1,335 Overhead Costs $109 $72 $136 $129 $174 $246 $549 $865 $234 $206 $267 $708 $262 $969 Prop Mining 109 72 136 129 174 246 549 865 234 206 267 708 262 969 Hosting 0 0 0 0 0 0 0 0 0 0 0 0 0 0 Adjusted Cost of Cryptocurrency Revenue 1** (Non-GAAP) $251 $396 $1,564 $1,154 $1,121 $1,437 $3,712 $5,923 $1,519 $1,439 $1,576 $4,535 $1,144 $5,679 Prop Mining 251 396 615 597 589 956 2,142 3,403 1,106 1,095 1,178 3,379 965 4,344 Hosting 0 0 950 557 532 481 1,570 2,520 413 344 398 1,156 180 1,335 Contribution Margin (Non-GAAP) $744 $1,261 $1,560 $1,283 $1,690 $1,884 $4,856 $8,422 $1,510 $1,648 $1,623 $4,781 $2,248 $7,029 Prop Mining 744 1,261 1,404 1,064 1,371 1,685 4,119 7,529 1,370 1,486 1,576 4,433 2,052 6,485 Hosting 0 0 156 219 319 199 737 893 140 161 47 348 196 544 Contribution % (Non-GAAP) 74.8% 76.1% 49.9% 52.6% 60.1% 56.7% 56.7% 58.7% 49.9% 53.4% 50.7% 51.3% 66.3% 55.3% Prop Mining 74.8% 76.1% 69.6% 64.1% 70.0% 63.8% 65.8% 68.9% 55.3% 57.6% 57.2% 56.7% 68.0% 59.9% Hosting n/a n/a 14.1% 28.2% 37.5% 29.3% 31.9% 26.2% 25.3% 31.9% 10.6% 23.2% 52.2% 29.0% Selling, general and administrative expenses(a) (Non-GAAP) 563 292 1,031 161 297 940 1,398 3,284 387 637 1,067 2,091 Addback: One-time expenses(b) (Non-GAAP) 512 37 649 23 0 347 370 1,568 0 0 0 0 Addback: Non-cash stock compensation 0 0 0 0 0 233 233 233 0 0 0 0 Adjusted EBITDA Contribution (Non-GAAP) $693 $1,006 $1,178 $1,145 $1,393 $1,524 $4,062 $6,939 $1,123 $1,011 $556 $2,690 Adjusted EBITDA Contribution % 69.6% 60.7% 37.7% 47.0% 49.5% 45.9% 47.4% 48.4% 37.1% 32.7% 17.4% 28.9% *Includes Electricity and Hosting costs **Excludes Depreciation and R&D Expenses (a) Excludes Corporate Assessment; (b) Management Estimate For more information on these non-GAAP financial measures, please see the section captioned “Reconciliation of non-GAAP results of operations to the nearest comparable GAAP measures”. To supplement our consolidated financial statements, which are prepared and presented in accordance with GAAP, we use the following non-GAAP financial measures: contribution margin, adjusted cost of cryptocurrency revenue and adjusted EBITDA contribution. The presentation of this financial information is not intended to be considered in isolation or as a substitute for, or superior to, the financial information prepared and presented in accordance with GAAP. 36
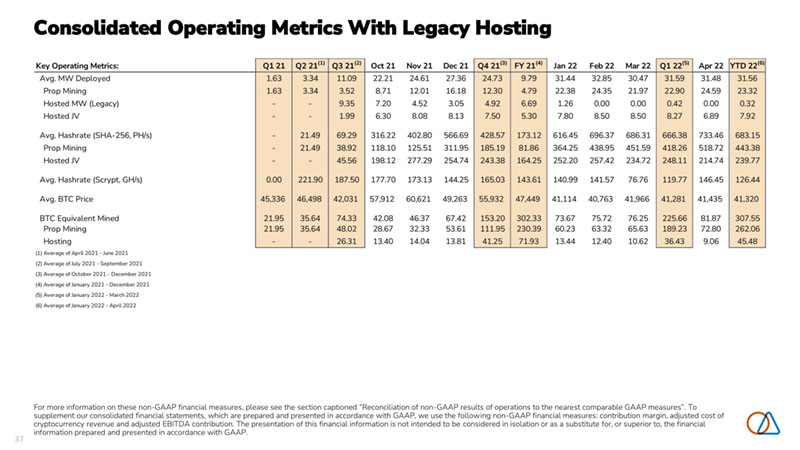
Consolidated Operating Metrics With Legacy Hosting Key Operating Metrics: Q1 21 Q2 21(1) Q3 21(2) Oct 21 Nov 21 Dec 21 Q4 21(3) FY 21(4) Jan 22 Feb 22 Mar 22 Q1 22(5) Apr 22 YTD 22(6) Avg. MW Deployed 1.63 3.34 11.09 22.21 24.61 27.36 24.73 9.79 31.44 32.85 30.47 31.59 31.48 31.56 Prop Mining 1.63 3.34 3.52 8.71 12.01 16.18 12.30 4.79 22.38 24.35 21.97 22.90 24.59 23.32 Hosted MW (Legacy) - - 9.35 7.20 4.52 3.05 4.92 6.69 1.26 0.00 0.00 0.42 0.00 0.32 Hosted JV - - 1.99 6.30 8.08 8.13 7.50 5.30 7.80 8.50 8.50 8.27 6.89 7.92 Avg. Hashrate (SHA-256, PH/s) - 21.49 69.29 316.22 402.80 566.69 428.57 173.12 616.45 696.37 686.31 666.38 733.46 683.15 Prop Mining - 21.49 38.92 118.10 125.51 311.95 185.19 81.86 364.25 438.95 451.59 418.26 518.72 443.38 Hosted JV - - 45.56 198.12 277.29 254.74 243.38 164.25 252.20 257.42 234.72 248.11 214.74 239.77 Avg. Hashrate (Scrypt, GH/s) 0.00 221.90 187.50 177.70 173.13 144.25 165.03 143.61 140.99 141.57 76.76 119.77 146.45 126.44 Avg. BTC Price 45,336 46,498 42,031 57,912 60,621 49,263 55,932 47,449 41,114 40,763 41,966 41,281 41,435 41,320 BTC Equivalent Mined 21.95 35.64 74.33 42.08 46.37 67.42 153.20 302.33 73.67 75.72 76.25 225.66 81.87 307.55 Prop Mining 21.95 35.64 48.02 28.67 32.33 53.61 111.95 230.39 60.23 63.32 65.63 189.23 72.80 262.06 Hosting - - 26.31 13.40 14.04 13.81 41.25 71.93 13.44 12.40 10.62 36.43 9.06 45.48 (1) Average of April 2021 - June 2021 (2) Average of July 2021 - September 2021 (3) Average of October 2021 - December 2021 (4) Average of January 2021 - December 2021 (5) Average of January 2022 - March 2022 (6) Average of January 2022 - April 2022 For more information on these non-GAAP financial measures, please see the section captioned “Reconciliation of non-GAAP results of operations to the nearest comparable GAAP measures”. To supplement our consolidated financial statements, which are prepared and presented in accordance with GAAP, we use the following non-GAAP financial measures: contribution margin, adjusted cost of cryptocurrency revenue and adjusted EBITDA contribution. The presentation of this financial information is not intended to be considered in isolation or as a substitute for, or superior to, the financial information prepared and presented in accordance with GAAP. 37

Marie: Non-GAAP Historical Financials With Legacy Hosting ($ in 000s) (Unaudited) Actual Actual Actual Actual Actual Estimate Estimate Q2 21 Q3 21 Oct 21 Nov 21 Dec 21 Q4 21 FY 21 Jan 22 Feb 22 Mar 22 Q1 22 Apr 22 YTD 22 Revenue $668 $2,219 $1,569 $1,446 $1,918 $4,933 $7,925 $1,585 $1,770 $1,637 $4,991 $1,567 $6,558 Prop Mining 668 1,114 793 595 1,238 2,626 4,512 1,032 1,264 1,191 3,488 1,192 4,679 Hosting 0 1,106 776 851 680 2,307 3,413 553 505 446 1,504 375 1,879 Electricity/Direct Costs* $190 $1,288 $693 $660 $783 $2,136 $3,637 $739 $670 $743 $2,152 $509 $2,662 Prop Mining 190 338 135 128 302 566 1,117 326 326 345 997 330 1,326 Hosting 0 950 557 532 481 1,570 2,520 413 344 398 1,156 180 1,335 Overhead Costs $0 $58 $42 $72 $86 $200 $258 $101 $99 $118 $318 $126 $445 Prop Mining 0 58 42 72 86 200 258 101 99 118 318 126 445 Hosting 0 0 0 0 0 0 0 0 0 0 0 0 0 Adjusted Cost of Cryptocurrency Revenue 1** (Non-GAAP) $190 $1,347 $734 $733 $869 $2,336 $3,895 $840 $769 $861 $2,471 $635 $3,106 Prop Mining 190 397 177 201 388 766 1,375 427 425 463 1,315 456 1,771 Hosting 0 950 557 532 481 1,570 2,520 413 344 398 1,156 180 1,335 Contribution Margin (Non-GAAP) $478 $873 $835 $713 $1,049 $2,597 $4,030 $745 $1,000 $776 $2,521 $932 $3,452 Prop Mining 478 717 616 394 850 1,860 3,136 605 839 728 2,172 736 2,908 Hosting 0 156 219 319 199 737 893 140 161 47 348 196 544 Contribution % (Non-GAAP) 71.6% 39.3% 53.2% 49.3% 54.7% 52.6% 50.8% 47.0% 56.5% 47.4% 50.5% 59.4% 52.6% Prop Mining 71.6% 64.4% 77.6% 66.3% 68.7% 70.8% 69.5% 58.6% 66.4% 61.1% 62.3% 61.7% 62.1% Hosting n/a 14.1% 28.2% 37.5% 29.3% 31.9% 26.2% 25.3% 31.9% 10.6% 23.2% 52.2% 29.0% Selling, general and administrative expenses(a) (Non-GAAP) 83 539 65 4 9 77 1,059 4 34 33 72 Addback: One-time expenses 37 486 2 0 8 10 880 0 Adjusted EBITDA Contribution (Non-GAAP) $432 $820 $772 $709 $1,049 $2,531 $3,851 $740 $967 $742 $2,449 Adjusted EBITDA Contribution % 64.7% 36.9% 49.2% 49.1% 54.7% 51.3% 48.6% 46.7% 54.6% 45.3% 49.1% *Includes Electricity and Hosting costs **Excludes Depreciation and R&D Expenses (a) Excludes Corporate Assessment For more information on these non-GAAP financial measures, please see the section captioned “Reconciliation of non-GAAP results of operations to the nearest comparable GAAP measures”. To supplement our consolidated financial statements, which are prepared and presented in accordance with GAAP, we use the following non-GAAP financial measures: contribution margin, adjusted cost of cryptocurrency revenue and adjusted EBITDA contribution. The presentation of this financial information is not intended to be considered in isolation or as a substitute for, or superior to, the financial information prepared and presented in accordance with GAAP. 38
Reconciliation of non -GAAP results of operations to the nearest comparable GAAP measures 39

Reconciliation Of Non-GAAP Results Reconciliation from GAAP Revenue to Non-GAAP Revenue YTD April 2022 ($ in 000s) (Unaudited) Soluna Computing Edith Marie Sophie Corporate Total Cryptocurrency revenue (GAAP) $707 $6,558 $5,442 $0 $12,708 less Legacy Hosting Revenue 0 52 0 0 52 Revenue (Non-GAAP) $707 $6,507 $5,442 $0 $12,656 40

Reconciliation Of Non-GAAP Results Reconciliation from Cost of Cryptocurrency Revenue to Adjusted Cost of Revenue (Non-GAAP) YTD April 2022 ($ in 000s) (Unaudited) Soluna Computing Edith Marie Sophie Corporate Total Cryptocurrency revenue (GAAP) $707 $6,558 $5,442 $0 $12,708 Cost of cryptocurrency revenue (GAAP): Electricity/Direct costs* 176 2,662 1,872 0 4,709 Overhead costs 219 3,343 3,455 0 7,017 Total cost of cryptocurrency revenue (GAAP) $395 $6,004 $5,327 $0 $11,726 Depreciation 124 2,898 3,025 0 6,048 Project Equipment Repairs 0 0 0 0 0 Adjusted Non-GAAP Cost of Revenue 1** $271 $3,106 $2,302 $0 $5,679 less Legacy Hosting Cost of Revenue 0 55 0 0 55 less Prepaid Lease Cost 0 328 0 0 328 Adjusted Non-GAAP Cost of Revenue 2** $271 $2,723 $2,302 $0 $5,295 *Includes Hosting costs **Excluding Depreciation and R&D Expenses 41
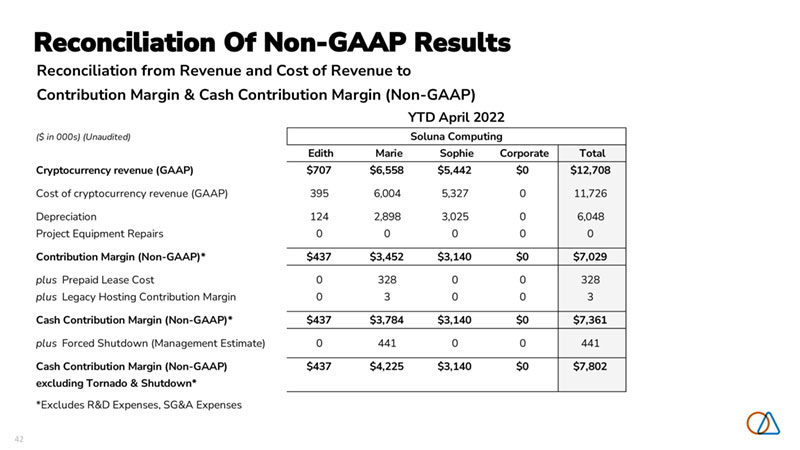
Reconciliation Of Non-GAAP Results Reconciliation from Revenue and Cost of Revenue to Contribution Margin & Cash Contribution Margin (Non-GAAP) YTD April 2022 ($ in 000s) (Unaudited) Soluna Computing Edith Marie Sophie Corporate Total Cryptocurrency revenue (GAAP) $707 $6,558 $5,442 $0 $12,708 Cost of cryptocurrency revenue (GAAP) 395 6,004 5,327 0 11,726 Depreciation 124 2,898 3,025 0 6,048 Project Equipment Repairs 0 0 0 0 0 Contribution Margin (Non-GAAP)* $437 $3,452 $3,140 $0 $7,029 plus Prepaid Lease Cost 0 328 0 0 328 plus Legacy Hosting Contribution Margin 0 3 0 0 3 Cash Contribution Margin (Non-GAAP)* $437 $3,784 $3,140 $0 $7,361 plus Forced Shutdown (Management Estimate) 0 441 0 0 441 Cash Contribution Margin (Non-GAAP) $437 $4,225 $3,140 $0 $7,802 excluding Tornado & Shutdown* *Excludes R&D Expenses, SG&A Expenses 42
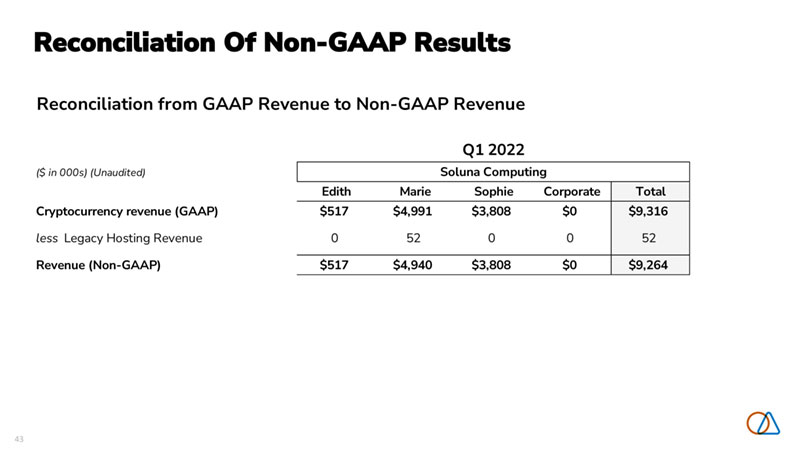
Reconciliation Of Non-GAAP Results Reconciliation from GAAP Revenue to Non-GAAP Revenue Q1 2022 ($ in 000s) (Unaudited) Soluna Computing Edith Marie Sophie Corporate Total Cryptocurrency revenue (GAAP) $517 $4,991 $3,808 $0 $9,316 less Legacy Hosting Revenue 0 52 0 0 52 Revenue (Non-GAAP) $517 $4,940 $3,808 $0 $9,264 43

Reconciliation Of Non-GAAP Results Reconciliation from Cost of Cryptocurrency Revenue to Adjusted Cost of Revenue (Non-GAAP) Q1 2022 ($ in 000s) (Unaudited) Soluna Computing Edith Marie Sophie Corporate Total Cryptocurrency revenue (GAAP) $517 $4,991 $3,808 $0 $9,316 Cost of cryptocurrency revenue (GAAP): Electricity/Direct costs* 128 2,152 1,546 0 3,827 Overhead costs 171 2,446 2,415 0 5,032 Total cost of cryptocurrency revenue (GAAP) $299 $4,598 $3,961 $0 $8,859 Depreciation 93 2,127 2,104 0 4,324 Project Equipment Repairs 0 0 0 0 0 Adjusted Non-GAAP Cost of Revenue 1** $207 $2,471 $1,857 $0 $4,535 less Legacy Hosting Cost of Revenue 0 55 0 0 55 less Prepaid Lease Cost 0 258 0 0 258 Adjusted Non-GAAP Cost of Revenue 2** $207 $2,158 $1,857 $0 $4,221 *Includes Hosting costs **Excluding Depreciation and R&D Expenses 44

Reconciliation Of Non-GAAP Results Reconciliation from Revenue and Cost of Revenue to Contribution Margin & Cash Contribution Margin Q1 2022 ($ in 000s) (Unaudited) Soluna Computing Edith Marie Sophie Corporate Total Cryptocurrency revenue (GAAP) $517 $4,991 $3,808 $0 $9,316 Cost of cryptocurrency revenue (GAAP) 299 4,598 3,961 0 8,859 Depreciation 93 2,127 2,104 0 4,324 Project Equipment Repairs 0 0 0 0 0 Contribution Margin (Non-GAAP)* $310 $2,521 $1,950 $0 $4,781 plus Prepaid Lease Cost 0 258 0 0 258 plus Legacy Hosting Contribution Margin 0 3 0 0 3 Cash Contribution Margin (Non-GAAP)* $310 $2,782 $1,950 $0 $5,043 plus Tornado Impact (Management Estimate) 0 0 0 0 0 plus Forced Shutdown (Management Estimate 0 163 0 0 163 Cash Contribution Margin (Non-GAAP) $310 $2,945 $1,950 $0 $5,206 excluding Tornado & Shutdown* *Excludes R&D Expenses, SG&A Expenses 45

Reconciliation Of Non-GAAP Results Reconciliation from GAAP Revenue to Non-GAAP Revenue FY 2021 ($ in 000s) (Unaudited) Soluna Computing Edith Marie Sophie Corporate Total Cryptocurrency revenue (GAAP) $3,648 $7,925 $2,772 $0 $14,345 less Legacy Hosting Revenue 0 1,335 0 0 1,335 Revenue (Non-GAAP) $3,648 $6,590 $2,772 $0 $13,010 46

Reconciliation Of Non-GAAP Results Reconciliation from Cost of Cryptocurrency Revenue to Adjusted Cost of Revenue (Non-GAAP) FY 2021 ($ in 000s) (Unaudited) Soluna Computing Edith Marie Sophie Corporate Total Cryptocurrency revenue (GAAP) $3,648 $7,925 $2,772 $0 $14,345 Cost of cryptocurrency revenue (GAAP): Electricity/Direct costs* 611 3,712 884 0 5,207 Overhead costs 563 1,280 1,020 0 2,863 Total cost of cryptocurrency revenue (GAAP) $1,174 $4,992 $1,904 $0 $8,070 Depreciation 314 1,096 713 0 2,123 Project Equipment Repairs 23 0 0 0 23 Adjusted Non-GAAP Cost of Revenue 1** $837 $3,896 $1,191 $0 $5,924 less Legacy Hosting Cost of Revenue 0 1,360 0 0 1,360 less Prepaid Lease Cost 0 307 0 0 307 Adjusted Non-GAAP Cost of Revenue 2** $837 $2,229 $1,191 $0 $4,258 *Includes Hosting costs **Excluding Depreciation and R&D Expenses 47

Reconciliation Of Non-GAAP Results Reconciliation from Revenue and Cost of Revenue to Contribution Margin & Cash Contribution Margin (Non-GAAP) FY 2021 ($ in 000s) (Unaudited) Soluna Computing Edith Marie Sophie Corporate Total Cryptocurrency revenue (GAAP) $3,648 $7,925 $2,772 $0 $14,345 Cost of cryptocurrency revenue (GAAP) 1,174 4,992 1,904 0 8,070 Depreciation 314 1,096 713 0 2,123 Project Equipment Repairs 23 0 0 0 23 Contribution Margin (Non-GAAP)* $2,810 $4,030 $1,581 $0 $8,421 plus Prepaid Lease Cost 0 307 0 0 307 plus Legacy Hosting Contribution Margin 0 25 0 0 25 Cash Contribution Margin (Non-GAAP)* $2,810 $4,361 $1,581 $0 $8,752 plus Tornado Impact (Management Estimate) 0 34 102 0 135 Cash Contribution Margin (Non-GAAP) excluding $2,810 $4,394 $1,682 $0 $8,887 Tornado & Shutdown* *Excludes R&D Expenses, SG&A Expenses 48

Reconciliation Of Non-GAAP Results Reconciliation from GAAP Revenue to Non-GAAP Revenue Q4 2021 ($ in 000s) (Unaudited) Soluna Computing Edith Marie Sophie Corporate Total Cryptocurrency revenue (GAAP) $864 $4,933 $2,772 $0 $8,569 less Legacy Hosting Revenue 0 579 0 0 579 Revenue (Non-GAAP) $864 $4,354 $2,772 $0 $7,990 49

Reconciliation Of Non-GAAP Results Reconciliation from Cost of Cryptocurrency Revenue to Adjusted Cost of Revenue (Non-GAAP) Q4 2021 ($ in 000s) (Unaudited) Soluna Computing Edith Marie Sophie Corporate Total Cryptocurrency revenue (GAAP) $864 $4,933 $2,772 $0 $8,569 Cost of cryptocurrency revenue (GAAP): Electricity/Direct costs* 143 2,136 884 0 3,164 Overhead costs 156 1,138 997 0 2,291 Total cost of cryptocurrency revenue (GAAP) $299 $3,274 $1,881 $0 $5,455 Depreciation 91 938 713 0 1,742 Project Equipment Repairs 0 0 0 0 0 Adjusted Non-GAAP Cost of Revenue 1** $208 $2,336 $1,169 $0 $3,712 less Legacy Hosting Cost of Revenue 0 590 0 0 590 less Prepaid Lease Cost 0 177 0 0 177 Adjusted Non-GAAP Cost of Revenue 2** $208 $1,569 $1,169 $0 $2,946 *Includes Hosting costs **Excluding Depreciation and R&D Expenses 50

Reconciliation Of Non-GAAP Results Reconciliation from Revenue and Cost of Revenue to Contribution Margin & Cash Contribution Margin (Non-GAAP) Q4 2021 ($ in 000s) (Unaudited) Soluna Computing Edith Marie Sophie Corporate Total Cryptocurrency revenue (GAAP) $864 $4,933 $2,772 $0 $8,569 Cost of cryptocurrency revenue (GAAP) 299 3,274 1,881 0 5,455 Depreciation 91 938 713 0 1,742 Project Equipment Repairs 0 0 0 0 0 Contribution Margin (Non-GAAP)* $656 $2,597 $1,604 $0 $4,856 plus Prepaid Lease Cost 0 177 0 0 177 plus Legacy Hosting Contribution Margin 0 11 0 0 11 Cash Contribution Margin (Non-GAAP)* $656 $2,785 $1,604 $0 $5,044 plus Tornado Impact (Management Estimate) 0 34 102 0 135 Cash Contribution Margin (Non-GAAP) excluding $656 $2,818 $1,705 $0 $5,179 Tornado* *Excludes R&D Expenses, SG&A Expenses 51
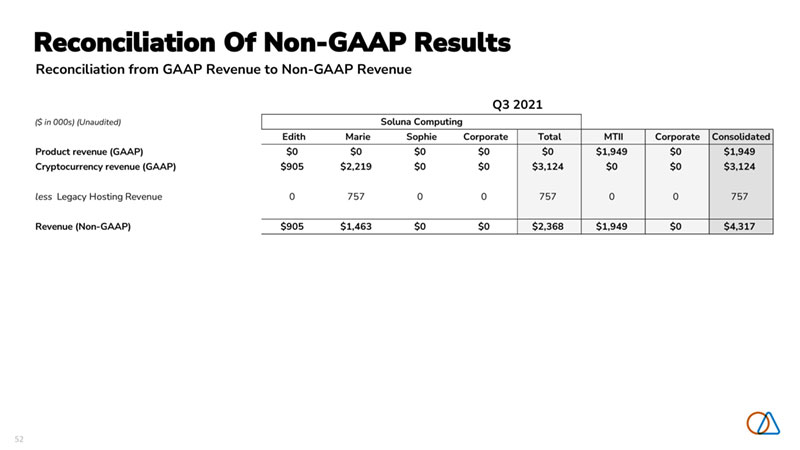
Reconciliation Of Non-GAAP Results Reconciliation from GAAP Revenue to Non-GAAP Revenue Q3 2021 ($ in 000s) (Unaudited) Soluna Computing Edith Marie Sophie Corporate Total MTII Corporate Consolidated Product revenue (GAAP) $0 $0 $0 $0 $0 $1,949 $0 $1,949 Cryptocurrency revenue (GAAP) $905 $2,219 $0 $0 $3,124 $0 $0 $3,124 less Legacy Hosting Revenue 0 757 0 0 757 0 0 757 Revenue (Non-GAAP) $905 $1,463 $0 $0 $2,368 $1,949 $0 $4,317 52

Reconciliation Of Non-GAAP Results Reconciliation from Cost of Cryptocurrency Revenue to Adjusted Cost of Revenue (Non-GAAP) Q3 2021 ($ in 000s) (Unaudited) Soluna Computing Edith Marie Sophie Corporate Total MTII Corporate Consolidated Product revenue (GAAP) $0 $0 $0 $0 $0 $1,949 $0 $1,949 Cryptocurrency revenue (GAAP) $905 $2,219 $0 $0 $3,124 $0 $0 $3,124 Cost of product revenue (GAAP) 0 0 0 0 0 661 0 661 Cost of cryptocurrency revenue (GAAP): Electricity/Direct costs* 140 1,288 0 0 1,428 0 0 1,428 Overhead costs 166 134 15 0 315 0 0 315 Total cost of cryptocurrency revenue (GAAP) $306 $1,422 $15 $0 $1,743 $0 $0 $1,743 Cost of revenue (GAAP) $306 $1,422 $15 $0 $1,743 $661 $0 $2,404 Depreciation 81 75 0 0 156 19 0 175 Project Equipment Repairs 23 0 0 0 23 0 0 23 Adjusted Non-GAAP Cost of Revenue 1** $203 $1,347 $15 $0 $1,564 $642 $0 $2,206 less Legacy Hosting Cost of Revenue 0 770 0 0 770 0 0 770 less Prepaid Lease Cost 0 130 0 0 130 0 0 130 Adjusted Non-GAAP Cost of Revenue 2** $203 $446 $15 $0 $664 $642 $0 $1,306 *Includes Hosting costs **Excluding Depreciation and R&D Expenses 53

Reconciliation Of Non-GAAP Results Reconciliation from Revenue and Cost of Revenue to Contribution Margin & Cash Contribution Margin (Non-GAAP) Q3 2021 ($ in 000s) (Unaudited) Soluna Computing Edith Marie Sophie Corporate Total MTII Corporate Consolidated Product revenue (GAAP) $0 $0 $0 $0 $0 $1,949 $0 $1,949 Cryptocurrency revenue (GAAP) $905 $2,219 $0 $0 $3,124 $0 $0 $3,124 Cost of product revenue (GAAP) 0 0 0 0 0 661 0 661 Cost of cryptocurrency revenue (GAAP) 306 1,422 15 0 1,743 0 0 1,743 Cost of revenue (GAAP) $306 $1,422 $15 $0 $1,743 $661 $0 $2,404 Depreciation 81 75 0 0 156 19 0 175 Project Equipment Repairs 23 0 0 0 23 0 0 23 Contribution Margin (Non-GAAP)* $702 $873 ($15) $0 $1,560 $1,307 $0 $2,867 plus Prepaid Lease Cost 0 130 0 0 130 0 0 130 plus Legacy Hosting Contribution Margin 0 13 0 0 13 0 0 13 Cash Contribution Margin (Non-GAAP)* $702 $1,016 ($15) $0 $1,703 $1,307 $0 $3,010 54

Reconciliation Of Non-GAAP Results Reconciliation from Cost of Cryptocurrency Revenue to Adjusted Cost of Revenue (Non-GAAP) Q2 2021 ($ in 000s) (Unaudited) Soluna Computing Edith Marie Sophie Corporate Total MTII Corporate Consolidated Product revenue (GAAP) $0 $0 $0 $0 $0 $1,647 $0 $1,647 Cryptocurrency revenue (GAAP) $988 $669 $0 $0 $1,657 $0 $0 $1,657 Cost of product revenue (GAAP) 0 0 0 0 0 502 0 502 Cost of cryptocurrency revenue (GAAP): Electricity/Direct costs* 208 265 0 0 472 0 0 472 Overhead costs 71 0 1 0 73 0 0 73 Total cost of cryptocurrency revenue (GAAP) $279 $264 $1 $0 $545 $0 $0 $545 Cost of revenue (GAAP) $279 $264 $1 $0 $545 $502 $0 $1,047 Depreciation 74 74 0 0 149 17 0 166 Adjusted Non-GAAP Cost of Revenue 1** $204 $190 $1 $0 $396 $485 $0 $881 *Includes Hosting costs **Excluding Depreciation and R&D Expenses 55

Reconciliation Of Non-GAAP Results Reconciliation from Revenue and Cost of Revenue to Contribution Margin (Non-GAAP) Q2 2021 ($ in 000s) (Unaudited) Soluna Computing Edith Marie Sophie Corporate Total MTII Corporate Consolidated Product revenue (GAAP) $0 $0 $0 $0 $0 $1,647 $0 $1,647 Cryptocurrency revenue (GAAP) $988 $669 $0 $0 $1,657 $0 $0 $1,657 Cost of product revenue (GAAP) 0 0 0 0 0 502 0 502 Cost of cryptocurrency revenue (GAAP) 279 264 1 0 545 0 0 545 Cost of revenue (GAAP) $279 $264 $1 $0 $545 $502 $0 $1,047 Depreciation 74 74 0 0 149 17 0 166 Contribution Margin (Non-GAAP)* $784 $478 ($1) $0 $1,261 $1,162 $0 $2,423 *Excludes R&D Expenses, SG&A Expenses 56

Reconciliation Of Non-GAAP Results Reconciliation from Cost of Cryptocurrency Revenue to Adjusted Cost of Revenue (Non-GAAP) Q1 2021 ($ in 000s) (Unaudited) Soluna Computing Edith Marie Sophie Corporate Total MTII Corporate Consolidated Product revenue (GAAP) $0 $0 $0 $0 $0 $1,337 $0 $1,337 Cryptocurrency revenue (GAAP) $891 $104 $0 $0 $995 $0 $0 $995 Cost of product revenue (GAAP) 0 0 0 0 0 452 0 452 Cost of cryptocurrency revenue (GAAP): Electricity/Direct costs* 120 23 0 0 143 0 0 143 Overhead costs 170 9 6 0 185 0 0 185 Total cost of cryptocurrency revenue (GAAP) $290 $31 $7 $0 $328 $0 $0 $328 Cost of revenue (GAAP) $290 $31 $7 $0 $328 $452 $0 $780 Depreciation 68 8 0 0 76 17 0 93 Adjusted Non-GAAP Cost of Revenue 1** $222 $23 $7 $0 $251 $435 $0 $687 *Includes Hosting costs **Excluding Depreciation and R&D Expenses 57

Reconciliation Of Non-GAAP Results Reconciliation from Revenue and Cost of Revenue to Contribution Margin (Non-GAAP) Q1 2021 ($ in 000s) (Unaudited) Soluna Computing Edith Marie Sophie Corporate Total MTII Corporate Consolidated Product revenue (GAAP) $0 $0 $0 $0 $0 $1,337 $0 $1,337 Cryptocurrency revenue (GAAP) $891 $104 $0 $0 $995 $0 $0 $995 Cost of product revenue (GAAP) 0 0 0 0 0 452 0 452 Cost of cryptocurrency revenue (GAAP) 290 31 7 0 328 0 0 328 Cost of revenue (GAAP) $290 $31 $7 $0 $328 $452 $0 $780 Depreciation 68 8 0 0 76 17 0 93 Contribution Margin (Non-GAAP)* $669 $81 ($7) $0 $744 $902 $0 $1,645 *Excludes R&D Expenses, SG&A Expenses 58

The future of renewable energy is computing. 59

Learn more at solunacomputing.com
Serious News for Serious Traders! Try StreetInsider.com Premium Free!
You May Also Be Interested In
- Soluna to Participate in Water Tower Research Fireside Chat Series
- Pierre & Vacances-Center Parcs Group: First Half 2023/2024 Revenue
- Global Energy as a Service Market Expected to Reach USD 142.23 Billion by 2031
Create E-mail Alert Related Categories
SEC FilingsSign up for StreetInsider Free!
Receive full access to all new and archived articles, unlimited portfolio tracking, e-mail alerts, custom newswires and RSS feeds - and more!
