

Form 8-K Soluna Holdings, Inc For: Aug 19
 Tweet
Tweet Share
Share
UNITED STATES
SECURITIES AND EXCHANGE COMMISSION
WASHINGTON, D.C. 20549
FORM
CURRENT REPORT
Pursuant to Section 13 OR 15(d) of The Securities Exchange Act of 1934
Date of Report (Date of earliest event reported)
(Exact name of registrant as specified in its charter)
| (State or other jurisdiction of incorporation) |
(Commission File Number) |
(IRS Employer Identification No.) |
|
|
||
| (Address of principal executive offices) | (Zip Code) |
Registrant’s telephone number, including
area code:
Check the appropriate box below if the Form 8-K filing is intended to simultaneously satisfy the filing obligation of the registrant under any of the following provisions (see General Instruction A.2. below):
| Written communications pursuant to Rule 425 under the Securities Act (17 CFR 230.425) |
| Soliciting material pursuant to Rule 14a-12 under the Exchange Act (17 CFR 240.14a-12) |
| Pre-commencement communications pursuant to Rule 14d-2(b) under the Exchange Act (17 CFR 240.14d-2(b)) |
| Pre-commencement communications pursuant to Rule 13e-4(c) under the Exchange Act (17 CFR 240.13e-4(c)) |
Securities registered pursuant to Section 12(b) of the Act:
| Title of each class | Trading Symbol(s) | Name of each exchange on which registered | ||
share |
||||
Preferred Stock, par value $0.001 per share |
Indicate by check mark whether the registrant is an emerging growth company as defined in Rule 405 of the Securities Act of 1933 (§230.405 of this chapter) or Rule 12b-2 of the Securities Exchange Act of 1934 (§240.12b-2 of this chapter).
Emerging
growth company
If an emerging growth company, indicate by check mark if the registrant has elected not to use the extended transition period for complying with any new or revised financial accounting standards provided pursuant to Section 13(a) of the Exchange Act. ☐
Item 2.02 Results of Operations and Financial Condition
On August 18, 2022, Soluna Holdings, Inc. (the “Company”), issued a press release announcing its financial and business highlights for the month ended July 31, 2022 and Soluna Computing, Inc. (“SCI”) July site level financials. The press release and presentation are furnished as Exhibits 99.1 and 99.2, respectively, to this Current Report on Form 8-K (this “Form 8-K”) and is incorporated by reference herein.
Item 7.01 Regulation FD Disclosure
Reference is made to the disclosure in Item 2.02 of this Form 8-K, which disclosure is incorporated herein by reference.
The information contained in this Form 8-K provided under Item 7.01 and Exhibits 99.1 and 99.2attached hereto are furnished to, but shall not be deemed filed with, the Securities and Exchange Commission (the “SEC”) or incorporated by reference into the Company’s filings under the Securities Act of 1933, as amended, or the Securities Exchange Act of 1934, as amended.
Forward-Looking Statements
This Form 8-K and Exhibits 99.1 and 99.2 contain forward-looking statements. Forward-looking statements include, but are not limited to, statements that express the Company’s intentions, beliefs, expectations, strategies, predictions or any other statements related to the Company’s future activities, or future events or conditions. These statements are based on current expectations, estimates and projections about the Company’s business based, in part, on assumptions made by its management. These statements are not guarantees of future performances and involve risks, uncertainties and assumptions that are difficult to predict. Therefore, actual outcomes and results may differ materially from what is expressed or forecasted in the forward-looking statements due to numerous factors, including those risks that may be included in documents that the Company files from time to time with the SEC. Any forward-looking statements speak only as of the date on which they are made, and the Company undertakes no obligation to update any forward-looking statement to reflect events or circumstances after the date of this Form 8-K, except as required by law.
Item 9.01 Financial Statements and Exhibits.
(d) Exhibits.
| 99.1 | Press release dated August 18, 2022 |
| 99.2 | Soluna Holdings, Inc. July 31, 2022 Monthly Flash Report |
2
SIGNATURES
Pursuant to the requirements of the Securities Exchange Act of 1934, the registrant has duly caused this report to be signed on its behalf by the undersigned hereunto duly authorized.
| Date: August 19, 2022 | SOLUNA HOLDINGS, INC. | ||
| By: | /s/ Michael Toporek | ||
|
Name: Michael Toporek Title: Chief Executive Officer |
|||
Exhibit 99.1

Soluna Holdings Announces July Site Level Financials
Despite Continued Low BTC Price Environment, Soluna Continues to Grow Hashrate and Intends to Invest through the Cycle
ALBANY, NY, August 18, 2022 - Soluna Holdings, Inc. (“SHI” or the “Company”), (NASDAQ: SLNH), the parent company of Soluna Computing, Inc. (“SCI”), a developer of green data centers for cryptocurrency mining and other intensive computing, today announced the release of its July site level financials.
Michael Toporek, CEO of Soluna Holdings, stated, “Despite Bitcoin remaining around $20,000 and challenging power markets, Soluna has been able to maintain healthy margins and increase computing power. As a result of the increase in activity from renewable energy generators seeking computing as the most effective solution to their curtailment problems, we continue to believe investing through the cycle is the best opportunity to deliver value to shareholders.”
Key Summary Highlights:
| ● | Increased BTC Production Despite Volatile Market |
| ○ | BTC Equivalent Mined increased by 12% despite average BTC prices decreasing by 12% from June to July. |
| ○ | Average Hashrate deployed increased by 9% with peak hashrate remaining above 1EH/s. |
| ● | Cash Contribution Margins Remain Healthy |
| ○ | 27% Cash contribution prop mining margins slightly offset by weaker hosting margins |
| ○ | 19% Consolidated cash contribution margins overall if hosting is included despite low BTC environment |
| ○ | Margins impacted by exceptional events leading to fuel cost increases at Sophie and Marie |
| ● | 10MW Hosting Agreement at Marie Expires End of September |
| ○ | Assessing economics of renewal or conversion to prop mining |
| ○ | Anticipated hosting margins with new contract expected to increase |
Revenue & Contribution Margin Summary:
*all numbers below exclude legacy hosting
**July Cash Contribution Margins Normalized to June FCA costs - See pg. 22 of presentation for details
**Excluding FCA cost adjustment July Cash Contribution Margin was $433
| ($ in 000s, Unaudited) | (Estimate) | ||||||
| FY 21 | Q1 2022 | April 2022 | May 2022 | June 2022 | Q2 2022 | July 2022 | |
| Revenue | $13,010 | $9,264 | $3,392 | $3,004 | $2,280 | $8,676 | $2,254 |
| Cash Contribution Margin | $8,888 | $5,206 | $2,605 | $1,600 | $800 | $5,005 | $756** |
| Annualized Revenue | $13,010 | $37,056 | $40,705 | $36,044 | $27,362 | $34,704 | $27,043 |
| Annualized Contribution Margin | $8,888 | $20,824 | $31,262 | $19,196 | $9,599 | $20,019 | $9,076 |
A presentation and corresponding video is available on the Company’s website at:
https://www.solunacomputing.com/investors/updates/july2022flash/
About Soluna Holdings, Inc (SLNH)
Soluna Holdings, Inc. is the leading developer of green data centers that convert excess renewable energy into global computing resources. Soluna builds modular, scalable data centers for computing intensive, batchable applications such as cryptocurrency mining, AI and machine learning. Soluna provides a cost-effective alternative to battery storage or transmission lines. Soluna uses technology and intentional design to solve complex, real-world challenges. Up to 30% of the power of renewable energy projects can go to waste. Soluna’s data centers enable clean electricity asset owners to ‘Sell. Every. Megawatt.’
For more information about Soluna, please visit www.solunacomputing.com or follow us on LinkedIn at linkedin.com/solunaholdings and Twitter @SolunaHoldings.
Contact Information
Sam Sova
VP, Marketing
Soluna Computing
+414 699 3667
MZ Contact
Brian M. Prenoveau, CFA
MZ Group – MZ North America
+561 489 5315
Exhibit 99.2

1 HOLDINGS COMPUTING July 2022 Flash August 2022

2 Preamble completely qualified by the legal disclosureson the several pages following this one share with you some of our strategic thinking and financial analysis we are using to guide the growth of our business accountable and transparent with shareholders hyper dynamic economic environment. That’s a fancy way of saying things change quickly. What we are telling you here is based on our estimates and assumptions which are our best guess. We reserve the right to revise our point of view based on new information and changes in the business environment investment decisions. This presentation lays some of that out for your review

3 Legal Disclosure & Disclaimer This presentation includes forward-looking statements within the meaning of the Private Securities Litigation Reform Act that reflect our current views with respect to, among other things, our operations, business strategy, interpretation of prior development activities, plans to develop and commercialize our products and services, potential market opportunity, financial performance and needs for additional financing. We have used words like “anticipate,” “believe,” “could,” “estimate,” “expect,” “future,” “intend,” “may,” “plan,” “potential,” “project,” “will,” and similar terms and phrases to identify forward-looking statements in this presentation. The forward-looking statements contained in this presentation are based on management’s current expectations and are subject to substantial risks, uncertainty and changes in circumstances. Actual results may differ materially from those expressed by these expectations due to risks and uncertainties, including, among others, those related to our ability to obtain additional capital on favorable terms to us, or at all, the success, timing and cost of ongoing or future operations, the lengthy and unpredictable nature of the project development, and technology process and businesses in which we currently engage or may engage. These risks and uncertainties include, but may not be limited to, those described in our filings with the SEC. Forward-looking statements speak only as of the date of this presentation, and we undertake no obligation to review or update any forward-looking statement except as may be required by applicable law.

4 Legal Disclosure & Disclaimer The material in this presentation has been prepared by Soluna and is general background information about Soluna’s activities, current as at the date of this presentation and is provided for information purposes only. It should be read in conjunction with Soluna’s periodic and continuous disclosure announcements filed with the Securities and Exchange Commission. This presentation provides information in summary form only andis not intended to be complete. Soluna makes no representation or warranty, express or implied, as to the accuracy, completeness, fairness or reliability of any of the information, illustrations, examples, opinions, forecasts, reports, estimates and conclusions contained in this presentation. It is not intended to be relied upon as advice or a recommendation to investors or potential investors and does not take into accountthe investment objectives, financial situation, taxation situation or needs of any particular investor. Due care and consideration should be undertaken when considering and analyzing Soluna’s future performance and business prospects. THIS PRESENTATION IS NOT INTENDED TO SERVE AS A FORECAST OF ANY SUCH FUTURE PERFORMANCE OR PROSPECTS. An investor must not act on any matter contained in this document but must make its ownassessment of Soluna and conduct its own investigations and analysis. Investors should assess their own individual financial circumstances and consider talking to a financial adviser, professional adviser or consultant before making any investment decision. This documentdoes not constitute an offer, invitation, solicitation or recommendation with respect to the purchase or sale of any security in Soluna nor does it constitute financial product advice. This document is not a prospectus, product disclosure statement or other offer document under United States federal or state securities law or under any other law. This document has not been filed, registered or approved by regulatory authorities in anyjurisdiction. Any projection, forecast, estimate or other “forward-looking” statement in this presentation only illustrates hypothetical performance under specified assumptions of events or conditions that have been clearly delineated herein. Such projections, forecasts, estimates or other”forward-looking” statements are not reliable indicators of future performance. Hypothetical or illustrative performance information contained in these materials may not be relied upon as a promise, prediction or projection of future performance and are subject to significant assumptions and limitations. In addition, not all relevant events or conditions may have been considered in developing such assumptions. READERS OF THIS DOCUMENT SHOULD UNDERSTAND THE ASSUMPTIONS AND EVALUATE WHETHER THEY ARE APPROPRIATE FOR THEIR PURPOSES. SOME EVENTS OR CONDITIONS MAY NOT HAVE BEEN CONSIDERED IN SUCH ASSUMPTIONS. ACTUAL EVENTS OR CONDITIONS WILL VARY AND MAY DIFFER MATERIALLY FROM SUCH ASSUMPTIONS. READERS SHOULD UNDERSTAND SUCH ASSUMPTIONS AND EVALUATE WHETHER THEY ARE APPROPRIATE FOR THEIR PURPOSES. This presentation may include figures related to past performance or simulated past performance as well as forecasted or simulated future performance. Soluna disclaims any obligation to update their views of such risks and uncertainties or to publicly announce the results of any revision to the forward-looking statements made herein.

5 Legal Disclosure & Disclaimer Use of Projections and Illustrations This presentation contains certain financial forecasts and illustrations. Neither Soluna’s [nor Soluna Holdings] independent auditors have studied, reviewed, compiled or performed any procedures with respect to the projections for the purpose of their inclusion in this presentation. The material in this presentation is for illustrative purposes only and should not be relied upon as being necessarily indicative of future results. To supplement our consolidated financial statements, which are prepared and presented in accordance with GAAP, we use the following non-GAAP financial measures: non-gaap revenue, cash contribution margin, cash contribution margin excluding tornado, cash contribution margin excl. tornado & shutdown, adjusted cost of cryptocurrency revenue and adjusted EBITDA contribution. The presentation of this financial information is not intended to be considered in isolation oras a substitute for, or superior to, the financial information prepared and presented in accordance with GAAP. Use of Estimates in Monthly Presentations Numbers presented BEFORE the release of Form 10-Q for third quarter ended September 30th, 2022, are monthly estimates and subject to change upon final accounting adjustments and entries. These monthly estimates are presented as an illustration of management’s review of key metrics that help in understanding the performance of the Company. Readers are strongly encouraged to review this presentation in connection with the Company’s Quarterly Report on Form 10-Q for the period ended June 30, 2022and the Company’s Annual Report on Form 10-K for the year ended December 31, 2021.

6 Key Operating Principles (1) Calculated as a percent of total undiluted shares 0 Alignment of Interests & Transparency Private equity firm owns 3Q%11l High Velocity Execution Senior Brool<stone personnel involved in active executive capacity Focus on Return of Invested Capital (ROIC) & Capital Discipline Long-Term Strategy Beyond Crypto

Batch-oriented Computing like cryptocurrency mining Excess energy from renewable sources We buy curtailedenergy from renewable power plants and convert it to clean, low-cost global computing. 7

8 The opportunity beyond crypto is Batchable Computing Digital currencies $10B Pharma research $5B Graphics/video processing $40B Scientific research $40B

9 Agenda Business Update In this presentation, we will be covering the following items: Flash July 2022 Results

10 Business Update

11 Engineered to thrive in a BTC downturn Right company Right plan for volatile environment
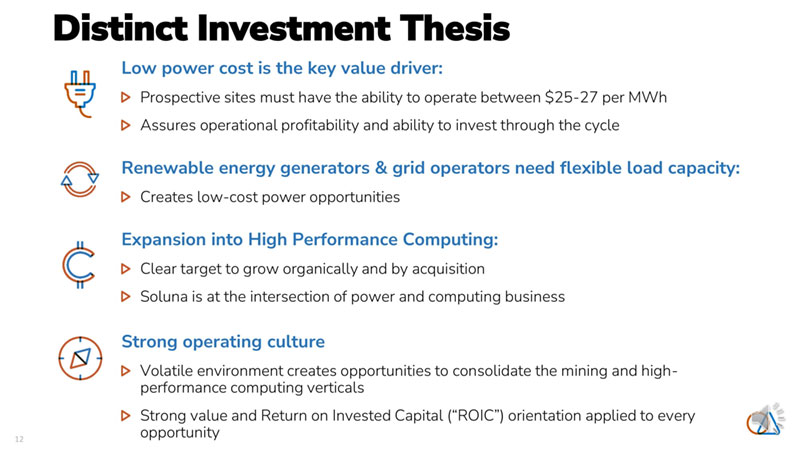
12 Low power cost is the key value driver: -27 per MWh Renewable energy generators & grid operators need flexible load capacity: -cost power opportunities Expansion into High Performance Computing: Strong operating culture -performance computing verticals opportunity Distinct Investment Thesis
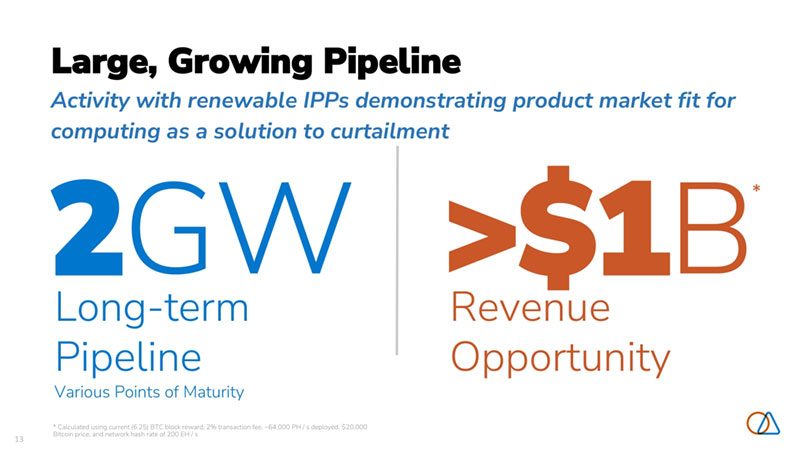
13 Long-term Pipeline 2GW Revenue Opportunity >$1B Large, Growing Pipeline * Calculated using current (6.25) BTC block reward, 2% transaction fee, ~64,000 PH / s deployed, $20,000 Bitcoin price, and network hash rate of 200 EH / s * Activity with renewable IPPs demonstrating product market fit for computing as a solution to curtailment Various Points of Maturity

14 Nowis The Time to Invest Important to Invest THROUGHthe Cycle computing equipment down 70 –80%since January payback period < 1 year 100+ MW at less than $30 / MWh Sourcing Non-Dilutive Capital to Fund Growth -term pipeline of opportunities near 2 GW monetize intellectual property

15 Q2 results demonstrated significant YoY growth Result of investment across Sophie and Marie BTC equivalent+7.5x Avg. hashrate+38.8x Revenue+5.2x Avg. BTC $42kin March $24kin June 3.9% sequential decrease in Cash Contribution Margin Update on the Quarter
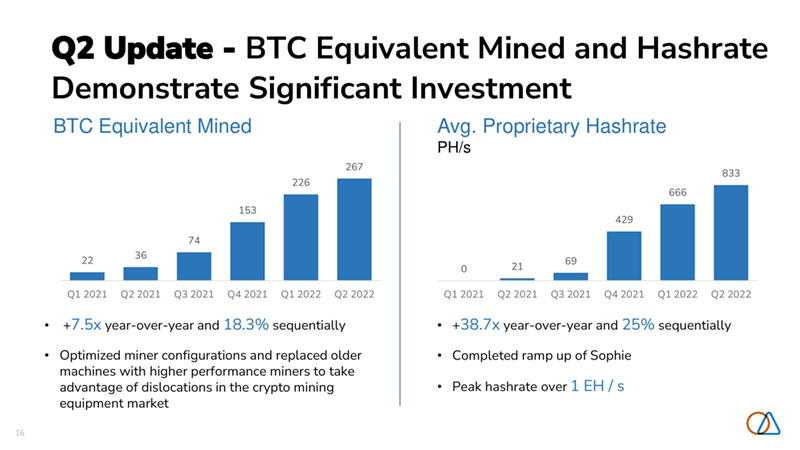
16 Q2 Update -BTC Equivalent Mined and Hashrate Demonstrate Significant Investment +7.5xyear-over-year and 18.3%sequentially Optimized miner configurations and replaced older machines with higher performance miners to take advantage of dislocations in the crypto mining equipment market BTC Equivalent Mined +38.7xyear-over-yearand25%sequentially CompletedrampupofSophie Peakhashrateover1EH/s Avg. Proprietary Hashrate PH/s 22 36 74 153 226 267 Q1 2021 Q2 2021 Q3 2021 Q4 2021 Q1 2022 Q2 2022 0 21 69 429 666 833 Q1 2021 Q2 2021 Q3 2021 Q4 2021 Q1 2022 Q2 2022

17 Q2 Update –Revenue Resilient Despite Challenged Markets Consolidated Revenue ($ in ‘000s) Rapid growth demonstrates Soluna’s ability to scale Second quarter revenue increased 5.2xyear-over-year Revenue only decreased 6.3%sequentially despite average BTC prices over the quarter decreasing 21.3% Increased seasonal curtailment and outages at Marie accounted for ~$0.6mm in the revenue lost in Q2 995 1,657 2,368 7,990 9,264 8,676 Q1 2021 Q2 2021 Q3 2021 Q4 2021 Q1 2022 Q2 2022
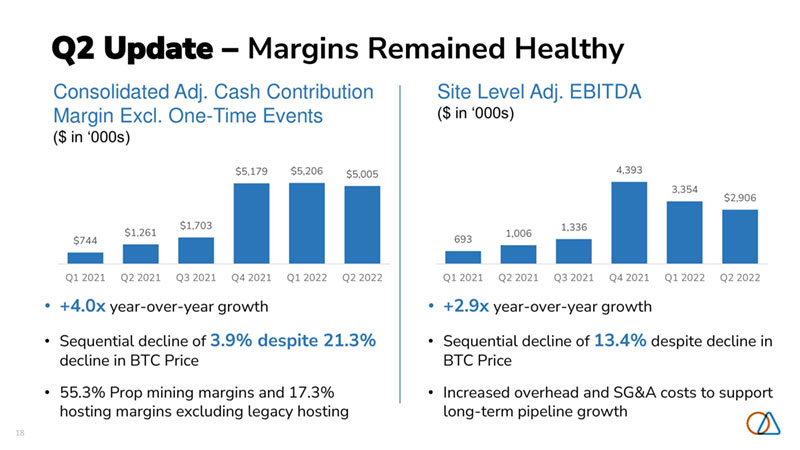
18 Q2 Update –Margins Remained Healthy +4.0xyear-over-year growth Sequential decline of 3.9% despite 21.3%decline in BTC Price 55.3% Prop mining margins and 17.3% hosting margins excluding legacy hosting Consolidated Adj. Cash Contribution Margin Excl. One-Time Events ($ in ‘000s) Site Level Adj. EBITDA ($ in ‘000s) +2.9xyear-over-year growth Sequential decline of 13.4%despite decline in BTC Price Increased overhead and SG&A costs to support long-term pipeline growth 693 1,006 1,336 4,393 3,354 $2,906 Q1 2021 Q2 2021 Q3 2021 Q4 2021 Q1 2022 Q2 2022 $744 $1,261 $1,703 $5,179 $5,206 $5,005 Q1 2021 Q2 2021 Q3 2021 Q4 2021 Q1 2022 Q2 2022

19 Challenging Markets in June and July Average price of Bitcoin declined 32%from May to July BTC mined equivalentincreased 10.4%over same period while average hashrateincreased 5.2% Revenue decreased 25.0% Performance suggests Solunagained share in network hashrate Significant seasonal increasesin power costs Consolidated power costs increased 26.9%in July Unprecedented seasonal impact exacerbated by other extraordinary events Costs should begin reducing in September
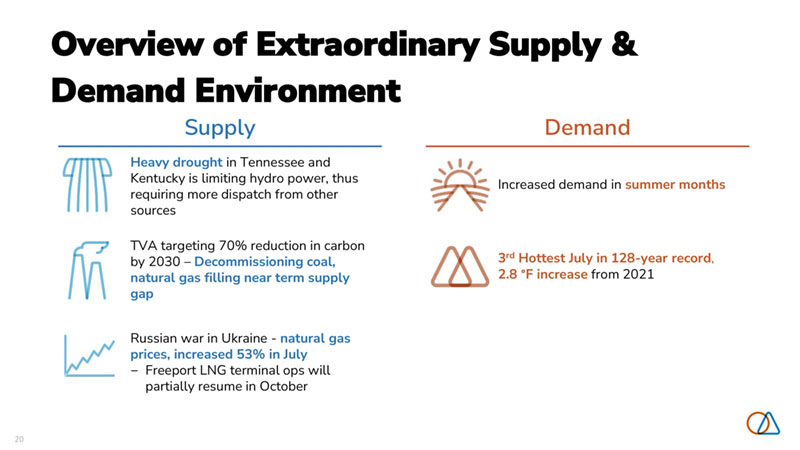
20 Overview of Extraordinary Supply & Demand Environment Supply Demand Heavy droughtin Tennessee and Kentucky is limiting hydro power, thus requiring more dispatch from other sources TVA targeting 70% reduction in carbon by 2030 –Decommissioning coal, natural gas filling near term supply gap Russian war in Ukraine -natural gas prices, increased 53% in July Freeport LNG terminal ops will partially resume in October Increased demand in summer months 3rdHottest July in 128-year record, 2.8 °F increasefrom 2021

21 Exceptional EventsLed to Fuel Cost Increases Sophie Marie Edith ELECTRICITY & DIRECT COST INCREASE FROM JUNE to JULY 41% 21% (2%) variations significant increase in the utility’s fuel cost adjustment (“FCA”) has averaged 1.5 cents -2.0 cents per kWh for the last seven years; the FCA in July was 3.8 cents—an unprecedented level* prices will be less dependent on fuel costs August costs will increasebut costs should begin reducing in September * Huntsville utilities

22 July Revenue $2,254 (-) June Electricity / Direct Costs (1,197) (-) July Overhead Costs (300) July Cash Contribution Margins Normalized to June FCA $756 Implied % Margin 34% Implied Impact $323 Reference: July Avg. MW Deployed 35.8 June Avg. MW Deployed 34.2 September Declines Anticipated utility community that costs should decline in September pricingwill remain elevated at these unprecedented levels understand that the September FCA is expected to decline to closer to June pricing return to June levels, the reduction would reflect a monthly ~$300k+ improvementto July’s expenses Illustrative Normalized Cash Contribution Margin * July Cash ContributionMargin was $433k. Implied impact derived by subtracting $433k from July Cash Contribution Margin Normalized to June FCA of $756k. *

23 Facility Results Review

24 July Business Summary Flat BTC Production Despite Volatile Market oBTC equivalent mined increased 12% despite average BTC prices decreasing by 12% from June to July oAverage hashrate deployed was increased by 5%with peak hashrate remaining above 1 EH/s Cash Contribution Margins Remain Healthy o19% Consolidated cash contribution margins despite low BTC environment27% cash contribution prop miningmargins slightly offset by weaker hosting margins 10MW Hosting Agreement at Marie Expires End of September oAssessing economics of renewal or conversion to prop mining oAnticipated hosting margins with new contract expected to increase

25 Path to 2.5 EH/s Scale Energizing Q4 2022 198 277 255 252 257 235 215 288 265 263 281 281 281 126 312 364 439 452 519 608 604 681 722 722 1,522 800 800 125 316 403 567 616 696 714 733 897 869 944 1,003 1,803 2,603 Sep 2021 Oct 2021 Nov 2021 Dec 2021 Jan 2022 Feb 2022 Mar 2022 Apr 2022 May 2022 Jun 2022 Jul 2022 Aug 6, 2022 Dorothy 1a Dorothy 1b Consolidated Hashrate (SHA-256, PH/s) Hosted JV Prop Mining Subject to Project Finance Process + Ercot

26 Sophie 23%to 439.8 PH/s versus June PH/S of 357.62oRamp up of installed machines continues (Non-GAAP)in July was $366thousand versus $560 thousand in JuneoThe decrease in margin was largely due to a decrease in BTC prices inlow BTC price environment Note: May-Jul 2022 Hashrate is average of the month. * Daily average hashrate. 15% (31 days) (30 days) (31 days) 11% * 9%
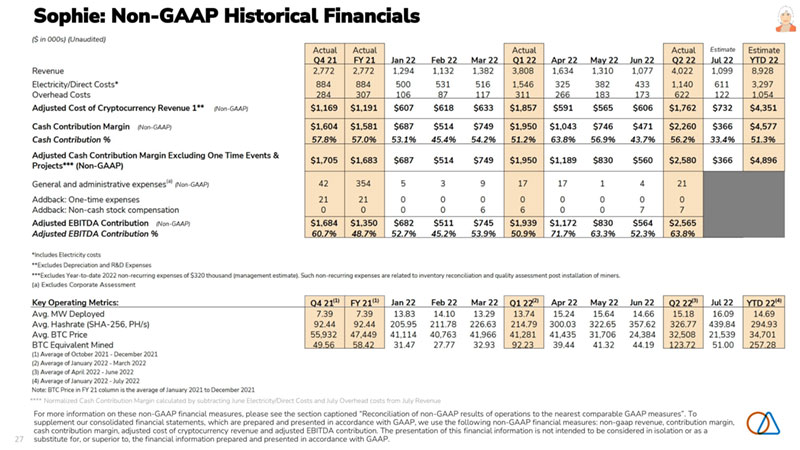
27 Sophie: Non-GAAP Historical Financials For more information on these non-GAAP financial measures, please see the section captioned “Reconciliation of non-GAAP results of operations to the nearest comparable GAAP measures”. To supplement our consolidated financial statements, which are prepared and presented in accordance with GAAP, we use the followingnon-GAAP financial measures: non-gaap revenue, contribution margin, cash contribution margin, adjusted cost of cryptocurrency revenue and adjusted EBITDA contribution. The presentation of this financial information is not intended to be considered in isolation or as a substitute for, or superior to, the financial information prepared and presented in accordance with GAAP. **** Normalized Cash Contribution Margin calculated by subtracting June Electricity/Direct Costs and July Overhead costs fromJuly Revenue
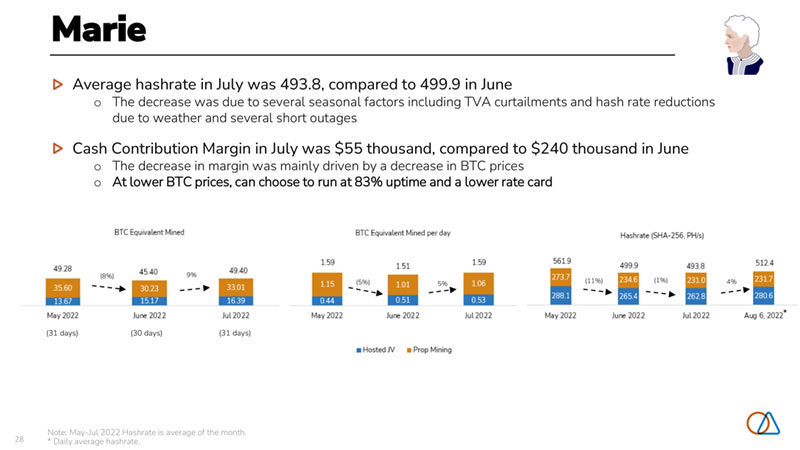
28 Marie oThe decrease was due to several seasonal factors including TVA curtailments and hash rate reductions due to weather and several short outages oThe decrease in margin was mainly driven by a decrease in BTC prices oAt lower BTC prices, can choose to run at 83% uptime and a lower rate card (31 days) (30 days) (31 days) (8%) (5%) 4% * 9% 5% (11%) (1%) Note: May-Jul 2022 Hashrate is average of the month. * Daily average hashrate.

29 Marie: Non-GAAP Historical Financials(A) ($in OOOs} (Unaudited} Revenue tNon-GAAPJ Prop Mining Hosting Electricity/Direct Cost s* Prop Mining Hosting Overhead Costs Prop Mining Hosting Adjusted Cost of Cryptocurrency Revenue 2** tNon-GAAPI Prop Mining Hosting Cash Contribution Margin rNon-GAAPJ Prop Mining Hosting Cash Contribution % rNon-GAAPJ Prop Mining Hosting Adjusted Ca sh Contribution Margin Excluding One Time Eve nts & Projects• ... (Non-GAAPI General and administrative exoenses:’1 rNon GAAP! Add back: One -time expenses Addback: Non-cash stock compensat ion Adjust ed EBITDA Cont ribut ion (Non-GAAPJ Adjusted EBITDA Cont ribution % “lnclude<3 Llecutc t::{ and l lostmg costs ... l::xcludes Uepree1at10n and H./ill b :penses “** l::xcludes 1m pactot tornado and shutdown (a) Excludes Corp orate Assessment Actual 02 21 $668 668 0 $190 190 0 so 0 0 $190 190 0 $478 478 0 71.6% 71.6% n/a $478 83 37 0 $432 64.7% Actual Actual 03 21 0 4 21 $ 1.463 $4.354 1,114 2,626 349 1,729 $392 $1,279 208 389 184 890 $54 $290 54 290 0 0 $446 $ 1,569 263 679 184 890 $ 1,016 $2,785 851 1,946 166 839 69.5% 64.0% 76.4% 74.1% 47.4% 48.5% $ 1,016 $2,818 539 77 486 10 0 0 $963 $2.752 65.8% 63.2% Actual FY 21 Jan 22 Feb 22 $6.589 $1.533 $ 1.770 4,512 1,032 1,264 2,078 501 505 $ 1,884 $581 $590 811 249 235 1.074 332 354 $345 $127 $89 34 5 127 89 0 0 0 $2,229 $708 $679 1.155 377 324 1.074 332 354 $4,361 $825 $ 1,091 3,357 655 940 1,004 169 151 66.2% 53.8% 61.7% 74.4% 63.5% 74.4% 48.3% 33.8% 29.9% $4,394 $825 $ 1,091 1,059 4 34 880 0 0 0 0 0 $4,215 $820 $ 1,057 64.0% 53.5% 59.8% Actual Actual Es timate Estimate Ma r 22 0 122 Aor 22 Mav22 Jun 22 02 22 Jul 22 YTD 22 $1.637 $4.940 $1.567 $1.562 $ 1.107 $4.236 $1.064 $10.240 1,191 3,488 1,192 1,129 737 3,058 7 11 7,256 446 1,452 375 434 370 1,179 353 2,984 $654 $ 1.825 $439 $725 $714 $1.877 $861 $4,564 2 54 739 174 363 365 902 4 18 2.059 400 1.086 265 362 349 975 443 2.50 5 $ 117 $333 $117 $132 $ 153 $401 $148 $882 117 333 117 132 153 401 148 882 0 0 0 0 0 0 0 0 $771 $2,158 $556 $857 $866 $2,279 $1,009 $ 5,446 370 1.071 290 495 518 1.303 566 2.941 400 1.086 265 362 349 975 443 2.505 $866 $2,782 $1,011 $706 $240 $1,958 $55 $4,795 821 2,416 901 634 219 1,754 145 4,316 4 5 366 110 72 21 203 (901 479 52.9% 56.3% 64.5% 45.2% 21.7% 46.2% 5.2% 46.8% 68.9% 69.3% 75.6% 56.1% 29.7% 57.4% 20.4% 59.5% 10.2% 25.2% 29.3% 16.6% 5.7% 17.3% -25.6% 16.0% $1,030 $2.945 $1,289 $706 $240 $2.236 $55 $ 5,236 33 72 49 61 62 172 0 0 0 0 0 0 3 3 0 0 9 9 $999 $2,877 $1.240 $645 $ 187 $2,072 61.0% 58.2% 79.1% 41.3% 16.9% 48.9% (A) Marie excludes pass-through revenue and expenses from LegacyHosting customers. Electricity/Direct Costs reduced by Marie “Prepaid Lease Cost” August 2021 onward. For details on legacy hosting, see appendix. For more information on these non-GAAP financial measures, please see the section captioned “Reconciliation of non-GAAP results of operations to the nearest comparable GAAP measures”. To supplement our consolidated financial statements, which are prepared and presented in accordance with GAAP, we use the following non-GAAP financial measures: non-gaap revenue, contribution margin, cash contribution margin, adjusted cost of cryptocurrency revenue and adjusted EBITDA contribution. The presentation of this financial information is not intended to be considered in isolation or as a substitute for, or superior to, the financial information prepared and presented in accordance with GAAP. **** Normalized Cash Contribution Margin calculated by subtracting June Electricity/Direct Costs and July Overhead costs fromJuly Revenue

30 Marie: Operating Metrics(A) Key Operating Metrics: Avg MW Deployed Prop Mining Hosted MW (Legacy) Hosted JV Avg Hashrate (SHA-256, PH/ s) Prop Mining Hosted JV Avg Hashrate (Scrypt, GH/s) Avg. BTC Price BTC Equivalent Mined Prop Mining Hosting (1) Average of Apnl2021 June 2021 (7) Ave’“gP ci July ?0?1 - Sept•mhPr ?0?1 (3) Average of October 202: - Decemter 2021 (4) Average of January 2021 - DecEmber 2021 (5) Average of January 2022 - March 2022 (6) Average of April 2022 - June 2022 (7) Average of January 2022 - July 2022 02 21111 1.58 1.58 - - 12.80 12.80 - 221.90 46,498 14.37 14.37 - 03 21121 04 21131 3.09 10.64 1.76 3.14 - - 1.99 7.50 58.62 324.77 28.25 81.38 45.56 243.38 187.50 165.03 42,031 55,932 34 .80 77.85 26.49 46.94 8.31 30.91 FY 21141 Jan 22 Feb 22 Mar22 7.46 14.75 17.29 15.61 2.16 6.95 8.79 7.11 - - - - 5.30 7.80 8.50 8.50 205.06 400.93 475.58 447.90 40.81 148.73 218.16 213.18 164.25 252.20 257.42 234.72 191.48 140.99 141.57 76.76 47,449 41,114 40,763 41,966 138.87 37.29 43.41 39.01 95.08 25.10 31.01 28.39 43 79 12.19 12.40 10.62 012’P1 Apr 22 May22 Jun 22 02 2i 61 Jul22 YTD 22171 15.88 14.59 19.20 17.91 17.23 18.09 16.78 7.62 7.70 10.48 10.00 9.39 9.70 8.68 - - - - - - 8.27 6.89 8.72 7.91 7.84 8.39 8.10 441.47 42 1.08 561.86 499.94 494.29 493.83 471.59 193.36 206.34 273.72 234.55 238.20 231.01 217.96 248.11 214.74 288.14 265.39 256.09 262.82 253.63 119.77 146.45 164.28 141.15 150.63 115.38 132.37 41,281 41,435 31,706 24,384 32,508 21.539 34,701 119.66 37.82 49.28 45.40 130.32 49.40 295.10 84.48 28.76 35.60 30.23 94.05 33.01 209.11 35.18 9.06 13.67 15.17 36.26 16.39 85.99 (A) Marie excludes pass-through revenue and expenses from LegacyHosting customers. Electricity/Direct Costs reduced by Marie “Prepaid Lease Cost” August 2021 onward. For details on legacy hosting, see appendix. For more information on these non-GAAP financial measures, please see the section captioned “Reconciliation of non-GAAP results of operations to the nearest comparable GAAP measures”. To supplement our consolidated financial statements, which are prepared and presented in accordance with GAAP, we use the following non-GAAP financial measures: non-gaap revenue, contribution margin, cash contribution margin, adjusted cost of cryptocurrency revenue and adjusted EBITDA contribution. The presentation of this financial information is not intended to be considered in isolation or as a substitute for, or superior to, the financial information prepared and presented in accordance with GAAP.
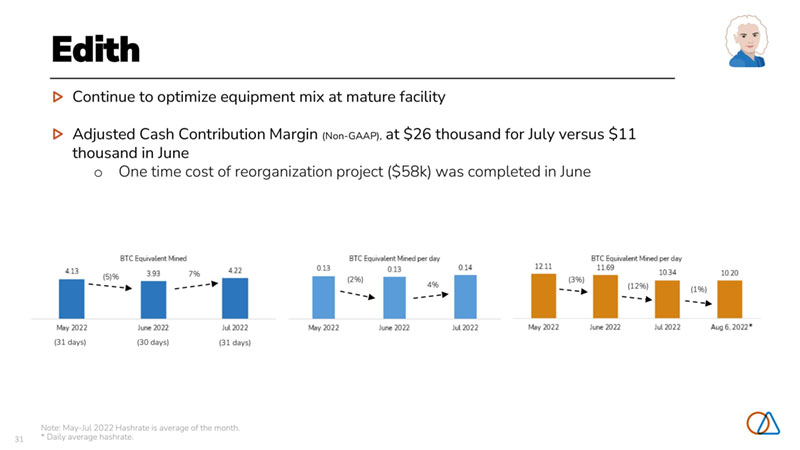
31 Edith (Non-GAAP),at $26 thousand for July versus $11 thousand in JuneoOne time cost of reorganization project ($58k) was completed in June Note: May-Jul 2022 Hashrate is average of the month. *Daily average hashrate. (31 days) (30 days) (5)% (31 days) 7% (2%) 4% (3%) (12%) (1%) *

32 Edith: Non-GAAP Historical Financials ($ in OOOs) {Unaudited) Revenue Electricity/Direct Costs* Overhead Costs** Adjust ed Cost of Cryptocurrency Revenue 1 +++ {Nnn-GAAf’l Cash Contribution Margin {Nnn -CiAAf’l Cash Contribution % Adjusted Cash Contribution Margin Excluding One Time Events & Projects•••• (Non·GAAPJ General and administrative expenses1• i {Nvn-G/viPJ Addback: One-time expenses Addback: Non-cash stock compensation Adjusted EBITDA Cont riblltion a;on GAAP1 Adjusted EBIIDA Contribution % x l ncludc~ Elcctricitv co5t~ Ufxdudl.”..i S23lhw :.HJnd of pruj;,:d <..’l.luipmcnl u,:J,Juir:.; •••E.x.dudt~s Dt~IJf t:’lialion <~rl:.l R&D E llp<U l i>~s •u”‘E,.,dutil:!!> $58 !JrousdrrU uf <.wle-lir·•e r~::urycmild .i t.~n I.H:.tj~t cusls Actual 02 21 988 133 71 $204 $784 79.4% $784 77 0 0 $707 71.6% Actual Actual 03 21 0421 905 864 140 143 63 65 $203 $208 $702 $656 77.6% 75.9% $702 $656 123 86 0 0 0 0 $579 $570 64.0% 66.0% Actual Actual FY 21 Jan 22 Feb 22 Mar 22 01 22 3,648 150 185 181 517 537 45 32 51 128 3 QQ_ 27 20 32 79 $838 $72 $52 $82 $207 $2,810 $78 $133 $99 $310 77.0% 52.0% 72.0% 54.5% 60.0% $2,810 $78 $133 $99 $310 291 0 (0) 0 (01 4 0 0 0 0 0 0 0 0 0 $2.522 $78 $133 $99 $310 69.2% 52.0% 72.0% 54.5% 60.0% Ia) Exdudes Corporate Assessmen t; Includes Soluna profit share f ron tv’av 2021 011w.ard. Corporate e)(penses ‘Nith in G&A at Edith ·.-.·ere re-d assrtied in 2021. Ch.art refl~ds ~G&A w i: houtc.orporii:e e-xpenses. Key Operating Met rics: Avg. MW Deployed Ava. Hashrate (SHA· 256. PH/sil81 Avg. BTC Price BTC Equivalent Mined Ill AvcraQc of J<1nuouy 202:. Mouch 2021 (2) lwl::!rif\ll::! of Aa;1 it 2021 - June 20 21 (3) A·Jerasle of July 2021 - September 2021 14) A·~Prit!JP of OrtohPr ?0? 1 - rlPCPMh !”r Jn? 1 (5) A·~craQc of J<1nu<1ry 202: Oct ember 2021 (1.11 /’.veraQe ot January 20Ll. • Marc.h 201:1. (7) A·~erage of AJ:ril 2022- June 2022 (R) Hr:>shr ~ t @ WitS not t r<“ r k”P.<i for thP first q u itrtH (9) lwl::!rif\ll::! of Jdnucny 2022 · Jul·~ 2022 02 21121 1.76 8.69 46,498 21.25 03 211’ 1 0 4 21141 FY 211’1 1.77 1.77 1.73 10.67 11.36 10.24 42,031 55,932 47,449 21.53 15.44 76.87 Jan 22 Feb 22 Mar 22 0122’’1 1.60 1.46 1.57 1.54 9.57 9.01 11.78 10.12 41,114 40,763 41,966 41.281 3.66 4.54 4.31 12’ 52 . ~--~ -\ ( ... 1’“ ~ ‘.a; Actual [ stimate Estimate Aor 22 Mav22 Jun 22 0 2 22 Jul 22 YTD 22 191 131 96 418 91 1,025 48 45 50 143 49 320 16 22 .93 131 16 2 26 $64 $67 $142 $274 $65 $545 $127 $64 ($47) $144 $26 $480 66.4% 48.5% -48.6% 34.4% 29.0% 46.8% $127 $64 $11 $202 $26 $538 0 0 0 0 0 0 0 0 0 0 0 0 127 63 11 201 66.4% 48.2% l1.9% 48.2% Aor 22 Mav22 Jun 22 02 22’11 Jul 22 YTD 22191 1.65 1.70 1.64 1.66 1.60 1.60 12.35 12.11 11.69 12.05 10.34 10.98 41.435 31.706 24,384 32,508 21.539 34,701 4.60 4.13 3.93 12.85 422 29.55 For more information on these non-GAAP financial measures, please see the section captioned “Reconciliation of non-GAAP results of operations to the nearest comparable GAAP measures”. To supplement our consolidated financial statements, which are prepared and presented in accordance with GAAP, we use the followingnon-GAAP financial measures: non-gaap revenue, contribution margin,, cash contribution margin, adjusted cost of cryptocurrency revenue and adjusted EBITDA contribution. The presentation of this financial information is not intended to be considered in isolation or as a substitute for, or superior to, the financial information prepared and presented in accordance with GAAP.

33 Site Consolidation 9%to 944 PH/s versus June PH/S of 869.3 6% to 1 EH/sover average 944 PH/s average in July 12% 2% (3%) (30 days) (31 days) (30 days) * 8% 9% 6% (1%) Note: May-Jul 2022 Hashrate is average of the month. * Daily average hashrate.

34 Consolidated Soluna Computing Non-GAAP Historical Financials(A) ($ in OOOsJ (Unaudited} Revenue (Non·GAAPJ Prop Mining Hosting Electricity/Direct Costs• Prop Mining Hosting Overhead Cost s Prop M in ing ~~-*-*”* Hosting Adjusted Cost of Cryptocurrency Revenue 2 .. (Non-GAAPJ Prop Mining Hosting Cash Contribution Margin (Non-GAAPJ Prop Mining Hosting Cash Contribution % (Non-GAAPJ Prop Mining Hosting Adjusted Cash Contribution Margin Excluding One Time Events & Projects*** (Non-GAAP) General and administrative expenses111 (Non-GAAP) Addback: One-t ime expenses’“ (Non-GAAP) Addback: Non- cash stock compensation Adjusted EBITDA Contribution (Non-GAAPJ Adjusted EBITDA Contribution 96 •(ndudM Electnc1ty and HostJno costs ·•Excludes Oeprecliltion ;~nd R&D Expenses $1,657 1,657 0 $324 324 0 $72 72 0 $396 396 0 $1,261 1,261 0 76_196 76.196 n/a $1,261 $2,368 2,018 349 $532 348 184 $132 132 0 $664 481 184 $ 1,703 1,538 166 71_996 76.296 47.496 $ 1,703 $7,990 6,261 1,729 $2,307 1,417 890 $639 639 0 $2,946 2,056 890 $5,044 4,206 839 63_196 67.296 48.596 $5.179 292 1.031 1,398 37 649 370 0 0 242 $1,006 $ 1,321 $4,393 60.796 55.896 55.0 96 •• “Excludes one ume events and protects such as shutdowns. tomados and reorgamzatton PfqectS · · --consolidated overheild costs 1ncludes smilll expenses for new O<lrothy $1te (a) Excludt>S Corporate Assessment; lbl Managemf’nt Est1mate Actual FY21 $ 13,0 10 10,932 2.078 $3,306 2.232 1.074 $952 952 0 $4,258 3,184 1.074 $8,752 7,748 1.004 67396 70.996 48396 $8.888 3.284 1,568 242 $7,414 57.096 Jan 22 Feb 22 Mar 22 $2,977 2.476 501 $1,127 795 332 $261 261 0 $1,387 1,056 332 $1,590 1,421 169 53_496 57.496 33.896 $1,590 $3,087 2.581 505 $1,152 798 354 $196 196 0 $ 1,348 994 354 $ 1,739 1,587 151 56396 61.596 29.996 $ 1,739 387 637 0 0 0 0 $1,203 $ 1,102 40.496 35.796 $3,200 2.754 446 $1,220 820 400 $265 265 0 $1,486 1,085 400 $1,714 1,669 45 53_696 60.696 10.296 $1,8 78 $9,264 7,812 1,452 $3,499 2.413 1.086 $722 722 0 $4,221 3,135 1.086 $5,043 4,677 366 54_496 59.996 25.296 $5,206 $3,392 3.0 17 375 $812 547 265 $399 399 0 $1,211 946 265 $2,181 2,071 110 64396 68.796 29.396 $2,605 1.067 2,091 805 0 0 0 230 230 0 $1,040 $3,345 $1,800 32.596 36.196 53.196 $3,004 2.570 434 $ 1,151 790 362 $337 337 0 $ 1,489 1,127 362 $ 1,515 1,443 72 50_496 56.1 96 16.696 $ 1,600 834 0 0 $766 25.596 $2,280 1.9 10 370 $1,197 848 349 $430 430 0 $1,627 1,279 349 $653 632 21 28_696 33.196 5.796 $800 761 0 302 $340 14.996 $8,676 7,497 1.179 $3,161 2.185 975 $ 1,166 1.166 0 $4,327 3,352 975 $4,349 4,146 203 50_196 55.396 17.396 $5,005 2,400 0 302 $2,906 33.596 Estimate Estimate Jul22 $2,254 1.901 353 $1,520 1.077 443 $300 300 0 $1,821 1,378 443 $433 523 (90) 19_296 27.596 -25.696 $433 YTD 22 $20,194 17.210 2.984 $8,180 5,675 2.505 $2,189 2.189 0 $ 10,369 7,864 2.505 $9,824 9,346 479 48.796 54.396 16.096 $ 10,643 (A) Marie excludes pass-through revenue and expenses from LegacyHosting customers. Electricity/Direct Costs reduced by Marie “Prepaid Lease Cost” August 2021 onward. For details on legacy hosting, see appendix. For more information on these non-GAAP financial measures, please see the section captioned “Reconciliation of non-GAAP results of operations to the nearest comparable GAAP measures”. To supplement our consolidated financial statements, which are prepared and presented in accordance with GAAP, we use the following non-GAAP financial measures: non-gaap revenue, contribution margin, cash contribution margin, adjusted cost of cryptocurrency revenue and adjusted EBITDA contribution. The presentation of this financial information is not intended to be considered in isolation or as a substitute for, or superior to, the financial information prepared and presented in accordance with GAAP.
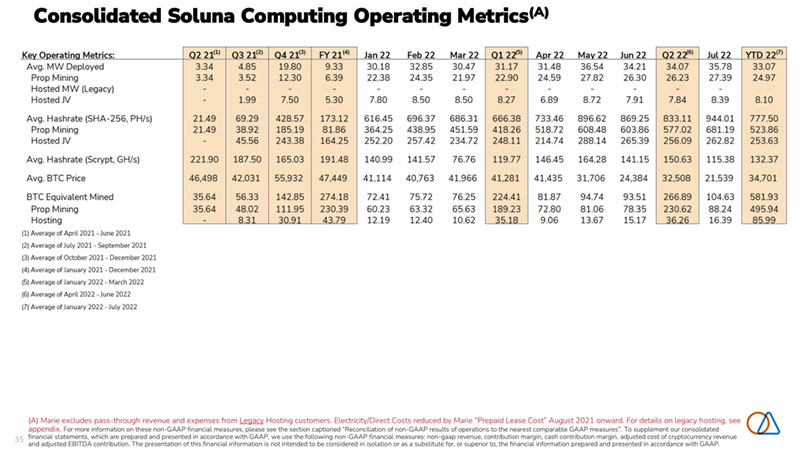
35 Consolidated Soluna Computing Operating Metrics(A) (A) Marie excludes pass-through revenue and expenses from LegacyHosting customers. Electricity/Direct Costs reduced by Marie “Prepaid Lease Cost” August 2021 onward. For details on legacy hosting, see appendix. For more information on these non-GAAP financial measures, please see the section captioned “Reconciliation of non-GAAP results of operations to the nearest comparable GAAP measures”. To supplement our consolidated financial statements, which are prepared and presented in accordance with GAAP, we use the following non-GAAP financial measures: non-gaap revenue, contribution margin, cash contribution margin, adjusted cost of cryptocurrency revenue and adjusted EBITDA contribution. The presentation of this financial information is not intended to be considered in isolation or as a substitute for, or superior to, the financial information prepared and presented in accordance with GAAP.

36 Appendix

37 Our data centers are named after catalyzers Edith Sophie Marie Marie Curiewas a fearless seeker of truth—a pioneer in the field of radioactivity.She won two Nobel Prizes.In pursuit of the truth, Soluna is constructing a data center withcomplete transparencyto help make the grid stable. Why such transparency?So, everyone can see & know what must happen,to do the right things. Including the players that have typically had a dark & controlling influence, making reckless decisions.But no longer. Sophie Wilsonis a detailed oriented designer who helped invent and deploy ARM technology. This was key to unlocking the mobile and custom chip revolution. She found ways to use processorsin more simple ways.We’re building a data center to help the grid. We’re using Sophie’s methods toblend details and simplicityfor our first greenfield project. Edith Clarkewas a pioneer in electrical engineering & power transmission.She was a firstin so many ways.The first woman to earn an MSc degree at MITin 1919. Thefirst woman employed as an electrical engineerat General Electric in 1921. Thefirst full-time electrical engineering professorin 1947, at University of Texas. We’re influenced by Edith’s firsts.It drives us tohelp make renewable, affordable energy the world’s primary power source.

38 Marie: Impact of forced shutdown *Note: Management estimate mined) in April and March, respectively and Cash Contribution Margin of $278 and $163 thousand, respectively seeking to resolve which may require an additional 5 days of down time over the remainder of the year. Marie excludes pass-through revenue and expenses from LegacyHosting customers. Electricity/Direct Costs reduced by Marie “Prepaid Lease Cost” August 2021 onward. For more information on these non-GAAP financial measures, please see the section captioned “Reconciliation of non-GAAP results of operations to the nearest comparable GAAP measures”. To supplement our consolidated financial statements, which are prepared and presented in accordance with GAAP, we use the following non-GAAP financial measures: non-gaap revenue, contribution margin, cash contribution margin, adjusted cost of cryptocurrency revenue and adjusted EBITDA contribution. The presentation of this financial information is not intended to be considered in isolation or as a substitute for, or superior to, the financial information prepared and presented in accordance with GAAP.($ in 000s) Estimate Shutdown Estimate Estimate Shutdown Estimate Mar 22 Impact* Pro-Forma Mar 22 Impact* Pro-Forma Revenue (Non-GAAP) $1,637 $319 $1,956 $1,567 $531 $2,098 Prop Mining 1,191 249 1,440 1,192 430 1,621 Hosted JV 446 70 515 375 101 477 Cash Contribution Margin (Non-GAAP) $866 $163 $1,030 $1,002 $278 $1,280 Prop Mining 821 149 970 892 258 1,149 Hosted JV 45 14 59 110 20 130 Marie - March (5 Days) Marie - April (8 Days)

39 Consolidated Soluna Computing Non-GAAP Historical Financials With Legacy Hosting For more information on these non-GAAP financial measures, please see the section captioned “Reconciliation of non-GAAP results of operations to the nearest comparable GAAP measures”. To supplement our consolidated financial statements, which are prepared and presented in accordance with GAAP, we use the followingnon-GAAP financial measures: contribution margin, adjusted cost of cryptocurrency revenue and adjusted EBITDA contribution. The presentation of this financial information is not intended to beconsidered in isolation or as a substitute for, or superior to, the financial information prepared and presented in accordance with GAAP.
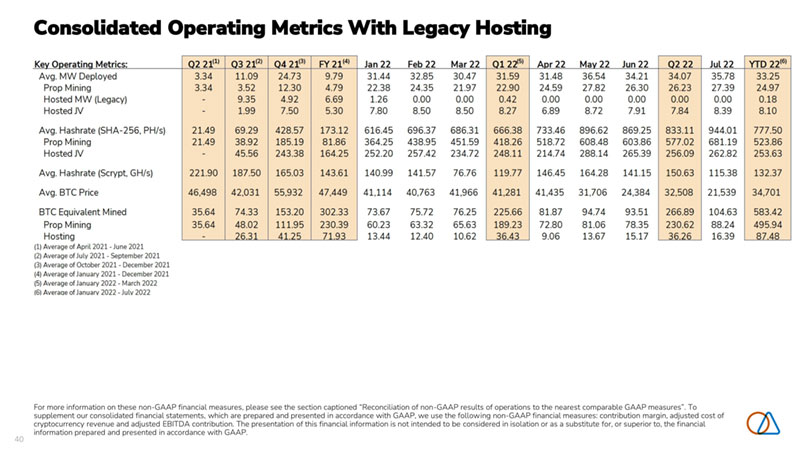
40 Consolidated Operating Metrics With Legacy Hosting Key Operatino Metrics: Avg. MW Deployed Prop Mining Hosted MW (Legacy) Hosted JV Avg. Hashrate (SHA-256, PH/s) Prop Mining Hosted JV Avg. Hashrate (Scrypt, GH/s) Avg. BTC Price BTC Equivalent Mined Prop Mining Hosting (11 Average of Apnl 2021 · June 2021 (21 Average of July 2021 ·September 2021 (31 Average of October 2021 - DecEmber 2021 (41 Average of January 2021 - December 2021 (51 Average of January 2022 - March 2022 (61 Averaoe of January 2022- July 2022 02 21111 03 21(2) 3.34 11.09 3.34 3.52 - 9.35 - 1.99 21.49 69.29 21.49 38.92 - 45.56 221.90 187.50 46,498 42,031 35.64 74.33 35.64 48.02 - 2631 04 21131 FY 21141 Jan 22 Feb 22 24.73 9.79 31.44 32.85 12.30 4.79 22.38 24.35 4.92 6.69 1.26 0.00 7.50 5.30 7.80 8.50 428.57 173.12 616.45 696.37 185.19 8 1.86 364.25 438.95 243.38 164.25 252.20 257.42 165.03 143.61 140.99 141.57 55,932 47,449 41,1 14 40.763 153.20 302.33 73.67 75.72 111.95 230.39 60.23 63.32 .4125 _71 93 13.44 12.40 Mar 22 Q12z151 Apr22 Mav22 Jun 22 0 2 22 Jul 22 YTD 22161 30.47 31.59 31.48 36.54 34.21 34.07 35.78 33.25 21.97 22.90 24.59 27.82 26.30 26.23 27.39 24.97 0.00 0.42 0.00 0.00 0.00 0.00 0.00 0.18 8.50 8.27 6.89 8.72 7.91 7.84 8.39 8.10 686.31 666.38 733.46 896.62 869.25 833.11 944.01 777.50 451.59 418.26 518.72 608.48 603.86 577.02 681.19 523.86 234.72 248.11 214.74 288.14 265.39 256.09 262.82 253.63 76.76 119.77 146.45 164.28 141.15 150.63 115.38 132.37 41,966 41,281 41,435 31,706 24,384 32,508 21,539 34,701 76.25 225.66 81.87 94.74 93.51 266.89 104.63 583.42 65.63 189.23 72.80 8 1.06 78.35 230.62 88.24 495.94 10.62 36A3 9.06 13.67 15.17 3626 16.39 87A8 For more information on these non-GAAP financial measures, please see the section captioned “Reconciliation of non-GAAP results of operations to the nearest comparable GAAP measures”. To supplement our consolidated financial statements, which are prepared and presented in accordance with GAAP, we use the followingnon-GAAP financial measures: contribution margin, adjusted cost of cryptocurrency revenue and adjusted EBITDA contribution. The presentation of this financial information is not intended to beconsidered in isolation or as a substitute for, or superior to, the financial information prepared and presented in accordance with GAAP.

41 Marie: Non-GAAP Historical Financials With Legacy Hosting ($ tn OOOsl (Unouditcdl Revenue Prop M1mng Hosting Electricity/Direct Costs* Prop Mining Hosting Overhead Costs Prop Mining Hosting Adjusted Cost of Cryptocurrency Revenue 1** (Non-GAAPI Prop Mimng Hosting Contribution Margin (Non-GAAPI Prop M1mng Hosting Contribution % /Non-GAAPI Prop Mining Hosting General and administrat ive exoenses(a) (Non GAAP1 Addback: One-t ime expenses Addback: Non-cash stock compensation Adjusted EBITDA Contribution (Non-GNJ>J Adjusted EBITDA Contribution % ~lnduriP<> FIPI’trir.ity Rnrl Hrn7ing (“M’f<; Ht~~;clu dES L>eprHicrt.on and H&L> l::xpenses (ill Exclude~ Coroorlltc A~::;c:x: mcnt Act ual 02 21 $668 668 a $190 190 0 $0 0 0 $190 190 0 $478 478 0 71.6% 71.6% n/a 83 37 0 $432 64.7% Actual Actual 03 21 0421 $2,219 $4,933 1.114 2,626 1.106 2,307 $1,288 $2,136 338 566 950 1,570 $58 $200 58 200 0 0 $1,347 $2,336 397 766 950 1,570 $873 $2,597 717 1,860 156 737 39.3% 52.6% 64.4% 708% 14.1% 31.9% 539 77 486 10 0 0 $820 $2,531 36.9% 51.3% Actual FY 21 Jan 22 Feb 22 Mar22 $7,925 $1,585 $1,770 $1,637 4,512 1,032 1,264 1,191 3,413 553 505 446 $3,637 $739 $670 $743 1,117 326 326 345 2,520 413 344 398 $258 $101 $99 $118 258 101 99 118 0 0 0 0 $3,895 $840 $769 $861 1,375 427 425 463 2,520 413 344 398 $4,030 $745 $1,000 $776 3,136 605 839 728 893 140 161 47 50.8% 47.0% 56.5% 47.4% 69.5% 58.6% 66.4% 61 .1% 26.2% 25.3% 31.9% 10.6% 1.059 4 34 33 880 0 0 0 0 0 0 3 $3,851 $740 $967 $745 48.6% 46.7% 54.6% 45.5% Actual Actual tsbmate Estimate 0122 Aor22 Mav22 Jun 22 0222 Jul22 YTD 22 $4,991 $1,567 $1,562 $1,107 $4,236 $1,064 $10,292 3,488 1,192 1,129 737 3,058 711 7,256 1.504 375 434 370 1,179 353 3,036 $2,152 $509 $815 $798 $2,122 $941 $5,215 997 244 453 449 1,146 498 2,641 1,156 265 362 349 975 443 2,574 $318 $117 $132 $153 $401 $148 $868 318 117 132 153 401 148 868 0 0 0 0 0 0 0 $2,471 $626 $947 $950 $2,523 $1,089 $6,083 1.315 360 585 602 1,548 646 3,509 1,156 265 362 349 975 443 2,574 $2,521 $941 $616 $156 $1,713 ($25) $4,209 2.172 831 544 135 1,510 65 3,748 348 110 72 21 203 (90) 461 50.5% 60.1% 39.4% 14.1% 40.4% -2.3% 40.9% 62.3% 69.7% 48 2% 18.3% 494% 9.2% 51 .6% 23.2% 29.3% 16.6% 5.7% 17.3% -25.6% 15.2% 72 49 61 62 172 0 0 0 0 0 3 0 0 9 9 $2,452 $892 $555 $103 $1,550 49.1% 56.9% 35.5% 9.3% 36.6% For more information on these non-GAAP financial measures, please see the section captioned “Reconciliation of non-GAAP results of operations to the nearest comparable GAAP measures”. To supplement our consolidated financial statements, which are prepared and presented in accordance with GAAP, we use the followingnon-GAAP financial measures: contribution margin, adjusted cost of cryptocurrency revenue and adjusted EBITDA contribution. The presentation of this financial information is not intended to beconsidered in isolation or as a substitute for, or superior to, the financial information prepared and presented in accordance with GAAP.
42 Reconciliation of non-GAAP results of operations to the nearest comparable GAAP measures

43 2022 July YTD -Reconciliation Of Non-GAAP Results Reconciliation from GAAP Revenue to Non-GAAP Revenue ($ in OOOs) (Unaudited) Cryptocurrency revenue (GAAP) less Leqacv Hostinq Revenue Revenue (Non-GAAP) I Edith $1,025 0 $1025 YTD July 2022 Soluna Computinq Marie Sophie $10,292 $8,928 52 0 $10 240 $8 928 Dorothy Total $0 $20,245 0 52 so $20194
44 2022 July YTD -Reconciliation Of Non-GAAP Results

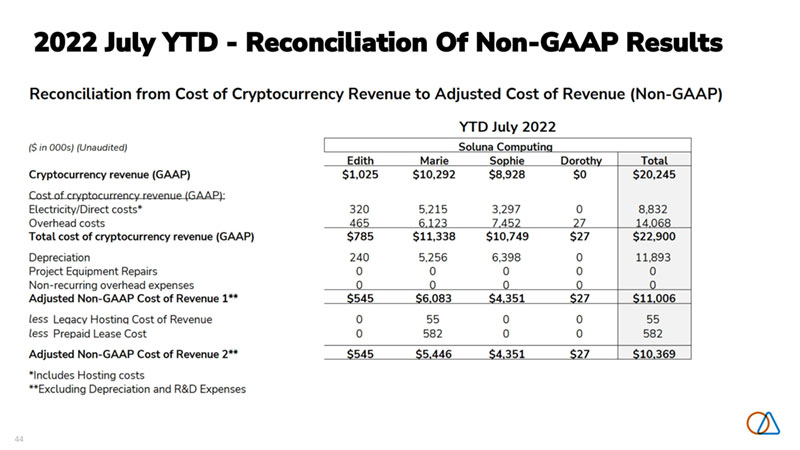
45 2022 July YTD -Reconciliation Of Non-GAAP Results Contribution Margin & Cash Contribution Margin (Non-GAAP) ($ in OOOs) (Unaudited) Cryptocurrency revenue (GAAP) Cost of cryptocurrency revenue (GAAP) Depreciation Project Equipment Repairs Contribution Margin (Non-GAAP)* plus Prepaid Lease Cost plus Leqacy Hostinq Contribution Marqin plus Non-recurring overhead expenses (Manaqement Estimate) Cash Contribution Margin (Non-GAAP)* plus One Time Events & Projects Adj usted Cash Contribution Margin Excluding One Time Events & Project (Non-GAAP) *Excludes R&D Expenses, SG&A Expenses I Edith $1,025 785 240 0 S480 0 0 0 $480 58 $538 Marie $10,292 11,338 5,256 0 S4 209 582 3 0 $4 795 441 0 $5,236 YTD July 2022 Soluna Comoutina Sophie Dorothy Total $8,928 $0 $20,245 10,749 27 22,900 6,398 0 11,893 0 0 0 S4 577 CS27l S9 239 0 0 582 0 0 3 0 0 0 $4 577 ($27) $9824 319 0 819 $4,896 ($27) $10,643

46 2022 Q2 -Reconciliation Of Non-GAAP Results Reconciliation from GAAP Revenue to Non-GAAP Revenue ($in OOOs) (Una udited) Cryptocurrency revenue (GAAP) less Leqacv Hostinq Revenue Revenue (Non-GAAP) I Edith $418 0 $418 Q2 2022 Soluna Comoutina Marie Sophie $4,236 $4,022 0 0 $4 236 $4022 Dorothy Corporate Total $0 $0 $8,676 0 0 0 $0 $0 $8 676
47 2022 Q2 -Reconciliation Of Non-GAAP Results

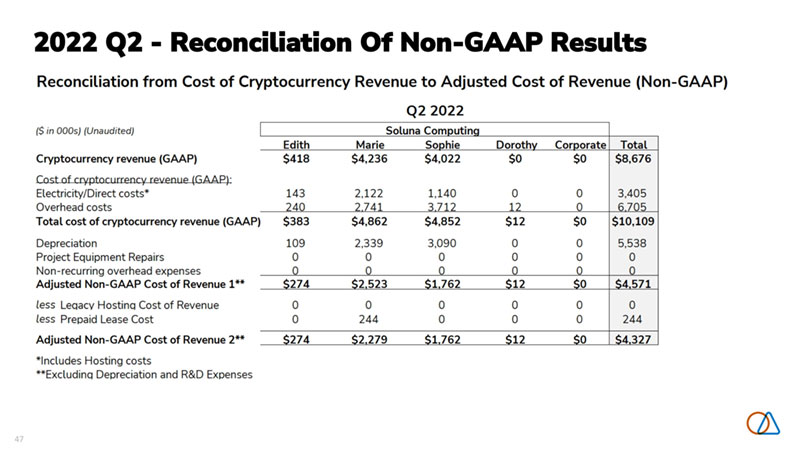
48 2022 Q2 -Reconciliation Of Non-GAAP Results Reconcilation from Revenue and Cost of Revenue to Contribution Margin & Cash Contribution Margin ($ in ODDs) (Unaudited) Cryptocurrency revenue (GAAP) Cost of cryptocurrency revenue (GAAP) Depreciat ion Project Equipment Repairs Contribution Margin (Non-GAAP)* plus Prepaid Lease Cost plus Leqacv Host inq Cont ribution Marqin plus Non-recurrinq overhead expenses (Mana Cash Contribution Margin (Non-GAAP)* plus One Time Events & Projects Adjustment Cash Contribution Margin (Non-GAAP) excluding One Time Events *Excludes R&D Expense. SG&A Expenses I Edith $418 383 109 0 $144 0 0 0 $144 58 $202 Q2 2022 Soluna Comoutina Marie Sophie Dorothy Corporate $4,236 $4,022 $0 $0 4,862 4,852 12 0 2,339 3,090 0 0 0 0 0 0 $1713 $2 260 ($12) so 244 0 0 0 0 0 0 0 0 0 0 0 $1958 $2 260 ($12) $0 278 320 0 0 $2,236 $2,580 ($12) $0 Total $8,676 10,109 5,538 0 $4105 244 0 0 $4 349 656 $5,005

49 2022 Q2 -Reconciliation Of Non-GAAP Results Reconciliation from Revenue and Cost of Revenue to Adjusted EBITDA (Non-GAAP} ($in OOOs) (Unaudited) Cryptocurrency revenue (GAAP) Cost of crypt ocurrency revenue (GAAP) Depreciation Project Equipment Repairs plus Prepaid Lease Cost plus Legacy Hosting Contribution Margin plus One Time Projects & Events Adjustment minus Total G&A (GAAP) plus One-time SG&A Expenses plus Non-Cash Stock Expenses Adjusted EBITDA (Non-GAAP) I Edith $418 383 109 0 0 0 58 0 0 0 $201 Marie $4,236 4,862 2,339 0 244 0 278 172 0 9 $2,072 Q2 2022 Soluna Computing Sophie Dorothy Corporate $4,022 $0 $0 4,852 12 0 3,090 0.1 0 0 0 0 0 0 0 0 0 0 320 0 0 21 (151) 2,358 0 0 . 0 7 1 285 $2,565 $140 ($2,073) Total $8,676 10,109 5,538 0 244 0 656 2.400 0 302 $2,906 Note: Adjusted EBITDA withLegacy Hosting Customer can be calculated by excluding the “Prepaid Lease Cost”, “Legacy Hosting Contribution Margin” and “One Time Projects and Events Adjustment” lines from the schedule above.
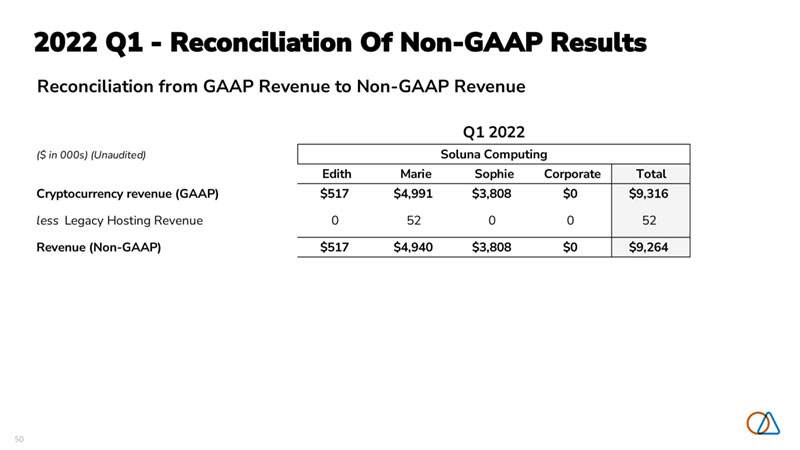
50 2022 Q1 -Reconciliation Of Non-GAAP ResultsReconciliation from GAAP Revenue to Non-GAAP Revenue ($ in 000s) (Unaudited) Edith Marie Sophie Corporate Total Cryptocurrency revenue (GAAP) $517 $4,991 $3,808 $0 $9,316 less Legacy Hosting Revenue 0 52 0 0 52 Revenue (Non-GAAP) $517 $4,940 $3,808 $0 $9,264 Q1 2022 Soluna Computing
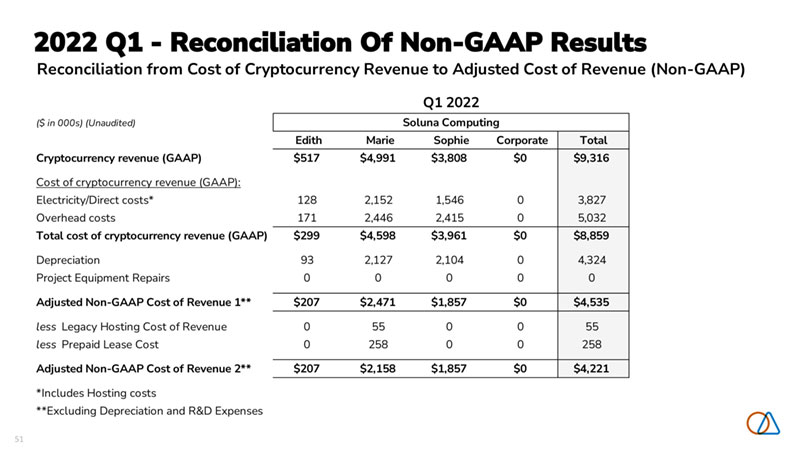
51 2022 Q1 -Reconciliation Of Non-GAAP ResultsReconciliation from Cost of Cryptocurrency Revenue to Adjusted Cost of Revenue (Non-GAAP) ($ in 000s) (Unaudited) Edith Marie Sophie Corporate Total Cryptocurrency revenue (GAAP) $517 $4,991 $3,808 $0 $9,316 Cost of cryptocurrency revenue (GAAP): Electricity/Direct costs* 128 2,152 1,546 0 3,827 Overhead costs 171 2,446 2,415 0 5,032 Total cost of cryptocurrency revenue (GAAP) $299 $4,598 $3,961 $0 $8,859 Depreciation 93 2,127 2,104 0 4,324 Project Equipment Repairs 0 0 0 0 0 Adjusted Non-GAAP Cost of Revenue 1** $207 $2,471 $1,857 $0 $4,535 less Legacy Hosting Cost of Revenue 0 55 0 0 55 less Prepaid Lease Cost 0 258 0 0 258 Adjusted Non-GAAP Cost of Revenue 2** $207 $2,158 $1,857 $0 $4,221 *Includes Hosting costs **Excluding Depreciation and R&D Expenses Q1 2022 Soluna Computing

52 2022 Q1 -Reconciliation Of Non-GAAP Results($ in 000s) (Unaudited) Edith Marie Sophie Corporate Total Cryptocurrency revenue (GAAP) $517 $4,991 $3,808 $0 $9,316 Cost of cryptocurrency revenue (GAAP) 299 4,598 3,961 0 8,859 Depreciation 93 2,127 2,104 0 4,324 Project Equipment Repairs 0 0 0 0 0 Contribution Margin (Non-GAAP)* $310 $2,521 $1,950 $0 $4,781 plus Prepaid Lease Cost 0 258 0 0 258 plus Legacy Hosting Contribution Margin 0 3 0 0 3 Cash Contribution Margin (Non-GAAP)* $310 $2,782 $1,950 $0 $5,043 plus Tornado Impact (Management Estimate) 0 0 0 0 0 plus Forced Shutdown (Management Estimate) 0 163 0 0 163 Cash Contribution Margin (Non-GAAP) excluding Tornado & Shutdown* $310 $2,945 $1,950 $0 $5,206 *Excludes R&D Expenses, SG&A Expenses Reconciliation from Revenue and Cost of Revenue to Contribution Margin & Cash Contribution Margin Q1 2022 Soluna Computing

53 2022 Q1 -Reconciliation Of Non-GAAP Results ($ in OOOs) (Unaudited) Cryptocurrency revenue (GAAP) Cost of cryptocurrency revenue (GAAP) Depreciation Project Equipment Repairs plus Prepaid Lease Cost plus Legacy Hosting Contribution Margin plus One Time Projects & Events Adjustment minus Total G&A (GAAP) plus One-time SG&A Expenses plus Non-Cash Stock Expenses Adjusted EBITDA (Non-GAAP) I Edith $517 299 93 0 0 0 0 (0) 0 0 $310 Marie $4,991 4,598 2,127 0 258 3 163 72 0 3 $2,877 Q12022 Soluna Computing Sophie Dorothy Corporate Total $3,808 $0 $0 $9,316 3,961 0 0 8 ,859 2,104 0 0 4,324 0 0 0 0 0 0 0 258 0 0 0 3 0 0 0 163 17 351 1,651 2,091 0 0 0 0 6 0 222 230 $1,939 ($351) ($1,430) $3,345 Note: Adjusted EBITDA withLegacy Hosting Customer can be calculated by excluding the “Prepaid Lease Cost”, “Legacy Hosting Contribution Margin” and “One Time Projects and Events Adjustment” lines from the schedule above.

54 2021 FY -Reconciliation Of Non-GAAP ResultsReconciliation from GAAP Revenue to Non-GAAP Revenue ($ in 000s) (Unaudited) Edith Marie Sophie Corporate Total Cryptocurrency revenue (GAAP) $3,648 $7,925 $2,772 $0 $14,345 less Legacy Hosting Revenue 0 1,335 0 0 1,335 Revenue (Non-GAAP) $3,648 $6,590 $2,772 $0 $13,010 FY 2021 Soluna Computing
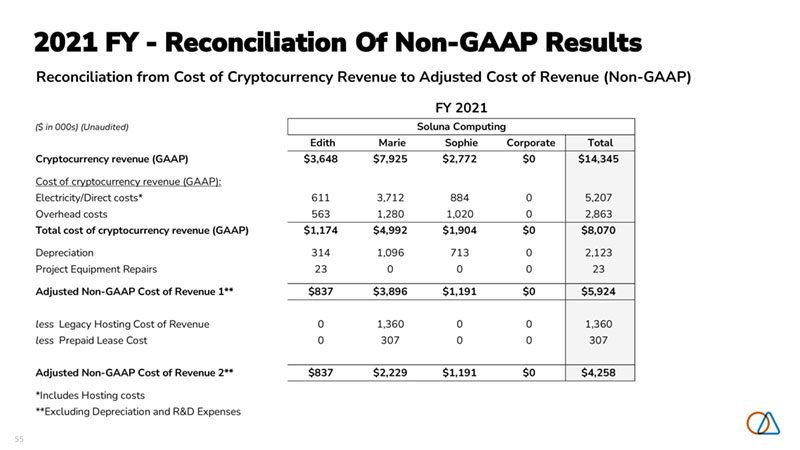
55Reconciliation from Cost of Cryptocurrency Revenue to Adjusted Cost of Revenue (Non-GAAP) ($ in 000s) (Unaudited) Edith Marie Sophie Corporate Total Cryptocurrency revenue (GAAP) $3,648 $7,925 $2,772 $0 $14,345 Cost of cryptocurrency revenue (GAAP): Electricity/Direct costs* 611 3,712 884 0 5,207 Overhead costs 563 1,280 1,020 0 2,863 Total cost of cryptocurrency revenue (GAAP) $1,174 $4,992 $1,904 $0 $8,070 Depreciation 314 1,096 713 0 2,123 Project Equipment Repairs 23 0 0 0 23 Adjusted Non-GAAP Cost of Revenue 1** $837 $3,896 $1,191 $0 $5,924 less Legacy Hosting Cost of Revenue 0 1,360 0 0 1,360 less Prepaid Lease Cost 0 307 0 0 307 Adjusted Non-GAAP Cost of Revenue 2** $837 $2,229 $1,191 $0 $4,258 *Includes Hosting costs **Excluding Depreciation and R&D Expenses FY 2021 Soluna Computing 2021 FY -Reconciliation Of Non-GAAP Results

56 2021 FY -Reconciliation Of Non-GAAP Results($ in 000s) (Unaudited) Edith Marie Sophie Corporate Total Cryptocurrency revenue (GAAP) $3,648 $7,925 $2,772 $0 $14,345 Cost of cryptocurrency revenue (GAAP) 1,174 4,992 1,904 0 8,070 Depreciation 314 1,096 713 0 2,123 Project Equipment Repairs 23 0 0 0 23 Contribution Margin (Non-GAAP)* $2,810 $4,030 $1,581 $0 $8,421 plus Prepaid Lease Cost 0 307 0 0 307 plus Legacy Hosting Contribution Margin 0 25 0 0 25 Cash Contribution Margin (Non-GAAP)* $2,810 $4,361 $1,581 $0 $8,752 plus Tornado Impact (Management Estimate) 0 34 102 0 135 Cash Contribution Margin (Non-GAAP) excluding Tornado & Shutdown* $2,810 $4,394 $1,682 $0 $8,887 *Excludes R&D Expenses, SG&A Expenses FY 2021 Soluna Computing Reconciliation from Revenue and Cost of Revenue to Contribution Margin & Cash Contribution Margin (Non-GAAP)
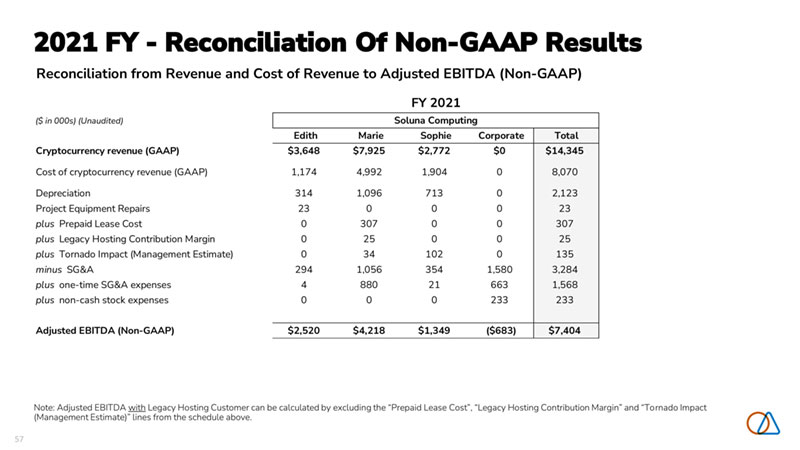
57 2021 FY -Reconciliation Of Non-GAAP Results($ in 000s) (Unaudited) Edith Marie Sophie Corporate Total Cryptocurrency revenue (GAAP) $3,648 $7,925 $2,772 $0 $14,345 Cost of cryptocurrency revenue (GAAP) 1,174 4,992 1,904 0 8,070 Depreciation 314 1,096 713 0 2,123 Project Equipment Repairs 23 0 0 0 23 plus Prepaid Lease Cost 0 307 0 0 307 plus Legacy Hosting Contribution Margin 0 25 0 0 25 plus Tornado Impact (Management Estimate) 0 34 102 0 135 minus SG&A 294 1,056 354 1,580 3,284 plus one-time SG&A expenses 4 880 21 663 1,568 plus non-cash stock expenses 0 0 0 233 233 Adjusted EBITDA (Non-GAAP) $2,520 $4,218 $1,349 ($683) $7,404 Reconciliation from Revenue and Cost of Revenue to Adjusted EBITDA (Non-GAAP) FY 2021 Soluna Computing Note: Adjusted EBITDA withLegacy Hosting Customer can be calculated by excluding the “Prepaid Lease Cost”, “Legacy Hosting Contribution Margin” and “Tornado Impact (Management Estimate)” lines from the schedule above.

58 2021 Q4 -Reconciliation Of Non-GAAP ResultsReconciliation from GAAP Revenue to Non-GAAP Revenue ($ in 000s) (Unaudited) Edith Marie Sophie Corporate Total Cryptocurrency revenue (GAAP) $864 $4,933 $2,772 $0 $8,569 less Legacy Hosting Revenue 0 579 0 0 579 Revenue (Non-GAAP) $864 $4,354 $2,772 $0 $7,990 Q4 2021 Soluna Computing
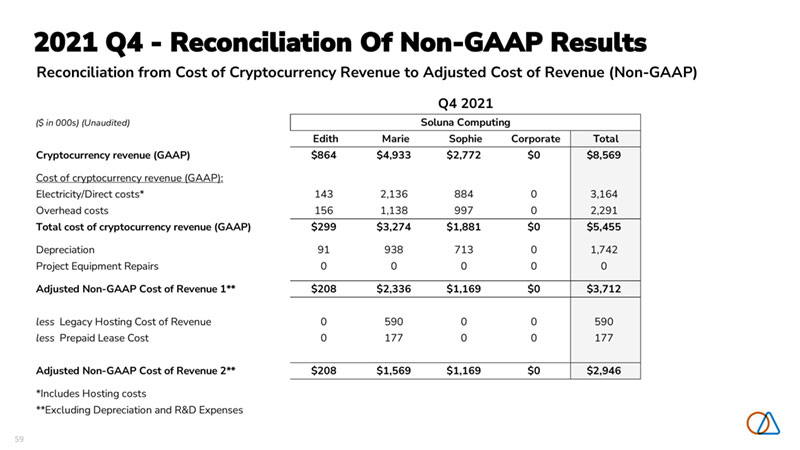
59 2021 Q4 -Reconciliation Of Non-GAAP ResultsReconciliation from Cost of Cryptocurrency Revenue to Adjusted Cost of Revenue (Non-GAAP) ($ in 000s) (Unaudited) Edith Marie Sophie Corporate Total Cryptocurrency revenue (GAAP) $864 $4,933 $2,772 $0 $8,569 Cost of cryptocurrency revenue (GAAP): Electricity/Direct costs* 143 2,136 884 0 3,164 Overhead costs 156 1,138 997 0 2,291 Total cost of cryptocurrency revenue (GAAP) $299 $3,274 $1,881 $0 $5,455 Depreciation 91 938 713 0 1,742 Project Equipment Repairs 0 0 0 0 0 Adjusted Non-GAAP Cost of Revenue 1** $208 $2,336 $1,169 $0 $3,712 less Legacy Hosting Cost of Revenue 0 590 0 0 590 less Prepaid Lease Cost 0 177 0 0 177 Adjusted Non-GAAP Cost of Revenue 2** $208 $1,569 $1,169 $0 $2,946 *Includes Hosting costs **Excluding Depreciation and R&D Expenses Q4 2021 Soluna Computing

60 2021 Q4 -Reconciliation Of Non-GAAP Results($ in 000s) (Unaudited) Edith Marie Sophie Corporate Total Cryptocurrency revenue (GAAP) $864 $4,933 $2,772 $0 $8,569 Cost of cryptocurrency revenue (GAAP) 299 3,274 1,881 0 5,455 Depreciation 91 938 713 0 1,742 Project Equipment Repairs 0 0 0 0 0 Contribution Margin (Non-GAAP)* $656 $2,597 $1,604 $0 $4,856 plus Prepaid Lease Cost 0 177 0 0 177 plus Legacy Hosting Contribution Margin 0 11 0 0 11 Cash Contribution Margin (Non-GAAP)* $656 $2,785 $1,604 $0 $5,044 plus Tornado Impact (Management Estimate) 0 34 102 0 135 Cash Contribution Margin (Non-GAAP) excluding Tornado* $656 $2,818 $1,705 $0 $5,179 *Excludes R&D Expenses, SG&A Expenses Soluna Computing Q4 2021 Reconciliation from Revenue and Cost of Revenue to Contribution Margin & Cash Contribution Margin (Non-GAAP)

61 2021 Q4 -Reconciliation Of Non-GAAP Results($ in 000s) (Unaudited) Edith Marie Sophie Corporate Total Cryptocurrency revenue (GAAP) $864 $4,933 $2,772 $0 $8,569 Cost of cryptocurrency revenue (GAAP) 299 3,274 1,881 0 $5,455 Depreciation 91 938 713 0 $1,742 Project Equipment Repairs 0 0 0 0 $0 plus Prepaid Lease Cost 0 177 0 0 $177 plus Legacy Hosting Contribution Margin 0 11 0 0 $11 plus Tornado Impact (Management Estimate) 0 34 102 0 $135 minus SG&A 86 77 42 1,192 $1,398 plus one-time SG&A expenses 0 10 21 339 $370 plus non-cash stock expense 0 0 0 233 $233 Adjusted EBITDA (Non-GAAP) $570 $2,752 $1,684 ($621) $4,384 Reconciliation from Revenue and Cost of Revenue to Adjusted EBITDA (Non-GAAP) Q4 2021 Soluna Computing Note: Adjusted EBITDA withLegacy Hosting Customer can be calculated by excluding the “Prepaid Lease Cost”, “Legacy Hosting Contribution Margin” and “Tornado Impact (Management Estimate)” lines from the schedule above.

62Reconciliation from GAAP Revenue to Non-GAAP Revenue ($ in 000s) (Unaudited) Edith Marie Sophie Corporate Total MTII Corporate Consolidated Product revenue (GAAP) $0 $0 $0 $0 $0 $1,949 $0 $1,949 Cryptocurrency revenue (GAAP) $905 $2,219 $0 $0 $3,124 $0 $0 $3,124 less Legacy Hosting Revenue 0 757 0 0 757 0 0 757 Revenue (Non-GAAP) $905 $1,463 $0 $0 $2,368 $1,949 $0 $4,317 Q3 2021 Soluna Computing 2021 Q3 -Reconciliation Of Non-GAAP Results

63Reconciliation from Cost of Cryptocurrency Revenue to Adjusted Cost of Revenue (Non-GAAP) ($ in 000s) (Unaudited) Edith Marie Sophie Corporate Total MTII Corporate Consolidated Product revenue (GAAP) $0 $0 $0 $0 $0 $1,949 $0 $1,949 Cryptocurrency revenue (GAAP) $905 $2,219 $0 $0 $3,124 $0 $0 $3,124 Cost of product revenue (GAAP) 0 0 0 0 0 661 0 661 Cost of cryptocurrency revenue (GAAP): Electricity/Direct costs* 140 1,288 0 0 1,428 0 0 1,428 Overhead costs 166 134 15 0 315 0 0 315 Total cost of cryptocurrency revenue (GAAP) $306 $1,422 $15 $0 $1,743 $0 $0 $1,743 Cost of revenue (GAAP) $306 $1,422 $15 $0 $1,743 $661 $0 $2,404 Depreciation 81 75 0 0 156 19 0 175 Project Equipment Repairs 23 0 0 0 23 0 0 23 Adjusted Non-GAAP Cost of Revenue 1** $203 $1,347 $15 $0 $1,564 $642 $0 $2,206 less Legacy Hosting Cost of Revenue 0 770 0 0 770 0 0 770 less Prepaid Lease Cost 0 130 0 0 130 0 0 130 Adjusted Non-GAAP Cost of Revenue 2** $203 $446 $15 $0 $664 $642 $0 $1,306 *Includes Hosting costs **Excluding Depreciation and R&D Expenses Q3 2021 Soluna Computing 2021 Q3 -Reconciliation Of Non-GAAP Results

64($ in 000s) (Unaudited) Edith Marie Sophie Corporate Total MTII Corporate Consolidated Product revenue (GAAP) $0 $0 $0 $0 $0 $1,949 $0 $1,949 Cryptocurrency revenue (GAAP) $905 $2,219 $0 $0 $3,124 $0 $0 $3,124 Cost of product revenue (GAAP) 0 0 0 0 0 661 0 661 Cost of cryptocurrency revenue (GAAP) 306 1,422 15 0 1,743 0 0 1,743 Cost of revenue (GAAP) $306 $1,422 $15 $0 $1,743 $661 $0 $2,404 Depreciation 81 75 0 0 156 19 0 175 Project Equipment Repairs 23 0 0 0 23 0 0 23 Contribution Margin (Non-GAAP)* $702 $873 ($15) $0 $1,560 $1,307 $0 $2,867 plus Prepaid Lease Cost 0 130 0 0 130 0 0 130 plus Legacy Hosting Contribution Margin 0 13 0 0 13 0 0 13 Cash Contribution Margin (Non-GAAP)* $702 $1,016 ($15) $0 $1,703 $1,307 $0 $3,010 Q3 2021 Reconciliation from Revenue and Cost of Revenue to Contribution Margin & Cash Contribution Margin (Non-GAAP) Soluna Computing 2021 Q3 -Reconciliation Of Non-GAAP Results
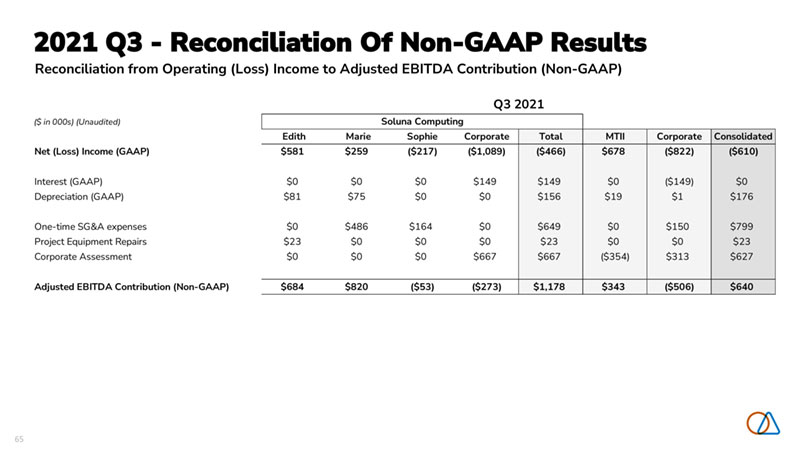
65 2021 Q3 -Reconciliation Of Non-GAAP ResultsReconciliation from Operating (Loss) Income to Adjusted EBITDA Contribution (Non-GAAP) ($ in 000s) (Unaudited) Edith Marie Sophie Corporate Total MTII Corporate Consolidated Net (Loss) Income (GAAP) $581 $259 ($217) ($1,089) ($466) $678 ($822) ($610) Interest (GAAP) $0 $0 $0 $149 $149 $0 ($149) $0 Depreciation (GAAP) $81 $75 $0 $0 $156 $19 $1 $176 One-time SG&A expenses $0 $486 $164 $0 $649 $0 $150 $799 Project Equipment Repairs $23 $0 $0 $0 $23 $0 $0 $23 Corporate Assessment $0 $0 $0 $667 $667 ($354) $313 $627 Adjusted EBITDA Contribution (Non-GAAP) $684 $820 ($53) ($273) $1,178 $343 ($506) $640 Q3 2021 Soluna Computing
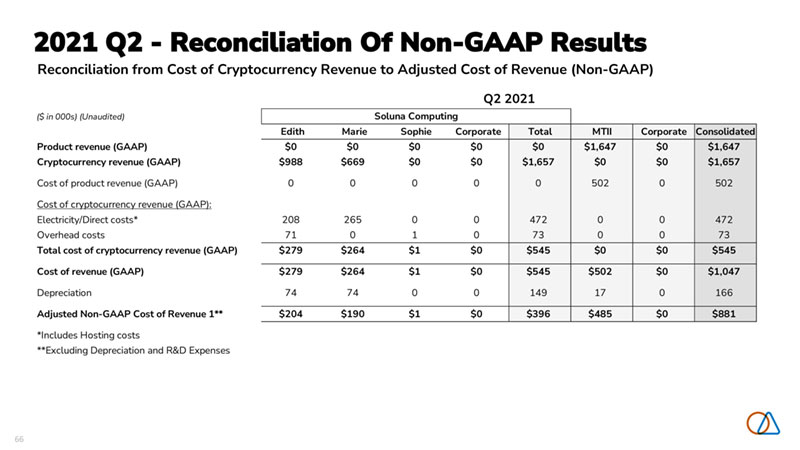
66Reconciliation from Cost of Cryptocurrency Revenue to Adjusted Cost of Revenue (Non-GAAP) ($ in 000s) (Unaudited) Edith Marie Sophie Corporate Total MTII Corporate Consolidated Product revenue (GAAP) $0 $0 $0 $0 $0 $1,647 $0 $1,647 Cryptocurrency revenue (GAAP) $988 $669 $0 $0 $1,657 $0 $0 $1,657 Cost of product revenue (GAAP) 0 0 0 0 0 502 0 502 Cost of cryptocurrency revenue (GAAP): Electricity/Direct costs* 208 265 0 0 472 0 0 472 Overhead costs 71 0 1 0 73 0 0 73 Total cost of cryptocurrency revenue (GAAP) $279 $264 $1 $0 $545 $0 $0 $545 Cost of revenue (GAAP) $279 $264 $1 $0 $545 $502 $0 $1,047 Depreciation 74 74 0 0 149 17 0 166 Adjusted Non-GAAP Cost of Revenue 1** $204 $190 $1 $0 $396 $485 $0 $881 *Includes Hosting costs **Excluding Depreciation and R&D Expenses Q2 2021 Soluna Computing 2021 Q2 -Reconciliation Of Non-GAAP Results

67Reconciliation from Revenue and Cost of Revenue to Contribution Margin (Non-GAAP) ($ in 000s) (Unaudited) Edith Marie Sophie Corporate Total MTII Corporate Consolidated Product revenue (GAAP) $0 $0 $0 $0 $0 $1,647 $0 $1,647 Cryptocurrency revenue (GAAP) $988 $669 $0 $0 $1,657 $0 $0 $1,657 Cost of product revenue (GAAP) 0 0 0 0 0 502 0 502 Cost of cryptocurrency revenue (GAAP) 279 264 1 0 545 0 0 545 Cost of revenue (GAAP) $279 $264 $1 $0 $545 $502 $0 $1,047 Depreciation 74 74 0 0 149 17 0 166 Contribution Margin (Non-GAAP)* $784 $478 ($1) $0 $1,261 $1,162 $0 $2,423 *Excludes R&D Expenses, SG&A Expenses Soluna Computing Q2 2021 2021 Q2 -Reconciliation Of Non-GAAP Results
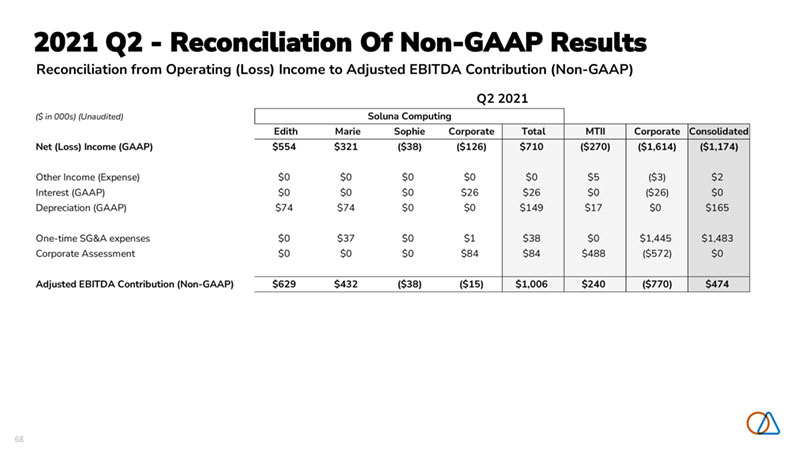
68Reconciliation from Operating (Loss) Income to Adjusted EBITDA Contribution (Non-GAAP) ($ in 000s) (Unaudited) Edith Marie Sophie Corporate Total MTII Corporate Consolidated Net (Loss) Income (GAAP) $554 $321 ($38) ($126) $710 ($270) ($1,614) ($1,174) Other Income (Expense) $0 $0 $0 $0 $0 $5 ($3) $2 Interest (GAAP) $0 $0 $0 $26 $26 $0 ($26) $0 Depreciation (GAAP) $74 $74 $0 $0 $149 $17 $0 $165 One-time SG&A expenses $0 $37 $0 $1 $38 $0 $1,445 $1,483 Corporate Assessment $0 $0 $0 $84 $84 $488 ($572) $0 Adjusted EBITDA Contribution (Non-GAAP) $629 $432 ($38) ($15) $1,006 $240 ($770) $474 Q2 2021 Soluna Computing 2021 Q2 -Reconciliation Of Non-GAAP Results

69Reconciliation from Cost of Cryptocurrency Revenue to Adjusted Cost of Revenue (Non-GAAP) ($ in 000s) (Unaudited) Edith Marie Sophie Corporate Total MTII Corporate Consolidated Product revenue (GAAP) $0 $0 $0 $0 $0 $1,337 $0 $1,337 Cryptocurrency revenue (GAAP) $891 $104 $0 $0 $995 $0 $0 $995 Cost of product revenue (GAAP) 0 0 0 0 0 452 0 452 Cost of cryptocurrency revenue (GAAP): Electricity/Direct costs* 120 23 0 0 143 0 0 143 Overhead costs 170 9 6 0 185 0 0 185 Total cost of cryptocurrency revenue (GAAP) $290 $31 $7 $0 $328 $0 $0 $328 Cost of revenue (GAAP) $290 $31 $7 $0 $328 $452 $0 $780 Depreciation 68 8 0 0 76 17 0 93 Adjusted Non-GAAP Cost of Revenue 1** $222 $23 $7 $0 $251 $435 $0 $687 *Includes Hosting costs **Excluding Depreciation and R&D Expenses Q1 2021 Soluna Computing 2021 Q1 -Reconciliation Of Non-GAAP Results

70Reconciliation from Revenue and Cost of Revenue to Contribution Margin (Non-GAAP) ($ in 000s) (Unaudited) Edith Marie Sophie Corporate Total MTII Corporate Consolidated Product revenue (GAAP) $0 $0 $0 $0 $0 $1,337 $0 $1,337 Cryptocurrency revenue (GAAP) $891 $104 $0 $0 $995 $0 $0 $995 Cost of product revenue (GAAP) 0 0 0 0 0 452 0 452 Cost of cryptocurrency revenue (GAAP) 290 31 7 0 328 0 0 328 Cost of revenue (GAAP) $290 $31 $7 $0 $328 $452 $0 $780 Depreciation 68 8 0 0 76 17 0 93 Contribution Margin (Non-GAAP)* $669 $81 ($7) $0 $744 $902 $0 $1,645 *Excludes R&D Expenses, SG&A Expenses Soluna Computing Q1 2021 2021 Q1 -Reconciliation Of Non-GAAP Results

71Reconciliation from Operating (Loss) Income to Adjusted EBITDA Contribution (Non-GAAP) ($ in 000s) (Unaudited) Edith Marie Sophie Corporate Total MTII Corporate Consolidated Operating (Loss) Income (GAAP) $566 ($287) ($170) ($48) $62 ($402) ($331) ($671) Depreciation (GAAP) $68 $8 $0 $0 $76 $17 $0 $93 One-time SG&A expenses $4 $347 $161 $0 $512 $0 $249 $761 Corporate Assessment $0 $0 $0 $42 $42 $361 ($403) $0 Adjusted EBITDA Contribution (Non-GAAP) $638 $68 ($9) ($45) $693 ($24) ($485) $183 Q1 2021 Soluna Computing 2021 Q1 -Reconciliation Of Non-GAAP Results

72 The future of renewable energyis computing.

73 Learn more at solunacomputing.com
Serious News for Serious Traders! Try StreetInsider.com Premium Free!
You May Also Be Interested In
- Port Houston Regular Commission Meeting
- Cybeats Responds to OTC Markets Request on Recent Promotional Activity
- Peralta Community College District Seeks More Outstanding Leaders
Create E-mail Alert Related Categories
SEC FilingsSign up for StreetInsider Free!
Receive full access to all new and archived articles, unlimited portfolio tracking, e-mail alerts, custom newswires and RSS feeds - and more!
