

Form 8-K SOUTH PLAINS FINANCIAL, For: Dec 08
 Tweet
Tweet Share
ShareExhibit 99.1
South Plains Financial Investor Presentation December 2021 1
Safe Harbor Statement and Other Disclosures FORWARD-LOOKING STATEMENTSThis presentation
contains, and future oral and written statements of South Plains Financial, Inc. (“South Plains” or the “Company”) and City Bank (“City Bank” or the “Bank”) may contain, statements about future events that constitute forward-looking statements
within the meaning of the Private Securities Litigation Reform Act of 1995. These forward-looking statements reflect South Plains’ current views with respect to, among other things, future events and South Plains’ financial performance. Any
statements about South Plains’ expectations, beliefs, plans, predictions, forecasts, objectives, assumptions or future events or performance are not historical facts and may be forward-looking. These statements are often, but not always, made
through the use of words or phrases such as “anticipate,” “believes,” “can,” “could,” “may,” “predicts,” “potential,” “should,” “will,” “estimate,” “plans,” “projects,” “continuing,” “ongoing,” “expects,” “intends” and similar words or phrases.
Forward-looking statements include, but are not limited to: (i) projections and estimates of revenues, expenses, income or loss, earnings or loss per share, and other financial items, (ii) statements of plans, objectives and expectations of
South Plains or its management, (iii) statements of future economic performance, and (iv) statements of assumptions underlying such statements. Forward-looking statements should not be relied on because they involve known and unknown risks,
uncertainties and other factors, some of which are beyond the control of South Plains and City Bank. These risks, uncertainties and other factors may cause the actual results, performance, and achievements of South Plains and City Bank to be
materially different from the anticipated future results, performance or achievements expressed in, or implied by, the forward-looking statements. Factors that could cause such differences include, but are not limited to, local, regional,
national and international economic conditions, the extent of the impact of the COVID-19 pandemic, including the impact of actions taken by governmental and regulatory authorities in response to such pandemic, such as the Coronavirus Aid,
Relief, and Economic Security Act and subsequent related legislations, and the programs established thereunder, and City Bank’s participation in such programs, volatility of the financial markets, changes in interest rates, regulatory
considerations, competition and market expansion opportunities, changes in non-interest expenditures or in the anticipated benefits of such expenditures, the receipt of required regulatory approvals, changes in non-performing assets and
charge-offs, adequacy of loan loss reserves, changes in tax laws, current or future litigation, regulatory examinations or other legal and/or regulatory actions, the impact of any tariffs, terrorist threats and attacks, acts of war or threats
thereof or other pandemics. Therefore, South Plains can give no assurance that the results contemplated in the forward-looking statements will be realized and readers are cautioned not to place undue reliance on the forward-looking statements
contained in this presentation. For more information about these factors, please see South Plains’ reports filed with or furnished to the U.S. Securities and Exchange Commission (the “SEC”), including South Plains’ most recent Annual Report on
Form 10-K and Quarterly Reports on Form 10-Q on file with the SEC, including the sections entitled "Risk Factors" and "Management's Discussion and Analysis of Financial Condition and Results of Operations." Further, any forward-looking
statement speaks only as of the date on which it is made and South Plains undertakes no obligation to update or revise any forward-looking statement to reflect events or circumstances after the date on which the statement is made or to reflect
the occurrence of unanticipated events, except as required by law. All forward-looking statements, express or implied, herein are qualified in their entirety by this cautionary statement.NON-GAAP FINANCIAL MEASURESManagement believes that
certain non-GAAP performance measures used in this presentation provide meaningful information about underlying trends in its business and operations. Non-GAAP financial measures should be viewed in addition to, and not as an alternative for,
SPFI’s reported results prepared in accordance with GAAP. Numbers in this presentation may not sum due to rounding. 2
New Mexico Texas Dallas Bryan /College Station Houston Midland Odessa El
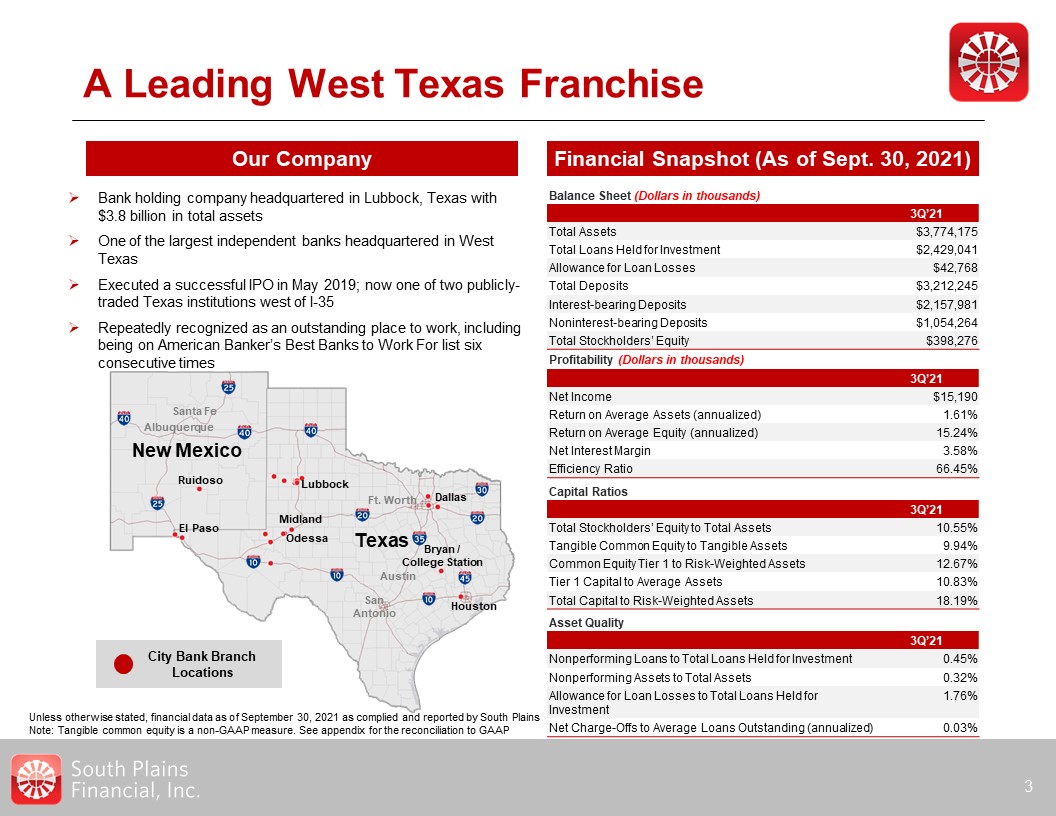
Paso Lubbock Ruidoso SanAntonio Ft. Worth Austin Albuquerque Santa Fe City Bank Branch Locations A Leading West Texas Franchise 3 Financial Snapshot (As of Sept. 30, 2021) Our Company Bank holding company headquartered in
Lubbock, Texas with $3.8 billion in total assetsOne of the largest independent banks headquartered in West TexasExecuted a successful IPO in May 2019; now one of two publicly-traded Texas institutions west of I-35Repeatedly recognized as an
outstanding place to work, including being on American Banker’s Best Banks to Work For list six consecutive times Balance Sheet (Dollars in thousands) 3Q’21 Total Assets $3,774,175 Total Loans Held for Investment $2,429,041 Allowance
for Loan Losses $42,768 Total Deposits $3,212,245 Interest-bearing Deposits $2,157,981 Noninterest-bearing Deposits $1,054,264 Total Stockholders’ Equity $398,276 Profitability (Dollars in thousands) 3Q’21 Net
Income $15,190 Return on Average Assets (annualized) 1.61% Return on Average Equity (annualized) 15.24% Net Interest Margin 3.58% Efficiency Ratio 66.45% Capital Ratios 3Q’21 Total Stockholders’ Equity to Total
Assets 10.55% Tangible Common Equity to Tangible Assets 9.94% Common Equity Tier 1 to Risk-Weighted Assets 12.67% Tier 1 Capital to Average Assets 10.83% Total Capital to Risk-Weighted Assets 18.19% Asset
Quality 3Q’21 Nonperforming Loans to Total Loans Held for Investment 0.45% Nonperforming Assets to Total Assets 0.32% Allowance for Loan Losses to Total Loans Held for Investment 1.76% Net Charge-Offs to Average Loans Outstanding
(annualized) 0.03% Unless otherwise stated, financial data as of September 30, 2021 as complied and reported by South PlainsNote: Tangible common equity is a non-GAAP measure. See appendix for the reconciliation to GAAP
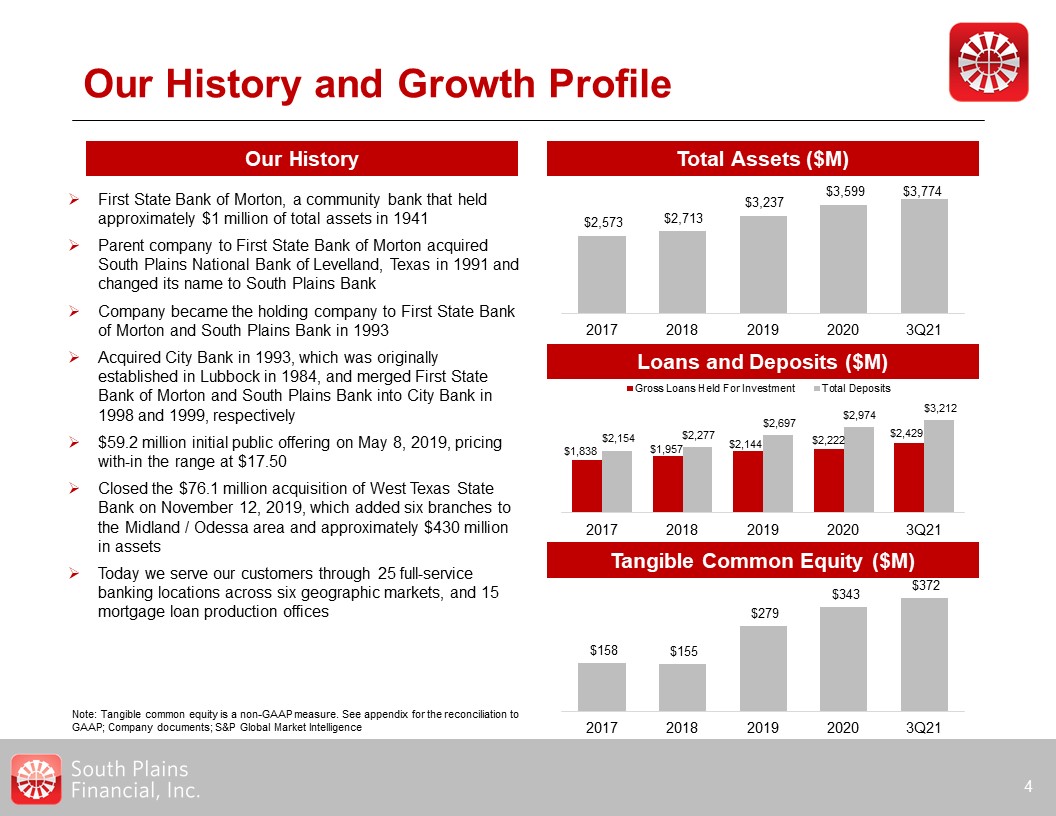
Our History and Growth Profile 4 Our History Loans and Deposits ($M) First State Bank
of Morton, a community bank that held approximately $1 million of total assets in 1941Parent company to First State Bank of Morton acquired South Plains National Bank of Levelland, Texas in 1991 and changed its name to South Plains BankCompany
became the holding company to First State Bank of Morton and South Plains Bank in 1993Acquired City Bank in 1993, which was originally established in Lubbock in 1984, and merged First State Bank of Morton and South Plains Bank into City Bank in
1998 and 1999, respectively$59.2 million initial public offering on May 8, 2019, pricing with-in the range at $17.50Closed the $76.1 million acquisition of West Texas State Bank on November 12, 2019, which added six branches to the Midland /
Odessa area and approximately $430 million in assetsToday we serve our customers through 25 full-service banking locations across six geographic markets, and 15 mortgage loan production offices Note: Tangible common equity is a non-GAAP
measure. See appendix for the reconciliation toGAAP; Company documents; S&P Global Market Intelligence Tangible Common Equity ($M) Total Assets ($M)

Investment Highlights 5 Improving Profitability Organic Growth Strong Credit
Culture Enterprise Risk Management Experienced Management Team Emphasize Community Banking Capital Allocation to Drive Value 1 2 3 4 5 6 7
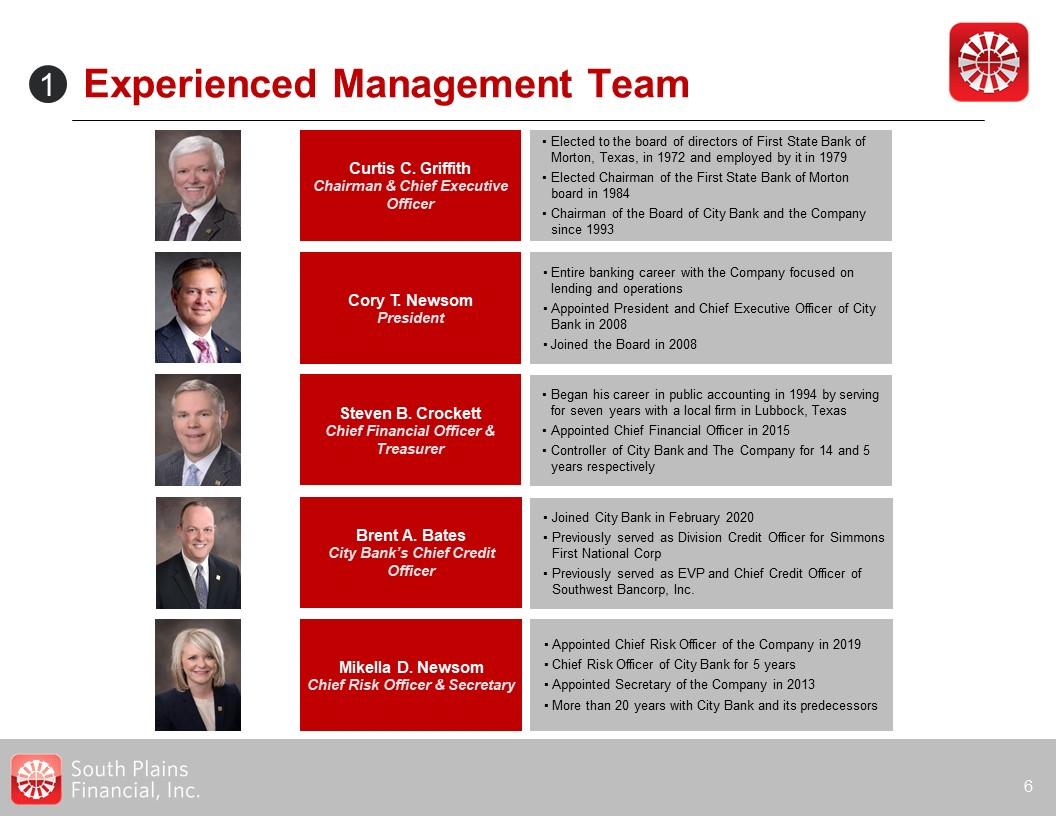
Experienced Management Team 6 Curtis C. GriffithChairman & Chief Executive
Officer Elected to the board of directors of First State Bank of Morton, Texas, in 1972 and employed by it in 1979Elected Chairman of the First State Bank of Morton board in 1984Chairman of the Board of City Bank and the Company since
1993 Steven B. CrockettChief Financial Officer & Treasurer Began his career in public accounting in 1994 by serving for seven years with a local firm in Lubbock, TexasAppointed Chief Financial Officer in 2015Controller of City Bank and
The Company for 14 and 5 years respectively Mikella D. NewsomChief Risk Officer & Secretary Appointed Chief Risk Officer of the Company in 2019Chief Risk Officer of City Bank for 5 years Appointed Secretary of the Company in 2013More than
20 years with City Bank and its predecessors Cory T. NewsomPresident Entire banking career with the Company focused on lending and operationsAppointed President and Chief Executive Officer of City Bank in 2008Joined the Board in 2008 Brent
A. BatesCity Bank’s Chief Credit Officer Joined City Bank in February 2020Previously served as Division Credit Officer for Simmons First National CorpPreviously served as EVP and Chief Credit Officer of Southwest Bancorp, Inc. 1
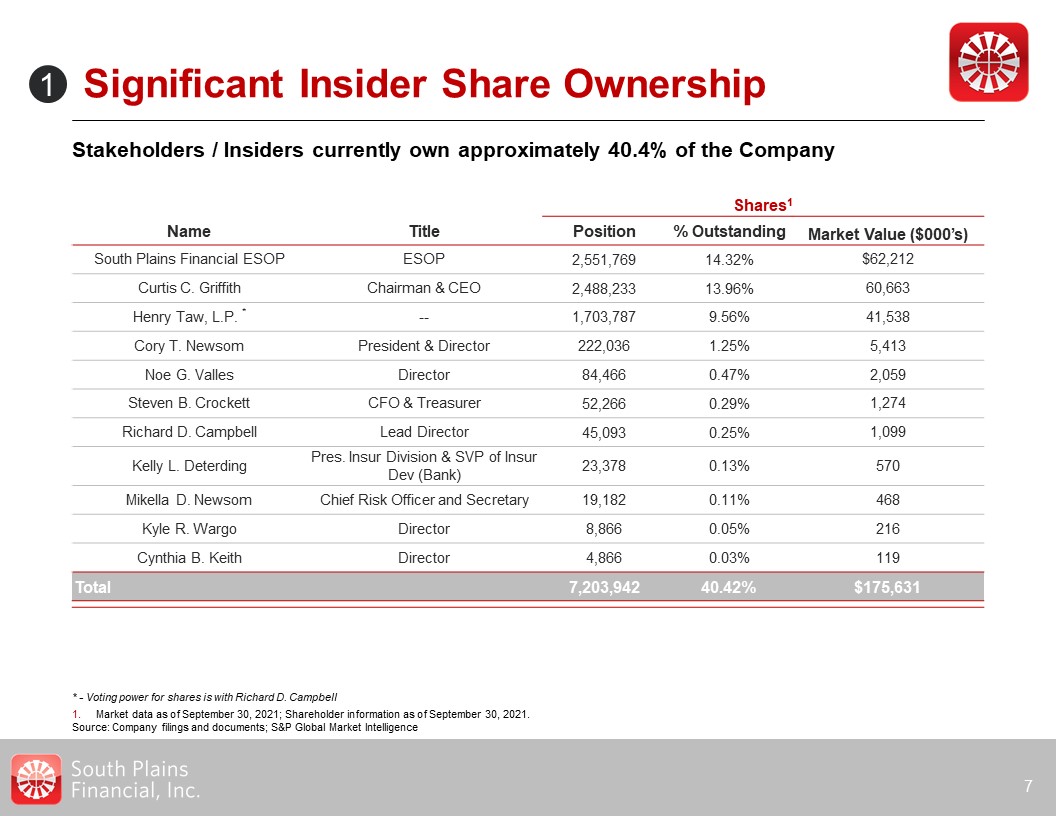
Significant Insider Share Ownership Stakeholders / Insiders currently own approximately
40.4% of the Company 7 Shares1 Name Title Position % Outstanding Market Value ($000’s) South Plains Financial ESOP ESOP 2,551,769 14.32% $62,212 Curtis C. Griffith Chairman & CEO 2,488,233 13.96% 60,663 Henry
Taw, L.P. * -- 1,703,787 9.56% 41,538 Cory T. Newsom President & Director 222,036 1.25% 5,413 Noe G. Valles Director 84,466 0.47% 2,059 Steven B. Crockett CFO & Treasurer 52,266 0.29% 1,274 Richard D. Campbell Lead
Director 45,093 0.25% 1,099 Kelly L. Deterding Pres. Insur Division & SVP of Insur Dev (Bank) 23,378 0.13% 570 Mikella D. Newsom Chief Risk Officer and Secretary 19,182 0.11% 468 Kyle R.
Wargo Director 8,866 0.05% 216 Cynthia B. Keith Director 4,866 0.03% 119 Total 7,203,942 40.42% $175,631 Market data as of September 30, 2021; Shareholder information as of September 30, 2021. Source: Company filings
and documents; S&P Global Market Intelligence 1 * - Voting power for shares is with Richard D. Campbell
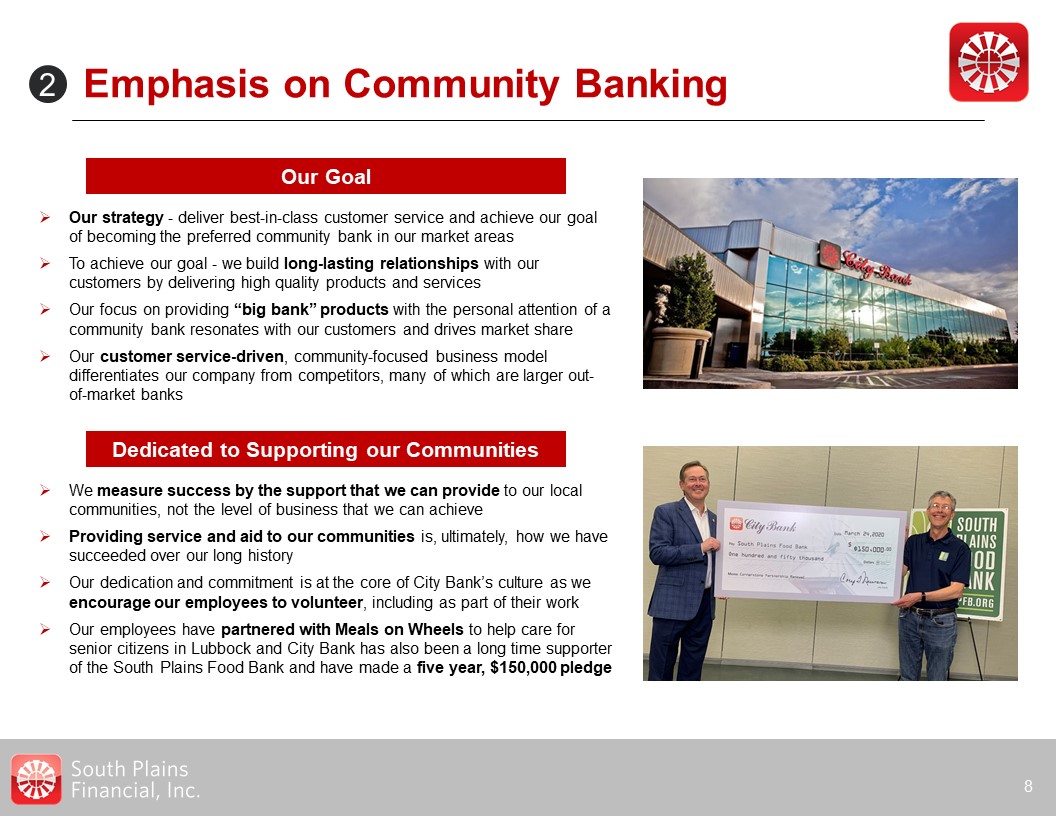
Emphasis on Community Banking 8 2 Our strategy - deliver best-in-class customer service
and achieve our goal of becoming the preferred community bank in our market areasTo achieve our goal - we build long-lasting relationships with our customers by delivering high quality products and services Our focus on providing “big bank”
products with the personal attention of a community bank resonates with our customers and drives market shareOur customer service-driven, community-focused business model differentiates our company from competitors, many of which are larger
out-of-market banks Our Goal We measure success by the support that we can provide to our local communities, not the level of business that we can achieveProviding service and aid to our communities is, ultimately, how we have succeeded over
our long historyOur dedication and commitment is at the core of City Bank’s culture as we encourage our employees to volunteer, including as part of their workOur employees have partnered with Meals on Wheels to help care for senior citizens in
Lubbock and City Bank has also been a long time supporter of the South Plains Food Bank and have made a five year, $150,000 pledge Dedicated to Supporting our Communities
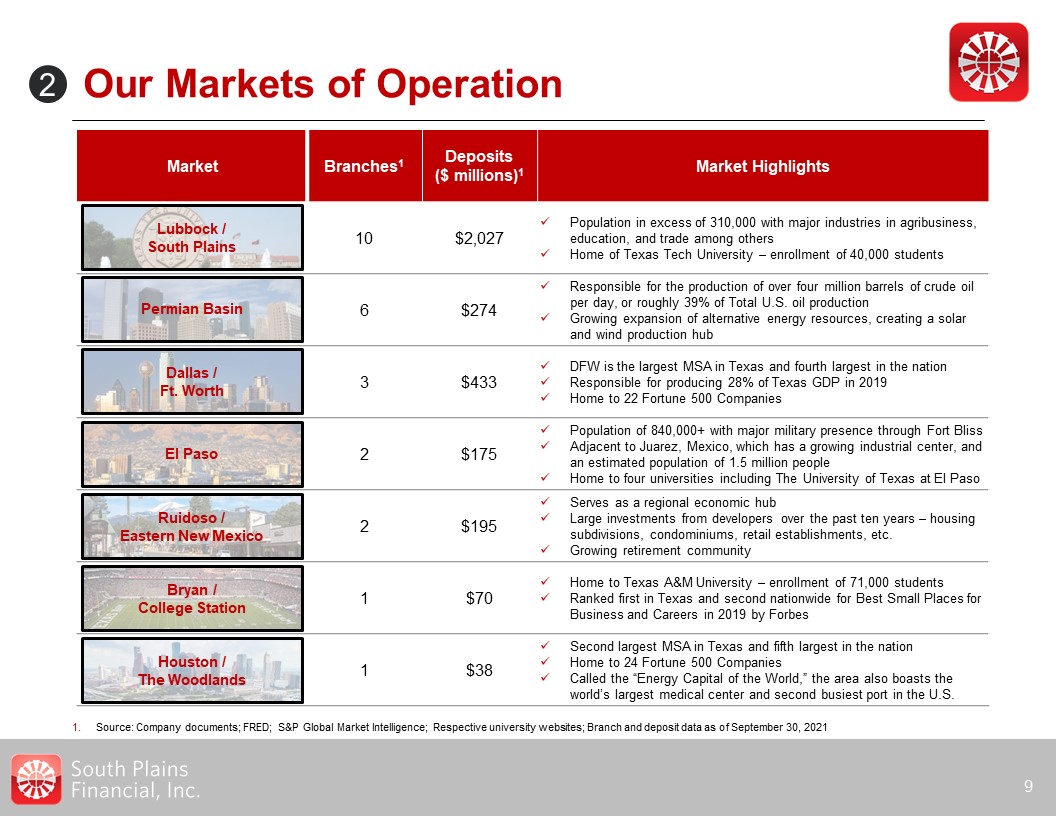
Market Branches1 Deposits($ millions)1 Market Highlights 10 $2,027 Population in
excess of 310,000 with major industries in agribusiness, education, and trade among othersHome of Texas Tech University – enrollment of 40,000 students 6 $274 Responsible for the production of over four million barrels of crude oil per
day, or roughly 39% of Total U.S. oil productionGrowing expansion of alternative energy resources, creating a solar and wind production hub 3 $433 DFW is the largest MSA in Texas and fourth largest in the nationResponsible for producing
28% of Texas GDP in 2019Home to 22 Fortune 500 Companies 2 $175 Population of 840,000+ with major military presence through Fort BlissAdjacent to Juarez, Mexico, which has a growing industrial center, and an estimated population of 1.5
million peopleHome to four universities including The University of Texas at El Paso 2 $195 Serves as a regional economic hubLarge investments from developers over the past ten years – housing subdivisions, condominiums, retail
establishments, etc.Growing retirement community 1 $70 Home to Texas A&M University – enrollment of 71,000 studentsRanked first in Texas and second nationwide for Best Small Places for Business and Careers in 2019 by
Forbes 1 $38 Second largest MSA in Texas and fifth largest in the nationHome to 24 Fortune 500 CompaniesCalled the “Energy Capital of the World,” the area also boasts the world’s largest medical center and second busiest port in the
U.S. Ruidoso /Eastern New Mexico El Paso Our Markets of Operation 9 2 Source: Company documents; FRED; S&P Global Market Intelligence; Respective university websites; Branch and deposit data as of September 30, 2021 Permian
Basin Dallas /Ft. Worth Bryan /College Station Houston /The Woodlands Lubbock /South Plains Find a stat
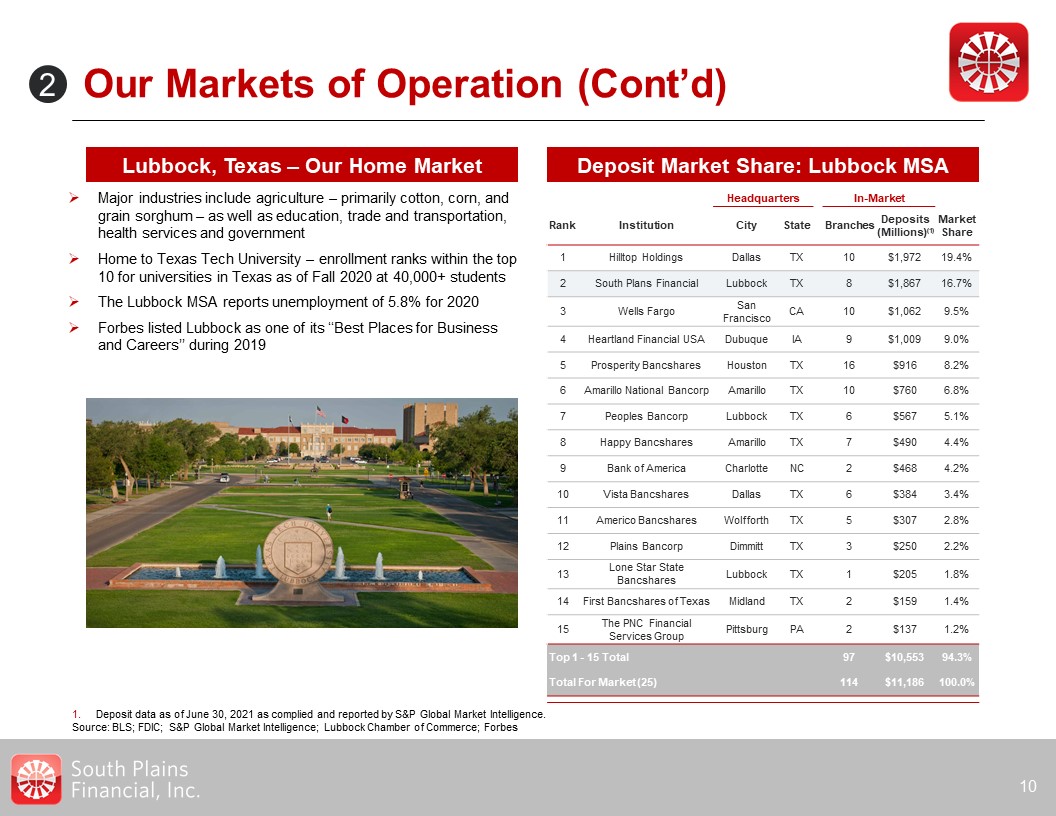
Our Markets of Operation (Cont’d) 10 Deposit Market Share: Lubbock MSA Lubbock, Texas
– Our Home Market Major industries include agriculture – primarily cotton, corn, and grain sorghum – as well as education, trade and transportation, health services and governmentHome to Texas Tech University – enrollment ranks within the top
10 for universities in Texas as of Fall 2020 at 40,000+ studentsThe Lubbock MSA reports unemployment of 5.8% for 2020Forbes listed Lubbock as one of its ‘‘Best Places for Business and Careers’’ during
2019 Headquarters In-Market Rank Institution City State Branches Deposits (Millions)(1) Market Share 1 Hilltop Holdings Dallas TX 10 $1,972 19.4% 2 South Plans
Financial Lubbock TX 8 $1,867 16.7% 3 Wells Fargo San Francisco CA 10 $1,062 9.5% 4 Heartland Financial USA Dubuque IA 9 $1,009 9.0% 5 Prosperity Bancshares Houston TX 16 $916 8.2% 6 Amarillo National
Bancorp Amarillo TX 10 $760 6.8% 7 Peoples Bancorp Lubbock TX 6 $567 5.1% 8 Happy Bancshares Amarillo TX 7 $490 4.4% 9 Bank of America Charlotte NC 2 $468 4.2% 10 Vista
Bancshares Dallas TX 6 $384 3.4% 11 Americo Bancshares Wolfforth TX 5 $307 2.8% 12 Plains Bancorp Dimmitt TX 3 $250 2.2% 13 Lone Star State Bancshares Lubbock TX 1 $205 1.8% 14 First Bancshares of
Texas Midland TX 2 $159 1.4% 15 The PNC Financial Services Group Pittsburg PA 2 $137 1.2% Top 1 - 15 Total 97 $10,553 94.3% Total For Market (25) 114 $11,186 100.0% 2 Deposit data as of
June 30, 2021 as complied and reported by S&P Global Market Intelligence. Source: BLS; FDIC; S&P Global Market Intelligence; Lubbock Chamber of Commerce; Forbes
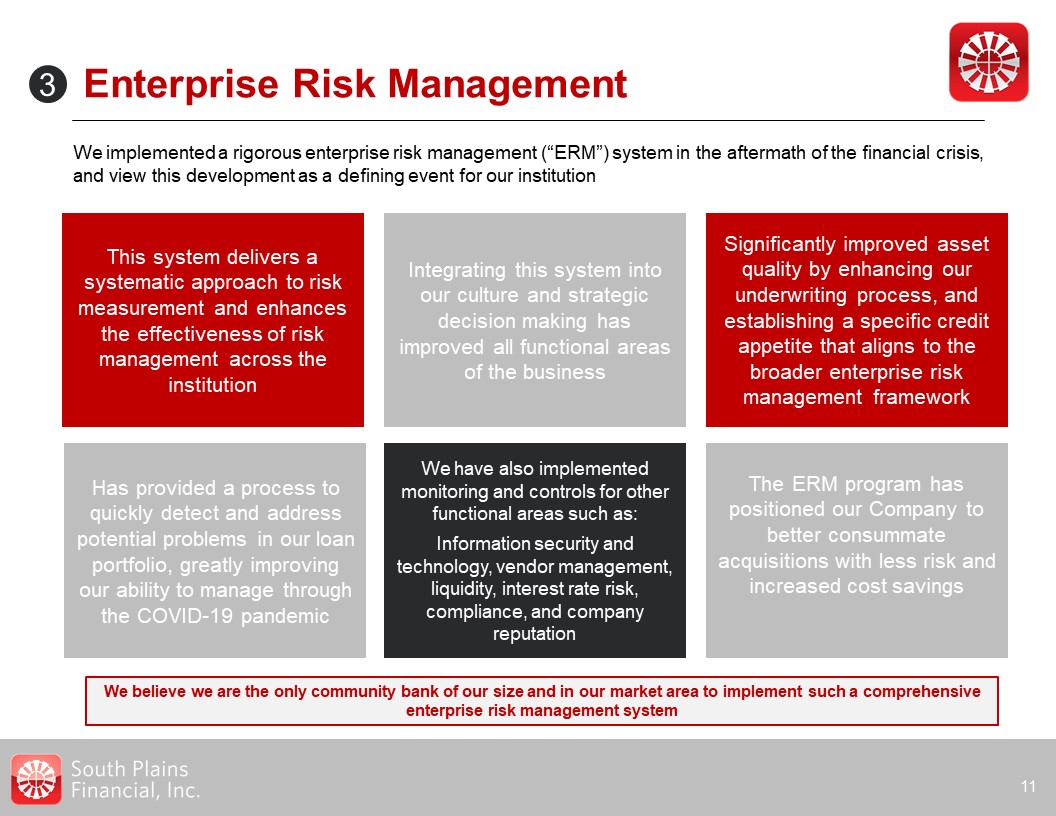
Enterprise Risk Management 11 3 We implemented a rigorous enterprise risk management
(“ERM”) system in the aftermath of the financial crisis, and view this development as a defining event for our institution This system delivers a systematic approach to risk measurement and enhances the effectiveness of risk management across
the institution Integrating this system into our culture and strategic decision making has improved all functional areas of the business Significantly improved asset quality by enhancing our underwriting process, and establishing a specific
credit appetite that aligns to the broader enterprise risk management framework Has provided a process to quickly detect and address potential problems in our loan portfolio, greatly improving our ability to manage through the COVID-19
pandemic We have also implemented monitoring and controls for other functional areas such as:Information security and technology, vendor management, liquidity, interest rate risk, compliance, and company reputation The ERM program has
positioned our Company to better consummate acquisitions with less risk and increased cost savings We believe we are the only community bank of our size and in our market area to implement such a comprehensive enterprise risk management
system
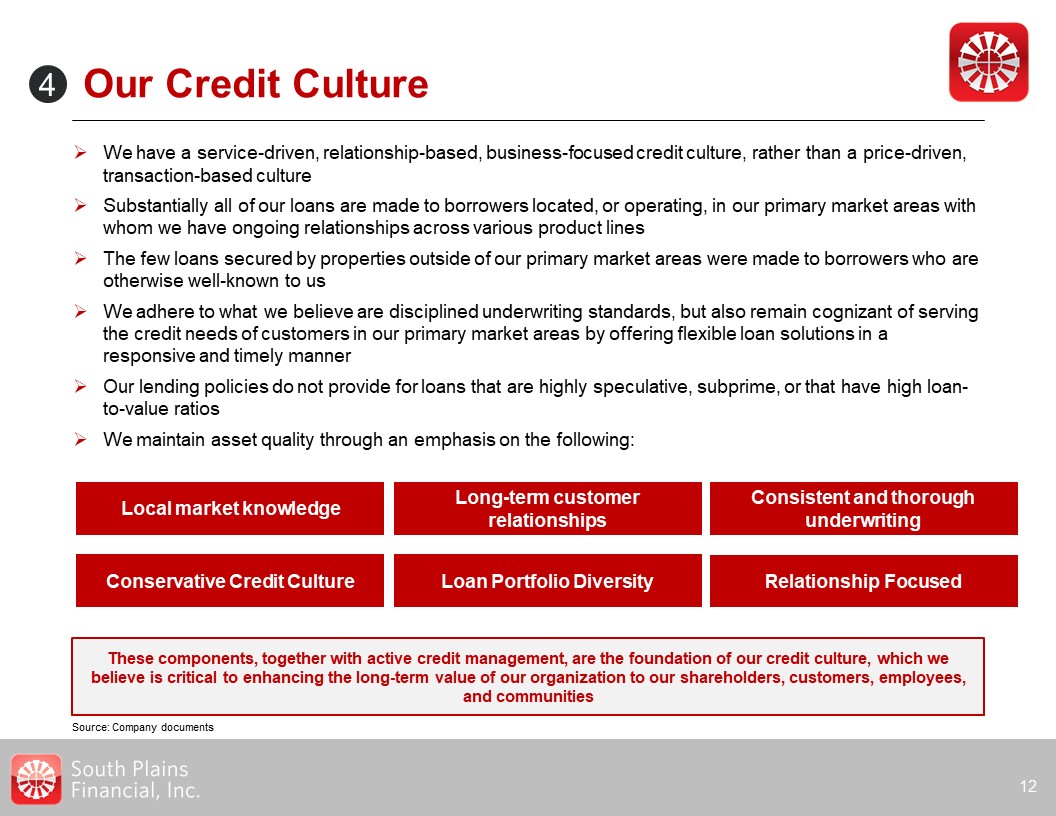
Our Credit Culture 12 We have a service-driven, relationship-based, business-focused
credit culture, rather than a price-driven, transaction-based cultureSubstantially all of our loans are made to borrowers located, or operating, in our primary market areas with whom we have ongoing relationships across various product linesThe
few loans secured by properties outside of our primary market areas were made to borrowers who are otherwise well-known to usWe adhere to what we believe are disciplined underwriting standards, but also remain cognizant of serving the credit
needs of customers in our primary market areas by offering flexible loan solutions in a responsive and timely mannerOur lending policies do not provide for loans that are highly speculative, subprime, or that have high loan-to-value ratiosWe
maintain asset quality through an emphasis on the following: These components, together with active credit management, are the foundation of our credit culture, which we believe is critical to enhancing the long-term value of our organization
to our shareholders, customers, employees, and communities 4 Local market knowledge Long-term customer relationships Consistent and thorough underwriting Conservative Credit Culture Loan Portfolio Diversity Relationship
Focused Source: Company documents
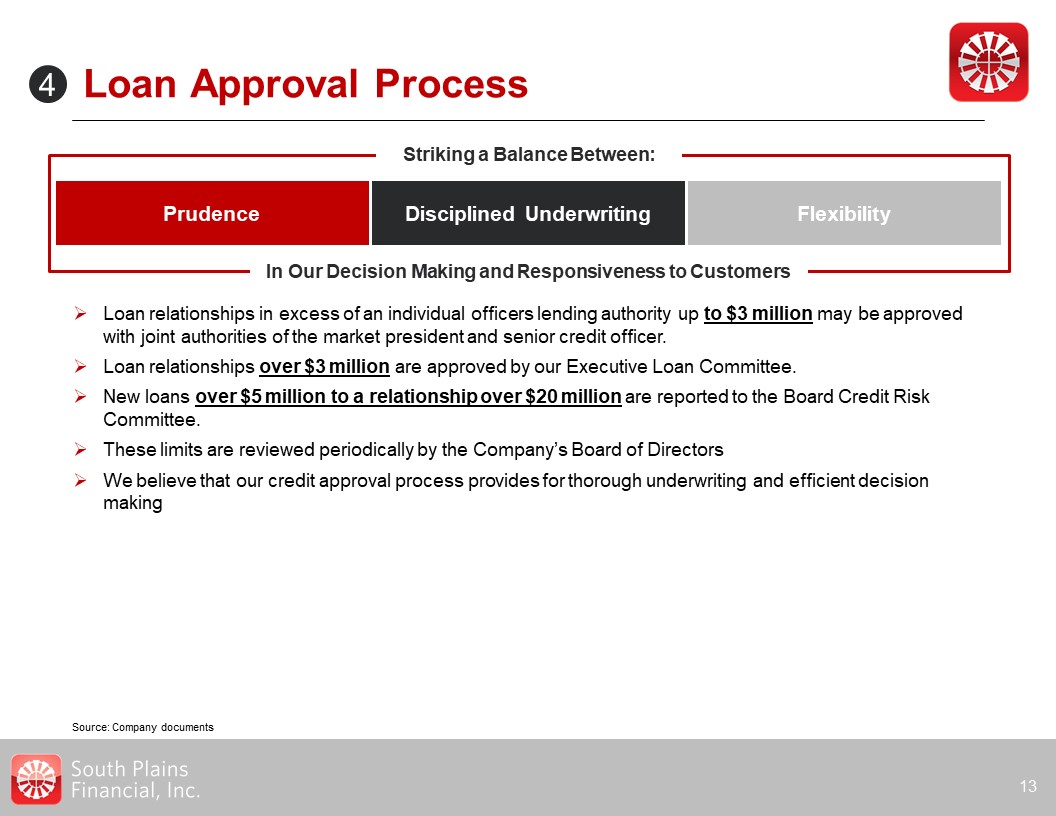
Loan Approval Process 13 Striking a Balance Between: In Our Decision Making and
Responsiveness to Customers Prudence Disciplined Underwriting Flexibility Loan relationships in excess of an individual officers lending authority up to $3 million may be approved with joint authorities of the market president and senior
credit officer.Loan relationships over $3 million are approved by our Executive Loan Committee.New loans over $5 million to a relationship over $20 million are reported to the Board Credit Risk Committee. These limits are reviewed periodically
by the Company’s Board of DirectorsWe believe that our credit approval process provides for thorough underwriting and efficient decision making 4 Source: Company documents
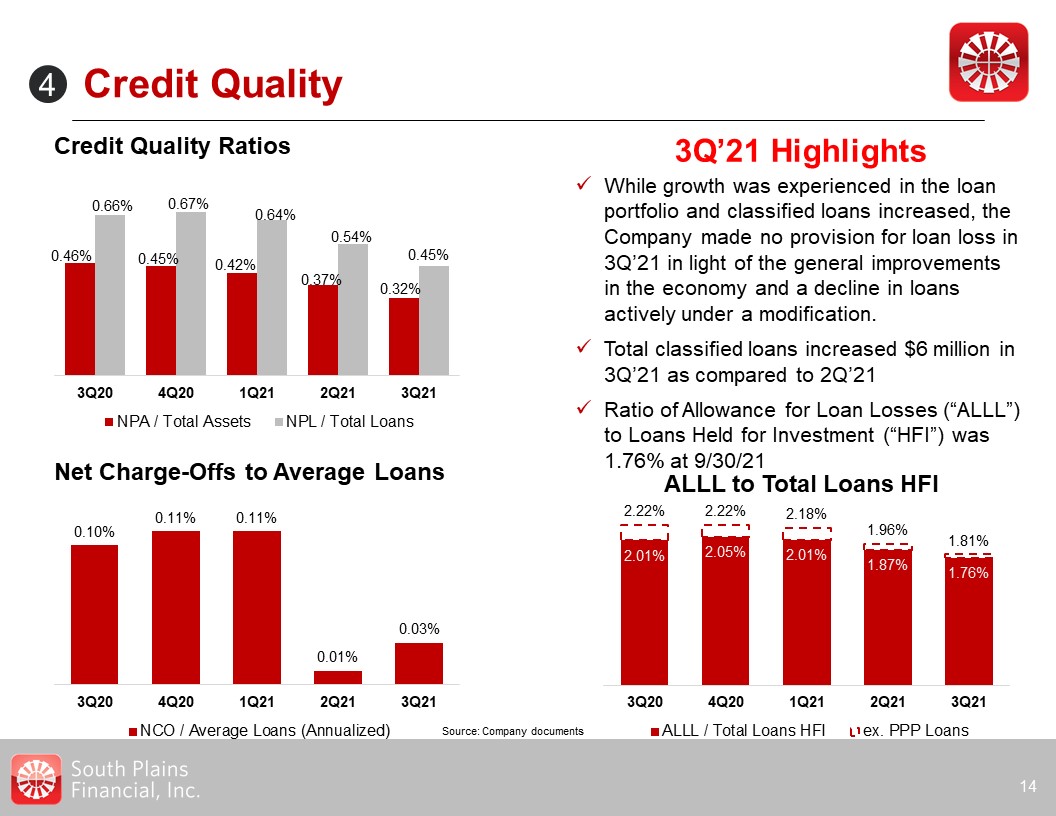
Credit Quality 14 3Q’21 Highlights Credit Quality Ratios While growth was experienced
in the loan portfolio and classified loans increased, the Company made no provision for loan loss in 3Q’21 in light of the general improvements in the economy and a decline in loans actively under a modification.Total classified loans increased
$6 million in 3Q’21 as compared to 2Q’21Ratio of Allowance for Loan Losses (“ALLL”) to Loans Held for Investment (“HFI”) was 1.76% at 9/30/21 Net Charge-Offs to Average Loans ALLL to Total Loans HFI Source: Company documents 4
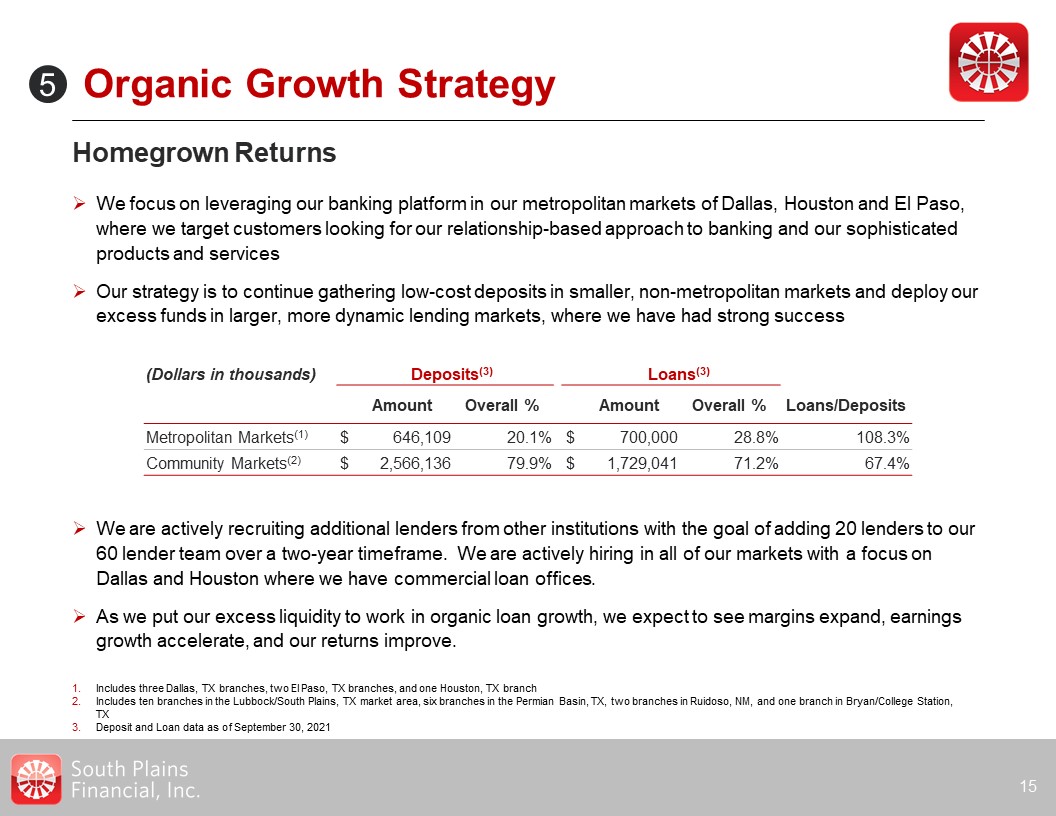
We are actively recruiting additional lenders from other institutions with the goal of adding
20 lenders to our 60 lender team over a two-year timeframe. We are actively hiring in all of our markets with a focus on Dallas and Houston where we have commercial loan offices. As we put our excess liquidity to work in organic loan growth, we
expect to see margins expand, earnings growth accelerate, and our returns improve. Organic Growth Strategy Homegrown Returns We focus on leveraging our banking platform in our metropolitan markets of Dallas, Houston and El Paso, where we
target customers looking for our relationship-based approach to banking and our sophisticated products and services Our strategy is to continue gathering low-cost deposits in smaller, non-metropolitan markets and deploy our excess funds in
larger, more dynamic lending markets, where we have had strong success 15 Includes three Dallas, TX branches, two El Paso, TX branches, and one Houston, TX branchIncludes ten branches in the Lubbock/South Plains, TX market area, six
branches in the Permian Basin, TX, two branches in Ruidoso, NM, and one branch in Bryan/College Station, TXDeposit and Loan data as of September 30, 2021 (Dollars in thousands) Deposits(3) Loans(3) Amount Overall
% Amount Overall % Loans/Deposits Metropolitan Markets(1) $ 646,109 20.1% $ 700,000 28.8% 108.3% Community Markets(2) $ 2,566,136 79.9% $ 1,729,041 71.2% 67.4% 5
New Mexico Texas Dallas Bryan /College Station Houston Midland Odessa El
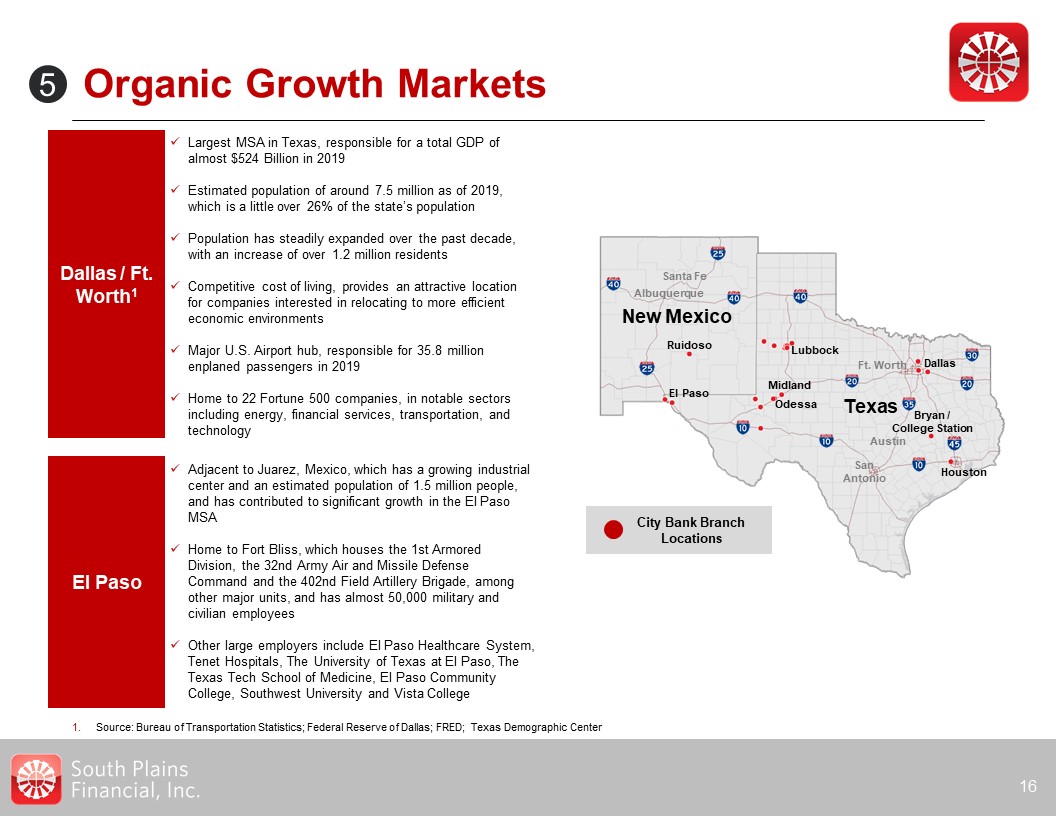
Paso Lubbock Ruidoso SanAntonio Ft. Worth Austin Albuquerque Santa Fe City Bank Branch Locations Organic Growth Markets 16 El Paso Adjacent to Juarez, Mexico, which has a growing industrial center and an estimated population
of 1.5 million people, and has contributed to significant growth in the El Paso MSAHome to Fort Bliss, which houses the 1st Armored Division, the 32nd Army Air and Missile Defense Command and the 402nd Field Artillery Brigade, among other major
units, and has almost 50,000 military and civilian employeesOther large employers include El Paso Healthcare System, Tenet Hospitals, The University of Texas at El Paso, The Texas Tech School of Medicine, El Paso Community College, Southwest
University and Vista College 5 Dallas / Ft. Worth1 Largest MSA in Texas, responsible for a total GDP of almost $524 Billion in 2019Estimated population of around 7.5 million as of 2019, which is a little over 26% of the state’s
populationPopulation has steadily expanded over the past decade, with an increase of over 1.2 million residentsCompetitive cost of living, provides an attractive location for companies interested in relocating to more efficient economic
environments Major U.S. Airport hub, responsible for 35.8 million enplaned passengers in 2019Home to 22 Fortune 500 companies, in notable sectors including energy, financial services, transportation, and technology Source: Bureau of
Transportation Statistics; Federal Reserve of Dallas; FRED; Texas Demographic Center
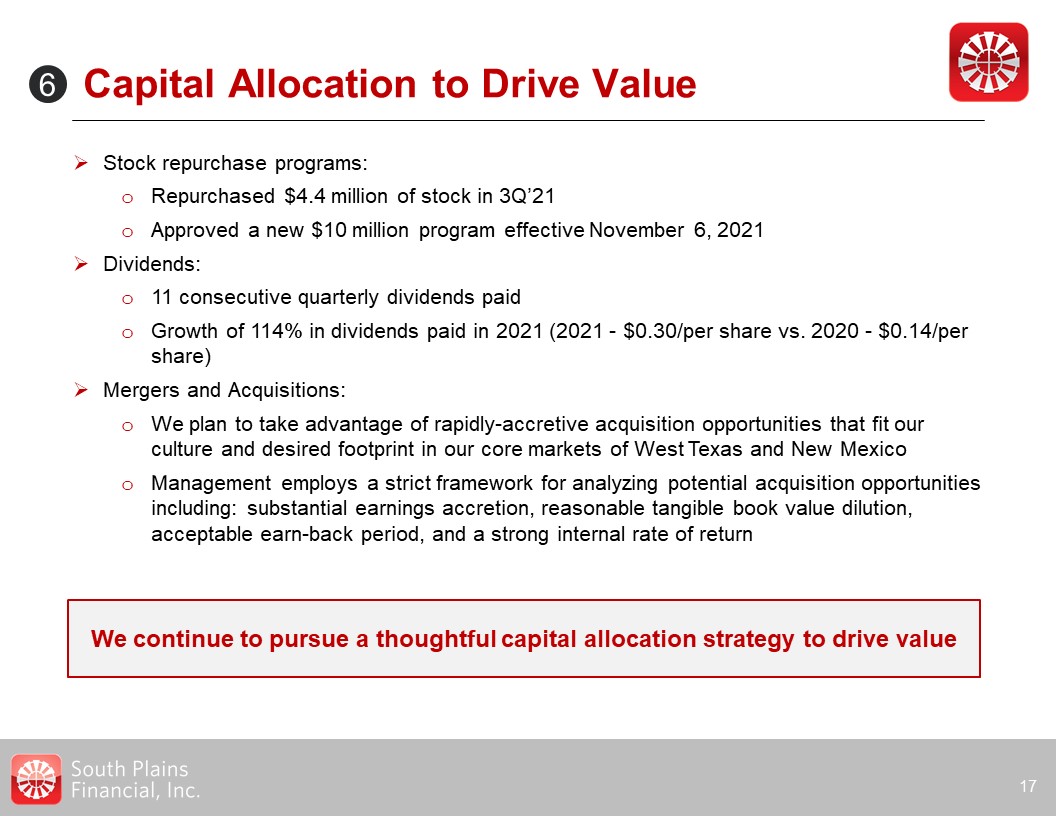
Capital Allocation to Drive Value 17 6 Stock repurchase programs:Repurchased $4.4
million of stock in 3Q’21Approved a new $10 million program effective November 6, 2021Dividends:11 consecutive quarterly dividends paidGrowth of 114% in dividends paid in 2021 (2021 - $0.30/per share vs. 2020 - $0.14/per share)Mergers and
Acquisitions:We plan to take advantage of rapidly-accretive acquisition opportunities that fit our culture and desired footprint in our core markets of West Texas and New MexicoManagement employs a strict framework for analyzing potential
acquisition opportunities including: substantial earnings accretion, reasonable tangible book value dilution, acceptable earn-back period, and a strong internal rate of return We continue to pursue a thoughtful capital allocation strategy to
drive value
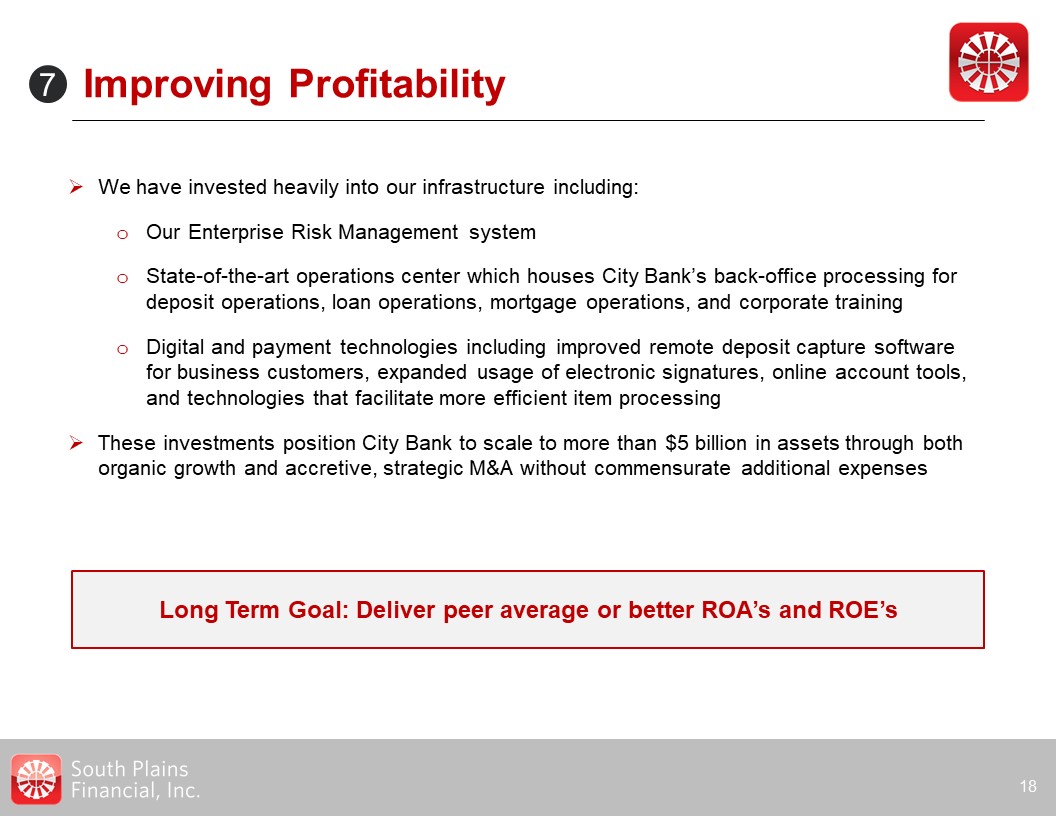
Improving Profitability 18 We have invested heavily into our infrastructure
including:Our Enterprise Risk Management system State-of-the-art operations center which houses City Bank’s back-office processing for deposit operations, loan operations, mortgage operations, and corporate trainingDigital and payment
technologies including improved remote deposit capture software for business customers, expanded usage of electronic signatures, online account tools, and technologies that facilitate more efficient item processing These investments position
City Bank to scale to more than $5 billion in assets through both organic growth and accretive, strategic M&A without commensurate additional expenses Long Term Goal: Deliver peer average or better ROA’s and ROE’s 7
Investment Highlights 19 Improving Profitability Organic Growth Strong Credit
Culture Enterprise Risk Management Experienced Management Team Emphasize Community Banking Capital Allocation to Drive Value 1 2 3 4 5 6 7

Financial Update 20
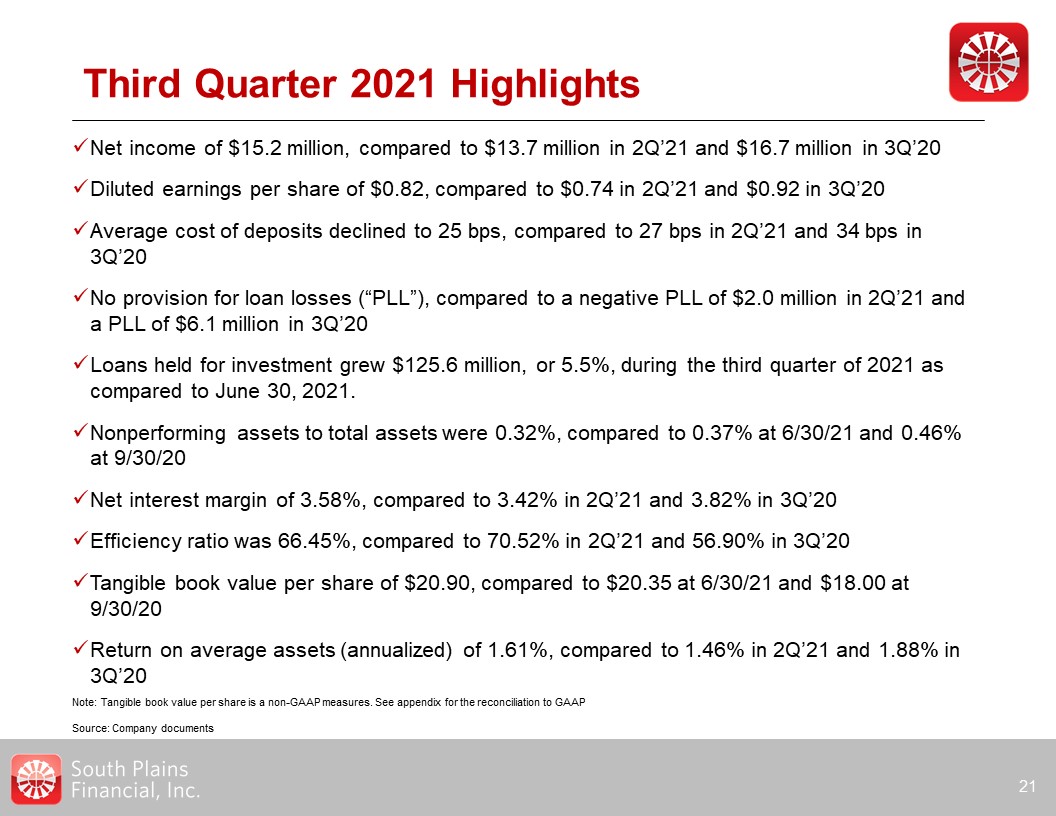
Third Quarter 2021 Highlights 21 Note: Tangible book value per share is a non-GAAP
measures. See appendix for the reconciliation to GAAP Source: Company documents Net income of $15.2 million, compared to $13.7 million in 2Q’21 and $16.7 million in 3Q’20Diluted earnings per share of $0.82, compared to $0.74 in 2Q’21 and $0.92
in 3Q’20Average cost of deposits declined to 25 bps, compared to 27 bps in 2Q’21 and 34 bps in 3Q’20No provision for loan losses (“PLL”), compared to a negative PLL of $2.0 million in 2Q’21 and a PLL of $6.1 million in 3Q’20Loans held for
investment grew $125.6 million, or 5.5%, during the third quarter of 2021 as compared to June 30, 2021.Nonperforming assets to total assets were 0.32%, compared to 0.37% at 6/30/21 and 0.46% at 9/30/20Net interest margin of 3.58%, compared to
3.42% in 2Q’21 and 3.82% in 3Q’20 Efficiency ratio was 66.45%, compared to 70.52% in 2Q’21 and 56.90% in 3Q’20Tangible book value per share of $20.90, compared to $20.35 at 6/30/21 and $18.00 at 9/30/20Return on average assets (annualized) of
1.61%, compared to 1.46% in 2Q’21 and 1.88% in 3Q’20
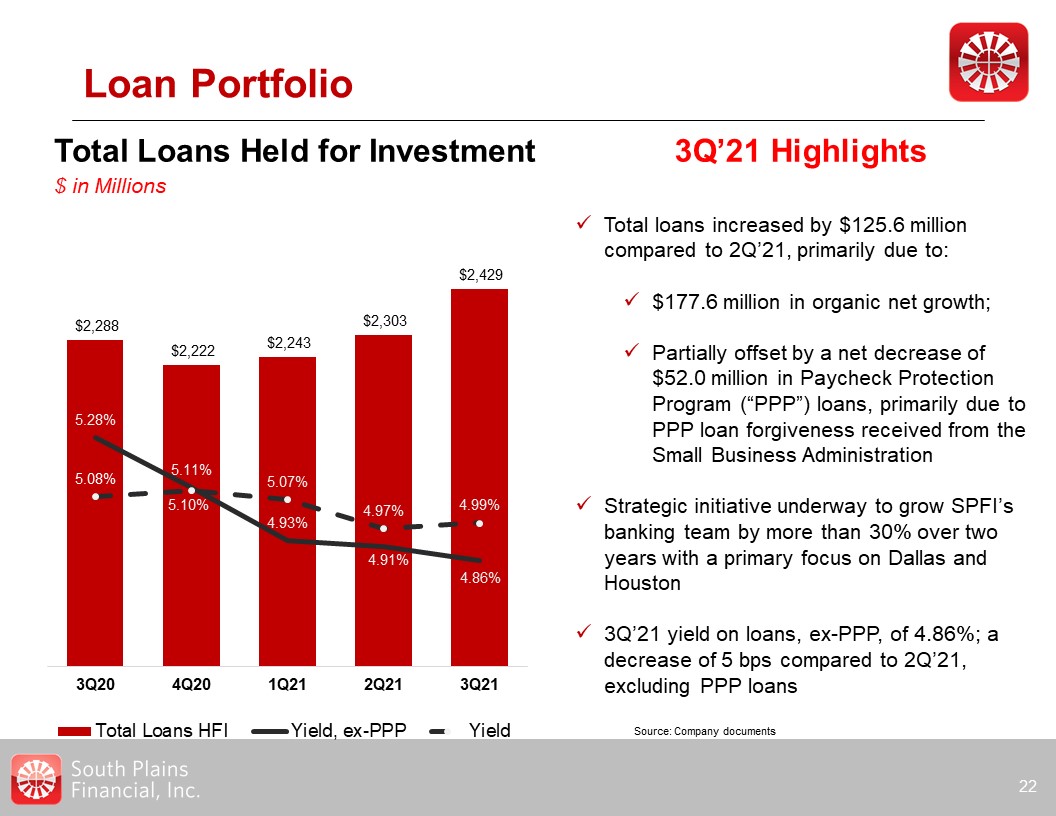
Loan Portfolio 22 3Q’21 Highlights Total loans increased by $125.6 million compared to
2Q’21, primarily due to:$177.6 million in organic net growth; Partially offset by a net decrease of $52.0 million in Paycheck Protection Program (“PPP”) loans, primarily due to PPP loan forgiveness received from the Small Business
AdministrationStrategic initiative underway to grow SPFI’s banking team by more than 30% over two years with a primary focus on Dallas and Houston3Q’21 yield on loans, ex-PPP, of 4.86%; a decrease of 5 bps compared to 2Q’21, excluding PPP
loans Total Loans Held for Investment$ in Millions Source: Company documents
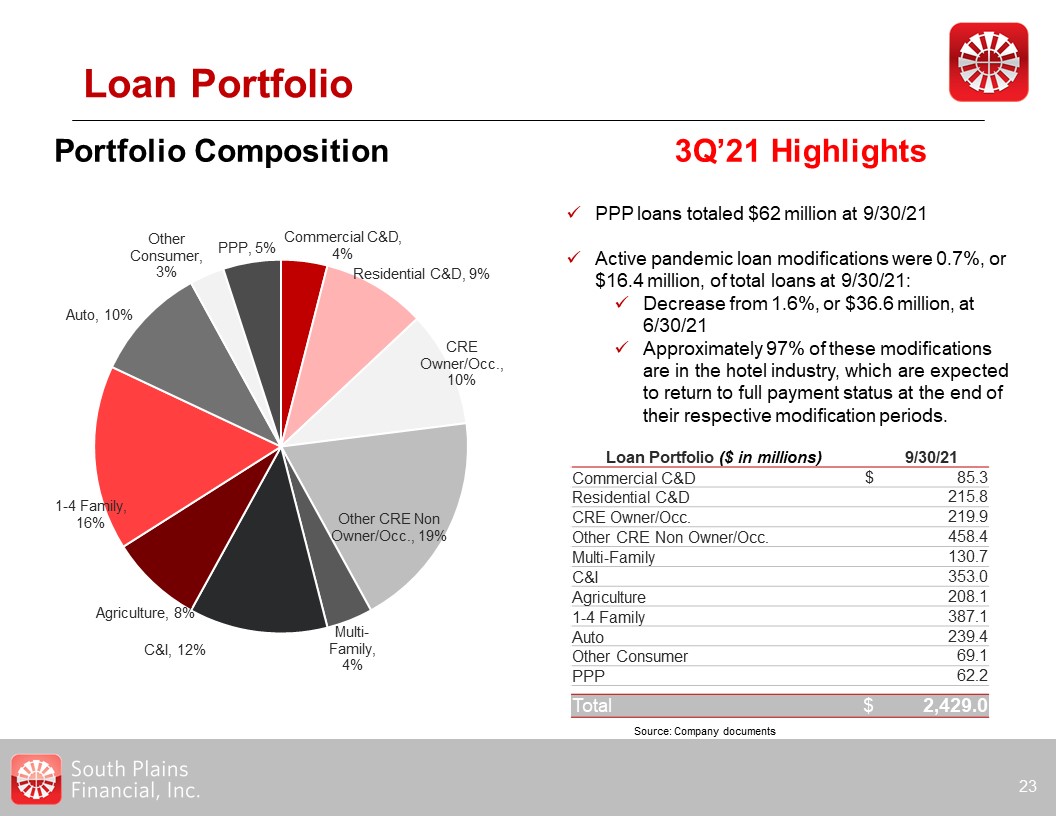
Loan Portfolio 23 Portfolio Composition Loan Portfolio ($ in
millions) 9/30/21 Commercial C&D $ 85.3 Residential C&D 215.8 CRE Owner/Occ. 219.9 Other CRE Non Owner/Occ. 458.4 Multi-Family 130.7 C&I 353.0 Agriculture 208.1 1-4 Family 387.1
Auto 239.4 Other Consumer 69.1 PPP 62.2 Total $ 2,429.0 Source: Company documents PPP loans totaled $62 million at 9/30/21Active pandemic loan modifications were 0.7%, or $16.4 million, of total loans at
9/30/21:Decrease from 1.6%, or $36.6 million, at 6/30/21Approximately 97% of these modifications are in the hotel industry, which are expected to return to full payment status at the end of their respective modification periods. 3Q’21
Highlights
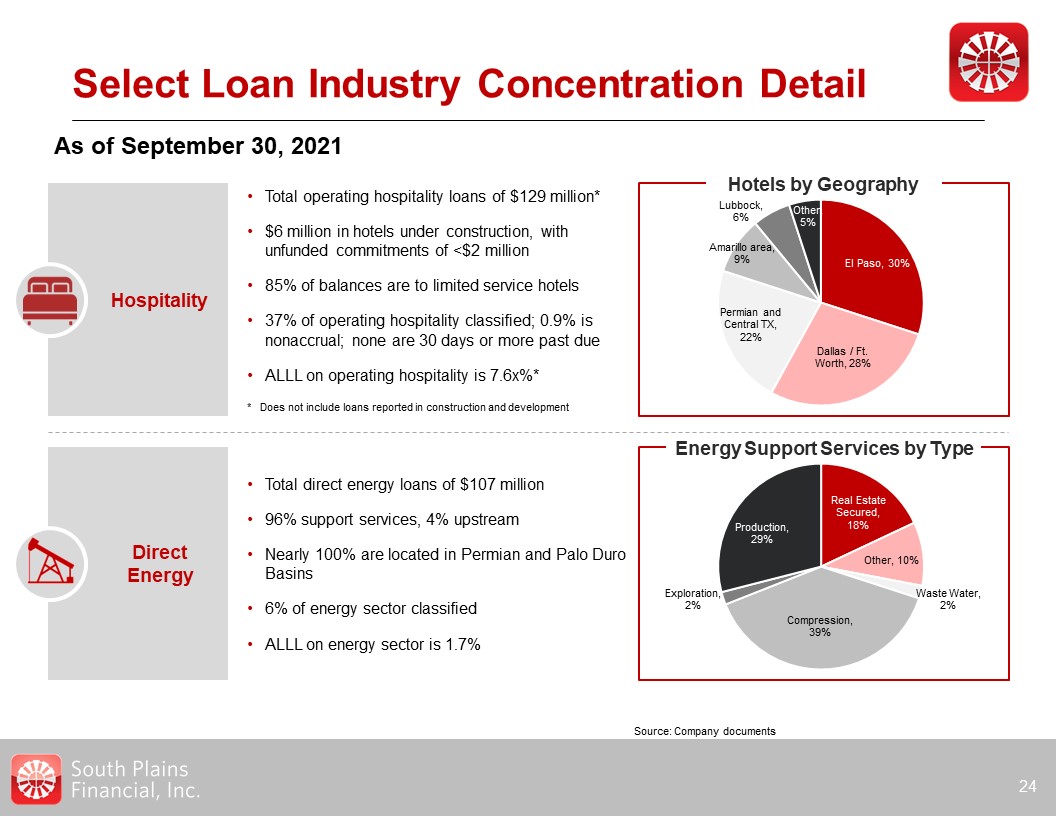
DirectEnergy Select Loan Industry Concentration Detail 24 As of September 30,
2021 Hospitality Total operating hospitality loans of $129 million*$6 million in hotels under construction, with unfunded commitments of <$2 million85% of balances are to limited service hotels37% of operating hospitality classified; 0.9%
is nonaccrual; none are 30 days or more past dueALLL on operating hospitality is 7.6x%** Does not include loans reported in construction and development Total direct energy loans of $107 million96% support services, 4% upstreamNearly 100% are
located in Permian and Palo Duro Basins6% of energy sector classifiedALLL on energy sector is 1.7% Hotels by Geography Source: Company documents Energy Support Services by Type
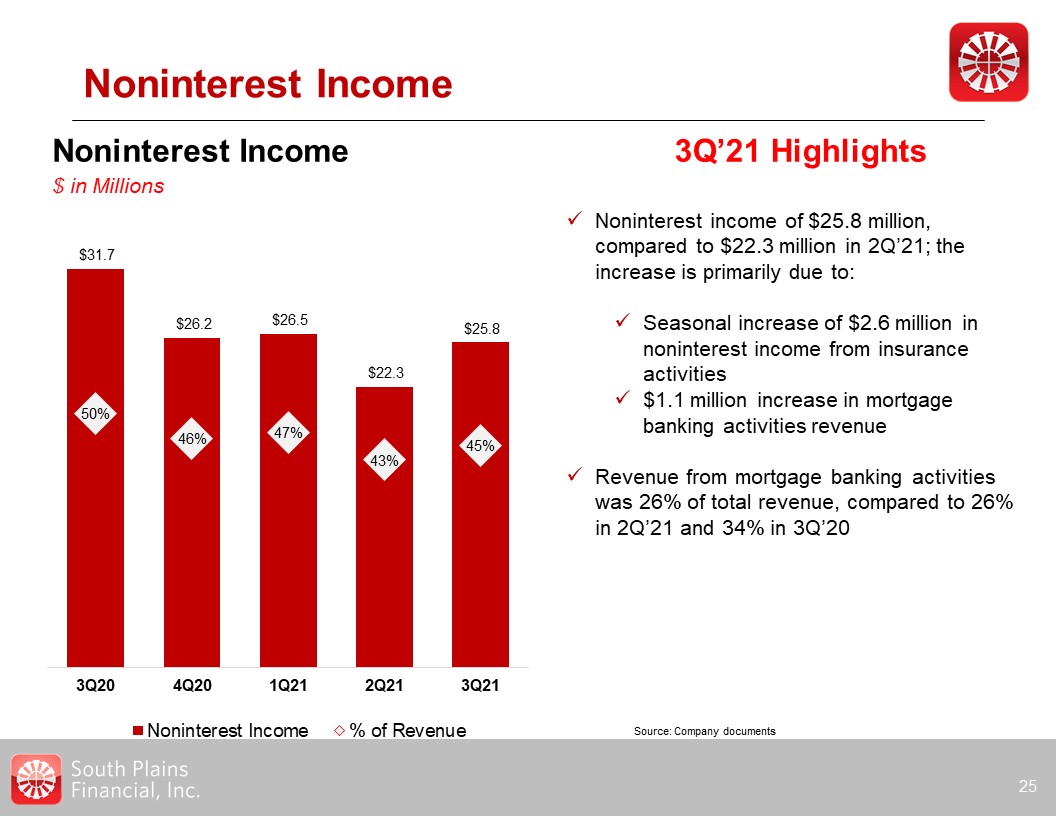
Noninterest Income 25 Noninterest Income$ in Millions 3Q’21 Highlights Noninterest
income of $25.8 million, compared to $22.3 million in 2Q’21; the increase is primarily due to:Seasonal increase of $2.6 million in noninterest income from insurance activities $1.1 million increase in mortgage banking activities revenueRevenue
from mortgage banking activities was 26% of total revenue, compared to 26% in 2Q’21 and 34% in 3Q’20 Source: Company documents
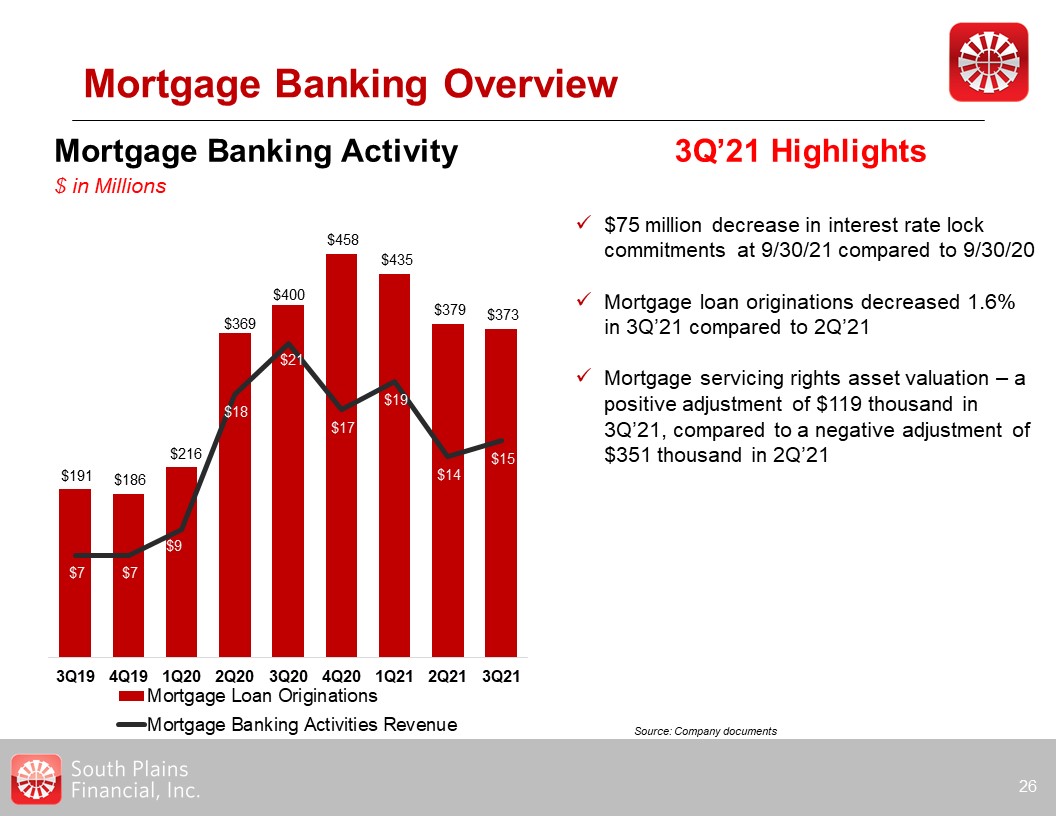
Mortgage Banking Overview 26 Mortgage Banking Activity$ in Millions 3Q’21 Highlights $75
million decrease in interest rate lock commitments at 9/30/21 compared to 9/30/20Mortgage loan originations decreased 1.6% in 3Q’21 compared to 2Q’21Mortgage servicing rights asset valuation – a positive adjustment of $119 thousand in 3Q’21,
compared to a negative adjustment of $351 thousand in 2Q’21 Source: Company documents
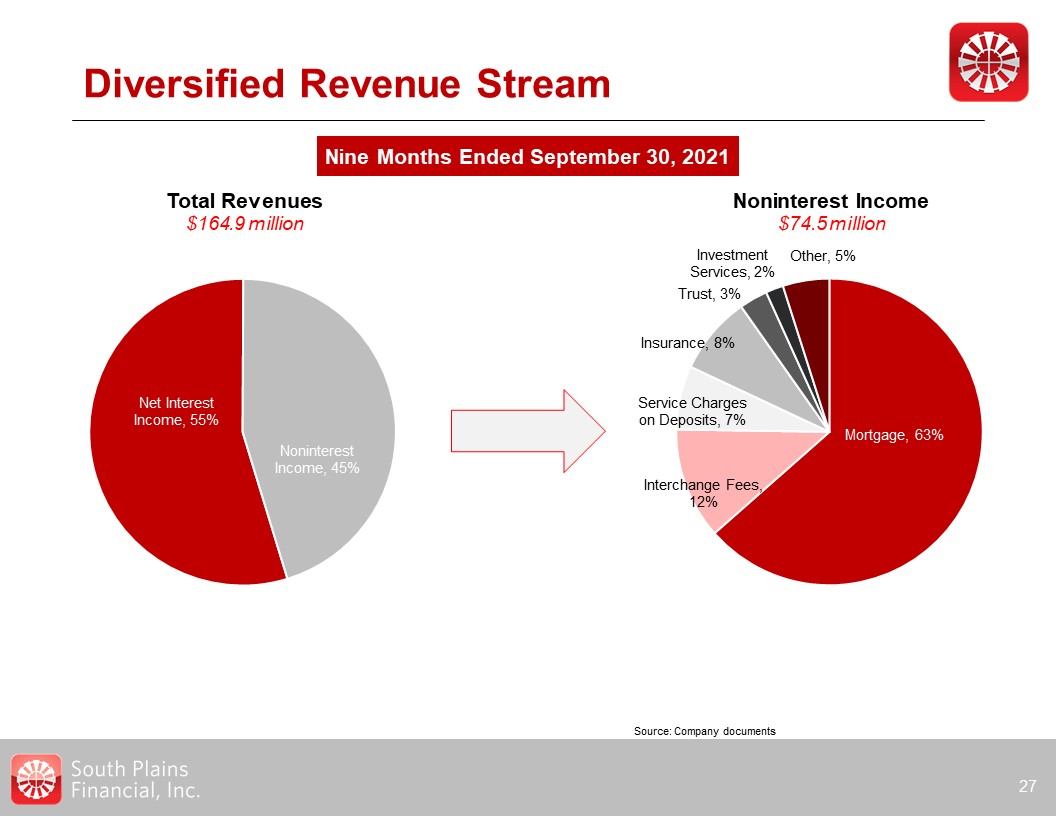
Diversified Revenue Stream Nine Months Ended September 30, 2021 27 Total Revenues$164.9
million Noninterest Income$74.5 million Source: Company documents
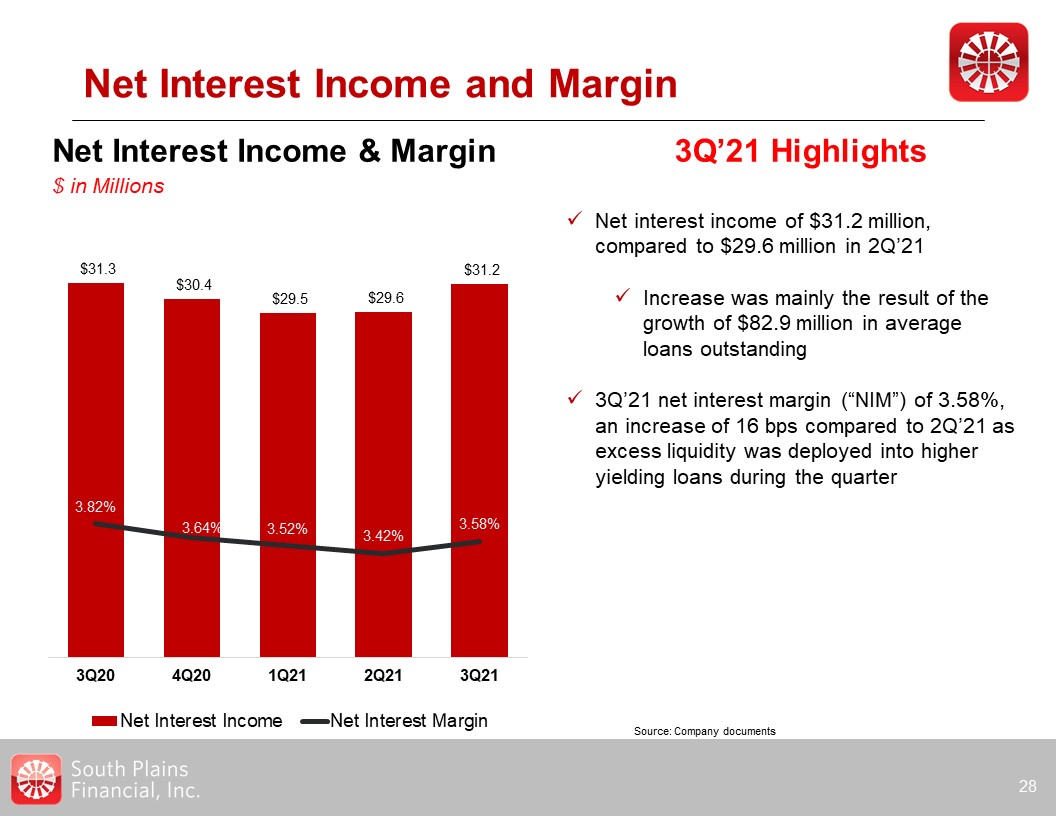
Net Interest Income and Margin 28 Net Interest Income & Margin$ in Millions 3Q’21
Highlights Net interest income of $31.2 million, compared to $29.6 million in 2Q’21Increase was mainly the result of the growth of $82.9 million in average loans outstanding3Q’21 net interest margin (“NIM”) of 3.58%, an increase of 16 bps
compared to 2Q’21 as excess liquidity was deployed into higher yielding loans during the quarter Source: Company documents
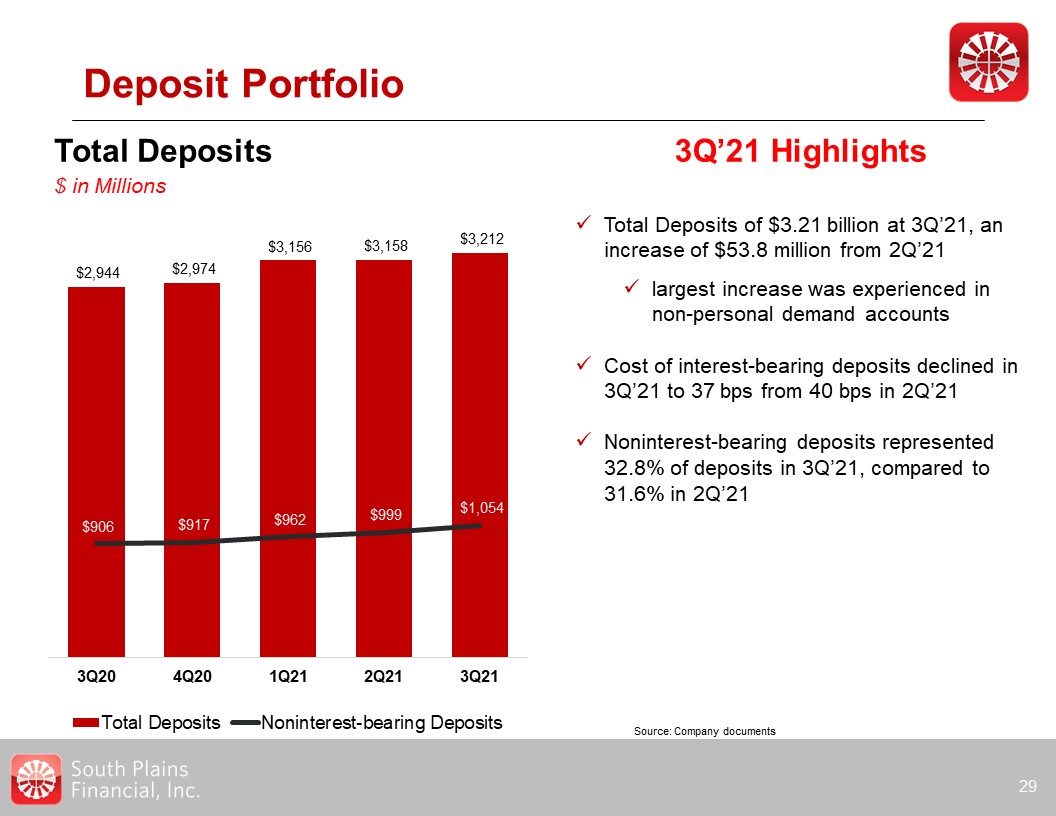
Deposit Portfolio 29 Total Deposits$ in Millions 3Q’21 Highlights Total Deposits of
$3.21 billion at 3Q’21, an increase of $53.8 million from 2Q’21largest increase was experienced in non-personal demand accounts Cost of interest-bearing deposits declined in 3Q’21 to 37 bps from 40 bps in 2Q’21Noninterest-bearing deposits
represented 32.8% of deposits in 3Q’21, compared to 31.6% in 2Q’21 Source: Company documents

Investment Securities 30 3Q’21 Highlights Investment Securities totaled $752.6 million
at 9/30/21, the fair value of securities decreased $6 million due to market conditions from 6/30/21All municipal bonds are in TexasAll MBS, CMO, and Asset Backed securities are U.S. Government or GSE 3Q’21 Securities
Composition $752.6million Securities & Cash$ in Millions Source: Company documents
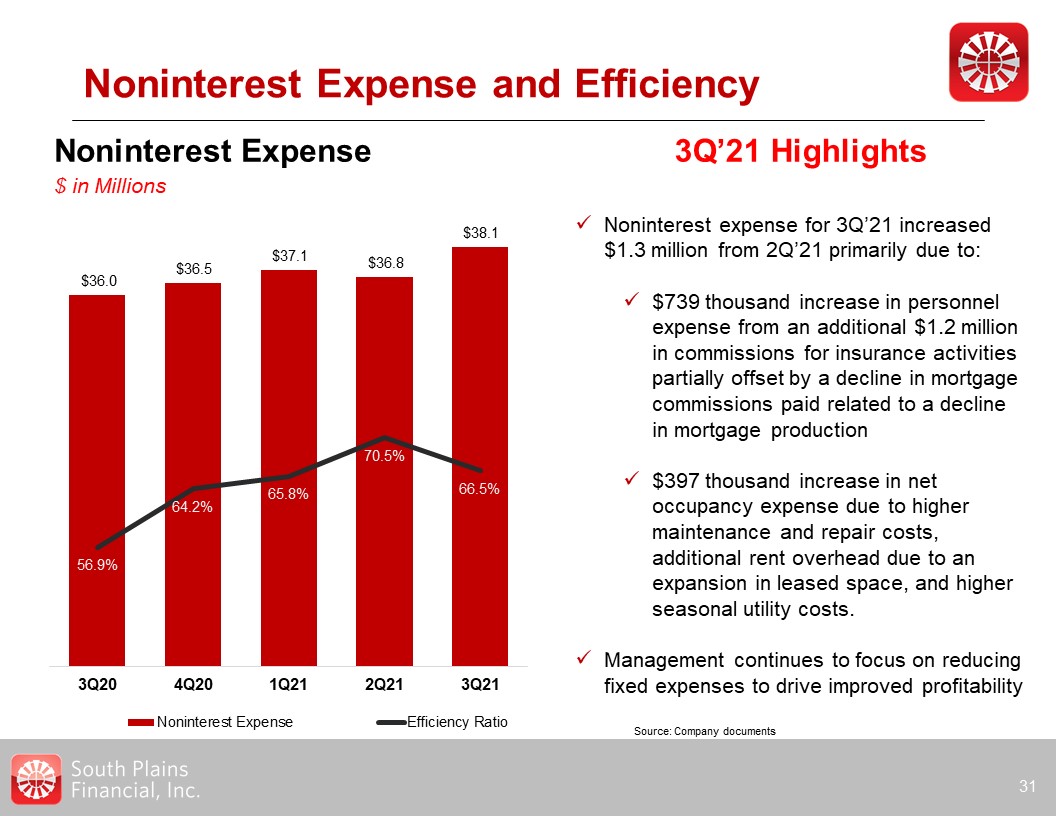
Noninterest Expense and Efficiency 31 Noninterest Expense$ in Millions 3Q’21
Highlights Noninterest expense for 3Q’21 increased $1.3 million from 2Q’21 primarily due to:$739 thousand increase in personnel expense from an additional $1.2 million in commissions for insurance activities partially offset by a decline in
mortgage commissions paid related to a decline in mortgage production$397 thousand increase in net occupancy expense due to higher maintenance and repair costs, additional rent overhead due to an expansion in leased space, and higher seasonal
utility costs.Management continues to focus on reducing fixed expenses to drive improved profitability Source: Company documents
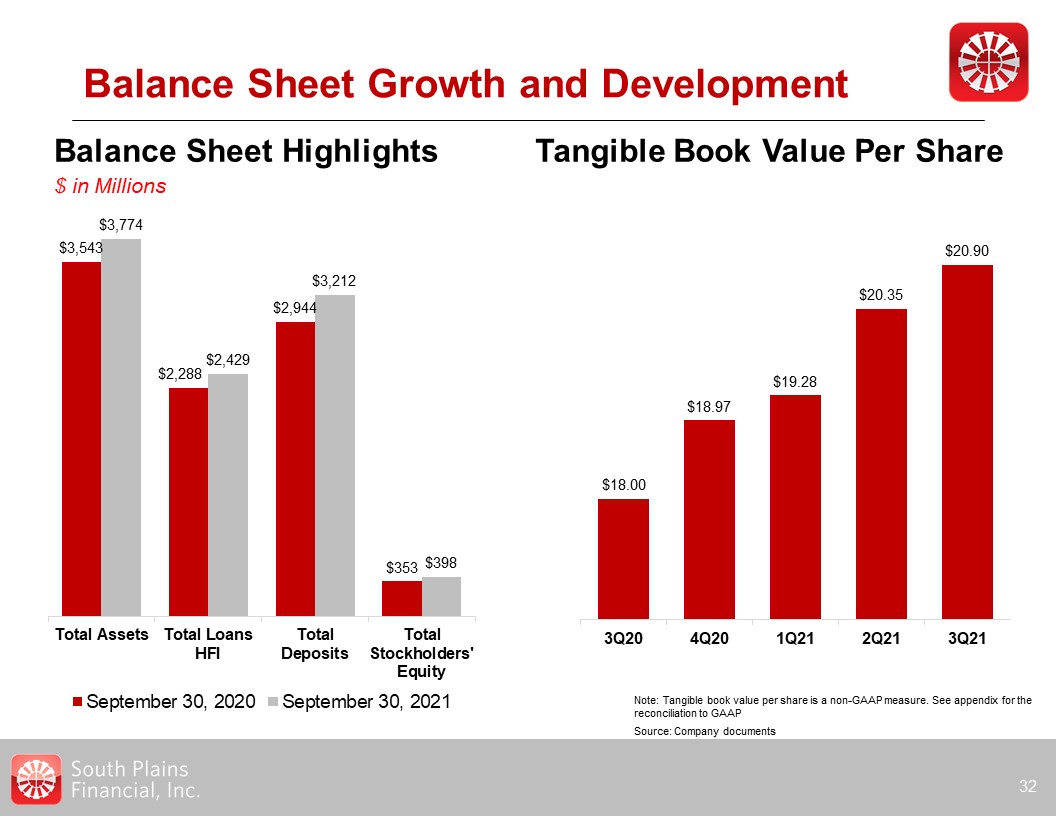
Balance Sheet Highlights$ in Millions Balance Sheet Growth and Development 32 Tangible
Book Value Per Share Note: Tangible book value per share is a non-GAAP measure. See appendix for the reconciliation to GAAP Source: Company documents
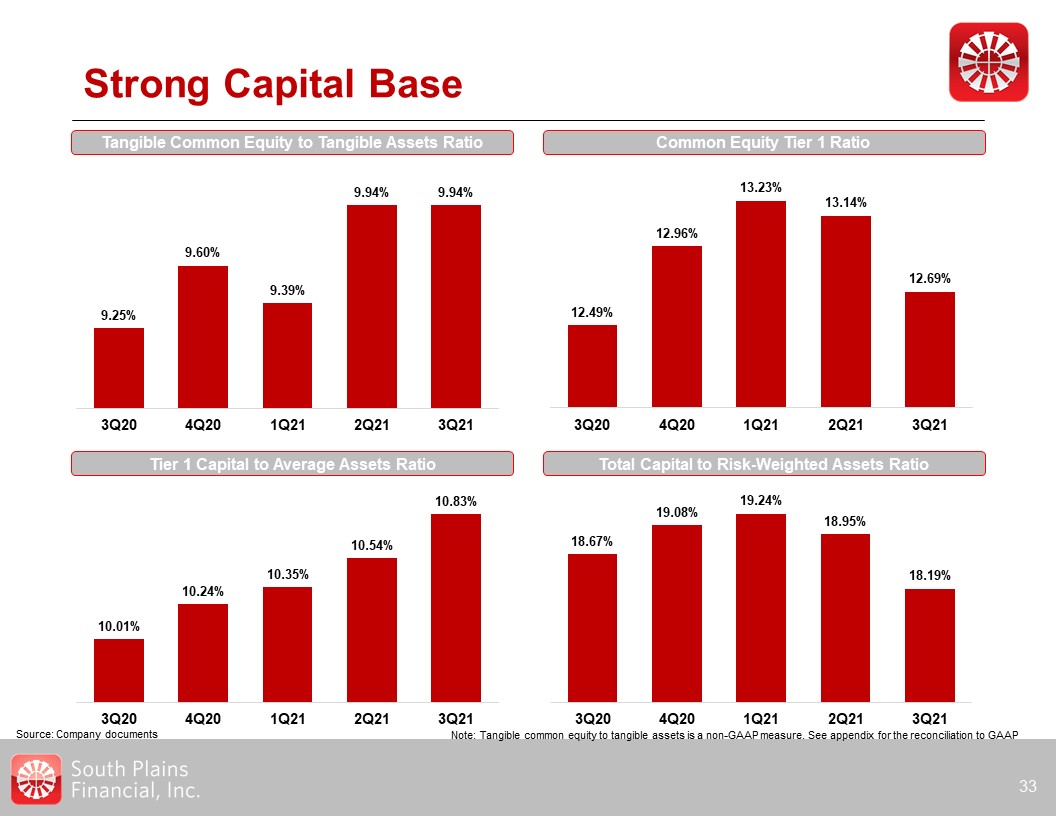
Strong Capital Base 33 Tangible Common Equity to Tangible Assets Ratio Common Equity
Tier 1 Ratio Tier 1 Capital to Average Assets Ratio Total Capital to Risk-Weighted Assets Ratio Source: Company documents Note: Tangible common equity to tangible assets is a non-GAAP measure. See appendix for the reconciliation to GAAP
Appendix 34
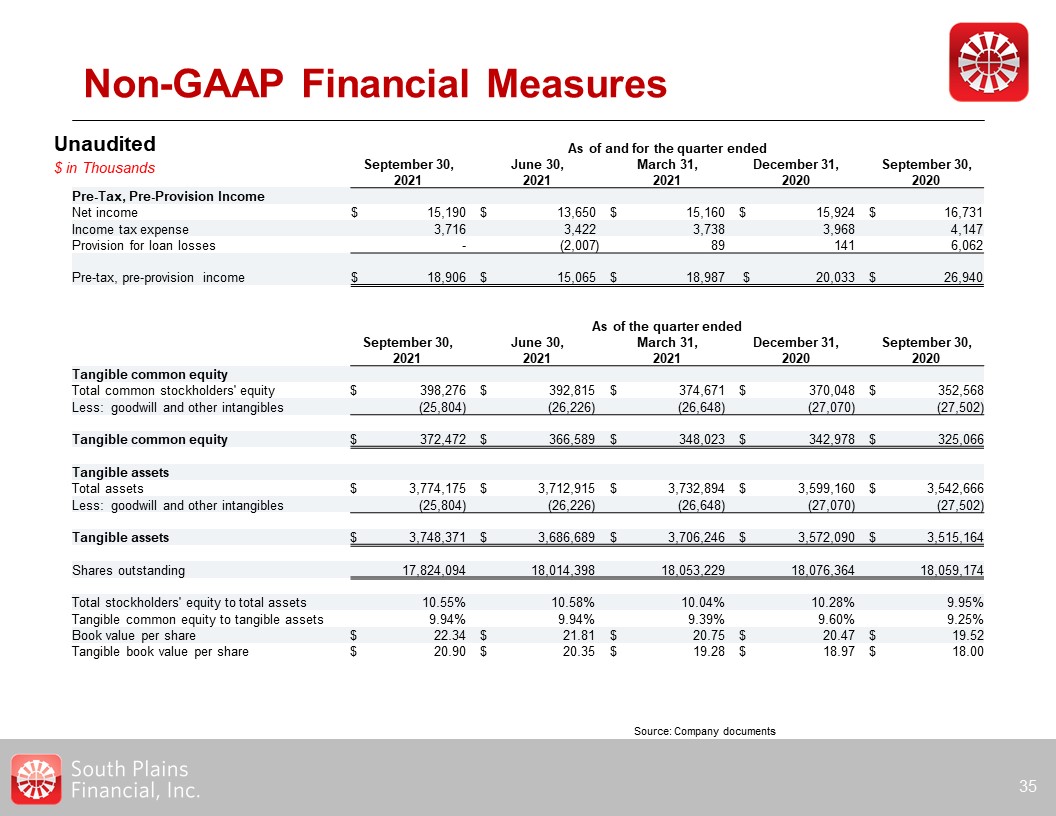
Non-GAAP Financial Measures 35 As of and for the quarter
ended September 30,2021 June 30,2021 March 31,2021 December 31,2020 September 30,2020 Pre-Tax, Pre-Provision Income Net income $ 15,190
$ 13,650 $ 15,160 $ 15,924 $ 16,731 Income tax expense 3,716 3,422 3,738 3,968 4,147 Provision for loan losses - (2,007 ) 89 141 6,062
Pre-tax, pre-provision income $ 18,906 $ 15,065 $ 18,987 $ 20,033 $ 26,940 Unaudited$ in Thousands Source: Company documents As of the quarter ended September 30,2021
June 30,2021 March 31,2021 December 31,2020 September 30,2020 Tangible common equity Total common stockholders' equity $ 398,276 $ 392,815 $ 374,671 $ 370,048
$ 352,568 Less: goodwill and other intangibles (25,804) (26,226) (26,648) (27,070) (27,502) Tangible common equity $ 372,472 $ 366,589 $ 348,023
$ 342,978 $ 325,066 Tangible assets Total assets $ 3,774,175 $ 3,712,915 $ 3,732,894 $ 3,599,160 $ 3,542,666 Less: goodwill and
other intangibles (25,804) (26,226) (26,648) (27,070) (27,502) Tangible assets $ 3,748,371 $ 3,686,689 $ 3,706,246 $ 3,572,090 $ 3,515,164
Shares outstanding 17,824,094 18,014,398 18,053,229 18,076,364 18,059,174 Total stockholders' equity to total assets 10.55%
10.58% 10.04% 10.28% 9.95% Tangible common equity to tangible assets 9.94% 9.94% 9.39% 9.60% 9.25% Book value per share $ 22.34 $ 21.81 $ 20.75 $ 20.47
$ 19.52 Tangible book value per share $ 20.90 $ 20.35 $ 19.28 $ 18.97 $ 18.00
Serious News for Serious Traders! Try StreetInsider.com Premium Free!
You May Also Be Interested In
- South Plains Financial Inc. (SPFI) Raises Quarterly Dividend 7.7% to $0.14; 2.2% Yield
- Northfield Bancorp, Inc. Announces First Quarter 2024 Results
- International Truck Integrates Allison Fully Automatic Transmissions with S13 Engine
Create E-mail Alert Related Categories
SEC FilingsSign up for StreetInsider Free!
Receive full access to all new and archived articles, unlimited portfolio tracking, e-mail alerts, custom newswires and RSS feeds - and more!
