

Form 8-K SHYFT GROUP, INC. For: Aug 05
 Tweet
Tweet Share
Share
Exhibit 99.1

The Shyft Group Reports Second Quarter Results
Achieves record sales of $244 million and doubling of backlog to all-time high of $751 million; Reports EPS of $0.44 and adjusted EPS of $0.53
NOVI, Mich., August 5, 2021 – The Shyft Group, Inc. (NASDAQ: SHYF) (“Shyft” or the “Company”), the North American leader in specialty vehicle manufacturing, assembly and upfit for the commercial, retail and service specialty vehicle markets, today reported operating results for the second quarter ending June 30, 2021.
Second Quarter 2021 Highlights from Continuing Operations1
For the second quarter of 2021 compared to the second quarter of 2020:
|
● |
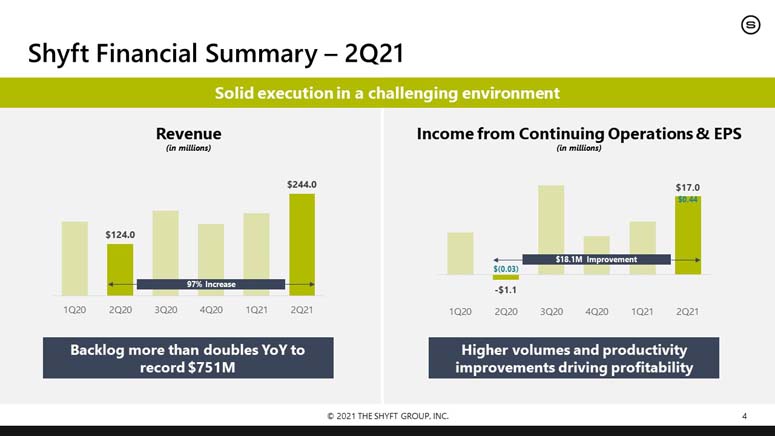
Sales of $244.0 million, an increase of $120.0 million, or 96.8%, from $124.0 million, reflecting increased sales in all product categories. |
|
● |
Gross profit margin of 21.3% of sales, a 190 basis point improvement from 19.4% of sales, driven by sales volume and actions taken to improve overall operating efficiency. |
|
● |
Income from continuing operations of $17.0 million, or $0.44 per share, compared to a loss of ($1.1) million, or ($0.03) per share. |
|
● |
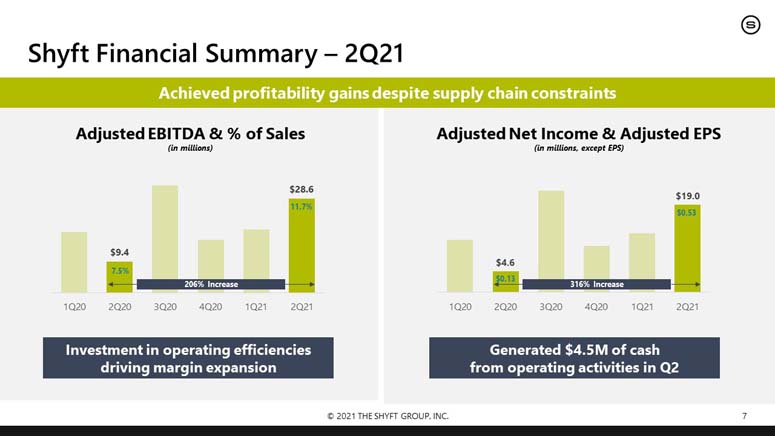
Adjusted EBITDA of $28.6 million, or 11.7% of sales, an increase of $19.2 million, or 205.6%, from $9.4 million, or 7.5% of sales. |
|
● |
Adjusted net income of $19.0 million, or $0.53 per share, an increase of $14.4 million, or 316.1%, from $4.6 million, or $0.13 per share. |
|
● |
Consolidated backlog at June 30, 2021, was a record $751.4 million, up $413.9 million, or 122.6%, compared to $337.5 million at June 30, 2020. |
“The Shyft Group’s momentum continued to build in the second quarter, producing results that exceeded our expectations, including doubling our sales and tripling adjusted EBITDA over the prior year,” said Daryl Adams, President and Chief Executive Officer. “Our strength in quality, innovation, and customer-driven product development, combined with rising demand in our markets, led to record backlog across all segments. While the environment remains challenging, our team continues to outperform and delivered our highest quarterly sales on record. We continue to see strong demand in parcel delivery and luxury motor coach, as well as accelerating demand in service bodies, which further cement our plans toward continued growth in the second half of the year.”
1 The Company divested its Emergency Response (ER) business effective February 1, 2020. Accordingly, the financial results of ER have been classified as discontinued operations for all periods presented. Unless otherwise noted, financial results presented are based on continuing operations

Fleet Vehicles and Services (FVS)
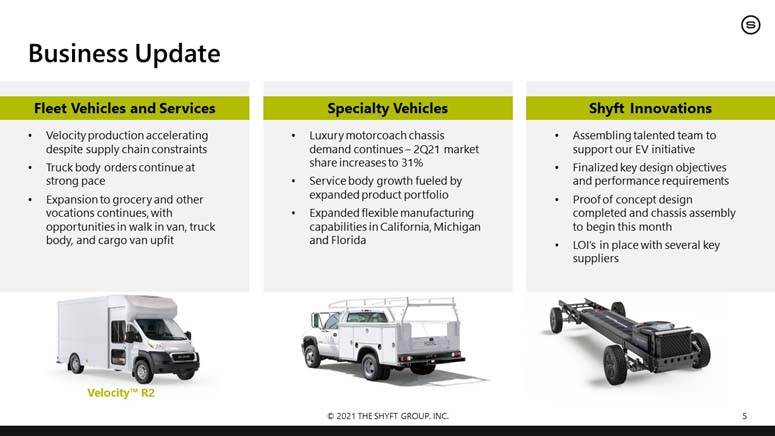
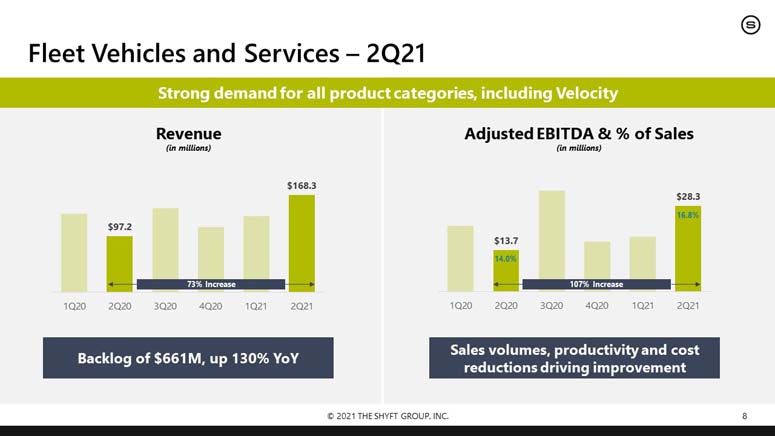
FVS segment sales were $168.3 million, an increase of 73.1% from $97.2 million, mainly due to strong sales across all product categories, including strong demand for last-mile delivery vehicles and growth in the recently introduced Velocity™ product line.
Adjusted EBITDA increased $14.6 million to $28.3 million, or 16.8% of sales, from $13.7 million, or 14.0% of sales, a year ago. The increase was primarily due to higher volume and productivity driven by capital investments.
The segment backlog at June 30, 2021, totaled a record $660.9 million, up 130.3%, compared to $287.0 million at June 30, 2020. On a sequential basis, backlog increased $71.3 million, or 12.1% from $589.6 million in the first quarter of 2021. This increase reflects strong demand for delivery vehicles, including the Velocity product line.
Specialty Vehicles (SV)
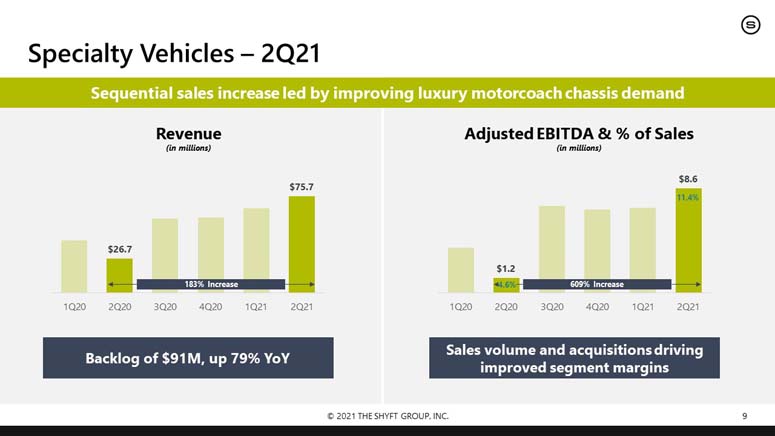
SV segment sales were $75.7 million, an increase of 183.2% from $26.7 million, led by luxury motor coach chassis sales and accelerating growth in service bodies.
Adjusted EBITDA increased $7.4 million to $8.6 million, or 11.4% of sales, from $1.2 million, or 4.6% of sales, a year ago. The increase was primarily due to higher sales volume.
The segment backlog at June 30, 2021, totaled $90.5 million, up 79.1% compared to $50.5 million at June 30, 2020. On a sequential basis, backlog increased $13.6 million, or 17.7%, from $76.9 million in the first quarter of 2021. The increase reflects increased orders across all product lines.
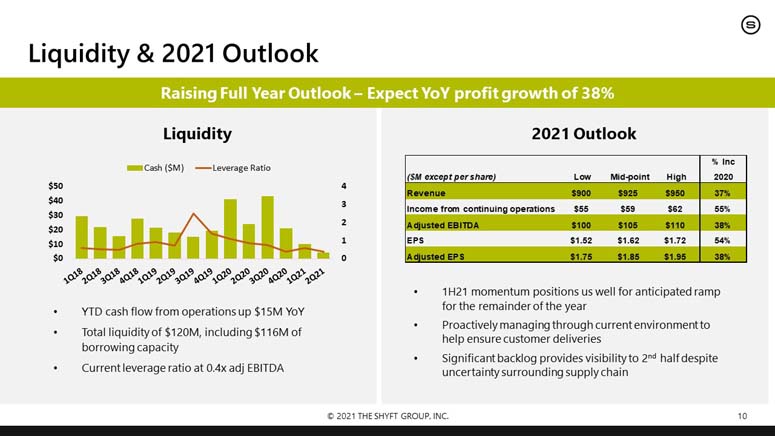
Update 2021 Outlook
“In addition to our strong financial performance during the quarter, we continued to make investments that will drive productivity improvements and position us for future growth,” said Jon Douyard, Chief Financial Officer. “Our current liquidity position remains healthy at $120.0 million, and our leverage ratio stands at just 0.4 times adjusted EBITDA, leaving ample room for further strategic investments. While our strong order intake resulted in record backlog, we continue to manage through a challenging supply environment. Despite this headwind, we are confident raising our guidance for the year to reflect the strong first half performance and our team’s ability to meet customer needs through the second half.”
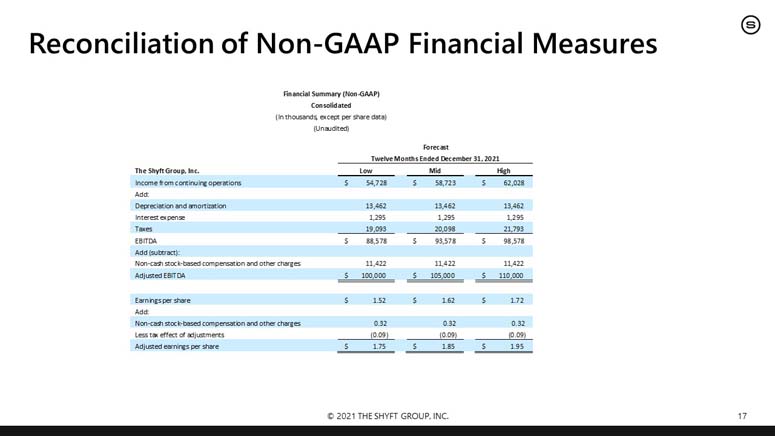
The Company expects full-year 2021 results from continuing operations to be as follows:
|
● |
Revenue to be in the range of $900 to $950 million |
|
● |
Net income of $55 to $62 million |
|
● |
Adjusted EBITDA of $100 to $110 million |
|
● |
Effective tax rate of approximately 26% |
|
● |
Earnings per share of $1.52 - $1.72 |
|
● |
Adjusted earnings per share of $1.75 - $1.95 |
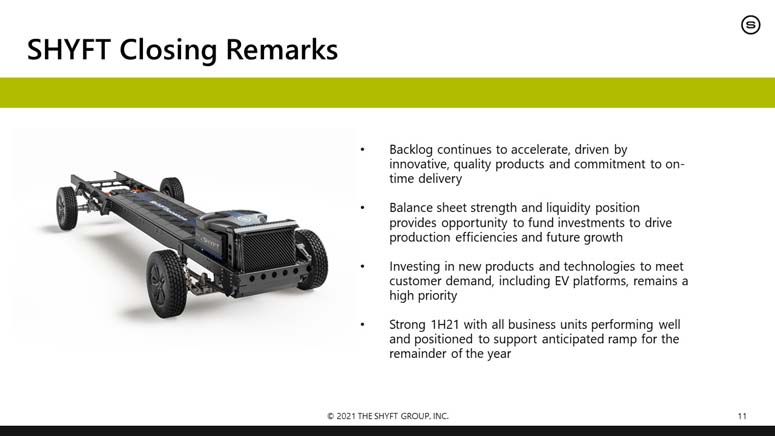
“Our achievements during the first half of the year highlight our proven business strategy and our team’s capacity to execute. This exceptional team continues to bring aptitude and energy to the organization and operate at the highest level, both from a day-to-day production and support standpoint, as well as in the areas of product research and development. With the strength of demand in our core markets and the tremendous opportunities inherent in our new products coming to market – such as the Velocity and our recently announced all-electric battery powered EV chassis – we have never been more excited about the future of our Company,” concluded Adams.
Conference Call, Webcast, Investor Presentation and Investor Information
The Shyft Group will host a conference call for analysts and portfolio managers at 10 a.m. EDT today to discuss these results and current business trends. The conference call and webcast will be available via:
Webcast: www.TheShyftGroup.com/investor-relations/webcasts
Conference Call: 1-877-317-6789 (domestic) or 412-317-6789 (international); passcode: 10155593
For more information about The Shyft Group, please visit www.TheShyftGroup.com.
About The Shyft Group
The Shyft Group is the North American leader in specialty vehicle manufacturing, assembly, and upfit for the commercial, retail, and service specialty vehicle markets. Our customers include first-to-last mile delivery companies across vocations, federal, state, and local government entities; the trades; and utility and infrastructure segments. The Shyft Group is organized into two core business units: Shyft Fleet Vehicles & Services™ and Shyft Specialty Vehicles™. Today, its family of brands include Utilimaster®, Royal Truck Body™, DuraMag® and Magnum®, Strobes-R-Us™, Spartan RV Chassis™, Builtmore Contract Manufacturing™, and corresponding aftermarket provisions. The Shyft Group and its go-to-market brands are well known in their respective industries for quality, durability, and first-to-market innovation. The Company employs approximately 2,900 associates across campuses, and operates facilities in Michigan, Indiana, Maine, Pennsylvania, South Carolina, Florida, Missouri, California, Arizona, Texas, and Saltillo, Mexico. The Company reported sales from continuing operations of $676 million in 2020. Learn more about The Shyft Group at www.TheShyftGroup.com.
This release contains several forward-looking statements that are not historical facts, including statements concerning our business, strategic position, financial projections, financial strength, future plans, objectives, and the performance of our products and operations. These statements can be identified by words such as "believe," "expect," "intend," "potential," "future," "may," "will," "should," and similar expressions regarding future expectations. Furthermore, statements contained in this document relating to the global outbreak of the novel coronavirus disease (COVID-19), the impact of which remains inherently uncertain on our financial results, are forward-looking statements. These forward-looking statements involve various known and unknown risks, uncertainties, and assumptions that are difficult to predict with regard to timing, extent, and likelihood. Therefore, actual performance and results may materially differ from what may be expressed or forecasted in such forward-looking statements. Factors that could contribute to these differences include future developments relating to the COVID-19 pandemic, including governmental responses, supply chain shortages, and potential labor issues; operational and other complications that may arise affecting the implementation of our plans and business objectives; continued pressures caused by economic conditions including weaknesses resulting from the COVID-19 pandemic; challenges that may arise in connection with the integration of new businesses or assets we acquire or the disposition of assets; restructuring of our operations, and/or our expansion into new geographic markets; issues unique to government contracting, such as competitive bidding processes, qualification requirements, and delays or changes in funding; disruptions within our dealer network; changes in our relationships with major customers, suppliers, or other business partners; changes in the demand or supply of products within our markets or raw materials needed to manufacture those products; and changes in laws and regulations affecting our business. Other factors that could affect outcomes are set forth in our Annual Report on Form 10-K and other filings we make with the Securities and Exchange Commission (SEC), which are available at www.sec.gov or our website. All forward-looking statements in this release are qualified by this paragraph. Investors should not place undue reliance on forward-looking statements as a prediction of actual results. We undertake no obligation to publicly update or revise any forward-looking statements in this release, whether as a result of new information, future events, or otherwise.
CONTACT:
|
Juris Pagrabs Group Treasurer The Shyft Group (517) 997-3862 |
|
The Shyft Group, Inc. and Subsidiaries |
|
Consolidated Balance Sheets |
|
(In thousands, except par value) |
|
(Unaudited) |
|
June 30, |
December 31, |
|||||||
|
2021 |
2020 |
|||||||
|
ASSETS |
||||||||
|
Current assets: |
||||||||
|
Cash and cash equivalents |
$ | 4,178 | $ | 20,995 | ||||
|
Accounts receivable, less allowance of $136 and $116 |
101,879 | 64,695 | ||||||
|
Contract assets |
15,370 | 9,414 | ||||||
|
Inventories, net |
68,420 | 46,428 | ||||||
|
Other receivables - chassis pool agreements |
13,983 | 6,503 | ||||||
|
Other current assets |
8,859 | 8,172 | ||||||
|
Total current assets |
212,689 | 156,207 | ||||||
|
Property, plant and equipment, net |
54,335 | 45,734 | ||||||
|
Right of use assets – operating leases |
41,905 | 43,430 | ||||||
|
Goodwill |
48,677 | 49,481 | ||||||
|
Intangible assets, net |
54,684 | 56,386 | ||||||
|
Other assets |
1,162 | 2,052 | ||||||
|
Net deferred tax asset |
5,625 | 5,759 | ||||||
|
TOTAL ASSETS |
$ | 419,077 | $ | 359,049 | ||||
|
LIABILITIES AND SHAREHOLDERS' EQUITY |
||||||||
|
Current liabilities: |
||||||||
|
Accounts payable |
$ | 74,749 | $ | 47,487 | ||||
|
Accrued warranty |
6,623 | 5,633 | ||||||
|
Accrued compensation and related taxes |
17,799 | 17,134 | ||||||
|
Deposits from customers |
377 | 756 | ||||||
|
Operating lease liability |
7,495 | 7,508 | ||||||
|
Other current liabilities and accrued expenses |
9,774 | 8,121 | ||||||
|
Short-term debt - chassis pool agreements |
13,983 | 6,503 | ||||||
|
Current portion of long-term debt |
253 | 221 | ||||||
|
Total current liabilities |
131,053 | 93,363 | ||||||
|
Other non-current liabilities |
4,628 | 5,447 | ||||||
|
Long-term operating lease liability |
35,182 | 36,662 | ||||||
|
Long-term debt, less current portion |
23,198 | 23,418 | ||||||
|
Total liabilities |
194,061 | 158,890 | ||||||
|
Shareholders' equity: |
||||||||
|
Preferred stock; 2,000 shares authorized (none issued) |
- | - | ||||||
|
Common stock; 80,000 shares authorized; 35,346 and 35,344 outstanding |
92,309 | 91,044 | ||||||
|
Retained earnings |
131,853 | 109,286 | ||||||
|
Total The Shyft Group, Inc. shareholders' equity |
224,162 | 200,330 | ||||||
|
Non-controlling interest |
854 | (171 | ) | |||||
|
Total shareholders' equity |
225,016 | 200,159 | ||||||
|
TOTAL LIABILITIES AND SHAREHOLDERS' EQUITY |
$ | 419,077 | $ | 359,049 | ||||
|
The Shyft Group, Inc. and Subsidiaries |
|
Consolidated Statements of Operations |
|
(In thousands, except per share data) |
|
(Unaudited) |
|
Three Months Ended June 30, |
Six Months Ended June 30, |
|||||||||||||||
|
2021 |
2020 |
2021 |
2020 |
|||||||||||||
|
Sales |
$ | 243,982 | $ | 123,970 | $ | 441,870 | $ | 300,918 | ||||||||
|
Cost of products sold |
192,076 | 99,965 | 349,978 | 240,612 | ||||||||||||
|
Gross profit |
51,906 | 24,005 | 91,892 | 60,306 | ||||||||||||
|
Operating expenses: |
||||||||||||||||
|
Research and development |
940 | 1,130 | 1,722 | 2,672 | ||||||||||||
|
Selling, general and administrative |
28,740 | 24,610 | 53,277 | 46,009 | ||||||||||||
|
Total operating expenses |
29,680 | 25,740 | 54,999 | 48,681 | ||||||||||||
|
Operating income (loss) |
22,226 | (1,735 |
) |
36,893 | 11,625 | |||||||||||
|
Other income (expense): |
||||||||||||||||
|
Interest expense |
(227 |
) |
(460 |
) |
(57 |
) |
(1,191 |
) |
||||||||
|
Interest and other income |
506 | 515 | 689 | 5 | ||||||||||||
|
Total other income (expense) |
279 | 55 | 632 | (1,186 |
) |
|||||||||||
|
Income (loss) from continuing operations before income taxes |
22,505 | (1,680 |
) |
37,525 | 10,439 | |||||||||||
|
Income tax expense (benefit) |
5,552 | (546 |
) |
9,042 | (169 |
) |
||||||||||
|
Income (loss) from continuing operations |
16,953 | (1,134 |
) |
28,483 | 10,608 | |||||||||||
|
Income (loss) from discontinued operations, net of income taxes |
- | (157 |
) |
81 | (4,021 |
) |
||||||||||
|
Net income (loss) |
16,953 | (1,291 |
) |
28,564 | 6,587 | |||||||||||
|
Less: net income attributable to non-controlling interest |
990 | 70 | 1,025 | 137 | ||||||||||||
|
Net income (loss) attributable to The Shyft Group Inc. |
$ | 15,963 | $ | (1,361 |
) |
$ | 27,539 | $ | 6,450 | |||||||
|
Basic earnings (loss) per share |
||||||||||||||||
|
Continuing operations |
$ | 0.45 | $ | (0.03 |
) |
$ | 0.78 | $ | 0.29 | |||||||
|
Discontinued operations |
- | (0.01 |
) |
- | (0.11 |
) |
||||||||||
|
Basic earnings (loss) per share |
$ | 0.45 | $ | (0.04 |
) |
$ | 0.78 | $ | 0.18 | |||||||
|
Diluted earnings (loss) per share |
||||||||||||||||
|
Continuing operations |
$ | 0.44 | $ | (0.03 |
) |
$ | 0.76 | $ | 0.29 | |||||||
|
Discontinued operations |
- | (0.01 |
) |
- | (0.11 |
) |
||||||||||
|
Diluted earnings (loss) per share |
$ | 0.44 | $ | (0.04 |
) |
$ | 0.76 | $ | 0.18 | |||||||
|
Basic weighted average common shares outstanding |
35,333 | 35,512 | 35,322 | 35,456 | ||||||||||||
|
Diluted weighted average common shares outstanding |
36,190 | 35,512 | 36,191 | 35,693 | ||||||||||||
|
The Shyft Group, Inc. and Subsidiaries |
|
Sales and Other Financial Information by Business Segment |
|
(Unaudited) |
|
Three Months Ended June 30, 2021 (in thousands of dollars) |
||||||||||||||||
|
Business Segments |
||||||||||||||||
|
Fleet Vehicles & Services |
Specialty Vehicles |
Other |
Consolidated |
|||||||||||||
|
Fleet vehicle sales |
$ | 159,826 | $ | - | $ | - | $ | 159,826 | ||||||||
|
Motorhome chassis sales |
- | 40,891 | - | 40,891 | ||||||||||||
|
Other specialty chassis and vehicles |
- | 29,415 | - | 29,415 | ||||||||||||
|
Aftermarket parts and assemblies |
8,447 | 5,403 | - | 13,850 | ||||||||||||
|
Total Sales |
$ | 168,273 | $ | 75,709 | $ | - | $ | 243,982 | ||||||||
|
Adjusted EBITDA |
$ | 28,287 | $ | 8,637 | $ | (8,354 | ) | $ | 28,570 | |||||||
|
The Shyft Group, Inc. and Subsidiaries |
|
Sales and Other Financial Information by Business Segment |
|
(Unaudited) |
|
Three Months Ended June 30, 2020 (in thousands of dollars) |
||||||||||||||||
|
Business Segments |
||||||||||||||||
|
Fleet Vehicles & Services |
Specialty Vehicles |
Other |
Consolidated |
|||||||||||||
|
Fleet vehicle sales |
$ | 90,762 | $ | - | $ | - | $ | 90,762 | ||||||||
|
Motorhome chassis sales |
- | 14,048 | - | 14,048 | ||||||||||||
|
Other specialty chassis and vehicles |
- | 10,929 | - | 10,929 | ||||||||||||
|
Aftermarket parts and assemblies |
6,476 | 1,755 | - | 8,231 | ||||||||||||
|
Total Sales |
$ | 97,238 | $ | 26,732 | $ | - | $ | 123,970 | ||||||||
|
Adjusted EBITDA |
$ | 13,652 | $ | 1,219 | $ | (5,521 | ) | $ | 9,350 | |||||||
|
Sales and Other Financial Information by Business Segment |
|
(Unaudited) |
|
Period End Backlog (amounts in thousands of dollars) |
||||||||||||||||||||
|
Jun. 30, 2021 |
Mar. 31, 2021 |
Dec. 31, 2020 |
Sept. 30, 2020 |
Jun. 30, 2020 |
||||||||||||||||
|
Fleet Vehicles and Services* |
$ | 660,908 | $ | 589,604 | $ | 427,338 | $ | 228,870 | $ | 286,955 | ||||||||||
|
Motorhome Chassis* |
56,294 | 42,742 | 31,580 | 40,387 | 38,804 | |||||||||||||||
|
Other Vehicles |
33,840 | 33,716 | 19,431 | 11,036 | 11,621 | |||||||||||||||
|
Aftermarket Parts and Accessories |
382 | 438 | 302 | 333 | 115 | |||||||||||||||
|
Total Specialty Vehicles |
90,516 | 76,896 | 51,313 | 51,756 | 50,540 | |||||||||||||||
|
Total Backlog |
$ | 751,424 | $ | 666,500 | $ | 478,651 | $ | 280,626 | $ | 337,495 | ||||||||||
|
* Anticipated time to fill backlog orders at June 30, 2021; five - twelve months for Fleet Vehicles and Services; less than three months for Specialty Vehicles. |
Reconciliation of Non-GAAP Financial Measures
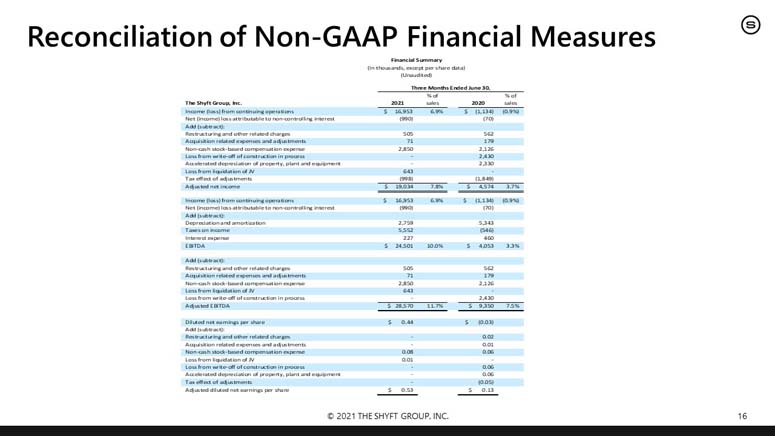
This release presents Adjusted EBITDA (earnings before interest, taxes, depreciation and amortization), adjusted net income, and adjusted earnings per share, each of which is a non-GAAP financial measure. These non-GAAP measures are calculated by excluding items that we believe to be infrequent or not indicative of our underlying operating performance, as well as certain non-cash expenses. We define Adjusted EBITDA as income from continuing operations before interest, income taxes, depreciation and amortization, as adjusted to eliminate the impact of restructuring charges, acquisition related expenses and adjustments, non-cash stock-based compensation expenses, and other gains and losses not reflective of our ongoing operations.
We present the non-GAAP measure Adjusted EBITDA because we consider it to be an important supplemental measure of our performance. The presentation of Adjusted EBITDA enables investors to better understand our operations by removing items that we believe are not representative of our continuing operations and may distort our longer-term operating trends. We believe this measure to be useful to improve the comparability of our results from period to period and with our competitors, as well as to show ongoing results from operations distinct from items that are infrequent or not indicative of our continuing operating performance. We believe that presenting this non-GAAP measure is useful to investors because it permits investors to view performance using the same tools that management uses to budget, make operating and strategic decisions, and evaluate our historical performance. We believe that the presentation of this non-GAAP measure, when considered together with the corresponding GAAP financial measures and the reconciliations to that measure, provides investors with additional understanding of the factors and trends affecting our business than could be obtained in the absence of this disclosure.
Our management uses Adjusted EBITDA to evaluate the performance of and allocate resources to our segments. Adjusted EBITDA is also used, along with other financial and non-financial measures, for purposes of determining annual incentive compensation for our management team and long-term incentive compensation for certain members of our management team.
|
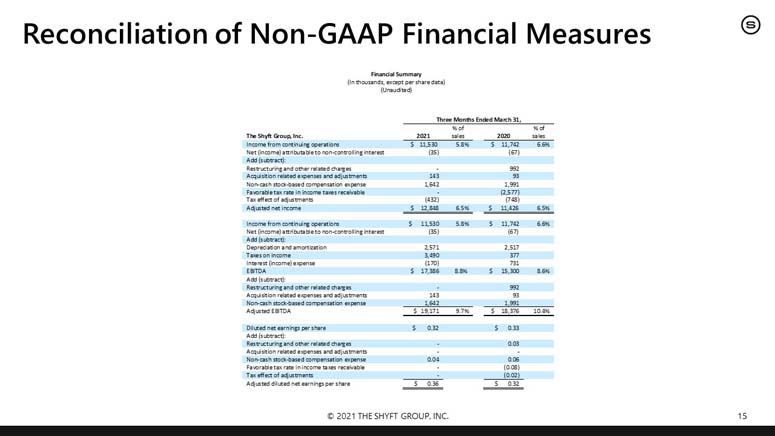
Financial Summary |
|
(In thousands, except per share data) |
|
(Unaudited) |
|
Three Months Ended June 30, |
||||||||||||||||
|
The Shyft Group, Inc. |
2021 |
% of sales |
2020 |
% of sales |
||||||||||||
|
Income (loss) from continuing operations |
$ | 16,953 | 6.9 | % | $ | (1,134 | ) | (0.9% | ) | |||||||
|
Net (income) loss attributable to non-controlling interest |
(990 | ) | (70 | ) | ||||||||||||
|
Add (subtract): |
||||||||||||||||
|
Restructuring and other related charges |
505 | 562 | ||||||||||||||
|
Acquisition related expenses and adjustments |
71 | 179 | ||||||||||||||
|
Non-cash stock-based compensation expense |
2,850 | 2,126 | ||||||||||||||
|
Loss from write-off of construction in process |
- | 2,430 | ||||||||||||||
|
Accelerated depreciation of property, plant and equipment |
- | 2,330 | ||||||||||||||
|
Loss from liquidation of JV |
643 | - | ||||||||||||||
|
Tax effect of adjustments |
(998 | ) | (1,849 | ) | ||||||||||||
|
Adjusted net income |
$ | 19,034 | 7.8 | % | $ | 4,574 | 3.7 | % | ||||||||
|
Income (loss) from continuing operations |
$ | 16,953 | 6.9 | % | $ | (1,134 | ) | (0.9% | ) | |||||||
|
Net (income) loss attributable to non-controlling interest |
(990 | ) | (70 | ) | ||||||||||||
|
Add (subtract): |
||||||||||||||||
|
Depreciation and amortization |
2,759 | 5,343 | ||||||||||||||
|
Taxes on income |
5,552 | (546 | ) | |||||||||||||
|
Interest expense |
227 | 460 | ||||||||||||||
|
EBITDA |
$ | 24,501 | 10.0 | % | $ | 4,053 | 3.3 | % | ||||||||
|
Add (subtract): |
||||||||||||||||
|
Restructuring and other related charges |
505 | 562 | ||||||||||||||
|
Acquisition related expenses and adjustments |
71 | 179 | ||||||||||||||
|
Non-cash stock-based compensation expense |
2,850 | 2,126 | ||||||||||||||
|
Loss from liquidation of JV |
643 | - | ||||||||||||||
|
Loss from write-off of construction in process |
- | 2,430 | ||||||||||||||
|
Adjusted EBITDA |
$ | 28,570 | 11.7 | % | $ | 9,350 | 7.5 | % | ||||||||
|
Diluted net earnings per share |
$ | 0.44 | $ | (0.03 | ) | |||||||||||
|
Add (subtract): |
||||||||||||||||
|
Restructuring and other related charges |
- | 0.02 | ||||||||||||||
|
Acquisition related expenses and adjustments |
- | 0.01 | ||||||||||||||
|
Non-cash stock-based compensation expense |
0.08 | 0.06 | ||||||||||||||
|
Loss from liquidation of JV |
0.01 | - | ||||||||||||||
|
Loss from write-off of construction in process |
- | 0.06 | ||||||||||||||
|
Accelerated depreciation of property, plant and equipment |
- | 0.06 | ||||||||||||||
|
Tax effect of adjustments |
- | (0.05 | ) | |||||||||||||
|
Adjusted diluted net earnings per share |
$ | 0.53 | $ | 0.13 | ||||||||||||
|
Financial Summary (Non-GAAP) |
|
Consolidated |
|
(In thousands, except per share data) |
|
(Unaudited) |
|
Forecast |
||||||||||||
|
Twelve Months Ended December 31, 2021 |
||||||||||||
|
The Shyft Group, Inc. |
Low |
Mid |
High |
|||||||||
|
Income from continuing operations |
$ | 54,728 | $ | 58,723 | $ | 62,028 | ||||||
|
Add: |
||||||||||||
|
Depreciation and amortization |
13,462 | 13,462 | 13,462 | |||||||||
|
Interest expense |
1,295 | 1,295 | 1,295 | |||||||||
|
Taxes |
19,093 | 20,098 | 21,793 | |||||||||
|
EBITDA |
$ | 88,578 | $ | 93,578 | $ | 98,578 | ||||||
|
Add (subtract): |
||||||||||||
|
Non-cash stock-based compensation and other charges |
11,422 | 11,422 | 11,422 | |||||||||
|
Adjusted EBITDA |
$ | 100,000 | $ | 105,000 | $ | 110,000 | ||||||
|
Earnings per share |
$ | 1.52 | $ | 1.62 | $ | 1.72 | ||||||
|
Add: |
||||||||||||
|
Non-cash stock-based compensation and other charges |
0.32 | 0.32 | 0.32 | |||||||||
|
Less tax effect of adjustments |
(0.09 | ) | (0.09 | ) | (0.09 | ) | ||||||
|
Adjusted earnings per share |
$ | 1.75 | $ | 1.85 | $ | 1.95 | ||||||
Exhibit 99.2


Serious News for Serious Traders! Try StreetInsider.com Premium Free!
You May Also Be Interested In
- Coastal Carolina Bancshares, Inc. Reports First Quarter Earnings
- The Michaels Organization Hosts Ribbon Cutting for New Affordable Multifamily Community in Fort Lupton, CO
- iManage to Present at ILTA EVOLVE Conference
Create E-mail Alert Related Categories
SEC FilingsSign up for StreetInsider Free!
Receive full access to all new and archived articles, unlimited portfolio tracking, e-mail alerts, custom newswires and RSS feeds - and more!
