

Form 8-K Presidio Property Trust, For: May 16
 Tweet
Tweet Share
Share
Exhibit 99.1

Presidio Property Trust, Inc. Announces Earnings for
the First Quarter Ended March 31, 2022
San Diego, California, May 16, 2022 – Presidio Property Trust, Inc. (Nasdaq: SQFT, SQFTP) (the “Company”), an internally managed, diversified real estate investment trust (“REIT”), today reported earnings for its first quarter ended March 31, 2022. All first quarter financial measures referenced herein are unaudited.
“We are pleased to report our first quarter earnings, continuing the strong performance that we saw throughout 2021,” said Jack Heilbron, the Company’s President and Chief Executive Officer. “In the first quarter of 2022, we collected 92% of total tenant billings, including 100% collections among our retail tenants. And just last week, we took advantage of our cash position, to pay off our loan on our 300 NP office property in Fargo, North Dakota in full, prudently deleveraging where it makes sense. That was our last commercial property loan maturing in 2022, with the next commercial property loan not maturing until the middle of 2024.”
“15 office, retail, and industrial leases were signed in the first quarter of 2022, with 7 new tenants and 8 existing tenant renewals,” noted Gary Katz, the Company’s Chief Investment Officer. “We saw continued leasing demand in the first quarter, in all our geographies, among a variety of tenants, including financial services and wireless tenants.”
First Quarter Ended March 31, 2022 Financial Results
Net loss attributable to the Company’s common stockholders for the three months ended March 31, 2022, was approximately $(3.8 million), or $(0.32) per basic and diluted share, compared to a net loss of $(2.6 million), or $(0.28) per basic and diluted share for the three months ended March 31, 2021. The change in net income attributable to the Company’s common stockholders was a result of:
| ● | A decrease in interest expense for the first quarter of 2022, after the sale of commercial properties in 2021 and payoff of the Polar Note, and | |
| ● | A gain on sale of real estate of 11 model homes sold in the first quarter of 2022, offset by a small loss on the sale of World Plaza | |
| ● | Off set by the preferred stock Series D dividends totaling approximately $0.5 million in Q1 2022, not experienced in Q1 2021. | |
| ● | A one-time Series A Warrant Divided totaling approximately $2.4 million granted in Q1 2022. |
FFO (non-GAAP) for the three months ended March 31, 2022, decreased by approximately $1 million to $(75,167) from $935,725 to the three months ended March 31, 2021, due primarily to the difference in loss (gain) on sale of real estate assets. A reconciliation of FFO to net income, the most directly comparable GAAP financial measure, is attached to this press release. However, because FFO excludes depreciation and amortization as well as the changes in the value of the Company’s properties that result from use or market conditions, each of which have real economic effects and could materially impact the Company’s results from operations, the utility of FFO as a measure of the Company’s performance is limited.
Acquisitions and Dispositions for the first quarter of 2022
| ● | World Plaza, which was sold on March 11, 2022, for approximately $10.0 million and the Company recognized a loss of approximately $0.3 million. |
| ● | The Company disposed of 11 model homes for approximately $5.6 million and recognized a gain of approximately $1.8 million. |
Dispositions during the first quarter of 2021:
| ● | Waterman Plaza, which was sold on January 28, 2021, for approximately $3.5 million and the Company recognized a loss of approximately $0.2 million. |
| ● | Garden Gateway, which was sold on February 19, 2021, for approximately $11.2 million and the Company recognized a loss of approximately $1.4 million. |
| ● | The Company disposed of 12 model homes for approximately $4.9 million and recognized a gain of approximately $0.4 million. |
Dividends paid during the first quarter of 2022:
| ● | During the first quarter of 2022, the Company paid a dividend of $0.105 per share to shareholders of Series A common stock |
| ● | During the first quarter of 2022, the Company paid three dividends in the total amount of $0.586 per share to shareholders of Series D preferred stock |
About Presidio Property Trust
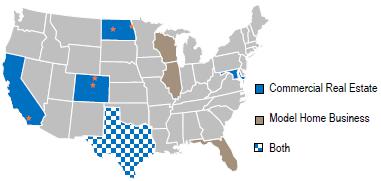
Presidio is an internally managed, diversified REIT with holdings in model home properties which are triple-net leased to homebuilders, office, industrial, and retail properties. Presidio’s model homes are leased to homebuilders located primarily in Texas and Florida. Our office, industrial and retail properties are located primarily in Colorado, with properties also located in Maryland, North Dakota, Texas, and Southern California. While geographical clustering of real estate enables us to reduce our operating costs through economies of scale by servicing a number of properties with less staff, it makes us susceptible to changing market conditions in these discrete geographic areas, including those that have developed as a result of COVID-19. Presidio is also the sponsor of the Special Purpose Acquisition Company (SPAC) Murphy Canyon Acquisition Corp. (MURFU), which currently holds approximately $140 million in trust. Murphy Canyon Acquisition Corp. is a blank check company formed for the purpose of effecting a merger, capital stock exchange, asset acquisition, stock purchase, reorganization or similar business combination with one or more businesses. The SPAC intends to focus on companies in the real estate industry, including construction, homebuilding, real estate owners and operators, arrangers of financing, insurance, and other services for real estate, and adjacent businesses and technologies targeting the real estate space with an aggregate combined enterprise value of approximately $300 million to $1.2 billion. For more information on Presidio, please visit the Company’s website at https://www.PresidioPT.com
Definitions
Non-GAAP Financial Measures
Funds from Operations (“FFO”) – The Company evaluates performance based on Funds From Operations, which we refer to as FFO, as management believes that FFO represents the most accurate measure of activity and is the basis for distributions paid to equity holders. The Company defines FFO as net income or loss (computed in accordance with GAAP), excluding gains (or losses) from sales of property, hedge ineffectiveness, acquisition costs of newly acquired properties that are not capitalized and lease acquisition costs that are not capitalized plus depreciation and amortization, including amortization of acquired above and below market lease intangibles and impairment charges on properties or investments in non-consolidated REITs, and after adjustments to exclude equity in income or losses from, and, to include the proportionate share of FFO from, non-consolidated REITs.
However, because FFO excludes depreciation and amortization as well as the changes in the value of the Company’s properties that result from use or market conditions, each of which have real economic effects and could materially impact the Company’s results from operations, the utility of FFO as a measure of the Company’s performance is limited. In addition, other REITs may not calculate FFO in accordance with the NAREIT definition as the Company does, and, accordingly, the Company’s FFO may not be comparable to other REITs’ FFO. Accordingly, FFO should be considered only as a supplement to net income as a measure of the Company’s performance.
Core Funds from Operations (“Core FFO”) – We calculate Core FFO by using FFO as defined by NAREIT and adjusting for certain other non-core items. We also exclude from our Core FFO calculation acquisition costs, loss on early extinguishment of debt, changes in the fair value of the earn-out, changes in fair value of contingent consideration, non-cash warrant dividends and the amortization of stock-based compensation.
We believe Core FFO provides a useful metric in comparing operations between reporting periods and in assessing the sustainability of our ongoing operating performance. Other equity REITs may calculate Core FFO differently or not at all, and, accordingly, the Company’s Core FFO may not be comparable to such other REITs’ Core FFO.
Cautionary Note Regarding Forward-Looking Statements
This press release contains statements that are “forward-looking statements” within the meaning of the Private Securities Litigation Reform Act of 1995, Section 27A of the Securities Act of 1933, as amended, and Section 21E of the Securities Exchange Act of 1934, as amended, and other federal securities laws. Forward-looking statements are statements that are not historical, including statements regarding management’s intentions, beliefs, expectations, representations, plans or predictions of the future, and are typically identified by such words as “believe,” “expect,” “anticipate,” “intend,” “estimate,” “may,” “will,” “should” and “could.” Because such statements include risks, uncertainties and contingencies, actual results may differ materially from those expressed or implied by such forward-looking statements. These forward-looking statements are based upon the Company’s present expectations, but these statements are not guaranteed to occur. Except as required by law, the Company disclaims any obligation to publicly update or revise any forward-looking statement to reflect changes in underlying assumptions or factors, of new information, data or methods, future events or other changes. Investors should not place undue reliance upon forward-looking statements. For further discussion of the factors that could affect outcomes, please refer to the “ Risk Factors” section of the Company’s documents filed with the SEC, copies of which are available on the SEC’s website, www.sec.gov.
Investor Relations Contacts:
Presidio Property Trust, Inc.
Lowell Hartkorn, Investor Relations
Telephone: (760) 471-8536 x1244
Presidio Property Trust, Inc. and Subsidiaries
Condensed Consolidated Balance Sheets
| March 31, | December 31, | |||||||
| 2022 | 2021 | |||||||
| (Unaudited) | ||||||||
| ASSETS | ||||||||
| Real estate assets and lease intangibles: | ||||||||
| Land | $ | 18,065,246 | $ | 21,136,379 | ||||
| Buildings and improvements | 114,976,059 | 119,224,375 | ||||||
| Tenant improvements | 11,884,924 | 12,752,518 | ||||||
| Lease intangibles | 4,110,139 | 4,110,139 | ||||||
| Real estate assets and lease intangibles held for investment, cost | 149,036,368 | 157,223,411 | ||||||
| Accumulated depreciation and amortization | (29,468,491 | ) | (30,589,969 | ) | ||||
| Real estate assets and lease intangibles held for investment, net | 119,567,877 | 126,633,442 | ||||||
| Real estate assets held for sale, net | 7,282,326 | 11,431,494 | ||||||
| Real estate assets, net | 126,850,203 | 138,064,936 | ||||||
| Cash, cash equivalents and restricted cash | 22,494,595 | 14,702,089 | ||||||
| Deferred leasing costs, net | 1,115,295 | 1,348,234 | ||||||
| Goodwill | 2,423,000 | 2,423,000 | ||||||
| Other assets, net | 3,992,267 | 4,658,504 | ||||||
| Investments held in Trust (see Notes 2 & 11) | 134,905,182 | — | ||||||
| TOTAL ASSETS | $ | 291,780,542 | $ | 161,196,763 | ||||
| LIABILITIES AND EQUITY | ||||||||
| Liabilities: | ||||||||
| Mortgage notes payable, net | $ | 88,658,485 | $ | 87,324,319 | ||||
| Mortgage notes payable related to properties held for sale, net | 4,180,971 | 1,535,513 | ||||||
| Mortgage notes payable, total net | 92,839,456 | 88,859,832 | ||||||
| Note payable, net | — | — | ||||||
| Accounts payable and accrued liabilities | 3,480,915 | 4,569,537 | ||||||
| Accounts payable and accrued liabilities of SPAC (see Notes 2 & 11) | 4,703,232 | 15,499 | ||||||
| Accrued real estate taxes | 1,405,957 | 1,940,913 | ||||||
| Dividends payable preferred stock | 179,685 | 179,685 | ||||||
| Lease liability, net | 68,573 | 75,547 | ||||||
| Below-market leases, net | 59,407 | 73,130 | ||||||
| Total liabilities | 102,737,225 | 95,714,143 | ||||||
| Commitments and contingencies (Note 9 & 11) | ||||||||
| SPAC Class A common stock subject to possible redemption; 13,225,000 shares (at $10.20 per share), net of issuance cost of $6.4 million | 128,534,952 | — | ||||||
| Equity: | ||||||||
| Series D Preferred Stock, $0.01 par value per share; 1,000,000 shares authorized; 920,000 shares issued and outstanding (liquidation preference $25.00 per share) as of March 31, 2022 and December 31, 2021, respectively | 9,200 | 9,200 | ||||||
| Series A Common Stock, $0.01 par value per share, shares authorized: 100,000,000; 11,795,970 shares and 11,599,720 shares were issued and outstanding at March 31, 2022 and December 31, 2021, respectively | 117,960 | 115,997 | ||||||
| Additional paid-in capital | 183,231,322 | 186,492,012 | ||||||
| Dividends and accumulated losses | (133,613,228 | ) | (130,947,434 | ) | ||||
| Total stockholders’ equity before noncontrolling interest | 49,745,254 | 55,669,775 | ||||||
| Noncontrolling interest | 10,763,111 | 9,812,845 | ||||||
| Total equity | 60,508,365 | 65,482,620 | ||||||
| TOTAL LIABILITIES AND EQUITY | $ | 291,780,542 | $ | 161,196,763 | ||||
Presidio Property Trust, Inc. and Subsidiaries
Condensed Consolidated Statements of Operations
(Unaudited)
| For the Three Months Ended March 31, | ||||||||
| 2022 | 2021 | |||||||
| Revenues: | ||||||||
| Rental income | $ | 4,452,318 | $ | 5,477,223 | ||||
| Fees and other income | 120,823 | 191,531 | ||||||
| Total revenue | 4,573,141 | 5,668,754 | ||||||
| Costs and expenses: | ||||||||
| Rental operating costs | 1,583,473 | 1,838,923 | ||||||
| General and administrative | 1,583,691 | 1,537,265 | ||||||
| Depreciation and amortization | 1,339,225 | 1,428,934 | ||||||
| Impairment of real estate assets | — | 300,000 | ||||||
| Total costs and expenses | 4,506,389 | 5,105,122 | ||||||
| Other income (expense): | ||||||||
| Interest expense-mortgage notes | (1,017,713 | ) | (1,305,021 | ) | ||||
| Interest expense - note payable | — | (279,373 | ) | |||||
| Interest and other (expense), net | 73,605 | (32,785 | ) | |||||
| Gain on sales of real estate, net | 1,522,785 | (1,161,328 | ) | |||||
| Gain on extinguishment of government debt | — | 10,000 | ||||||
| Income tax expense | (265,239 | ) | (50,199 | ) | ||||
| Total other income (expense), net | 313,438 | (2,818,706 | ) | |||||
| Net income (loss) | 380,190 | (2,255,074 | ) | |||||
| Less: Income attributable to noncontrolling interests | (1,208,676 | ) | (406,608 | ) | ||||
| Net loss attributable to Presidio Property Trust, Inc. stockholders | $ | (828,486 | ) | $ | (2,661,682 | ) | ||
| Less: Preferred Stock Series D dividends | (539,056 | ) | — | |||||
| Less: Series A Warrant dividend | (2,456,511 | ) | — | |||||
| Net loss attributable to Presidio Property Trust, Inc. common stockholders | $ | (3,824,053 | ) | $ | (2,661,682 | ) | ||
| Net loss per share attributable to Presidio Property Trust, Inc. common stockholders: | ||||||||
| Basic & Diluted | $ | (0.32 | ) | $ | (0.28 | ) | ||
| Weighted average number of common shares outstanding - basic & diluted | 11,773,649 | 9,508,363 | ||||||
Presidio Property Trust, Inc. and Subsidiaries
Reconciliation of Net Income to FFO and Core FFO
(Unaudited)
| For the Three Months Ended March 31, | ||||||||
| 2022 | 2021 | |||||||
| Net (loss) income attributable to Presidio Property Trust, Inc. common stockholders | $ | (3,824,053 | ) | $ | (2,661,682 | ) | ||
| Adjustments: | ||||||||
| Income attributable to noncontrolling interests | 1,208,676 | 406,608 | ||||||
| Depreciation and amortization | 1,339,225 | 1,428,934 | ||||||
| Amortization of above and below market leases, net | (13,723 | ) | (1,010 | ) | ||||
| Impairment of real estate assets | - | 300,000 | ||||||
| Loss (Gain) on sale of real estate assets | (1,522,785 | ) | 1,161,328 | |||||
| FFO | $ | (2,812,660 | ) | $ | 634,178 | |||
| Stock Based Compensation | 280,982 | 301,547 | ||||||
| 2,456,511 | — | |||||||
| Core FFO | $ | (75,167 | ) | $ | 935,725 | |||
| Weighted average number of common shares outstanding - basic | 11,773,649 | 9,508,363 | ||||||
| Core FFO / Wgt Avg Share | $ | (0.01 | ) | $ | 0.10 | |||
Exhibit 99.2


SUPPLEMENTAL FINANCIAL INFORMATION
As of March 31, 2022
| FORWARD-LOOKING STATEMENTS |  |
This presentation contains “forward-looking statements” within the meaning of the federal securities laws that involve risks and uncertainties, many of which are beyond our control. Our actual results could differ materially and adversely from those anticipated in such forward-looking statements as a result of certain factors, including those set forth in the Quarterly Report on Form 10-Q. Forward-looking statements relate to matters such as our industry, business strategy, goals and expectations concerning our market position, future operations, margins, profitability, capital expenditures, financial condition, liquidity, capital resources, cash flows, dividends, results of operations and other financial and operating information. When used in this presentation, the words “will,” “may,” “believe,” “anticipate,” “intend,” “estimate,” “expect,” “should,” “project,” “plan,” and similar expressions are intended to identify forward-looking statements, although not all forward-looking statements contain such identifying words.
The forward-looking statements contained in this presentation are based on historical performance and management’s current plans, estimates and expectations in light of information currently available to it and are subject to uncertainty and changes in circumstances. There can be no assurance that future developments affecting us will be those that we have anticipated. Actual results may differ materially from these expectations due to the factors, risks and uncertainties described in the Annual Report on Form 10-K, as filed March 30, 2022 (“Annual Report”) and the Company’s Quarterly Report on Form 10-Q filed with the SEC on the date hereof (“Quarterly Report”), changes in global, regional or local political, economic, business, competitive, market, regulatory and other factors described in the “Risk Factors” section of the Annual Report and the Quarterly Report, many of which are beyond our control. Should one or more of these risks or uncertainties materialize or should any of our assumptions prove to be incorrect, our actual results may vary in material respects from what we may have expressed or implied by these forward-looking statements. We caution that you should not place undue reliance on any of our forward-looking statements. Any forward-looking statement made by us in this presentation speaks only as of the date on which we make it. Factors or events that could cause our actual results to differ may emerge from time to time, and it is not possible for us to predict all of them. We undertake no obligation to publicly update any forward-looking statement, whether as a result of new information, future developments or otherwise, except as may be required by applicable securities laws.
| COMPANY OVERVIEW | |

| ● | Presidio Property Trust, Inc. (“Presidio” or the “Company”) was founded in 1999 as NetREIT |
| ● | Presidio is an internally managed real estate company focused on commercial real estate opportunities in often overlooked and regionally dominant markets |
| ● | The Company acquires, owns and manages office and industrial real estate assets in markets with strong demographic and economic drivers with attractive going-in cap rates |
| ● | Presidio’s commercial portfolio currently includes 12 commercial properties with a book value of approximately $94 million |
| ● | In addition to its commercial real estate holdings, Presidio generates fees and rental income from affiliated entities, which manage and/or own a portfolio of model homes (1) |
| Corporate Information | |
| Headquarters | San Diego, CA |
| Founded | 1999 |
| Key Geographies | CA, CO, ND, TX & MD |
| Employees | 18 |
| Portfolio Summary (Number / Square Footage) | |
| Office | 8 properties / 605,763 sq. ft. |
| Retail | 3 properties / 65,242 sq. ft. |
| Industrial | 1 property / 150,030 sq. ft. |
| Model Homes (1) | 5 funds / 85 homes |
| Portfolio Value & Debt | |
| Book Value | $126.9 million (2) |
| Existing Secured Debt | $93.5 million |
(1) The Company holds partial ownership interests in several entities which own model home properties
(2) Includes book value of model homes
 |
 |
| COMMERCIAL PORTFOLIO | |
| ($ in000’s) Property Location | Sq., Ft. | Date Acquired | Year Property Constructed | Purchase Price (1) | Occupancy | Percent Ownership | Mortgage On property | |||||||||||||||||
| Office/Industrial Properties: | ||||||||||||||||||||||||
| Genesis Plaza, San Diego, CA (2) | 57,807 | 08/10 | 1989 | 10,000 | 85.6 | % | 76.4 | % | 6,140 | |||||||||||||||
| Dakota Center, Fargo, ND | 119,184 | 05/11 | 1982 | 9,575 | 72.1 | % | 100.0 | % | 9,618 | |||||||||||||||
| Grand Pacific Center, Bismarck, ND (3) | 93,000 | 03/14 | 1976 | 5,350 | 56.6 | % | 100.0 | % | 3,589 | |||||||||||||||
| Arapahoe Center, Colorado Springs, CO | 79,023 | 12/14 | 2000 | 11,850 | 100.0 | % | 100.0 | % | 7,728 | |||||||||||||||
| West Fargo Industrial, West Fargo, ND | 150,099 | 08/15 | 1998/2005 | 7,900 | 87.5 | % | 100.0 | % | 4,119 | |||||||||||||||
| 300 N.P., West Fargo, ND | 34,517 | 08/15 | 1922 | 3,850 | 60.1 | % | 100.0 | % | 2,222 | |||||||||||||||
| One Park Centre, Westminster CO | 69,174 | 08/15 | 1983 | 9,150 | 80.5 | % | 100.0 | % | 6,248 | |||||||||||||||
| Shea Center II, Highlands Ranch, CO | 121,306 | 12/15 | 2000 | 25,325 | 90.3 | % | 100.0 | % | 17,427 | |||||||||||||||
| Baltimore, Baltimore, MD | 31,752 | 12/21 | 2006 | 8,685 | 100.0 | % | 100.0 | % | 5,670 | |||||||||||||||
| Total Office/Industrial Properties | 755,862 | $ | 91,685 | 81.5 | % | $ | 62,761 | |||||||||||||||||
| Retail Properties: | ||||||||||||||||||||||||
| Union Town Center, Colorado Springs, CO | 44,042 | 12/14 | 2003 | 11,212 | 87.4 | % | 100.0 | % | 8,136 | |||||||||||||||
| Research Parkway, Colorado Springs, CO | 10,700 | 08/15 | 2003 | 2,850 | 100.0 | % | 100.0 | % | 1,691 | |||||||||||||||
| Mandolin, Houston, TX | 10,500 | 08/21 | 2021 | 4,892 | 100.0 | % | 61.3 | % | — | |||||||||||||||
| Total Retail Properties | 65,242 | $ | 18,954 | 91.5 | % | $ | 9,827 | |||||||||||||||||
| 821,104 | $ | 110,639 | 82.3 | % | $ | 72,588 | ||||||||||||||||||
| (1) | Prior to January 1, 2009, “Purchase Price” includes our acquisition related costs and expenses for the purchase of the property. After January 1, 2009, acquisition related costs and expenses were expensed when incurred until ASU 2017-01 was adopted by the Company in 2017. Since then, acquisition related costs for real estate acquisitions that do not meet the definition of a business, are capitalized. |
| (2) | Genesis Plaza is owned by two tenants-in-common, each of which own 57% and 43%, respectively, and we beneficially own an aggregate of 76.4%, based on our ownership percentages of each tenant-in-common. |
| (3) | Property held for sale as of March 31, 2022. |
| MODEL HOMES PORTFOLIO | |
| Region | No. of Properties | Aggregate Square Feet | Approximate % of Aggregate Square Feet | Current Annual Base Rent | Approximate % of Aggregate Annual Rent | Purchase Price | Current Mortgage Balance | |||||||||||||||||||||
| Southwest | 82 | 250,328 | 96.2 | % | $ | 2,416,092 | 94.6 | % | $ | 32,806,304 | $ | 20,231,296 | ||||||||||||||||
| Northeast | 2 | 6,153 | 2.4 | % | 80,844 | 3.2 | % | 898,250 | 299,904 | |||||||||||||||||||
| Midwest | 1 | 3,663 | 1.4 | % | 57,420 | 2.2 | % | 638,000 | 392,998 | |||||||||||||||||||
| Total | 85 | 260,144 | 100.0 | % | $ | 2,554,356 | 100.0 | % | $ | 34,342,554 | $ | 20,924,198 | ||||||||||||||||
| CONSOLIDATED BALANCE SHEET | |
| March 31, | December 31, | |||||||
| 2022 | 2021 | |||||||
| (Unaudited) | ||||||||
| ASSETS | ||||||||
| Real estate assets and lease intangibles: | ||||||||
| Land | $ | 18,065,246 | $ | 21,136,379 | ||||
| Buildings and improvements | 114,976,059 | 119,224,375 | ||||||
| Tenant improvements | 11,884,924 | 12,752,518 | ||||||
| Lease intangibles | 4,110,139 | 4,110,139 | ||||||
| Real estate assets and lease intangibles held for investment, cost | 149,036,368 | 157,223,411 | ||||||
| Accumulated depreciation and amortization | (29,468,491 | ) | (30,589,969 | ) | ||||
| Real estate assets and lease intangibles held for investment, net | 119,567,877 | 126,633,442 | ||||||
| Real estate assets held for sale, net | 7,282,326 | 11,431,494 | ||||||
| Real estate assets, net | 126,850,203 | 138,064,936 | ||||||
| Cash, cash equivalents and restricted cash | 22,494,595 | 14,702,089 | ||||||
| Deferred leasing costs, net | 1,115,295 | 1,348,234 | ||||||
| Goodwill | 2,423,000 | 2,423,000 | ||||||
| Other assets, net | 3,992,267 | 4,658,504 | ||||||
| Investments held in Trust (see Notes 2 & 11) | 134,905,182 | — | ||||||
| TOTAL ASSETS | $ | 291,780,542 | $ | 161,196,763 | ||||
| LIABILITIES AND EQUITY | ||||||||
| Liabilities: | ||||||||
| Mortgage notes payable, net | $ | 88,658,485 | $ | 87,324,319 | ||||
| Mortgage notes payable related to properties held for sale, net | 4,180,971 | 1,535,513 | ||||||
| Mortgage notes payable, total net | 92,839,456 | 88,859,832 | ||||||
| Note payable, net | — | — | ||||||
| Accounts payable and accrued liabilities | 3,480,915 | 4,569,537 | ||||||
| Accounts payable and accrued liabilities of SPAC (see Notes 2 & 11) | 4,703,232 | 15,499 | ||||||
| Accrued real estate taxes | 1,405,957 | 1,940,913 | ||||||
| Dividends payable preferred stock | 179,685 | 179,685 | ||||||
| Lease liability, net | 68,573 | 75,547 | ||||||
| Below-market leases, net | 59,407 | 73,130 | ||||||
| Total liabilities | 102,737,225 | 95,714,143 | ||||||
| Commitments and contingencies (Note 9 & 11) | ||||||||
| SPAC Class A common stock subject to possible redemption; 13,225,000 shares (at $10.20 per share), net of issuance cost of $6.4 million | 128,534,952 | — | ||||||
| Equity: | ||||||||
| Series D Preferred Stock, $0.01 par value per share; 1,000,000 shares authorized; 920,000 shares issued and outstanding (liquidation preference $25.00 per share) as of March 31, 2022 and December 31, 2021, respectively | 9,200 | 9,200 | ||||||
| Series A Common Stock, $0.01 par value per share, shares authorized: 100,000,000; 11,795,970 shares and 11,599,720 shares were issued and outstanding at March 31, 2022 and December 31, 2021, respectively | 117,960 | 115,997 | ||||||
| Additional paid-in capital | 183,231,322 | 186,492,012 | ||||||
| Dividends and accumulated losses | (133,613,228 | ) | (130,947,434 | ) | ||||
| Total stockholders’ equity before noncontrolling interest | 49,745,254 | 55,669,775 | ||||||
| Noncontrolling interest | 10,763,111 | 9,812,845 | ||||||
| Total equity | 60,508,365 | 65,482,620 | ||||||
| TOTAL LIABILITIES AND EQUITY | $ | 291,780,542 | $ | 161,196,763 | ||||
| CONSOLIDATED STATEMENT OF OPERATIONS | |
| For the Three Months Ended March 31, | ||||||||
| 2022 | 2021 | |||||||
| Revenues: | ||||||||
| Rental income | $ | 4,452,318 | $ | 5,477,223 | ||||
| Fees and other income | 120,823 | 191,531 | ||||||
| Total revenue | 4,573,141 | 5,668,754 | ||||||
| Costs and expenses: | ||||||||
| Rental operating costs | 1,583,473 | 1,838,923 | ||||||
| General and administrative | 1,583,691 | 1,537,265 | ||||||
| Depreciation and amortization | 1,339,225 | 1,428,934 | ||||||
| Impairment of real estate assets | — | 300,000 | ||||||
| Total costs and expenses | 4,506,389 | 5,105,122 | ||||||
| Other income (expense): | ||||||||
| Interest expense-mortgage notes | (1,017,713 | ) | (1,305,021 | ) | ||||
| Interest expense - note payable | — | (279,373 | ) | |||||
| Interest and other (expense), net | 73,605 | (32,785 | ) | |||||
| Gain on sales of real estate, net | 1,522,785 | (1,161,328 | ) | |||||
| Gain on extinguishment of government debt | — | 10,000 | ||||||
| Income tax expense | (265,239 | ) | (50,199 | ) | ||||
| Total other income (expense), net | 313,438 | (2,818,706 | ) | |||||
| Net income (loss) | 380,190 | (2,255,074 | ) | |||||
| Less: Income attributable to noncontrolling interests | (1,208,676 | ) | (406,608 | ) | ||||
| Net loss attributable to Presidio Property Trust, Inc. stockholders | $ | (828,486 | ) | $ | (2,661,682 | ) | ||
| Less: Preferred Stock Series D dividends | (539,056 | ) | — | |||||
| Less: Series A Warrant dividend | (2,456,511 | ) | — | |||||
| Net loss attributable to Presidio Property Trust, Inc. common stockholders | $ | (3,824,053 | ) | $ | (2,661,682 | ) | ||
| Net loss per share attributable to Presidio Property Trust, Inc. common stockholders: | ||||||||
| Basic & Diluted | $ | (0.32 | ) | $ | (0.28 | ) | ||
| Weighted average number of common shares outstanding - basic & diluted | 11,773,649 | 9,508,363 | ||||||
| CONSOLIDATED STATEMENT OF CASH FLOWS | |
| For the Three Months Ended March 31, | ||||||||
| 2022 | 2021 | |||||||
| Cash flows from operating activities: | ||||||||
| Net income (loss) | $ | 380,190 | $ | (2,255,074 | ) | |||
| Adjustments to reconcile net loss to net cash used in operating activities: | ||||||||
| Depreciation and amortization | 1,339,225 | 1,428,934 | ||||||
| Stock compensation | 280,981 | 301,547 | ||||||
| Bad debt expense | 13,416 | — | ||||||
| Loss (Gain) on sale of real estate assets, net | (1,522,785 | ) | 1,161,328 | |||||
| Gain on extinguishment of government debt | — | (10,000 | ) | |||||
| Net change in fair value marketable securities | 68,962 | — | ||||||
| Impairment of real estate assets | — | 300,000 | ||||||
| Amortization of financing costs | 65,018 | 261,779 | ||||||
| Amortization of above-market leases | — | 18,027 | ||||||
| Amortization of below-market leases | (13,723 | ) | (19,037 | ) | ||||
| Straight-line rent adjustment | (19,660 | ) | (132,990 | ) | ||||
| Changes in operating assets and liabilities: | ||||||||
| Other assets | 295,357 | 481,459 | ||||||
| Accounts payable and accrued liabilities | (1,330,285 | ) | (1,980,474 | ) | ||||
| Accrued real estate taxes | (534,956 | ) | (1,023,680 | ) | ||||
| Net cash used in operating activities | (978,260 | ) | (1,468,181 | ) | ||||
| Cash flows from investing activities: | ||||||||
| Real estate acquisitions | (2,427,890 | ) | — | |||||
| Additions to buildings and tenant improvements | (319,737 | ) | (100,765 | ) | ||||
| Investment in marketable securities | (172,866 | ) | — | |||||
| Proceeds from sale of marketable securities | 755,989 | — | ||||||
| Investment of SPAC IPO proceeds into Trust Account | (134,895,000 | ) | — | |||||
| Additions to deferred leasing costs | (18,352 | ) | (37,585 | ) | ||||
| Proceeds from sales of real estate, net | 14,763,130 | 19,047,906 | ||||||
| Net cash provided by (used in) investing activities | (122,314,726 | ) | 18,909,556 | |||||
| Cash flows from financing activities: | ||||||||
| Proceeds from mortgage notes payable, net of issuance costs | 7,365,855 | 6,013,700 | ||||||
| Repayment of mortgage notes payable | (3,275,234 | ) | (17,231,730 | ) | ||||
| Repayment of note payable | — | (7,675,598 | ) | |||||
| Payment of deferred offering costs | (3,159,411 | ) | (70,276 | ) | ||||
| Distributions to noncontrolling interests, net | (258,410 | ) | (2,034,212 | ) | ||||
| Proceeds from initial public offering of SPAC | 132,250,000 | — | ||||||
| Dividends paid to preferred stockholders | (539,056 | ) | — | |||||
| Dividends paid to common stockholders | (1,298,252 | ) | (998,795 | ) | ||||
| Net cash provided by (used in) financing activities | 131,085,492 | (21,996,911 | ) | |||||
| Net increase (decrease) in cash equivalents and restricted cash | 7,792,506 | (4,555,536 | ) | |||||
| Cash, cash equivalents and restricted cash - beginning of period | 14,702,089 | 11,540,917 | ||||||
| Cash, cash equivalents and restricted cash - end of period | $ | 22,494,595 | $ | 6,985,381 | ||||
| Supplemental disclosure of cash flow information: | ||||||||
| Interest paid-mortgage notes payable | $ | 951,727 | $ | 1,239,193 | ||||
| Interest paid-notes payable | $ | — | $ | 103,861 | ||||
| Non-cash financing activities: | ||||||||
| Deferred offering cost SPAC, underwriting commission payable | $ | 4,628,750 | $ | — | ||||
| Dividends payable - Preferred Stock Series D | $ | 179,685 | $ | — | ||||
| EBITDAre RECONCILIATION | |
| For the Three Months Ended | ||||||||
| 03/31/22 | 03/31/21 | |||||||
| Net (loss) income attributable to Presidio Property Trust, Inc. common stockholders | $ | (3,824,053 | ) | $ | (2,661,682 | ) | ||
| Adjustments: | ||||||||
| Interest Expense | 1,017,713 | 1,584,394 | ||||||
| Depreciation and Amortization | 1,325,502 | 1,427,924 | ||||||
| Asset Impairments | — | 300,000 | ||||||
| Net Loss on Sales of RE | (1,522,785 | ) | 1,161,328 | |||||
| Gain Extinguishment of Government Debt | — | (10,000 | ) | |||||
| Income Taxes | 265,239 | 50,199 | ||||||
| EBITDAre | $ | (2,738,384 | ) | $ | 1,852,163 | |||
| FFO AND CORE FFO RECONCILIATION | |
| For the Years Ended | ||||||||
| 12/31/2021 | 12/31/2020 | |||||||
| Net (loss) income attributable to Presidio Property Trust, Inc. common stockholders | $ | (3,824,053 | ) | $ | (2,661,682 | ) | ||
| Adjustments: | ||||||||
| Income attributable to noncontrolling interests | 1,208,676 | 406,608 | ||||||
| Depreciation and amortization | 1,339,225 | 1,428,934 | ||||||
| Amortization of above and below market leases, net | (13,723 | ) | (1,010 | ) | ||||
| Impairment of real estate assets | — | 300,000 | ||||||
| Loss (gain) on sale of real estate assets, net | (1,522,785 | ) | 1,161,328 | |||||
| FFO | $ | (2,812,660 | ) | $ | 634,178 | |||
| Restricted stock compensation | 280,982 | 301,547 | ||||||
| Series A Warrant dividend | (2,456,511 | |||||||
| Core FFO | $ | (75,167 | ) | $ | 935,725 | |||
| Weighted average number of common shares outstanding - basic and diluted | 11,773,649 | 9,508,363 | ||||||
| Core FFO / Wgt Avg Share | $ | (0.01 | ) | $ | 0.10 | |||
| SEGMENT DATA |


| DEFINITIONS – NON-GAAP MEASUREMENTS | |
EBITDAre - EBITDAre is defined by NAREIT as earnings before interest, taxes, depreciation and amortization, gain or loss on disposal of depreciated assets, and impairment write-offs.
Funds from Operations (“FFO”) – The Company evaluates performance based on Funds From Operations, which we refer to as FFO, as management believes that FFO represents the most accurate measure of activity and is the basis for distributions paid to equity holders. The Company defines FFO, a non-GAAP measure, as net income or loss (computed in accordance with GAAP), excluding gains (or losses) from sales of property, hedge ineffectiveness, acquisition costs of newly acquired properties that are not capitalized and lease acquisition costs that are not capitalized plus depreciation and amortization, including amortization of acquired above and below market lease intangibles and impairment charges on properties or investments in non-consolidated REITs, and after adjustments to exclude equity in income or losses from, and, to include the proportionate share of FFO from, non-consolidated REITs.
However, because FFO excludes depreciation and amortization as well as the changes in the value of the Company’s properties that result from use or market conditions, each of which have real economic effects and could materially impact the Company’s results from operations, the utility of FFO as a measure of the Company’s performance is limited. In addition, other REITs may not calculate FFO in accordance with the NAREIT definition as the Company does, and, accordingly, the Company’s FFO may not be comparable to other REITs’ FFO. Accordingly, FFO should be considered only as a supplement to net income as a measure of the Company’s performance.
Core Funds from Operations (“Core FFO”) – We calculate Core FFO, a non-GAAP measure, by using FFO as defined by NAREIT and adjusting for certain other non-core items. We also exclude from our Core FFO calculation acquisition costs, loss on early extinguishment of debt, changes in the fair value of the earn-out, changes in fair value of contingent consideration, non-cash warrant dividends and the amortization of stock-based compensation.
We believe Core FFO provides a useful metric in comparing operations between reporting periods and in assessing the sustainability of our ongoing operating performance. Other equity REITs may calculate Core FFO differently or not at all, and, accordingly, the Company’s Core FFO may not be comparable to such other REITs’ Core FFO.
Serious News for Serious Traders! Try StreetInsider.com Premium Free!
You May Also Be Interested In
- Genie Energy to Report First Quarter 2024 Results
- Hanryu Holdings, Inc. Announces Receipt of a Delinquency Compliance Alert Notice from Nasdaq
- Elavon and FreedomPay to transform payments for hospitality and retail in Europe
Create E-mail Alert Related Categories
SEC FilingsSign up for StreetInsider Free!
Receive full access to all new and archived articles, unlimited portfolio tracking, e-mail alerts, custom newswires and RSS feeds - and more!
