

Form 8-K Pathfinder Acquisition For: Sep 17
 Tweet
Tweet Share
ShareExhibit 99.1


x x x x x x x x x x x x


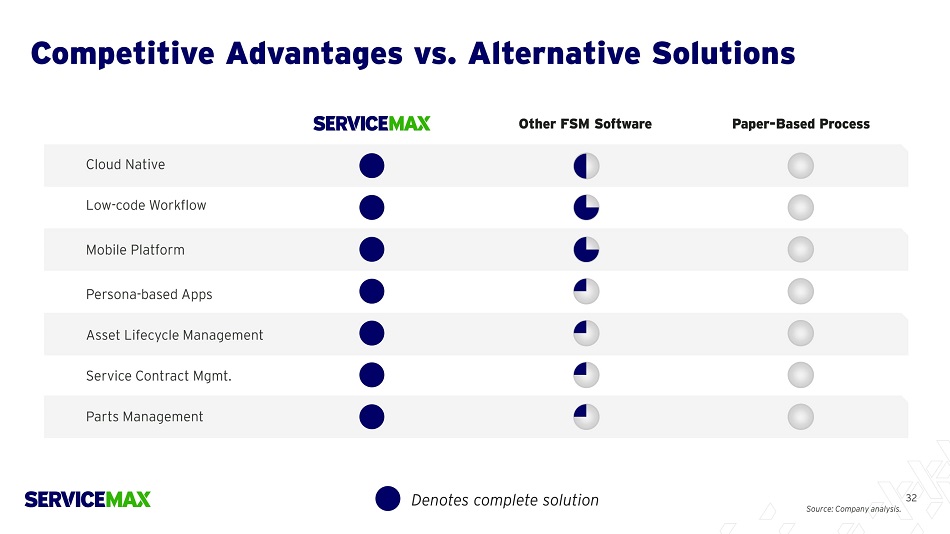
▪ ▪ ▪ ▪
▪ ▪ ▪ ▪ ▪ ▪ ▪ ▪ ▪ ▪ ▪


▪ ▪ ▪ ▪ ▪ ▪ ▪ ▪ ▪ ▪ ▪ ▪


▪ ▪ ▪ ▪ ▪ ▪ ▪ ▪ ▪ ▪

▪ ▪ ▪ ▪ ▪

▪ ▪ ▪ ▪

▪ ▪ ▪ ▪ ▪ ▪ ▪ ▪ ▪ ▪ ▪ ▪ ▪ ▪ ▪ ▪ ▪ ▪ ▪ ▪


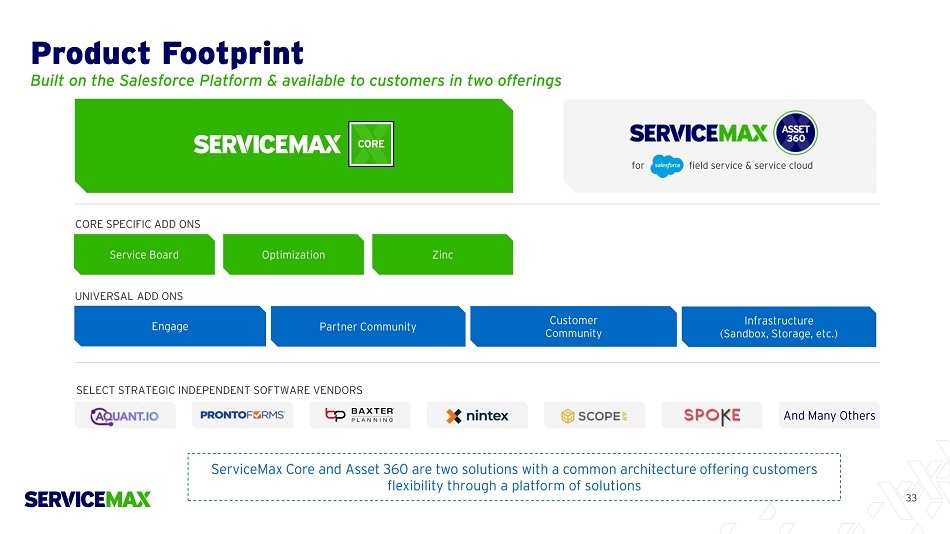


▪ ▪ ▪

▪ ▪ ▪

▪ ▪ ▪

▪ ▪ ▪

▪ ▪ ▪ ▪

▪ ▪ ▪ ▪ ▪


▪ ▪ ▪ ▪ ▪

▪ ▪ ▪ ▪ ▪

▪ ▪ ▪ ▪ ▪ ▪ ▪ ▪ ▪ ▪ ▪ ▪ ▪ ▪


▪ ▪ ▪ ▪ ▪ ▪ ▪ ▪ ▪

▪ ▪ ▪ ▪ ▪ ▪ ▪ ▪ ▪ ▪ ▪ ▪


▪ ▪ ▪ ▪ ▪ ▪

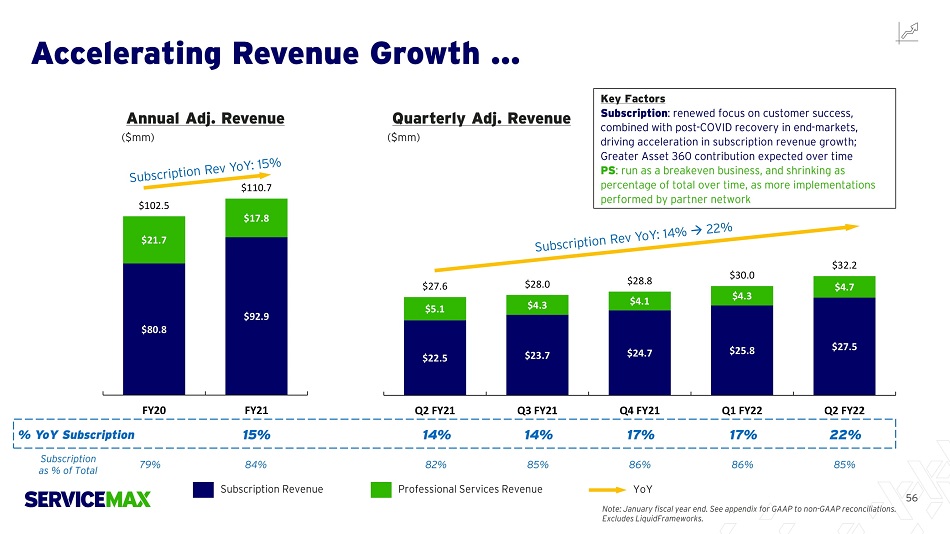
$22.5 $23.7 $24.7 $ 2 5 . 8 $27.5 $ 5 .1 $4.3 $4.1 $4.3 $4.7 $ 2 7.6 $28.0 $28.8 $30.0 $32 .2 Q2 FY21 Q3 FY21 Q4 FY21 Q1 FY22 Q2 FY22 $80.8 $92.9 $21.7 $17.8 $102 .5 $ 1 1 0 .7 FY20 FY21

x x x x x x x x

1 0 8% 109% 111% 115% 118% Q2 FY21 Q3 FY21 Q4 FY21 Q1 FY22 Q2 FY22 x x x x x


$57 $67 5 6 % 60% FY20 FY21 $16 $18 $19 $20 $21 7 3 % 7 5 % 7 6 % 76% 78% Q2 FY21 Q3 FY21 Q4 FY21 Q1 FY22 Q2 FY22 $16 $17 $18 $19 $22 59% 61% 64% 6 5 % 68% Q2 FY21 Q3 FY21 Q4 FY21 Q1 FY22 Q2 FY22 $56 $69 70% 74% FY20 FY21
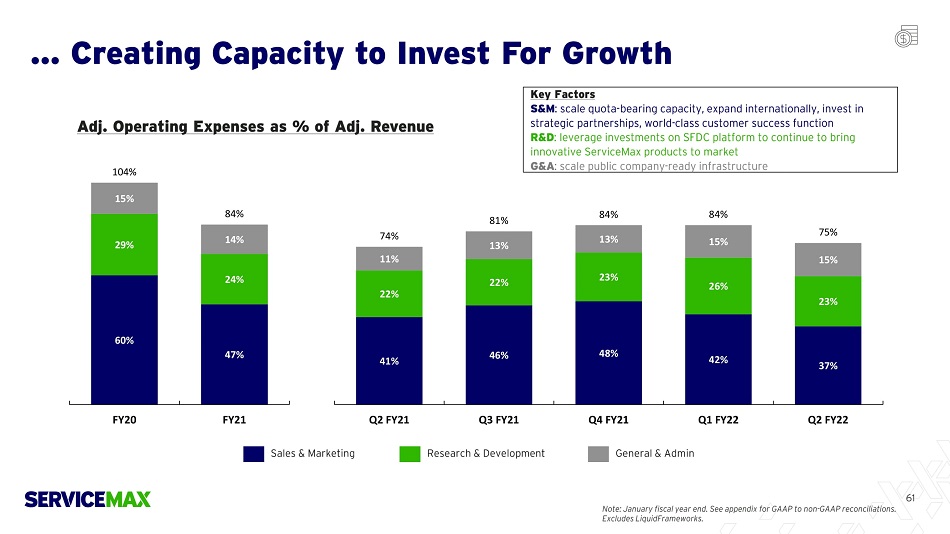
41% 46% 48% 42% 37 % 22% 22% 2 3 % 26% 23% 11% 13% 13% 1 5 % 15% 74% 81% 8 4 % 84% 7 5 % Q2 FY 2 1 Q3 FY 2 1 Q4 FY 2 1 Q1 FY 2 2 Q2 FY 2 2 60% 47% 29% 24% 15% 14% 104% 84% FY20 FY21

( $49) ( $17) ( 48 %) ( 1 5%) FY20 FY21 ( $49) ( $2 6 ) (48%) (24%) FY20 FY21 ( $4) ( $6) ( $6) ( $6) ( $3) (15%) (20%) (20%) (19%) (8%) Q2 FY 2 1 Q3 FY 2 1 Q4 FY 2 1 Q1 FY 2 2 Q2 FY 2 2 ( $9) ( $1 ) ( $3) Q1 FY22 $4 ( $5) (32%) ( 4%) (11%) 1 2 % ( 1 6%) Q2 FY21 Q3 FY21 Q4 FY21 Q2 FY22

x x x

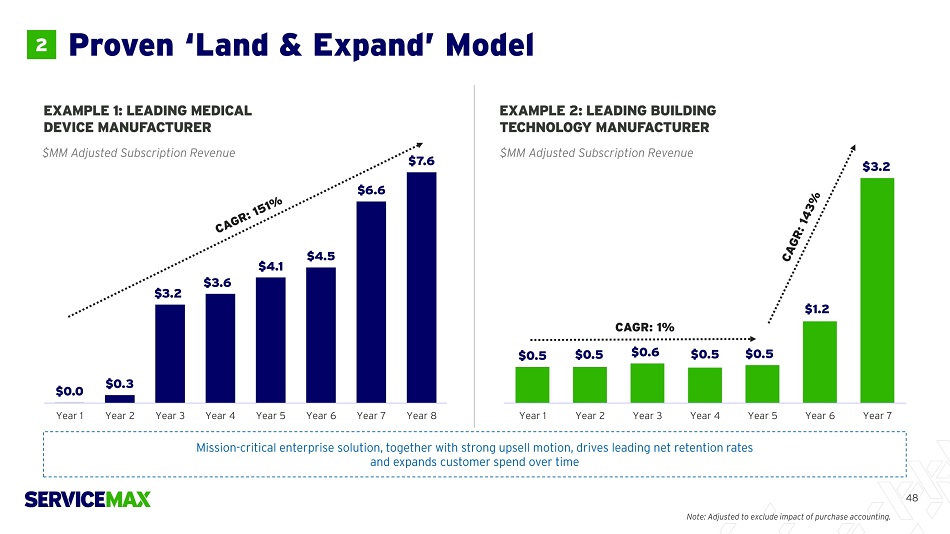
F Y 2 0 A Growt $103 $111 $130 $155 $188 56 % 60 % 67 % 69 % 71% Memo: Subscription Margin 70% 74% 77% 79% 80% FY20A Margin $57 $67 $86 $107 $134 F Y 2 1 A F Y 2 2 E F Y 2 3 E F Y 2 4 E M argi n ( 49 % ) ( 18 % ) ( 16 % ) 1% 12% ( $50) ( $20) ( $20) $2 $22 F Y 2 0 A F Y 2 1 A F Y 2 2 E F Y 2 3 E F Y 2 4 E


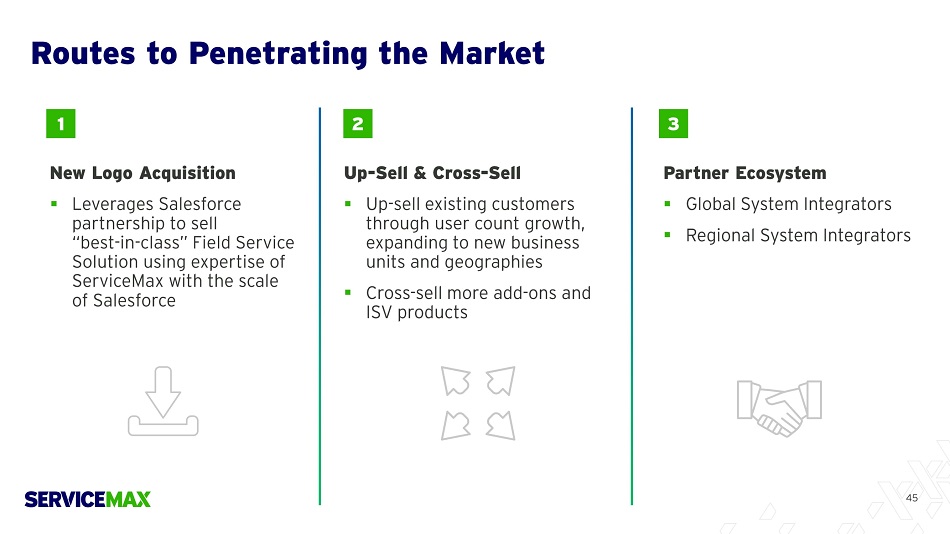
• • • • • •

x x x x x x x x x x x x


• • • • • • •
• • • •

($mm) Q 2 FY 202 1 Q 3 FY 202 1 Q 4 FY 202 1 Q 1 FY 202 2 Q 2 FY 202 2 FY2020 FY2021 GAAP Revenue $27.2 $27.6 $28.4 $30.0 $32.2 $86.9 $109.1 + Fair Value Adjustment to Acquired Unearned Revenue (1) 0.4 0.4 0.4 - - 15.7 1.6 Adj. Revenue $27.6 $28.0 $28.8 $30.0 $32.2 $102.5 $110.7 % YoY Growth 9.3% 7.7% 10.0% 14.0% 16.7% - 8.0% GAAP Subscription Revenue $22.1 $23.3 $24.3 $25.8 $27.5 $65.1 $91.3 + Fair Value Adjustment to Acquired Unearned Revenue (1) 0.4 0.4 0.4 - - 15.7 1.6 Adj. Subscription Revenue $22.5 $23.7 $24.7 $25.8 $27.5 $80.8 $92.9 % YoY Growth 13.9% 13.6% 17.2% 17.0% 22.1% - 15.0% GAAP Gross Profit $10.7 $11.4 $12.7 $14.0 $16.5 $20.3 $44.0 + Fair Value Adjustment to Acquired Unearned Revenue (1) 0.4 0.4 0.4 - - 15.7 1.6 + Amortization of Acquired Intangibles 5.2 5.2 5.2 5.2 5.2 20.7 20.7 + Stock - Based Compensation 0.0 0.0 0.0 0.1 0.1 0.1 0.2 + Other Non - Recurring Costs - - - 0.1 - 0.6 0.1 Adj. Gross Profit $16.3 $17.0 $18.3 $19.4 $21.8 $57.4 $66.5 % Adj. Gross Margin 59.0% 60.8% 63.5% 64.7% 67.6% 55.9% 60.1% GAAP Subscription Gross Profit $10.8 $12.1 $13.2 $14.5 $16.2 $20.0 $46.5 + Fair Value Adjustment to Acquired Unearned Revenue (1) 0.4 0.4 0.4 - - 15.7 1.6 + Amortization of Acquired Intangibles 5.2 5.2 5.2 5.2 5.2 20.7 20.7 + Stock - Based Compensation 0.0 0.0 0.0 0.0 0.0 0.0 (0.0) + Other Non - Recurring Costs - - - - - 0.1 (0.0) Adj. Subscription Gross Profit $16.4 $17.7 $18.8 $19.7 $21.4 $56.4 $68.8 % Adj. Subscription Gross Margin 72.9% 74.6% 76.0% 76.5% 77.8% 69.8% 74.0%

($mm) Q2 FY2021 Q3 FY2021 Q4 FY2021 Q1 FY2022 Q2 FY2022 FY2020 FY2021 GAAP S&M Expense $15.3 $17.1 $18.2 $17.3 $16.0 $79.1 $68.3 + Fair Value Adjustment to Acquired Deferred Commissions (2 0.3 0.2 0.2 0.2 0.2 1.9 1.1 - Amortization of Acquired Intangibles (4.3) (4.3) (4.3) (4.3) (4.3) (17.0) (17.0) - Stock - Based Compensation (0.1) (0.1) (0.1) (0.1) (0.1) (0.3) (0.4) - Other Non - Recurring Costs - - (0.2) (0.6) (0.1) (1.9) (0.3) Adj. S&M Expense $11.3 $13.0 $13.9 $12.6 $11.8 $61.8 $51.8 Adj. S&M as % of Adj. Revenue 40.9% 46.3% 48.2% 42.1% 36.5% 60.3% 46.8% GAAP G&A Expense $3.7 $4.0 $3.3 $4.9 $6.7 $18.9 $16.1 - Stock - Based Compensation (0.2) (0.2) (0.1) (0.2) (0.2) (0.6) (0.8) - Other Non - Recurring Costs (0.5) (0.1) 0.5 (0.1) (1.5) (3.3) (0.2) Adj. G&A Expense $3.0 $3.6 $3.7 $4.5 $5.0 $14.9 $15.2 Adj. G&A as % of Adj. Revenue 11.1% 12.9% 12.7% 15.2% 15.5% 14.6% 13.7% GAAP R&D Expense $6.0 $6.1 $6.6 $8.0 $7.7 $30.4 $26.4 - Stock - Based Compensation (0.1) (0.1) (0.1) (0.1) (0.1) (0.2) (0.2) - Other Non - Recurring Costs - - - - - (0.8) (0.2) Adj. R&D Expense $6.0 $6.0 $6.5 $7.9 $7.5 $29.4 $26.1 Adj. R&D as % of Adj. Revenue 21.7% 21.5% 22.7% 26.4% 23.4% 28.7% 23.5% GAAP Operating Loss ($14.4) ($15.8) ($15.5) ($16.2) ($13.9) ($108.0) ($66.9) + Fair Value Adjustment to Acquired Unearned Revenue (1) 0.4 0.4 0.4 - - 15.7 1.6 - Fair Value Adjustment to Acquired Deferred Commissions (2) (0.3) (0.2) (0.2) (0.2) (0.2) (1.9) (1.1) + Amortization of Acquired Intangibles 9.4 9.4 9.4 9.4 9.4 37.7 37.8 + Stock - Based Compensation 0.4 0.5 0.3 0.5 0.6 1.2 1.6 + Other Non - Recurring Costs 0.5 0.1 (0.2) 0.8 1.6 6.6 0.7 Adj. Operating Loss ($4.0) ($5.6) ($5.8) ($5.7) ($2.5) ($48.8) ($26.5) % Operating Margin (14.6%) (20.0%) (20.2%) (19.0%) (7.8%) (47.6%) (23.9%)
Serious News for Serious Traders! Try StreetInsider.com Premium Free!
You May Also Be Interested In
- Hempacco Co (HPCO) Receives Nasdaq Non-compliance Notice
- Splash Beverage Group Inc. (SBEV) Appoints Julius Ivancsits as CFO
- Dave & Buster's Entertainment (PLAY) Appoints Darin Harper as CFO
Create E-mail Alert Related Categories
SEC FilingsRelated Entities
Definitive AgreementSign up for StreetInsider Free!
Receive full access to all new and archived articles, unlimited portfolio tracking, e-mail alerts, custom newswires and RSS feeds - and more!
