Form 8-K PROASSURANCE CORP For: Feb 25

Fourth Quarter and FY 2021 March

ProAssurance Overview

ProAssurance Investor Briefing | March 2022 3 Mission, Vision, & Values The ProAssurance Mission We exist to Protect Others. Our Shared Vision We will be the best in the world at understanding and providing solutions for the risks our customers encounter as healers, innovators, employers, and professionals. Through an integrated family of companies, products, and services, we will be a trusted partner enabling those we serve to focus on their vital work. As the employer of choice, we embrace every day as a singular opportunity to reach for extraordinary outcomes, build and deepen superior relationships, advance diversity, equity, and inclusion, and accomplish our mission with infectious enthusiasm and unbending integrity. Corporate Values Integrity | Leadership | Relationships | Enthusiasm

ProAssurance Investor Briefing | March 2022 4 At a Glance All employee and financial data as of 12/31/21. Office locations and employee counts include NORCAL. Business Unit Principal Offices Employees Lines of Business HCPL 6 512 Healthcare Professional Liability Medmarc 1 29 Medical Technology Liability Innovative Specialty Team 1 100 Professional Liability for Podiatrists, Chiropractors, & Dentists, and LawyerCare Eastern 8 238 Workers’ Compensation & Captive Facilities (all lines) PRA Corporate 1 124 Corporate functions (Accounting, Legal, etc.) • Healthcare-centric specialty insurance writer ◦ Specialty Property & Casualty ▪ Healthcare Professional Liability (HCPL) ▪ Life Sciences and Medical Technology Liability ▪ Innovative Specialty Team ◦ Workers' Compensation Insurance ◦ Segregated Portfolio Cell (SPC) Reinsurance ◦ Lloyd's of London Syndicates (1729 & 6131) • Total Assets: $6.2 billion • Shareholders' Equity: $1.4 billion • Claims-Paying Ratings ◦ A.M. Best: “A” (Excellent) ◦ Fitch: “A-” (Strong) • 20 locations, with operations in three countries ◦ 1,003 employees • Writing in 50 states & DC Corporate Headquarters Claims Offices Claims/Underwriting Offices Underwriting Offices Cayman Islands Lloyds

ProAssurance Investor Briefing | March 2022 5 ProAssurance Executive Leadership Ned Rand - President & Chief Executive Officer Mr. Rand, who assumed this position at ProAssurance on July 1, 2019, was formerly Chief Operating Officer, and has served as Chief Financial Officer, Executive Vice President, and Senior Vice President of Finance since joining ProAssurance in November of 2004. Prior to joining ProAssurance, Mr. Rand was Chief Accounting Officer and Head of Corporate Finance for PartnerRe Ltd. from 2000 - 2004. He also served as the Chief Financial Officer of Atlantic American Corporation from 1996 - 2000 and Controller of United Capitol Insurance Company from 1992 - 1996. Prior to that time, Mr. Rand was employed by Coopers & Lybrand (now PriceWaterhouseCoopers) for four years. Mr. Rand is a certified public accountant and is a graduate of Davidson College where he majored in Economics. Mike Boguski President Specialty P&C Noreen Dishart Executive Vice President & Chief Human Resources Officer Dana Hendricks Executive Vice President & Chief Financial Officer Jeff Lisenby Executive Vice President & General Counsel Kevin Shook President Workers’ Compensation & Segregated Portfolio Cell Reinsurance Executive Team bios available on our website at Investor.ProAssurance.com/OD

ProAssurance Investor Briefing | March 2022 6 ProAssurance Board of Directors Director bios available on our website at Investor.ProAssurance.com/OD Maye Head Frei C M. James Gorrie N/C Ziad R. Haydar, MD C Edward L. Rand, Jr E Frank A. Spinosa, DPM N/C Katisha T. Vance, MD N/C A ‐ Audit Committee C ‐ Compensation Committee E ‐ Executive Committee N/C ‐ Nominating/Corporate Governance Committee Underlined ‐ Chair Scott C. Syphax C Samuel A. Di Piazza, Jr A Fabiola Cobarrubias, MD A Bruce D. Angiolillo A, C Kedrick D. Adkins, Jr A Thomas A.S. Wilson, Jr, MD Lead Director E, N/C W. Stancil Starnes Executive Chairman E
ProAssurance Investor Briefing | March 2022 7 ProAssurance Brand Profile Specialty P&C Healthcare Professional Liability Workers’ Comp Alternative Risk Transfer Medical Technology & Life Sciences Products Liability Legal Professional Liability

ProAssurance Investor Briefing | March 2022 8 ProAssurance Specialty Property & Casualty • Healthcare Professional Liability (HCPL) insures healthcare providers and facilities, including E&S coverages • Innovative Specialty Team (IST) insures podiatrists, chiropractors, dentists, and lawyers • Medmarc insures medical technology and life sciences companies that manufacture or distribute products • This segment includes business acquired through the NORCAL transaction completed May 5, 2021 Eastern Alliance Workers’ Compensation • Specialty underwriter of workers’ compensation products and services • Focused in the East, South, and Midwest regions of the United States • Guaranteed cost, policyholder dividend, retro‐rated, deductible, and alternative solutions policies available Inova Re/Eastern Re SPC Reinsurance • Segregated Portfolio Company structure • Workers’ compensation and healthcare professional liability coverage in a Cayman‐based captive • Industries include healthcare, forestry, staffing, construction, petroleum, marine and recreation, and social services Lloyd’s Syndicates 1729 and 6131 • The results from our participation in Lloyd's of London Syndicate 1729 and Syndicate 6131 ProAssurance Corporate • Reports our investment results, interest expense, and U.S. income taxes • Includes corporate expenses and includes non‐premium revenues generated outside of our insurance entities • Company‐wide administrative departments reside in ProAssurance Corporate ProAssurance Reports Financial Results in Five Segments
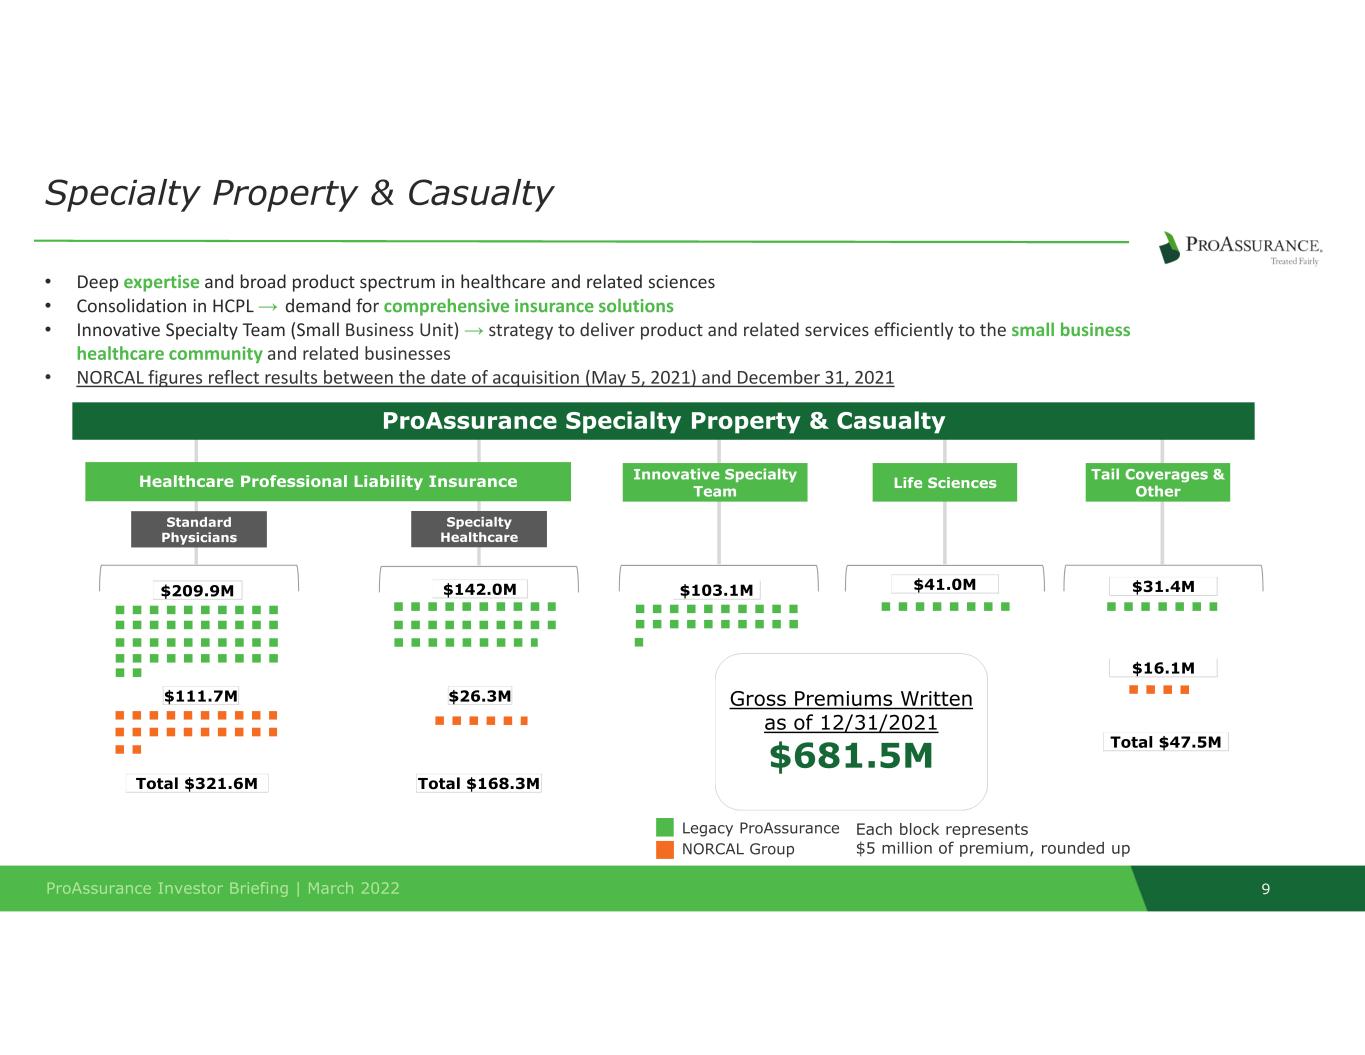
ProAssurance Investor Briefing | March 2022 9 ProAssurance Specialty Property & Casualty Specialty Healthcare Life SciencesInnovative Specialty Team Standard Physicians Healthcare Professional Liability Insurance $209.9M $111.7M $41.0M$103.1M$142.0M $26.3M Each block represents $5 million of premium, rounded up Legacy ProAssurance NORCAL Group Total $321.6M Total $168.3M Gross Premiums Written as of 12/31/2021 $681.5M Specialty Property & Casualty • Deep expertise and broad product spectrum in healthcare and related sciences • Consolidation in HCPL → demand for comprehensive insurance solutions • Innovative Specialty Team (Small Business Unit) → strategy to deliver product and related services efficiently to the small business healthcare community and related businesses • NORCAL figures reflect results between the date of acquisition (May 5, 2021) and December 31, 2021 Tail Coverages & Other $31.4M $16.1M Total $47.5M
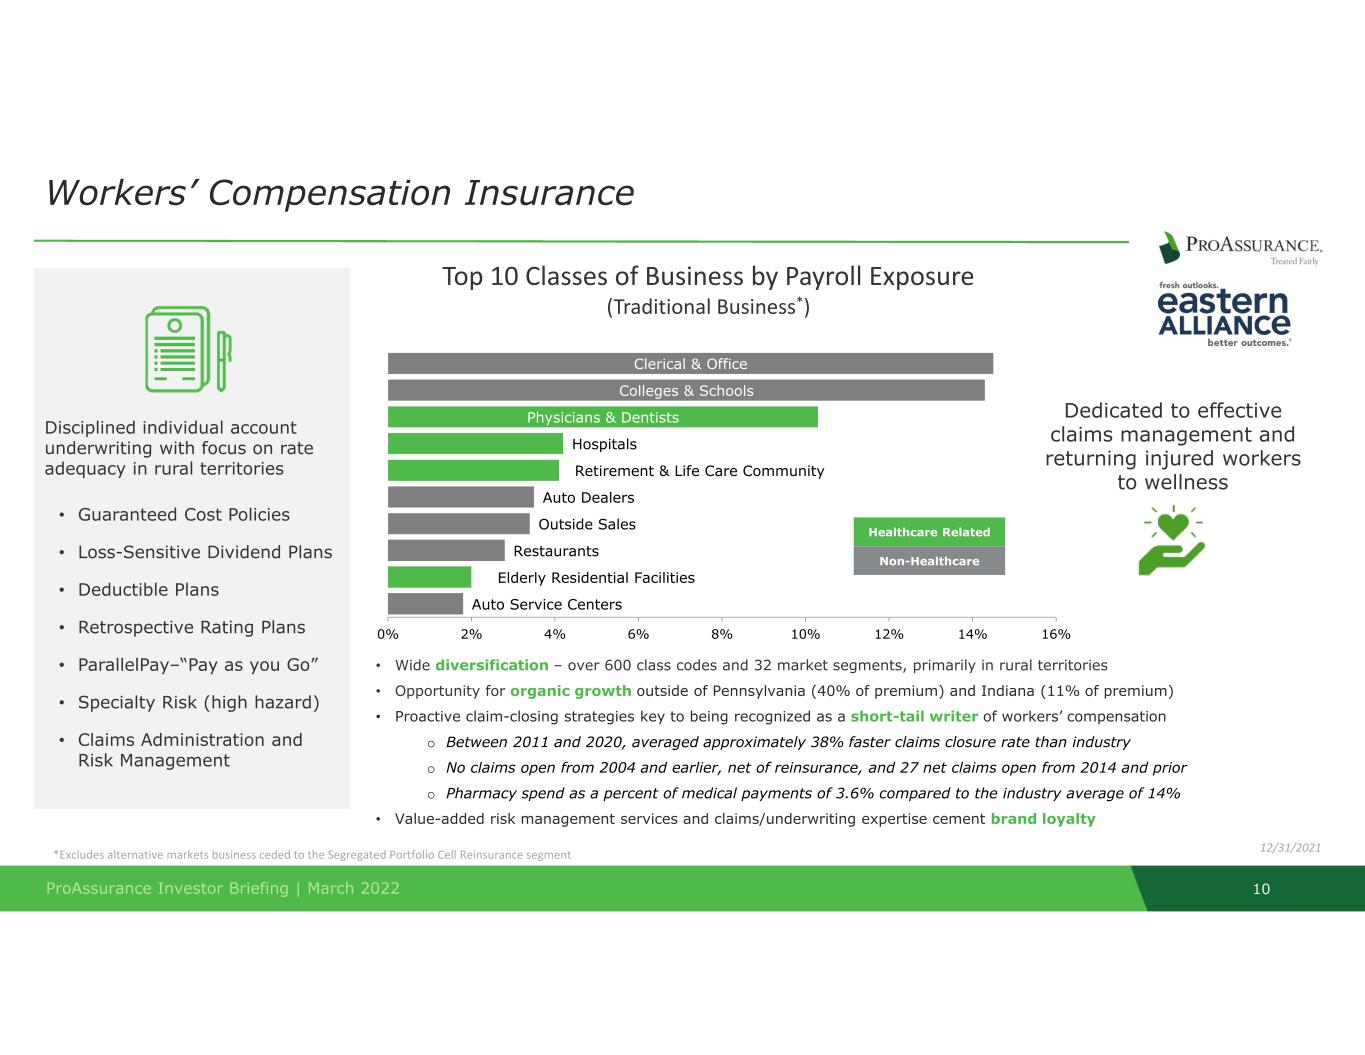
ProAssurance Investor Briefing | March 2022 10 Disciplined individual account underwriting with focus on rate adequacy in rural territories • Guaranteed Cost Policies • Loss-Sensitive Dividend Plans • Deductible Plans • Retrospective Rating Plans • ParallelPay–“Pay as you Go” • Specialty Risk (high hazard) • Claims Administration and Risk Management Workers’ Compensation Insurance • Wide diversification – over 600 class codes and 32 market segments, primarily in rural territories • Opportunity for organic growth outside of Pennsylvania (40% of premium) and Indiana (11% of premium) • Proactive claim-closing strategies key to being recognized as a short-tail writer of workers’ compensation o Between 2011 and 2020, averaged approximately 38% faster claims closure rate than industry o No claims open from 2004 and earlier, net of reinsurance, and 27 net claims open from 2014 and prior o Pharmacy spend as a percent of medical payments of 3.6% compared to the industry average of 14% • Value-added risk management services and claims/underwriting expertise cement brand loyalty Auto Service Centers Elderly Residential Facilities Restaurants Outside Sales Auto Dealers Retirement & Life Care Community Hospitals Physicians & Dentists Colleges & Schools Clerical & Office 0% 2% 4% 6% 8% 10% 12% 14% 16% *Excludes alternative markets business ceded to the Segregated Portfolio Cell Reinsurance segment Dedicated to effective claims management and returning injured workers to wellness Healthcare Related Non-Healthcare 12/31/2021 Top 10 Classes of Business by Payroll Exposure (Traditional Business*)

ProAssurance Investor Briefing | March 2022 11 Segregated Portfolio Cell Reinsurance ProAssurance Fronting Arrangement Agency Group or Association establishes/funds a cell Underwriting Claims Administration Risk Management Reinsurance Audit Asset Management Services + Cell Rental Fees + Participation in profits/losses of carefully selected cells Fee Income to PRA • HCPL and workers’ compensation captive insurance solutions provided through Inova Re (Cayman Islands) • SPCs are a high ROE product with favorable retention results • Low capital requirement • Strategic partnerships with select independent agencies looking to manage controllable expenses • Alternative market solutions are in high demand • Value-added risk management services and claims/underwriting expertise Inova Re Services As of 12/31/2021 • Gross premiums written: $71.8M o Workers’ Compensation Insurance: $64.6M o Healthcare Professional Liability: $7.2M • 23 active cells Individually capitalized cells (companies) exist within the Inova Re structure. Assets of each are segregated from others. ProAssurance/Eastern participates in select cells

ProAssurance Investor Briefing | March 2022 12 Lloyd’s of London Syndicates ProAssurance Funds at Lloyd’s (FAL) $37.8 Million 1 Property Insurance (All Other - Mainly US) 29% Casualty (Mainly US) 25% Catastrophe Reinsurance (Excess of Loss) 13% Specialty 13% Facility (US) 7% General Liability (US) 4% Contingency 5% All Other Reinsurance (Mainly US) 4% Dale Underwriting Partners Independent, Owner‐Managed Syndicate at Lloyd’s Syndicate 1729 61312 PRA Participation 5% 50% PRA share of 2021 Underwriting Capacity $13M $14M • Opportunity to invest alongside a recognized leader in Duncan Dale • Lloyd’s provides universal distribution and licensures • Westernization of international healthcare professional liability provides opportunities in new markets 1 Comprised of investment securities, cash, and cash equivalents deposited with Lloyd's as of 12/31/2021. 2 For the 2022 underwriting year, and effective January 1, 2022, Syndicate 6131 ceased underwriting on a quota share basis with Syndicate 1729. Its business will be retained within Syndicate 1729. This will be reflected in our results beginning Q2 2022. Subject to rounding Premium percentages reflect 100% of the Syndicates’ premiums written, and not solely ProAssurance’s participation.

ProAssurance Investor Briefing | March 2022 13 Specialty P&C 66% Workers' Comp 30% Standard Physicians 31% ($321.6M) Specialty 16% ($168.3M) Small Business Unit 10% ($103.1M) Tail Coverages + Other 5% ($47.5M) Medical Technology Liability 4% ($41.0M) Segregated Portfolio Cell Reinsurance 7% ($71.8M) Workers' Compensation Insurance 23% ($240.5M) Lloyd's 4% ($38.0M) Specialty P&C 90% Workers' Comp 10% Standard Physicians 46% Specialty 16% Medical Technology Liability 1% Tail Coverages + Reinsurance 2% Small Business Unit 24% Segregated Portfolio Cell Reinsurance 2% Workers' Compensation Insurance 8% Premium allocated by line does not reflect inter-segment eliminations, and thus will not agree to total 2021 gross premiums written Consolidated Premiums, Policyholders & Distribution for 2021 Our Distribution Sources HCPL LPL Life Sciences Workers’ Comp Agent/Broker 79% 100% 100% 100% Direct 21% -- -- -- FY 2021 Gross Premium: $960M Inforce 2021 Policyholder Count: 129,385* All Data as of 12/31/2021, subject to rounding *Excludes Lloyd’s of London

ProAssurance Investor Briefing | March 2022 14 • ProAssurance is recognized for our financial strength by top rating agencies • We maintain a balance sheet that ensures stability and security for our customers • Our conservative reserving philosophy enables success over the insurance cycles Financial Ratings & Balance Sheet Highlights Balance Sheet Highlights 12/31/2021 Total Assets $6,191,477 Total Investments $4,828,323 Net Loss Reserves $3,579,940 Total Debt (less Issuance Costs) $424,986 Shareholders’ Equity $1,428,387 Book Value per Share $26.46 Rating Agency Financial Strength Rating Date AM Best “A”1 3/23/2021 Fitch* “A-”2 10/29/2021 Moody’s “A3” 10/7/2020 $ in thousands, except per share data 1 ProAssurance Group only – AM Best assigns a rating of “A‐” (excellent) to NORCAL Group 2 Excludes NORCAL Group, which has not yet been rated by Fitch All financial rating information is available on our website: https://investor.proassurance.com/financial‐information/financial‐ratings/default.aspx

ProAssurance Investor Briefing | March 2022 15 • $425 million debt at 12/31/2021 o Includes $176 million of Contribution Certificates related to NORCAL acquisition o $250 million 10-year notes due 11/15/2023 5.30% Coupon • $250 million revolving credit facility, $50 million "accordion" option o At 12/31/2021, there were no outstanding borrowings ProAssurance Leverage Update Ten-Year Premiums to EquityTen-Year Debt to Capital • Our minimum target is 0.75:1 • Committed to enhancing shareholder value through effective capital management o Retaining capital needed as the market turns, and supporting current loss reserve estimates Financial Leverage Operating Leverage 2% 5% 9% 10% 15% 20% 21% 16% 16% 16% 24% $- $0.8 $1.6 $2.4 20212020201920182017201620152014201320122011 $ in billions Debt Capital Debt to Capital 0.3 0.2 0.2 0.4 0.4 0.5 0.5 0.5 0.6 0.6 0.6 $- $0.8 $1.6 $2.4 20212020201920182017201620152014201320122011 $ in billions Net Premiums Written Equity Premiums to Equity
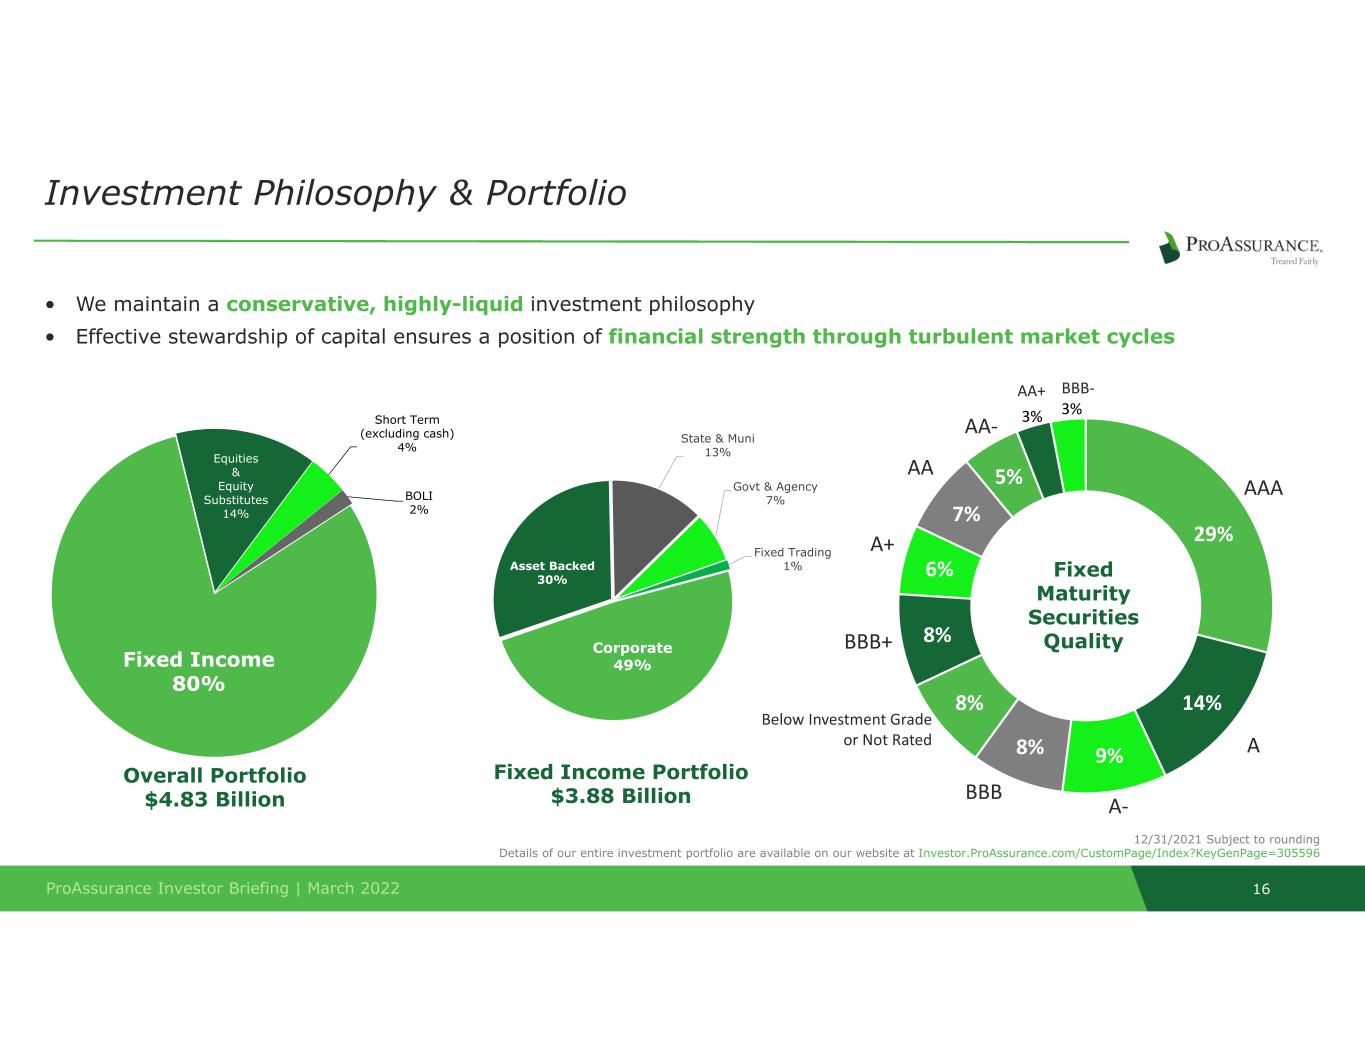
ProAssurance Investor Briefing | March 2022 16 Corporate 49% Asset Backed 30% State & Muni 13% Govt & Agency 7% Fixed Trading 1% • We maintain a conservative, highly-liquid investment philosophy • Effective stewardship of capital ensures a position of financial strength through turbulent market cycles Fixed Income 80% Equities & Equity Substitutes 14% Short Term (excluding cash) 4% BOLI 2% Investment Philosophy & Portfolio Overall Portfolio $4.83 Billion Fixed Income Portfolio $3.88 Billion 12/31/2021 Subject to rounding Details of our entire investment portfolio are available on our website at Investor.ProAssurance.com/CustomPage/Index?KeyGenPage=305596 29% 14% 9%8% 8% 8% 6% 7% 5% 3% 3% Fixed Maturity Securities Quality AAA A A+ BBB+ Below Investment Grade or Not Rated BBB A‐ AA‐ AA AA+ BBB‐

ProAssurance Investor Briefing | March 2022 17 COVID-19 and the Markets We Serve • Healthcare Professional Liability (HCPL) ◦ Primary exposures in broader markets: misdiagnoses, complications from delayed elective procedures, and failure to prevent infection in Senior Care settings May be mitigated by support at state and federal levels for liability immunity for healthcare professionals doing their best in extraordinary circumstances ◦ Pre-tax $10 million IBNR reserve for COVID-19 established in the second quarter of 2020 ◦ Recognized $1 million of related favorable development in the third quarter of 2021 ◦ No change in the fourth quarter ◦ Reduced exposure by adding pandemic exclusions to all Senior Care policies renewed in 2021 ◦ Overall HCPL claims frequency reduction observed in 2020 continued through 2021 • Workers’ Compensation Insurance ◦ Primary exposures in broader markets: healthcare professionals ◦ Secondary exposures: fatigued workers ◦ The majority of workers showing viral symptoms are able to return to work after one or two weeks ◦ Claim activity rising as workers return to full employment after a prolonged hiatus ◦ Labor shortage driving worker fatigue and alternative work arrangement risks ◦ Lack of robust training programs • Segregated Portfolio Cell Reinsurance (SPCR) ◦ Primary exposures in broader markets: consistent with HCPL and Workers’ Compensation, on a smaller scale SPCR business is ceded from the HCPL and Workers’ Compensation Insurance segments • Lloyd’s of London ◦ Primary exposures in broader markets: event cancellation, business interruption ◦ Most business interruption policies specifically exclude pandemics and other market-wide triggers ◦ We have significantly reduced our participation at the Lloyd’s on London Syndicates over the past two years For more details, and for policyholder resources, visit our dedicated websites: ProAssurance.com/Covid‐19/ and EasternAlliance.com/Coronavirus_and_Workers_Comp/

Success in Competitive Markets

ProAssurance Investor Briefing | March 2022 19 A Foundation in Excellence “From our earliest days, we have operated with a strategy both responsive to near‐term challenges and proactive to long‐term opportunity.” ‐Ned Rand President & CEO Superior brand identity and reputation in the market Specialization •Deep expertise and commitment to our customers throughout the insurance cycles enable us to outperform our peers over time Experienced & Collaborative Leadership •Average executive leadership tenure of 20 years with PRA or subsidiaries History of Successful M&A •Selective M&A with best‐in‐class partners, and nearly 20 transactions in our 46 year history Scope & Scale •Regional hubs combined with local knowledge of market dynamics and regulatory environments

ProAssurance Investor Briefing | March 2022 20 In 2020, We… Fo cu se d on U nd er w rit in g • Specialty Property & Casualty: o Completed the initial re‐underwriting of our HCPL Specialty book of business o Enhanced organizational structure and leadership Added new Senior Executive underwriting and actuarial leaders to our existing, experienced organization Established interdepartmental participation in complex and large account underwriting Delivered an enhanced HCPL underwriting structure focused on Standard Physicians and HCPL Specialty business Launched the Innovative Specialty Team to efficiently deliver our Small Business products o Implemented disciplined state strategy process for HCPL o Reduced exposure to volatile product lines, which have had an outsized effect on recent results Impact of re‐underwriting and enhanced risk selection on volatile classes: • Year‐over‐year, Senior Care premium levels reduced by 82%, and Correctional Healthcare premium levels reduced by 52% o Reduced current accident year net loss ratio for the year ended December 31, 2020 by 6.3 percentage points compared to year‐end 2019* as a result of re‐underwriting efforts • Workers’ Compensation Insurance: o Strong underwriting leadership with average management team tenure of over twenty years o Demonstrated ability to underwrite profitably throughout the evolving insurance and economic cycles o Rural underwriting strategy mitigated exposure to COVID‐19 claims as compared to larger metro areas All data as of 12/31/2020 *Excludes effects of the large national healthcare account (see previous disclosures) in 2019 and 2020, and the pre-tax $10M IBNR COVID-19 reserve in 2Q of 2020 We seek constantly to be more efficient and effective as an organization Here’s how we’re doing it

ProAssurance Investor Briefing | March 2022 21 In 2020, We… • Specialty Property & Casualty o Achieved renewal rate gains outpacing severity o Improved product structure, terms, and conditions for complex risks o Secured average renewal pricing increases of: +10% in Specialty in 4Q, +15% full year 2020 +10% in Standard Physicians in 4Q, +11% full year 2020 • Workers’ Compensation Insurance o Maintained profitable pricing levels in a soft Workers’ Compensation Insurance market o Achieved average renewal pricing decrease of 4% in both 4Q and the full year 2020 in a competitive marketplace All data as of 12/31/2020 Ac hi ev ed S tr on g Ra te G ai ns We seek constantly to be more efficient and effective as an organization Here’s how we’re doing it

ProAssurance Investor Briefing | March 2022 22 In 2020, We… • Implemented adjustments to our business model, including regional operating structure and staffing assignments o Streamlined organizational structure by reducing number of field offices by 50% in Specialty P&C (since July 2019) Executed a “spans and layers” overhaul to create a four‐region structure, leveraging regional expertise and promoting collaboration, with beneficial effects to policyholder and shareholder value creation. Added fifth region upon closure of NORCAL acquisition. Demarcated healthcare professional liability into Standard Physicians, Specialty Healthcare, and the Innovative Specialty Team, with specialized talent in each Restructured or terminated underperforming technology partnerships with vendors o In the third quarter of 2020, the Workers’ Compensation Insurance segment: Repositioned from five regions to three for more effective management of underwriting, risk management, and claims processing while maintaining our local service teams Integrated small business and underwriting support functions into one unit for each with dedicated leadership, improving submission turnaround time while continuing our individual account underwriting philosophy Realigned our previously stand‐alone captive team into our regional structure to improve accountability Streamlined marketing operations to extend more agency management responsibilities to decision makers in the underwriting process • Made use of technology to streamline operations and eliminate redundancies • Achieved approximately $22 million in expected pro‐forma annual expense reductions as compared to 2019 o $16 million in Specialty P&C o $5 million in Workers’ Compensation Insurance o $1 million in Corporate St re ng th en ed O ur O pe ra tio na l St ru ct ur e We seek constantly to be more efficient and effective as an organization Here’s how we’re doing it

ProAssurance Investor Briefing | March 2022 23 In 2021… W e co nt in ue to e xe cu te o ur co m pr eh en siv e st ra te gy We seek constantly to be more efficient and effective as an organization Here’s how we’re doing it *NAIC Data †NAIC before purchase accounting All data as of 12/31/2021 • Specialty Property & Casualty: o Closed our acquisition of the NORCAL Group Added ~$300 million* of business to our Standard Physicians line Added ~$1.6 billion† to our investment portfolio Expands market share in profitable territories o Reduced our combined ratio by 20.3 points year‐over‐year Reflects improvement in both the net loss ratio and expense ratio o Improved retention in all lines of business except Specialty Healthcare, by design o Secured average renewal rate increases of 8% for the year (9% in the fourth quarter) Standard Physicians: 8% for the year (9% in the fourth quarter) Specialty Healthcare: 12% for the year (18% in the fourth quarter) • Workers’ Compensation Insurance: o Reduced our expense ratio by 1.1 points for the year Reduced general expenses by $4.0 million o Closed 58% of 2020 and prior claims during 2021 o Closed over 99% and 93% of all 2020 and 2021 reported COVID claims, respectively o Despite an increase in claim activity during the second half of the year, overall frequency continues to be below pre‐pandemic levels and the lowest in ten years, with the exception of accident year 2020

ProAssurance Investor Briefing | March 2022 24 Cyclicality in Insurance Loss Trends Decelerate Market Softens Loss Trends Accelerate Market Hardens CatalystAvailability crisis Mergers & acquisitions Tort reform Competitors withdraw Underwriting criteria tightens Prices increase Pricing outpaces losses Combined ratios improve Favorable reserve development Competitors enter the market Prices decrease Underwriting criteria loosens Losses outpace pricing Combined ratios worsen Unfavorable reserve development For over forty years, ProAssurance and its predecessors have successfully navigated the peaks and valleys of the long cycles characteristic of our businesses.

Strategic Update

ProAssurance Investor Briefing | March 2022 26 Physicians $647.3M Other HCP $98.3M Hospitals $46.2M Facilities $4.3M Physicians $299.5M Other HCP $89.4M Hospitals $45.8M Facilities $1.5M Physicians $347.8M Other HCP $8.9M Hospitals $0.4M Facilities $2.8M Source: 2020 NAIC filings for all MPL lines, figures subject to rounding $436.7M $359.8M $796.1M2020 DPW: Acquisition Created the #3 HCPL Insurer in the U.S.

ProAssurance Investor Briefing | March 2022 27 MPL Market Position Ranked in Top 3 (17 States, 7 new) Alabama Alaska Arizona California Delaware Illinois Indiana Kentucky Maryland Michigan Nevada Pennsylvania Tennessee Texas West Virginia Wisconsin Washington DC Ranked in Top Ten (29 states) Arkansas Connecticut Florida Georgia Hawaii Idaho Iowa Kansas Louisiana Maine Massachusetts Minnesota Mississippi Missouri Montana Nebraska New Hampshire New Jersey New Mexico New York North Carolina Ohio Oklahoma Oregon Rhode Island South Carolina Utah Virginia Wyoming Outside Top Ten Source: 2020 NAIC filings for all MPL Lines ProAssurance + NORCAL Competitive Position

ProAssurance Investor Briefing | March 2022 28 Overview of NORCAL Insurance Company NORCAL Overview NORCAL Brands • NORCAL is one of the leading providers of medical professional insurance companies in the country with ~33,000 insured physicians • Created during California’s medical malpractice crisis in 1975, NORCAL has been committed to healthcare providers and their insurance needs for 47 years • Licensed in 49 states and D.C., with the ability to write in New York through PPM RRG • Headquartered in San Francisco, CA with four regional offices (FL, KS, PA & TX) MPL Premiums Written By Geography MPL Premiums By Line of Business Total 2020 DPW: $359.9M Data as of 12/31/2020 Source: Company website, 2020 NAIC filings for all MPL lines Physicians $347.8M Other HCP $8.9M Hospitals $0.4M Facilities $2.8M CA 29.9% FL 12.3% PA 9.4% IL 10.6% TX 5.2% Other 32.5% Established in 1975 as a policyholder-owned and physician directed medical professional liability insurance carrier. Upon demutualization, became NORCAL Insurance Company Surplus lines carrier, focusing on providing flexible coverage options that address the unique needs of complex accounts PPM is the only anesthesia-specific medical professional liability insurance carrier in the nation. Established in 1987, PPM insures anesthesiologists in 40 states

ProAssurance Investor Briefing | March 2022 29 Enhanced Scale and Capabilities1 • Positions company as #3 writer of MPL insurance in the industry • Enhances ProAssurance’s HCPL business: adds additional scale, capabilities and strong California presence • Ability to underwrite larger risks from integrated systems with national footprint Conservatively Priced and Financed Transaction3 • Attractive purchase price; modest impact to tangible book value per share • Additional consideration contingent on favorable reserve development relative to our expectation • Funded with a combination of cash on hand and contribution certificates Value Creation for Customers and All Key Stakeholders4 • Scaled platform to produce strong results driven by disciplined underwriting • Clear path to achieving identified expense synergies • Facilitates EPS and ROE accretive transaction as results / synergies are phased-in, with meaningful accretion thereafter Strong Strategic Alignment and Rationale5 • A shared commitment to the HCPL industry, provision of affordable coverage and the defense of physicians • Best in class talent supporting true nationwide platform • Adds attractive customer base and distribution at a time when the HCPL market is beginning to harden Product, Customer, & Geographic Diversification2 • Premier HCPL insurer with nationwide presence • Expanded product capabilities with broader geographic scale and efficiencies to address varying client needs (e.g. SPC / ART) • High touch model that drives retention using common distribution channels ProAssurance + NORCAL = A Stronger, Better Positioned HCPL Specialty Insurer

ProAssurance Investor Briefing | March 2022 30 • Build a true national platform and enhance state market leadership • Provide best in class service • Improve overall business quality and profitability • Improve bench strength by retaining the best talent • Establish an effective regional/field operating matrix • Enhance our data advantage • Drive a high performing, unified culture Integration Goals & Objectives

ProAssurance Investor Briefing | March 2022 31 HCPL Regional Structure Note: Overland Park, KS is PPM Office Regional Office Satellite Office Five Regions Northeast Mechanicsburg, PA (Hub) Midwest Greenwood, IN (Hub) Okemos, MI Madison, WI Southeast Birmingham, AL (Hub) Jacksonville, FL Mobile, AL Southwest Austin, TX (Hub) West San Francisco, CA (Hub)

ProAssurance Investor Briefing | March 2022 32 ProAssurance’s Proven History of Successful Acquisitions & 1995 Acquisition 1996 Acquisition OHiC 1994 Acquisition 1998 Demutualization/Merger Forms ProNational 1995 Acquisitions 1996 Acquisition 1999 Acquisition 2004 Hospital Renewal Rights Purchase 2005 Acquisition 2006 Acquisition 2008 Acquisition 2008 Acquisition 2009 Acquisition 2010 Acquisition 2012 Acquisition 2013 Acquisition 2014 Acquisition & 2001 ProNational & Medical Assurance Merge to Form ProAssurance 2021 Acquisition

Appendix

ProAssurance Investor Briefing | March 2022 34 Income Statement Highlights (12/31/21) Three Months Ended Year Ended December 31 2021 2020 2021 2020 Gross Premiums Written $ 218.1 $ 161.8 $ 960.0 $ 854.4 Net Premiums Earned $ 273.1 $ 187.0 $ 971.7 $ 792.7 Net Investment Result $ 33.8 $ 26.3 $ 119.5 $ 60.1 Net Investment Gains (Losses) $ 4.1 $ 15.5 $ 24.3 $ 15.7 Total Revenues $ 313.1 $ 229.6 $ 1,124.4 $ 874.9 Net Losses and Loss Adjustment Expenses $ 197.2 $ 140.0 $ 752.2 $ 661.4 Underwriting, Policy Acquisition & Operating Expenses $ 67.8 $ 57.7 $ 268.2 $ 237.9 Gain on bargain burchase $ — $ — $ 74.4 $ — Net Income (Loss) (Includes Realized Investment Gains & Losses) $ 32.1 $ 14.3 $ 144.1 $ (175.7) Non-GAAP Operating Income (Loss) $ 33.4 $ 3.3 $ 75.9 $ (27.7) Non-GAAP Operating Income (Loss) per Diluted Share $ 0.62 $ 0.06 $ 1.40 $ (0.52) In millions, except per share data | Subject to rounding
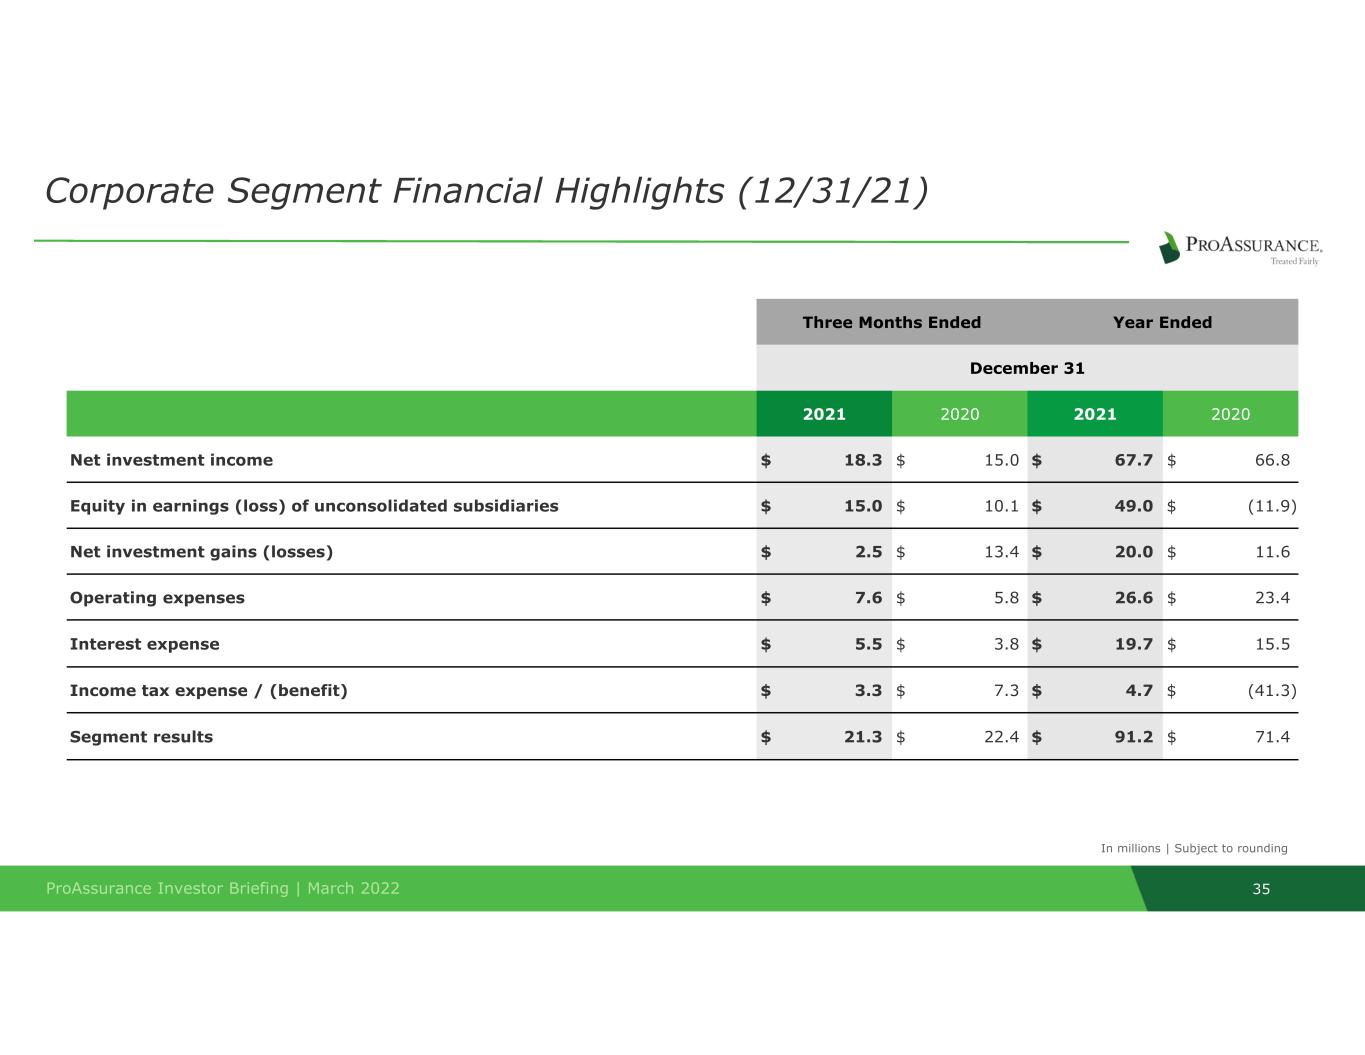
ProAssurance Investor Briefing | March 2022 35 Corporate Segment Financial Highlights (12/31/21) Three Months Ended Year Ended December 31 2021 2020 2021 2020 Net investment income $ 18.3 $ 15.0 $ 67.7 $ 66.8 Equity in earnings (loss) of unconsolidated subsidiaries $ 15.0 $ 10.1 $ 49.0 $ (11.9) Net investment gains (losses) $ 2.5 $ 13.4 $ 20.0 $ 11.6 Operating expenses $ 7.6 $ 5.8 $ 26.6 $ 23.4 Interest expense $ 5.5 $ 3.8 $ 19.7 $ 15.5 Income tax expense / (benefit) $ 3.3 $ 7.3 $ 4.7 $ (41.3) Segment results $ 21.3 $ 22.4 $ 91.2 $ 71.4 In millions | Subject to rounding

ProAssurance Investor Briefing | March 2022 36 Current Accident Year Net Loss Ratio 82.2 % 92.3 % 87.5 % 104.2 % Effect of Prior Accident Year Reserve Development (6.2%) (6.1%) (4.7%) (5.7%) Net Loss Ratio 76.0 % 86.2 % 82.8 % 98.5 % Underwriting Expense Ratio 17.6 % 23.8 % 18.4 % 23.0 % Combined Ratio 93.6 % 110.0 % 101.2 % 121.5 % Specialty P&C Financial Highlights (12/31/21) Three Months Ended Year Ended December 31 2021 2020 2021 2020 Gross Premiums Written $ 166.1 $ 102.2 $ 681.5 $ 522.9 Net Premiums Earned $ 207.0 $ 112.1 $ 695.0 $ 477.4 Total Revenues $ 207.6 $ 112.5 $ 698.4 $ 481.3 Net Losses & Loss Adjustment Expenses $ (157.3) $ (96.6) $ (575.2) $ (470.1) Underwriting, Policy Acquisition & Operating Expenses $ (36.3) $ (26.7) $ (127.7) $ (109.6) Segment Results $ 14.0 $ (10.9) $ (4.5) $ (98.4) In millions, except ratios | Subject to rounding

ProAssurance Investor Briefing | March 2022 37 Workers’ Compensation Insurance Financial Highlights (12/31/21) Three Months Ended Year Ended December 31 2021 2020 2021 2020 Gross Premiums Written $ 45.8 $ 47.3 $ 240.5 $ 246.8 Net Premiums Earned $ 41.7 $ 42.3 $ 164.6 $ 171.8 Total Revenues $ 42.2 $ 42.8 $ 166.8 $ 174.0 Net Losses & Loss Adjustment Expenses $ (29.4) $ (26.9) $ (114.7) $ (111.6) Underwriting, Policy Acquisition & Operating Expenses $ (13.9) $ (13.8) $ (52.4) $ (56.4) Segment Results $ (1.1) $ 2.1 $ (0.3) $ 6.0 Current Accident Year Net Loss Ratio 74.0 % 68.2 % 74.0 % 69.0 % Effect of Prior Accident Year Reserve Development (3.6%) (4.6%) (4.3%) (4.1%) Net Loss Ratio 70.4 % 63.6 % 69.7 % 64.9 % Underwriting Expense Ratio 33.3 % 32.7 % 31.8 % 32.9 % Combined Ratio 103.7 % 96.3 % 101.5 % 97.8 % In millions, except ratios | Subject to rounding

ProAssurance Investor Briefing | March 2022 38 Segregated Portfolio Cell Reinsurance Financial Highlights (12/31/21) Three Months Ended Year Ended December 31 2021 2020 2021 2020 Gross Premiums Written $ 15,395 $ 14,775 $ 71,850 $ 72,843 Net Premiums Earned $ 16,188 $ 16,572 $ 63,688 $ 66,352 Net Investment Income $ 194 $ 252 $ 814 $ 1,084 Net Gains (Losses) $ 1,308 $ 2,191 $ 4,080 $ 3,085 Other Income (Loss) $ — $ 2 $ 3 $ 205 Net Losses & Loss Adjustment Expenses $ (6,009) $ (5,714) $ (32,569) $ (29,605) Underwriting, Policy Acquisition & Operating Expenses $ (6,556) $ (5,236) $ (21,635) $ (20,709) SPC U.S. Federal Income Tax Expense $ (656) $ (173) $ (1,947) $ (1,746) SPC Net Results $ 4,469 $ 7,894 $ 12,434 $ 18,666 Segregated Portfolio Cell Dividend (Expense)/Income $ (4,124) $ (6,316) $ (10,050) $ (14,304) Segment Results $ 345 $ 1,578 $ 2,384 $ 4,362 In thousands, except ratios | Subject to rounding Current Accident Year Net Loss Ratio 69.5 % 88.7 % 67.1 % 69.6 % Effect of Prior Accident Year Reserve Development (32.4%) (54.2%) (16.0%) (25.0%) Net Loss Ratio 37.1 % 34.5 % 51.1 % 44.6 % Underwriting Expense Ratio 40.5 % 31.6 % 34.0 % 31.2 % Combined Ratio 77.6 % 66.1 % 85.1 % 75.8 %

ProAssurance Investor Briefing | March 2022 39 Lloyd’s Segment Financial Highlights (12/31/21) Three Months Ended Year Ended December 31 2021 2020 2021 2020 Gross Premiums Written $ 6.3 $ 12.3 $ 38.0 $ 84.7 Net Premiums Earned $ 8.1 $ 16.0 $ 48.4 $ 77.2 Total Revenues $ 8.7 $ 16.7 $ 51.5 $ 82.4 Net Losses & Loss Adjustment Expenses $ (4.6) $ (10.8) $ (29.8) $ (50.2) Underwriting, Policy Acquisition & Operating Expenses $ (2.7) $ (6.8) $ (18.0) $ (30.1) Segment Results $ 1.4 $ (0.9) $ 3.7 $ 2.1 Current Accident Year Net Loss Ratio 38.7 % 55.4 % 51.9 % 64.2 % Effect of Prior Accident Year Reserve Development 17.5 % 11.8 % 9.7 % 0.8 % Net Loss Ratio 56.2 % 67.2 % 61.6 % 65.0 % Underwriting Expense Ratio 33.7 % 42.2 % 37.1 % 39.0 % Combined Ratio 89.9 % 109.4 % 98.7 % 104.0 % In millions, except ratios | Subject to rounding

ProAssurance Investor Briefing | March 2022 40 Subject to rounding (1) All other reinsurance arrangements primarily represent alternative market business ceded under a 100% quota share reinsurance agreement, net of a ceding commission, to SPCs in our Segregated Portfolio Cell Reinsurance segment. (2) All other reinsurance arrangements includes alternative market premium, net of reinsurance, which all or a portion of the premium is ceded to certain SPCs in our Segregated Portfolio Cell Reinsurance segment. (3) All Lloyd’s reinsurance premium is shown in the “all other reinsurance arrangements” line. (4) Includes $4.2M contributed by NORCAL since the date of acquisition. The NORCAL premium related almost entirely to an increase in our estimate of premiums owed to reinsurers due to premium in excess of the deposit ceded premium under NORCAL's excess of loss reinsurance arrangement and, to a lesser extent, premium related to cyber liability coverages. The majority of ceded premiums for NORCAL's excess of loss reinsurance arrangement were recorded by NORCAL before the acquisition in their first quarter 2021 results, and were expensed pro rata throughout the contract year. However, we incorporated NORCAL policies into our existing HCPL excess of loss reinsurance arrangement with the October 1, 2021 renewal and ceded premiums will fluctuate with the volume of written premium subject to cession under the arrangement each quarter. Ceded Premiums Written (12/31/21) ($ in millions) Specialty P&C Workers’ Compensation Insurance (1) Segregated Portfolio Cell Reinsurance Lloyd’s (3) HCPL including Podiatry(2) Products Lawyers 12/31/21 12/31/20 12/31/21 12/31/20 12/31/21 12/31/20 12/31/21 12/31/20 12/31/21 12/31/20 12/31/21 12/31/20 Gross premiums written $ 611.6 $ 459.1 $ 41.8 $ 36.1 $ 28.2 $ 27.7 $ 240.5 $ 246.8 $ 71.9 $ 72.8 $ 38.0 $ 84.7 Ceded premiums written(4) 43.5 58.9 10.0 10.5 1.8 2.5 78.7 81.9 8.8 8.7 6.3 17.1 Net premiums written $ 568.1 $ 400.2 $ 31.8 $ 25.6 $ 26.4 $ 25.2 $ 161.8 $ 164.9 $ 63.1 $ 64.1 $ 31.7 $ 67.6 Ceded Premium Components: Primary reinsurance arrangement, current accident year $ 17.8 $ 21.0 $ 10.0 $ 10.5 $ 1.8 $ 2.5 $ 11.5 $ 12.4 $ 8.8 $ 8.7 $ — $ — All other reinsurance arrangements 29.6 37.2 — — — — 67.8 69.5 — — 6.3 17.1 Ceded premiums, current accident year 47.4 58.2 10.0 10.5 1.8 2.5 79.3 81.9 8.8 8.7 6.3 17.1 Reduction in premiums owed under reinsurance agreements (3.9) 0.7 — — — — (0.6) — — — — — Total ceded premiums written, current accident year $ 43.5 $ 58.9 $ 10.0 $ 10.5 $ 1.8 $ 2.5 $ 78.7 $ 81.9 $ 8.8 $ 8.7 $ 6.3 $ 17.1 Ceded premiums ratio, current accident year 7.8% 12.7% 24.0% 29.1% 6.5% 8.9% 33.0% 33.2% 12.2% 12.0% 16.6% 20.2%

ProAssurance Investor Briefing | March 2022 41 Investment Strategy and 2022 Outlook • Duration management remains paramount ◦ We will not extend duration in search of incremental yield • Optimizing our allocations for better risk-adjusted returns ◦ Ensures non-correlation of returns • Effective stewardship of capital ensures a position of financial strength through turbulent market cycles • Ongoing analysis of holdings to ensure lasting quality and profitability

ProAssurance Investor Briefing | March 2022 42 ($ in millions) 12/31/2021 12/31/2020 Change Net Investment Income Fixed maturities $ 74,437 $ 69,308 $ 5,129 Equities 2,539 4,369 (1,830) Short-term investments including Other 1,969 2,683 (714) BOLI 2,698 2,023 675 Investment fees and expenses (11,121) (6,385) (4,736) Net investment income 70,522 71,998 (1,476) Equity in Earnings (Loss) of Unconsolidated Subsidiaries All other investments, primarily investment fund LPs/LLCs 64,031 7,855 56,176 Tax credit partnerships (15,057) (19,776) 4,719 Equity in earnings (loss) 48,974 (11,921) 60,895 Net investment result $ 119,496 $ 60,077 $ 59,419 2021 Net Investment Result Excluding Capital Gains / (Losses) • Income from fixed maturities is up due to higher average investment balances primarily due to the addition of fixed maturity securities valued at $1.1B acquired through the NORCAL acquisition partially offset by lower yields from our corporate debt securities. • Income from equities is lower due to the reallocation in our mix of securities within this asset category. • Income yield is 2.3% (2.3% tax equivalent) for 2021 and 3.1% (3.1% tax equivalent) for the same period of 2020. • Includes Lloyd’s Syndicates investment income of $2M for 2021 and $4M for 2020 and SPCRe investment income of $0.8M for 2021 and $1.1M for 2020. • Equity in earnings (loss) results are due to higher reported earnings from our LPs/LLC, primarily within our non-public equity funds, and the prior year effect of the disruption in global financial markets during 2020 due to COVID-19. As part of the NORCAL transaction, we acquired interests in four LPs; these investments contributed $1.4M to our results. • Net investment income also includes $13.1M of income earned from investments acquired from NORCAL.
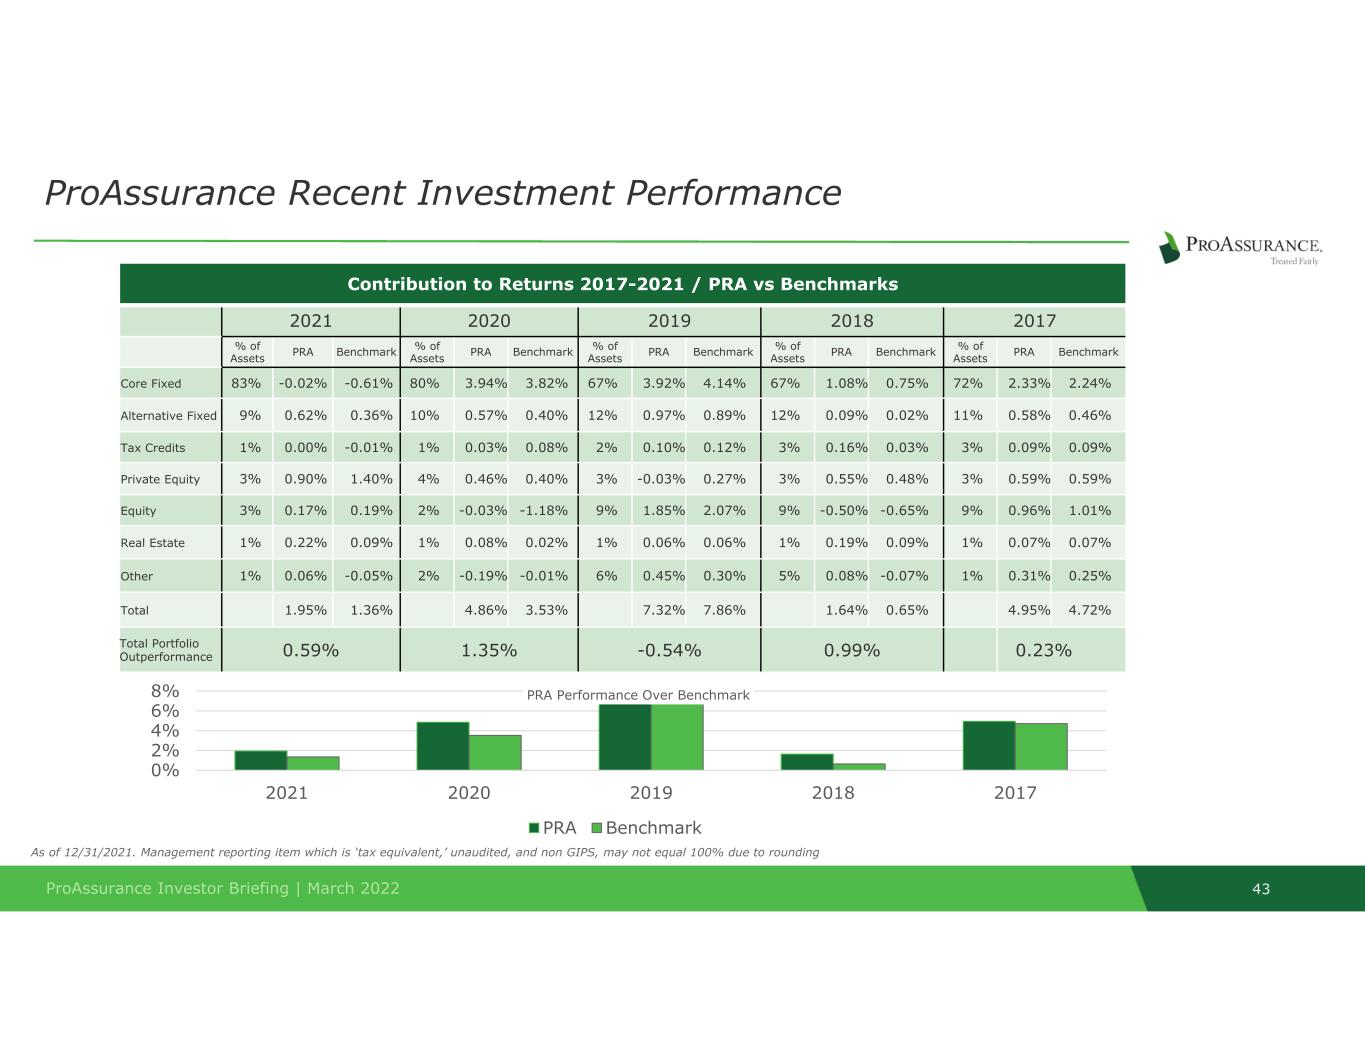
ProAssurance Investor Briefing | March 2022 43 ProAssurance Recent Investment Performance Contribution to Returns 2017-2021 / PRA vs Benchmarks 2021 2020 2019 2018 2017 % of Assets PRA Benchmark % of Assets PRA Benchmark % of Assets PRA Benchmark % of Assets PRA Benchmark % of Assets PRA Benchmark Core Fixed 83% -0.02% -0.61% 80% 3.94% 3.82% 67% 3.92% 4.14% 67% 1.08% 0.75% 72% 2.33% 2.24% Alternative Fixed 9% 0.62% 0.36% 10% 0.57% 0.40% 12% 0.97% 0.89% 12% 0.09% 0.02% 11% 0.58% 0.46% Tax Credits 1% 0.00% -0.01% 1% 0.03% 0.08% 2% 0.10% 0.12% 3% 0.16% 0.03% 3% 0.09% 0.09% Private Equity 3% 0.90% 1.40% 4% 0.46% 0.40% 3% -0.03% 0.27% 3% 0.55% 0.48% 3% 0.59% 0.59% Equity 3% 0.17% 0.19% 2% -0.03% -1.18% 9% 1.85% 2.07% 9% -0.50% -0.65% 9% 0.96% 1.01% Real Estate 1% 0.22% 0.09% 1% 0.08% 0.02% 1% 0.06% 0.06% 1% 0.19% 0.09% 1% 0.07% 0.07% Other 1% 0.06% -0.05% 2% -0.19% -0.01% 6% 0.45% 0.30% 5% 0.08% -0.07% 1% 0.31% 0.25% Total 1.95% 1.36% 4.86% 3.53% 7.32% 7.86% 1.64% 0.65% 4.95% 4.72% Total Portfolio Outperformance 0.59% 1.35% -0.54% 0.99% 0.23% 0% 2% 4% 6% 8% 2021 2020 2019 2018 2017 PRA Performance Over Benchmark PRA Benchmark As of 12/31/2021. Management reporting item which is ‘tax equivalent,’ unaudited, and non GIPS, may not equal 100% due to rounding

ProAssurance Investor Briefing | March 2022 44 * Equity shown in millions; all other data shown in thousands Change in Capital: 2011 ‒ 2021 2011 2012 2013 2014 2015 2016 2017 2018 2019 2020 2021 Beginning Equity* $1,705 $1,856 $2,164 $2,271 $2,394 $2,158 $1,958 $1,799 $1,595 $1,523 $1,349 Cumulative-effect adjustments — — — — — — — 149 8,334 (444) — Employee Stock Transactions 6,147 6,167 7,780 9,261 11,246 8,221 12,857 8,058 2,368 1,154 4,792 Earnings 231,598 287,096 275,470 297,523 196,565 116,197 151,081 107,264 47,057 1,004 144,124 Dividends — (15,269) (192,466) (64,777) (220,464) (119,866) (315,028) (316,890) (94,314) (66,669) (10,796) Treasury Stock (106,347) (20,317) — (32,054) (222,360) (169,793) (2,106) — — — — Unrealized G/L 19,870 50,913 15,343 (85,719) (1,457) (34,349) (6,456) (2,488) (35,238) 53,866 (58,943) Total Equity* $1,856 $2,164 $2,271 $2,394 $2,158 $1,958 $1,799 $1,595 $1,523 $1,349 $1,428 1. 2020 earnings includes a pre-tax net underwriting loss of $45.7 million associated with a large national healthcare account tail policy and a pre-tax $10 million IBNR pandemic-related reserve, both of which were recorded in 2Q 2020, and a $161 million goodwill impairment charge recorded in 3Q 2020. 2. 2021 earnings includes $74.4 million gain on bargain purchase related to closing the acquisition of NORCAL.

ProAssurance Investor Briefing | March 2022 45 Utilities /Energy 10% Non US Sovrgn & Gov't 2% Basic Materials 3% Other 4% Technology 5% Communications 7% Consumer Oriented 23% Financials 40% Industrials 8% ProAssurance Portfolio Detail Corporate: $1.9 Billion (49% of Fixed Assets / 39% of Invested Assets) Weighted Average Rating: BBB+ Cash/Equities/Bonds 90% LPs (Secondary Liquidity) 7% HFs/Privates 30‐90 DAYS 2% BOLI SIX MONTHS 2% Sources of Liquidity 12/31/2021 Subject to rounding

ProAssurance Investor Briefing | March 2022 46 12/31/2021 Subject to rounding ProAssurance Portfolio Detail: Asset Backed Weighted Average Rating: “AA” Asset-Backed Securities: $1.2 Billion (30% of Fixed Income / 24% of Invested Assets) RMBS 38% Student Loans 1% Auto 9% Credit Cards 2% CLOs 3% Other 29% CMBS 18%

ProAssurance Investor Briefing | March 2022 47 12/31/2021 Subject to rounding ProAssurance Portfolio Detail: Fixed-Trading Weighted Average Rating: “AA” Fixed Maturities: $44 Million (1% of Fixed Income / 1% of Invested Assets) All Fixed Trading Securities are owned by Lloyd’s Syndicate 1729 ABS & Other 2% Consumer Oriented 12% Financial 23% Government 48% Industrial 6% Technology 5% Utilities/Energy 5%

ProAssurance Investor Briefing | March 2022 48 General Obligation 16% Pre-refunded 5% Special Revenue 78% 12/31/2021 Subject to rounding ProAssurance Portfolio Detail: Municipals Municipals: $519 Million (13% of Fixed Income / 11% Invested Assets) Weighted Average Rating: AA Top 10 Municipal Holdings in millions New York City Transitional $14 Houston TX Utility Sys Revenue $12 New York, NY $12 Texas State A&M University Revenue $9 Connecticut State Housing Fin Auth $9 New York State Urban Dev Auth $9 Illinois State Fin Auth Revenue $8 Regl Transprtn Auth IL $7 Oregon State $7 Miami-Dade Cnty Fl Water and Sewer $7

ProAssurance Investor Briefing | March 2022 49 12/31/2021 Subject to rounding ProAssurance Portfolio: Equities & Other Common Equities 3% Private Equity 27% Private Credit 15% Real Estate LP 8% Other <1% Bond Funds 31% Convertible Bonds 14% Tax Credits 2% Equities & Other: $652 Million (14% of Invested Assets)

ProAssurance Investor Briefing | March 2022 50 Combined Tax Credits Portfolio Detail & Projections Year Capital Contributions GAAP Income/(Loss) from Operations, Disposition & Impairment Total Credits Tax Provision after Operating Losses/Impairments and Tax Credits Impact on Earnings 2021 $ 120,245 (15,056,695) (13,495,592) (16,657,500) 1,600,804 2022 $ 283,415 (8,800,603) (4,819,621) (6,667,750) (2,132,853) 2023 $ 51,338 (3,320,443) (167,458) (864,751) (2,455,692) 2024 $ 51,338 (1,641,341) (38,350) (383,034) (1,258,307) 2025 $ 41,159 (993,001) (21,466) (229,996) (763,004) 2026 $ 25,734 (60,117) (3,054) (15,678) (44,439) 2027 $ - 70,489 (79) 14,724 55,765 2028 $ - - - - - This column represents our current estimated schedule of tax credits that we expect to receive from our tax credit partnerships. The actual amounts of credits provided by the tax credit partnerships may prove to be different than our estimates. These tax credits are included in our Tax Expense (Benefit) on our Income Statement (below the line) and result in a Tax Receivable (or a reduction to a Tax Liability) on our Balance Sheet.

ProAssurance Investor Briefing | March 2022 51 Forward Looking Statements Non-GAAP Measures This presentation contains Forward Looking Statements and other information designed to convey our projections and expectations regarding future results. There are a number of factors which could cause our actual results to vary materially from those projected in this presentation. The principal risk factors that may cause these differences are described in various documents we file with the Securities and Exchange Commission, such as our Current Reports on Form 8-K, and our regular reports on Forms 10-Q and 10-K, particularly in “Item 1A, Risk Factors.” Please review this presentation in conjunction with a thorough reading and understanding of these risk factors. This presentation contains Non-GAAP measures, and we may reference Non-GAAP measures in our remarks and discussions with investors. The primary Non-GAAP measure we reference is Non-GAAP operating income, a Non-GAAP financial measure that is widely used to evaluate performance within the insurance sector. In calculating Non-GAAP operating income, we have excluded the after-tax effects of net realized investment gains or losses and guaranty fund assessments or recoupments that do not reflect normal operating results. We believe Non-GAAP operating income presents a useful view of the performance of our insurance operations, but should be considered in conjunction with net income computed in accordance with GAAP. A reconciliation of these measures to GAAP measures is available in our regular reports on Forms 10-Q and 10-K and in our latest quarterly news release, all of which are available in the Investor Relations section of our website, Investor.ProAssurance.com. IMPORTANT SAFE HARBOR & NON-GAAP NOTICES

© ProAssurance Corporation. All rights reserved. MAILING ADDRESS: ProAssurance Corporation 100 Brookwood Place Birmingham, AL 35209 CONTACT: Jason Gingerich VP of Investor Relations 512.879.5101 [email protected]
Serious News for Serious Traders! Try StreetInsider.com Premium Free!
You May Also Be Interested In
- Vault Cares Network Partners With Global Alliance for Regenerative Medicine to Pioneer Advanced Healthcare Solutions
- Bambuser Acquires the Tech Solution HERO from Klarna
- RMG Acquisition Corp. III Announces Cancellation of Dissolution
Create E-mail Alert Related Categories
SEC FilingsSign up for StreetInsider Free!
Receive full access to all new and archived articles, unlimited portfolio tracking, e-mail alerts, custom newswires and RSS feeds - and more!


 Tweet
Tweet Share
Share