

Form 8-K PHOTRONICS INC For: Dec 08
 Tweet
Tweet Share
ShareExhibit 99.1
 |
For Further Information:
John P. Jordan
Executive Vice President & CFO
203.740.5671
|
Press Release
Photronics Reports Full Year and Fourth Quarter Fiscal 2021 Results
BROOKFIELD, Conn. December 8, 2021 (GLOBE NEWSWIRE) — Photronics, Inc. (NASDAQ: PLAB), a worldwide leader in photomask technologies and solutions, today reported
financial results for its full year and fourth quarter fiscal 2021 ended October 31, 2021.
“Photronics achieved a fourth consecutive year of record revenue, as demand for our design-driven products accelerated and we fully ramped new flat panel display
capacity,” said Peter Kirlin, chief executive officer. “We made strategic investments in 2021 that have positioned us to achieve organic growth as market trends such as the increase in demand from Asia foundries and the adoption of advanced display
technologies in mobile applications have driven the market higher.”
Full Year 2021 Results
| • |
Revenue of $663.8 million was a record for the fourth consecutive year, up 9% compared with 2020
|
| • |
Net income attributable to Photronics, Inc. shareholders was $55.4 million, or $0.89 per diluted share
|
| • |
Cash provided by operating activities was $150.8 million, capex was $103.5 million, share repurchases were $48.3 million, and ending cash balance was $276.7 million
|
Fourth Quarter 2021 Results
| • |
Revenue was $181.3 million, the third consecutive quarterly record, up 6% sequentially and 21% year-over-year
|
| • |
Net income attributable to Photronics, Inc. shareholders was $19.8 million ($0.33 per diluted share), compared with $17.1 million ($0.28 per diluted share) for the third quarter of
2021 and $6.5 million ($0.10 per diluted share) for the fourth quarter of 2020
|
Full year integrated circuit (IC) revenue was $460.2 million, up 10% compared with last year; flat panel display (FPD) revenue was $203.6 million, 6% over the same
quarter last year.
IC revenue in the fourth quarter was $125.4 million, up 7% sequentially and 18% compared with the fourth quarter of last year; FPD revenue was $55.8 million, up 6% over
last quarter and 29% over the same period last year.
“Past investments in targeted technologies are paying off, as margin expansion is accompanying top-line growth,” added Kirlin. “We are generating gross and operating
margins already at the high-end of the three-year target model we presented last year, and our strong cash flow enables us to invest in the business while we also return cash to shareholders as part of our disciplined capital allocation. With strong
end market demand, solid balance sheet, broad geographic presence, and a team with a proven track record, we are excited about our future and optimistic we can deliver on our long-term target model objectives.”
First Quarter 2022 Guidance
For the first quarter of 2022, Photronics expects revenue to be between $178 million and $186 million, and net income attributable to Photronics, Inc. shareholders to be
between $0.27 and $0.34 per diluted share.
Conference Call
A conference call to discuss these results is scheduled for 8:30 a.m. Eastern time on Wednesday, December 8, 2021. The call can be accessed by logging onto Photronics'
website at www.photronics.com. The live dial-in number is (877) 377-7095 or (408) 774-4601 outside of the United States and Canada. The call will be archived on Photronics’ website.
About Photronics
Photronics is a leading worldwide manufacturer of integrated circuit (IC) and flat panel
display (FPD) photomasks. High precision quartz plates that contain microscopic images of electronic circuits, photomasks are a key element in the IC and FPD manufacturing
process. Founded in 1969, Photronics has been a trusted photomask supplier for over 50 years. As of October 31, 2021, the company had 1,728 employees. The company operates 11 strategically located manufacturing facilities in Asia, Europe, and North America. Additional information on the company can be accessed at www.photronics.com.
Forward-Looking Statements
Certain statements in this press release constitute “forward-looking statements” within the meaning of the Private Securities Litigation Reform Act of 1995. The Private
Securities Litigation Reform Act of 1995 provides a “safe harbor” for forward-looking statements made by or on behalf of the company and its subsidiaries. Such forward-looking statements involve known and unknown risks, uncertainties and other
factors which may cause actual results, performance or achievements of Photronics to be materially different from any future results, performance or achievements expressed or implied by such forward-looking statements. Statements preceded by,
followed by or that otherwise include the words “believes,” “expects,” “anticipates,” “intends,” “projects,” “estimates,” “plans,” “may increase,” “may fluctuate,” “will,” “should,” “would,” “may” and “could” or similar words or expressions are
generally forward-looking in nature and not historical facts. Any statements that refer to outlook, expectations or other characterizations of future events, circumstances or results are also forward-looking statements. Important risks, assumptions
and other important factors that could cause future results to differ materially from those expressed in the forward-looking statements are specified in Photronics’ Annual and Quarterly filings with the Securities and Exchange Commission under
headings such as “Forward-Looking Statements”, “Risk Factors” and “Management’s Discussion and Analysis of Financial Condition and Results of Operations” and in other filings and furnishings made by Photronics with the Securities and Exchange
Commission from time to time. These risks and uncertainties include, but are not limited to, the current pandemic and future recurrences and other developments with respect thereto, governmental responses to the pandemic and related matters, changes
in end markets resulting therefrom, changes in investment, tax, trade, exchange and other laws and regulations, compliance with local, State and Federal laws, rules and regulations including, but not limited to, import and export controls, tariffs
and penalties, fines and violations related thereto, as well as economic, competitive, legal, governmental, political, monetary and fiscal policy, and technological factors and decisions we may make in the future regarding our business, capital
structure and other matters. Photronics undertakes no obligation to release publicly any revisions to any forward-looking statements or, except as required to be disclosed in filings or furnishings with the Securities and Exchange Commission, to
report events or to report the occurrence of unanticipated events. There is no assurance that Photronics’ expectations will be realized.
Exhibit 99.2
PHOTRONICS, INC.
Condensed Consolidated Statements of Income
(in thousands, except per share amounts)
(Unaudited)
|
Three Months Ended
|
Year Ended
|
|||||||||||||||||||
|
October 31,
2021 |
August 1,
2021 |
October 31,
2020 |
October 31,
2021 |
October 31,
2020 |
||||||||||||||||
|
Revenue
|
$
|
181,288
|
$
|
170,643
|
$
|
149,286
|
$
|
663,761
|
$
|
609,691
|
||||||||||
|
Cost of goods sold
|
129,347
|
125,318
|
117,401
|
496,717
|
475,037
|
|||||||||||||||
|
Gross Profit
|
51,941
|
45,325
|
31,885
|
167,044
|
134,654
|
|||||||||||||||
|
Operating Expenses:
|
||||||||||||||||||||
|
Selling, general and administrative
|
14,322
|
15,083
|
12,790
|
57,525
|
53,582
|
|||||||||||||||
|
|
||||||||||||||||||||
|
Research and development
|
4,100
|
5,305
|
4,110
|
18,490
|
17,144
|
|||||||||||||||
|
|
||||||||||||||||||||
|
Total Operating Expenses
|
18,422
|
20,388
|
16,900
|
76,015
|
70,726
|
|||||||||||||||
|
Other operating income, net
|
-
|
3,525
|
-
|
3,525
|
-
|
|||||||||||||||
|
Operating Income
|
33,519
|
28,462
|
14,985
|
94,554
|
63,928
|
|||||||||||||||
|
Non-operating income (expense), net
|
3,809
|
3,735
|
(2,937
|
)
|
7,452
|
(2,327
|
)
|
|||||||||||||
|
Income Before Income Tax Provision
|
37,328
|
32,197
|
12,048
|
102,006
|
61,601
|
|||||||||||||||
|
Income tax provision
|
8,697
|
7,842
|
3,469
|
23,190
|
21,258
|
|||||||||||||||
|
Net Income
|
28,631
|
24,355
|
8,579
|
78,816
|
40,343
|
|||||||||||||||
|
Net income attributable to noncontrolling interests
|
8,820
|
7,279
|
2,119
|
23,367
|
6,523
|
|||||||||||||||
|
Net income attributable to Photronics, Inc. shareholders
|
$
|
19,811
|
$
|
17,076
|
$
|
6,460
|
$
|
55,449
|
$
|
33,820
|
||||||||||
|
Earnings per share:
|
||||||||||||||||||||
|
Basic
|
$
|
0.33
|
$
|
0.28
|
$
|
0.10
|
$
|
0.90
|
$
|
0.52
|
||||||||||
|
|
||||||||||||||||||||
|
Diluted
|
$
|
0.33
|
$
|
0.28
|
$
|
0.10
|
$
|
0.89
|
$
|
0.52
|
||||||||||
|
Weighted-average number of common shares outstanding:
|
||||||||||||||||||||
|
Basic
|
60,216
|
60,884
|
64,193
|
61,407
|
64,866
|
|||||||||||||||
|
|
||||||||||||||||||||
|
Diluted
|
60,908
|
61,515
|
64,768
|
61,999
|
65,470
|
|||||||||||||||
Exhibit 99.3
PHOTRONICS, INC.
Condensed Consolidated Balance Sheets
(in thousands)
(Unaudited)
|
October 31,
2021 |
October 31,
2020 |
|||||||
|
Assets
|
||||||||
|
Current assets:
|
||||||||
|
Cash and cash equivalents
|
$
|
276,670
|
$
|
278,665
|
||||
|
Accounts receivable
|
174,447
|
134,470
|
||||||
|
Inventories
|
55,249
|
57,269
|
||||||
|
Other current assets
|
44,250
|
29,735
|
||||||
|
Total current assets
|
550,616
|
500,139
|
||||||
|
Property, plant and equipment, net
|
696,553
|
631,475
|
||||||
|
Intangible assets, net
|
774
|
3,437
|
||||||
|
Other assets
|
46,259
|
53,131
|
||||||
|
Total assets
|
$
|
1,294,202
|
$
|
1,188,182
|
||||
|
Liabilities and Equity
|
||||||||
|
Current liabilities:
|
||||||||
|
Debt
|
$
|
22,248
|
$
|
13,678
|
||||
|
Accounts payable and accrued liabilities
|
153,900
|
129,261
|
||||||
|
Total current liabilities
|
176,148
|
142,939
|
||||||
|
Long-term debt
|
89,446
|
54,980
|
||||||
|
Other liabilities
|
28,046
|
27,997
|
||||||
|
Photronics, Inc. shareholders' equity
|
823,692
|
804,962
|
||||||
|
Noncontrolling interests
|
176,870
|
157,304
|
||||||
|
Total equity
|
1,000,562
|
962,266
|
||||||
|
Total liabilities and equity
|
$
|
1,294,202
|
$
|
1,188,182
|
||||
Exhibit 99.4
PHOTRONICS, INC.
Condensed Consolidated Statements of Cash Flows
(in thousands)
(Unaudited)
|
Year Ended
|
||||||||
|
October 31,
2021 |
October 31,
2020 |
|||||||
|
Cash flows from operating activities:
|
||||||||
|
Net income
|
$
|
78,816
|
$
|
40,343
|
||||
|
Adjustments to reconcile net income to net cash provided by operating activities:
|
||||||||
|
Depreciation and amortization
|
90,396
|
93,814
|
||||||
|
Share-based compensation
|
5,348
|
4,927
|
||||||
|
Changes in operating assets, liabilities and other
|
(23,788
|
)
|
3,962
|
|||||
|
Net cash provided by operating activities
|
150,772
|
143,046
|
||||||
|
Cash flows from investing activities:
|
||||||||
|
Purchases of property, plant and equipment
|
(109,099
|
)
|
(70,815
|
)
|
||||
|
Government incentives
|
5,775
|
5,263
|
||||||
|
Purchases of intangible assets
|
(170
|
)
|
(159
|
)
|
||||
|
Net cash used in investing activities
|
(103,494
|
)
|
(65,711
|
)
|
||||
|
Cash flows from financing activities:
|
||||||||
|
Proceeds from long-term debt
|
20,858
|
20,340
|
||||||
|
Purchases of treasury stock
|
(48,250
|
)
|
(34,394
|
)
|
||||
|
Repayments of debt
|
(20,352
|
)
|
(7,392
|
)
|
||||
|
Dividends paid to noncontrolling interests
|
(9,597
|
)
|
(16,151
|
)
|
||||
|
Proceeds from share-based arrangements
|
3,874
|
4,239
|
||||||
|
Contribution from noncontrolling interest
|
-
|
17,596
|
||||||
|
Net settlements of restricted stock awards
|
(436
|
)
|
(248
|
)
|
||||
|
Net cash used in financing activities
|
(53,903
|
)
|
(16,010
|
)
|
||||
|
Effect of exchange rate changes on cash, cash equivalents, and restricted cash
|
4,703
|
10,986
|
||||||
|
Net (decrease) increase in cash, cash equivalents, and restricted cash
|
(1,922
|
)
|
72,311
|
|||||
|
Cash, cash equivalents, and restricted cash, beginning of period
|
281,602
|
209,291
|
||||||
|
Cash, cash equivalents, and restricted cash, end of period
|
$
|
279,680
|
$
|
281,602
|
||||
Exhibit 99.5
Q4 2021 Financial Results Conference CallDecember 8, 2021 Photronics, Inc.
Safe Harbor Statement This presentation and some of our comments may contain projections or other
forward-looking statements regarding future events, our future financial performance and/or the future performance of the industry. These statements are predictions and contain risks and uncertainties. Actual events or results may differ
materially from those presented. These statements include words like “anticipate”, “believe”, “estimate”, “expect”, “forecast”, “may”, “plan”, “project”, “in our view” or the negative thereto. We cannot guarantee the accuracy of any forecasts
or estimates, and we are not obligated to update any forward-looking statements if our expectations change. If you would like more information on the risks involved in forward-looking statements, please see the documents we file from time to
time with the Securities and Exchange Commission. 12/8/2021 2

2021 Summary Revenue was a record $663.8M, up 9%IC and FPD both achieved record revenue, up 10% and
6%, respectivelyRecord revenue to China, up 20%Net income attributable to Photronics, Inc. shareholders of $55.4M ($0.89/share)Cash balance $277M100% of free cash flow returned to investors through share repurchases$151M generated from
operating activity$109M invested in capex ($103M net of government incentives)Completed FPD capacity expansion ahead of schedule 12/8/2021 3 Another year with record revenue and improved performance in a challenging environment

Q4 2021 Summary Revenue was a record $181.3M, up 6% Q/Q and 21% Y/YIC (+7% Q/Q, +18% Y/Y) and FPD (+6%
Q/Q, +29% Y/Y) both achieved record revenueRecord revenue to China, up 26% Q/Q and 55% Y/YNet income attributable to Photronics, Inc. shareholders of $19.8M ($0.33/share)Cash balance $277M$38M generated from operating activity$17M invested in
capex$13M returned to investors through share repurchasesInvesting in mainstream IC capacity to capitalize on market growth trendsReceived 2021 UMC Excellent Collaboration and Partnership Award 12/8/2021 4 Strategic investments driving
long-term, profitable growth

Next phase of investment strategy Revenue growthWin lion’s share of “Made in China 2025” TAM
growthSupplement new factories with point tool investmentsCapture captive outsourcing opportunity created by EUVCapitalize on technology leadership in AMOLED to continue improving mixMargin expansionSustained pricing strength in mainstream IC
going into 2022Optimize asset tool set to match end-market demandIncreasing benefit from operating leverageExplore strategic partnerships 12/8/2021 5

Illustrative Target Model $M (except EPS) 2019 2020 2021 12/2020 Illustrative FY2023 Target
Model Revenue $551 $610 $664 $7005% CAGR $7256% CAGR $7507% CAGR Gross Margin 22% 22% 25% 24-26% 26-28% 27-29% Operating Margin 9% 10% 14% 13-15% 15-17% 17-19% Operating Cash
Flow $68 $143 $151 $150-160 $160-170 $175-185 Free Cash Flow ($83) $77 $47 $80-90 $90-100 $100-110 EPS $0.44 $0.52 $0.89 $1.00-1.05 $1.15-1.25 $1.25-1.35 12/8/2021 6

Income Statement Summary $M (except EPS) Q421 Q321 Q/Q Q420 Y/Y Revenue $ 181.3 $ 170.6 6% $
149.3 21% Gross Profit $ 51.9 $ 45.3 15% $ 31.9 63% Gross Margin 28.7% 26.6% 210 bps 21.4% 730 bps Operating Income $ 33.5 $ 28.5 18% $ 15.0 124% Operating Margin 18.5% 16.7% 180 bps 10.0% 850 bps Other non-operating
income (expense) $ 3.8 $ 3.7 $ 0.1 ($ 2.9) $ 6.7 Income tax provision $ 8.7 $ 7.8 $ 0.9 $ 3.5 $ 5.2 Minority interest $ 8.8 $ 7.3 $ 1.5 $ 2.1 $ 6.7 Net Income* $ 19.8 $ 17.1 16% $ 6.5 207% Diluted EPS* $ 0.33 $ 0.28 $
0.05 $ 0.10 $ 0.23 Days in quarter 91 91 - 90 1 Margins improved on higher revenue (IC & FPD), better mainstream IC pricing and high-end mixAsia price increases already in placeRolling out price increases in other marketsQ321
operating income includes $3.5M gain on sale of fixed assetOther non-operating income (expense) primarily due to FX gain (loss)Minority interest is IC JVs in Taiwan and China 12/8/2021 7 *Net income attributable to Photronics, Inc.
shareholders

$M Q421 Q321 Q/Q Q420 Y/Y High-End* $ 42.6 $ 42.4 1% $ 38.2 12% Mainstream $ 82.9 $
75.4 10% $ 67.8 22% Total $ 125.4 $ 117.8 7% $ 105.9 18% IC Photomask Revenue 12/8/2021 8 High-end growth driven by strong logic demand in AsiaMainstream up on proliferation of chips in IoT, 5G, Crypto and consumer products
creating support for higher ASPsOutlookContinued strength from remote work and educationMainstream demand strong, expanding ASPs *28nm and smaller Total may differ due to rounding
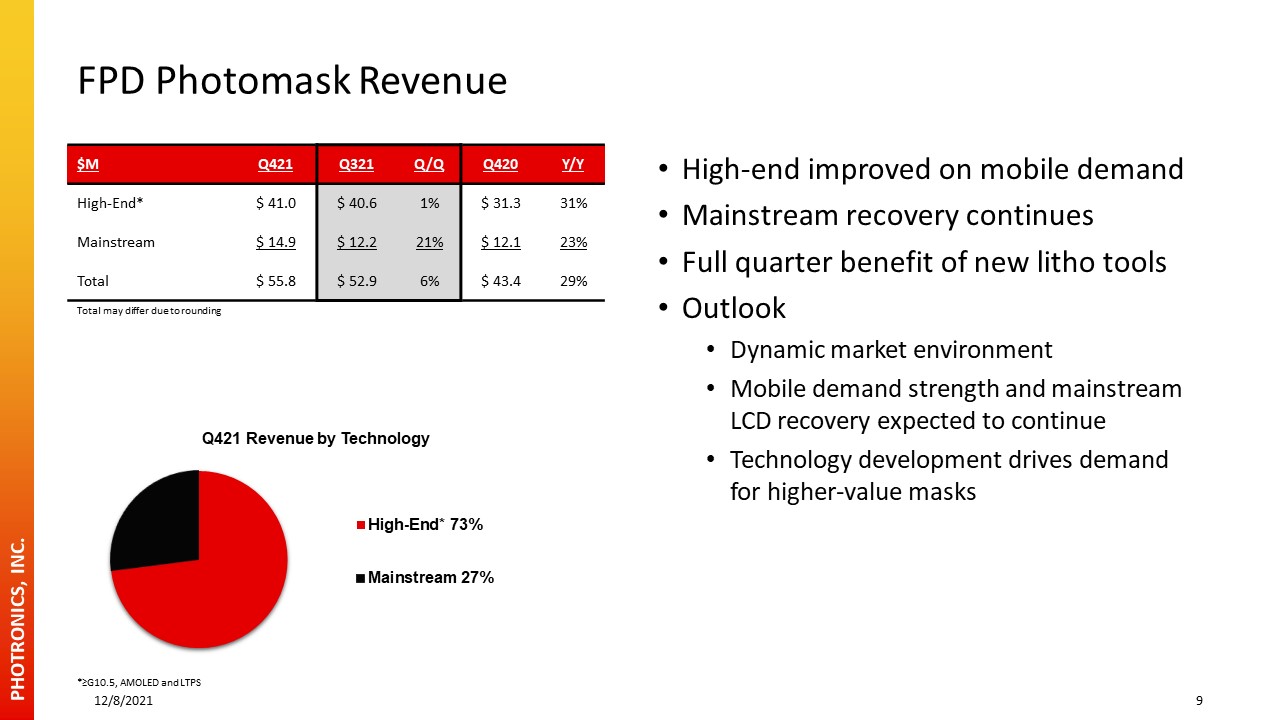
FPD Photomask Revenue 12/8/2021 9 High-end improved on mobile demandMainstream recovery continues
Full quarter benefit of new litho toolsOutlookDynamic market environmentMobile demand strength and mainstream LCD recovery expected to continueTechnology development drives demand for higher-value masks *≥G10.5, AMOLED and
LTPS $M Q421 Q321 Q/Q Q420 Y/Y High-End* $ 41.0 $ 40.6 1% $ 31.3 31% Mainstream $ 14.9 $ 12.2 21% $ 12.1 23% Total $ 55.8 $ 52.9 6% $ 43.4 29% Total may differ due to rounding
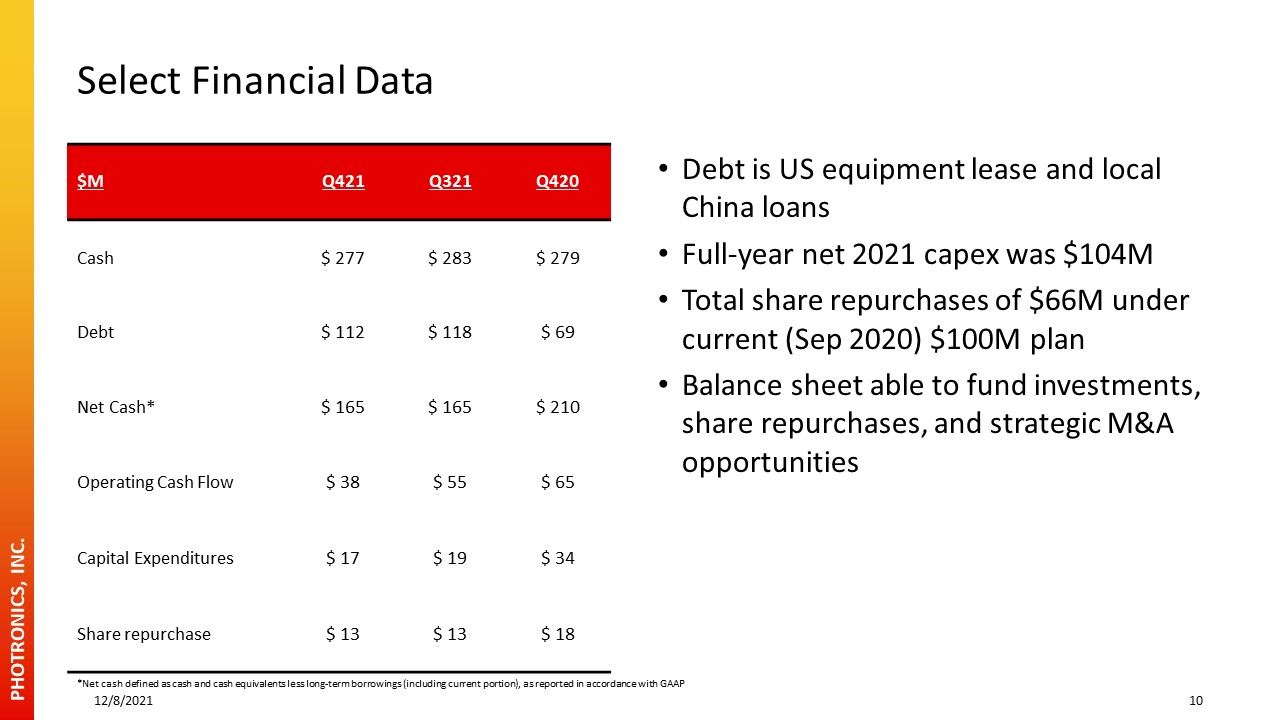
Select Financial Data $M Q421 Q321 Q420 Cash $ 277 $ 283 $ 279 Debt $ 112 $ 118 $ 69 Net
Cash* $ 165 $ 165 $ 210 Operating Cash Flow $ 38 $ 55 $ 65 Capital Expenditures $ 17 $ 19 $ 34 Share repurchase $ 13 $ 13 $ 18 Debt is US equipment lease and local China loansFull-year net 2021 capex was $104MTotal share
repurchases of $66M under current (Sep 2020) $100M planBalance sheet able to fund investments, share repurchases, and strategic M&A opportunities 12/8/2021 10 *Net cash defined as cash and cash equivalents less long-term borrowings
(including current portion), as reported in accordance with GAAP

Q122 Guidance Revenue ($M) $178 - $186 Operating Margin 18% - 20% Taxes ($M) $9 -
$10 EPS $0.27 - $0.34 Diluted Shares (M) ~60 Full-year Capex (M) ~$100 Incorporation of chips in IoT, 5G, Crypto and consumer products Remote work and learningAdvanced display technologiesGrowing nationalism spurs investmentOutlook
clouded by geopolitical uncertainty and supply chain challengesDriving margin expansion and improved cash flowsCapex mostly mainstream IC capacity & facility expansion 12/8/2021 11
For Additional Information:John P. JordanExecutive Vice President &
[email protected] Thank you for your interest!

Appendix

Total Revenue 12/8/2021 14 IC FPD Total may differ due to rounding
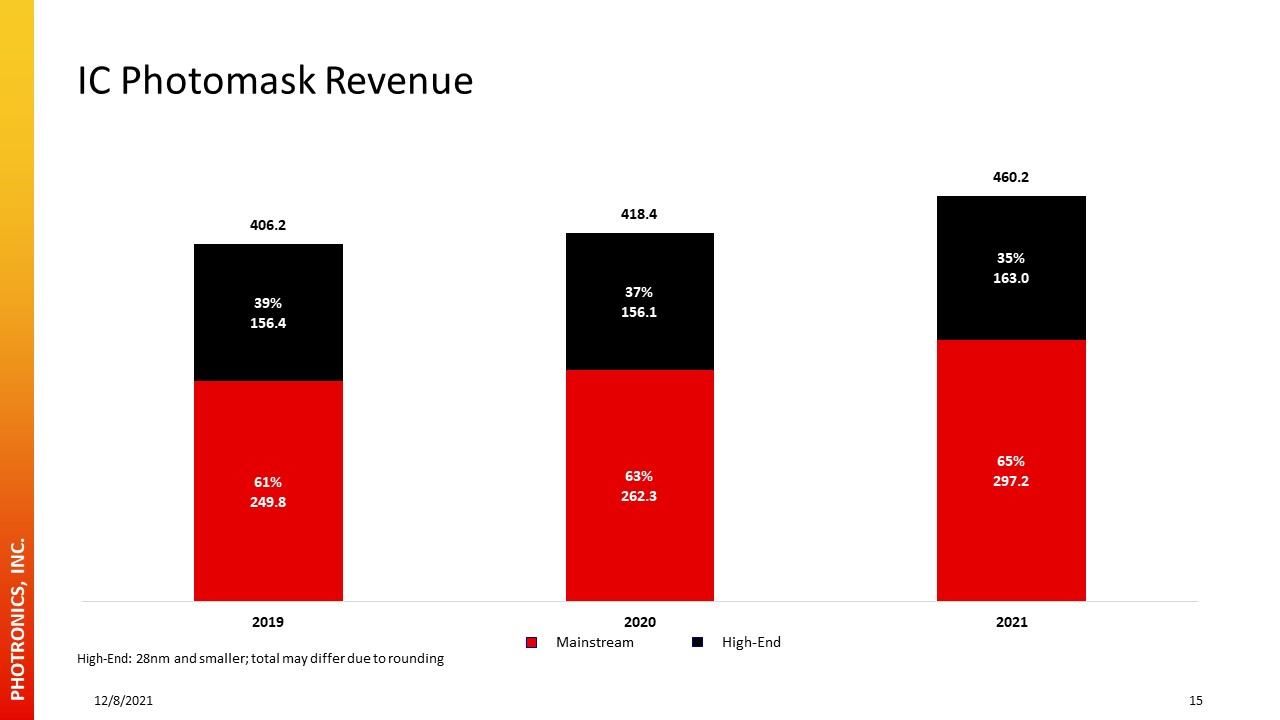
IC Photomask Revenue 12/8/2021 15 Mainstream High-End High-End: 28nm and smaller; total may
differ due to rounding

FPD Photomask Revenue 12/8/2021 16 Mainstream High-End High-End: ≥G10.5, AMOLED and LTPS; total may differ due to rounding
Serious News for Serious Traders! Try StreetInsider.com Premium Free!
You May Also Be Interested In
- Builders Capital Mortgage Corp. Releases Annual Financial Statements; Reports Strong Results for 2023: Annual Income up 21.6% Year-Over-Year
- La Jolla Institute for Immunology and RevolKa started a Research Collaboration
- William H. Reinhardt Elected Vice President – Research, Adams Diversified Equity Fund
Create E-mail Alert Related Categories
SEC FilingsSign up for StreetInsider Free!
Receive full access to all new and archived articles, unlimited portfolio tracking, e-mail alerts, custom newswires and RSS feeds - and more!
