

Form 8-K PACIFIC GAS & ELECTRIC For: Jun 09 Filed by: PG&E Corp
 Tweet
Tweet Share
Share
Exhibit 99.1

Investor Day June 10, 2022 1

Forward - Looking Statements This presentation contains statements regarding management’s expectations and objectives for future periods as well as foreca sts and estimates regarding PG&E Corporation’s and Pacific Gas and Electric Company’s (the “Utility”) culture, Lean operating system, wildfire mitigation initiatives, rate base projections, capital exp end iture forecasts, expense reduction forecasts, clean energy goals, and regulatory developments. These statements and other statements that are not purely historical constitute forward - looking statements that ar e necessarily subject to various risks and uncertainties. Actual results may differ materially from those described in forward - looking statements. PG&E Corporation and the Utility are not able to predict all the factors that may affect future results. Factors that could cause actual results to differ materially include, but are not limited to, risks and uncertainties associated with: • wildfires that have occurred in the Utility’s territory, including the extent of the Utility’s liability in connection with t he 2019 Kincade fire, the 2020 Zogg fire, the 2021 Dixie fire (including the outcome of the criminal complaint filed in connection with the 2020 Zogg fire), and future wildfires; • the Utility’s ability to recover wildfire - related costs, including costs for the 2021 Dixie fire, from the Wildfire Fund (includ ing the Utility’s maintenance of a valid safety certificate and whether the Wildfire Fund has sufficient remaining funds) and through the WEMA and FERC TO rate cases; and the timing of insurance recoveries; • the Utility’s implementation of its wildfire mitigation initiatives, including the Public Safety Power Shutoff and Enhanced P owe rline Safety Settings program and the undergrounding initiative, and the initiatives’ effectiveness; • the Utility’s ability to safely and reliably operate, maintain, construct and decommission its facilities; • the Utility’s ability to obtain wildfire insurance at a reasonable cost in the future, or at all; the adequacy of insurance c ove rage and scope of limitations; the ability to obtain recovery of insurance premiums; and the timing and extent of insurance recoveries; • changes in the electric power and gas industries driven by technological advancements and a decarbonized economy; • a cyber incident, cyber security breach, severe natural event or physical attack; • severe weather conditions, extended drought, and climate change, particularly their impact on the likelihood and severity of wil dfires; • the impact of legislative and regulatory developments, including those regarding wildfires, the environment, California’s cle an energy goals, the nuclear industry, regulation of utilities and their holding companies, and taxes; • the timing and outcome of FERC and CPUC ratemaking, cost recovery, and future cost of capital proceedings; • the outcome of self - reports, investigations or other enforcement actions, including the EOEP and other enforcement proceedings; • PG&E Corporation and the Utility’s substantial indebtedness, which may adversely affect their financial health and limit thei r o perating flexibility; • the ability of PG&E Corporation and the Utility to finance through securitization up to $2.4 billion of fire risk mitigation cap ital expenditures that were or will be incurred by the Utility and $7.5 billion of costs related to the 2017 Northern California wildfires; • the timing and outcome of PG&E Corporation’s and the Utility’s litigation, including unresolved claims from the Chapter 11 pr oce edings, securities class action claims, wildfire - related litigation, and appeals of the Confirmation Order; • future substantial sales of shares of common stock of PG&E Corporation by existing shareholders, including the Fire Victim Tr ust ; • the Utility’s ability to retain or contract for the workforce to execute its wildfire mitigation initiatives; • the Utility’s ability to control operating costs, timely recover costs through rates and achieve projected savings, and the e xte nt to which it incurs unrecoverable costs that are higher than forecasted; • tax treatment of certain assets and liabilities, including whether PG&E Corporation or the Utility undergoes an “ownership ch ang e” that limits certain tax attributes; • the impact of growing distributed and renewable generation resources, and changing customer demand for its natural gas and el ect ric services; and • the other factors disclosed in PG&E Corporation and the Utility’s joint annual report on Form 10 - K for the year ended December 3 1, 2021, their joint quarterly report on Form 10 - Q for the quarter ended March 31, 2022 (the “Form 10 - Q”), and other reports filed with the SEC, which are available on PG&E Corporation’s website at www.pgeco rp.com and on the SEC website at www.sec.gov. Undefined, capitalized terms have the meanings set forth in the Form 10 - Q. Unless otherwise indicated, the statements in this pr esentation are made as of June 9, 2022. PG&E Corporation and the Utility undertake no obligation to update information contained herein. This presentation was attached to PG&E Corporation and the Ut ili ty’s joint current report on Form 8 - K that was furnished to the SEC on June 9, 2022 and is also available on PG&E Corporation’s website at www.pgecorp.com. 2
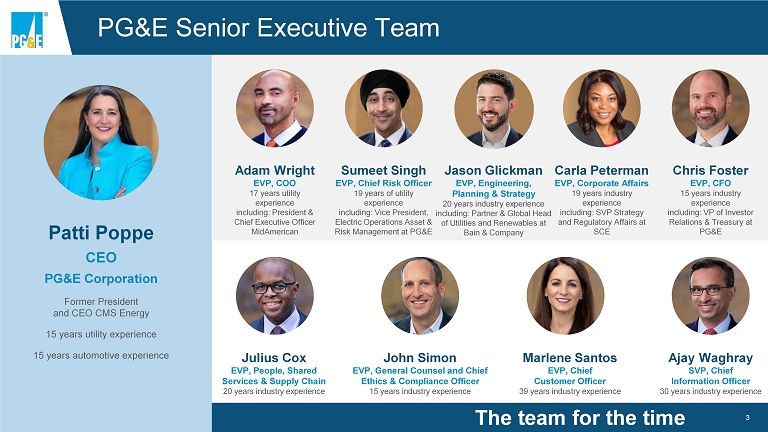
PG&E Senior Executive Team Patti Poppe CEO PG&E Corporation Former President and CEO CMS Energy 15 years utility experience 15 years automotive experience Adam Wright EVP, COO 17 years utility experience including: President & Chief Executive Officer MidAmerican Julius Cox EVP, People, Shared Services & Supply Chain 20 years industry experience Chris Foster EVP, CFO 15 years industry experience including: VP of Investor Relations & Treasury at PG&E Sumeet Singh EVP, Chief Risk Officer 19 years of utility experience including: Vice President, Electric Operations Asset & Risk Management at PG&E Jason Glickman EVP, Engineering, Planning & Strategy 20 years industry experience including: Partner & Global Head of Utilities and Renewables at Bain & Company John Simon EVP, General Counsel and Chief Ethics & Compliance Officer 15 years industry experience Marlene Santos EVP, Chief Customer Officer 39 years industry experience Carla Peterman EVP, Corporate Affairs 19 years industry experience including: SVP Strategy and Regulatory Affairs at SCE Ajay Waghray SVP, Chief Information Officer 30 years industry experience The team for the time 3

® 4 Welcome: We are... …by accelerating performance. Changing Culture Building Capability Earning Trust Delivering on our Commitments Mitigating Risk Physical and Financial

Accelerating performance 5 Mitigating Physical and Financial Risk Mitigating physical risk today Sumeet Singh - EVP, Chief Risk Officer Engineering risk and opportunity Jason Glickman - EVP, Engineering, Planning & Strategy Changing culture and building capability Adam Wright - EVP, COO Earning trust Carla Peterman - EVP, Corporate Affairs Mitigating financial risk for customers and investors Chris Foster - EVP, CFO

Accelerating performance 6 Mitigating Physical and Financial Risk Changing culture and building capability Mitigating physical risk today Sumeet Singh - EVP, Chief Risk Officer Engineering risk and opportunity Jason Glickman - EVP, Engineering, Planning & Strategy Changing culture and building capability Adam Wright - EVP, COO Earning trust Carla Peterman - EVP, Corporate Affairs Mitigating financial risk for customers and investors Chris Foster - EVP, CFO

® 7 Culture and capability... ...provide the foundation for sustainable success.
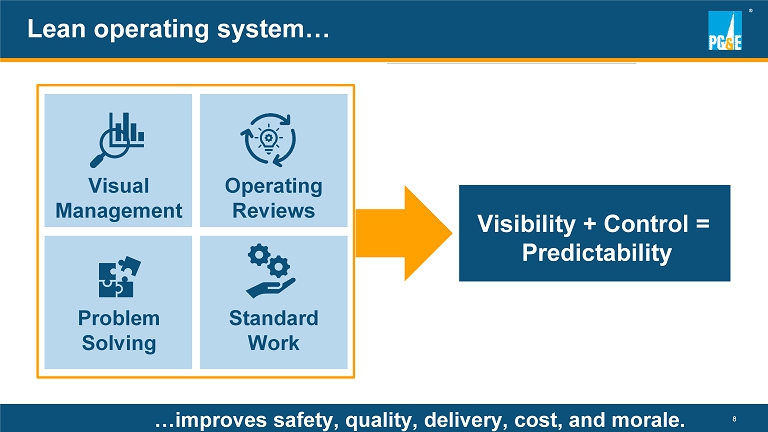
® 8 Lean operating system… …improves safety, quality, delivery, cost, and morale. Visibility + Control = Predictability Visual Management Operating Reviews Standard Work Problem Solving

® 9 Presentation Endnotes in Appendix The safest jobs have the best quality and cost BEFORE: Using a strap Risk score: 41 AFTER: Using new tool Risk score: 17 2.05 1.34 1.01 0.53 2019 2020 2021 Q1 2022 59% 75% Culture and capability... Humantech Technology DART Performance 1 …are best sustained when centered on safety. Risk Reduction Reduction

® 10 50% increase in capitalization rate since 2020 Capitalizing the right work… …improves safety, customer service, quality, and cost. PROBLEM High ratio of expense versus capital repairs LEAN SOLUTION Reduce gas leak repairs while upgrading the system Permanent repairs result in fewer return visits OLD SERVICE NEW SERVICE Leak repair expense 10% 90% Other gas operations expense

® 11 LEAN SOLUTION Align training profiles with job roles and responsibilities. ■ current state ■ proposed state (post problem solving) 13% 87% Other non - productive time Training hours Forklifts Forklift Trainees 400 1,000 4,000 5,000 Productive time… …improves safety, customer service, quality, and cost. PROBLEM Large number of hours being charged to non - productive time

® 12 Changing culture and building capability… …will deliver consistent and predictable results. Culture and capability Reduced Wildfire Risk Public & Coworker Safety Resilient Energy System Expense Efficiency Excellent Customer Experiences Regulator Trust Break - through Outcomes Full Potential of EVs Efficient End - to - End Work Processes Improved Shareholder Value Clean Energy Transition Safe & Reliable Gas System

Accelerating performance 13 Mitigating Physical and Financial Risk Mitigating physical risk today Engineering risk and opportunity Jason Glickman - EVP, Engineering, Planning & Strategy Creating culture and capability Adam Wright - EVP, COO Earning trust Carla Peterman - EVP, Corporate Affairs Mitigating financial risk for customers and investors Chris Foster - EVP, CFO Mitigating physical risk today Sumeet Singh - EVP, Chief Risk Officer

® 14 Presentation Endnotes in Appendix Enhancing what we operate 1 Enhancing how we operate OPERATIONAL TECHNOLOGY INFORMATIONAL TECHNOLOGY • EPSS protection settings on 4,300+ line devices and circuit breakers • 500+ high - definition cameras and 1,300+ weather stations • 1,200+ new SCADA - enabled sectionalizing devices • 60+ fault anticipation and early fault detection devices. 2500+ line sensors Technology advancements… …enabling data - driven decisions. Leveraging Palantir Foundry for rapid data integration, analysis, and visualization

® 15 Presentation Endnotes in Appendix EPSS implementation… ...mitigating physical risk today. 80% fewer CPUC - reportable ignitions on EPSS enabled circuits 1 • 170 circuits • ~11,500 High Fire Risk Area (HFRA) miles • 45% of HFRA EPSS IN 2021 • 1,018 circuits • ~44,000 miles, including 25,500+ high fire threat district miles • 100% of HFRA EPSS IN 2022 80% fewer CPUC - reportable ignitions on EPSS enabled circuits 2 HS14

® 16 Presentation Endnotes in Appendix Wildfire risk mitigations… …are data driven and adaptive. 90%+ Wildfire Risk Reduction 1 Baseline Wildfire Risk Post - Mitigation Wildfire Risk Wildfire Mitigation Programs System Hardening (including Undergrounding) Vegetation Management Fire Ignition Component Replacement Inspections and Repairs Enhanced Powerline Safety Settings Public Safety Power Shutoff Partial Voltage Detection Low Current Fault Detection Core Resiliency programs Additional Operational Mitigations 2022 Wildfire Risk Evaluation Weather - driven Operational Mitigations 2022
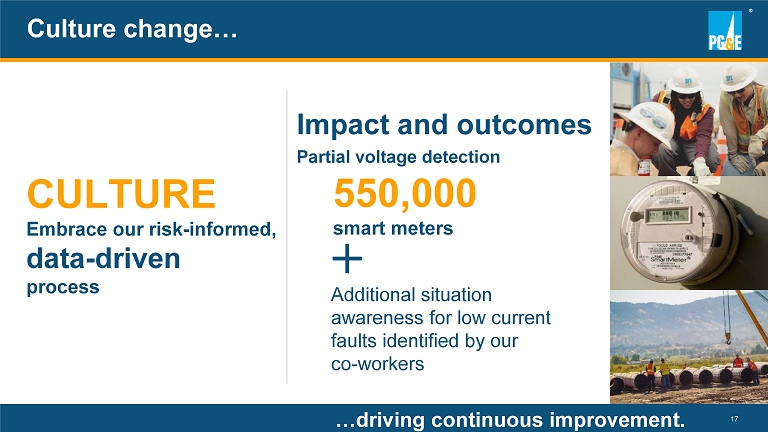
® 17 Impact and outcomes Partial voltage detection CULTURE Embrace our risk - informed, data - driven process 550,000 smart meters Additional situation awareness for low current faults identified by our co - workers Culture change… …driving continuous improvement.

Mitigating physical risk today Sumeet Singh - EVP, Chief Risk Officer Accelerating performance 18 Mitigating Physical and Financial Risk Engineering risk and opportunity Creating culture and capability Adam Wright - EVP, COO Earning trust Carla Peterman - EVP, Corporate Affairs Mitigating financial risk for customers and investors Chris Foster - EVP, CFO Engineering risk and opportunity Jason Glickman - EVP, Engineering, Planning & Strategy
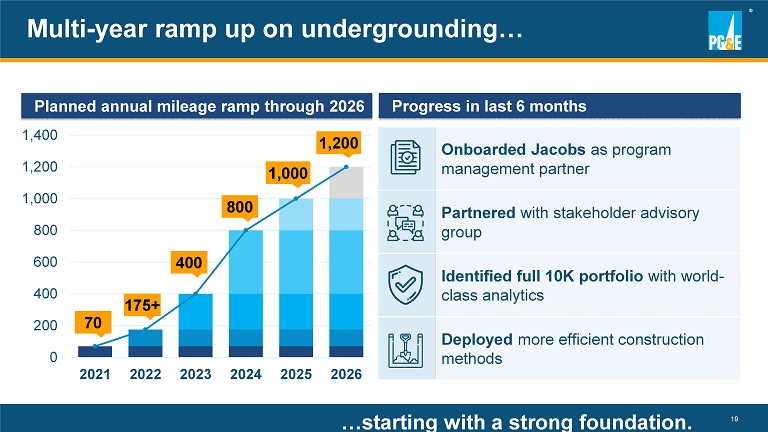
® 19 0 200 400 600 800 1,000 1,200 1,400 2021 2022 2023 2024 2025 2026 70 175+ 400 800 1,000 1,200 Progress in last 6 months Onboarded Jacobs as program management partner Partnered with stakeholder advisory group Identified full 10K portfolio with world - class analytics Deployed more efficient construction methods Planned annual mileage ramp through 2026 …starting with a strong foundation. Multi - year ramp up on undergrounding…
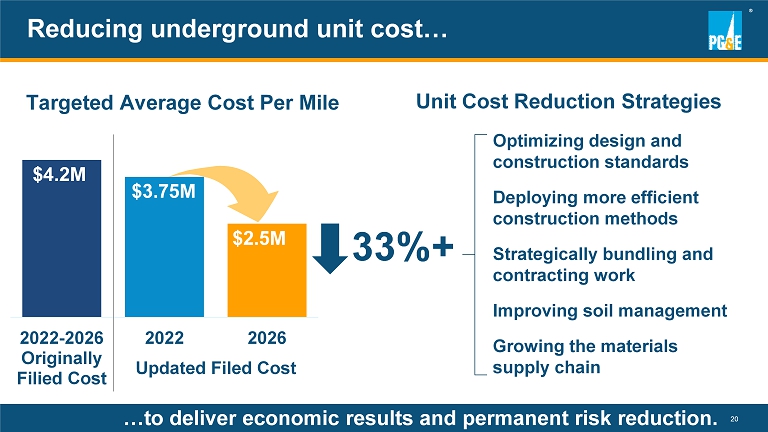
® 20 2022-2026 Originally Filied Cost 2022 2026 $3.75M $2.5M $4.2M Targeted Average Cost Per Mile Updated Filed Cost Unit Cost Reduction Strategies Optimizing design and construction standards Deploying more efficient construction methods Strategically bundling and contracting work Improving soil management Growing the materials supply chain 33%+ Reducing underground unit cost… …to deliver economic results and permanent risk reduction.

® 21 Engineering capital upgrades into the system… …for customers and investors. PG&E 2020 PG&E target 2026 Peer utilities in 2020 Undergrounding Pipeline configuration Maintenance bundling EV and DER readiness 0.90 ~1.20 1.40 ط ط ط ط Capital to Expense Ratio
Accelerating performance 22 Panel Q&A Mitigating physical risk today Sumeet Singh - EVP, Chief Risk Officer Engineering risk and opportunity Jason Glickman - EVP, Engineering, Planning & Strategy Creating culture and capability Adam Wright - EVP, COO

Engineering risk and opportunity Jason Glickman - EVP, Engineering, Planning & Strategy Mitigating physical risk today Sumeet Singh - EVP, Chief Risk Officer Accelerating performance 23 Mitigating Physical and Financial Risk Earning trust Creating culture and capability Adam Wright - EVP, COO Mitigating financial risk for customers and investors Chris Foster - EVP, CFO Earning trust Carla Peterman - EVP, Corporate Affairs

® 24 Presentation Endnotes in Appendix Exceeding California’s clean energy goals… …leading an equitable and viable transition. 2050 2040 Climate - & Nature - Positive Energy System Net Zero Energy System 2015 2030 Industry Leading Results Baseline - 50% 3 - 25% Scope 1, 2, 3, and “4” greenhouse gas (GHG) emission reductions • Enabling 3 million EVs • Achieving 6 million homes’ GHG - equivalent energy efficiency 1 2 1 & “ 4 ”

® 25 SB 884 (McGuire) • Focused on undergrounding • Opportunity to affirm state support Undergrounding… …building support for a longer - term solution. Updated GRC • Greater risk reduction • Affordable for customers UG Advisory Group • 22 organizations • Focus on partnership opportunities and local outreach LEGISLATION REGULATION COLLABORATION

® 26 Engaging with policymakers… …earning trust. PG&E does an excellent job of linking its outreach activities to CPUC and other public safety partner requirements and activities.” – Wildfire Safety Advisory Board on 2022 WMP I was not only impressed by their use of technology in monitoring threats and risks using a variety of platforms and algorithms, but I was most impressed by the people who staff this vital center.” – Marin Fire Chief on Hazard Awareness Warning Center We were impressed by this center and PG&E’s commitment to training their employees to ensure a safer future.” – Congressman Mike Thompson on PG&E Gas Safety Academy – Alice Reynolds, President, CPUC PG&E has changed. They have a new board in place, and new executive management. They are taking actions to shore up their system, to harden their infrastructure, to improve the way they do vegetation management. But we’re going to continue to watch them.” “ “ “ “

Earning trust Carla Peterman - EVP, Corporate Affairs Engineering risk and opportunity Jason Glickman - EVP, Engineering, Planning & Strategy Mitigating physical risk today Sumeet Singh - EVP, Chief Risk Officer Accelerating performance 27 Mitigating Physical and Financial Risk Mitigating financial risk for customers and investors Creating culture and capability Adam Wright - EVP, COO Mitigating financial risk for customers and investors Chris Foster - EVP, CFO

® 28 Mitigating Physical Risk Today Data Driven Wildfire Mitigation Engineering Risk and Opportunity Expense to Capital Conversion Changing Culture and Building Capability Lean Operating System Earning Trust Progress Toward Shared Goals Simple Affordable Model Mitigating physical and financial risk… …with a model serving customers AND investors.

® 29 Presentation Endnotes in Appendix Simple and affordable model… …that mitigates financial risk. MODEL 1 FUTURE Capital Investments 9% - O&M cost reduction (non - fuel) 2 2% - Electric load growth 3 1% - 3% - Other (including efficient financing) 4 2% Offsets 5% - 7% Customer Impacts: At or Below Assumed Inflation 2% - 4% ANNUAL 2022 Plan Long - Term Plan Good Business Decisions (Millions) (Millions) - Attrition $25 $25 - Contracting 150 50 - Capital Conversion 150 50 - Automation 5 25 Savings through Lean - Planning and Execution Improvements 30 130 Net Cost Increases (160) (80) Net Savings $ 200 $ 200 Percent Savings 2% 2% POSSIBLE EXAMPLES OF O&M COST REDUCTION (NON - FUEL)
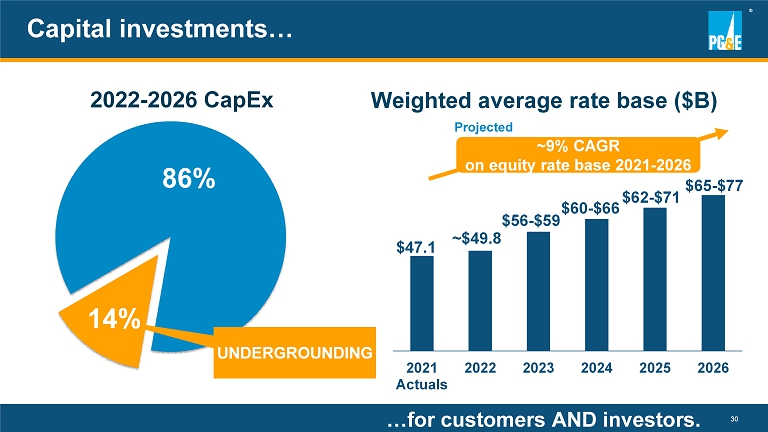
® 30 Capital investments… UNDERGROUNDING 2022 - 2026 CapEx 2021 Actuals 2022 2023 2024 2025 2026 ~9% CAGR on equity rate base 2021 - 2026 $47.1 Projected Weighted average rate base ($B) ~$49.8 $56 - $59 $60 - $66 $62 - $71 $65 - $77 …for customers AND investors. 86% 14%

® 31 Presentation Endnotes in Appendix Value proposition… …better for customers AND investors. Non - GAAP Core EPS 1 (CAGR) 2022 - 2024 2025 - 2026 10% Non - GAAP Core EPS Growth At least 10% At least 9% Dividend Eligibility reached mid - 2023 2 Annual Non - GAAP Core EPS Growth & Dividend Yield At least 10% At least 10% Rate Base Growth (CAGR) 3 9% O&M Cost Reduction (Non - Fuel) 4 2% Annually FFO/Debt 5 Mid - to - high teens by 2024

Accelerating performance 32 Panel Q&A Mitigating financial risk for customers and investors Chris Foster - EVP, CFO Earning trust Carla Peterman - EVP, Corporate Affairs
Accelerating performance 33 Mitigating Physical and Financial Risk Mitigating physical risk today Sumeet Singh - EVP, Chief Risk Officer Engineering risk and opportunity Jason Glickman - EVP, Engineering, Planning & Strategy Changing culture and building capability Adam Wright - EVP, COO Earning trust Carla Peterman - EVP, Corporate Affairs Mitigating financial risk for customers and investors Chris Foster - EVP, CFO

® 34 Delivering on our commitments... …for our customers and investors. Changing Culture Building Capability Earning Trust Delivering on our Commitments Mitigating Risk Physical and Financial
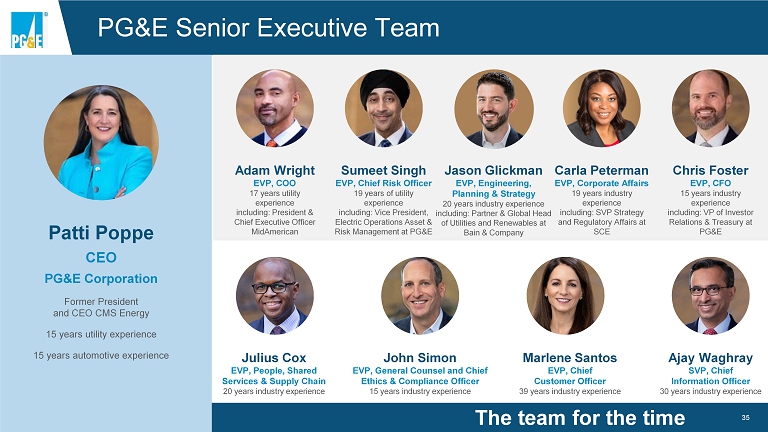
PG&E Senior Executive Team Patti Poppe CEO PG&E Corporation Former President and CEO CMS Energy 15 years utility experience 15 years automotive experience Adam Wright EVP, COO 17 years utility experience including: President & Chief Executive Officer MidAmerican Julius Cox EVP, People, Shared Services & Supply Chain 20 years industry experience Chris Foster EVP, CFO 15 years industry experience including: VP of Investor Relations & Treasury at PG&E Sumeet Singh EVP, Chief Risk Officer 19 years of utility experience including: Vice President, Electric Operations Asset & Risk Management at PG&E Jason Glickman EVP, Engineering, Planning & Strategy 20 years industry experience including: Partner & Global Head of Utilities and Renewables at Bain & Company John Simon EVP, General Counsel and Chief Ethics & Compliance Officer 15 years industry experience Marlene Santos EVP, Chief Customer Officer 39 years industry experience Carla Peterman EVP, Corporate Affairs 19 years industry experience including: SVP Strategy and Regulatory Affairs at SCE Ajay Waghray SVP, Chief Information Officer 30 years industry experience The team for the time 35

Appendix 36

® 37 Dixie Fire Recovery Sources… …reflect confidence in AB 1054 protections. Amounts may not sum due to rounding. $ 1.15 B 1 $569M $98M $339M $150M Dixie Liability Recovery Sources PG&E Insurance Policies FERC Rates WEMA Recovery 2 AB1054 Wildfire Fund $1B WF Fund Threshold $1.15B Presentation Endnotes in Appendix

® 38 AB 1054 … ...wildfire safety certificate offers protections under AB 1054. Effective risk reducing plan Approved wildfire mitigation plan Wildfire safety certificate Downside protections Improved prudency standard 1 Liquidity to pay claims Maximum liability cap for fund reimbursement 2 Presentation Endnotes in Appendix
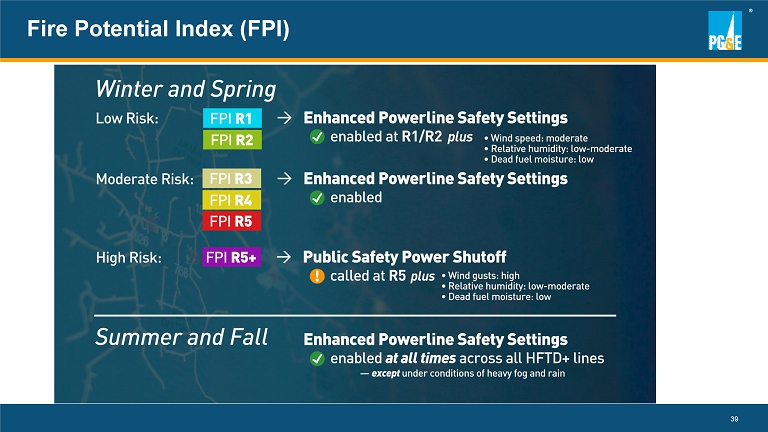
® 39 Fire Potential Index (FPI)

Endnotes Slide 8: Culture and Capability 1. Refers to the Days Away, Restricted, & Transferred Rate, which measures OSHA - recordable injuries that result in lost time or res tricted duty per 200,000 hours worked. Slide 14: Technology Advancements 1. Data is from January 1, 2019 through March 31, 2022. Slide 15: EPSS Implementation 1. Based on 2021 actuals relative to 2018 - 2020 three - year average for July 28 - October 20. 2. Based on 2022 actuals relative to 2018 - 2020 3 - year average for January 1 - June 5. Slide 16: Wildfire Risk Mitigations 1. Based on a comparison of the wildfire risk score for a baseline risk level to a risk level reflecting Pacific Gas and Electri c C ompany’s (the Utility) mitigation work. Risk scores are calculated using the scoring methodology established by the CPUC in the Safety Model Assessment Proceeding, which reflects the frequency with which variou s r isks are expected to occur and the potential safety, reliability, and financial impacts of varying degrees of wildfire severity. Slide 24: Exceeding California’s Clean Energy Goals 1. This figure is based on the Utility’s goal to achieve 48 million metric tons of lifecycle carbon emission reductions by 2030 thr ough comprehensive customer energy efficiency and decarbonization strategies. We used the U.S. EPA’s Greenhouse Gas Equivalencies Calculator to estimate that the emissions reduction total is equivalent to the ca rbo n emissions from powering 6 million homes for a single year. Slide 29: Simple and Affordable Model 1. These numbers are illustrative approximations. 2. The Utility’s cost reduction strategies include increased efficiency driven by implementing the Lean operating system, improv ing its work management, identifying additional opportunities to convert expenses to capital expenditures, and an improved organizational design. Factors that may cause the Utility’s actual results to differ materially fr om its forecasts include whether the Utility can control its operating costs within the authorized levels of spending and timely recover its costs through rates; whether the Utility can continue implementing a str eam lined organizational structure and achieve projected savings; the extent to which the Utility incurs unrecoverable costs that are higher than the forecasts of such costs; and changes in cost forecasts or the sco pe and timing of planned work resulting from changes in customer demand for electricity and natural gas or other reasons. 3. Expected drivers of forecasted electric load growth include electrification and electric vehicle adoption. 4. Factors that may cause the Utility’s actual results to differ materially from its forecasts include the ability of PG&E Corpo rat ion and the Utility to access capital markets and other sources of debt and equity financing in a timely manner on acceptable terms; their ability to raise financing through securitization transactions; actions by credit rat ing agencies to downgrade PG&E Corporation’s or the Utility’s credit ratings; the supply and price of electricity, natural gas, and nuclear fuel; the availability, cost, coverage, and terms of the Utility’s insurance; and the impact of any changes in federal or state tax laws, policies, regulations, or their interpretation, and PG&E Corporation’s and the Utility’s ability to obtain efficient tax treatment.. Slide 31: Value Proposition 1. Refers to non - GAAP core earnings per share. Non - GAAP core earnings per share is not calculated in accordance with GAAP and excl udes non - core items. See Appendix 5 of PG&E Corporation's First Quarter 2022 Earnings Presentation for the use of non - GAAP financial measures. 2. Pursuant to the Confirmation Order, PG&E Corporation agreed to not pay common dividends until it has recognized $6.2 billion in non - GAAP core earnings after the Plan effective date. Subject to the foregoing restriction, any decision to declare and pay dividends in the future will be made at the discretion of the Board of Directors an d will depend on, among other things, PG&E Corporation’s results of operations, financial condition, cash requirements, contractual restrictions, and other factors that the Board of Directors may deem relevant. 3. In accordance with AB1054, $3.21 billion of fire risk mitigation capital expenditures will be excluded from the Utility's equity rate base. 4. 2% reduction calculated based on the prior year's operating and maintenance costs, excluding fuel costs. Reductions will be rede ployed for capital projects. The Utility’s cost reduction strategies include increased efficiency driven by implementing the Lean operating system, improving its work management, identifying additional opportunities to convert expenses to capital expenditures, and an improved organizational design. Factors that may cause the Utility’s actual results to differ materially from its forecasts include whether the Utility can cont rol its operating costs within the authorized levels of spending and timely recover its costs through rates; whether the Utility can continue implementing a streamlined organizational structure and achieve projected saving s; the extent to which the Utility incurs unrecoverable costs that are higher than the forecasts of such costs; and changes in cost forecasts or the scope and timing of planned work resulting from changes in custome r demand for electricity and natural gas or other reasons. 5. As calculated according to S&P Global’s methodology. 40

Endnotes Slide 37: Dixie Fire Recovery Sources 1. The $1.15 billion estimate does not include, among other things: ( i ) any amounts for potential penalties, fines, or restitution that may be imposed by courts or other governmental entities on PG& E Corporation or the Utility, (ii) any punitive damages, (iii) any amounts in respect of compensation claims by Federal agencies, including for da mag e to land and vegetation in national parks or national forests or fire suppression costs, or by state, county and local agencies, or (iv) any other amounts that are not reasonably estimable. 2. Recovery of WEMA costs is subject to CPUC approval . Slide 38: AB1054 1. If the electrical corporation has a valid safety certificate, the electrical corporation’s conduct would be deemed reasonable un less a party to the proceeding raises serious doubt. 2. Does not apply if the Wildfire Fund administrator determines that the electrical corporation’s actions or inactions that resu lte d in the wildfire constituted conscious or willful disregard of the rights and safety of others and/or if the electrical corporation fails to maintain a valid safety certification. 41
Serious News for Serious Traders! Try StreetInsider.com Premium Free!
You May Also Be Interested In
- PG&E Corp. (PCG) Misses Q1 EPS by 1c
- Tilray Brands Celebrates Big Wins at the Craft Brewer’s Conference and 2024 World Beer Cup, the Most Prestigious Beer Competition in the World
- The Eastern Company Declares 335th Consecutive Quarterly Cash Dividend
Create E-mail Alert Related Categories
SEC FilingsSign up for StreetInsider Free!
Receive full access to all new and archived articles, unlimited portfolio tracking, e-mail alerts, custom newswires and RSS feeds - and more!
