

Form 8-K Orange County Bancorp, For: Sep 22
 Tweet
Tweet Share
Share
Exhibit 99.1

Stephens Inc. Bank Forum September 2021

Forward Looking Statements Forward - Looking Statements This presentation contains, and future oral and written statements by us and our management may contain, forward - looking statements within the meaning of Section 27A of the Securities Act of 1933 and Section 21E of the Securities Exchange Act of 1934. These forward - looking statements represent plans, estimates, objectives, goals, guidelines, expectations, intentions, projections, and statements of our beliefs concerning future events, bu siness plans, objectives, expected operating results, and the assumptions upon which those statements are based. Forward - looking statements include without limitat ion, any statement that may predict, forecast, indicate or imply future results, performance or achievements, and are typically identified with words suc h a s “may,” “could,” “should,” “will,” “would,” “believe,” “anticipate,” “estimate,” “expect,” “aim,” “intend,” “plan,” or words or phases of similar meaning. We ca uti on that the forward - looking statements are based largely on our expectations and are subject to a number of known and unknown risks and uncertainties tha t a re subject to change based on factors which are, in many instances, beyond our control. Such forward - looking statements are based on various assumptions (some of which may be beyond our control) and are subject to risks and uncertainties, which change overtime, and other factors which could cause actual result s t o differ materially from those currently anticipated. New risks and uncertainties may emerge from time to time, and it is not possible for us to predict their occurre nce or how they will affect us. If one or more of the factors affecting our forward - looking information and statements proves incorrect, then our actual results, performa nce or achievements could differ materially from those expressed in, or implied by, forward - looking information and statements contained in this presentation. Th erefore, we caution you not to place undue reliance on our forward - looking information and statements. We disclaim any duty to revise or update the forward - looking s tatements, whether written or oral, to reflect actual results or changes in the factors affecting the forward - looking statements, except as specifically required by law. Industry Information This presentation includes statistical and other industry and market data that we obtained from government reports and other thi rd - party sources. Our internal data, estimates, and forecasts are based on information obtained from government reports, trade and business organizations and othe r c ontacts in the markets in which we operate and our management’s understanding of industry conditions. Although we believe that this information (including th e i ndustry publications and third party research, surveys, and studies) is accurate and reliable, we have not independently verified such information. In addit ion , estimates, forecasts and assumptions are necessarily subject to a high degree of uncertainty and risk due to a variety of factors. Finally, forward - looking informati on obtained from these sources is subject to the same qualifications and the additional uncertainties regarding the other forward - looking statements in this presentation . Non - GAAP Financial Measures We present tangible shareholders’ equity to tangible assets and efficiency ratios to help us describe our operating performance. Our presentation of these non - GAAP measures is intended as a supplemental measure of our performance that is not required by, or presented in accordance wi th, U.S. generally accepted accounting principles (“GAAP”). These non - GAAP measures should not be considered as an alternative to performance measures deriv ed in accordance with U.S. GAAP. Our presentation of these non - GAAP measures should not be construed to imply that our future results will be unaffected by these items. See the appendix to this presentation for a reconciliation of these non - GAAP measures to the most directly comparable GAAP financial measures . June 30, 2021 Numbers contained in this presentation for the quarter ended June 30, 2021 are unaudited. As a result, subsequent information may cause a change in certain accounting estimates and other financial information, including the Company’s allowance for loan losses, fair values, and inc ome taxes. 2

NIM 3.18% ROAA 1.09% ROAE 14.95% Efficiency Ratio 60.41% TCE/TA 2 6.54% Tier 1 Leverage 3 7.56% Tier 1 Capital Ratio 3 12.13% Total Capital Ratio 3 13.38% MRQ NCOs / Average Loans 0.00% NPAs / Assets 0.12% Loan Loss Reserves / Gross Loans 1.32% YTD Profitability Regulatory Capital Asset Quality Franchise Overview 3 1) Recent approval of one new branch in Nanuet , which is scheduled to open in the next 3 months 2) See Slide 15 for non - GAAP reconciliation information 3) Bank - level regulatory data Background ▪ Bank was established in 1892 and has operated successfully for over 125 years ▪ Successfully completed IPO and NASDAQ listing on August 9, 2021 ▪ Headquartered in Middletown, NY ▪ Premier business bank in the Hudson Valley region, operating in diverse and stable markets ▪ Highly attractive core deposit franchise ▪ Full service commercial bank with focus on small to medium sized businesses ▪ Diverse, high - margin private banking and trust/wealth management service offerings Financial Snapshot as of and for the Six Months Ended June 30, 2021 Strong Banking Institution with Established Presence in Stable Markets Company Background and Financial Snapshot Geographic Presence 1 2021Q2 $2.1B TOTAL ASSETS 2021Q2 $ 1.3B TOTAL NET LOANS 2021Q2 $ 1.9B TOTAL DEPOSITS 2021Q2 $1.2B AUM Existing Branch ( 14) Headquarters Branch Opening 2021 (1) Market Footprint

Structure & Scope Balanced, Client - Driven Business Model 4 Business Banking Private Banking Orange Wealth Management • 14 branches • Focus on small to medium sized businesses in the communities served • Seasoned lenders with significant regional and industry expertise • Comprehensive product offering • Full treasury management suite Key Financials $ 1.3 billion loans $ 1.9 billion deposits • Launched in mid 2017 • Division of Orange Bank & Trust • Client - driven service linking our four primary product areas 1) Cash Management / Treasury 2) Loans (Commercial and/or Residential) 3) Trust, Estate and Custody Services 4) Investment Advisory Services (through HVIA) Approximately 360 Clients • Subsidiary of Orange County Bancorp, Inc. • Acquired in late 2012 from Sterling Bancorp • SEC registered Investment Advisor $1.2 billion AUM • Founding division of the Bank • Traditional trust & administration services to local clients • Niche focus on Special Needs Trust and Guardianship services Note: Key financials are as of June 30, 2021 Client - Driven Service Unifies Three Unique Product Areas

Franchise Scarcity Value in Highly Attractive Markets 5 Attractive Demographics in a Large, Growing Addressable Market Median Household Income ($000) 1) Defined as Lower Hudson Valley region, includes Orange, Westchester, and Rockland counties . Note: Deposit data as of June 30, 2020 Source: FDIC, S&P Global Market Intelligence $92 $103 $95 $74 $68 $0 $30 $60 $90 $120 Westchester, NY Rockland, NY State of NY U.S. Overall OBT Growth Markets Orange County Westchester & Rockland Counties Bronx County • Attractive and stable market • 60 miles from New York City • 129 - year - operating history in the region • Strong foundation for growth and low - cost deposit funding • Recent COVID - 19 related population growth • Primary OBT growth markets • Large, economically diverse and affluent markets • U nbalanced M arket : large regional/national banks, few small community banks • Reputation as leading local bank for small business • Significant long - term growth opportunity relative to current market share • Densely populated area with approximately 1.4 million residents • Diversified economy typical of most urban population centers • Persistent need for housing in the region generates constant growth through demand for construction lending and refinancing activity $22,408 $14,899 $7,419 $5,738 $5,138 $1,438 $679 $592 $421 $167 $133 $130 $123 $90 $88 JPMorgan Chase Webster Financial Citigroup Toronto-Dominion Wells Fargo Orange County Bancorp PCSB Walden Northeast Community Wallkill Valley Berkshire Bancorp Rhinebeck Bancorp Salisbury Bancorp First Federal Savings ES Bancshares Largest Locally Headquartered Bank in the Lower Hudson Valley 1 Deposits in the Market ($ in millions) 1 2 3 4 5 14 18 19 21 26 28 29 30 32 33 Rank

Business Strategy 6 Note: Financial data as of June 30, 2021 Leverage Relationships to Drive Organic Growth Derive Loan Growth Through Differentiated Service Continue to Grow Core Deposit Franchise Continue to Build Fee - Based Business Capitalize on Market Disruption Strategic Expansion • The bank’s historical success has been closely tied to that of its clients and the communities it serves • Seek trusted advisor role with clients as they build their businesses with the Bank’s resources and support • Majority of loan growth comes from existing clients and referrals • Direct access to senior management offers customers quicker response time on loan applications and other transactions • Differentiated level of service provides a pricing advantage, often resulting in higher loan rates • Core deposits comprise 95.3% of total funding, attributed to the bank’s long - standing relationships with clients • C ash management has helped the bank expand depth and efficiency of deposit product offerings • By broadening its suite of business services in 2020, deposits and loans grew 37.5% and 29.2% respectively during 2020 and 25.9% and 11.8% for the 1 st half of 2021. • Exploration of new opportunities for expansion remains a key initiative • Ongoing investments in Rockland, Westchester and Bronx Counties continue to be significant drivers of growth & profitability • L ower Hudson Valley market has experienced significant consolidation with the sales/mergers of The Westchester Bank, Sterling National Bank, Hudson Valley Bank, Hometown Bank and Greater Hudson Bank • M&A consolidation presents opportunities to hire seasoned bankers positioned to thrive under the bank’s personalized, customer - centric business model • Having recently reached $1.2 billion in combined AUM as of 2021Q2, the bank’s trust and advisory services provide a strong foundation of fee - based revenue • Company intends to expand HVIA’s services into Westchester and Rockland counties • Private Banking service enables approximately 360 clients to leverage the resources of the platform Engage in Opportunistic M&A • Strategic opportunities to produce attractive returns for stockholders may be evaluated • Opportunities could include fee - based business, whole bank or branch acquisitions that would improve market position in geographies with attractive demographics
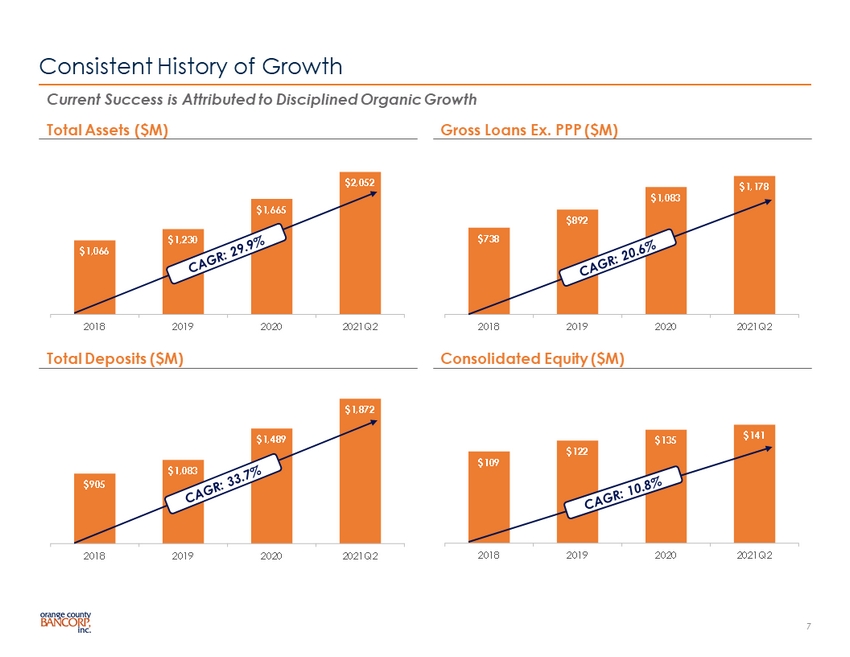
$905 $1,083 $1,489 $1,872 2018 2019 2020 2021Q2 $109 $122 $135 $141 2018 2019 2020 2021Q2 $738 $892 $1,083 $1,178 2018 2019 2020 2021Q2 $1,066 $1,230 $1,665 $2,052 2018 2019 2020 2021Q2 Consistent History of Growth 7 Current Success is Attributed to Disciplined Organic Growth Gross Loans Ex. PPP ($M) Total Assets ($M) Consolidated Equity ($M) Total Deposits ($M)

3.71 3.88 3.36 3.18 3.30 3.33 3.09 3.13 2018 2019 2020 YTD 2021 OBT Local Peers $35.9 $43.3 $48.7 $28.4 $10.0 $9.8 $11.4 $5.9 $45.9 $53.1 $60.1 $34.3 2018 2019 2020 YTD 2021 Net Interest Income Noninterest Income 0.73% 0.97% 0.76% 1.09% 8.18% 9.94% 9.02% 14.95% 2018 2019 2020 YTD 2021 ROAA ROAE $7.6 $11.5 $11.7 $10.2 2018 2019 2020 YTD 2021 Strong and Consistent Historical Profitability 8 Net Interest Margin (%) Net Income ($M) Pre - Provision Net Revenue ($M) ROAA and ROAE (%) Success Maintaining Strong Profitabilit y Metrics (YTD for the 6 months ended 6/30/2021) 1 Source: S&P Global Market Intelligence 1) Local Peers include NASDAQ, NYSE, NYSEAM, and OTC - traded U.S. banks and thrifts in the NYC MSA with total assets under $50 billion as of 2021Q2, excluding merger targets and mutuals

Loan Composition 9 1) CRE Loans as a % of Total Risked - Based Capital; Bank - level regulatory data 2) Excluding PPP loans Note : Financial data as of June 30, 2021 CRE 61% C&I 19% CRE Construction 5% Residential RE 5% Home Equity 1% Consumer 1% PPP 8% Total Loans: $ 1.3 Billion 376% CRE Concentration 1 4.50% Yield on Loans 2 Highly Diversified Portfolio with Conservative Concentrations ▪ Strong asset quality, historically managed well through cycles ▪ Majority of lending occurs within market ▪ ~$108.7M PPP loans Loan Portfolio Commentary 0.19% 0.18% 0.15% 0.12% 2018 2019 2020 2021Q2 0.05% 0.07% 0.15% 0.00% 2018 2019 2020 YTD 2021 NPAs / Assets (%) Net Charge - off (NCOs) / Average Loans (%) 4.86% 4.98% 4.72% 4.50% 2018 2019 2020 2021Q2 Historical Yield on Loans 2 Orange 35% Westchester 23% Other NY Counties 10% Rockland 9% Bronx 8% CT & Other 6% New Jersey 6% Manhattan 3% Composition by Geography

0.07% 0.17% 0.33% 0.00% 0.50% 1.00% 1.50% 2.00% 2.50% 3.00% Avg. Fed Funds Rate OBT Local Peers Leading Core Deposit Franchise Areas of Focus • Keys to Success x Dedicated Deposit Relationship managers x Investment into Treasury / Cash management product suite • Escrow x Attractable DDA capture • Municipal Deposits x Competitive products and niche focus x Focused on local opportunities x Long - term relationships 10 Cost of Total Deposits During ’15 – ’19 Rate Cycle 1 Source: S&P Global Market Intelligence, FDIC. Note: FDIC deposit data as of 6/30/2020 1) Cost of total deposits calculated using total annualized deposit interest expense and average total deposits in the given per iod 2) Deposit beta is calculated as the change in the bank’s deposit costs as a percentage of the change in the Fed Fund Rate, measured fro m 2 015Q1 to 2019Q1 3) Local Peers include NASDAQ, NYSE, NYSEAM, and OTC - traded U.S. banks and thrifts in the NYC MSA with total assets under $50 billion as of 2021Q2, excluding merger targets and mutuals Through - the - Cycle Deposit Beta 2 : OCBI: 5.4% Local Peers 3 : 24.9% 95.3% Core Deposits 34.9% Non - Interest Bearing 17bps Q2 2021 Cost of Deposits Stable and Low Cost Core Funding Base Non - time Interest Bearing 60% Noninterest Bearing 35% Retail Time 4% Jumbo Time 1% Total Deposits: $ 1.9 Billion Composition by Geography Orange 53% Westchester 38% Rockland 7% Other 2% 50.9% Transaction Accounts

Second Quarter 2021 Highlights & Below Peer Valuation 11 ▪ Significant organic growth continues ― QoQ gross loan growth ex. PPP was 27.0% (annualized) ― Deposit inflows continue ▪ Solid profitability metrics ― Annualized ROAA and ROAE of 1.05% and 14.97% ▪ Credit quality remains strong ― Net charge - offs in the quarter were 1bp (annualized) ― COVID - 19 loan deferrals were less than 1.0% ― Reserve levels of 1.45% of gross loans ex. PPP ▪ IPO completed on August 9, 2021 ― Raised gross proceeds of $38.5 million Undervalued relative to comparable banks Source: S&P Global Market Intelligence. Note: Market data as of 9/10/2021. 1) High Growth Peers include NASDAQ , NYSE , and NYSEAM traded U.S. banks and thrifts with total assets between $1 and $4 billion as of 2021Q2, with last twelve months Total Loan (ex. PPP) growth of greater than 15%, excluding merger targets and mutuals. Long - term average shown for a 5 year period.
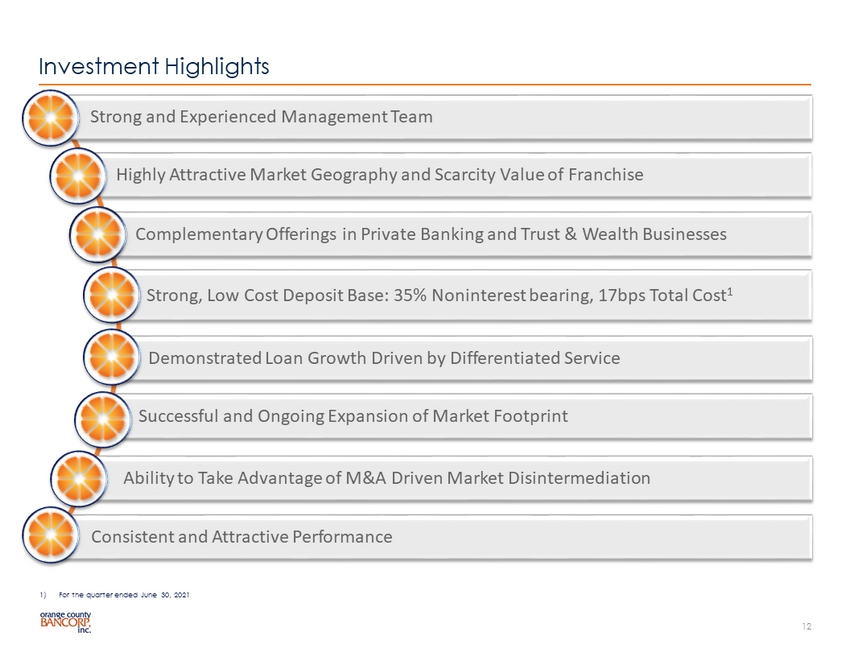
Strong, Low Cost Deposit Base: 35% Noninterest bearing, 17bps Total Cost 1 Highly Attractive Market Geography and Scarcity Value of Franchise Complementary Offerings in Private Banking and Trust & Wealth Businesses Demonstrated Loan Growth Driven by Differentiated Service Strong and Experienced Management Team Investment Highlights 12 Successful and Ongoing Expansion of Market Footprint Ability to Take Advantage of M&A Driven Market Disintermediation Consistent and Attractive Performance 1) For the quarter ended June 30, 2021

13

Executive Management Team 14 Experienced Leadership Team with Strong Ties to the Community Mr. Gilfeather has been President and Chief Executive Officer of the Company and the Bank since April 2014 and a Director sin ce 2014. He brings over 35 years of experience to his leadership position. Mr. Gilfeather also serves as a director of Hudson Valley Inve stm ent Advisors. Prior to joining Orange County Bancorp, he served as Chief Administrative Officer at Hudson Valley Bank, where he was directly respons ibl e for the branch network, training and development, human resources and the trust department. Before working with Hudson Valley Bank, M r. Gilfeather was with The Bank of New York for 20 years, where he was the Senior Manager for all retail banking in Manhattan. Mr. Gilfeat her has an MBA in Finance from Pace University and a Bachelor of Science in Psychology from Union College. Mr. Gilfeather is the Chairman of th e B oard of the Orange County Partnership and the Vice Chairman of the New York Bankers Association . Michael Gilfeather President, Chief Executive Officer and Director Mr. Peacock joined Orange County Bancorp, Inc. and the Bank as Executive Vice President and Chief Financial Officer in July 2 018 . In February 2021, Mr. Peacock was promoted to Senior Executive Vice President and Chief Financial Officer. Mr. Peacock has over 35 years of experience in the financial services industry. He previously served as Executive Vice President and Strategic Planning Officer of Spencer S avi ngs Bank, SLA and had been its Treasurer since June 2, 2016. Mr. Peacock served as Chief Financial Officer and Senior Vice President of Spencer Sa vings Bank, SLA. He has a Master of Business Administration and a BS in Finance and Statistics both from The Wharton School of the University of Pennsylvania. Robert Peacock Senior Executive VP and Chief Financial Officer Mr. Scacco serves as Chief Investment Officer and Chief Executive Officer of HVIA, since February 2015. Mr. Scacco has 30 yea rs of experience in the finance and investment industry. Mr. Scacco has a Bachelor of Business Administration in Management from Adelphi Unive rsi ty and a Master of Business Administration in Finance from Hofstra University’s Frank Zarb School of Business. Mr. Scacco previously w as a Partner at Angelo Gordon Asset Management where as a portfolio manager was part of a team that managed over $3.5 billion in assets. Prior posit ion s included co - managing Morgan Stanley’s Capital Growth Fund, and as an equity analyst and COO at Tiger Management’s Tiger Shark fund. Mr. S cacco is a member of the Economics Club of New York and the New York State Society of Certified Public Accountants. As Chief Investmen t O fficer and Chief Executive Officer of HVIA, Mr. Scacco brings knowledge of the wealth management industry and the operations of HVIA, wh ich he has managed for over six years. Gustave Scacco CEO & Chief Investment Officer HVIA Mr. Coulter joined the Bank in April 2017 as Senior Vice President and Chief Lending Officer and was promoted to Executive Vi ce President and Chief Lending Officer in February 2019. Prior to joining the Bank, Mr. Coulter served as Executive Vice President of Metropol ita n Bank in Manhattan. Prior to Metropolitan, Mr. Coulter held progressively more senior positions at BBVA Compass Bank, Sun National Ban k, Citizens and Key Bank — all in the greater New York City and Hudson Valley markets. He has over 35 years of experience in banking. Mr. Coulte r has a degree in Business Administration from the State University of New York Orange and also attended the State University of New York at Ne w Paltz. Michael Coulter EVP and Chief Lending Officer Mr. Ruhl joined the Bank in January 2015 to lead the commercial business expansion into Westchester County, and serves as Exe cut ive Vice President and Regional President for Westchester. He spent the first part of his career as a practicing attorney until joinin g H udson Valley Bank over 20 years ago as First Senior Vice President and Division Executive in charge of its Legal Services Division. Mr. Ruhl ha s a Juris Doctor from Pace University School of Law and a Bachelor’s degree from Fordham University. Mr. Ruhl currently serves as the President of the Board of the St. Philip the Apostle Foundation, a Board member of the Westchester County Bar Foundation, an Advisory Board member of the paral ega l program at Mercy College, the Secretary of the Italian American Forum, and a member of the Parks and Recreation Board of the Vil lage of Pleasantville. Mr. Ruhl is also the Co - Chair of the newly formed Program for Legal Advocacy, a strategic partnership between the Elisabeth Haub School of Law at Pace University and the courts of the Ninth Judicial District . Joseph Ruhl EVP and Regional President of Westchester County Mr. Listner has served as the Senior Vice President and Chief Credit Officer of the Bank since March 2020. He previously served as 1st Vice President and Senior Credit Officer when he was hired by the Bank in 2018. Before joining the Bank, Mr. Listner previously served as Senior Vice President, Senior Relationship Manager at Sun National Bank from 2011 to 2014 and then again from 2016 to 2018 . He was Senior Vice President, Senior Relationship Manager with BBVA from 2015 to 2016. Prior to his roles in the banking industry, Mr. Listner was an Associate Director with Standard & Poor’s, covering structured finance products and both investment grade and high yield corporates. Mr. Listner holds a Master of Business Administration with concentrations in Finance and Accounting from NYU Stern School of Business and a Bachelor or Science with dual majors in Finance and Economics from Villanova University. Michael Listner SVP & Chief Credit Officer

Dollar Values in Thousands As of the Year Ended December 31, 6 months Ended, 2018 2019 2020 6/30/2021 Total Common Equity 109,279 122,063 135,423 140,911 Goodwill 5,359 5,359 5,359 5,359 Other Intangibles 2,535 2,249 1,963 1,821 Less: Total Intangible Assets 7,894 7,608 7,322 7,180 Tangible Common Equity 101,385 114,455 128,101 133,731 Total Assets 1,064,873 1,228,430 1,664,936 2,052,232 Goodwill 5,359 5,359 5,359 5,359 Other Intangibles 2,535 2,249 1,963 1,821 Less: Total Intangible Assets 7,894 7,608 7,322 7,180 Tangible Assets 1,056,979 1,220,822 1,657,614 2,045,052 Tangible Common Equity / Tangible Assets 9.59% 9.38% 7.73% 6.54% GAAP-based Efficiency Ratio 74.65% 68.73% 66.87% 62.03% Net Interest Income 35,912 43,281 48,739 28,372 Noninterest Income 10,019 9,814 11,423 5,919 Less: Net Gains on Sale of Securities - (219) 804 - Adjusted Revenue 45,931 53,314 59,358 34,291 Total Noninterest Expense 34,286 36,491 40,231 20,716 Efficiency Ratio, Adjusted 74.65% 68.45% 67.78% 60.41% Non - GAAP Reconciliation 15
Serious News for Serious Traders! Try StreetInsider.com Premium Free!
You May Also Be Interested In
- Aristocrat Leisure Completes Acquisition of Neo Group Ltd. (f/k/a NeoGames) for $29.50 per Share
- Cerrado Gold Announces Possible Late Filing of Annual Financial Statements
- ROSEN, NATIONAL TRIAL LAWYERS, Encourages Northern Genesis Acquisition Corp. n/k/a The Lion Electric Company Investors to Secure Counsel Before Important Deadline in Securities Class Action – NGA
Create E-mail Alert Related Categories
SEC FilingsSign up for StreetInsider Free!
Receive full access to all new and archived articles, unlimited portfolio tracking, e-mail alerts, custom newswires and RSS feeds - and more!
