

Form 8-K Oaktree Specialty Lendin For: Aug 05
 Tweet
Tweet Share
Share
UNITED STATES
SECURITIES AND EXCHANGE COMMISSION
Washington, D.C. 20549
FORM 8-K
CURRENT REPORT
Pursuant to Section 13 or 15(d)
of The Securities Exchange Act of 1934
Date of Report (Date of earliest event reported): August 5, 2021
Oaktree Specialty Lending Corporation
(Exact name of registrant as specified in its charter)
| Delaware | 814-00755 | 26-1219283 | ||
| (State or other jurisdiction of incorporation) |
(Commission File Number) |
(IRS Employer Identification No.) | ||
| 333 South Grand Avenue, 28th Floor Los Angeles, CA |
90071 | |||
| (Address of principal executive offices) | (Zip Code) | |||
Registrant’s telephone number, including area code: (213) 830-6300
Not Applicable
(Former name or former address, if changed since last report)
Check the appropriate box below if the Form 8-K filing is intended to simultaneously satisfy the filing obligation of the registrant under any of the following provisions:
| ☐ | Written communications pursuant to Rule 425 under the Securities Act (17 CFR 230.425) |
| ☐ | Soliciting material pursuant to Rule 14a-12 under the Exchange Act (17 CFR 240.14a-12) |
| ☐ | Pre-commencement communications pursuant to Rule 14d-2(b) under the Exchange Act (17 CFR 240.14d-2(b)) |
| ☐ | Pre-commencement communications pursuant to Rule 13e-4(c) under the Exchange Act (17 CFR 240.13e-4(c)) |
Securities registered pursuant to Section 12(b) of the Act:
| Title of each class |
Trading |
Name of each exchange | ||
| Common stock, par value $0.01 per share | OCSL | The Nasdaq Stock Market LLC |
Indicate by check mark whether the registrant is an emerging growth company as defined in Rule 405 of the Securities Act of 1933 (17 CFR §230.405) or Rule 12b-2 of the Securities Exchange Act of 1934 (17 CFR §240.12b-2).
Emerging Growth Company ☐
If an emerging growth company, indicate by check mark if the registrant has elected not to use the extended transition period for complying with any new or revised financial accounting standards provided pursuant to Section 13(a) of the Exchange Act. ☐
Item 2.02. Results of Operations and Financial Condition.
On August 5, 2021, Oaktree Specialty Lending Corporation (the “Company”) issued a press release announcing its financial results for the fiscal quarter ended June 30, 2021. A copy of the press release is attached hereto as Exhibit 99.1.
On August 5, 2021, the Company will host a conference call to discuss its financial results for the fiscal quarter ended June 30, 2021. In connection therewith, the Company provided an investor presentation on its website at http://www.oaktreespecialtylending.com. A copy of the investor presentation is attached hereto as Exhibit 99.2.
The information disclosed under this Item 2.02, including Exhibits 99.1 and 99.2 hereto, is being “furnished” and is not deemed “filed” by the Company for purposes of Section 18 of the Securities Exchange Act of 1934, as amended (the “Exchange Act”), or otherwise subject to the liabilities of that Section, nor is it deemed incorporated by reference into any filing under the Securities Act of 1933, as amended, or the Exchange Act, except as shall be expressly set forth by specific reference in such filing.
Item 9.01. Financial Statements and Exhibits.
| (d) | Exhibits |
| 99.1 | Press release of Oaktree Specialty Lending Corporation dated August 5, 2021 | |
| 99.2 | Oaktree Specialty Lending Corporation Third Quarter 2021 Earnings Presentation | |
SIGNATURE
Pursuant to the requirements of the Exchange Act, the registrant has duly caused this report to be signed on its behalf by the undersigned hereunto duly authorized.
| OAKTREE SPECIALTY LENDING CORPORATION | ||||||||
| Date: August 5, 2021 | By: | /s/ Mel Carlisle | ||||||
| Name: | Mel Carlisle | |||||||
| Title: | Chief Financial Officer and Treasurer | |||||||
Exhibit 99.1

Oaktree Specialty Lending Corporation Announces Third Fiscal Quarter 2021 Financial Results and Declares Increased Distribution of $0.145 Per Share
LOS ANGELES, CA, August 5, 2021 - Oaktree Specialty Lending Corporation (NASDAQ: OCSL) (“Oaktree Specialty Lending” or the “Company”), a specialty finance company, today announced its financial results for the fiscal quarter ended June 30, 2021.
Financial Highlights for the Quarter Ended June 30, 2021
| • | Total investment income was $65.4 million ($0.36 per share) for the third fiscal quarter of 2021, up from $41.9 million ($0.29 per share) for the second fiscal quarter of 2021. The increase was primarily driven by the first full quarter of interest income earned on the assets acquired in the merger with Oaktree Strategic Income Corporation (“OCSI”) (the “Merger”), original issue discount (“OID”) accretion that resulted from Merger-related accounting adjustments and higher OID acceleration and prepayment fees resulting from exits of investments. Excluding the Merger-related income accretion, adjusted total investment income was $60.4 million ($0.33 per share). |
| • | GAAP net investment income was $35.9 million ($0.20 per share) for the third fiscal quarter of 2021, as compared with $18.1 million ($0.12 per share) for the second fiscal quarter of 2021. The increase was primarily driven by higher total investment income and lower accrued Part II incentive fees, offset by higher interest expense and higher base management fees (net of waivers) as a result of additional outstanding borrowings and a larger investment portfolio, respectively, following the Merger. |
| • | Adjusted net investment income was $33.7 million ($0.19 per share) for the third fiscal quarter of 2021, as compared with $21.1 million ($0.14 per share) for the second fiscal quarter of 2021. The increase was primarily driven by higher adjusted total investment income, offset by higher interest expense and higher base management fees (net of waivers) as a result of additional outstanding borrowings and a larger investment portfolio, respectively, following the Merger. |
| • | Net asset value (“NAV”) per share was $7.22 as of June 30, 2021, up 1.8% from $7.09 as of March 31, 2021. The increase was primarily driven by realized and unrealized gains on certain debt and equity investments during the quarter and adjusted net investment income earned in excess of the June distribution to stockholders. |
| • | Originated $178.4 million of new investment commitments and received $170.6 million of proceeds from prepayments, exits, other paydowns and sales during the quarter ended June 30, 2021. Of these new investment commitments, 79% were first lien loans, 14% were second lien loans and 7% were subordinated debt investments. The weighted average yield on new debt investments was 9.2%. |
| • | No investments were on non-accrual status as of June 30, 2021. |
| • | Total debt outstanding was $1,114.1 million as of June 30, 2021. The total debt to equity ratio was 0.86x, and the net debt to equity ratio was 0.79x, after adjusting for cash and cash equivalents. |
| • | The Company issued $350 million of unsecured notes during the quarter ended June 30, 2021 that mature on January 15, 2027 and bear interest at a rate of 2.7%. In connection with the issuance of the 2027 Notes, the Company entered into an interest rate swap agreement under which the Company receives a fixed interest rate of 2.7% and pays a floating rate of the three-month LIBOR plus 1.658% on a notional amount of $350 million. |
| • | Liquidity as of June 30, 2021 was composed of $84.7 million of unrestricted cash and cash equivalents and $635.9 million of undrawn capacity under the credit facilities (subject to borrowing base and other limitations). Unfunded investment commitments were $288.0 million, or $239.0 million excluding unfunded commitments to the Company’s joint ventures. Of the $239.0 million, approximately $166.2 million can be drawn immediately as the remaining amount is subject to certain milestones that must be met by portfolio companies. |
1
| • | A quarterly cash distribution was declared of $0.145 per share, up 11.5% from the prior quarter and the fifth consecutive quarterly distribution increase. The distribution will be paid in cash and is payable on September 30, 2021 to stockholders of record on September 15, 2021. |
Armen Panossian, Chief Executive Officer and Chief Investment Officer, said, “The third quarter was highlighted by strong earnings and continued robust portfolio performance. Adjusted net investment income was $0.19 per share, up 58% from the same quarter a year earlier. This reflected new origination activity at attractive yields over the prior year and the successful exit of one of our opportunistic investments made in the wake of the pandemic. NAV grew again this quarter to $7.22 per share, a 1.8% increase from March 31, 2021, as the portfolio continues to perform well and our credit quality remains excellent.”
Mathew Pendo, President and Chief Operating Officer, said, “We made several improvements to our capital structure during the quarter, creating flexibility and reducing overall borrowing costs. Importantly, we increased the size of our syndicated credit facility to $950 million from $800 million and extended its maturity by two years. We also retired a higher cost credit facility acquired from OCSI, and we issued $350 million of unsecured notes. These and other changes further bolstered our funding versatility and positioned us well for new investment opportunities.
“Additionally, based on our strong and consistent earnings, our Board increased the quarterly dividend by 12% to $0.145 per share, the fifth consecutive quarterly increase. At this level, the dividend is 38% higher than a year earlier and demonstrates OCSL’s improved performance.”
Chief Financial Officer and Treasurer Transition
On August 4, 2021, Mel Carlisle announced his resignation as Chief Financial Officer and Treasurer of the Company, effective November 30, 2021, to assume another senior management role within Oaktree. Subject to approval by the Company’s Board of Directors, the Company expects to appoint Christopher McKown, Managing Director of Oaktree and the Company’s Assistant Treasurer, to succeed Mr. Carlisle as Chief Financial Officer and Treasurer of the Company.
Mr. Carlisle will continue to serve in his current role during the transition period to help ensure a smooth transition of responsibilities.
Armen Panossian, Chief Executive Officer and Chief Investment Officer, said, “We are tremendously grateful to Mel for all of his contributions to the Company over the last four years. He has built a first-rate accounting and financial reporting team and played an integral part in our growth as a firm. We wish him the very best as he moves onto his new role at Oaktree.”
Mr. McKown is responsible for fund accounting and reporting for Oaktree’s Strategic Credit strategy. Prior to joining Oaktree in 2011, Mr. McKown spent nearly eight years at KPMG LLP, most recently as an audit senior manager in the Investment Management practice. Mr. McKown received a B.A. degree in business economics with a minor in accounting cum laude from the University of California, Los Angeles and is a Certified Public Accountant (inactive).
Mr. Panossian continued, “In his ten years with Oaktree, Chris has demonstrated strong leadership abilities and financial acumen. He has worked closely with Mel to successfully build out our BDC finance organization and integrate the Company onto the Oaktree platform nearly four years ago.”
Distribution Declaration
The Board of Directors declared a quarterly distribution of $0.145 per share, an increase of 11.5%, or $0.015 per share, from the prior quarter and the fifth consecutive quarterly distribution increase, payable on September 30, 2021 to stockholders of record on September 15, 2021.
Distributions are paid primarily from distributable (taxable) income. To the extent taxable earnings for a fiscal taxable year fall below the total amount of distributions for that fiscal year, a portion of those distributions may be deemed a return of capital to the Company’s stockholders.
2
Results of Operations
|
|
|
|||||||||||
| For the three months ended | ||||||||||||
| ($ in thousands, except per share data) | June 30, 2021 (unaudited) |
March 31, 2021 (unaudited) |
June 30, 2020 (unaudited) |
|||||||||
| GAAP operating results: |
||||||||||||
| Interest income |
$ | 51,999 | $ | 35,655 | $ | 30,112 | ||||||
| PIK interest income |
4,597 | 3,801 | 2,183 | |||||||||
| Fee income |
7,823 | 2,278 | 1,827 | |||||||||
| Dividend income |
1,019 | 209 | 281 | |||||||||
|
|
|
|
|
|
|
|||||||
| Total investment income |
65,438 | 41,943 | 34,403 | |||||||||
| Net expenses |
29,148 | 23,829 | 17,633 | |||||||||
|
|
|
|
|
|
|
|||||||
| Net investment income before taxes |
36,290 | 18,114 | 16,770 | |||||||||
| (Provision) benefit for taxes on net investment income |
(358 | ) | — | — | ||||||||
|
|
|
|
|
|
|
|||||||
| Net investment income |
35,932 | 18,114 | 16,770 | |||||||||
| Net realized and unrealized gains (losses), net of taxes |
11,106 | 70,003 | 103,461 | |||||||||
|
|
|
|
|
|
|
|||||||
| Net increase (decrease) in net assets resulting from operations |
$ | 47,038 | $ | 88,117 | $ | 120,231 | ||||||
|
|
|
|
|
|
|
|||||||
| Total investment income per common share |
$ | 0.36 | $ | 0.29 | $ | 0.24 | ||||||
| Net investment income per common share |
$ | 0.20 | $ | 0.12 | $ | 0.12 | ||||||
| Net realized and unrealized gains (losses), net of taxes per common share |
$ | 0.06 | $ | 0.48 | $ | 0.73 | ||||||
| Earnings (loss) per common share — basic and diluted |
$ | 0.26 | $ | 0.60 | $ | 0.85 | ||||||
| Non-GAAP Financial Measures1: |
||||||||||||
| Adjusted total investment income |
$ | 60,378 | $ | 41,278 | $ | 34,403 | ||||||
| Adjusted net investment income |
$ | 33,709 | $ | 21,058 | $ | 16,770 | ||||||
| Adjusted net realized and unrealized gains (losses), net of taxes |
$ | 16,151 | $ | 36,607 | $ | 103,461 | ||||||
| Adjusted earnings (loss) |
$ | 47,023 | $ | 54,056 | $ | 120,231 | ||||||
| Adjusted total investment income per share |
$ | 0.33 | $ | 0.28 | $ | 0.24 | ||||||
| Adjusted net investment income per share |
$ | 0.19 | $ | 0.14 | $ | 0.12 | ||||||
| Adjusted net realized and unrealized gains (losses), net of taxes per share |
$ | 0.09 | $ | 0.25 | $ | 0.73 | ||||||
| Adjusted earnings (loss) per share |
$ | 0.26 | $ | 0.37 | $ | 0.85 | ||||||
| 1 | See Non-GAAP Financial Measures below for a description of the non-GAAP measures and the reconciliations from the most comparable GAAP financial measures to the Company’s non-GAAP measures, including on a per share basis. The Company’s management uses these non-GAAP financial measures internally to analyze and evaluate financial results and performance and believes that these non-GAAP financial measures are useful to investors as an additional tool to evaluate ongoing results and trends for the Company and to review the Company’s performance without giving effect to non-cash income/gain resulting from the Merger and in the case of adjusted net investment income, without giving effect to capital gains incentive fees. The presentation of non-GAAP measures are not intended to be a substitute for financial results prepared in accordance with GAAP and should not be considered in isolation. |
|
|
|
|||||||||||
| As of | ||||||||||||
| ($ in thousands, except per share data and ratios) | June 30, 2021 (unaudited) |
March 31, 2021 (unaudited) |
September 30, 2020 | |||||||||
| Select balance sheet and other data: |
||||||||||||
| Cash and cash equivalents |
$ | 84,689 | $ | 39,872 | $ | 39,096 | ||||||
| Investment portfolio at fair value |
2,339,301 | 2,327,353 | 1,573,851 | |||||||||
| Total debt outstanding (net of unamortized financing costs) |
1,104,099 | 1,109,897 | 709,315 | |||||||||
| Net assets |
1,302,414 | 1,278,823 | 914,879 | |||||||||
| Net asset value per share |
7.22 | 7.09 | 6.49 | |||||||||
| Total debt to equity ratio |
0.86 | x | 0.87 | x | 0.78 | x | ||||||
| Net debt to equity ratio |
0.79 | x | 0.84 | x | 0.74 | x | ||||||
Adjusted total investment income for the quarter ended June 30, 2021 was $60.4 million and included $46.9 million of interest income from portfolio investments, $4.6 million of payment-in-kind (“PIK”) interest income, $7.8 million of fee income and $1.0 million of dividend income. The increase of $19.1 million from the prior quarter was primarily driven by the first full quarter of interest income earned on the assets acquired from the Merger and higher OID acceleration and prepayment fees resulting from exits of investments.
Net expenses for the quarter totaled $29.1 million, up $5.3 million from the quarter ended March 31, 2021. The increase in net expenses was primarily driven by $2.5 million of higher accrued Part I incentive fees as a result of higher adjusted total investment income, $2.3 million of higher interest expense and $1.2 million of higher base management fees (net of waivers) as a result of additional outstanding borrowings and a larger investment portfolio, respectively, following the Merger, partially offset by $0.8 million of lower accrued Part II incentive fees.
3
Adjusted net investment income was $33.7 million ($0.19 per share) for the quarter ended June 30, 2021, up from $21.1 million ($0.14 per share) for the quarter ended March 31, 2021, primarily driven by $19.1 million of higher adjusted total investment income, partially offset by $6.0 million of higher net expenses (excluding Part II incentive fees) and $0.4 million of income tax expense.
Adjusted net realized and unrealized gains, net of taxes, were $16.2 million for the quarter and were primarily driven by gains on certain debt and equity investments.
Portfolio and Investment Activity
|
|
|
|||||||||||
| As of | ||||||||||||
| ($ in thousands) | June 30, 2021 (unaudited) |
March 31, 2021 (unaudited) |
June 30, 2020 (unaudited) |
|||||||||
| Investments at fair value |
$ | 2,339,301 | $ | 2,327,353 | $ | 1,561,153 | ||||||
| Number of portfolio companies |
135 | 137 | 119 | |||||||||
| Average portfolio company debt size |
$ | 17,600 | $ | 17,600 | $ | 14,600 | ||||||
| Asset class: |
||||||||||||
| Senior secured debt |
86.7 | % | 86.5 | % | 80.9 | % | ||||||
| Unsecured debt |
1.4 | % | 1.1 | % | 7.2 | % | ||||||
| Equity |
3.9 | % | 4.4 | % | 4.7 | % | ||||||
| JV interests |
8.1 | % | 8.0 | % | 7.0 | % | ||||||
| Limited partnership interests |
— | % | — | % | 0.2 | % | ||||||
| Non-accrual debt investments: |
||||||||||||
| Non-accrual investments at fair value |
$ | — | $ | — | $ | 2,497 | ||||||
| Non-accrual investments as a percentage of debt investments |
— | % | — | % | 0.2 | % | ||||||
| Number of investments on non-accrual |
— | — | 3 | |||||||||
| Interest rate type: |
||||||||||||
| Percentage floating-rate |
91.4 | % | 91.8 | % | 86.2 | % | ||||||
| Percentage fixed-rate |
8.6 | % | 8.2 | % | 13.8 | % | ||||||
| Yields: |
||||||||||||
| Weighted average yield on debt investments1 |
8.4 | % | 8.3 | % | 8.1 | % | ||||||
| Cash component of weighted average yield on debt investments |
7.1 | % | 7.1 | % | 6.9 | % | ||||||
| Weighted average yield on total portfolio investments2 |
8.0 | % | 7.8 | % | 7.6 | % | ||||||
| Investment activity3: |
||||||||||||
| New investment commitments |
$ | 178,400 | $ | 317,700 | $ | 260,500 | ||||||
| New funded investment activity4 |
$ | 165,300 | $ | 301,800 | $ | 198,500 | ||||||
| Proceeds from prepayments, exits, other paydowns and sales |
$ | 170,600 | $ | 228,900 | $ | 127,800 | ||||||
| Net new investments5 |
$ | (5,300 | ) | $ | 72,900 | $ | 70,700 | |||||
| Number of new investment commitments in new portfolio companies |
9 | 18 | 10 | |||||||||
| Number of new investment commitments in existing portfolio companies |
1 | 2 | 8 | |||||||||
| Number of portfolio company exits |
11 | 12 | 19 | |||||||||
| 1 | Annual stated yield earned plus net annual amortization of OID or premium earned on accruing investments, including the Company’s share of the return on debt investments in the SLF JV I and Glick JV, and excluding any amortization or accretion of interest income resulting solely from the cost basis established by ASC 805 (see Non-GAAP Financial Measures below) for the assets acquired in connection with the Merger. |
| 2 | Annual stated yield earned plus net annual amortization of OID or premium earned on accruing investments and dividend income, including the Company’s share of the return on debt investments in the SLF JV I and Glick JV, and excluding any amortization or accretion of interest income resulting solely from the cost basis established by ASC 805 for the assets acquired in connection with the Merger. |
| 3 | Excludes the assets acquired as part of the Merger. |
| 4 | New funded investment activity includes drawdowns on existing revolver and delayed draw term loan commitments. |
| 5 | Net new investments consists of new funded investment activity less proceeds from prepayments, exits, other paydowns and sales. |
4
As of June 30, 2021, the fair value of the investment portfolio was $2.3 billion and was composed of investments in 135 companies. These included debt investments in 117 companies, equity investments in 33 companies, including limited partnership interests in one private equity fund, and the Company’s joint venture investments in Senior Loan Fund JV I, LLC (“SLF JV I”) and OCSI Glick JV LLC (“Glick JV”). 17 of the equity investments were in companies in which the Company also had a debt investment.
As of June 30, 2021, 94.5% of the Company’s portfolio at fair value consisted of debt investments, including 67.6% of first lien loans, 19.1% of second lien loans and 7.9% of unsecured debt investments, including the debt investments in SLF JV I and Glick JV. This compared to 68.3% of first lien loans, 18.2% of second lien loans and 7.6% of unsecured debt investments, including the debt investments in SLF JV I and Glick JV, at fair value as of March 31, 2021.
As of June 30, 2021, there were no investments on non-accrual status.
The Company’s investments in SLF JV I totaled $132.9 million at fair value as of June 30, 2021, up 2% from $130.4 million as of March 31, 2021. The increase in the value of the Company’s investments in SLF JV I was primarily driven by unrealized appreciation of certain liquid debt investments in the underlying investment portfolio and undistributed net investment income.
As of June 30, 2021, SLF JV I had $386.5 million in assets, including senior secured loans to 57 portfolio companies. This compared to $352.4 million in assets, including senior secured loans to 55 portfolio companies, as of March 31, 2021. As of June 30, 2021, there were no investments held by SLF JV I on non-accrual status. SLF JV I generated interest income of $1.9 million for the Company during the quarter ended June 30, 2021, up $0.2 million from $1.7 million in the prior quarter. In addition, SLF JV I generated dividend income of $0.5 million for the Company during the quarter ended June 30, 2021. As of June 30, 2021, SLF JV I had $50.4 million of undrawn capacity (subject to borrowing base and other limitations) on its $260 million senior revolving credit facility, and its debt to equity ratio was 1.4x.
The Company’s investments in Glick JV totaled $55.4 million at fair value as of June 30, 2021, up 1% from $54.6 million as of March 31, 2021. The increase in the value of the Company’s investments in Glick JV was primarily driven by unrealized appreciation of certain liquid debt investments in the underlying investment portfolio.
As of June 30, 2021, Glick JV had $148.1 million in assets, including senior secured loans to 38 portfolio companies. This compared to $137.3 million in assets, including senior secured loans to 36 portfolio companies, as of March 31, 2021. As of June 30, 2021, there were no investments held by Glick JV on non-accrual status. Glick JV generated cash interest income of $0.7 million during the quarter ended June 30, 2021, which was the first full quarter since the Company acquired the Glick JV in connection with the Merger. As of June 30, 2021, Glick JV had $18.1 million of undrawn capacity (subject to borrowing base and other limitations) on its $90 million senior revolving credit facility, and its debt to equity ratio was 1.1x.
Liquidity and Capital Resources
On May 4, 2021, the Company amended its syndicated credit facility to, among other things, (1) increase the size of the facility to $950 million (and increase the “accordion” feature to permit the Company, under certain circumstances, to increase the size of the facility to up to the greater of $1.25 billion and the Company’s net worth, as defined in the facility), (2) extend the period during which the Company may make drawings to May 4, 2025, (3) extend the final maturity date to May 4, 2026 and (4) provide that the interest rate for margin for LIBOR loans is 2.00% and the margin for alternate base rate loans is 1.00%, in each case regardless of the Company’s senior debt coverage ratio.
On May 4, 2021, the Company repaid all outstanding borrowings under its Deutsche Bank facility using borrowings under its syndicated credit facility, following which the Deutsche Bank facility was terminated.
On May 18, 2021, the Company issued $350.0 million in aggregate principal amount of the 2027 Notes for net proceeds of $344.8 million after deducting OID of $1.0 million, underwriting commissions and discounts of $3.5 million and offering costs of $0.7 million. Interest on the 2027 Notes is paid semi-annually on January 15 and July 15, beginning on January 15, 2022, at a rate of 2.7% per annum. In connection with the issuance of the 2027 Notes, the Company entered into an interest rate swap agreement under which the Company receives a fixed interest rate of 2.7% and pays a floating rate of the three-month LIBOR plus 1.658% on a notional amount of $350 million.
5
As of June 30, 2021, the Company had total principal value of debt outstanding of $1,114.1 million, including $464.1 million of outstanding borrowings under its revolving credit facilities, $300.0 million of the 3.500% Notes due 2025 and $350.0 million of the 2.700% Notes due 2027. The funding mix was composed of 42% secured and 58% unsecured borrowings as of June 30, 2021. The Company was in compliance with all financial covenants under its credit facilities as of June 30, 2021.
As of June 30, 2021, the Company had $84.7 million of unrestricted cash and cash equivalents and $635.9 million of undrawn capacity on its credit facilities (subject to borrowing base and other limitations). As of June 30, 2021, unfunded investment commitments were $288.0 million, or $239.0 million excluding unfunded commitments to the Company’s joint ventures. Of the $239.0 million, approximately $166.2 million could be drawn immediately as the remaining amount is subject to certain milestones that must be met by portfolio companies. The Company has analyzed cash and cash equivalents, availability under its credit facilities, the ability to rotate out of certain assets and amounts of unfunded commitments that could be drawn and believe its liquidity and capital resources are sufficient to take advantage of market opportunities in the current economic climate.
As of June 30, 2021, the weighted average interest rate on debt outstanding, including the effect of the interest rate swap agreement, was 2.4%, as compared with 2.6% as of March 31, 2021.
The Company’s total debt to equity ratio was 0.86x and 0.87x as of June 30, 2021 and March 31, 2021, respectively. The Company’s net debt to equity ratio was 0.79x and 0.84x as of June 30, 2021 and March 31, 2021, respectively.
Recent Developments
On July 2, 2021, the Company amended its credit facility with Citibank to, among other things, (1) reduce the size of the facility from $180 million to $150 million, (2) extend the reinvestment period to July 18, 2023, (3) extend the maturity date to July 18, 2024, (4) modify the interest rate on outstanding borrowings to LIBOR plus between 1.25% and 2.20% per annum on broadly syndicated loans subject to the observable market depth and pricing and LIBOR plus 2.25% per annum on all other eligible loans during the reinvestment period and (5) added provisions relating to the transition from LIBOR to the Secured Overnight Financing Rate.
Non-GAAP Financial Measures
On a supplemental basis, the Company is disclosing certain adjusted financial measures, each of which is calculated and presented on a basis of methodology other than in accordance with GAAP (“non-GAAP”). The Company’s management uses these non-GAAP financial measures internally to analyze and evaluate financial results and performance and believes that these non-GAAP financial measures are useful to investors as an additional tool to evaluate ongoing results and trends for the Company and to review the Company’s performance without giving effect to non-cash income/gain resulting from the Merger and in the case of adjusted net investment income, without giving effect to capital gains incentive fees. The presentation of the below non-GAAP measures is not intended to be a substitute for financial results prepared in accordance with GAAP and should not be considered in isolation.
| • | “Adjusted Total Investment Income” and “Adjusted Total Investment Income Per Share” – represents total investment income excluding any amortization or accretion of interest income resulting solely from the cost basis established by ASC 805 (see below) for the assets acquired in connection with the Merger. |
| • | “Adjusted Net Investment Income” and “Adjusted Net Investment Income Per Share” – represents net investment income, excluding (i) any amortization or accretion of interest income resulting solely from the cost basis established by ASC 805 (see below) for the assets acquired in connection with the Merger and (ii) capital gains incentive fees (“Part II incentive fees”). |
6
| • | “Adjusted Net Realized and Unrealized Gains (Losses), Net of Taxes” and “Adjusted Net Realized and Unrealized Gains (Losses), Net of Taxes Per Share” – represents net realized and unrealized gains (losses) net of taxes excluding any net realized and unrealized gains (losses) resulting solely from the cost basis established by ASC 805 (see below) for the assets acquired in connection with the Merger. |
| • | “Adjusted Earnings (Loss)” and “Adjusted Earnings (Loss) Per Share” – represents the sum of (i) Adjusted Net Investment Income and (ii) Adjusted Net Realized and Unrealized Gains (Losses), Net of Taxes and includes the impact of Part II incentive fees1, if any. |
On March 19, 2021, the Company completed the Merger. The Merger was accounted for as an asset acquisition in accordance with the asset acquisition method of accounting as detailed in ASC 805-50, Business Combinations—Related Issues (“ASC 805”). The consideration paid to OCSI’s stockholders was allocated to the individual assets acquired and liabilities assumed based on the relative fair values of the net identifiable assets acquired other than “non-qualifying” assets, which established a new cost basis for the acquired OCSI investments under ASC 805 that, in aggregate, was significantly lower than the historical cost basis of the acquired OCSI investments prior to the Merger. Additionally, immediately following the completion of the Merger, the acquired OCSI investments were marked to their respective fair values under ASC 820, Fair Value Measurements, which resulted in unrealized appreciation. The new cost basis established by ASC 805 on debt investments acquired will accrete over the life of each respective debt investment through interest income, with a corresponding adjustment recorded to unrealized appreciation on such investment acquired through its ultimate disposition. The new cost basis established by ASC 805 on equity investments acquired will not accrete over the life of such investments through interest income and, assuming no subsequent change to the fair value of the equity investments acquired and disposition of such equity investments at fair value, the Company will recognize a realized gain with a corresponding reversal of the unrealized appreciation on disposition of such equity investments acquired.
The Company’s management uses the non-GAAP financial measures described above internally to analyze and evaluate financial results and performance and to compare its financial results with those of other business development companies that have not adjusted the cost basis of certain investments pursuant to ASC 805. The Company’s management believes “Adjusted Total Investment Income”, “Adjusted Total Investment Income Per Share”, “Adjusted Net Investment Income” and “Adjusted Net Investment Income Per Share” are useful to investors as an additional tool to evaluate ongoing results and trends for the Company without giving effect to the accretion income resulting from the new cost basis of the OCSI investments acquired in the Merger because these amounts do not impact the fees payable to Oaktree Fund Advisors, LLC (the “Adviser”) under its amended and restated advisory agreement (the “A&R Advisory Agreement”), and specifically as its relates to “Adjusted Net Investment Income” and “Adjusted Net Investment Income Per Share”, without giving effect to Part II incentive fees. In addition, the Company’s management believes that “Adjusted Net Realized and Unrealized Gains (Losses), Net of Taxes”, “Adjusted Net Realized and Unrealized Gains (Losses), Net of Taxes Per Share”, “Adjusted Earnings (Loss)” and “Adjusted Earnings (Loss) Per Share” are useful to investors as they exclude the non-cash income/gain resulting from the Merger and are used by management to evaluate the economic earnings of its investment portfolio. Moreover, these metrics align the Company’s key financial measures with the calculation of incentive fees payable to the Adviser under with the A&R Advisory Agreement (i.e., excluding amounts resulting solely from the lower cost basis of the acquired OCSI investments established by ASC 805 that would have been to the benefit of the Adviser absent such exclusion).
| 1 | Adjusted earnings (loss) includes accrued Part II incentive fees. For the three months ended June 30, 2021, $2.8 million of accrued Part II incentive fees were expensed. As of June 30, 2021, the total accrued Part II incentive fee liability was $16.0 million. Part II incentive fees are contractually calculated and paid at the end of the fiscal year in accordance with the A&R Advisory Agreement, which differs from Part II incentive fees accrued under GAAP. Hypothetically, if Part II incentive fees were calculated as of June 30, 2021 under the A&R Advisory Agreement, the amount payable would have been $7.2 million. |
7
The following table provides a reconciliation of total investment income (the most comparable U.S. GAAP measure) to adjusted total investment income for the periods presented:
| For the three months ended | ||||||||||||||||||||||||
| June 30, 2021 (unaudited) |
March 31, 2021 (unaudited) |
June 30, 2020 (unaudited) |
||||||||||||||||||||||
| ($ in thousands, except per share data) | Amount | Per Share |
Amount | Per Share |
Amount | Per Share |
||||||||||||||||||
| GAAP total investment income |
$ | 65,438 | $ | 0.36 | $ | 41,943 | $ | 0.29 | $ | 34,403 | $ | 0.24 | ||||||||||||
| Less: Interest income accretion related to merger accounting adjustments |
(5,060 | ) | (0.03 | ) | (665 | ) | — | — | — | |||||||||||||||
|
|
|
|
|
|
|
|
|
|
|
|
|
|||||||||||||
| Adjusted total investment income |
$ | 60,378 | $ | 0.33 | $ | 41,278 | $ | 0.28 | $ | 34,403 | $ | 0.24 | ||||||||||||
|
|
|
|
|
|
|
|
|
|
|
|
|
|||||||||||||
The following table provides a reconciliation of net investment income (the most comparable U.S. GAAP measure) to adjusted net investment income for the periods presented:
| For the three months ended | ||||||||||||||||||||||||
| June 30, 2021 (unaudited) |
March 31, 2021 (unaudited) |
June 30, 2020 (unaudited) |
||||||||||||||||||||||
| ($ in thousands, except per share data) | Amount | Per Share |
Amount | Per Share |
Amount | Per Share |
||||||||||||||||||
| GAAP net investment income |
$ | 35,932 | $ | 0.20 | $ | 18,114 | $ | 0.12 | $ | 16,770 | $ | 0.12 | ||||||||||||
| Less: Interest income accretion related to merger accounting adjustments |
(5,060 | ) | (0.03 | ) | (665 | ) | — | — | — | |||||||||||||||
| Add: Part II incentive fee |
2,837 | 0.02 | 3,609 | 0.02 | — | — | ||||||||||||||||||
|
|
|
|
|
|
|
|
|
|
|
|
|
|||||||||||||
| Adjusted net investment income |
$ | 33,709 | $ | 0.19 | $ | 21,058 | $ | 0.14 | 16,770 | $ | 0.12 | |||||||||||||
|
|
|
|
|
|
|
|
|
|
|
|
|
|||||||||||||
The following table provides a reconciliation of net realized and unrealized gains (losses), net of taxes (the most comparable U.S. GAAP measure) to adjusted net realized and unrealized gains (losses), net of taxes for the periods presented:
| For the three months ended | ||||||||||||||||||||||||
| June 30, 2021 (unaudited) |
March 31, 2021 (unaudited) |
June 30, 2020 (unaudited) |
||||||||||||||||||||||
| ($ in thousands, except per share data) | Amount | Per Share |
Amount | Per Share |
Amount | Per Share |
||||||||||||||||||
| GAAP net realized and unrealized gains (losses), net of taxes |
$ | 11,106 | $ | 0.06 | $ | 70,003 | $ | 0.48 | $ | 103,461 | $ | 0.73 | ||||||||||||
| Less: Net realized and unrealized losses (gains) related to merger accounting adjustments |
5,045 | 0.03 | (33,396 | ) | (0.23 | ) | — | — | ||||||||||||||||
|
|
|
|
|
|
|
|
|
|
|
|
|
|||||||||||||
| Adjusted net realized and unrealized gains (losses), net of taxes |
$ | 16,151 | $ | 0.09 | $ | 36,607 | $ | 0.25 | $ | 103,461 | $ | 0.73 | ||||||||||||
|
|
|
|
|
|
|
|
|
|
|
|
|
|||||||||||||
The following table provides a reconciliation of net increase (decrease) in net assets resulting from operations (the most comparable U.S. GAAP measure) to adjusted earnings (loss) for the periods presented:
| For the three months ended | ||||||||||||||||||||||||
| June 30, 2021 (unaudited) |
March 31, 2021 (unaudited) |
June 30, 2020 (unaudited) |
||||||||||||||||||||||
| ($ in thousands, except per share data) | Amount | Per Share |
Amount | Per Share |
Amount | Per Share |
||||||||||||||||||
| Net increase (decrease) in net assets resulting from operations |
$ | 47,038 | $ | 0.26 | $ | 88,117 | $ | 0.60 | $ | 120,231 | $ | 0.85 | ||||||||||||
| Less: Interest income accretion related to merger accounting adjustments |
(5,060 | ) | (0.03 | ) | (665 | ) | — | — | — | |||||||||||||||
| Less: Net realized and unrealized losses (gains) related to merger accounting adjustments |
5,045 | 0.03 | (33,396 | ) | (0.23 | ) | — | — | ||||||||||||||||
|
|
|
|
|
|
|
|
|
|
|
|
|
|||||||||||||
| Adjusted earnings (loss) |
$ | 47,023 | $ | 0.26 | $ | 54,056 | $ | 0.37 | $ | 120,231 | $ | 0.85 | ||||||||||||
|
|
|
|
|
|
|
|
|
|
|
|
|
|||||||||||||
8
Conference Call Information
Oaktree Specialty Lending will host a conference call to discuss its third fiscal quarter 2021 results at 11:00 a.m. Eastern Time / 8:00 a.m. Pacific Time on August 5, 2021. The conference call may be accessed by dialing (877) 507-4376 (U.S. callers) or +1 (412) 317-5239 (non-U.S. callers). All callers will need to reference “Oaktree Specialty Lending” once connected with the operator. Alternatively, a live webcast of the conference call can be accessed through the Investors section of Oaktree Specialty Lending’s website, www.oaktreespecialtylending.com. During the conference call, the Company intends to refer to an investor presentation that will be available on the Investors section of its website.
For those individuals unable to listen to the live broadcast of the conference call, a replay will be available on Oaktree Specialty Lending’s website, or by dialing (877) 344-7529 (U.S. callers) or +1 (412) 317-0088 (non-U.S. callers), access code 10158174, beginning approximately one hour after the broadcast.
About Oaktree Specialty Lending Corporation
Oaktree Specialty Lending Corporation (NASDAQ: OCSL) is a specialty finance company dedicated to providing customized one-stop credit solutions to companies with limited access to public or syndicated capital markets. The Company’s investment objective is to generate current income and capital appreciation by providing companies with flexible and innovative financing solutions including first and second lien loans, unsecured and mezzanine loans, and preferred equity. The Company is regulated as a business development company under the Investment Company Act of 1940, as amended, and is externally managed by Oaktree Fund Advisors, LLC, an affiliate of Oaktree Capital Management, L.P. For additional information, please visit Oaktree Specialty Lending’s website at www.oaktreespecialtylending.com.
Forward-Looking Statements
Some of the statements in this press release constitute forward-looking statements because they relate to future events, future performance or financial condition. The forward-looking statements may include statements as to: future operating results of the Company and distribution projections; business prospects of the Company and the prospects of its portfolio companies; and the impact of the investments that the Company expects to make. In addition, words such as “anticipate,” “believe,” “expect,” “seek,” “plan,” “should,” “estimate,” “project” and “intend” indicate forward-looking statements, although not all forward-looking statements include these words. The forward-looking statements contained in this press release involve risks and uncertainties. Certain factors could cause actual results and conditions to differ materially from those projected, including the uncertainties associated with (i) changes in the economy, financial markets and political environment, (ii) risks associated with possible disruption in the operations of the Company or the economy generally due to terrorism, natural disasters or the COVID-19 pandemic; (iii) future changes in laws or regulations (including the interpretation of these laws and regulations by regulatory authorities); (iv) conditions in the Company’s operating areas, particularly with respect to business development companies or regulated investment companies; (v) general considerations associated with the COVID-19 pandemic; and (vi) other considerations that may be disclosed from time to time in the Company’s publicly disseminated documents and filings. The Company has based the forward-looking statements included in this press release on information available to it on the date of this press release, and the Company assumes no obligation to update any such forward-looking statements. The Company undertakes no obligation to revise or update any forward-looking statements, whether as a result of new information, future events or otherwise, you are advised to consult any additional disclosures that it may make directly to you or through reports that the Company in the future may file with the Securities and Exchange Commission, including annual reports on Form 10-K, quarterly reports on Form 10-Q and current reports on Form 8-K.
Contacts
Investor Relations:
Oaktree Specialty Lending Corporation
Michael Mosticchio
(212) 284-1900
Media Relations:
Financial Profiles, Inc.
Moira Conlon
(310) 478-2700
9
Oaktree Specialty Lending Corporation
Consolidated Statements of Assets and Liabilities
(in thousands, except per share amounts)
| June 30, 2021 (unaudited) |
March 31, 2021 (unaudited) |
September 30, 2020 |
||||||||||
| ASSETS |
||||||||||||
| Investments at fair value: |
||||||||||||
| Control investments (cost June 30, 2021: $283,707; cost March 31, 2021: $287,571; cost September 30, 2020: $245,950) |
$ | 269,478 | $ | 269,752 | $ | 201,385 | ||||||
| Affiliate investments (cost June 30, 2021: $14,788; cost March 31, 2021: $12,138; cost September 30, 2020: $7,551) |
13,959 | 11,200 | 6,509 | |||||||||
|
Non-control/Non-affiliate investments (cost June 30, 2021: $2,021,729; cost March 31, 2021: $2,011,349; cost September 30, 2020: $1,415,669) |
2,055,864 | 2,046,401 | 1,365,957 | |||||||||
|
|
|
|
|
|
|
|||||||
| Total investments at fair value (cost June 30, 2021: $2,320,224; cost March 31, 2021: $2,311,058; cost September 30, 2020: $1,669,170) |
2,339,301 | 2,327,353 | 1,573,851 | |||||||||
| Cash and cash equivalents |
84,689 | 39,872 | 39,096 | |||||||||
| Restricted cash |
2,840 | 3,857 | — | |||||||||
| Interest, dividends and fees receivable |
15,415 | 11,291 | 6,935 | |||||||||
| Due from portfolio companies |
1,394 | 3,283 | 2,725 | |||||||||
| Receivables from unsettled transactions |
2,466 | 36,469 | 9,123 | |||||||||
| Due from broker |
1,640 | — | — | |||||||||
| Deferred financing costs |
9,413 | 7,076 | 5,947 | |||||||||
| Deferred offering costs |
34 | 67 | 67 | |||||||||
| Deferred tax asset, net |
735 | 527 | 847 | |||||||||
| Derivative assets at fair value |
2,449 | 1,333 | 223 | |||||||||
| Other assets |
2,332 | 2,285 | 1,898 | |||||||||
|
|
|
|
|
|
|
|||||||
| Total assets |
$ | 2,462,708 | $ | 2,433,413 | $ | 1,640,712 | ||||||
|
|
|
|
|
|
|
|||||||
| LIABILITIES AND NET ASSETS |
||||||||||||
| Liabilities: |
||||||||||||
| Accounts payable, accrued expenses and other liabilities |
$ | 3,925 | $ | 3,467 | $ | 1,072 | ||||||
| Base management fee and incentive fee payable |
31,127 | 24,559 | 11,212 | |||||||||
| Due to affiliate |
5,011 | 4,688 | 2,130 | |||||||||
| Interest payable |
5,277 | 2,734 | 1,626 | |||||||||
| Payables from unsettled transactions |
10,588 | 9,245 | 478 | |||||||||
| Derivative liability at fair value |
267 | — | — | |||||||||
| Credit facilities payable |
464,057 | 814,782 | 414,825 | |||||||||
| Unsecured notes payable (net of $6,876, $2,900 and $3,272 of unamortized financing costs as of June 30, 2021, March 31, 2021 and September 30, 2020, respectively) |
640,042 | 295,115 | 294,490 | |||||||||
|
|
|
|
|
|
|
|||||||
| Total liabilities |
1,160,294 | 1,154,590 | 725,833 | |||||||||
|
|
|
|
|
|
|
|||||||
| Commitments and contingencies |
||||||||||||
| Net assets: |
||||||||||||
| Common stock, $0.01 par value per share, 250,000 shares authorized; 180,361, 180,361 and 140,961 shares issued and outstanding as of June 30, 2021, March 31, 2021 and September 30, 2020, respectively |
1,804 | 1,804 | 1,409 | |||||||||
| Additional paid-in-capital |
1,730,083 | 1,730,083 | 1,487,774 | |||||||||
| Accumulated overdistributed earnings |
(429,473 | ) | (453,064 | ) | (574,304 | ) | ||||||
|
|
|
|
|
|
|
|||||||
| Total net assets (equivalent to $7.22, $7.09 and $6.49 per common share as of June 30, 2021, March 31, 2021 and September 30, 2020, respectively) |
1,302,414 | 1,278,823 | 914,879 | |||||||||
|
|
|
|
|
|
|
|||||||
| Total liabilities and net assets |
$ | 2,462,708 | $ | 2,433,413 | $ | 1,640,712 | ||||||
|
|
|
|
|
|
|
|||||||
10
Oaktree Specialty Lending Corporation
Consolidated Statements of Operations
(in thousands, except per share amounts)
(unaudited)
| Three months ended June 30, 2021 |
Three months ended March 31, 2021 |
Three months ended June 30, 2020 |
Nine months ended June 30, 2021 |
Nine months ended June 30, 2020 |
||||||||||||||||
| Interest income: |
||||||||||||||||||||
| Control investments |
$ | 3,405 | $ | 2,374 | $ | 2,558 | $ | 8,122 | $ | 7,502 | ||||||||||
| Affiliate investments |
189 | 143 | 127 | 437 | 379 | |||||||||||||||
|
Non-control/Non-affiliate investments |
48,403 | 33,133 | 27,406 | 110,720 | 80,214 | |||||||||||||||
| Interest on cash and cash equivalents |
2 | 5 | 21 | 8 | 320 | |||||||||||||||
|
|
|
|
|
|
|
|
|
|
|
|||||||||||
| Total interest income |
51,999 | 35,655 | 30,112 | 119,287 | 88,415 | |||||||||||||||
|
|
|
|
|
|
|
|
|
|
|
|||||||||||
| PIK interest income: |
||||||||||||||||||||
|
Non-control/Non-affiliate investments |
4,597 | 3,801 | 2,183 | 11,487 | 5,290 | |||||||||||||||
|
|
|
|
|
|
|
|
|
|
|
|||||||||||
| Total PIK interest income |
4,597 | 3,801 | 2,183 | 11,487 | 5,290 | |||||||||||||||
|
|
|
|
|
|
|
|
|
|
|
|||||||||||
| Fee income: |
||||||||||||||||||||
| Control investments |
13 | 18 | 13 | 46 | 27 | |||||||||||||||
| Affiliate investments |
5 | 5 | 5 | 15 | 15 | |||||||||||||||
|
Non-control/Non-affiliate investments |
7,805 | 2,255 | 1,809 | 13,392 | 4,906 | |||||||||||||||
|
|
|
|
|
|
|
|
|
|
|
|||||||||||
| Total fee income |
7,823 | 2,278 | 1,827 | 13,453 | 4,948 | |||||||||||||||
|
|
|
|
|
|
|
|
|
|
|
|||||||||||
| Dividend income: |
||||||||||||||||||||
| Control investments |
1,019 | 209 | 281 | 1,358 | 881 | |||||||||||||||
|
|
|
|
|
|
|
|
|
|
|
|||||||||||
| Total dividend income |
1,019 | 209 | 281 | 1,358 | 881 | |||||||||||||||
|
|
|
|
|
|
|
|
|
|
|
|||||||||||
| Total investment income |
65,438 | 41,943 | 34,403 | 145,585 | 99,534 | |||||||||||||||
|
|
|
|
|
|
|
|
|
|
|
|||||||||||
| Expenses: |
||||||||||||||||||||
| Base management fee |
8,905 | 7,074 | 5,988 | 22,520 | 16,890 | |||||||||||||||
| Part I incentive fee |
6,990 | 4,444 | 3,556 | 15,583 | 9,988 | |||||||||||||||
| Part II incentive fee |
2,837 | 3,609 | — | 15,986 | (5,557 | ) | ||||||||||||||
| Professional fees |
1,059 | 1,017 | 545 | 2,943 | 1,854 | |||||||||||||||
| Directors fees |
147 | 157 | 143 | 447 | 428 | |||||||||||||||
| Interest expense |
8,823 | 6,568 | 6,406 | 21,486 | 20,156 | |||||||||||||||
| Administrator expense |
421 | 293 | 373 | 1,047 | 1,194 | |||||||||||||||
| General and administrative expenses |
716 | 775 | 622 | 2,009 | 1,934 | |||||||||||||||
|
|
|
|
|
|
|
|
|
|
|
|||||||||||
| Total expenses |
29,898 | 23,937 | 17,633 | 82,021 | 46,887 | |||||||||||||||
| Reversal of fees waived (fees waived) |
(750 | ) | (108 | ) | — | (858 | ) | 5,200 | ||||||||||||
|
|
|
|
|
|
|
|
|
|
|
|||||||||||
| Net expenses |
29,148 | 23,829 | 17,633 | 81,163 | 52,087 | |||||||||||||||
|
|
|
|
|
|
|
|
|
|
|
|||||||||||
| Net investment income before taxes |
36,290 | 18,114 | 16,770 | 64,422 | 47,447 | |||||||||||||||
| (Provision) benefit for taxes on net investment income |
(358 | ) | — | — | (358 | ) | — | |||||||||||||
|
|
|
|
|
|
|
|
|
|
|
|||||||||||
| Net investment income |
35,932 | 18,114 | 16,770 | 64,064 | 47,447 | |||||||||||||||
|
|
|
|
|
|
|
|
|
|
|
|||||||||||
| Unrealized appreciation (depreciation): |
||||||||||||||||||||
| Control investments |
3,590 | 18,411 | 13,790 | 30,336 | (39,605 | ) | ||||||||||||||
| Affiliate investments |
109 | 394 | (45 | ) | 213 | (1,839 | ) | |||||||||||||
|
Non-control/Non-affiliate investments |
(898 | ) | 42,803 | 87,225 | 83,842 | (19,018 | ) | |||||||||||||
| Foreign currency forward contracts |
1,116 | 3,536 | (398 | ) | 2,226 | 380 | ||||||||||||||
|
|
|
|
|
|
|
|
|
|
|
|||||||||||
| Net unrealized appreciation (depreciation) |
3,917 | 65,144 | 100,572 | 116,617 | (60,082 | ) | ||||||||||||||
|
|
|
|
|
|
|
|
|
|
|
|||||||||||
| Realized gains (losses): |
||||||||||||||||||||
| Control investments |
— | — | — | — | 777 | |||||||||||||||
|
Non-control/Non-affiliate investments |
9,350 | 8,179 | 2,821 | 26,267 | (18,117 | ) | ||||||||||||||
| Extinguishment of unsecured notes payable |
— | — | — | — | (2,541 | ) | ||||||||||||||
| Foreign currency forward contracts |
(740 | ) | (2,323 | ) | — | (3,586 | ) | (490 | ) | |||||||||||
|
|
|
|
|
|
|
|
|
|
|
|||||||||||
| Net realized gains (losses) |
8,610 | 5,856 | 2,821 | 22,681 | (20,371 | ) | ||||||||||||||
|
|
|
|
|
|
|
|
|
|
|
|||||||||||
| (Provision) benefit for taxes on realized and unrealized gains (losses) |
(1,421 | ) | (997 | ) | 68 | (2,663 | ) | 1,613 | ||||||||||||
|
|
|
|
|
|
|
|
|
|
|
|||||||||||
| Net realized and unrealized gains (losses), net of taxes |
11,106 | 70,003 | 103,461 | 136,635 | (78,840 | ) | ||||||||||||||
|
|
|
|
|
|
|
|
|
|
|
|||||||||||
| Net increase (decrease) in net assets resulting from operations |
$ | 47,038 | $ | 88,117 | $ | 120,231 | $ | 200,699 | $ | (31,393 | ) | |||||||||
|
|
|
|
|
|
|
|
|
|
|
|||||||||||
| Net investment income per common share — basic and diluted |
$ | 0.20 | $ | 0.12 | $ | 0.12 | $ | 0.41 | $ | 0.34 | ||||||||||
| Earnings (loss) per common share — basic and diluted |
$ | 0.26 | $ | 0.60 | $ | 0.85 | $ | 1.29 | $ | (0.22 | ) | |||||||||
| Weighted average common shares outstanding — basic and diluted |
180,361 | 146,652 | 140,961 | 155,970 | 140,961 | |||||||||||||||
11
Exhibit 99.2

OAKTREE OCSL Specialty Lending Corporation THIRD QUARTER 2021 AUGUST 5, 2021 EARNINGS PRESENTATION NASDAQ: OCSL
OAKTREE OCSL Specialty Lending Corporation Forward Looking Statements Some of the statements in this presentation constitute forward-looking statements because they relate to future events or our future performance or financial condition. The forward-looking statements contained in this presentation may include statements as to: our future operating results and distribution projections; the ability of Oaktree Fund Advisors, LLC (together with its affiliates, “Oaktree”) to reposition our portfolio and to implement Oaktree’s future plans with respect to our business; the ability of Oaktree and its affiliates to attract and retain highly talented professionals; our business prospects and the prospects of our portfolio companies; the impact of the investments that we expect to make; the ability of our portfolio companies to achieve their objectives; our expected financings and investments and additional leverage we may seek to incur in the future; the adequacy of our cash resources and working capital; the timing of cash flows, if any, from the operations of our portfolio companies; and the cost or potential outcome of any litigation to which we may be a party. In addition, words such as “anticipate,” “believe,” “expect,” “seek,” “plan,” “should,” “estimate,” “project” and “intend” indicate forward-looking statements, although not all forward-looking statements include these words. The forward-looking statements contained in this presentation involve risks and uncertainties. Our actual results could differ materially from those implied or expressed in the forward-looking statements for any reason, including the factors set forth in “Risk Factors” and elsewhere in our annual report on Form 10-K for the fiscal year ended September 30, 2020 and our quarterly report on Form 10-Q for the quarter ended June 30, 2021. Other factors that could cause actual results to differ materially include: changes or potential disruptions in our operations, the economy, financial markets or political environment; risks associated with possible disruption in our operations or the economy generally due to terrorism, natural disasters or the COVID-19 pandemic; future changes in laws or regulations (including the interpretation of these laws and regulations by regulatory authorities) and conditions in our operating areas, particularly with respect to business development companies or regulated investment companies; general considerations associated with the COVID-19 pandemic; the ability to realize the anticipated benefits of the merger of Oaktree Strategic Income Corporation (“OCSI”) with and into us (the “Merger”); and other considerations that may be disclosed from time to time in our publicly disseminated documents and filings. We have based the forward-looking statements included in this presentation on information available to us on the date of this presentation, and we assume no obligation to update any such forward-looking statements. Although we undertake no obligation to revise or update any forward-looking statements, whether as a result of new information, future events or otherwise, you are advised to consult any additional disclosures that we may make directly to you or through reports that we in the future may file with the SEC, including annual reports on Form 10-K, quarterly reports on Form 10-Q and current reports on Form 8-K.
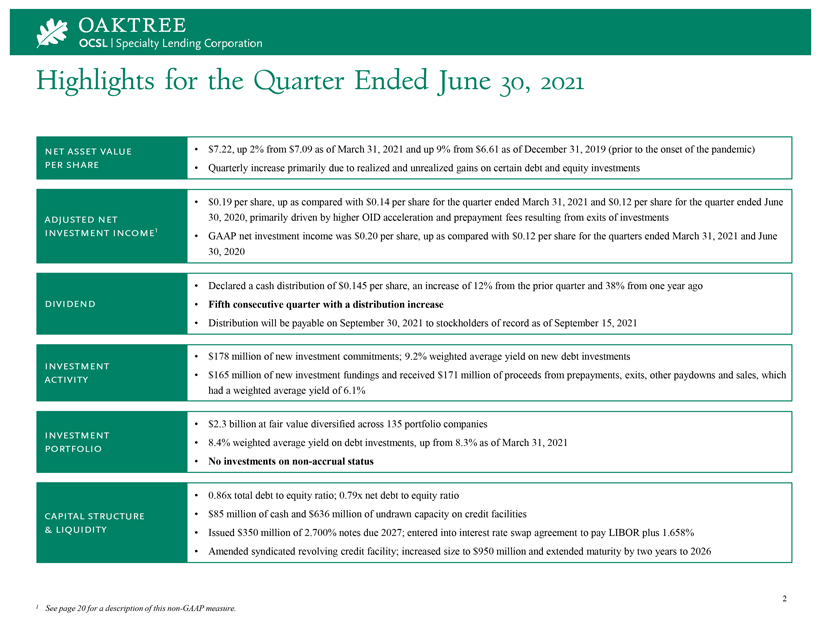
Highlights for the Quarter Ended June 30, 2021 NET ASSET VALUE PER SHARE $7.22, up 2% from $7.09 as of March 31, 2021 and up 9% from $6.61 as of December 31, 2019 (prior to the onset of the pandemic) Quarterly increase primarily due to realized and unrealized gains on certain debt and equity investments ADJUSTED NET INVESTMENT INCOME1 $0.19 per share, up as compared with $0.14 per share for the quarter ended March 31, 2021 and $0.12 per share for the quarter ended June 30, 2020, primarily driven by higher OID acceleration and prepayment fees resulting from exits of investments GAAP net investment income was $0.20 per share, up as compared with $0.12 per share for the quarters ended March 31, 2021 and June 30, 2020 Declared a cash distribution of $0.145 per share, an increase of 12% from the prior quarter and 38% from one year ago DIVIDEND Fifth consecutive quarter with a distribution increase Distribution will be payable on September 30, 2021 to stockholders of record as of September 15, 2021 $178 million of new investment commitments; 9.2% weighted average yield on new debt investments INVESTMENT ACTIVITY $165 million of new investment fundings and received $171 million of proceeds from prepayments, exits, other paydowns and sales, which had a weighted average yield of 6.1% INVESTMENT PORTFOLIO $2.3 billion at fair value diversified across 135 portfolio companies 8.4% weighted average yield on debt investments, up from 8.3% as of March 31, 2021 No investments on non-accrual status CAPITAL STRUCTURE & LIQUIDITY 0.86x total debt to equity ratio; 0.79x net debt to equity ratio $85 million of cash and $636 million of undrawn capacity on credit facilities Issued $350 million of 2.700% notes due 2027; entered into interest rate swap agreement to pay LIBOR plus 1.658% Amended syndicated revolving credit facility; increased size to $950 million and extended maturity by two years to 2026 1 See page 20 for a description of this non-GAAP measure.
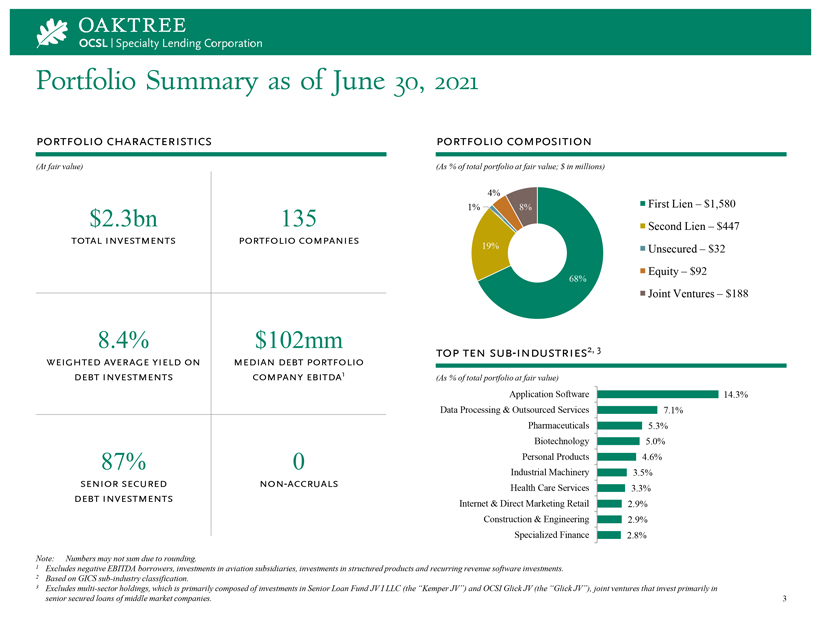
OAKTREE OCSL | Specialty Lending Corporation Portfolio Summary as of June 30, 2021 PORTFOLIO CHARACTERISTICS PORTFOLIO COMPOSITION (At fair value) (As % of total portfolio at fair value; $ in millions) 4% First Lien – $1,580 $2.3bn 135 1% 8% Second Lien – $447 TOTAL INVESTMENTS PORTFOLIO COMPANIES 19% Unsecured – $32 Equity – $92 68% Joint Ventures – $ 188 8.4% $102mm TOP TEN SUB-INDUSTRIES2, 3 WEIGHTED AVERAGE YIELD ON MEDIAN DEBT PORTFOLIO DEBT INVESTMENTS COMPANY EBITDA1 (As % of total portfolio at fair value) Application Software 14.3% Data Processing & Outsourced Services 7.1% Pharmaceuticals 5.3% Biotechnolog y 5.0% 87% 0 Personal Products 4.6% Industrial Machinery 3.5% SENIOR SECURED NON-ACCRUALS Health Care Services 3.3% DEBT INVESTMENTS Internet & Direct Marketing Retail 2.9% Construction & Engineering 2.9% Specialized Finance 2.8% Note: Numbers may not sum due to rounding. 1 Excludes negative EBITDA borrowers, investments in aviation subsidiaries, investments in structured products and recurring revenue software investments. 2 Based on GICS sub-industry classification. 3 Excludes multi-sector holdings, which is primarily composed of investments in Senior Loan Fund JV I LLC (the “Kemper JV”) and OCSI Glick JV (the “Glick JV”), joint ventures that invest primarily in senior secured loans of middle market companies. 3
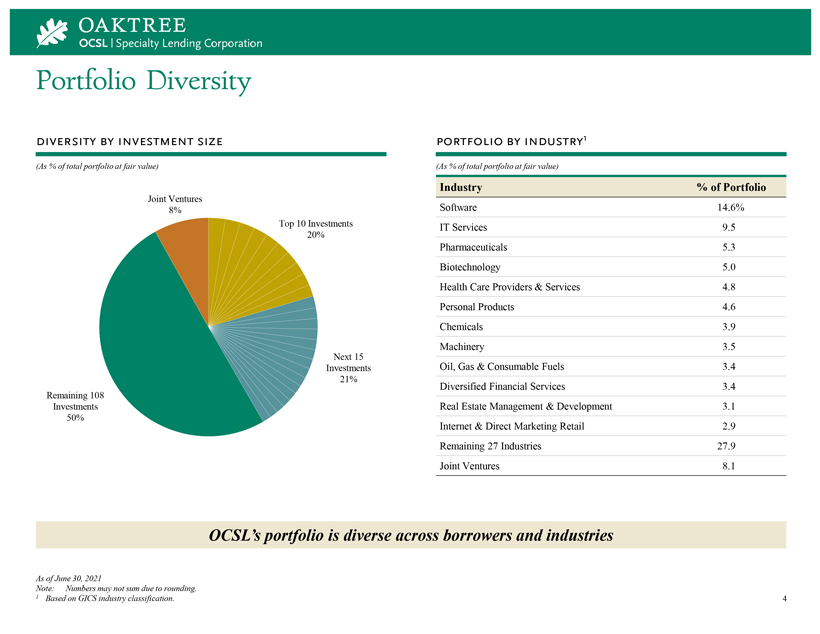
OAKTREE OCSL | Specialty Lending Corporation Portfolio Diversity DIVERSITY BY INVESTMENT SIZE PORTFOLIO BY INDUSTRY1 (As % of total portfolio at fair value) (As % of total portfolio at fair value) Industry % of Portfolio Joint Ventures 8% Software 14.6% Top 10 Investments IT Services 9.5 20% Pharmaceuticals 5.3 Biotechnology 5.0 Health Care Providers & Services 4.8 Personal Products 4.6 Chemicals 3.9 Next 15 Machinery 3.5 Investments Oil, Gas & Consumable Fuels 3.4 21% Diversified Financial Services 3.4 Remaining 108 Investments Real Estate Management & Development 3.1 50% Internet & Direct Marketing Retail 2.9 Remaining 27 Industries 27.9 Joint Ventures 8.1 OCSL’s portfolio is diverse across borrowers and industries As of June 30, 2021 Note: Numbers may not sum due to rounding. 1 Based on GICS industry classification. 4
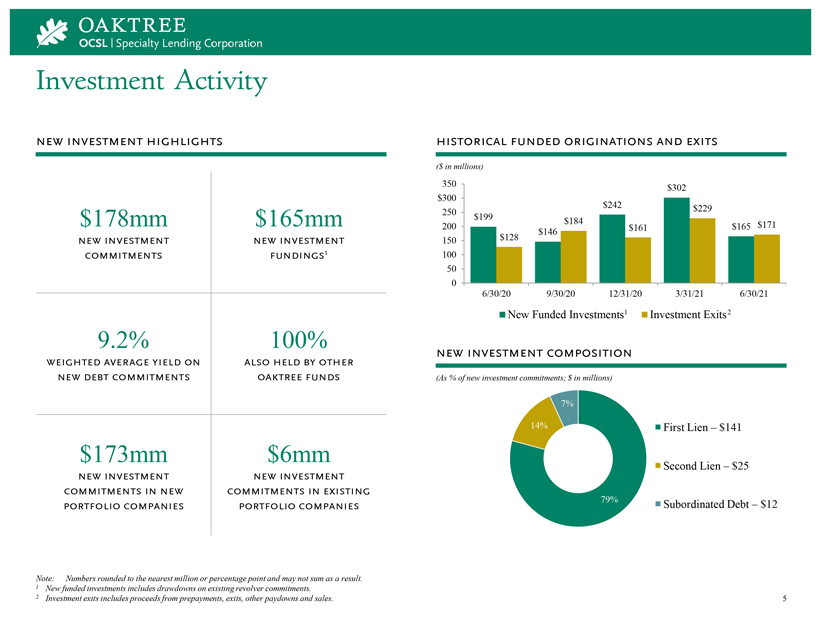
OAK TREE OSCL | Speciality Leading Corporation Investment Activity NEW INVESTMENT HIGHLIGHTS HISTORICAL FUNDED ORIGINATIONS AND EXITS ($ in millions) 350 $302 $300 $242 $229250 $178mm $165mm $199 $184 200 $161 $165 $171 $146 NEW INVESTMENT NEW INVESTMENT150 $128 COMMITMENTS FUNDINGS1 100500 6/30/20 9/30/20 12/31/20 3/31/21 6/30/21 New Funded Investments1 Investment Exits2 9.2% 100% NEW INVESTMENT COMPOSITION WEIGHTED AVERAGE YIELD ON ALSO HELD BY OTHER NEW DEBT COMMITMENTS OAKTREE FUNDS (As % of new investment commitments; $ in millions) 7% 14% First Lien – $141 $173mm $6mm Second Lien – $25 NEW INVESTMENT NEW INVESTMENT COMMITMENTS IN NEW COMMITMENTS IN EXISTING 79% Subordinated De bt – $12 PORTFOLIO COMPANIES PORTFOLIO COMPANIES Note: Numbers rounded to the nearest million or percentage point and may not sum as a result. 1 New funded investments includes drawdowns on existing revolver commitments. 2 Investment exits includes proceeds from prepayments, exits, other paydowns and sales. 5
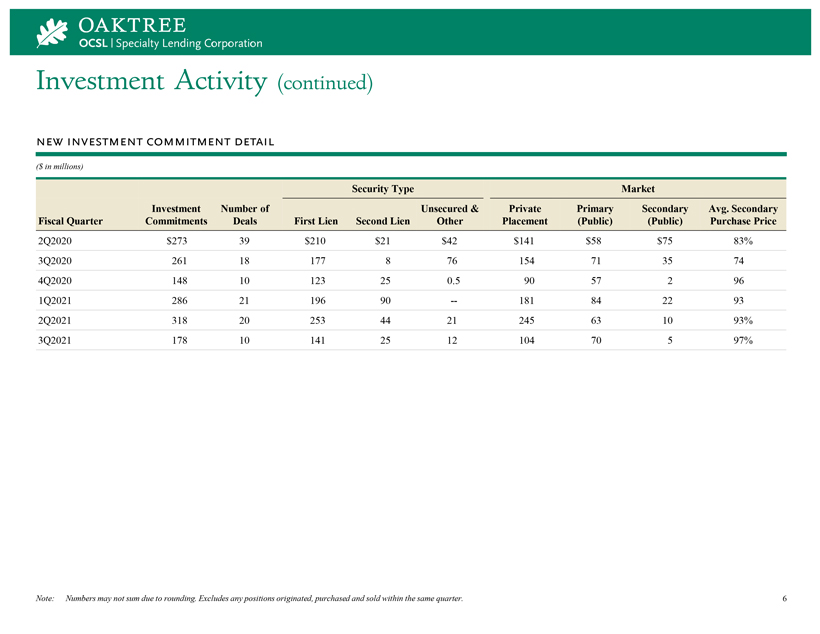
OAKTREE OCSL Specialty Lending Corporation Investment Activity (continued) NEW INVESTMENT COMMITMENT DETAIL ($ in millions) Security Type Market Investment Number of Unsecured & Private Primary Secondary Avg. Secondary Fiscal Quarter Commitments Deals First Lien Second Lien Other Placement (Public) (Public) Purchase Price 2Q2020 $273 39 $210 $21 $42 $141 $58 $75 83% 3Q2020 261 18 177 8 76 154 71 35 74 4Q2020 148 10 123 25 0.5 90 57 2 96 1Q2021 286 21 196 90 -- 181 84 22 93 2Q2021 318 20 253 44 21 245 63 10 93% 3Q2021 178 10 141 25 12 104 70 5 97% Note: Numbers may not sum due to rounding. Excludes any positions originated, purchased and sold within the same quarter. 6
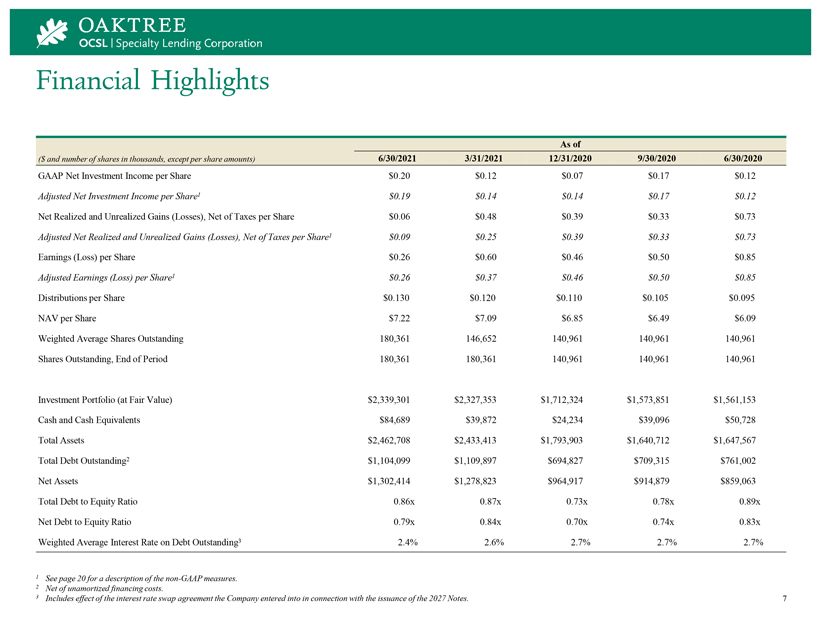
OAKTREE OCSL | Specialty Lending Corporation Financial HighlightsAs of($ and number of shares in thousands, except per share amounts) 6/30/2021 3/31/2021 12/31/2020 9/30/2020 6/30/2020GAAP Net Investment Income per Share $0.20 $0.12 $0.07 $0.17 $0.12Adjusted Net Investment Income per Share1 $0.19 $0.14 $0.14 $0.17 $0.12Net Realized and Unrealized Gains (Losses), Net of Taxes per Share $0.06 $0.48 $0.39 $0.33 $0.73Adjusted Net Realized and Unrealized Gains (Losses), Net of Taxes per Share1 $0.09 $0.25 $0.39 $0.33 $0.73Earnings (Loss) per Share $0.26 $0.60 $0.46 $0.50 $0.85Adjusted Earnings (Loss) per Share1 $0.26 $0.37 $0.46 $0.50 $0.85Distributions per Share $0.130 $0.120 $0.110 $0.105 $0.095 NAV per Share $7.22 $7.09 $6.85 $6.49 $6.09 Weighted Average Shares Outstanding 180,361 146,652 140,961 140,961 140,961 Shares Outstanding, End of Period 180,361 180,361 140,961 140,961 140,961Investment Portfolio (at Fair Value) $2,339,301 $2,327,353 $1,712,324 $1,573,851 $1,561,153 Cash and Cash Equivalents $84,689 $39,872 $24,234 $39,096 $50,728 Total Assets $2,462,708 $2,433,413 $1,793,903 $1,640,712 $1,647,567 Total Debt Outstanding2 $1,104,099 $1,109,897 $694,827 $709,315 $761,002 Net Assets $1,302,414 $1,278,823 $964,917 $914,879 $859,063 Total Debt to Equity Ratio 0.86x 0.87x 0.73x 0.78x 0.89x Net Debt to Equity Ratio 0.79x 0.84x 0.70x 0.74x 0.83x Weighted Average Interest Rate on Debt Outstanding3 2.4% 2.6% 2.7% 2.7% 2.7%1 See page 20 for a description of the non-GAAP measures. 2 Net of unamortized financing costs. 3 Includes effect of the interest rate swap agreement the Company entered into in connection with the issuance of the 2027 Notes. 7
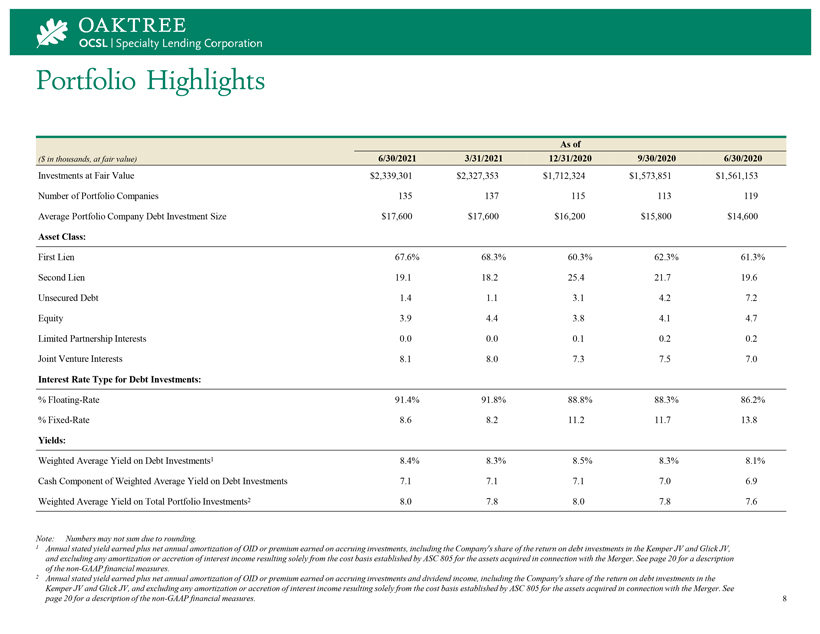
OAKTREE OCSL | Specialty Lending Corporation Portfolio HighlightsAs of($ in thousands, at fair value) 6/30/2021 3/31/2021 12/31/2020 9/30/2020 6/30/2020Investments at Fair Value $2,339,301 $2,327,353 $1,712,324 $1,573,851 $1,561,153 Number of Portfolio Companies 135 137 115 113 119 Average Portfolio Company Debt Investment Size $17,600 $17,600 $16,200 $15,800 $14,600Asset Class:First Lien 67.6% 68.3% 60.3% 62.3% 61.3% Second Lien 19.1 18.2 25.4 21.7 19.6 Unsecured Debt 1.4 1.1 3.1 4.2 7.2 Equity 3.9 4.4 3.8 4.1 4.7 Limited Partnership Interests 0.0 0.0 0.1 0.2 0.2 Joint Venture Interests 8.1 8.0 7.3 7.5 7.0Interest Rate Type for Debt Investments:% Floating-Rate 91.4% 91.8% 88.8% 88.3% 86.2%% Fixed-Rate 8.6 8.2 11.2 11.7 13.8Yields:Weighted Average Yield on Debt Investments1 8.4% 8.3% 8.5% 8.3% 8.1% Cash Component of Weighted Average Yield on Debt Investments 7.1 7.1 7.1 7.0 6.9 Weighted Average Yield on Total Portfolio Investments2 8.0 7.8 8.0 7.8 7.6Note: Numbers may not sum due to rounding.1 Annual stated yield earned plus net annual amortization of OID or premium earned on accruing investments, including the Company’s share of the return on debt investments in the Kemper JV and Glick JV, and excluding any amortization or accretion of interest income resulting solely from the cost basis established by ASC 805 for the assets acquired in connection with the Merger. See page 20 for a description of the non-GAAP financial measures.2 Annual stated yield earned plus net annual amortization of OID or premium earned on accruing investments and dividend income, including the Company’s share of the return on debt investments in the Kemper JV and Glick JV, and excluding any amortization or accretion of interest income resulting solely from the cost basis established by ASC 805 for the assets acquired in connection with the Merger. See page 20 for a description of the non-GAAP financial measures. 8
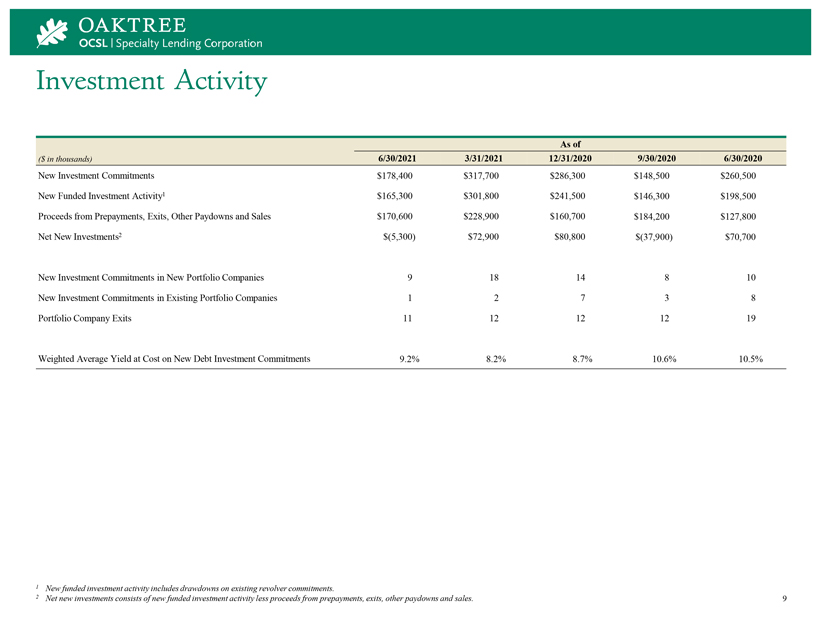
OAKTREE OCSL Specialty Lending Corporation Investment Activity As of ($ in thousands) 6/30/2021 3/31/2021 12/31/2020 9/30/2020 6/30/2020 New Investment Commitments $178,400 $317,700 $286,300 $148,500 $260,500 New Funded Investment Activity1 $165,300 $301,800 $241,500 $146,300 $198,500 Proceeds from Prepayments, Exits, Other Paydowns and Sales $170,600 $228,900 $160,700 $184,200 $127,800 Net New Investments2 $(5,300) $72,900 $80,800 $(37,900) $70,700 New Investment Commitments in New Portfolio Companies 9 18 14 8 10 New Investment Commitments in Existing Portfolio Companies 1 2 7 3 8 Portfolio Company Exits 11 12 12 12 19 Weighted Average Yield at Cost on New Debt Investment Commitments 9.2% 8.2% 8.7% 10.6% 10.5%1 New funded investment activity includes drawdowns on existing revolver commitments. 2 Net new investments consists of new funded investment activity less proceeds from prepayments, exits, other paydowns and sales. 9
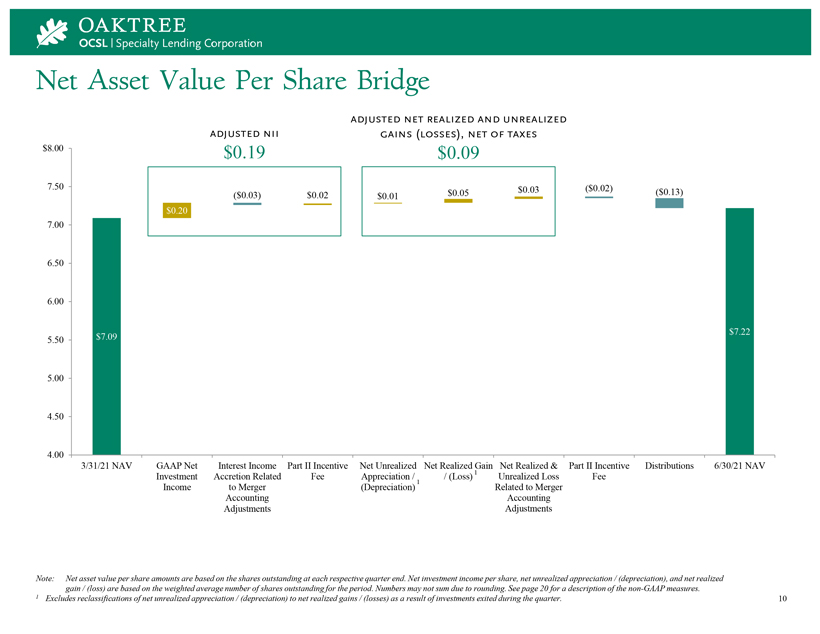
OAKTREE OCSL | Specialty Lending Corporation Net Asset Value Per Share Bridge ADJUSTED NII $0.19 ADJUSTED NET REALIZED AND UNREALIZED GAINS (LOSSES), NET OF TAXES $0.09 ($0.03) $0.02 $0.20 $0.05 $0.03 $0.01 ($0.02) ($0.13) $8.00 7.50 7.00 6.50 6.00 5.50 5.00 4.50 4.00 $7.09 $7.22 3/31/21 NAV GAAP Net Investment Income Interest Income Accretion Related to Merger Accounting Adjustments Part II Incentive Fee Net Unrealized Appreciation / (Depreciation) 1 Net Realized Gain / (Loss) 1 Net Realized & Unrealized loss Related to Merger Accounting Adjustments Part II Incentive Fee Distributions 6/30/21 NAV Note: Net asset value per share amounts are based on the shares outstanding at each respective quarter end. Net investment income per share, net unrealized appreciation / (depreciation), and net realized gain / (loss) are based on the weighted average number of shares outstanding for the period. Numbers may not sum due to rounding. See page 20 for a description of the non-GAAP measures. 1 Excludes reclassifications of net unrealized appreciation / (depreciation) to net realized gains / (losses) as a result of investments exited during the quarter. 10
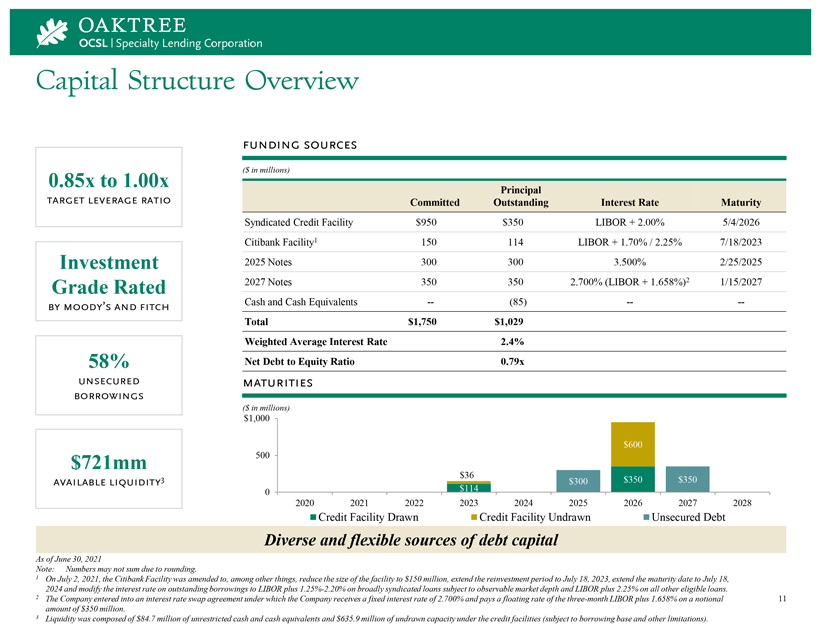
OAKTREE OCSL | Specialty Lending Corporation Capital Structure Overview FUNDING SOURCES 0.85x to 1.00x ($ in millions) Principal TARGET LEVERAGE RATIO Committed Outstanding Interest Rate MaturitySyndicated Credit Facility $950 $350 LIBOR + 2.00% 5/4/2026 Citibank Facility1 150 114 LIBOR + 1.70% / 2.25% 7/18/2023 Investment 2025 Notes 300 300 3.500% 2/25/2025 Grade Rated 2027 Notes 350 350 2.700% (LIBOR + 1.658%)2 1/15/2027 Cash and Cash Equivalents — (85) — — BY MOODY’S AND FITCH Total $1,750 $1,029 Weighted Average Interest Rate 2.4% 58% Net Debt to Equity Ratio 0.79x UNSECURED MATURITIES BORROWINGS ($ in millions) $1,000 $600 $721mm 500 3 $36 $350 $350 AVAILABLE LIQUIDITY $3000 $114 2020 2021 2022 2023 2024 2025 2026 2027 2028 Credit Facility Drawn Credit Facility Undrawn Unsecured Debt Diverse and flexible sources of debt capital As of June 30, 2021 Note: Numbers may not sum due to rounding. 1 On July 2, 2021, the Citibank Facility was amended to, among other things, reduce the size of the facility to $150 million, extend the reinvestment period to July 18, 2023, extend the maturity date to July 18, 2024 and modify the interest rate on outstanding borrowings to LIBOR plus 1.25%-2.20% on broadly syndicated loans subject to observable market depth and LIBOR plus 2.25% on all other eligible loans. 2 The Company entered into an interest rate swap agreement under which the Company receives a fixed interest rate of 2.700% and pays a floating rate of the three-month LIBOR plus 1.658% on a notional 11 amount of $350 million. 3 Liquidity was composed of $84.7 million of unrestricted cash and cash equivalents and $635.9 million of undrawn capacity under the credit facilities (subject to borrowing base and other limitations). 11
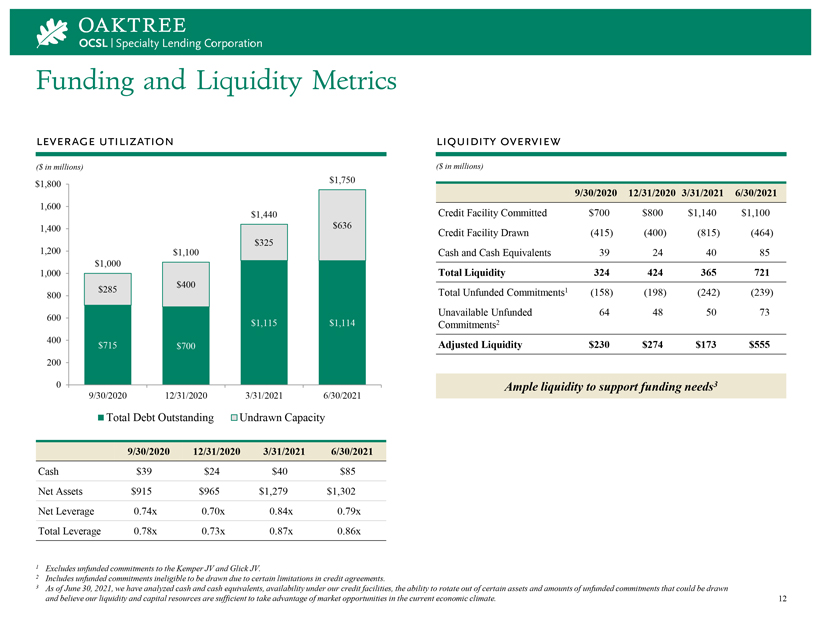
OAKTREE OSCL | Specialty Lending Corporation Funding and Liquidity Metrics LEVERAGE UTILIZATION LIQUIDITY OVERVIEW ($ in millions) ($ in millions) $1,800 $1,750 9/30/2020 12/31/2020 3/31/2021 6/30/2021 1,600 $1,440 Credit Facility Committed $700 $800 $1,140 $1,100 1,400 $636 $325 Credit Facility Drawn (415) (400) (815) (464) 1,200 $1,100 Cash and Cash Equivalents 39 24 40 85 $1,000 1,000 Total Liquidity 324 424 365 721 $400 800 $285 Total Unfunded Commitments1 (158) (198) (242) (239) Unavailable Unfunded 64 48 50 73 600 $1,115 $1,114 Commitments2 400 Adjusted Liquidity $230 $274 $173 $555 $715 $700 200 Ample liquidity to support funding needs 3 9/30/2020 12/31/2020 3/31/2021 6/30/2021 Total Debt Outstanding Undrawn Capacity 9/30/2020 12/31/2020 3/31/2021 6/30/2021 Cash $39 $24 $40 $85 Net Assets $915 $965 $1,279 $1,302 Net Leverage 0.74x 0.70x 0.84x 0.79x Total Leverage 0.78x 0.73x 0.87x 0.86x 1 Excludes unfunded commitments to the Kemper JV and Glick JV. 2 Includes unfunded commitments ineligible to be drawn due to certain limitations in credit agreements. 3 As of June 30, 2021, we have analyzed cash and cash equivalents, availability under our credit facilities, the ability to rotate out of certain assets and amounts of unfunded commitments that could be drawn and believe our liquidity and capital resources are sufficient to take advantage of market opportunities inthe current economic climate. 12

OAKTREE OCSL Specialty Lending Corporation Strategic Joint Ventures are Accretive to Earnings OCSL’S JOINT VENTURES ARE INCOME-ENHANCING VEHICLES THAT PRIMARILY INVEST IN SENIOR SECURED LOANS OF MIDDLE MARKET COMPANIES AND OTHER CORPORATE DEBT SECURITIES Key Attributes of Joint Ventures:• Equity ownership: 87.5% OCSL and 12.5% joint venture partner• Shared voting control: 50% OCSL and 50% joint venture partnerKEMPER JV CHARACTERISTICS GLICK JV CHARACTERISTICS(At fair value) (At fair value) $133mm OCSL’S INVESTMENTS IN THE KEMPER JV 5.7% % OF OCSL’S PORTFOLIO $3.3mm NET INVESTMENT INCOME1 $55mm OCSL’S INVESTMENTS IN THE GLICK JV 2.4%% OF OCSL’S PORTFOLIO $1.4mm NET INVESTMENT INCOME2 COMBINED PORTFOLIO SUMMARY PORTFOLIO COMPANY WTD. AVG. DEBT PORTFOLIO INVESTMENT PORTFOLIO FIRST LIEN COUNT YIELD LEVERAGE RATIO $490mm 95% 63 6.0% 1.3x As of June 30, 2021 13 1 Represents OCSL’s 87.5% share of the Kemper JV’s net investment income (excluding subordinated note interest expense) earned during the quarter ended June 30, 2021.2 Represents OCSL’s 87.5% share of the Glick JV’s net investment income (excluding subordinated note interest expense) earned during the quarter ended June 30, 2021.

Compelling Performance Under Oaktree ManagementNAV AND CUMULATIVE DISTRIBUTIONS PAID PER SHARE $10.009.008.00 $1.28 $1.41 $1.16 7.00 $0.56 $0.66 $0.75 $1.05 $0.47 $0.94 $0.18 $0.37 $0.09 $0.286.00 $0.855.004.00 $7.09 $7.22 $6.60 $6.60 $6.61 $6.85 $6.55 $6.49 $5.95 $6.09 $6.19 $6.09 $5.81 $5.87$5.343.002.001.0012/31/17 3/31/18 6/30/18 9/30/18 12/31/18 3/31/19 6/30/19 9/30/19 12/31/19 3/31/20 6/30/20 9/30/20 12/31/20 3/31/21 6/30/21NAV Per Share Cumulative Distributions Paid Per Share 1OCSL has generated a 12.0% annualized return on equity under Oaktree management2 1 Cumulative distributions declared and paid from December 31, 2017 through June 30, 2021. 2 Annualized return on equity calculated as the change in net asset value plus distributions paid from December 31, 2017 through June 30, 2021. 14
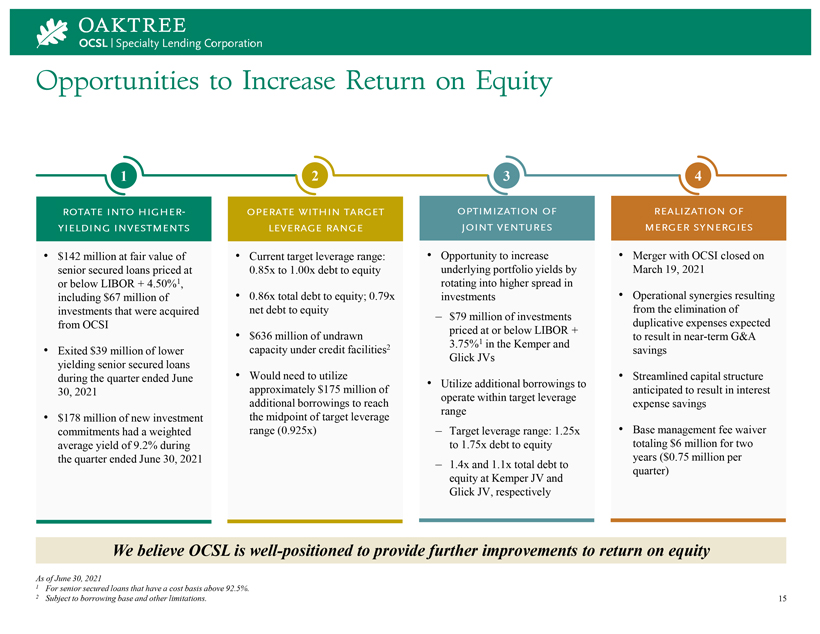
Opportunities to Increase Return on Equity 1 ROTATE INTO HIGHER-YIELDING INVESTMENT • $142 million at fair value of senior secured loans priced at or below LIBOR + 4.50%1, including $67 million of investments that were acquired from OCSI • Exited $39 million of lower yielding senior secured loans during the quarter ended June 30, 2021 • $178 million of new investment commitments had a weighted average yield of 9.2% during the quarter ended June 30, 2021 2 OPERATE WITHIN TARGET LEVERAGE RANGE • Current target leverage range: 0.85x to 1.00x debt to equity • 0.86x total debt to equity; 0.79x net debt to equity • $636 million of undrawn capacity under credit facilities2 • Would need to utilize approximately $175 million of additional borrowings to reach the midpoint of target leverage range (0.925x) 3 OPTIMIZATION OF JOINT VENTURES • Opportunity to increase underlying portfolio yields by rotating into higher spread in investments – $79 million of investments priced at or below LIBOR + 3.75%1 in the Kemper and Glick JVs • Utilize additional borrowings to operate within target leverage range – Target leverage range: 1.25x to 1.75x debt to equity – 1.4x and 1.1x total debt to equity at Kemper JV and Glick JV, respectively 4 REALIZATION OF MERGER SYNERGIES • Merger with OCSI closed on March 19, 2021 • Operational synergies resulting from the elimination of duplicative expenses expected to result in near-term G&A savings • Streamlined capital structure anticipated to result in interest expense savings • Base management fee waiver totaling $6 million for two years ($0.75 million per quarter) We believe OCSL is well-positioned to provide further improvements to return on equity As of June 30, 2021 1 For senior secured loans that have a cost basis above 92.5%. 2 Subject to borrowing base and other limitations. 15
Appendix OAKTREE OCSL Specialty Lending Corporation
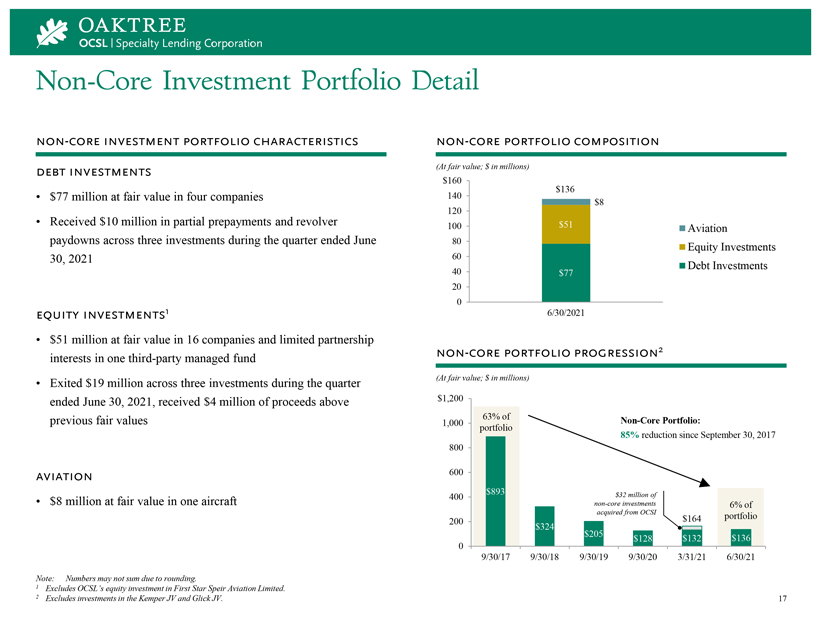
Non-Core Investment Portfolio Detail NON-CORE INVESTMENT PORTFOLIO CHARACTERISTICS DEBT INVESTMENTS • $77 million at fair value in four companies • Received $10 million in partial prepayments and revolver paydowns across three investments during the quarter ended June 30, 2021 EQUITY INVESTMENTS1 • $51 million at fair value in 16 companies and limited partnership interests in one third-party managed fund • Exited $19 million across three investments during the quarter ended June 30, 2021, received $4 million of proceeds above previous fair values AVIATION • $8 million at fair value in one aircraft Note: Numbers may not sum due to rounding. 1 Excludes OCSL’s equity investment in First Star Speir Aviation Limited. 2 Excludes investments in the Kemper JV and Glick JV. NON-CORE PORTFOLIO COMPOSITION (At fair value; $ in millions) $160 $136 140 $8 120 100 $51 Aviation 80 Equity Investments 60 Debt Investments 40 $77 20 0 6/30/2021 NON-CORE PORTFOLIO PROGRESSION2 (At fair value; $ in millions) $1,200 63% of Non-Core Portfolio: 1,000 portfolio 85% reduction since September 30, 2017 800 600 $893 $32 million of 400 non-core investments 6% of acquired from OCSI portfolio 200 $164 $324 $205 $128 $132 $136 0 9/30/17 9/30/18 9/30/19 9/30/20 3/31/21 6/30/21 17
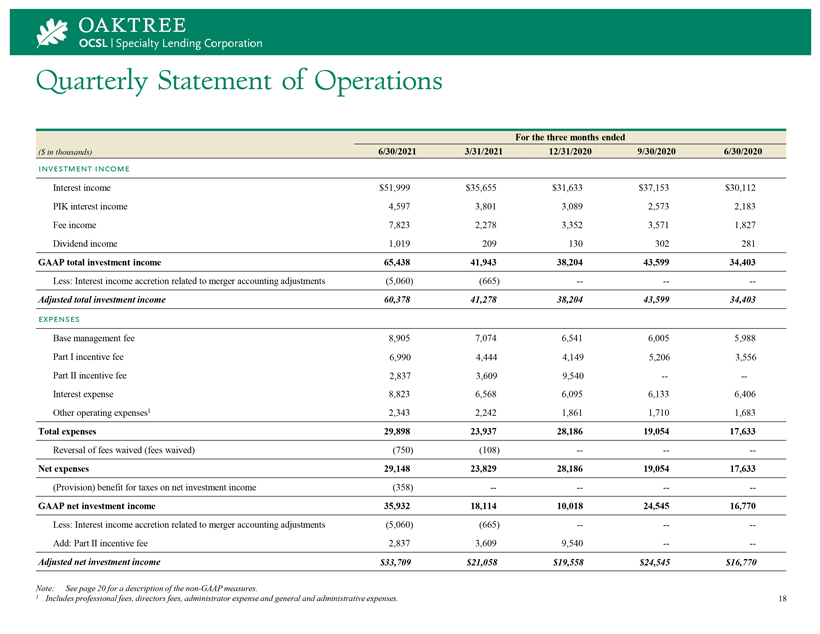
OAK TREE OSCL | Speciality Leading Corporation Quarterly Statement of Operations For the three months ended ($ in thousands) 6/30/2021 3/31/2021 12/31/2020 9/30/2020 6/30/2020 INVESTMENT INCOME Interest income $51,999 $35,655 $31,633 $37,153 $30,112 PIK interest income 4,597 3,801 3,089 2,573 2,183 Fee income 7,823 2,278 3,352 3,571 1,827 Dividend income 1,019 209 130 302 281 GAAP total investment income 65,438 41,943 38,204 43,599 34,403 Less: Interest income accretion related to merger accounting adjustments (5,060) (665) -——- Adjusted total investment income 60,378 41,278 38,204 43,599 34,403 EXPENSES Base management fee 8,905 7,074 6,541 6,005 5,988 Part I incentive fee 6,990 4,444 4,149 5,206 3,556 Part II incentive fee 2,837 3,609 9,540 -—-Interest expense 8,823 6,568 6,095 6,133 6,406 Other operating expenses1 2,343 2,242 1,861 1,710 1,683 Total expenses 29,898 23,937 28,186 19,054 17,633 Reversal of fees waived (fees waived) (750) (108) -——- Net expenses 29,148 23,829 28,186 19,054 17,633 (Provision) benefit for taxes on net investment income (358) -———- GAAP net investment income 35,932 18,114 10,018 24,545 16,770 Less: Interest income accretion related to merger accounting adjustments (5,060) (665) -——-Add: Part II incentive fee 2,837 3,609 9,540 -—- Adjusted net investment income $33,709 $21,058 $19,558 $24,545 $16,770 Note: See page 20 for a description of the non-GAAP measures. 1 Includes professional fees, directors fees, administrator expense and general and administrative expenses. 18
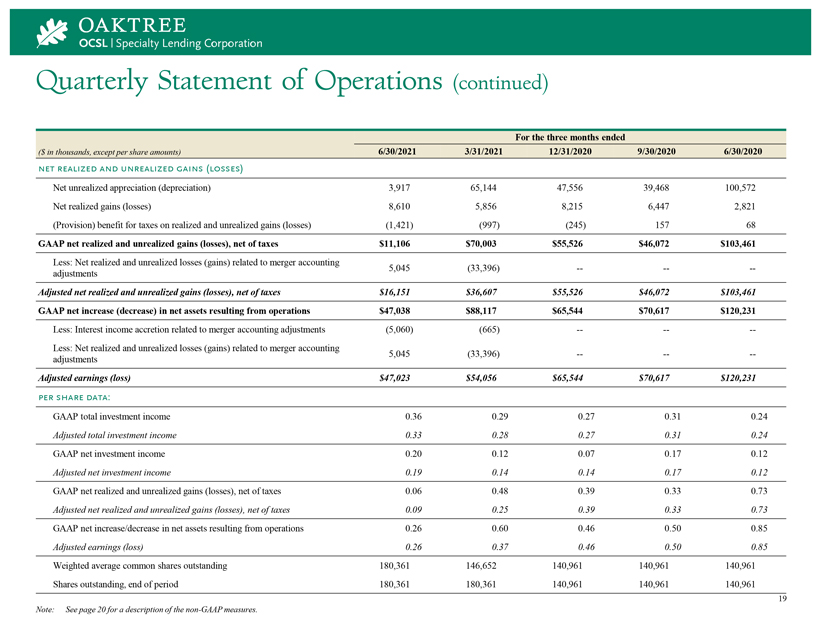
OAK TREE OSCL | Speciality Leading Corporation Quarterly Statement of Operations (continued) For the t hree months ended ($ in thousands, except per share amounts) 6/30/2021 3/31/2021 12/31/2020 9/30/2020 6/30/2020 NET REALIZED AND UNREALIZED GAINS (LOSSES) Net unrealized appreciation (depreciation) 3,917 65,144 47,556 39,468 100,572 Net realized gains (losses) 8,610 5,856 8,215 6,447 2,821 (Provision) benefit for taxes on realized and unrealized gains (losses) (1,421) (997) (245) 157 68 GAAP net realized and unrealized gains (losses), net of taxes $11,106 $70,003 $55,526 $46,072 $103,461 Less: Net realized and unrealized losses (gains) related to merger accounting 5,045 (33,396) -——-adjustments Adjusted net realized and unrealized gains (losses), net of taxes $16,151 $36,607 $55,526 $46,072 $103,461 GAAP net increase (decrease) in net assets resulting from operations $47,038 $88,117 $65,544 $70,617 $120,231 Less: Interest income accretion related to merger accounting adjustments (5,060) (665) -——-Less: Net realized and unrealized losses (gains) related to merger accounting 5,045 (33,396) -——-adjustments Adjusted earnings (loss) $47,023 $54,056 $65,544 $70,617 $120,231 PER SHARE DATA: GAAP total investment income 0.36 0.29 0.27 0.31 0.24 Adjusted total investment income 0.33 0.28 0.27 0.31 0.24 GAAP net investment income 0.20 0.12 0.07 0.17 0.12 Adjusted net investment income 0.19 0.14 0.14 0.17 0.12 GAAP net realized and unrealized gains (losses), net of taxes 0.06 0.48 0.39 0.33 0.73 Adjusted net realized and unrealized gains (losses), net of taxes 0.09 0.25 0.39 0.33 0.73 GAAP net increase/decrease in net assets resulting from operations 0.26 0.60 0.46 0.50 0.85 Adjusted earnings (loss) 0.26 0.37 0.46 0.50 0.85 Weighted average common shares outstanding 180,361 146,652 140,961 140,961 140,961 Shares outstanding, end of period 180,361 180,361 140,961 140,961 140,961 19 Note: See page 20 for a description of the non-GAAP measures.19
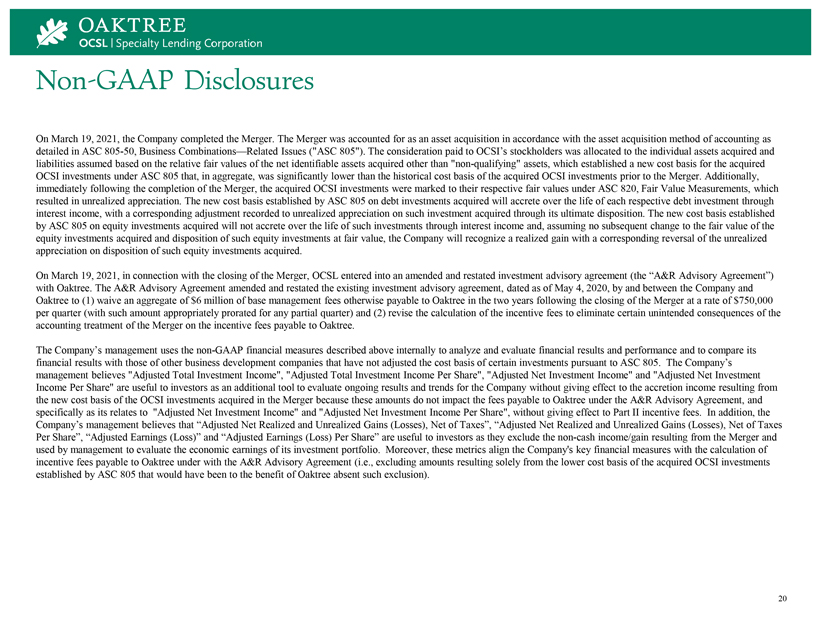
Non-GAAP Disclosures On March 19, 2021, the Company completed the Merger. The Merger was accounted for as an asset acquisition in accordance with the asset acquisition method of accounting as detailed in ASC 805-50, Business Combinations—Related Issues (“ASC 805”). The consideration paid to OCSI’s stockholders was allocated to the individual assets acquired and liabilities assumed based on the relative fair values of the net identifiable assets acquired other than “non-qualifying” assets, which established a new cost basis for the acquired OCSI investments under ASC 805 that, in aggregate, was significantly lower than the historical cost basis of the acquired OCSI investments prior to the Merger. Additionally, immediately following the completion of the Merger, the acquired OCSI investments were marked to their respective fair values under ASC 820, Fair Value Measurements, which resulted in unrealized appreciation. The new cost basis established by ASC 805 on debt investments acquired will accrete over the life of each respective debt investment through interest income, with a corresponding adjustment recorded to unrealized appreciation on such investment acquired through its ultimate disposition. The new cost basis established by ASC 805 on equity investments acquired will not accrete over the life of such investments through interest income and, assuming no subsequent change to the fair value of the equity investments acquired and disposition of such equity investments at fair value, the Company will recognize a realized gain with a corresponding reversal of the unrealized appreciation on disposition of such equity investments acquired. On March 19, 2021, in connection with the closing of the Merger, OCSL entered into an amended and restated investment advisory agreement (the “A&R Advisory Agreement”) with Oaktree. The A&R Advisory Agreement amended and restated the existing investment advisory agreement, dated as of May 4, 2020, by and between the Company and Oaktree to (1) waive an aggregate of $6 million of base management fees otherwise payable to Oaktree in the two years following the closing of the Merger at a rate of $750,000 per quarter (with such amount appropriately prorated for any partial quarter) and (2) revise the calculation of the incentive fees to eliminate certain unintended consequences of the accounting treatment of the Merger on the incentive fees payable to Oaktree. The Company’s management uses the non-GAAP financial measures described above internally to analyze and evaluate financial results and performance and to compare its financial results with those of other business development companies that have not adjusted the cost basis of certain investments pursuant to ASC 805. The Company’s management believes “Adjusted Total Investment Income”, “Adjusted Total Investment Income Per Share”, “Adjusted Net Investment Income” and “Adjusted Net Investment Income Per Share” are useful to investors as an additional tool to evaluate ongoing results and trends for the Company without giving effect to the accretion income resulting from the new cost basis of the OCSI investments acquired in the Merger because these amounts do not impact the fees payable to Oaktree under the A&R Advisory Agreement, and specifically as its relates to “Adjusted Net Investment Income” and “Adjusted Net Investment Income Per Share”, without giving effect to Part II incentive fees. In addition, the Company’s management believes that “Adjusted Net Realized and Unrealized Gains (Losses), Net of Taxes”, “Adjusted Net Realized and Unrealized Gains (Losses), Net of Taxes Per Share”, “Adjusted Earnings (Loss)” and “Adjusted Earnings (Loss) Per Share” are useful to investors as they exclude the non-cash income/gain resulting from the Merger and used by management to evaluate the economic earnings of its investment portfolio. Moreover, these metrics align the Company’s key financial measures with the calculation of incentive fees payable to Oaktree under with the A&R Advisory Agreement (i.e., excluding amounts resulting solely from the lower cost basis of the acquired OCSI investments established by ASC 805 that would have been to the benefit of Oaktree absent such exclusion). 20
Serious News for Serious Traders! Try StreetInsider.com Premium Free!
You May Also Be Interested In
- Medicure Receives US FDA Fast Track Designation for MC-1 for PNPO Deficiency
- Desert Gold Announces Non-Brokered Private Placement and CAD $910,000 in Lead Orders
- Cabbacis Files Annual Report and Closes First Tranche of IPO
Create E-mail Alert Related Categories
SEC FilingsSign up for StreetInsider Free!
Receive full access to all new and archived articles, unlimited portfolio tracking, e-mail alerts, custom newswires and RSS feeds - and more!
