

Form 8-K Mondee Holdings, Inc. For: Aug 15
 Tweet
Tweet Share
Share
UNITED STATES
SECURITIES AND EXCHANGE COMMISSION
Washington, D.C. 20549
FORM
CURRENT REPORT
PURSUANT TO SECTION 13 OR 15(D)
OF THE SECURITIES EXCHANGE ACT OF 1934
Date of Report (Date of earliest event reported):
(Exact name of registrant as specified in its charter)
| (State or other jurisdiction of incorporation) |
(Commission File Number) |
(I.R.S. Employer Identification No.) |
|
|
||
| (Address of principal executive offices) | (Zip Code) |
(
(Registrant’s telephone number, including area code)
Not Applicable
(Former name or former address, if changed since last report)
Check the appropriate box below if the Form 8-K is intended to simultaneously satisfy the filing obligation of the registrant under any of the following provisions:
| Written communications pursuant to Rule 425 under the Securities Act | |
| Soliciting material pursuant to Rule 14a-12 under the Exchange Act | |
| Pre-commencement communications pursuant to Rule 14d-2(b) under the Exchange Act | |
| Pre-commencement communications pursuant to Rule 13e-4(c) under the Exchange Act |
Securities registered pursuant to Section 12(b) of the Act:
| Title of each class | Trading Symbol(s) |
Name of each exchange on which registered | ||
| The | ||||
| The |
Indicate by check mark whether the registrant is an emerging growth company as defined in Rule 405 of the Securities Act of 1933 (§230.405 of this chapter) or Rule 12b-2 of the Securities Exchange Act of 1934 (§240.12b-2 of this chapter).
Emerging growth company
If an emerging growth company, indicate
by check mark if the registrant has elected not to use the extended transition period for complying with any new or revised financial
accounting standards provided pursuant to Section 13(a) of the Exchange Act.
Item 2.02 Results of Operations and Financial Condition.
On August 15, 2022, Mondee Holdings, Inc. (“Mondee” or the “Company”) issued a press release (the “Press Release”) announcing its financial results for the second quarter ended June 30, 2022 (the “Second Quarter Financial Results”), and posted a presentation (the “Presentation”) for investors in the Company that includes the Second Quarter Financial Results to its website. A copy of the Press Release is attached as Exhibit 99.1 to this current report on Form 8-K and a copy of the Presentation is attached as Exhibit 99.2 to this current report on Form 8-K and each is incorporated by reference herein.
Item 7.01 Regulation FD Disclosure.
Mondee announces material information to the public about Mondee, its products and services, and other matters through a variety of means, including filings with the Securities and Exchange Commission, press releases, public conference calls, webcasts, the investor relations section of its website (investors.mondee.com), its LinkedIn page (linkedin.com/company/mondee-inc/), its Instagram account (@mondee_inc), its Facebook page (facebook.com/OfficialMondeeInc), and its Twitter account (@mondee_official) in order to achieve broad, non-exclusionary distribution of information to the public and for complying with its disclosure obligations under Regulation FD.
The information in Item 2.02 and Item 7.01 of this Current Report on Form 8-K, and Exhibit 99.1 and Exhibit 99.2 attached hereto, shall not be deemed “filed” for purposes of Section 18 of the Securities Exchange Act of 1934, as amended (the “Exchange Act”) or otherwise subject to the liabilities of that section, nor shall it be deemed incorporated by reference in any filing under the Securities Act of 1933, as amended, or the Exchange Act, except as shall be expressly set forth by specific reference in such a filing.
Item 9.01 Financial Statements and Exhibits.
(d) Exhibits.
| Exhibit No. | Description | |
| 99.1 | Press Release issued by Mondee Holdings, Inc. dated August 15, 2022 | |
| 99.2 | Investor Presentation dated August 15, 2022 | |
| 104 | Cover Page Interactive Data File (Cover page XBRL tags are embedded within the Inline XBRL document) | |
SIGNATURES
Pursuant to the requirements of the Securities Exchange Act of 1934, the Registrant has duly caused this report to be signed on its behalf by the undersigned hereunto duly authorized.
| MONDEE HOLDINGS, INC. | ||
| Dated: August 15, 2022 | ||
| By: | /s/ Dan Figenshu | |
| Name: Dan Figenshu | ||
| Title: Chief Financial Officer | ||
Exhibit 99.1

Mondee Announces Second Quarter 2022 Financial Results
- Gross Revenue of $614.8M Increased 180% Year-Over-Year
- Net Revenue of $42.7M Increased 81% Year-Over-Year
- Adjusted EBITDA of $4.4M Increased from $0 in the Same Quarter Last Year
- Initiates 2022 Annual Guidance of Net Revenue Expected to Reach $150-160M
- Began Trading July 19th on the Nasdaq under the “MOND” ticker
AUSTIN, Texas - Mondee Holdings, Inc. (Nasdaq: MOND) (“Mondee” or the “Company”), the high-growth, travel technology company and marketplace, with a portfolio of globally recognized platforms and brands in the leisure and corporate travel sectors, today announced financial results for the second quarter ended June 30, 2022. Mondee completed a business combination with ITHAX Acquisition Corp., a Cayman Islands exempted company (“ITHAX”), on July 18, 2022 and since July 19, 2022, it has been trading on The Nasdaq Stock Market (“Nasdaq”) under the ticker symbol “MOND”.
“We are thrilled to commence our journey as a Nasdaq-listed company with a year-over-year improvement of nearly 3x in gross revenue and nearly 2x in net revenue in the second quarter, driven by adoption of our next-gen travel-tech platform, recovery in international leisure travel, and agile go-to-market investments. In addition, as we scale, we continue to deliver profitability with adjusted EBITDA doubling quarter-over-quarter,” said Prasad Gundumogula, Chairman, Chief Executive Officer, and Founder of Mondee. “This high-growth performance has been achieved despite some inflation and recession headwinds in addition to travel restrictions continuing to impact our key Asian markets,” continued Mr. Gundumogula. “We look forward to leveraging our publicly-traded status and post-merger capital structure to execute acquisitions of companies that fit our strategic vision.”
Second Quarter 2022 Financial Highlights
| ● | Gross revenue of $614.8 million was up 180% year-over-year as compared to $219.7 million in the second quarter of 2021 (“2Q21”). |
| ● | Net revenue of $42.7 million was up 81% year-over-year as compared to $23.6 million in 2Q21. |
| ● | Net Loss was $2.1 million, an improvement of $10.8 million as compared to a 2Q21 Net Loss of $12.9 million. |
| ● | Adjusted EBITDA was $4.4 million, an improvement of $4.4 million as compared to a 2Q21 Adjusted EBITDA of $0.0. |
Financial Summary and Operating Results
Year-Over-Year Quarterly Comparison
| For the quarter ended June 30* | Year-Over-Year Δ | |||||||||||||||
| 2Q22 Actual | 2Q21 Actual | % | ||||||||||||||
| Transactions | 549,729 | 377,720 | 172,009 | 45.5 | % | |||||||||||
| Revenue, Gross | $ | 614.8 | $ | 219.7 | $ | 395.1 | 179.8 | % | ||||||||
| Revenue, Net | $ | 42.7 | $ | 23.6 | $ | 19.1 | 80.9 | % | ||||||||
| Net Income (Loss) | $ | (2.1 | ) | $ | (12.9 | ) | $ | 10.8 | 83.7 | % | ||||||
| Loss per share (EPS) | $ | (0.03 | ) | $ | (0.16 | ) | $ | 0.13 | 83.7 | % | ||||||
| Adjusted EBITDA | $ | 4.4 | $ | (0.0 | ) | $ | 4.4 | n/m | ||||||||
| Adjusted Net Income (Loss) | $ | (3.0 | ) | $ | (6.3 | ) | $ | 3.3 | 53.0 | % | ||||||
| Adjusted EPS | $ | (0.03 | ) | $ | (0.07 | ) | $ | 0.04 | 53.0 | % | ||||||
Quarter-Over-Quarter 2022 Comparison
| For the quarters ended June 30*and March 31* | Quarter-Over-Quarter Δ | |||||||||||||||
| 2Q22 Actual | 1Q22 Actual | % | ||||||||||||||
| Transactions | 549,729 | 462,931 | 86,798 | 18.7 | % | |||||||||||
| Revenue, Gross | $ | 614.8 | $ | 469.3 | $ | 145.5 | 31.0 | % | ||||||||
| Revenue, Net | $ | 42.7 | $ | 37.7 | $ | 5.0 | 13.3 | % | ||||||||
| Net Income (Loss) | $ | (2.1 | ) | $ | (7.0 | ) | $ | 4.9 | 70.0 | % | ||||||
| Loss per share (EPS) | $ | (0.03 | ) | $ | (0.09 | ) | $ | 0.06 | 70.0 | % | ||||||
| Adjusted EBITDA | $ | 4.4 | $ | 2.2 | $ | 2.2 | 100.2 | % | ||||||||
| Adjusted Net Income (Loss) | $ | (3.0 | ) | $ | (4.4 | ) | $ | 1.5 | 33.0 | % | ||||||
| Adjusted EPS | $ | (0.03 | ) | $ | (0.05 | ) | $ | 0.02 | 33.0 | % | ||||||
Year-Over-Year Six-Month Comparison
| For the six months ended June 30* | Year-Over-Year Δ | |||||||||||||||
| 2022 Actual | 2021 Actual | % | ||||||||||||||
| Transactions | 1,012,660 | 640,426 | 372,235 | 58.1 | % | |||||||||||
| Revenue, Gross | $ | 1,078.1 | $ | 370.2 | $ | 707.9 | 191.2 | % | ||||||||
| Revenue, Net | $ | 80.3 | $ | 37.1 | $ | 43.3 | 116.8 | % | ||||||||
| Net Income (Loss) | $ | (9.1 | ) | $ | (25.6 | ) | $ | 16.5 | 64.5 | % | ||||||
| Loss per share (EPS) | $ | (0.11 | ) | $ | (0.32 | ) | $ | 0.20 | 64.5 | % | ||||||
| Adjusted EBITDA | $ | 6.6 | $ | (4.0 | ) | $ | 10.6 | n/m | ||||||||
| Adjusted Net Income (Loss) | $ | (8.2 | ) | $ | (16.6 | ) | $ | 8.3 | 50.3 | % | ||||||
| Adjusted EPS | $ | (0.09 | ) | $ | (0.18 | ) | $ | 0.09 | 50.3 | % | ||||||
*in millions, except transactions, per share data, and percentages
*Note that second quarter 2022 financial results of Mondee do not give effect to the business combination with ITHAX.
Financial Commentary
“We are excited by the continued growth of adjusted EBITDA profitability, especially given that our second-quarter performance was driven entirely by organic revenue growth. We have used part of the liquidity provided by our business combination with ITHAX to optimize our capital structure, which also serves to reduce interest expense going forward. We are now turning our attention towards implementing our planned M&A strategy,” said Dan Figenshu, Chief Financial Officer of Mondee.
Financial 2022 Outlook
Mondee is providing the following projections for its full-year ending December 31, 2022. We expect to continue delivering profitable growth despite a backdrop of global inflation and an evolving travel recovery.
| ● | Net Revenue is projected to be in the range of $150 million to $160 million, representing year-over-year growth of 66% at the midpoint. |
| ● | Adjusted EBITDA is projected to be in the range of $15 million to $22 million, representing year-over-year growth of 436% and a margin of 12% at the midpoint. |
Business Highlights
| ● | Mondee completed its business combination with ITHAX on July 18, 2022 and started trading on Nasdaq under the ticker “MOND” as of July 19, 2022. The Company announced a new board of directors with diverse and extensive experiences in public companies, including Orestes Fintiklis’ appointment as Vice Chairman and Chief Strategy and Business Development Officer. |
| ● | The Company added another dimension to its global content hub in the activities and events space to include access to theme parks, theater tickets, and sporting events through its strategic partnership with EBG Solutions (“EBG”). In addition, Mondee will provide its technology platform to EBG to include packaged travel solutions for an extensive set of travel and airline products . |
| ● | The Company expanded access through multiple closed-user groups to over 125 million members, up from the 10 million announced in the first quarter of 2022, for its TripPlanet and white labeled solutions. This expansion of access was accomplished largely through strategic partnerships with groups like Gallagher Affinity and more recently EBG, the latter with more than 40,000 participating companies. Attention is now turning to increasing the adoption rate within this expansive network. |
| ● | During the first half of 2022 travel-recovery, Mondee launched agile, targeted marketing initiatives to capitalize on the earliest opening international markets, resulting in 218% growth in its European-region business, taking this region to 27% of total mix of transactions, in June 2022 from 12% in January 2022. |
Conference Call Information
Mondee will host a conference call today at 5:30 a.m. (PST) / 7:30 a.m. (CST) / 8:30 a.m. (EST) to discuss its financial results with the investment community. A live webcast of the event will be available on the Mondee Investor Relations website at http://investors.mondee.com. A live dial-in is available domestically at (844) 200-6205 and internationally at +1 (929) 526-1599, passcode 315548.
A webcast replay will be available on the Mondee Investor Relations website and an audio replay will be available domestically at (866) 813-9403 or internationally at +44 (204) 525-0658, passcode 920386, until midnight (ET) September 5, 2022.
About Mondee
Mondee is a group of leading travel technology, service, and content companies driving disruptive innovative change in the leisure and corporate travel markets. They deliver a revolutionary technology platform of SaaS, mobile, and cloud products and services to a global customer base, processing over 50 million daily searches and multi-billion dollars of transactional volume yearly. The Company is connecting a network of 50,000+ leisure travel advisors and gig economy workers to 500+ airlines and over 1 million hotel and vacation rentals, packaged solutions and ancillary offerings. Founded in 2011, Mondee is headquartered in Austin, Texas, with 17 offices in the USA and Canada, and operations in India, Thailand, and Ireland. On July 18, 2022, Mondee completed a business combination with ITHAX and has been trading as a publicly listed company on Nasdaq since July 19, 2022 under the ticker symbol “MOND”. For more information, please visit https://www.mondee.com.
Non-GAAP Measurements:
In addition to disclosing financial measures prepared in accordance with generally accepted accounting principles in the United States (GAAP), this press release and the accompanying tables include adjusted EBITDA non-GAAP net income, and non-GAAP EPS.
These non-GAAP financial measures are not calculated in accordance with GAAP as they have been adjusted to exclude the effects of stock-based compensation expenses, provision for income taxes, and the impacts of depreciation and amortization. We define Adjusted EBITDA as net loss before depreciation and amortization, provision for income taxes, interest expense (net), other income net, stock-based compensation, and gain on forgiveness of PPP loans. Non-GAAP net income (loss) is defined as net loss before the impacts of amortization of intangibles, provision for income taxes, stock-based compensation, and one time items. Non-GAAP net income (loss) per share is defined as non-GAAP net income (loss) on a per share basis. See "Reconciliation of GAAP to Non-GAAP Financial Measures" for a discussion of the applicable weighted-average shares outstanding.
We believe these non-GAAP financial measures provide investors and other users of our financial information consistency and comparability with our past financial performance and facilitate period-to-period comparisons of our results of operations. With respect to adjusted EBITDA and non-GAAP net loss/ income, we believe these non-GAAP financial measures are useful in evaluating our profitability relative to the amount of revenue generated, excluding the impact of stock-based compensation expense and other one-time expenses. We also believe non-GAAP financial measures are useful in evaluating our operating performance compared to that of other companies in our industry, as these metrics eliminate the effects of stock-based compensation, which may vary for reasons unrelated to overall operating performance.
We use these non-GAAP financial measures in conjunction with traditional GAAP measures as part of our overall assessment of our performance, including the preparation of our annual operating budget and quarterly forecasts, and to evaluate the effectiveness of our business strategies. Our definition may differ from the definitions used by other companies and therefore comparability may be limited. In addition, other companies may not publish this or similar metrics. Thus, our non-GAAP financial measures should be considered in addition to, not as a substitute for, nor superior to or in isolation from, measures prepared in accordance with GAAP.
These non-GAAP financial measures may be limited in their usefulness because they do not present the full economic effect of our use of stock-based compensation. We compensate for these limitations by providing investors and other users of our financial information a reconciliation of the non-GAAP financial measure to the most closely related GAAP financial measures. However, we have not reconciled the non-GAAP guidance measures disclosed under "Financial Outlook" to their corresponding GAAP measures because certain reconciling items such as stock-based compensation and the corresponding provision for income taxes depend on factors such as the stock price at the time of award of future grants and thus cannot be reasonably predicted. Accordingly, reconciliations to the non-GAAP guidance measures is not available without unreasonable effort. We encourage investors and others to review our financial information in its entirety, not to rely on any single financial measure and to view non-GAAP net loss/ income and non-GAAP net loss/ income per share in conjunction with net loss and net loss per share.
Operating Metrics:
This press release also includes certain operating metrics that we believe are useful in providing additional information in assessing the overall performance of our business.
Transactions are defined as the aggregation of transactions handled by our platform between a third party seller or service provider and the ultimate consumer. A single transaction could include an airline ticket, a hotel or hospitality accommodation, and any number of ancillaries offered on the platform. We generate revenue from service fees earned on these transactions and, accordingly our revenue increases or decreases based on the increase or decrease in either or both the number or value of transactions we process. Revenue will increase as a result of an increase in the number of customers using Mondee’s platform and/or as a result of an increase in service fees from higher value services offered on the platform.
Forward-Looking Statements:
This press release contains “forward-looking statements” within the meaning of federal securities law. Forward-looking statements can be identified by words such as: “believe,” “can”, “"may,” “expects,” “intends,” “potential,” “plans,” “will” and similar references to future periods. Examples of forward-looking statements include, among others, statements we make regarding future growth, performance, business prospects and opportunities, future plans and intentions or other future events are forward looking statements. Such forward-looking statements are subject to risks, uncertainties, and other factors, which could cause actual results to differ materially from those expressed or implied by such forward-looking statements.
These forward-looking statements are based upon estimates and assumptions that, while considered reasonable by the Company and its management, are inherently uncertain. The Company cautions you that these forward-looking statements are subject to risks and uncertainties, most of which are difficult to predict and many of which are beyond the control of the Company. Factors that may cause actual results to differ materially from current expectations include, but are not limited to, the ability to implement business plans, forecasts, and other expectations after the recently completed business combination between ITHAX Acquisition Corp. and Mondee Holdings II, Inc., the outcome of any legal proceedings that may be instituted against the Company or others and any definitive agreements with respect thereto, the ability to recognize the anticipated benefits of the business combination, which may be affected by, among other things, competition, the ability of the Company to grow and manage growth profitably, maintain relationships with customers and suppliers and retain its management and key employees, the ability to meet Nasdaq’s listing standards, and other risks and uncertainties set forth in the sections entitled “Risk Factors” and “Cautionary Note Regarding Forward-Looking Statements” in the Company’s registration statement on Form S-4 relating to the business combination declared effective by the U.S. Securities and Exchange Commission (the “SEC”) on June 27, 2022, the Company’s Current Report on Form 8-K filed with the SEC on July 20, 2022, and in the Company’s subsequent filings with the SEC. There may be additional risks that the Company does not presently know of or that the Company currently believe are immaterial that could also cause actual results to differ from those contained in the forward-looking statements.
Nothing in this press release should be regarded as a representation by any person that the forward-looking statements set forth herein will be achieved or that any of the contemplated results of such forward-looking statements will be achieved. You should not place undue reliance on forward-looking statements, which speak only as of the date they are made, and the Company expressly disclaims any obligation or undertaking to disseminate any updates or revisions to any forward-looking statement to reflect events or circumstances after the date on which such statement is being made, or to reflect the occurrence of unanticipated events.
Reconciliation of GAAP to Non-GAAP Measures:
| For the quarter ended June 30 | Year-Over-Year Δ | |||||||||||||||
| 2Q22 Actual | 2Q21 Actual | % | ||||||||||||||
| Net Income (Loss) | $ | (2.1 | ) | $ | (12.9 | ) | $ | 10.8 | 83.7 | % | ||||||
| Interest expense, (net) | $ | 6.5 | $ | 5.7 | $ | 0.7 | 12.8 | % | ||||||||
| Stock-based comp exp | $ | 0.1 | $ | 3.8 | $ | (3.7 | ) | (98.0 | %) | |||||||
| Depreciation & amortization | $ | 2.8 | $ | 3.3 | $ | (0.5 | ) | (16.3 | %) | |||||||
| Income tax provision | $ | 0.2 | $ | 0.1 | $ | 0.2 | 293.3 | % | ||||||||
| Gain on forgiveness of PPP loan | $ | (2.0 | ) | $ | 0.0 | $ | (2.0 | ) | n/m | |||||||
| Other expense (income), net | $ | (1.0 | ) | $ | 0.0 | $ | (1.1 | ) | n/m | |||||||
| Adjusted EBITDA | $ | 4.4 | $ | 0.0 | $ | 4.4 | n/m | |||||||||
| For the quarters ended June 30 and March 31 | Quarter-Over-Quarter Δ | |||||||||||||||
| 2Q22 Actual | 1Q22 Actual | % | ||||||||||||||
| Net Income (Loss) | $ | (2.1 | ) | $ | (7.0 | ) | $ | 4.9 | 70.0 | % | ||||||
| Interest expense, (net) | $ | 6.5 | $ | 6.1 | $ | 0.4 | 6.0 | % | ||||||||
| Stock-based comp exp | $ | 0.1 | $ | 0.1 | $ | 0.0 | 0.0 | % | ||||||||
| Depreciation & amortization | $ | 2.8 | $ | 2.8 | $ | (1.0 | ) | (1.8 | %) | |||||||
| Income tax provision | $ | 0.2 | $ | 0.1 | $ | 0.2 | 329.1 | % | ||||||||
| Gain on forgiveness of PPP loan | $ | (2.0 | ) | $ | 0.0 | $ | (2.0 | ) | n/m | |||||||
| Other expense (income), net | $ | (1.0 | ) | $ | 0.2 | $ | (1.2 | ) | n/m | |||||||
| Adjusted EBITDA | $ | 4.4 | $ | 2.2 | $ | 2.2 | 100.2 | % | ||||||||
| For the six months ended June 30 | Year-Over-Year Δ | |||||||||||||||
| 2022 Actual | 2021 Actual | % | ||||||||||||||
| Net Income (Loss) | $ | (9.1 | ) | $ | (25.6 | ) | $ | 16.5 | 64.5 | % | ||||||
| Interest expense, (net) | $ | 12.6 | $ | 11.2 | $ | 1.4 | 12.6 | % | ||||||||
| Stock-based comp exp | $ | 0.2 | $ | 3.8 | $ | (3.6 | ) | (95.9 | %) | |||||||
| Depreciation & amortization | $ | 5.6 | $ | 6.5 | $ | (0.9 | ) | (14.4 | %) | |||||||
| Income tax provision | $ | 0.3 | $ | 0.1 | $ | 0.2 | 132.8 | % | ||||||||
| Gain on forgiveness of PPP loan | $ | (2.0 | ) | $ | 0.0 | $ | (2.0 | ) | n/m | |||||||
| Other expense (income), net | $ | (0.9 | ) | $ | 0.0 | $ | (0.9 | ) | n/m | |||||||
| Adjusted EBITDA | $ | 6.6 | $ | (4.0 | ) | $ | 10.6 | n/m | ||||||||
| For the quarter ended June 30 | Year-Over-Year Δ | |||||||||||||||
| 2Q22 Actual | 2Q21 Actual | % | ||||||||||||||
| Net Income (Loss) | $ | (2.1 | ) | $ | (12.9 | ) | $ | 10.8 | 83.7 | % | ||||||
| Stock-based comp exp | $ | 0.1 | $ | 3.8 | $ | (3.7 | ) | -98.0 | % | |||||||
| Amortization - intangibles | $ | 1.6 | $ | 1.6 | $ | 0.0 | 0.0 | % | ||||||||
| Income tax provision | $ | 0.2 | $ | 0.1 | $ | 0.2 | 293.3 | % | ||||||||
| One time expenses* | $ | (2.8 | ) | $ | 1.2 | $ | (3.9 | ) | n/m | |||||||
| Adjusted Net Income (Loss) | $ | (3.0 | ) | $ | (6.3 | ) | $ | 3.3 | 53.0 | % | ||||||
| For the quarters ended June 30 and March 31 | Quarter-Over-Quarter Δ | |||||||||||||||
| 2Q22 Actual | 1Q22 Actual | % | ||||||||||||||
| Net Income (Loss) | $ | (2.1 | ) | $ | (7.0 | ) | $ | 4.9 | 70.0 | % | ||||||
| Stock-based comp exp | $ | 0.1 | $ | 0.1 | $ | 0.0 | 0.0 | % | ||||||||
| Amortization - intangibles | $ | 1.6 | $ | 2.1 | $ | (0.5 | ) | (23.5 | )% | |||||||
| Income tax provision | $ | 0.2 | $ | 0.1 | $ | 0.2 | 329.1 | % | ||||||||
| One time expenses* | $ | (2.8 | ) | $ | 0.4 | $ | (3.1 | ) | n/m | |||||||
| Adjusted Net Income (Loss) | $ | (3.0 | ) | $ | (4.4 | ) | $ | 1.5 | 33.0 | % | ||||||
| For the six months ended June 30 | Year-Over-Year Δ | |||||||||||||||
| 2022 Actual | 2021 Actual | % | ||||||||||||||
| Net Income (Loss) | - | $ | (9.1 | ) | $ | (25.6 | ) | $ | 16.5 | 64.5 | % | |||||
| Stock-based comp exp | $ | 0.2 | $ | 3.8 | $ | (3.6 | ) | (95.9 | %) | |||||||
| Amortization - intangibles | $ | 3.2 | $ | 4.1 | $ | (1.0 | ) | (23.6 | %) | |||||||
| Income tax provision | $ | 0.3 | $ | 0.1 | $ | 0.2 | 132.8 | % | ||||||||
| One time expenses* | $ | (2.8 | ) | $ | 1.0 | $ | (3.8 | ) | n/m | |||||||
| Adjusted Net Income (Loss) | $ | (8.2 | ) | $ | (16.6 | ) | $ | 8.3 | 50.3 | % | ||||||
| For the quarter ended June 30 | Year-Over-Year Δ | |||||||||||||||
| 2Q22 Actual | 2Q21 Actual | % | ||||||||||||||
| Net Income (Loss) | $ | (2.1 | ) | $ | (12.9 | ) | $ | 10.8 | 83.7 | % | ||||||
| Share count** | 81.2 | 81.2 | 0.0 | 0.0 | % | |||||||||||
| GAAP EPS | $ | (0.03 | ) | $ | (0.16 | ) | $ | 0.13 | 83.7 | % | ||||||
| Adjusted Net Income (Loss) | $ | (3.0 | ) | $ | (6.3 | ) | $ | 3.3 | 53.0 | % | ||||||
| Share count (fully diluted)** | 93.7 | 93.7 | 0.0 | 0.0 | % | |||||||||||
| Adjusted EPS | $ | (0.03 | ) | $ | (0.07 | ) | $ | 0.04 | 53.0 | % | ||||||
| For the quarters ended June 30 and March 31 | Year-Over-Year Δ | |||||||||||||||
| 2Q22 Actual | 1Q22 Actual | % | ||||||||||||||
| Net Income (Loss) | $ | (2.1 | ) | $ | (7.0 | ) | $ | 4.9 | 70.0 | % | ||||||
| Share count** | 81.2 | 81.2 | 0.0 | 0.0 | % | |||||||||||
| GAAP EPS | $ | (0.03 | ) | $ | (0.09 | ) | $ | 0.06 | 70.0 | % | ||||||
| Adjusted Net Income (Loss) | $ | (3.0 | ) | $ | (4.4 | ) | $ | 1.5 | 33.0 | % | ||||||
| Share count (fully diluted)** | 93.7 | 93.7 | 0.0 | 0.0 | % | |||||||||||
| Adjusted EPS | $ | (0.03 | ) | $ | (0.05 | ) | $ | 0.02 | 33.0 | % | ||||||
| For the six months ended June 30 | Year-Over-Year Δ | |||||||||||||||
| 2022 Actual | 2021 Actual | % | ||||||||||||||
| Net Income (Loss) | $ | (9.1 | ) | $ | (25.6 | ) | 16.5 | 64.5 | % | |||||||
| Share count** | 81.2 | 81.2 | 0.0 | 0.0 | % | |||||||||||
| GAAP EPS | $ | (0.11 | ) | $ | (0.32 | ) | $ | 0.20 | 64.5 | % | ||||||
| Adjusted Net Income (Loss) | $ | (8.2 | ) | $ | (16.6 | ) | $ | 8.3 | 50.3 | % | ||||||
| Share count (fully diluted)** | 93.7 | 93.7 | 0.0 | 0.0 | % | |||||||||||
| Adjusted EPS | $ | (0.09 | ) | $ | (0.18 | ) | $ | 0.09 | 50.3 | % | ||||||
* One time expenses are primarily PPP Loan related for 2022
** Share count is proforma as of the date of the business combination
For Further Information, Contact:
Public Relations
[email protected]
Investor Relations
[email protected]
Exhibit 99.2

COMPANY OVERVIEW August 2022 THE FUTURE OF TRAVEL, NOW

© 2022 All Rights Reserved | 2 Safe Harbor Statement (Under the Private Securities Litigation Reform Act of 1995) This presentation contains “forward - looking statements” within the meaning of federal securities law . Forward - looking statements can be identified by words such as : “believe,” “can”, “"may,” “expects,” “intends,” “potential,” “plans,” “will” and similar references to future periods . Examples of forward - looking statements include, among others, statements we make regarding future growth, performance, business prospects and opportunities, future plans and intentions or other future events are forward looking statements . Such forward - looking statements are subject to risks, uncertainties, and other factors, which could cause actual results to differ materially from those expressed or implied by such forward - looking statements . These forward - looking statements are based upon estimates and assumptions that, while considered reasonable by the Company and its management, are inherently uncertain . The Company cautions you that these forward - looking statements are subject to risks and uncertainties, most of which are difficult to predict and many of which are beyond the control of the Company . Factors that may cause actual results to differ materially from current expectations include, but are not limited to, the ability to implement business plans, forecasts, and other expectations after the recently completed business combination between ITHAX Acquisition Corp . and Mondee Holdings II, Inc . , the outcome of any legal proceedings that may be instituted against the Company or others and any definitive agreements with respect thereto, the ability to recognize the anticipated benefits of the business combination, which may be affected by, among other things, competition, the ability of the Company to grow and manage growth profitably, maintain relationships with customers and suppliers and retain its management and key employees, the ability to meet Nasdaq’s listing standards, and other risks and uncertainties set forth in the sections entitled “Risk Factors” and “Cautionary Note Regarding Forward - Looking Statements” in the Company’s registration statement on Form S - 4 relating to the business combination declared effective by the U . S . Securities and Exchange Commission (the “SEC”) on June 27 , 2022 , the Company’s Current Report on Form 8 - K filed with the SEC on July 20 , 2022 , and in the Company’s subsequent filings with the SEC . There may be additional risks that the Company does not presently know of or that the Company currently believe are immaterial that could also cause actual results to differ from those contained in the forward - looking statements . Nothing in this press release should be regarded as a representation by any person that the forward - looking statements set forth herein will be achieved or that any of the contemplated results of such forward - looking statements will be achieved . You should not place undue reliance on forward - looking statements, which speak only as of the date they are made, and the Company expressly disclaims any obligation or undertaking to disseminate any updates or revisions to any forward - looking statement to reflect events or circumstances after the date on which such statement is being made, or to reflect the occurrence of unanticipated events .

© 2022 All Rights Reserved | 3 Capitalized on Market Recovery ● Agile marketing initiative investments ● Targeting fastest recovering international regions ● Positioned for second half upside in late - recovering markets Chairman’s Message Mondee’s second quarter 2022 accomplishments in key areas were marked by … Prasad Gundumogula Chairman, Chief Executive Officer, and Founder Continued to Evolve Next - Generation Travel - Tech Platform ● GenZ/Millennial traveler, Gig Economy worker focus ● Commenced full Proof - of - Concept pilot with major customers ● Accelerating traction with hotels & vacation rentals and ancillary solutions Positioned for Accretive M&A Strategy ● Completed public - company debut on July 19, 2022 ● Capital and public market currency to fuel M&A strategy Delivered Strong Results ● Gross revenue of $614.8 million was up 180% year - over - year ● Net revenue of $42.7 million was up 81% year - over - year ● Adjusted EBITDA* was $4.4 million, an improvement of $4.4 million from 2Q21 *Please refer to the Appendix of this presentation for non - GAAP reconciliation tables.

© 2022 All Rights Reserved | 4 Capitalizing on Travel Recovery and New Market Channels ● Agile repositioning to fastest recovering international regions ● Poised to benefit from Asia recovery in second half of 2022 ● Expansion of access to over 125 million closed - user group members ● Almost 3X increase in daily tickets for our closed - user - group business and drove ~3x year - over - year improvement in gross revenue ~2x net revenue 46% Increase in Transactions *Source: internal Mondee analysis 5% 19% 6% 19% 14% 6% 30% 2% 7& 9% 7% 25% 17% 8% 28% 1% 0% 5% 10% 15% 20% 25% 30% 35% Africa Asia Central and South America Europe Indian Subcontinent Middle East North America South Pacific Transaction % by Region 2022-Q2 2019-Q2

Mondee Modern Marketplace CONTENT DISTRIBUTION TECH PLATFORM Air Hotels and Vacation Rentals Ancillaries Cars Packages Cruises Theme Parks, Activities & Events User Generated Content Omni - Channel Booking Platform Conversational Commerce Global Content Hub Fin - Tech Mar - Tech CRM CMS BI, Data Analytics & Dashboards TripPro Leisure Platform Gig Economy Workers Influencers, Cohorts Home - Based Agents TripPlanet Closed - User Group Platform Self Serviced Travel Cost - Sensitive Return - to - Travel Member Based Travel SERVICE HUB Crowd Source Service Hub Local Experts - Content Curation Gig Economy Falcon Retail Platform Curated, Personalized Content Omini Channel Shopping Subscription Services

© 2022 All Rights Reserved | 6 Net - Gen Travel - Tech Platform *Source: internal Mondee analysis Travel Tech & Distribution Platform Activity TripPro GIG Platform - Pilot in progress with major customers in Gig - workers space TripPlanet CUG Platform - Achieved ~4X transaction growth from Jan to June 2022 Fin - Tech Platform - Achieved 184% year - over - year revenue growth in 2Q22 Global Content Hub Activity Enhanced Content Hub with more Hotels and vacation rentals, Air content, Ancillaries globally Working on expanding into Cruises, Theme Parks, Activities, and Events

© 2022 All Rights Reserved | 7 Implementing M&A Growth Strategy We believe that our post - merger capital structure and public - market currency positions Mondee well to rapidly build on our accretive M&A platform. Content Technology Distribution Robust Pipeline of Current Opportunities Public Company Debut *Source: internal Mondee analysis # Target Companies 1 Hotels 2 Air, Hotel 3 Package 5 Cruise 6 Seven Other (Air, Hotel, Package, Tour, Corporate)

© 2022 All Rights Reserved | 8 2Q22 Financial Results Gross Revenue +180% YoY $614.8M Net Revenue +81% YoY $42.7M Adjusted EBITDA* $4.4M Up from $0 in 2Q21 Adjusted EPS* $(0.04) +$0.03 YoY +31% QoQ +13% QoQ Up from $2.2M in 1Q22 +$0.02 QoQ *Please refer to the Appendix of this presentation for non - GAAP reconciliation tables.

© 2022 All Rights Reserved | 9 1H22 Financial Results Gross Revenue +708% YoY $1,078M Net Revenue +117% YoY $80.3M Adjusted EBITDA* $6.6M Up from $(4.0) in 1H21 Adjusted EPS* $(0.09) +$0.09 YoY *Please refer to the Appendix of this presentation for non - GAAP reconciliation tables.

© 2022 All Rights Reserved | 10 2022 Financial Outlook Net Revenue is projected to be in the range of $155 million to $160 million , representing YoY growth of 66% at the midpoint. Adjusted EBITDA is projected to be in the range of $15 million to $22 million , Representing YoY growth of 436% and a margin of 12%, at the midpoint.

INVESTOR BRIEFING MARCH 2022 APPENDIX

© 2022 All Rights Reserved | 12 Post - Merger Capital Structure July 18, 2022 Mondee completed its business combination with ITHAX Acquisition Corp. July 19, 2022 Mondee started trading on Nasdaq under the ticker “MOND” Mondee collected $70 million from the equity PIPE transaction consummated at the closing of the business combination and used part of that liquidity to optimize its capital stru cture and reduce net debt by $40 million to $157 million. As of August 12, 2022 Mondee had outstanding 81,247,218 of Class A common stock (74,747,218 shares plus 6,500,000 unvested earnout shares) and 12,412,500 redeemable warrants representing the right to purchase one share of Class A common stock. PIPE: 7,000,000 (in process of being registered) Warrants: 12,412,500 ($11.50 strike price) Earnout: 6,500,000 (granted but not vested; another 2,500,000 not assigned) Class A shares subject to a lockup: 66,233,750 (6 - month lockup)

© 2022 All Rights Reserved | 13 Non - GAAP Measurements In addition to disclosing financial measures prepared in accordance with U . S . generally accepted accounting principles (GAAP), this press release and the accompanying tables include adjusted EBITDA non - GAAP net income, and non - GAAP EPS . These non - GAAP financial measures are not calculated in accordance with GAAP as they have been adjusted to exclude the effects of stock - based compensation expenses, provision for income taxes, and the impacts of depreciation and amortization . We define Adjusted EBITDA as net loss before depreciation and amortization, provision for income taxes, interest expense (net), other income net, stock - based compensation, and gain on forgiveness of PPP loans . Non - GAAP net income (loss) is defined as net loss before the impacts of amortization of intangibles, provision for income taxes, stock - based compensation, and one time items . Non - GAAP net income (loss) per share is defined as non - GAAP net income (loss) on a per share basis . See "Reconciliation of GAAP to Non - GAAP Financial Measures" for a discussion of the applicable weighted - average shares outstanding . We believe these non - GAAP financial measures provide investors and other users of our financial information consistency and comparability with our past financial performance and facilitate period - to - period comparisons of our results of operations . With respect to adjusted EBITDA and non - GAAP net loss/ income, we believe these non - GAAP financial measures are useful in evaluating our profitability relative to the amount of revenue generated, excluding the impact of stock - based compensation expense and other one - time expenses . We also believe non - GAAP financial measures are useful in evaluating our operating performance compared to that of other companies in our industry, as these metrics eliminate the effects of stock - based compensation, which may vary for reasons unrelated to overall operating performance . We use these non - GAAP financial measures in conjunction with traditional GAAP measures as part of our overall assessment of our performance, including the preparation of our annual operating budget and quarterly forecasts, and to evaluate the effectiveness of our business strategies . Our definition may differ from the definitions used by other companies and therefore comparability may be limited . In addition, other companies may not publish this or similar metrics . Thus, our non - GAAP financial measures should be considered in addition to, not as a substitute for, nor superior to or in isolation from, measures prepared in accordance with GAAP . These non - GAAP financial measures may be limited in their usefulness because they do not present the full economic effect of our use of stock - based compensation . We compensate for these limitations by providing investors and other users of our financial information a reconciliation of the non - GAAP financial measure to the most closely related GAAP financial measures . However, we have not reconciled the non - GAAP guidance measures disclosed under "Financial Outlook" to their corresponding GAAP measures because certain reconciling items such as stock - based compensation and the corresponding provision for income taxes depend on factors such as the stock price at the time of award of future grants and thus cannot be reasonably predicted . Accordingly, reconciliations to the non - GAAP guidance measures is not available without unreasonable effort . We encourage investors and others to review our financial information in its entirety, not to rely on any single financial measure and to view non - GAAP net loss/ income and non - GAAP net loss/ income per share in conjunction with net loss and net loss per share .
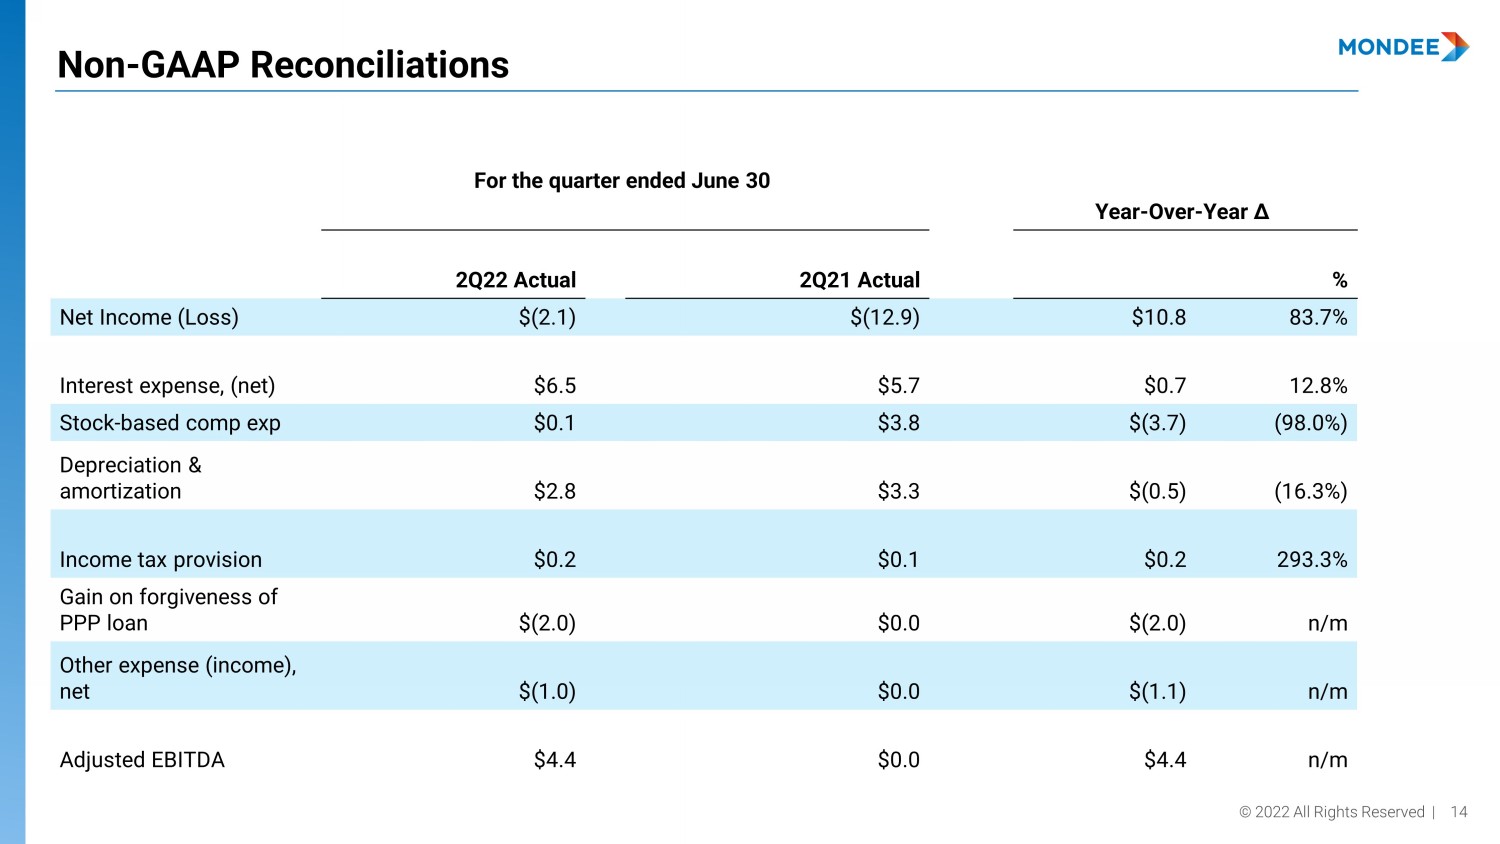
© 2022 All Rights Reserved | 14 Non - GAAP Reconciliations For the quarter ended June 30 Year - Over - Year Δ 2Q22 Actual 2Q21 Actual % Net Income (Loss) $(2.1) $(12.9) $10.8 83.7% Interest expense, (net) $6.5 $5.7 $0.7 12.8% Stock - based comp exp $0.1 $3.8 $(3.7) (98.0%) Depreciation & amortization $2.8 $3.3 $(0.5) (16.3%) Income tax provision $0.2 $0.1 $0.2 293.3% Gain on forgiveness of PPP loan $(2.0) $0.0 $(2.0) n/m Other expense (income), net $(1.0) $0.0 $(1.1) n/m Adjusted EBITDA $4.4 $0.0 $4.4 n/m

© 2022 All Rights Reserved | 15 Non - GAAP Reconciliations For the quarters ended June 30 and March 31 Quarter - Over - Quarter Δ 2Q22 Actual 1Q22 Actual % Net Income (Loss) $(2.1) $(7.0) $4.9 70.0% Interest expense, (net) $6.5 $6.1 $0.4 6.0% Stock - based comp exp $0.1 $0.1 $0.0 0.0% Depreciation & amortization $2.8 $2.8 $(1.0) (1.8%) Income tax provision $0.2 $0.1 $0.2 329.1% Gain on forgiveness of PPP loan $(2.0) $0.0 $(2.0) n/m Other expense (income), net $(1.0) $0.2 $(1.2) n/m Adjusted EBITDA $4.4 $2.2 $2.2 100.2%

© 2022 All Rights Reserved | 16 Non - GAAP Reconciliations For the six months ended June 30 Year - Over - Year Δ 2022 Actual 2021 Actual % Net Income (Loss) $(9.1) $(25.6) $16.5 64.5% Interest expense, (net) $12.6 $11.2 $1.4 12.6% Stock - based comp exp $0.2 $3.8 $(3.6) (95.9%) Depreciation & amortization $5.6 $6.5 $(0.9) (14.4%) Income tax provision $0.3 $0.1 $0.2 132.8% Gain on forgiveness of PPP loan $(2.0) $0.0 $(2.0) n/m Other expense (income), net $(0.9) $0.0 $(0.9) n/m Adjusted EBITDA $6.6 $(4.0) $10.6 n/m

© 2022 All Rights Reserved | 17 Non - GAAP Reconciliations For the quarter ended June 30 Year - Over - Year Δ 2Q22 Actual 2Q21 Actual % Net Income (Loss) $(2.1) $(12.9) $10.8 83.7% Stock - based comp exp $0.1 $3.8 $(3.7) - 98.0% Amortization - intangibles $1.6 $1.6 $0.0 0.0% Income tax provision $0.2 $0.1 $0.2 293.3% One time expenses* $(2.8) $1.2 $(3.9) n/m Adjusted Net Income (Loss) $(3.0) $(6.3) $3.3 53.0% * One time expenses are primarily PPP Loan related for 2022 ** Share count is proforma as of the date of the business combination
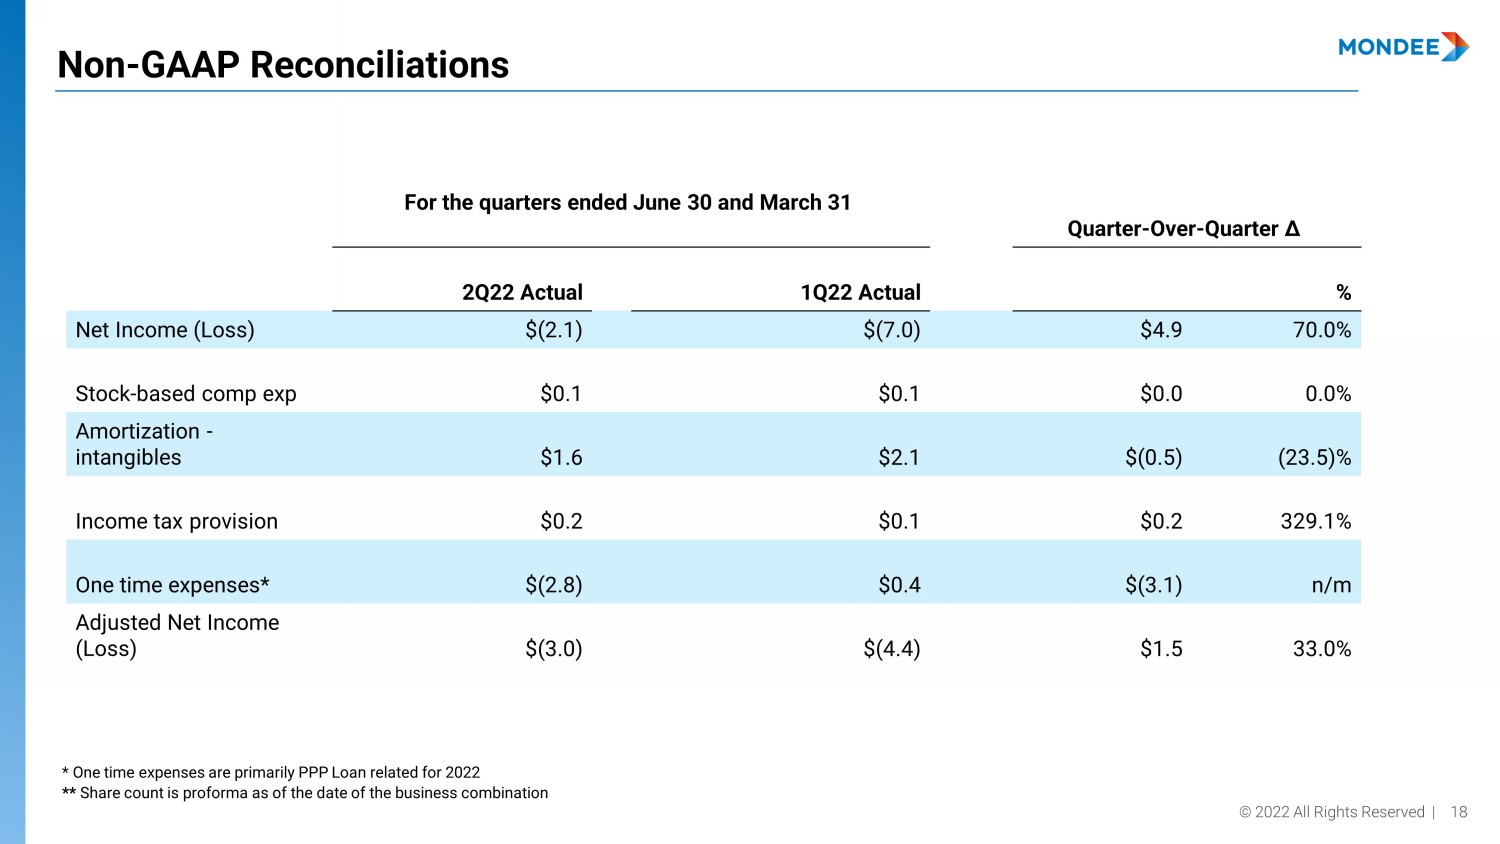
© 2022 All Rights Reserved | 18 Non - GAAP Reconciliations For the quarters ended June 30 and March 31 Quarter - Over - Quarter Δ 2Q22 Actual 1Q22 Actual % Net Income (Loss) $(2.1) $(7.0) $4.9 70.0% Stock - based comp exp $0.1 $0.1 $0.0 0.0% Amortization - intangibles $1.6 $2.1 $(0.5) (23.5)% Income tax provision $0.2 $0.1 $0.2 329.1% One time expenses* $(2.8) $0.4 $(3.1) n/m Adjusted Net Income (Loss) $(3.0) $(4.4) $1.5 33.0% * One time expenses are primarily PPP Loan related for 2022 ** Share count is proforma as of the date of the business combination

© 2022 All Rights Reserved | 19 Non - GAAP Reconciliations For the six months ended June 30 Year - Over - Year Δ 2022 Actual 2021 Actual % Net Income (Loss) - $(9.1) $(25.6) $16.5 64.5% Stock - based comp exp $0.2 $3.8 $(3.6) (95.9%) Amortization - intangibles $3.2 $4.1 $(1.0) (23.6%) Income tax provision $0.3 $0.1 $0.2 132.8% One time expenses* $(2.8) $1.0 $(3.8) n/m Adjusted Net Income (Loss) $(8.2) $(16.6) $8.3 50.3% * One time expenses are primarily PPP Loan related for 2022 ** Share count is proforma as of the date of the business combination

© 2022 All Rights Reserved | 20 Non - GAAP Reconciliations For the quarter ended June 30 Year - Over - Year Δ 2Q22 Actual 2Q21 Actual % Net Income (Loss) $(2.1) $(12.9) $10.8 83.7% Share count** 81.2 81.2 0.0 0.0% GAAP EPS $(0.03) $(0.16) $0.13 83.7% Adjusted Net Income (Loss) $(3.0) $(6.3) $3.3 53.0% Share count (fully diluted)** 93.7 93.7 0.0 0.0% Adjusted EPS $(0.03) $(0.07) $0.04 53.0% * One time expenses are primarily PPP Loan related for 2022 ** Share count is proforma as of the date of the business combination

© 2022 All Rights Reserved | 21 Non - GAAP Reconciliations For the quarters ended June 30 and March 31 Year - Over - Year Δ 2Q22 Actual 1Q22 Actual % Net Income (Loss) $(2.1) $(7.0) $4.9 70.0% Share count** 81.2 81.2 0.0 0.0% GAAP EPS $(0.03) $(0.09) $0.06 70.0% Adjusted Net Income (Loss) $(3.0) $(4.4) $1.5 33.0% Share count (fully diluted)** 93.7 93.7 0.0 0.0% Adjusted EPS $(0.03) $(0.05) $0.02 33.0% * One time expenses are primarily PPP Loan related for 2022 ** Share count is proforma as of the date of the business combination

© 2022 All Rights Reserved | 22 Non - GAAP Reconciliations For the six months ended June 30 Year - Over - Year Δ 2022 Actual 2021 Actual % Net Income (Loss) $(9.1) $(25.6) 16.5 64.5% Share count** 81.2 81.2 0.0 0.0% GAAP EPS $(0.11) $(0.32) $0.20 64.5% Adjusted Net Income (Loss) $(8.2) $(16.6) $8.3 50.3% Share count (fully diluted)** 93.7 93.7 0.0 0.0% Adjusted EPS $(0.09) $(0.18) $0.09 50.3% * One time expenses are primarily PPP Loan related for 2022 ** Share count is proforma as of the date of the business combination

INVESTOR BRIEFING MARCH 2022 FULL INVESTOR PRESENTATION

© 2022 All Rights Reserved | 24 Mondee Business Summary Hi - Growth and Profitable Travel Technology Company and Marketplace Proven M&A Platform Successfully acquired and integrated 14 companies, driving exponential revenue growth in the Mondee ecosystem and achieving significant synergies Mondee is both a growth & value play $3B 1 Gross Revenue, approx. 40% Organic - 62% Inorganic CAGR 2 2015 - 19, 2019: $171M Adjusted Net Revenue, $40M Adjusted EBITDA 3 Modern Marketplace and Technology Platform disrupting the $1tn assisted/affiliated travel market Marketplace seamlessly connecting travel suppliers with gig agents, corporations and consumers on state - of - the - art operating system disrupting legacy incumbent platforms Proven management team Decades of travel & technology industry experience, track record of growth & navigating the pandemic Modern disruptive Technology Platform and interface Indispensable operating system to travel ecosystem, disrupting legacy OTA and incumbent platforms Significant barriers to entry Market leadership protected by triple moat on content, distribution and unique technology 1: 3bn = total sales volume in 2019 and 171m = net revenue for 2019 financial year; 2. 40% = organic CAGR (based off business in p lace in 2015) and 62% = CAGR including accretive M&A during the period; 3. Adjusted EBITDA is a non - GAAP financial measure, calculated as Net Loss before depreciation and amortizat ion, provision for income taxes, interest expense (net), other income net, stock - based compensation, and gain on forgiveness of PPP loans. See “Disclaimer - Non - GAAP Financial Measures ”

© 2022 All Rights Reserved | 25 Disrupting a segment of the $2T global travel market Capitalizing on an early opportunity to disrupt the assisted/affiliated travel segment…. Global travel market, 2019 Bookings = $1.9T 47% 53% $0.9T $1.0T Self - Service Consumer Travel Low Tech, No Touch Assisted/Affiliated Travel Old Tech, High Touch Metasearch Airline, Hotel, Car Rental Sites OTAs Gig Economy Workers Travel Agencies Clubs & Closed User Groups SMEs & Businesses TMCs Current operating systems are on legacy technology Sources: IBIS, PhocusWright
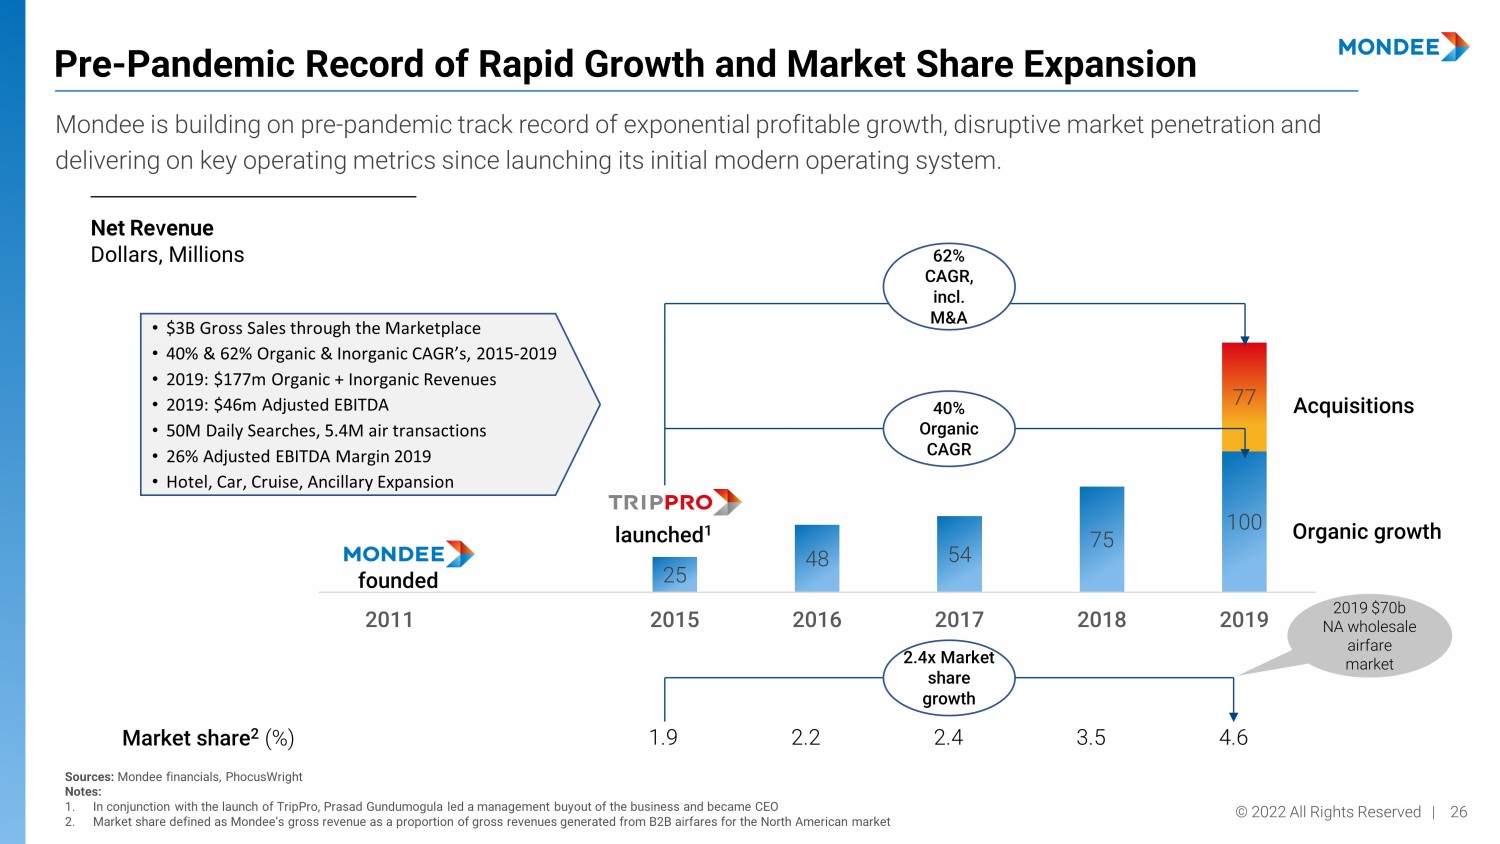
© 2022 All Rights Reserved | 26 Pre - Pandemic Record of Rapid Growth and Market Share Expansion Net Revenue Dollars, Millions Acquisitions Organic growth Sources: Mondee financials, PhocusWright Notes: 1. In conjunction with the launch of TripPro, Prasad Gundumogula led a management buyout of the business and became CEO 2. Market share defined as Mondee’s gross revenue as a proportion of gross revenues generated from B2B airfares for the North Am eri can market Market share 2 (%) 1.9 2.2 2.4 3.5 4.6 25 48 54 75 100 77 2011 2012-14 2015 2016 2017 2018 2019 62% CAGR, incl. M&A founded 40% Organic CAGR launched 1 2.4x Market share growth Mondee is building on pre - pandemic track record of exponential profitable growth, disruptive market penetration and delivering on key operating metrics since launching its initial modern operating system. • $3B Gross Sales through the Marketplace • 40% & 62% Organic & Inorganic CAGR’s, 2015 - 2019 • 2019: $177m Organic + Inorganic Revenues • 2019: $46m Adjusted EBITDA • 50M Daily Searches, 5.4M air transactions • 26% Adjusted EBITDA Margin 2019 • Hotel, Car, Cruise, Ancillary Expansion 2019 $70b NA wholesale airfare market

© 2022 All Rights Reserved | 27 Mondee’s Platform Overcoming Challenges – Mondee’s Modern Travel Marketplace Platform Mondee’s platform connects travel suppliers with consumers and their businesses, optimizing for all stakeholders Hoteliers Airlines Suppliers Wholesalers Ancillary providers Mondee helps suppliers optimize inventory and utilize excess capacity Legacy Distribution Technology Platforms COMAND ... xxxx COMAND ... xxxx COMAND COMAND ... xxxx COMAND COMAND COMAND ... xxxx COMAND ... xxxx COMAND ... xxxx Travel Agent 1. Incomplete content (e.g., no low - cost carriers, no alternative accommodations) 2. Text - based; not extendable to mobile 3. Lack of modern messaging capabilities 4. Credit - card focused for payments 5. Inability to link search results and marketing messaging Consumers Mondee helps customers modernize technology, gain access to broader content and narrowcast their distribution 1. Comprehensive global content 2. Modern user experience, extendable to Mobile 3. Full suite of communication tools – integrated phone, email, SMS, chat 4. Fintech platform, tailored to the travel market 5. Multi - channel marketing platform Corporations Travel Agents SME’s & Nonprofits Consumers (subscription members)

© 2022 All Rights Reserved | 28 A Modern Marketplace Travel Suppliers • Excess Inventory Channel • Niche Market Targeting • Revenue & Yield Optimization • Value Added Distribution Gig Economy Workers • Agile Operating System • Full Suite of Business Tools • Full Content Access Membership Organizations • Member Benefits • Value - based Programs • Self Service Platforms Small and Medium - Sized Businesses • Personalized Employee Engagement • Value - priced Content • Reduced Travel Spend • Engagement - to - reporting Management Leisure Travelers • Curated Content, Personalized Experiences • Hybrid Platforms - Self - service & Assisted • Value - priced • Any - device Connectivity Partners • Transaction Volume • Rich Content Sharing • FinTech Solutions The next generation consumer is here ... always connected, information empowered ... requiring a new marketplace and modern engagement models . Mondee is that marketplace ... adding significant value to ALL players in the travel ecosystem Mondee - A Modern Marketplace for the Gig Economy • NextGen Operating system • Rich & Global Content Hub • Full FinTech • Conversational Commerce • MarTech enabled • Mobile - forward

© 2022 All Rights Reserved | 29 The Gig traveler is setting the pace for change in the travel industry Pre 2000s 2010s 2020s 2025s… Traveler Generation Needs & Requirements Intermediaries & Distribution Solutions: Products & Services Boomers Gen X Millennials Gen Z Gig Traveler Experiential Content Aggregated Content Real - Time, Always On “Bleisure” Groups Multi - Tasker/Role Functionality Personalization Price Sensitive Self - Service Support Accessibility to inventory Online Support FOMO Supplier Direct Email Online Agencies (OLA, OTA) Metasearch Engines NDC Text Travel Memberships & Clubs Gig Agents Social Commerce AI & Machine Learning Web Electronic Payment Cloud Privacy Timeline Pricing/Fare Transparency Travel Agencies Personal Computing Search - based Content Social Media Connected Consumer Curated Content Online Mobile Conversational Commerce GDSs Travel Agents Home - Based Agents Gig Economy Workers Influencers, Cohorts Shifting Influence Levels Travel Affiliates Managed Travel Cost - Sensitive Return - to - Travel Self Serviced Travel Member - Based Travel SMEs, Corporate Mondee’s technology has continuously delivered the platforms to meet the evolving traveler needs…

© 2022 All Rights Reserved | 30 New 3D marketplace with an Uber - like Technology Platform Multi - dimension differentiators backed by our technology platform….positioning Mondee as a true crowd - sourced marketplace Technology Platform Conversational Commerce FinTech Self Enrollment & Service MarTech Channels & Networks Consumers & Travelers Closed User Groups, Gig Networks, SMEs, etc. Micro Networks & Consumer Personas Crowd - Sourced Services, Curation Differentiated Content Activities Cruises Car Hotel Air User Generated Public Content Exclusive Content Crowd - Sourced Content Service through crowd - sourced gig workers Curated Content & Personalized Experiences Gig Workers are Contributors

© 2022 All Rights Reserved | 31 Mondee’s products now serve a variety of different customer segments across the B2B travel landscape Best - in - Class Products Tailored for the Gig Economy Travel Market Launch date 2015 2013 (acquired in 2020) June 2021 August 2021 Target segment ■ Travel agents ■ TMCs ■ Large corporations ■ SMEs ■ Nonprofits ■ Membership organizations ■ Subscribers, including consumer members Description Platform for travel search, booking, and more Incentive platform that reduces corporate travel spending Discount online booking site, with enhanced service Discount online subscription - based booking Customer base 50,000+ agents 50+ corporations 125M+ members Soft launch/testing

© 2022 All Rights Reserved | 32 6 Consolidator focused on the Middle East and Southeast Asia Hariworld 7 Tour company with extensive content Aavan Vacations 1 Largest N. American consolidator serving the Indian subcontinent Skylink 2 Retail flight business and technology platform Exploretrip 3 Metasearch engine cFares 4 Largest N. American consolidator serving Asia C&H 6 Canadian consolidator Leto Travel 1 Retail travel company with extensive call center operations LBF Travel 2 Hotel content hub Hotelwiz 4 Travel club platform Avia Travel 5 Largest and fastest growing N. American wholesaler Cosmopolitan Travel Services 7 Corporate travel incentives platform Rocketrip 5 Largest N. American wholesaler serving South America and the South Pacific TransAm 2011 2012 2013 - 2018 2019 2020 FOUNDATION COVID - 19 Mondee has been successful in executing and maximizing the value of acquisitions, regardless of market conditions Proven Ability to Execute On Synergistic Acquisitions Content Technology Distribution 3 Marketing and ad platform for travel Bookingwiz Strong track record of accretive M&A with 14 acquisitions Doubled - down during the pandemic to expand products and brands
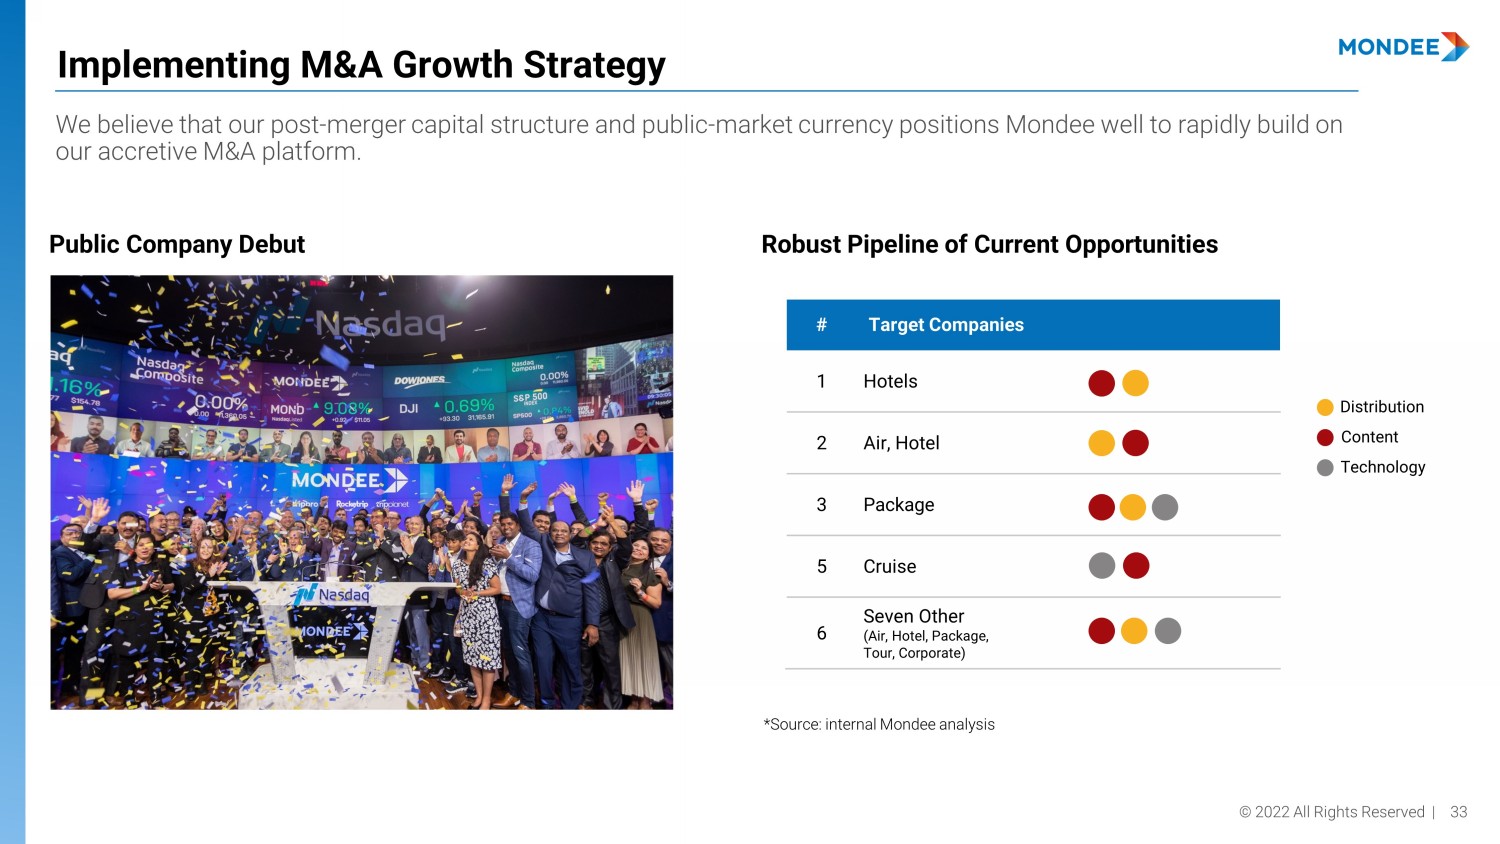
© 2022 All Rights Reserved | 33 Implementing M&A Growth Strategy We believe that our post - merger capital structure and public - market currency positions Mondee well to rapidly build on our accretive M&A platform. Content Technology Distribution Robust Pipeline of Current Opportunities Public Company Debut *Source: internal Mondee analysis # Target Companies 1 Hotels 2 Air, Hotel 3 Package 5 Cruise 6 Seven Other (Air, Hotel, Package, Tour, Corporate)

© 2022 All Rights Reserved | 34 Dan Figenshu CFO Experienced CFO and entrepreneur. Former Rocketrip, Mic, The Blaze Venkat Pasupuleti CTO Experienced CTO and entrepreneur, Former Avesta, Zoom Interview, Eze Technologies Yuvraj Datta CCO Experienced travel executive focused on supplier and revenue management, Former Skylink Mondee is led by a team of seasoned entrepreneurs and executives, who – together – have 100+ years of combined experience in the travel industry Proven C - Suite Experienced travel and technology executive and entrepreneur. Former EDS (an HP company), BTI Americas, Citicorp Jim Dullum COO Serial entrepreneur. Founder of Metaminds, ExploreTrip, LogixCube, POD Technologies with successful exits Prasad Gundumogula Chairman, Chief Executive Officer, and Founder Orestes Fintiklis Vice Chairman and Chief Corporate Strategy and Business Development Officer Founder and Managing Director of Ithaca Capital, Former CEO of ITHAX Acquisition Corp Michalis Tsakos President - Wholesale Entrepreneur, founded and grew CTS into the largest, fastest growing consolidator in North America Michael Thomas President - Retail Serial entrepreneur, founded LBF Travel and sold other companies to Amadeus and Travelport

© 2022 All Rights Reserved | 35 Mondee’s Board of directors with diverse and extensive experiences in public companies. Board of Directors Prasad Gundumogula Chairman, Chief Executive Officer, and Founder Asi Ginio Co - Founder, Former CPO, COO, CEO, Tourico Holidays Inc. Noor Sweid Founder, General Partner, Global Ventures Pradeep Udhas Co - Founder, Senior Advisor, KPMG India Roopa Purushothaman Chief Economist, Head of Policy Advocacy, Tata Sons Private Limited Mona Aboelnaga Kanaan Managing Partner, K6 Investments LLC Orestes Fintiklis Vice Chairman and Chief Corporate Strategy and Business Development Officer

© 2022 All Rights Reserved | 36 OTA GDS B2E 1 Corporate Mondee has no direct comparables, hence a selection of global travel B2B, B2C, and GDS businesses provide a proxy for valuation Comparables Selection Sources: Public filings Notes: 1. B2E Travel defined as a relationship between a business and a enterprise, most commonly for the purposes of facilitating empl oye e business travel 2. AMS and SABR do not offer booking capability directly to consumers 3. CapEx as % of 2019A Revenue. ¼ = < 5%, ½ = 5 - 10%, ¾ = 10 - 15%, Full = >15% Geographic presence End market exposure Customer mix CapEx requirement 3 Retail Corporate B2B B2C B2E Global EMEA APAC Global Global Global Global – – – – – – – ᴡ 2 – ᴡ 2

© 2022 All Rights Reserved | 37 10.0x 6.3x 14.9x 12.9x 8.7x 18.8x 16.8x Mondee Mondee CTM Booking Expedia Amadeus Sabre 9.5x 6.1x 12.6x 11.9x 6.6x 12.8x 13.7x Mondee Mondee CTM Booking Expedia Amadeus Sabre 2 2 Comparables are trading at ~9 – 19x 2023 EV/EBITDA adjusting for capex. The implied valuation for Mondee represents a deep discount to comparables, despite Mondee’s much higher historic growth rate. Attractive Valuation Relative to Comps OTA B2E Corporate GDS 2023F EV/EBITDA 1 Multiple 2 2023F P/E 1 Ratio 40.0 17.7 13.0 16.0 10.1 7.6 Revenue CAGR, 2015 - 19 (%) Sources: Public filings, Capital IQ Notes: 1. Market data as of 8 August 2022 2. On a fully - diluted basis, excluding Earnout and Warrants. Organic Organic Organic + Acquisitions Organic + Acquisitions 62.0 2023F EV/(EBITDA - CapEx 1 ) Multiple 2 9.0x 22.0x 16.2x 11.1x 22.5x nm 5.6x
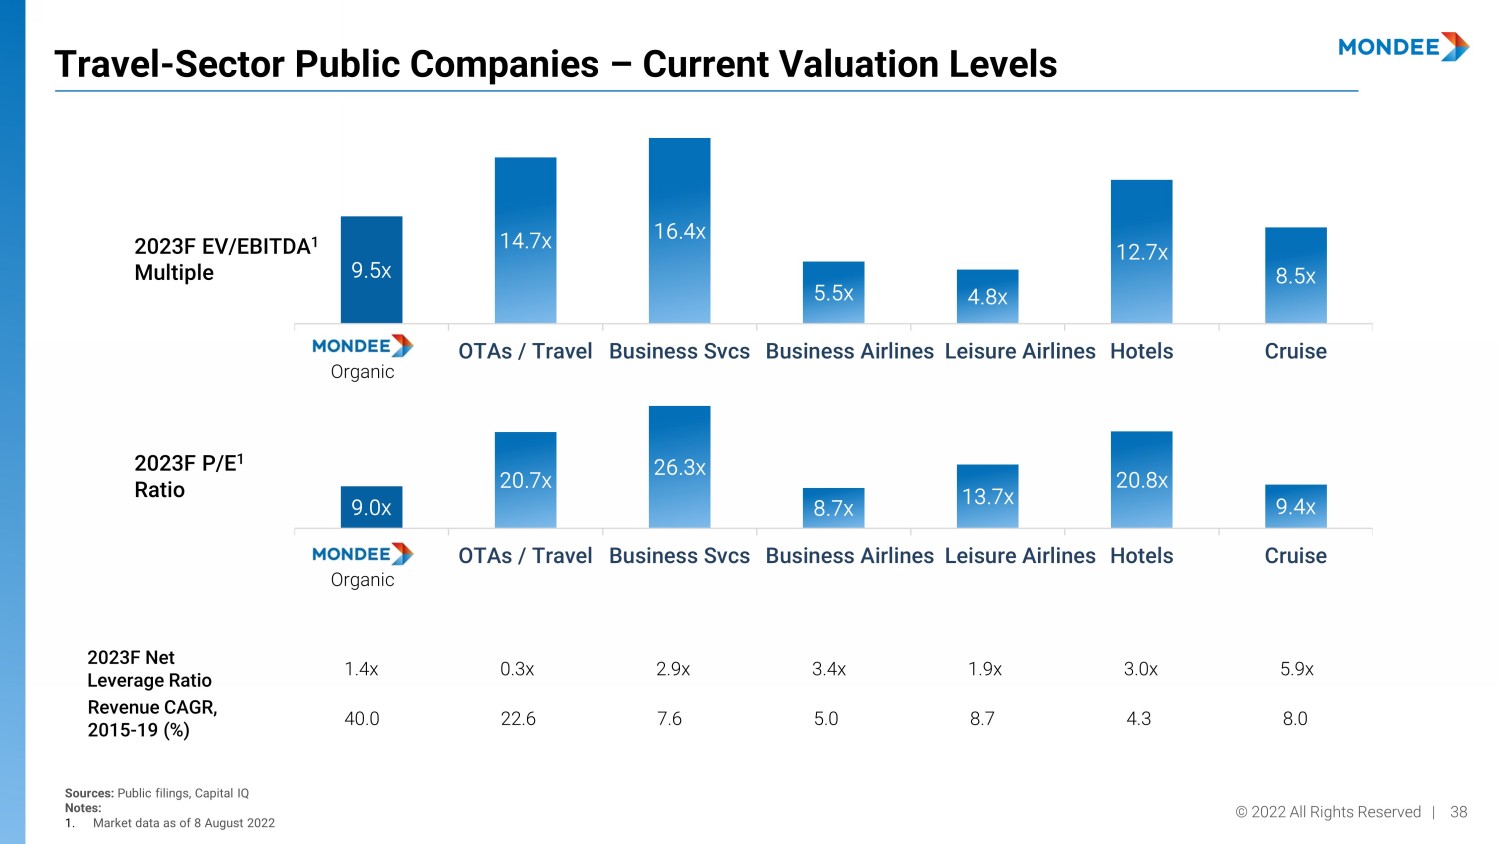
© 2022 All Rights Reserved | 38 9.0x 20.7x 26.3x 8.7x 13.7x 20.8x 9.4x OTAs / Travel Business Svcs Business Airlines Leisure Airlines Hotels Cruise 9.5x 14.7x 16.4x 5.5x 4.8x 12.7x 8.5x OTAs / Travel Business Svcs Business Airlines Leisure Airlines Hotels Cruise Travel - Sector Public Companies – Current Valuation Levels 2023F EV/EBITDA 1 Multiple 2023F P/E 1 Ratio 0.3x 2.9x 3.4x 1.9x 3.0x 5.9x 22.6 7.6 5.0 8.7 4.3 8.0 Sources: Public filings, Capital IQ Notes: 1. Market data as of 8 August 2022 Organic Organic 1.4x 2023F Net Leverage Ratio 40.0 Revenue CAGR, 2015 - 19 (%)
Serious News for Serious Traders! Try StreetInsider.com Premium Free!
You May Also Be Interested In
- Oak Valley Bancorp Reports 1st Quarter Results
- Millicom (Tigo) share repurchase activity
- Biosenta Announces Private Placement Financing
Create E-mail Alert Related Categories
SEC FilingsSign up for StreetInsider Free!
Receive full access to all new and archived articles, unlimited portfolio tracking, e-mail alerts, custom newswires and RSS feeds - and more!
