

Form 8-K MURPHY OIL CORP For: Jun 22
 Tweet
Tweet Share
ShareExhibit 99.1
0 www.murphyoilcorp.com NYSE: MUR 0 J.P. Morgan 2021 Energy, Power & Renewables Conference ROGER W. JENKINS PRESIDENT & CHIEF EXECUTIVE OFFICER JUNE 22, 2021

1 www.murphyoilcorp.com NYSE: MUR 1 Cautionary Note to US Investors – The United States Securities and Exchange Commission (SEC) requires oil and natural gas companies, in their filings with the SEC, to disclose proved reserves that a company has demonstrated by actual production or conclusive formation tests to be economically and legally producible under existing economic and operating conditions . We may use certain terms in this presentation, such as “resource”, “gross resource”, “recoverable resource”, “net risked PMEAN resource”, “recoverable oil”, “resource base”, “EUR” or “estimated ultimate recovery” and similar terms that the SEC’s rules prohibit us from including in filings with the SEC . The SEC permits the optional disclosure of probable and possible reserves in our filings with the SEC . Investors are urged to consider closely the disclosures and risk factors in our most recent Annual Report on Form 10 - K filed with the SEC and any subsequent Quarterly Report on Form 10 - Q or Current Report on Form 8 - K that we file, available from the SEC’s website . Forward - Looking Statements – This presentation contains forward - looking statements within the meaning of the Private Securities Litigation Reform Act of 1995 . Forward - looking statements are generally identified through the inclusion of words such as “aim”, “anticipate”, “believe”, “drive”, “estimate”, “expect”, “expressed confidence”, “forecast”, “future”, “goal”, “guidance”, “intend”, “may”, “objective”, “outlook”, “plan”, “position”, “potential”, “project”, “seek”, “should”, “strategy”, “target”, “will” or variations of such words and other similar expressions . These statements, which express management’s current views concerning future events or results, are subject to inherent risks and uncertainties . Factors that could cause one or more of these future events or results not to occur as implied by any forward - looking statement include, but are not limited to : macro conditions in the oil and natural gas industry, including supply/demand levels, actions taken by major oil exporters and the resulting impacts on commodity prices ; increased volatility or deterioration in the success rate of our exploration programs or in our ability to maintain production rates and replace reserves ; reduced customer demand for our products due to environmental, regulatory, technological or other reasons ; adverse foreign exchange movements ; political and regulatory instability in the markets where we do business ; the impact on our operations or market of health pandemics such as COVID - 19 and related government responses ; other natural hazards impacting our operations or markets ; any other deterioration in our business, markets or prospects ; any failure to obtain necessary regulatory approvals ; any inability to service or refinance our outstanding debt or to access debt markets at acceptable prices ; or adverse developments in the US or global capital markets, credit markets or economies in general . For further discussion of factors that could cause one or more of these future events or results not to occur as implied by any forward - looking statement, see “Risk Factors” in our most recent Annual Report on Form 10 - K filed with the US Securities and Exchange Commission (“SEC”) and any subsequent Quarterly Report on Form 10 - Q or Current Report on Form 8 - K that we file, available from the SEC’s website and from Murphy Oil Corporation’s website at http : //ir . murphyoilcorp . com . Murphy Oil Corporation undertakes no duty to publicly update or revise any forward - looking statements . Non - GAAP Financial Measures – This presentation refers to certain forward - looking non - GAAP measures . Definitions of these measures are included in the appendix . Cautionary Statement and Investor Relations Contacts Kelly Whitley VP, Investor Relations & Communications 281 - 675 - 9107 [email protected] Megan Larson Staff Investor Relations Analyst 281 - 675 - 9470 [email protected]

2 www.murphyoilcorp.com NYSE: MUR 2 Agenda 1 Company Overview 2 Murphy Priorities Murphy Portfolio 3 Looking Ahead 4

3 www.murphyoilcorp.com NYSE: MUR 3 Murphy at a Glance Onshore United States • Eagle Ford Shale on private lands in Texas with ~1,400 future locations on ~134,000 net acres • Produced 30 MBOEPD in 1Q 2021, comprised of 74% oil and 87% liquids Onshore Canada • Tupper Montney ~1,400 future locations on ~100,000 net acres, produced 234 MMCFD in 1Q 2021 • Kaybob Duvernay ~600 future locations on ~170,000 net acres, produced 10.7 MBOEPD in 1Q 2021 Offshore Deepwater Gulf of Mexico • Fifth largest producer in the Gulf of Mexico, produced 70,900 BOEPD 1 in 1Q 2021 • Executing 3 major projects with first oil expected in 2022 Exploration • ~1.1 BBOE of risked mean resources and more than 8 MM net acres across Gulf of Mexico, offshore Mexico, Brazil, Vietnam and Australia Murphy is an independent exploration and production company, producing in three areas with an advantaged portfolio and exploration upside US Onshore Offshore Canada Onshore 19% 32% 49% 155 MBOEPD 1Q 2021 Production 1 24% 23% 53% 2020 Proved Reserves 1 697 MMBOE Our production is processed into products such as gasoline, diesel, jet fuel, other petrochemical materials and electrical power generation 1 Excluding noncontrolling interest Note: Future locations and net acres as of December 31, 2020

4 www.murphyoilcorp.com NYSE: MUR 4 Why Murphy Oil? Oil and natural gas assets that are safely operated with low carbon emissions intensity in three operating areas across North America High - potential exploration portfolio with industry - leading offshore capabilities Strong generator of free cash flow with capital allocation flexibility Financial discipline has led to 60 - year track record of returning capital to shareholders Supported by multi - decade founding family, with meaningful board and management ownership

5 www.murphyoilcorp.com NYSE: MUR 5 Murphy’s environmentally - advantaged portfolio positions the company to navigate these trends Global Energy Transition Global demand for energy sources, including oil and natural gas, remains strong Demand is growing for clean energy sources Regulations that incentivize clean energy are increasing

6 www.murphyoilcorp.com NYSE: MUR 6 Low Emissions Intensity Energy Generation Ranked top - quartile in carbon intensity for 2020 among oil - weighted peers • Lowering emissions intensity 15 - 20% by 2030 • Realizing lower costs while reducing environmental impacts • Deepwater offshore assets have the lowest carbon intensity in global oil - producing fields • Monitoring and evaluating further actions to decarbonize
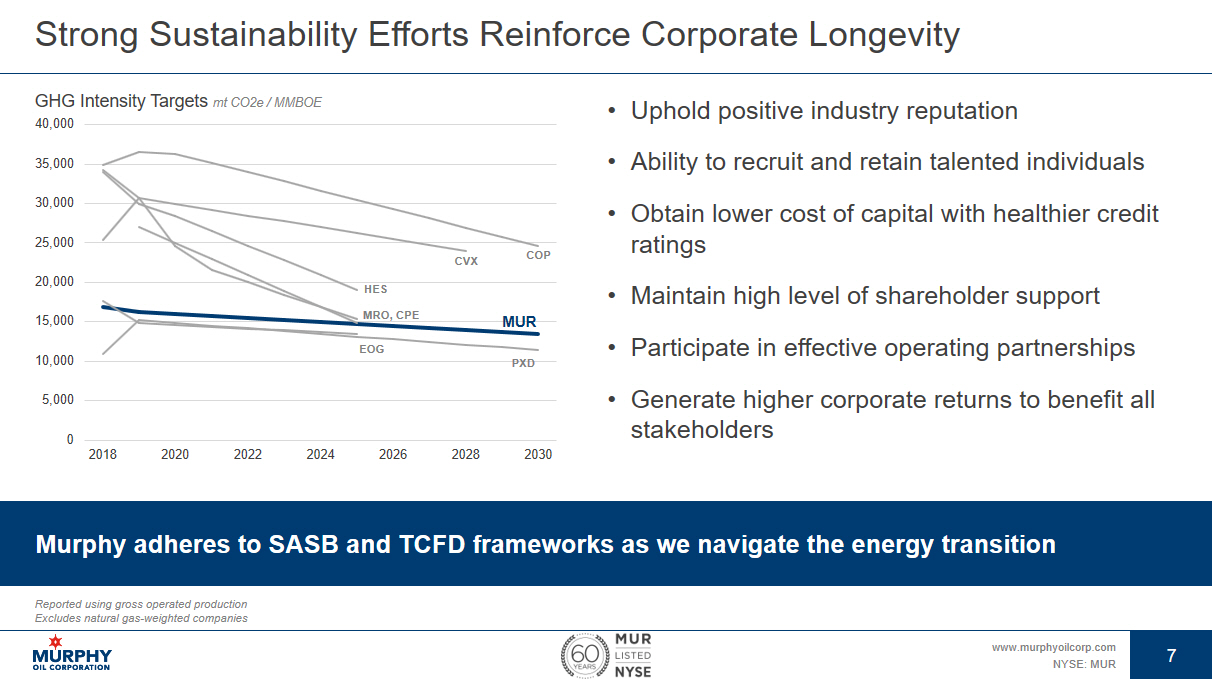
7 www.murphyoilcorp.com NYSE: MUR 7 Strong Sustainability Efforts Reinforce Corporate Longevity 0 5,000 10,000 15,000 20,000 25,000 30,000 35,000 40,000 2018 2020 2022 2024 2026 2028 2030 COP CVX MUR EOG HES MRO, CPE PXD GHG Intensity Targets mt CO2e / MMBOE Murphy adheres to SASB and TCFD frameworks as we navigate the energy transition Reported using gross operated production Excludes natural gas - weighted companies • Uphold positive industry reputation • Ability to recruit and retain talented individuals • Obtain lower cost of capital with healthier credit ratings • Maintain high level of shareholder support • Participate in effective operating partnerships • Generate higher corporate returns to benefit all stakeholders

8 www.murphyoilcorp.com NYSE: MUR 8 High - Potential Exploration Portfolio With Leading Offshore Execution Ability Focused and Meaningful • Four primary exploration areas • Targeting 3 to 5 exploration wells per year Reduced Risk • Leveraging strategic partnerships Strategic Themes • Consistent US Gulf of Mexico program • High - impact potential from Brazil and Mexico Significant Resource Base • ~1.1 BBOE net risked resources King’s Quay Sailaway Ceremony

9 www.murphyoilcorp.com NYSE: MUR 9 Long Term Shareholder Support With Significant Board Ownership • Initiated dividend in 1961 • Returned ~$4.0 BN to shareholders in last 10 years • $1.9 BN in share repurchases, 2012 – 2021E • Representing >20% of total shares outstanding • High stock ownership by directors and NEOs solidifies shareholder alignment 0% 2% 4% 6% 8% 10% 12% HES MUR RRC CNX XEC COG KOS OVV SWN PDCE APA DVN MRO TALO Company Ownership by Directors and NEOs FY 2020 $0 $200 $400 $600 $800 $1,000 2012 2013 2014 2015 2016 2017 2018 2019 2020 2021E Dividends Special Dividends Repurchases Cash Paid to Shareholders $MMs

10 www.murphyoilcorp.com NYSE: MUR 10 MURPHY PRIORITIES

11 www.murphyoilcorp.com NYSE: MUR 11 Our 2021 Priorities Accomplished in the First Quarter • Achieved debt reduction of 8%, or ~$230 MM, in 1Q 2021 • Goal of further ~$200 MM in 2021, for total of ~15% reduction FY 2021 at current strip prices • Brought onshore wells online ahead of schedule and under budget • Produced 88 MBOPD oil, or 7% above guide, with Eagle Ford Shale 4% above despite winter storm impact • Remain on schedule for major offshore projects • Spud Silverback exploration well in Gulf of Mexico in 2Q 2021 • Cutthroat exploration well in Brazil planned to spud in 3Q 2021 DELEVER EXECUTE EXPLORE
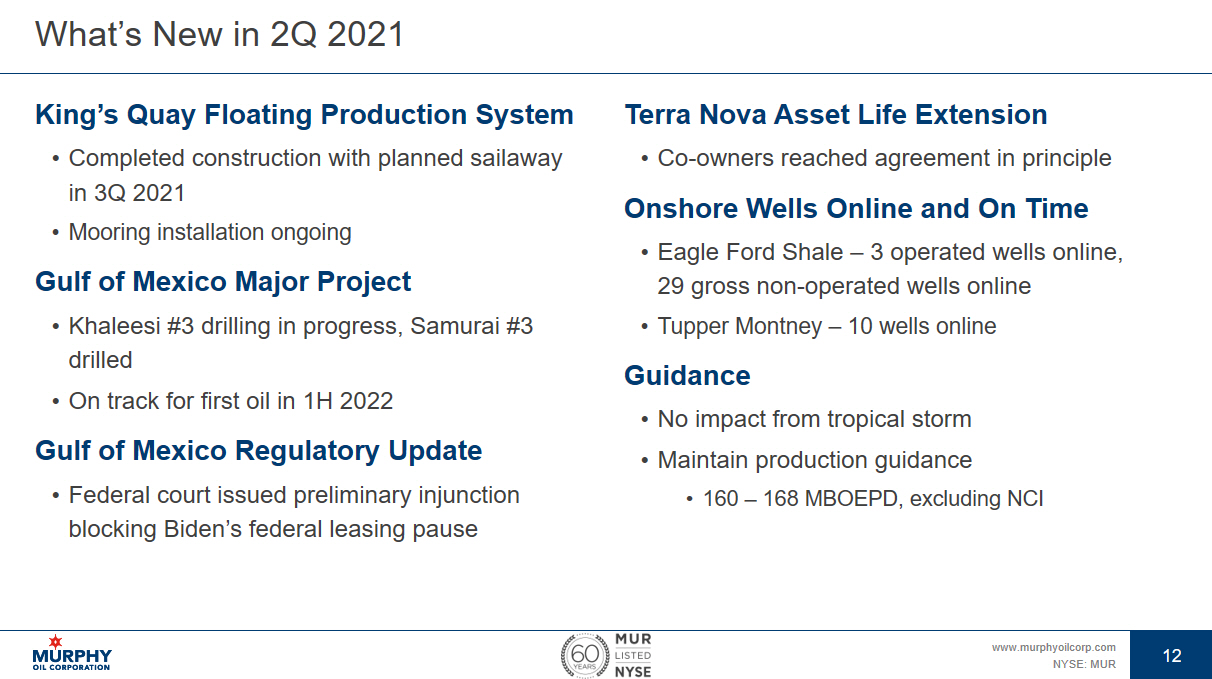
12 www.murphyoilcorp.com NYSE: MUR 12 What’s New in 2Q 2021 King’s Quay Floating Production System • Completed construction with planned sailaway in 3Q 2021 • Mooring installation ongoing Gulf of Mexico Major Project • Khaleesi #3 drilling in progress, Samurai #3 drilled • On track for first oil in 1H 2022 Gulf of Mexico Regulatory Update • Federal court issued preliminary injunction blocking Biden’s federal leasing pause Terra Nova Asset Life Extension • Co - owners reached agreement in principle Onshore Wells Online and On Time • Eagle Ford Shale – 3 operated wells online, 29 gross non - operated wells online • Tupper Montney – 10 wells online Guidance • No impact from tropical storm • Maintain production guidance • 160 – 168 MBOEPD, excluding NCI

13 www.murphyoilcorp.com NYSE: MUR 13 MURPHY PORTFOLIO

14 www.murphyoilcorp.com NYSE: MUR 14 Concentrated Onshore Portfolio With Multi - Year Inventories Tupper Montney Kaybob Duvernay Eagle Ford Shale Oil - Weighted PRICE - ADVANTAGED EAGLE FORD SHALE Natural Gas WELL - POSITIONED FOR IN TUPPER MONTNEY Over 3,400 FUTURE LOCATIONS ~540 MMBOE PROVED RESERVES
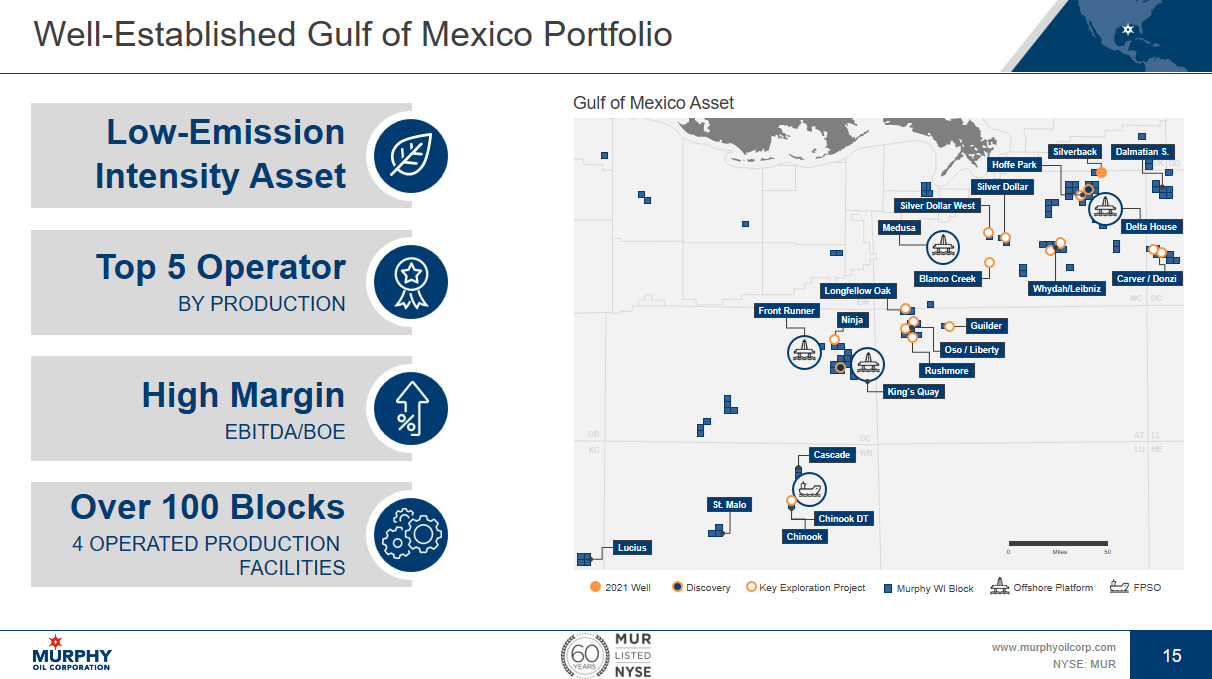
15 www.murphyoilcorp.com NYSE: MUR 15 Well - Established Gulf of Mexico Portfolio Top 5 Operator BY PRODUCTION High Margin EBITDA/BOE Over 100 Blocks 4 OPERATED PRODUCTION FACILITIES Low - Emission Intensity Asset GC WR EW KC GB MC DC LU AT LL HE VK DD Miles 50 0 Lucius Cascade St. Malo Chinook Front Runner Medusa Dalmatian S. Murphy WI Block Offshore Platform FPSO 2021 Well Discovery Key Exploration Project Gulf of Mexico Asset Delta House Rushmore Guilder Silver Dollar West Ninja Silver Dollar Silverback Blanco Creek Carver / Donzi King’s Quay Longfellow Oak Whydah/Leibniz Oso / Liberty Chinook DT Hoffe Park
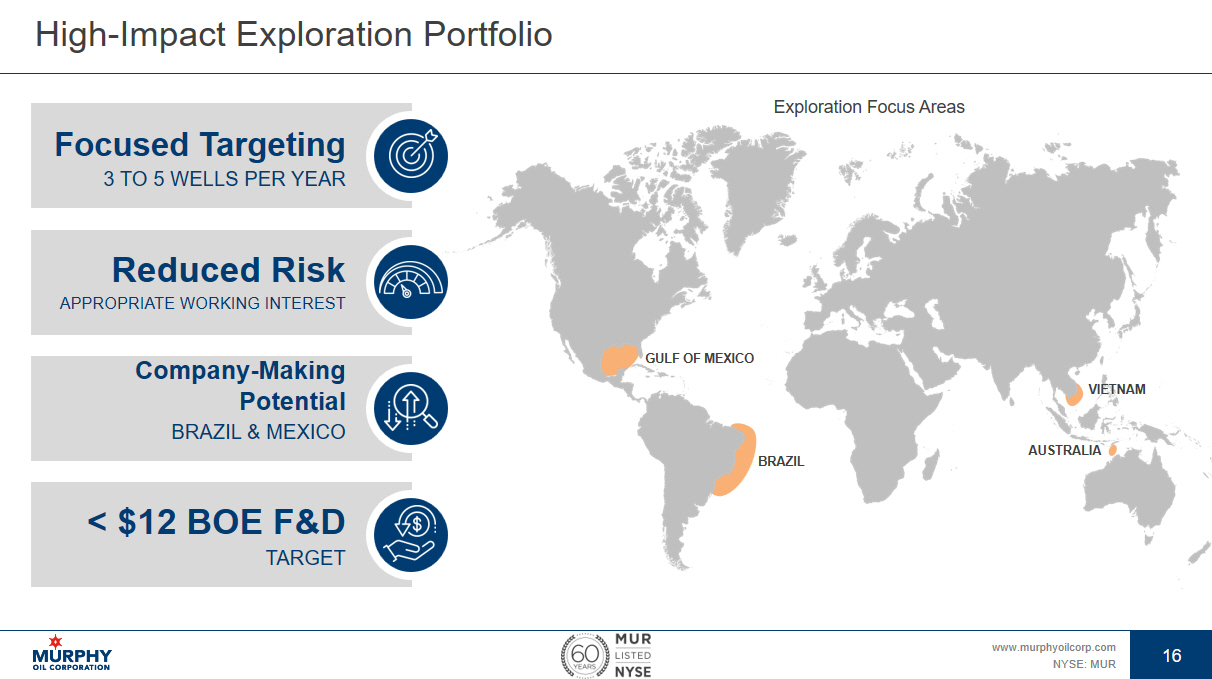
16 www.murphyoilcorp.com NYSE: MUR 16 High - Impact Exploration Portfolio Company - Making Potential BRAZIL & MEXICO Reduced Risk APPROPRIATE WORKING INTEREST Focused Targeting 3 TO 5 WELLS PER YEAR < $12 BOE F&D TARGET GULF OF MEXICO BRAZIL VIETNAM AUSTRALIA Exploration Focus Areas

17 www.murphyoilcorp.com NYSE: MUR 17 LOOKING AHEAD
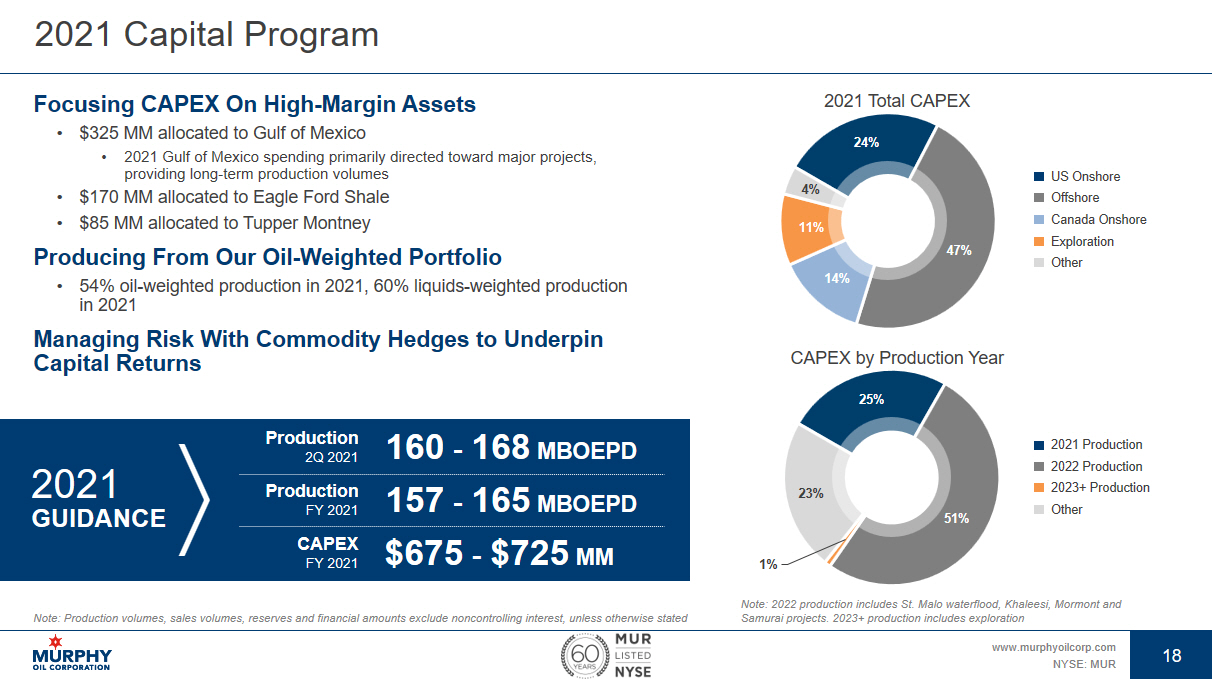
18 www.murphyoilcorp.com NYSE: MUR 18 Focusing CAPEX On High - Margin Assets • $325 MM allocated to Gulf of Mexico • 2021 Gulf of Mexico spending primarily directed toward major projects, providing long - term production volumes • $170 MM allocated to Eagle Ford Shale • $85 MM allocated to Tupper Montney Producing From Our Oil - Weighted Portfolio • 54% oil - weighted production in 2021, 60% liquids - weighted production in 2021 Managing Risk With Commodity Hedges to Underpin Capital Returns 2021 Capital Program Note: Production volumes, sales volumes, reserves and financial amounts exclude noncontrolling interest, unless otherwise sta ted 25% 51% 1% 23% CAPEX by Production Year 24% 47% 14% 11% 4% 2021 Total CAPEX Note: 2022 production includes St. Malo waterflood, Khaleesi, Mormont and Samurai projects. 2023+ production includes exploration $675 - $725 MM CAPEX FY 2021 160 - 168 MBOEPD Production 2Q 2021 157 - 165 MBOEPD Production FY 2021 2021 GUIDANCE US Onshore Offshore Canada Onshore Exploration Other 2021 Production 2022 Production 2023+ Production Other
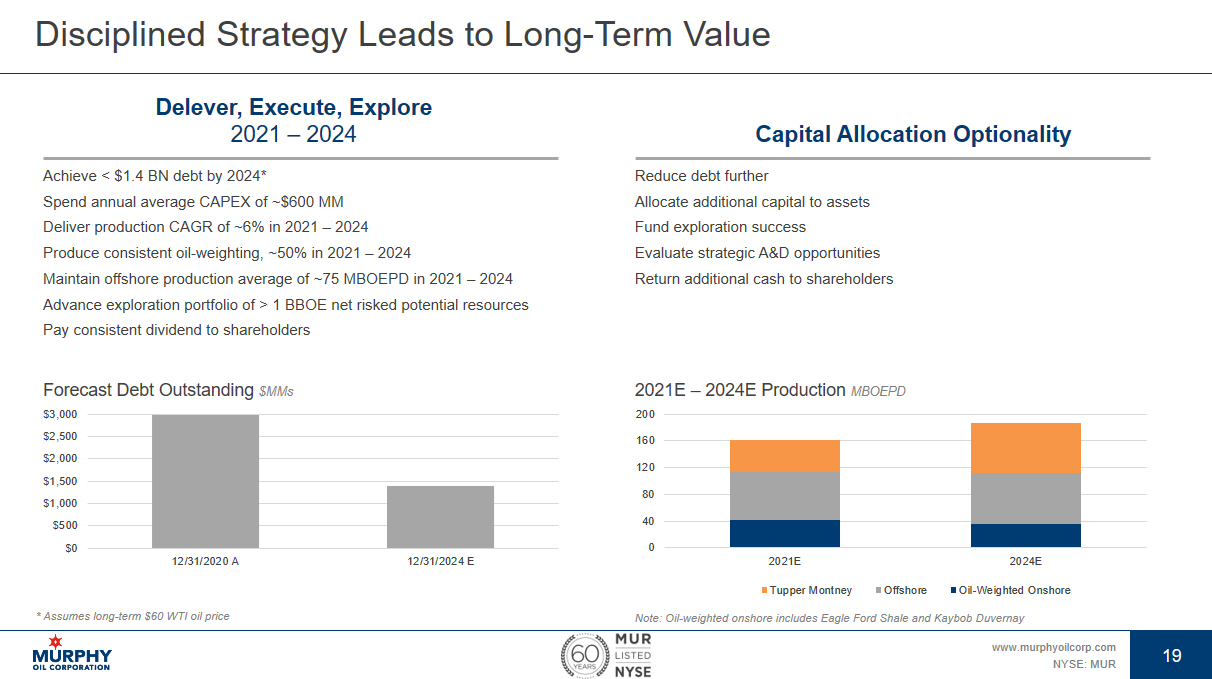
19 www.murphyoilcorp.com NYSE: MUR 19 Disciplined Strategy Leads to Long - Term Value 0 40 80 120 160 200 2021E 2024E Tupper Montney Offshore Oil-Weighted Onshore Note: Oil - weighted onshore includes Eagle Ford Shale and Kaybob Duvernay $0 $500 $1,000 $1,500 $2,000 $2,500 $3,000 12/31/2020 A 12/31/2024 E Forecast Debt Outstanding $MMs 2021E – 2024E Production MBOEPD Delever, Execute, Explore 2021 – 2024 Achieve < $1.4 BN debt by 2024* Spend annual average CAPEX of ~$600 MM Deliver production CAGR of ~6% in 2021 – 2024 Produce consistent oil - weighting, ~50% in 2021 – 2024 Maintain offshore production average of ~75 MBOEPD in 2021 – 2024 Advance exploration portfolio of > 1 BBOE net risked potential resources Pay consistent dividend to shareholders Capital Allocation Optionality Reduce debt further Allocate additional capital to assets Fund exploration success Evaluate strategic A&D opportunities Return additional cash to shareholders * Assumes long - term $60 WTI oil price
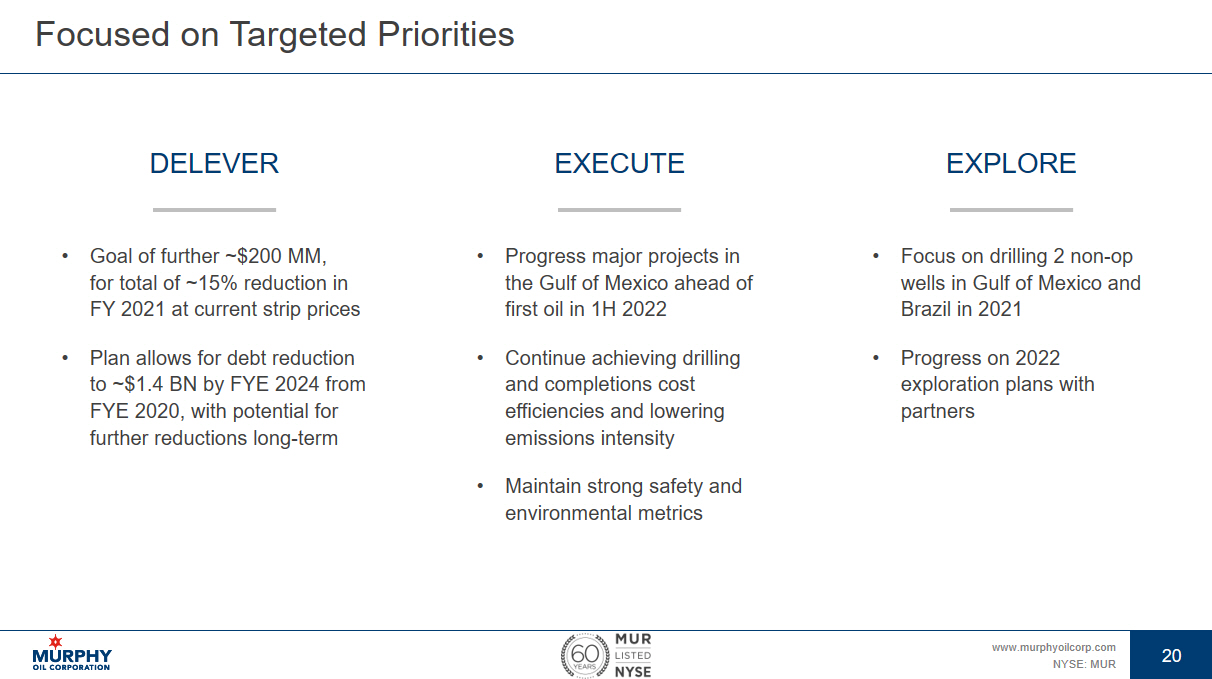
20 www.murphyoilcorp.com NYSE: MUR 20 Focused on Targeted Priorities • Goal of further ~$200 MM, for total of ~15% reduction in FY 2021 at current strip prices • Plan allows for debt reduction to ~$1.4 BN by FYE 2024 from FYE 2020, with potential for further reductions long - term • Progress major projects in the Gulf of Mexico ahead of first oil in 1H 2022 • Continue achieving drilling and completions cost efficiencies and lowering emissions intensity • Maintain strong safety and environmental metrics • Focus on drilling 2 non - op wells in Gulf of Mexico and Brazil in 2021 • Progress on 2022 exploration plans with partners DELEVER EXECUTE EXPLORE

21 www.murphyoilcorp.com NYSE: MUR 21 Why Murphy Oil? Oil and natural gas assets that are safely operated with low carbon emissions intensity in three operating areas across North America High - potential exploration portfolio with industry - leading offshore capabilities Strong generator of free cash flow with capital allocation flexibility Financial discipline has led to 60 - year track record of returning capital to shareholders Supported by multi - decade founding family, with meaningful board and management ownership

22 www.murphyoilcorp.com NYSE: MUR 22 J.P. Morgan 2021 Energy, Power & Renewables Conference ROGER W. JENKINS PRESIDENT & CHIEF EXECUTIVE OFFICER JUNE 22, 2021

23 www.murphyoilcorp.com NYSE: MUR 23 Appendix 1 Non - GAAP Definitions and Reconciliations 2 Glossary of Abbreviations 3 2Q 2021 Guidance 4 Current Hedging Positions 6 Acreage Maps 5 Supplemental Information

24 www.murphyoilcorp.com NYSE: MUR 24 The following list of Non - GAAP financial measure definitions and related reconciliations is intended to satisfy the requirements of Regulation G of the Securities Exchange Act of 1934, as amended. This information is historical in nature. Murphy undertakes no obligation to publicly update or revise any Non - GAAP financial measure definitions and related reconciliations. Non - GAAP Financial Measure Definitions and Reconciliations

25 www.murphyoilcorp.com NYSE: MUR 25 EBITDA and EBITDAX Murphy defines EBITDA as net income (loss) attributable to Murphy 1 before interest, taxes, depreciation and amortization (DD&A). Murphy defines EBITDAX as net income (loss) attributable to Murphy before interest, taxes, depreciation and amortization (DD&A) and exploration expense. Management believes that EBITDA and EBITDAX provide useful information for assessing Murphy's financial condition and results of operations and are widely accepted financial indicators of the ability of a company to incur and service debt, fund capital expenditure programs, pay dividends and make other distributions to stockholders. EBITDA and EBITDAX, as reported by Murphy, may not be comparable to similarly titled measures used by other companies and sho uld be considered in conjunction with net income, cash flow from operations and other performance measures prepared in accordance with generally accepted accountin g p rinciples (GAAP). EBITDA and EBITDAX have certain limitations regarding financial assessments because they exclude certain items that affect net income an d n et cash provided by operating activities. EBITDA and EBITDAX should not be considered in isolation or as a substitute for an analysis of Murphy's GAAP results as repor ted . Non - GAAP Reconciliation $ Millions Three Months Ended – Mar 31, 2021 Three Months Ended – Mar 31, 2020 Net (loss) income attributable to Murphy (GAAP) (287.4) (416.1) Income tax ( benefit) expense (88.2) (91.5) Interest expense, net 88.1 41.1 DD&A expense 188.3 286.2 EBITDA attributable to Murphy (Non - GAAP) (99.2) (180.3) Exploration expense 11.8 20.1 EBITDAX attributable to Murphy (Non - GAAP) (87.4) (160.2) 1 ‘Attributable to Murphy’ represents the economic interest of Murphy excluding a 20% noncontrolling interest in MP GOM.

26 www.murphyoilcorp.com NYSE: MUR 26 ADJUSTED EBITDA Murphy defines Adjusted EBITDA as net income (loss) attributable to Murphy 1 before interest, taxes, depreciation and amortization (DD&A), impairment expense, discontinued operations, foreign exchange gains and losses, mark - to - market gains and losses on crude oil derivative contracts, accretion of asset retirement obli gations and certain other items that management believes affect comparability between periods. Adjusted EBITDA is used by management to evaluate the company’s operational performance and trends between periods and relati ve to its industry competitors. Adjusted EBITDA may not be comparable to similarly titled measures used by other companies and it should be considered in con jun ction with net income, cash flow from operations and other performance measures prepared in accordance with generally accepted accounting principles (GAAP). Adjusted EBITDA has certain li mitations regarding financial assessments because it excludes certain items that affect net income and net cash provided by operating activities. Adjusted EBITDA should not be co nsi dered in isolation or as a substitute for an analysis of Murphy's GAAP results as reported. Non - GAAP Reconciliation $ Millions, except per BOE amounts Three Months Ended – Mar 31, 2021 Three Months Ended – Mar 31, 2020 EBITDA attributable to Murphy (Non - GAAP) (99.2) (180.3) Impairment of assets 171.3 866.4 Mark - to - market loss (gain) on crude oil derivative contracts 153.5 (358.3) Mark - to - market loss (gain) on contingent consideration 14.9 (59.2) Accretion of asset retirement obligations 10.5 10.0 Unutilized rig charges 2.8 3.5 Foreign exchange losses (gains) 1.3 (4.7) Discontinued operations (income) loss (0.2) 4.9 Inventory loss - 4.8 Adjusted EBITDA attributable to Murphy (Non - GAAP) 254.9 287.1 Total barrels of oil equivalents sold from continuing operations attributable to Murphy (thousands of barrels) 13,670 17,071 Adjusted EBITDA per BOE (Non - GAAP) 18.65 16.82 1 ‘Attributable to Murphy’ represents the economic interest of Murphy excluding a 20% noncontrolling interest in MP GOM.

27 www.murphyoilcorp.com NYSE: MUR 27 ADJUSTED EBITDAX Murphy defines Adjusted EBITDAX as net income (loss) attributable to Murphy 1 before interest, taxes, depreciation and amortization (DD&A), exploration expense, impairment expense, discontinued operations, foreign exchange gains and losses, mark - to - market gains and losses on crude oil derivative contracts, a ccretion of asset retirement obligations and certain other items that management believes affect comparability between periods. Adjusted EBITDAX is used by management to evaluate the company’s operational performance and trends between periods and relat ive to its industry competitors. Adjusted EBITDAX may not be comparable to similarly titled measures used by other companies and it should be considered in co nju nction with net income, cash flow from operations and other performance measures prepared in accordance with generally accepted accounting principles (GAAP). Adjusted EBITDAX has certai n l imitations regarding financial assessments because it excludes certain items that affect net income and net cash provided by operating activities. Adjusted EBITDAX should not be c ons idered in isolation or as a substitute for an analysis of Murphy's GAAP results as reported. Non - GAAP Reconciliation $ Millions, except per BOE amounts Three Months Ended – Mar 31, 2021 Three Months Ended – Mar 31, 2020 EBITDAX attributable to Murphy (Non - GAAP) (87.4) (160.2) Impairment of assets 171.3 866.4 Mark - to - market loss (gain) on crude oil derivative contracts 153.5 (358.3) Mark - to - market loss (gain) on contingent consideration 14.9 (59.2) Accretion of asset retirement obligations 10.5 10.0 Unutilized rig charges 2.8 3.5 Foreign exchange losses (gains) 1.3 (4.7) Discontinued operations (income) loss (0.2) 4.9 Inventory loss - 4.8 Adjusted EBITDAX attributable to Murphy (Non - GAAP) 266.7 307.2 Total barrels of oil equivalents sold from continuing operations attributable to Murphy (thousands of barrels) 13,670 17,071 Adjusted EBITDAX per BOE (Non - GAAP) 19.51 17.99 1 ‘Attributable to Murphy’ represents the economic interest of Murphy excluding a 20% noncontrolling interest in MP GOM.
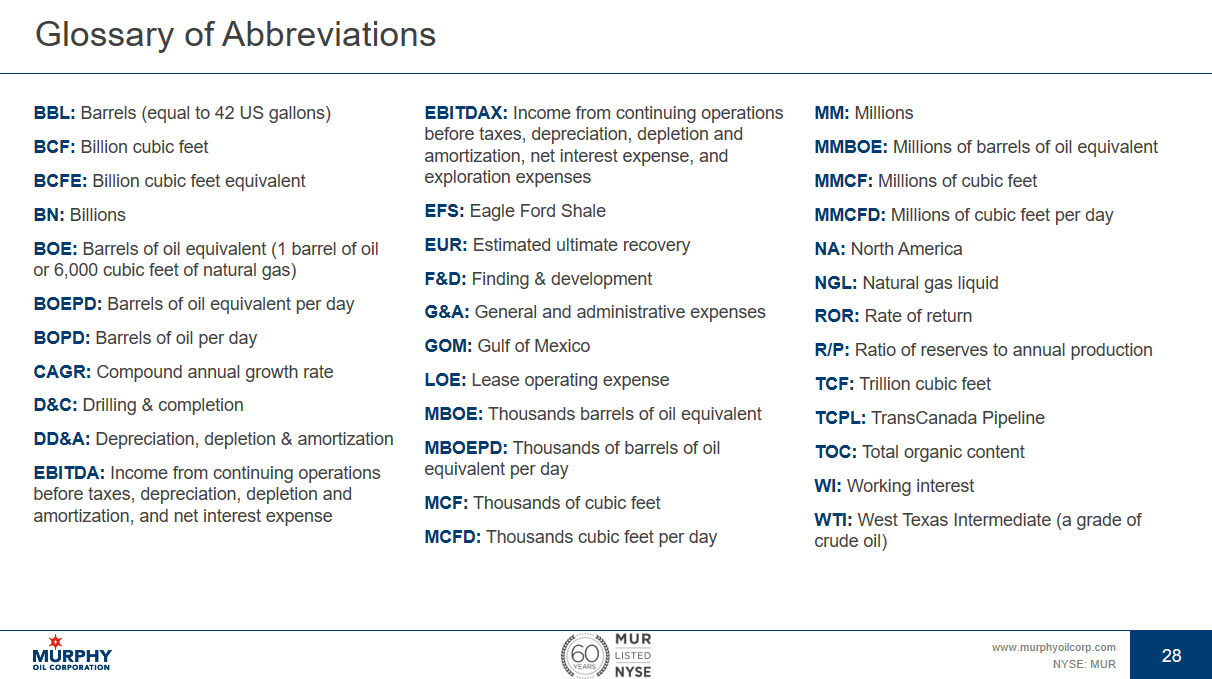
28 www.murphyoilcorp.com NYSE: MUR 28 BBL: Barrels (equal to 42 US gallons) BCF: Billion cubic feet BCFE: Billion cubic feet equivalent BN: Billions BOE: Barrels of oil equivalent (1 barrel of oil or 6,000 cubic feet of natural gas) BOEPD: Barrels of oil equivalent per day BOPD: Barrels of oil per day CAGR: Compound annual growth rate D&C: Drilling & completion DD&A: Depreciation, depletion & amortization EBITDA: Income from continuing operations before taxes, depreciation, depletion and amortization, and net interest expense EBITDAX: Income from continuing operations before taxes, depreciation, depletion and amortization, net interest expense, and exploration expenses EFS: Eagle Ford Shale EUR: Estimated ultimate recovery F&D: Finding & development G&A: General and administrative expenses GOM: Gulf of Mexico LOE: Lease operating expense MBOE: Thousands barrels of oil equivalent MBOEPD: Thousands of barrels of oil equivalent per day MCF: Thousands of cubic feet MCFD: Thousands cubic feet per day MM: Millions MMBOE: Millions of barrels of oil equivalent MMCF: Millions of cubic feet MMCFD: Millions of cubic feet per day NA: North America NGL: Natural gas liquid ROR: Rate of return R/P: Ratio of reserves to annual production TCF: Trillion cubic feet TCPL: TransCanada Pipeline TOC: Total organic content WI: Working interest WTI: West Texas Intermediate (a grade of crude oil) Glossary of Abbreviations

29 www.murphyoilcorp.com NYSE: MUR 29 2Q 2021 Guidance Producing Asset Oil (BOPD) NGLs (BOPD) Gas (MCFD) Total (BOEPD) US – Eagle Ford Shale 28,300 5,000 27,400 37,900 – Gulf of Mexico excluding NCI 1 57,400 5,100 68,800 74,000 Canada – Tupper Montney – – 236,400 39,400 – Kaybob Duvernay and Placid Montney 5,400 1,000 18,200 9,400 – Offshore 3,300 – – 3,300 2Q Production Volume (BOEPD) excl. NCI 1 160,000 – 168,000 2Q Exploration Expense ($MM) $20 Full Year 2021 CAPEX ($MM) excl. NCI 2 $675 – $725 Full Year 2021 Production Volume (BOEPD) excl. NCI 3 157,000 – 165,000 1 Excludes noncontrolling interest of MP GOM of 9,500 BOPD oil, 600 BOPD NGLs and 4,600 MCFD gas 2 Excludes noncontrolling interest of MP GOM of $30 MM 3 Excludes noncontrolling interest of MP GOM of 8,800 BOPD oil, 500 BOPD NGLs and 4,300 MCFD gas

30 www.murphyoilcorp.com NYSE: MUR 30 Capital Execution and Guidance Executing In - Line With Plan • 1Q 2021 accrued CAPEX* of $230 MM aligned with plan • Primary business units’ CAPEX heavily weighted to 1Q 2021 Outperformance Leads to Production Guidance Raise • Improved drilling technical performance while reducing costs • Guiding 2Q 2021 production of 160 – 168 MBOEPD, with midpoint of oil production at 95 MBOPD • Tightening FY 2021 production guidance to 157 – 165 MBOEPD Maintain FY 2021 CAPEX guide of $675 – $725 MM Accrual CAPEX, based on midpoint of guidance range and excluding noncontrolling interest * Excludes King’s Quay CAPEX of $17 MM $210 $190 $160 $120 $700 $20 0 100 200 300 400 500 600 700 800 1Q 2021A * 2Q 2021E 3Q 2021E 4Q 2021E FY 2021E Accrued CAPEX by Quarter $MM Forecast CAPEX Actual CAPEX A&D

31 www.murphyoilcorp.com NYSE: MUR 31 Current Hedging Positions United States Commodity Type Volumes (BBL/D) Price (BBL) Start Date End Date WTI Fixed Price Derivative Swap 45,000 $42.77 4/1/2021 12/31/2021 WTI Fixed Price Derivative Swap 20,000 $44.88 1/1/2022 12/31/2022 Montney, Canada Commodity Type Volumes (MMCF/D) Price (MCF) Start Date End Date Natural Gas Fixed Price Forward Sales at AECO 203 C$2.55 4/1/2021 5/31/2021 Natural Gas Fixed Price Forward Sales at AECO 241 C$2.57 6/1/2021 12/31/2021 Natural Gas Fixed Price Forward Sales at AECO 231 C$2.42 1/1/2022 1/31/2022 Natural Gas Fixed Price Forward Sales at AECO 221 C$2.41 2/1/2022 4/30/2022 Natural Gas Fixed Price Forward Sales at AECO 250 C$2.40 5/1/2022 5/31/2022 Natural Gas Fixed Price Forward Sales at AECO 292 C$2.39 6/1/2022 12/31/2022 Natural Gas Fixed Price Forward Sales at AECO 201 C$2.36 1/1/2023 12/31/2023 Natural Gas Fixed Price Forward Sales at AECO 147 C$2.41 1/1/2024 12/31/2024 * As of May 5 , 2020

32 www.murphyoilcorp.com NYSE: MUR 32 Balance Sheet Stability Solid Foundation for Commodity Price Cycles • $1.6 BN senior unsecured credit facility matures Nov 2023, undrawn at March 31, 2021 • All debt is unsecured, senior credit facility not subject to semi - annual borrowing base redeterminations • $231 MM of cash and cash equivalents at March 31, 2021 • Next senior notes maturity due in 2024 0 500 1,000 1,500 2,000 Notes Drawn RCF Undrawn RCF Note Maturity Profile $MM 10 Year 20 Year 30 Year Maturity Profile* Total Bonds Outstanding $BN $2.756 Weighted Avg Fixed Coupon 6.3% Weighted Avg Years to Maturity 7.7 * As of March 31, 2021

33 www.murphyoilcorp.com NYSE: MUR 33 1Q 2021 Cash Flow Simplification Cash Flow Attributable to Murphy ($MM) Inflow Outflow Net Cash from operations and property additions 1 $238 ($241) ($3) King’s Quay monetization $268 ($218) 2 $50 Senior notes transactions $542 ($610) 3 ($68) Dividends ($19) ($19) Distribution to noncontrolling interest ($36) ($36) Other ($4) ($4) Net Cash Flow $1,048 ($1,128) ($80) 1 Includes noncontrolling interest 2 Includes 1Q 2021 CAPEX of $18 MM plus revolver payoff of $200 MM 3 Includes 2022 notes principal amount of $576 MM plus $34 MM early redemption of debt cost Cash Flow Adjustments • Total inflow of cash of $1,048 MM • From operations, King’s Quay monetization and senior notes transactions • Total outflow of $1,128 MM • From transactions, dividends and distribution to NCI • Includes $20 MM cost of Lucius WI acquisition and $233 MM of net debt reduction • Resulted in $80 MM cash deficit for the quarter, funded with cash on hand • $231 MM cash and equivalents as of March 31, 2021 • At current prices, goal of repurchasing additional ~$200 MM of senior notes in 2021

34 www.murphyoilcorp.com NYSE: MUR 34 North America Onshore Area Net Acres Reservoir Inter - Well Spacing (ft) Remaining Wells Karnes 10,092 Lower EFS 300 106 Upper EFS 600 142 Austin Chalk 1,200 97 Tilden 64,770 Lower EFS 600 264 Upper EFS 500 138 Austin Chalk 600 100 Catarina 48,375 Lower EFS 550 238 Upper EFS 950 219 Austin Chalk 1,200 112 Total 123,237 1,416 Area Net Acres Inter - Well Spacing (ft) Remaining Wells Two Creeks 35,232 984 104 Kaybob East 37,744 984 152 Kaybob West 25,984 984 107 Kaybob North 25,536 984 98 Simonette 32,116 984 108 Saxon 12,298 984 57 Total 168,910 626 Kaybob Duvernay Well Locations Eagle Ford Shale Operated Well Locations *As of December 31, 2020 *As of December 31, 2020

35 www.murphyoilcorp.com NYSE: MUR 35 North America Onshore Balancing Investments for Free Cash Generation to Delever Balance Sheet 1Q 2021 Onshore Activity • Eagle Ford Shale • 16 operated wells + 16 gross non - operated wells* online • $75 MM of $170 MM FY 2021 CAPEX guidance • Tupper Montney • 4 operated wells online • $30 MM of $85 MM FY 2021 CAPEX guidance FY 2021 Onshore Activity • Eagle Ford Shale • 19 operated + 45 gross non - operated wells* online • Tupper Montney • 14 operated wells online Note: Non - op well cadence subject to change per operator plans Eagle Ford Shale non - operated wells adjusted for 18% average working interest 2021 Wells Online 0 5 10 15 20 25 1Q 2021 2Q 2021 3Q 2021 4Q 2021 Eagle Ford Shale Tupper Montney Eagle Ford Shale (Non-Op) * Eagle Ford Shale non - operated wells average 18% working interest

36 www.murphyoilcorp.com NYSE: MUR 36 Eagle Ford Shale Base Production Outperforms While Lowering Costs Eagle Ford Shale Acreage CATARINA TILDEN KARNES Zavala Atascosa Karnes McMullen Frio Dimmit La Salle Live Oak Bee Wilson Murphy Acreage Eagle Ford Shale Drilling and Completions $MM per well $0 $1 $2 $3 $4 $5 $6 $7 2018 2019 2020 YTD 2021 Drilling Cost Completions 1Q 2021 Activity • 16 operated wells online, all Karnes • Primarily Lower EFS and Austin Chalk • Avg 1,400 BOEPD IP30 • Two best wells achieved 2,000 BOEPD IP30 Lowering D&C Costs • 40% reduction in completions costs since FY 2018 • ~$4.5 MM avg well cost in 1Q 2021, down from ~$6.3 MM in FY 2018 • Karnes avg cost per well in - line with top peers Achieving Strong Austin Chalk Results • 1Q 2021 Karnes Tier 2 wells meaningfully outperforming Tier 1 type curve • Avg 1,400 BOEPD IP30 rate • Reassessing ultimate recovery expectations based on results • ~100 Karnes locations as of YE 2020

37 www.murphyoilcorp.com NYSE: MUR 37 Tupper Montney Increasing Recoveries While Lowering Costs * Includes contingent well count $0 $50 $100 $150 $200 $250 0 100 200 300 400 500 2020A 2021 2022 2023 2024 2025 Production Cum FCF Tupper Montney Production and Cumulative FCF MMCFD $MM Tupper Montney Drilling and Completions $MM per well $0 $1 $2 $3 $4 $5 $6 2017 2018 2019 2020 YTD 2021 Drilling Cost Completions 1Q 2021 Activity • 4 wells online, 45 days ahead of plan Lowering D&C costs • 28% reduction since FY 2017 • ~$4.1 MM avg well cost in 1Q 2021, down from ~$5.5 MM in FY 2019 ~1,400 Remaining Locations* Support a Low - Carbon Energy Future Low Execution Risk • Average ultimate recovery of ~21 BCF / well • Low subsurface risk from proven resource • Ample existing take - away and infrastructure in place

38 www.murphyoilcorp.com NYSE: MUR 38 Tupper Montney Advantages • Employ capital allocation process that maximizes free long term cash flow • Generates greater cash margin per well than Eagle Ford Shale at conservative prices • < $1 / MCF average new well breakeven cost • Long history of continuous improvement • Increasing laterals to ~11,000’ • Improved drilling and completion costs to ~$5 MM / well • Increased average ultimate recovery to ~21 BCF / well Improved Macro Economics for Region • Increased local take - away capacity and debottlenecking completed • 600 MMCFD westward export 2020 – 2022 • 1.3 BCFD eastward export 2021 – 2022 • Declining regional production 2 BCFPD lower Y - o - Y • Improved domestic demand due to coal to natural gas switching • Construction underway for LNG Canada project, estimated in service in 2025 • Lowest AECO to Henry Hub basis differential in 5 years Low Carbon Intensity Asset • Lowest greenhouse gas intensity asset in current portfolio $- $1 $2 $3 $4 $5 $6 Year 1 Year 2 Year 3 Year 4 Annual Cumulative Cash Margin Per Well $MM Eagle Ford Shale Tupper Montney Tupper Montney Project Low Carbon Intensity Development With Attractive Cash Margins Eagle Ford Shale Tupper Montney Kaybob Duvernay Gulf of Mexico – Non - Op Canada Offshore – Non - Op 0 10 20 30 40 0 10 20 30 40 50 60 70 80 5 - year Production Average, MBOEPD Average 5 - Year GHG Intensity by Asset Tonnes CO 2 e / MBOE Note: 5 - year average intensity based on internal estimates Cash margins based on average price $44 / WTI, $1.78 / MCF AECO Gulf of Mexico – Op
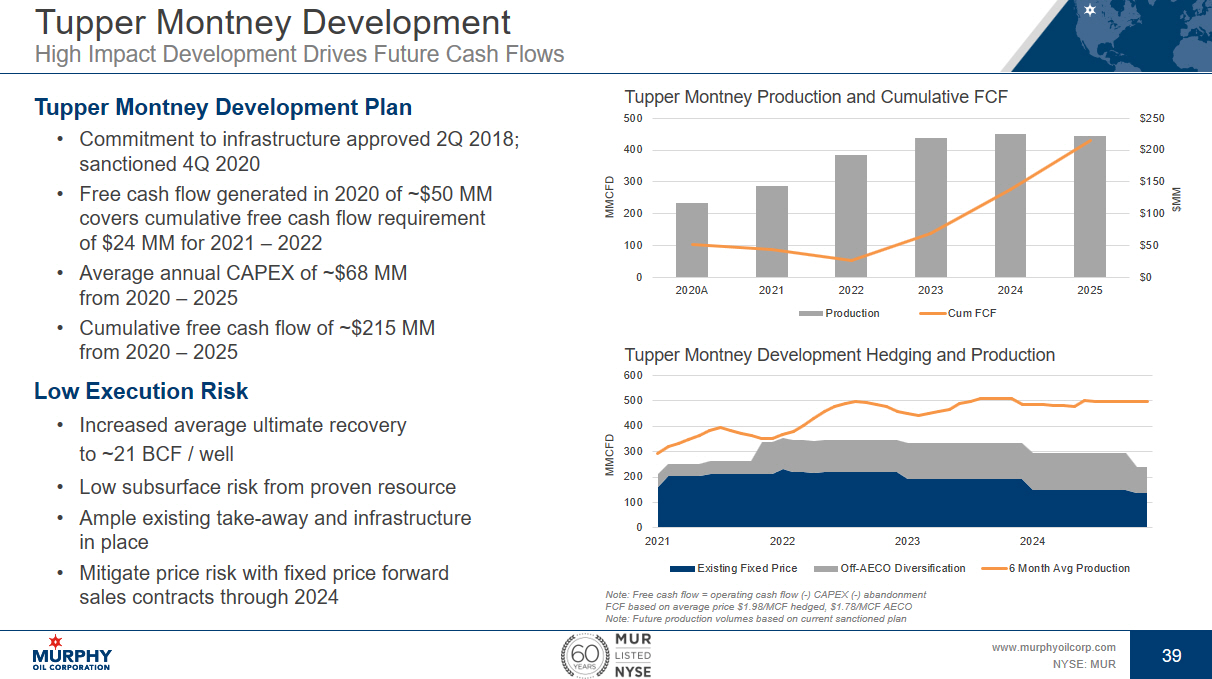
39 www.murphyoilcorp.com NYSE: MUR 39 Tupper Montney Development High Impact Development Drives Future Cash Flows $0 $50 $100 $150 $200 $250 0 100 200 300 400 500 2020A 2021 2022 2023 2024 2025 Production Cum FCF Tupper Montney Production and Cumulative FCF MMCFD $MM Tupper Montney Development Plan • Commitment to infrastructure approved 2Q 2018; sanctioned 4Q 2020 • Free cash flow generated in 2020 of ~$50 MM covers cumulative free cash flow requirement of $24 MM for 2021 – 2022 • Average annual CAPEX of ~$68 MM from 2020 – 2025 • Cumulative free cash flow of ~$215 MM from 2020 – 2025 Low Execution Risk • Increased average ultimate recovery to ~21 BCF / well • Low subsurface risk from proven resource • Ample existing take - away and infrastructure in place • Mitigate price risk with fixed price forward sales contracts through 2024 0 100 200 300 400 500 600 2021 2022 2023 2024 Existing Fixed Price Off-AECO Diversification 6 Month Avg Production Note: Free cash flow = operating cash flow ( - ) CAPEX ( - ) abandonment FCF based on average price $1.98/MCF hedged, $1.78/MCF AECO Note: Future production volumes based on current sanctioned plan Tupper Montney Development Hedging and Production MMCFD

40 www.murphyoilcorp.com NYSE: MUR 40 Drilling and Completions Field Drilled Completions Online Khaleesi 4Q 2021 1H 2022 Mormont 1Q 2022 1H 2022 Samurai 2Q 2022 2H 2022 Gulf of Mexico Major Projects Drive Future Free Cash Flow Khaleesi / Mormont / Samurai • Launched drilling campaign 2Q 2021 • Drilled top hole sections for 3 wells • Currently drilling Khaleesi #3 well • On track for first oil in 1H 2022 St. Malo Waterflood • First producer well online • Drilling final well of 4 - well campaign in 2Q 2021 Facilities Project Components Fabrication Commissioning Installation / Hook - up King’s Quay FPS 3Q 2021 – 2Q 2022 1H 2022 King’s Quay Moorings N/A 2Q 2021 / 4Q 2021 Subsea Flowlines and Equipment Ongoing 1H 2022 4Q 2021 – 3Q 2022 See Appendix for major project CAPEX and production cadence Drilling in progress Planned well Drilled well
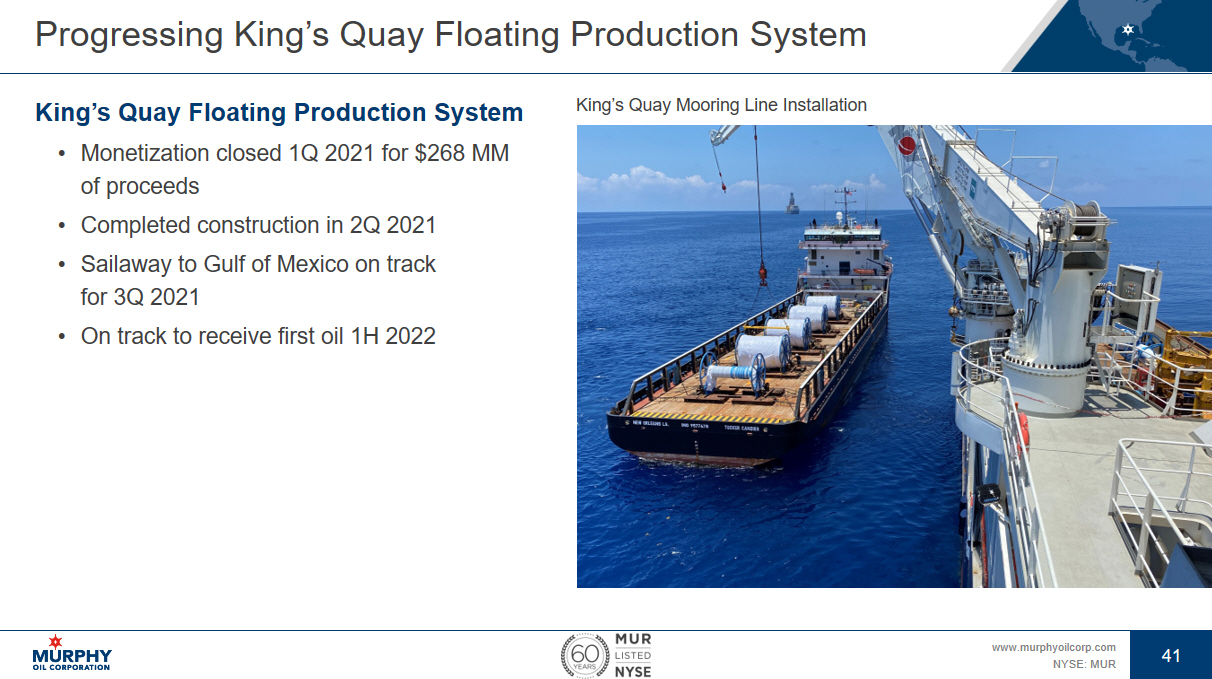
41 www.murphyoilcorp.com NYSE: MUR 41 Progressing King’s Quay Floating Production System King’s Quay Floating Production System • Monetization closed 1Q 2021 for $268 MM of proceeds • Completed construction in 2Q 2021 • Sailaway to Gulf of Mexico on track for 3Q 2021 • On track to receive first oil 1H 2022 King’s Quay Mooring Line Installation

42 www.murphyoilcorp.com NYSE: MUR 42 Gulf of Mexico Major Projects CAPEX and Production Cadence Major Projects Net Production MBOEPD Major projects include Khaleesi, Mormont, Samurai and St. Malo waterflood Major Projects Net CAPEX $MM 0 15 30 45 60 75 90 1Q 2021 2Q 2021 3Q 2021 4Q 2021 1Q 2022 2Q 2022 3Q 2022 4Q 2022 1Q 2023 2Q 2023 3Q 2023 4Q 2023 1Q 2024 2Q 2024 3Q 2024 4Q 2024 0 10 20 30 2022 2023 2024 2025 2026 2027 2028 2029 2030 2031 2032 2033 2034 2035 2036 2037 2038 2039 2040 2041 2042

43 www.murphyoilcorp.com NYSE: MUR 43 Eagle Ford Shale Peer Acreage OIL CONDENSATE GAS EOG EP Energy Murphy Ensign Ovintiv Marathon ConocoPhillips Lewis/BP Chesapeake Mesquite Energy Callon BP Equinor Sundance

44 www.murphyoilcorp.com NYSE: MUR 44 Kaybob Duvernay Peer Acreage

45 www.murphyoilcorp.com NYSE: MUR 45 T74 T75 T76 T77 T78 T79 T80 T77 T78 T79 T80 R12W6R13R14R15R16R17R18R19R20 R13W6 Tupper Montney Peer Acreage ARC Montney Shell Montney Advantage Montney Other Competitor Montney Open Crown - Montney Tourmaline Montney Ovintiv Montney Birchcliff Montney Dry Gas Limit TCPL Pipeline Murphy Montney Facility Battery Murphy Pipeline 0 10 Miles Dawson Creek

46 www.murphyoilcorp.com NYSE: MUR 46 Placid Montney Peer Acreage

47 www.murphyoilcorp.com NYSE: MUR 47 PRODUCING ASSETS Asset Operator Murphy WI 1 Cascade Murphy 80% Chinook Murphy 80% Clipper Murphy 80% Cottonwood Murphy 80% Dalmatian Murphy 56% Front Runner Murphy 50% Habanero Shell 27% Kodiak Kosmos 48% Lucius Anadarko 13% Marmalard Murphy 27% Marmalard East Murphy 68% Medusa Murphy 48% Neidermeyer Murphy 53% Powerball Murphy 75% Son of Bluto II Murphy 27% St. Malo Chevron 20% Tahoe W&T 24% Thunder Hawk Murphy 50% Gulf of Mexico Murphy Blocks Note: Anadarko is a wholly - owned subsidiary of Occidental Petroleum 1 Excluding noncontrolling interest GC WR EW KC GB MC DC LU AT LL HE VK DD Miles 50 0 Lucius Cascade St. Malo Chinook Front Runner Medusa Dalmatian S. Murphy WI Block Offshore Platform FPSO 2021 Well Discovery Key Exploration Project Gulf of Mexico Exploration Area Delta House Rushmore Guilder Silver Dollar West Ninja Silver Dollar Silverback Blanco Creek Carver / Donzi King’s Quay Longfellow Oak Whydah/Leibniz Oso / Liberty Chinook DT Hoffe Park
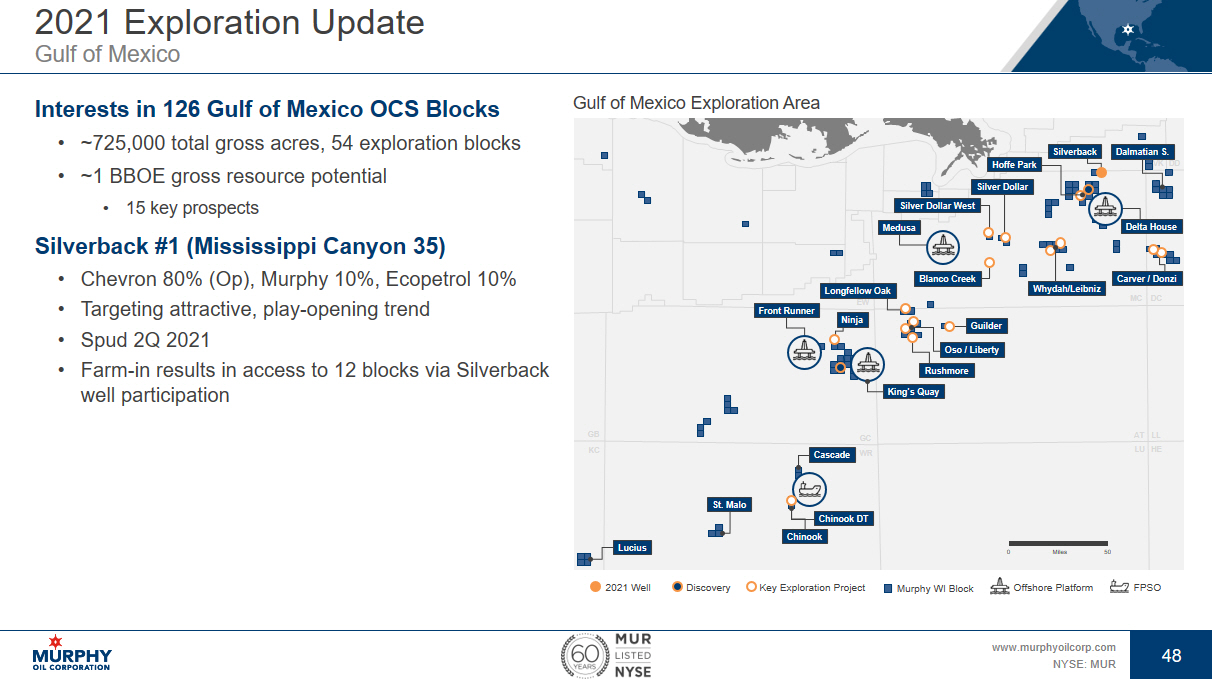
48 www.murphyoilcorp.com NYSE: MUR 48 2021 Exploration Update Gulf of Mexico Interests in 126 Gulf of Mexico OCS Blocks • ~725,000 total gross acres, 54 exploration blocks • ~1 BBOE gross resource potential • 15 key prospects Silverback #1 (Mississippi Canyon 35) • Chevron 80% (Op), Murphy 10%, Ecopetrol 10% • Targeting attractive, play - opening trend • Spud 2Q 2021 • Farm - in results in access to 12 blocks via Silverback well participation GC WR EW KC GB MC DC LU AT LL HE VK DD Miles 50 0 Lucius Cascade St. Malo Chinook Front Runner Medusa Dalmatian S. Murphy WI Block Offshore Platform FPSO 2021 Well Discovery Key Exploration Project Gulf of Mexico Exploration Area Delta House Rushmore Guilder Silver Dollar West Ninja Silver Dollar Silverback Blanco Creek Carver / Donzi King’s Quay Longfellow Oak Whydah/Leibniz Oso / Liberty Chinook DT Hoffe Park
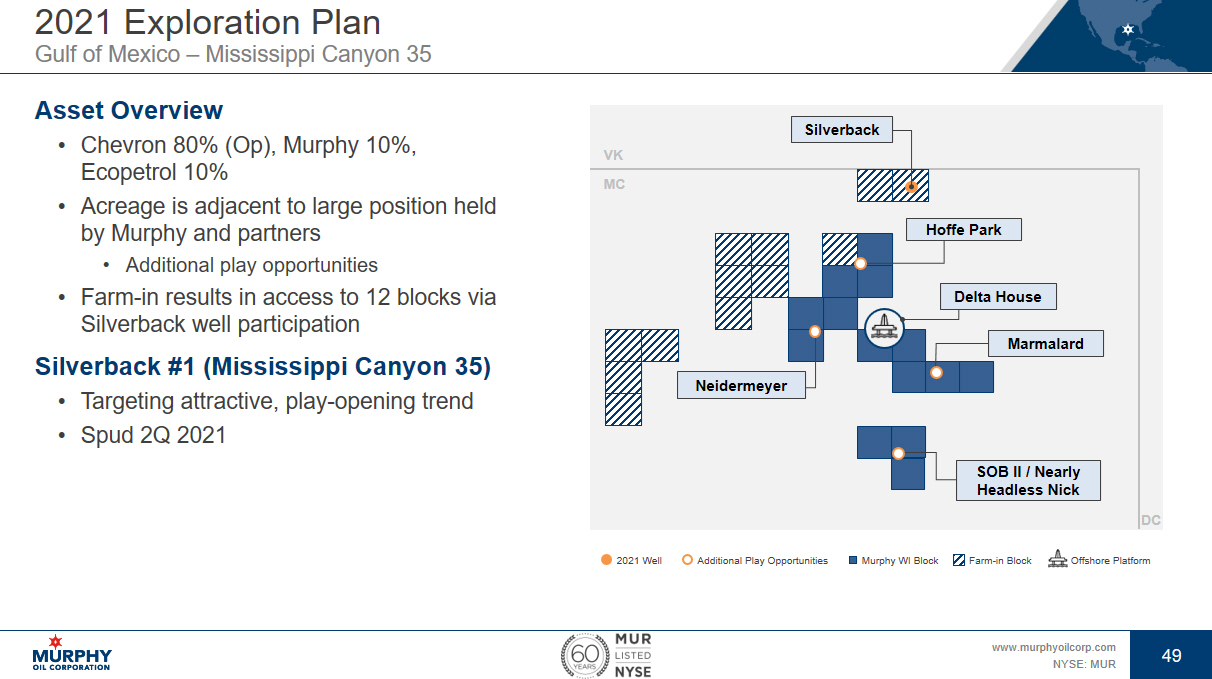
49 www.murphyoilcorp.com NYSE: MUR 49 2021 Exploration Plan Gulf of Mexico – Mississippi Canyon 35 Murphy WI Block Offshore Platform 2021 Well Additional Play Opportunities Farm - in Block MC VK Delta House Marmalard Neidermeyer Hoffe Park DC Silverback SOB II / Nearly Headless Nick Asset Overview • Chevron 80% (Op), Murphy 10%, Ecopetrol 10% • Acreage is adjacent to large position held by Murphy and partners • Additional play opportunities • Farm - in results in access to 12 blocks via Silverback well participation Silverback #1 (Mississippi Canyon 35) • Targeting attractive, play - opening trend • Spud 2Q 2021

50 www.murphyoilcorp.com NYSE: MUR 50 2021 Exploration Plan Sergipe - Alagoas Basin, Brazil Asset Overview • ExxonMobil 50% (Op), Enauta Energia S.A. 30%, Murphy 20% • Hold WI in 9 blocks, spanning >1.6 MM acres • >2.8 BN BOE discovered in basin • >1.2 BN BOE in deepwater since 2007 • Material opportunities identified on Murphy WI blocks Drilling Program • On track for drilling Cutthroat - 1 in 2H 2021 • ~$15 MM net cost • Mean to upward gross resource potential • 500 MMBOE – 1,050 MMBOE • Continuing to mature inventory and plan future well timing Sergipe - Alagoas Basin All blocks begin with SEAL - M 0 50 Kilometers 351 428 430 503 505 501 575 573 637 Murphy WI Block Other Block Discovered Field BRAZIL Planned Well Cutthroat - 1

51 www.murphyoilcorp.com NYSE: MUR 51 2021 Exploration Update Potiguar Basin, Brazil Asset Overview • Wintershall Dea 70% (Op), Murphy 30% • Hold WI in 3 blocks, spanning ~775 M gross acres • Proven oil basin in proximity to Pitu oil discovery Extending the Play into the Deepwater • >2.1 BBOE discovered in basin • Onshore and shelf exploration • Pitu step - out into deepwater • Interpreting final seismic data • Targeting late 2022 to early 2023 spud Petrobras/ Shell Shell Petrobras/ Shell Petrobras/ BP/GALP Petrobras/ BP/GALP Petrobras Petrobras/BP/ GALP/IBV Petrobras/BP/ GALP/IBV POT - M - 857 POT - M - 863 POT - M - 865 Pitu BRAZIL 0 50 Kilometers Murphy WI Block Other Block Discovered Field Potiguar Basin

52 www.murphyoilcorp.com NYSE: MUR 52 Block 5 Overview • Murphy 40% (Op), Petronas 30%, Wintershall Dea 30% • 34 leads / prospects • Mean to upward gross resource potential • 800 MMBO – 2,000 MMBO • Proven oil basin in proximity to multiple oil discoveries in Miocene section • Targeting exploration drilling campaign in 2022 • Initial prospects identified – Batopilas and Linares • Progressing permitting and regulatory approvals Cholula Appraisal Program • Discretionary 3 - year program approved by CNH • Up to 3 appraisal wells + geologic/engineering studies 2021 Exploration Update Salina Basin, Mexico Salina Basin Murphy WI Block Other Block Planned Well Discovery 0 60 Kilometers Cholula Block 5 Batopilas Saasken 200 – 300 MMBOIP Zama 670 MMBOE recoverable Polok 650’ net pay Chinwol 500’ net pay 0 3 0 Kilometers Cholula Block 5 Saasken 200 – 300 MMBOIP Zama 670 MMBOE recoverable Polok 650’ net pay Chinwol 500’ net pay MEXICO Linares Batopilas

53 www.murphyoilcorp.com NYSE: MUR 53 Asset Overview • Murphy 40% (Op), PVEP 35%, SKI 25% Block 15 - 1/05 • Received approval of the Lac Da Vang (LDV) retainment / development area • LDV field development plan submitted to government • LDT - 1X discovery in 2019 • Maturing remaining block prospectivity • LDT - 1X discovery and other exploration upside has potential to add bolt - on resources to LDV Development Update Cuu Long Basin, Vietnam Cuu Long Basin Murphy WI Block Murphy Prospect Discovered Field BLOCK 15 - 02/17 15 - 2 15 - 2 16 - 1 15 - 1 09 - 2 - 10 BLOCK 15 - 01/05 SU TU VANG LAC DA VANG TE GIAC TRANG RANG DONG JVPC PHOUNG DONG LAC DA NAU HAI SU DEN HAI SU TRANG LAC DA HONG HAI SU HONG HAI SU BAC HAI SU VANG LAC DA TRANG DISCOVERY SU TU TRANG LAC DA TRANG WEST LAC DA TRANG NORTH WEST 15 km

54 www.murphyoilcorp.com NYSE: MUR 54 Asset Overview • Murphy 40% (Op), PVEP 35%, SKI 25% Block 15 - 2/17 • Signed joint operating agreement with partners in 4Q 2020 • 3 - year primary exploration period • 1 well commitment in 2022 • Seismic reprocessing, geological / geophysical studies ongoing Exploration Update Cuu Long Basin, Vietnam Cuu Long Basin Murphy WI Block Murphy Prospect Discovered Field BLOCK 15 - 02/17 15 - 2 15 - 2 16 - 1 15 - 1 09 - 2 - 10 BLOCK 15 - 01/05 SU TU VANG LAC DA VANG TE GIAC TRANG RANG DONG JVPC PHUONG DONG LAC DA NAU HAI SU DEN HAI SU TRANG LAC DA HONG HAI SU HONG HAI SU BAC HAI SU VANG LAC DA TRANG DISCOVERY SU TU TRANG LAC DA TRANG WEST LAC DA TRANG NORTH WEST 15 km

55 www.murphyoilcorp.com NYSE: MUR 55 J.P. Morgan 2021 Energy, Power & Renewables Conference ROGER W. JENKINS PRESIDENT & CHIEF EXECUTIVE OFFICER JUNE 22, 2021
Serious News for Serious Traders! Try StreetInsider.com Premium Free!
You May Also Be Interested In
- Murphy Oil Corp. (MUR) PT Raised to $55 at Mizuho
- Port Houston Regular Commission Meeting
- NV Gold Announces Secured Loan Terms
Create E-mail Alert Related Categories
SEC FilingsSign up for StreetInsider Free!
Receive full access to all new and archived articles, unlimited portfolio tracking, e-mail alerts, custom newswires and RSS feeds - and more!
