

Form 8-K MACERICH CO For: May 11
 Tweet
Tweet Share
ShareExhibit 99.1

Earnings Results & Supplemental Information
Quarter ended March 31, 2021
The Macerich Company
Earnings Results & Supplemental Information
Quarter Ended March 31, 2021
Table of Contents
All information included in this supplemental financial package is unaudited, unless otherwise indicated.
| Page No. | ||||
| Executive Summary & Financial Highlights |
1-10 | |||
| Executive Summary |
1-5 | |||
| Financial Highlights |
6-10 | |||
| Capital Information |
11-12 | |||
| Capital Information and Market Capitalization |
11 | |||
| Changes in Total Common and Equivalent Shares/Units |
12 | |||
| Financial Data |
13-20 | |||
| Consolidated Statements of Operations (Unaudited) |
13 | |||
| Consolidated Balance Sheet (Unaudited) |
14 | |||
| Non-GAAP Pro Rata Financial Information (Unaudited) |
15-17 | |||
| 2021 Earnings Guidance |
18 | |||
| Supplemental FFO Information |
19 | |||
| Capital Expenditures |
20 | |||
| Operational Data |
21-29 | |||
| Occupancy |
21 | |||
| Average Base Rent Per Square Foot |
22 | |||
| Percentage of Net Operating Income by State |
23 | |||
| Property Listing |
24-27 | |||
| Joint Venture List |
28-29 | |||
| Debt Tables |
30-32 | |||
| Debt Summary |
30 | |||
| Outstanding Debt by Maturity Date |
31-32 | |||
| Development Pipeline |
33-34 | |||
| Corporate Information |
35 | |||
The Macerich Company
Executive Summary
March 31, 2021

We own 50 million square feet of real estate consisting primarily of interests in 46 regional shopping centers. We specialize in successful retail properties in many of the country’s most attractive, densely populated markets with a significant presence on the West Coast, and in Arizona and the Metro New York to Washington, DC corridor. We are a recognized leader in sustainability and have achieved the #1 GRESB ranking in the North American Retail Sector for six straight years (2015 – 2020).
COVID-19 and Other Updates:
Our centers are open and fully operational, and government-imposed restrictions have continued to relax over the past few months as improved vaccination levels continue across the United States. This loosening of restrictions is especially apparent in our key markets of New York and California, which were the most capacity restricted markets in 2020. As a result, and combined with significant pent-up demand and economic stimulus, sales and traffic continue to improve across the portfolio. During the first quarter of 2021, comparable tenant sales across the portfolio were only 2.0% less than the pre-COVID first quarter of 2019, and were 1.9% higher than the pre-COVID first quarter of 2019, excluding the capacity-restricted food and beverage category. In the latter half of March 2021, traffic levels were approaching 80% of pre-COVID levels, when compared to the same timeframe in March 2019. Our rent collections remain strong, with 97% of rent collected for the fourth quarter of 2020 and 95% of rent collected for the first quarter of 2021. At March 31, 2021, portfolio occupancy was 88.5%, which we anticipate will be the lowest level for post-COVID occupancy. For the six months ended March 31, 2021, we have signed leases for nearly the same amount of space as the pre-COVID six-month period ended March 31, 2020. Further, the number of new and renewal leases executed through mid-April 2021 is slightly greater than the number of leases signed during the same pre-COVID period in 2019.
Through our strategic planning and operational expertise, we believe that we have successfully managed through the unprecedented disruption of the COVID-19 pandemic while balancing the many interests of our shareholders, our employees, our retailers and their employees, our shoppers and our communities.
Financial Results for the Quarter:
| • | Net loss attributable to the Macerich Company (the “Company”) was $63.6 million or $0.40 per share-diluted for the quarter ended March 31, 2021, compared to net income attributable to the Company of $7.5 million or $0.05 per share-diluted attributable to the Company for the quarter ended March 31, 2020. |
1
The Macerich Company
Executive Summary
March 31, 2021
| • | Funds from operations-diluted (“FFO”), excluding financing expense in connection with Chandler Freehold, was $75.6 million or $0.45 per share-diluted during the first quarter of 2021, compared to $122.7 million or $0.81 per share-diluted for the quarter ended March 31, 2020. These declines were expected and as we had previously communicated, retroactive rental abatements relating to 2020 rent were finalized in the first quarter of 2021, with $29 million of COVID-related rent abatements. |
| • | Same center net operating income, excluding lease termination income, decreased 29% in the first quarter of 2021 compared to the first quarter of 2020 as a result of COVID-related retroactive rent abatements and reduced occupancy. |
Operations:
| • | During the first quarter of 2021, comparable tenant sales across the portfolio were only 2.0% less than the pre-COVID first quarter of 2019, and were 1.9% higher than the pre-COVID first quarter of 2019, excluding the capacity-restricted food and beverage category. |
| • | Our mall portfolio occupancy was 88.5% at March 31, 2021, compared to 89.7% at December 31, 2020. |
| • | Average rent per square foot was $63.47 at March 31, 2021. This represents a 1.6% increase compared to $62.44 as of March 31, 2020, and a 2.6% increase compared to $61.87 at December 31, 2020. |
| • | During the first quarter of 2021, we signed 181 leases for 700,000 square feet (excluding COVID workout deals), approximately the same amount of leased space that was signed during the first quarter of 2020. |
| • | To help our communities during the pandemic, we continue to offer COVID-19 testing and/or vaccination facilities at our properties. |
Redevelopment:
We have significantly reduced our planned development expenditures to conserve capital given uncertainties posed by COVID-19, however, we continue to focus on numerous transformative redevelopments:
| • | One Westside in Los Angeles, a 584,000 square foot creative office redevelopment, continues on schedule with a planned delivery to Google in early 2022. |
| • | We have executed a lease with Primark to replace JC Penney at Green Acres Mall in Valley Stream, NY. |
| • | We have numerous near-term openings with many other large-format spaces, including among others: Primark at Fashion District Philadelphia and Tysons Corner, a second to portfolio location with Life Time Athletic at Broadway Plaza, Crunch Fitness at Deptford Mall in a portion of the former Sears store, Barbarie’s Fitness at Danbury Fair, Dave & Buster’s at Vintage Faire in a portion of the former Sears store, Kids Empire at SanTan Village, X-Lanes at Fresno Fashion Fair, County of San Bernardino offices at Inland Center, Ross at Pacific View and ModelLand at Santa Monica Place. |
2
The Macerich Company
Executive Summary
March 31, 2021
Balance Sheet:
On April 14, 2021, we completed the renewal of our secured, corporate credit facility. The new facility is $700 million, and includes a $525 million revolving line of credit and a $175 million term loan. The revolving line of credit has a two-year term, plus a one-year renewal option, and the term loan has a three-year term. The revolving line of credit may be expanded from $525 million to $800 million, subject to certain conditions. As of the date of closing, the facility’s floating interest rate was LIBOR + 2.75% and the balance was $495 million, including a fully drawn term loan of $175 million.
During 2021, we sold $732 million of common equity through our at-the-market offering programs at an average price of $13.15 per share. At the end of March 2021, we sold a 95% interest in Paradise Valley Mall to a newly-formed joint venture for $95 million. The net proceeds from both the common equity and Paradise Valley sales, along with cash on hand, were used to repay nearly $1 billion of debt as part of our commitment to reduce leverage over time.
During the first quarter of 2021, we secured two year extensions (including renewal options) of both the $257 million loan on Green Acres Mall and the $125 million loan on the adjacent Green Acres Commons. Over the past three quarters, using minimal cash resources, we have now secured extensions of six mortgage loans totaling approximately $950 million, with extended loan terms ranging up to three years for Danbury Fair Mall, The Shops at Atlas Park, Fashion Outlets of Niagara Falls, FlatIron Crossing, Green Acres Mall and Green Acres Commons.
At March 31, 2021, our total debt including our pro-rata share of joint ventures was $8.66 billion, including consolidated debt of $6.01 billion, at a weighted average annual rate of 3.66%, and at the closing of our corporate credit facility on April 14, 2021, our total debt including our pro-rata share of joint ventures was approximately $7.67 billion, including consolidated debt of $5.03 billion.
2021 Earnings Guidance:
At this time, we are amending our 2021 guidance for estimated EPS-diluted and re-affirming our guidance for estimated Funds from Operations (“FFO”) per share-diluted. A reconciliation of estimated EPS-diluted to FFO per share-diluted follows:
| Year 2021 Guidance | ||
| Earnings per share-diluted |
($0.55 - $0.35) | |
| Plus: real estate depreciation and amortization |
$2.32 - $2.32 | |
|
| ||
| FFO per share-diluted |
$1.77 - $1.97 | |
|
|
This guidance range assumes no further government mandated shutdowns of our retail properties.
More details of the guidance assumptions are included on page 18.
Dividend:
On April 29, 2021, we declared a quarterly cash dividend of $0.15 per share of common stock. The dividend is payable on June 3, 2021 to stockholders of record at the close of business on May 7, 2021.
3
The Macerich Company
Executive Summary
March 31, 2021
Investor Conference Call:
We will provide an online Web simulcast and rebroadcast of our quarterly earnings conference call. The call will be available on The Macerich Company’s website at www.macerich.com (Investors Section). The call begins on May 11, 2021 at 10:00 AM Pacific Time. To listen to the call, please go to the website at least 15 minutes prior to the call in order to register and download audio software if needed. An online replay at www.macerich.com (Investors Section) will be available for one year after the call.
About Macerich and this Document
The Company is a fully integrated, self-managed and self-administered real estate investment trust (“REIT”), which focuses on the acquisition, leasing, management, development and redevelopment of regional malls throughout the United States. The Company is the sole general partner of, and owns a majority of the ownership interests in, The Macerich Partnership, L.P., a Delaware limited partnership (the “Operating Partnership” or the “OP”) and conducts all of its operations through the Operating Partnership and the Company’s management companies (collectively, the “Management Companies”).
As of March 31, 2021, the Operating Partnership owned or had an ownership interest in 50 million square feet of gross leasable area (“GLA”) consisting primarily of interests in 46 regional shopping centers and five community/power shopping centers. These 51 centers (which include any related office space) are referred to hereinafter as the “Centers” unless the context requires otherwise.
All references to the Company in this document include the Company, those entities owned or controlled by the Company and predecessors of the Company, unless the context indicates otherwise.
The Company presents certain measures in this document on a pro rata basis which represents (i) the measure on a consolidated basis, minus the Company’s partners’ share of the measure from its consolidated joint ventures (calculated based upon the partners’ percentage ownership interest); plus (ii) the Company’s share of the measure from its unconsolidated joint ventures (calculated based upon the Company’s percentage ownership interest). Management believes that these measures provide useful information to investors regarding its financial condition and/or results of operations because they include the Company’s share of the applicable amount from unconsolidated joint ventures and exclude the Company’s partners’ share from consolidated joint ventures, in each case presented on the same basis. The Company has several significant joint ventures and the Company believes that presenting various measures in this manner can help investors better understand the Company’s financial condition and/or results of operations after taking into account its economic interest in these joint ventures. Management also uses these measures to evaluate regional property level performance and to make decisions about resource allocations. The Company’s economic interest (as distinct from its legal ownership interest) in certain of its joint ventures could fluctuate from time to time and may not wholly align with its legal ownership interests because of provisions in certain joint venture agreements regarding distributions of cash flow based on capital account balances, allocations of profits and losses, payments of preferred returns and control over major decisions. Additionally, the Company does not control its unconsolidated joint ventures and the presentation of certain items, such as assets, liabilities, revenues and expenses, from these unconsolidated joint ventures does not represent the Company’s legal claim to such items.
Note: This document contains statements that constitute forward-looking statements which can be identified by the use of words, such as “will,” “expects,” “anticipates,” “assumes,” “believes,” “estimated,” “guidance,” “projects,” “scheduled” and similar expressions that do not relate to historical matters, and includes expectations regarding the Company’s future operational results as well as development, redevelopment and expansion activities. Stockholders are cautioned that any such forward-looking statements are not guarantees of future
4
The Macerich Company
Executive Summary
March 31, 2021
performance and involve risks, uncertainties and other factors that may cause actual results, performance or achievements of the Company to vary materially from those anticipated, expected or projected. Such factors include, among others, general industry, as well as national, regional and local economic and business conditions, which will, among other things, affect demand for retail space or retail goods, availability and creditworthiness of current and prospective tenants, anchor or tenant bankruptcies, closures, mergers or consolidations, lease rates, terms and payments, interest rate fluctuations, availability, terms and cost of financing and operating expenses; adverse changes in the real estate markets including, among other things, competition from other companies, retail formats and technology, risks of real estate development and redevelopment, and acquisitions and dispositions; the continuing adverse impact of the novel coronavirus (COVID-19) on the U.S., regional and global economies and the financial condition and results of operations of the Company and its tenants; the liquidity of real estate investments; governmental actions and initiatives (including legislative and regulatory changes); environmental and safety requirements; and terrorist activities or other acts of violence which could adversely affect all of the above factors. The reader is directed to the Company’s various filings with the Securities and Exchange Commission, including the Annual Report on Form 10-K for the year ended December 31, 2020 for a discussion of such risks and uncertainties, which discussion is incorporated herein by reference. You are cautioned not to place undue reliance on these forward-looking statements, which speak only as of the date of this document. The Company does not intend, and undertakes no obligation, to update any forward-looking information to reflect events or circumstances after the date of this document or to reflect the occurrence of unanticipated events unless required by law to do so.
(See attached tables)
##
5
THE MACERICH COMPANY
FINANCIAL HIGHLIGHTS
(IN THOUSANDS, EXCEPT PER SHARE AMOUNTS)
Results of Operations:
| For the Three Months | ||||||||
| Ended March 31, | ||||||||
| Unaudited | ||||||||
| 2021 | 2020 | |||||||
| Revenues: |
||||||||
| Leasing revenue |
$ | 179,535 | $ | 210,721 | ||||
| Other income |
5,321 | 9,258 | ||||||
| Management Companies’ revenues |
5,568 | 6,973 | ||||||
|
|
|
|
|
|||||
| Total revenues |
190,424 | 226,952 | ||||||
|
|
|
|
|
|||||
| Expenses: |
||||||||
| Shopping center and operating expenses |
76,155 | 70,725 | ||||||
| Management Companies’ operating expenses |
14,843 | 16,224 | ||||||
| Leasing expenses |
5,166 | 7,425 | ||||||
| REIT general and administrative expenses |
8,087 | 6,821 | ||||||
| Depreciation and amortization |
78,396 | 82,213 | ||||||
| Interest expense (a) |
53,896 | 8,074 | ||||||
|
|
|
|
|
|||||
| Total expenses |
236,543 | 191,482 | ||||||
|
|
|
|
|
|||||
| Equity in income of unconsolidated joint ventures |
1,910 | 9,698 | ||||||
| Income tax (expense) benefit |
(2,238 | ) | 266 | |||||
| (Loss) on sale or write down of assets, net |
(21,283 | ) | (36,703 | ) | ||||
|
|
|
|
|
|||||
| Net (loss) income |
(67,730 | ) | 8,731 | |||||
| Less net (loss) income attributable to noncontrolling interests |
(4,126 | ) | 1,209 | |||||
|
|
|
|
|
|||||
| Net (loss) income attributable to the Company |
($ | 63,604 | ) | $ | 7,522 | |||
|
|
|
|
|
|||||
| Weighted average number of shares outstanding—basic |
158,580 | 141,437 | ||||||
|
|
|
|
|
|||||
| Weighted average shares outstanding, assuming full conversion of OP Units (b) |
169,436 | 151,915 | ||||||
|
|
|
|
|
|||||
| Weighted average shares outstanding—Funds From Operations (“FFO”)—diluted (b) |
169,436 | 151,915 | ||||||
|
|
|
|
|
|||||
| Earnings per share (“EPS”)—basic |
($ | 0.40 | ) | $ | 0.05 | |||
|
|
|
|
|
|||||
| EPS—diluted |
($ | 0.40 | ) | $ | 0.05 | |||
|
|
|
|
|
|||||
| Dividend paid per share |
$ | 0.15 | $ | 0.50 | ||||
|
|
|
|
|
|||||
| FFO—basic and diluted (b) (c) |
$ | 73,004 | $ | 168,389 | ||||
|
|
|
|
|
|||||
| FFO—basic and diluted, excluding financing expense in connection with Chandler Freehold (b) (c) |
$ | 75,555 | $ | 122,682 | ||||
|
|
|
|
|
|||||
| FFO per share—basic and diluted (b) (c) |
$ | 0.43 | $ | 1.11 | ||||
|
|
|
|
|
|||||
| FFO per share—basic and diluted, excluding financing expense in connection with Chandler Freehold (b) (c) |
$ | 0.45 | $ | 0.81 | ||||
|
|
|
|
|
|||||
6
THE MACERICH COMPANY
FINANCIAL HIGHLIGHTS
(IN THOUSANDS, EXCEPT PER SHARE AMOUNTS)
| (a) | The Company accounts for its investment in the Chandler Fashion Center and Freehold Raceway Mall (“Chandler Freehold”) joint venture as a financing arrangement. As a result, the Company has included in interest expense (i) a credit of $863 and $48,385 to adjust for the change in the fair value of the financing arrangement obligation during the three months ended March 31, 2021 and 2020, respectively; (ii) distributions of ($1,232) and $1,464 to its partner representing the partner’s share of net (loss) income for the three months ending March 31, 2021 and 2020, respectively; and (iii) distributions of $3,414 and $2,678 to its partner in excess of the partner’s share of net income for the three months ended March 31, 2021 and 2020, respectively. |
| (b) | The Operating Partnership has operating partnership units (“OP units”). OP units can be converted into shares of Company common stock. Conversion of the OP units not owned by the Company has been assumed for purposes of calculating FFO per share and the weighted average number of shares outstanding. The computation of average shares for FFO—diluted includes the effect of share and unit-based compensation plans, stock warrants and convertible senior notes using the treasury stock method. It also assumes conversion of MACWH, LP preferred and common units to the extent they are dilutive to the calculation. |
| (c) | The Company uses FFO in addition to net income to report its operating and financial results and considers FFO and FFO-diluted as supplemental measures for the real estate industry and a supplement to Generally Accepted Accounting Principles (“GAAP”) measures. The National Association of Real Estate Investment Trusts (“Nareit”) defines FFO as net income (loss) (computed in accordance with GAAP), excluding gains (or losses) from sales of properties, plus real estate related depreciation and amortization, impairment write-downs of real estate and write-downs of investments in an affiliate where the write-downs have been driven by a decrease in the value of real estate held by the affiliate and after adjustments for unconsolidated joint ventures. Adjustments for unconsolidated joint ventures are calculated to reflect FFO on the same basis. |
The Company accounts for its joint venture in Chandler Freehold as a financing arrangement. In connection with this treatment, the Company recognizes financing expense on (i) the changes in fair value of the financing arrangement, (ii) any payments to such joint venture partner equal to their pro rata share of net income and (iii) any payments to such joint venture partner less than or in excess of their pro rata share of net income. The Company excludes the noted expenses related to the changes in fair value and for the payments to such joint venture partner less than or in excess of their pro rata share of net income.
The Company also presents FFO excluding financing expense in connection with Chandler Freehold.
FFO and FFO on a diluted basis are useful to investors in comparing operating and financial results between periods. This is especially true since FFO excludes real estate depreciation and amortization, as the Company believes real estate values fluctuate based on market conditions rather than depreciating in value ratably on a straight-line basis over time. The Company believes that such a presentation also provides investors with a more meaningful measure of its operating results in comparison to the operating results of other REITs. In addition, the Company believes that FFO excluding financing expense in connection with Chandler Freehold provides useful supplemental information regarding the Company’s performance as it shows a more meaningful and consistent comparison of the Company’s operating performance and allows investors to more easily compare the Company’s results. The Company believes that FFO on a diluted basis is a measure investors find most useful in measuring the dilutive impact of convertible securities.
The Company further believes that FFO does not represent cash flow from operations as defined by GAAP, should not be considered as an alternative to net income (loss) as defined by GAAP, and is not indicative of cash available to fund all cash flow needs. The Company also cautions that FFO as presented, may not be comparable to similarly titled measures reported by other REITs.
7
THE MACERICH COMPANY
FINANCIAL HIGHLIGHTS
(IN THOUSANDS, EXCEPT PER SHARE AMOUNTS)
Reconciliation of net (loss) income attributable to the Company to FFO attributable to common stockholders and unit holders—basic and diluted, excluding financing expense in connection with Chandler Freehold (c):
| For the Three Months |
||||||||
| Ended March 31, | ||||||||
| Unaudited | ||||||||
| 2021 | 2020 | |||||||
| Net (loss) income attributable to the Company |
($ | 63,604 | ) | $ | 7,522 | |||
| Adjustments to reconcile net (loss) income attributable to the Company to FFO attributable to common stockholders and unit holders—basic and diluted: |
||||||||
| Noncontrolling interests in the OP |
(4,356 | ) | 557 | |||||
| Loss on sale or write down of consolidated assets, net |
21,283 | 36,703 | ||||||
| Add: gain on undepreciated asset sales or write-down from consolidated assets |
2,905 | — | ||||||
| Loss on write down of consolidated non-real estate assets |
(1,200 | ) | — | |||||
| Noncontrolling interests share of loss on sale or write-down of consolidated joint ventures, net |
(46 | ) | — | |||||
| Gain on sale or write down of assets from unconsolidated joint ventures (pro rata), net |
(27 | ) | — | |||||
| Depreciation and amortization on consolidated assets |
78,396 | 82,213 | ||||||
| Less depreciation and amortization allocable to noncontrolling interests in consolidated joint ventures |
(4,075 | ) | (3,789 | ) | ||||
| Depreciation and amortization on unconsolidated joint ventures (pro rata) |
47,106 | 49,509 | ||||||
| Less: depreciation on personal property |
(3,378 | ) | (4,326 | ) | ||||
|
|
|
|
|
|||||
| FFO attributable to common stockholders and unit holders—basic and diluted |
73,004 | 168,389 | ||||||
| Financing expense in connection with Chandler Freehold |
2,551 | (45,707 | ) | |||||
|
|
|
|
|
|||||
| FFO attributable to common stockholders and unit holders, excluding financing expense in connection with Chandler Freehold—diluted |
$ | 75,555 | $ | 122,682 | ||||
|
|
|
|
|
|||||
Reconciliation of EPS to FFO per share—diluted (c):
| For the Three Months Ended March 31, |
||||||||
| Unaudited | ||||||||
| 2021 | 2020 | |||||||
| EPS—diluted |
($ | 0.40 | ) | $ | 0.05 | |||
| Per share impact of depreciation and amortization of real estate |
0.70 | 0.82 | ||||||
| Per share impact of loss on sale or write down of assets, net |
0.13 | 0.24 | ||||||
|
|
|
|
|
|||||
| FFO per share—basic and diluted |
$ | 0.43 | $ | 1.11 | ||||
| Per share impact of financing expense in connection with Chandler Freehold. |
0.02 | (0.30 | ) | |||||
|
|
|
|
|
|||||
| FFO per share—basic and diluted, excluding financing expense in connection with Chandler Freehold |
$ | 0.45 | $ | 0.81 | ||||
|
|
|
|
|
|||||
8
THE MACERICH COMPANY
FINANCIAL HIGHLIGHTS
(IN THOUSANDS, EXCEPT PER SHARE AMOUNTS)
Reconciliation of Net (loss) income attributable to the Company to Adjusted EBITDA:
| For the Three Months Ended March 31, |
||||||||
| Unaudited | ||||||||
| 2021 | 2020 | |||||||
| Net (loss) income attributable to the Company |
($ | 63,604 | ) | $ | 7,522 | |||
| Interest expense—consolidated assets |
53,896 | 8,074 | ||||||
| Interest expense—unconsolidated joint ventures (pro rata) |
27,065 | 26,988 | ||||||
| Depreciation and amortization—consolidated assets |
78,396 | 82,213 | ||||||
| Depreciation and amortization—unconsolidated joint ventures (pro rata) |
47,106 | 49,509 | ||||||
| Noncontrolling interests in the OP |
(4,356 | ) | 557 | |||||
| Less: Interest expense and depreciation and amortization allocable to noncontrolling interests in consolidated joint ventures |
(6,643 | ) | (8,963 | ) | ||||
| Loss on sale or write down of assets, net—consolidated assets |
21,283 | 36,703 | ||||||
| Gain on sale or write down of assets, net—unconsolidated joint ventures (pro rata) |
(27 | ) | — | |||||
| Add: Noncontrolling interests share of loss on sale or write-down of consolidated joint ventures, net |
(46 | ) | — | |||||
| Income tax expense (benefit) |
2,238 | (266 | ) | |||||
| Distributions on preferred units |
90 | 100 | ||||||
|
|
|
|
|
|||||
| Adjusted EBITDA (d) |
$ | 155,398 | $ | 202,437 | ||||
|
|
|
|
|
|||||
Reconciliation of Adjusted EBITDA to Net Operating Income (“NOI”) and to NOI—Same Centers:
| For the Three Months Ended March 31, |
||||||||
| Unaudited | ||||||||
| 2021 | 2020 | |||||||
| Adjusted EBITDA (d) |
$ | 155,398 | $ | 202,437 | ||||
| REIT general and administrative expenses |
8,087 | 6,821 | ||||||
| Management Companies’ revenues |
(5,568 | ) | (6,973 | ) | ||||
| Management Companies’ operating expenses |
14,843 | 16,224 | ||||||
| Leasing expenses, including joint ventures at pro rata |
5,823 | 8,215 | ||||||
| Straight-line and above/below market adjustments |
(10,864 | ) | (13,039 | ) | ||||
|
|
|
|
|
|||||
| NOI—All Centers |
167,719 | 213,685 | ||||||
| NOI of non-Same Centers |
(15,093 | ) | (2,843 | ) | ||||
|
|
|
|
|
|||||
| NOI—Same Centers (e) |
152,626 | 210,842 | ||||||
| Lease termination income of Same Centers |
(4,438 | ) | (1,241 | ) | ||||
|
|
|
|
|
|||||
| NOI—Same Centers, excluding lease termination income (e) |
$ | 148,188 | $ | 209,601 | ||||
|
|
|
|
|
|||||
| NOI—Same Centers percentage change, excluding lease termination income (e) |
-29.30 | % | ||||||
9
THE MACERICH COMPANY
FINANCIAL HIGHLIGHTS
(IN THOUSANDS, EXCEPT PER SHARE AMOUNTS)
| (d) | Adjusted EBITDA represents earnings before interest, income taxes, depreciation, amortization, noncontrolling interests in the OP, extraordinary items, loss (gain) on remeasurement, sale or write down of assets, loss (gain) on extinguishment of debt and preferred dividends and includes joint ventures at their pro rata share. Management considers Adjusted EBITDA to be an appropriate supplemental measure to net income because it helps investors understand the ability of the Company to incur and service debt and make capital expenditures. The Company believes that Adjusted EBITDA should not be construed as an alternative to operating income as an indicator of the Company’s operating performance, or to cash flows from operating activities (as determined in accordance with GAAP) or as a measure of liquidity. The Company also cautions that Adjusted EBITDA, as presented, may not be comparable to similarly titled measurements reported by other companies. |
| (e) | The Company presents Same Center NOI because the Company believes it is useful for investors to evaluate the operating performance of comparable centers. Same Center NOI is calculated using total Adjusted EBITDA and eliminating the impact of the Management Companies’ revenues and operating expenses, leasing expenses (including joint ventures at pro rata), the Company’s REIT general and administrative expenses and the straight-line and above/below market adjustments to minimum rents and subtracting out NOI from non-Same Centers. |
10
The Macerich Company
Supplemental Financial and Operating Information (unaudited)
Capital Information and Market Capitalization
| Period Ended | ||||||||||||
| 3/31/2021 | 12/31/2020 | 12/31/2019 | ||||||||||
| dollars in thousands, except per share data | ||||||||||||
| Closing common stock price per share |
$ | 11.70 | $ | 10.67 | $ | 26.92 | ||||||
| 52 week high |
$ | 25.99 | $ | 26.98 | $ | 47.05 | ||||||
| 52 week low |
$ | 4.81 | $ | 4.81 | $ | 25.53 | ||||||
| Shares outstanding at end of period |
||||||||||||
| Class A non-participating convertible preferred units |
103,235 | 103,235 | 90,619 | |||||||||
| Common shares and partnership units |
206,854,671 | 160,751,189 | 151,892,138 | |||||||||
|
|
|
|
|
|
|
|||||||
| Total common and equivalent shares/units outstanding |
206,957,906 | 160,854,424 | 151,982,757 | |||||||||
|
|
|
|
|
|
|
|||||||
| Portfolio capitalization data |
||||||||||||
| Total portfolio debt, including joint ventures at pro rata |
$ | 8,655,264 | $ | 8,675,076 | $ | 8,074,867 | ||||||
| Equity market capitalization |
2,421,407 | 1,716,317 | 4,091,376 | |||||||||
|
|
|
|
|
|
|
|||||||
| Total market capitalization |
$ | 11,076,671 | $ | 10,391,393 | $ | 12,166,243 | ||||||
|
|
|
|
|
|
|
|||||||
| Debt as a percentage of total market capitalization |
78.1 | % | 83.5 | % | 66.4 | % | ||||||
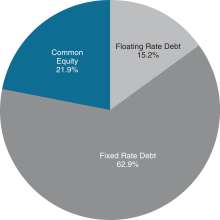
Portfolio Capitalization at March 31, 2021
11
The Macerich Company
Supplemental Financial and Operating Information (unaudited)
Changes in Total Common and Equivalent Shares/Units
| Partnership Units |
Company Common Shares |
Class A Non-Participating Convertible Preferred Units |
Total Common and Equivalent Shares/ Units |
|||||||||||||
| Balance as of December 31, 2020 |
10,980,614 | 149,770,575 | 103,235 | 160,854,424 | ||||||||||||
| Conversion of partnership units to cash |
(55 | ) | — | — | (55 | ) | ||||||||||
| Conversion of partnership units to common shares |
(1,178,530 | ) | 1,178,530 | — | — | |||||||||||
| Issuance of shares from at-the-market (“ATM”) programs |
— | 45,992,318 | — | 45,992,318 | ||||||||||||
| Issuance of stock/partnership units from restricted stock issuance or other share or unit-based plans |
16,466 | 94,753 | — | 111,219 | ||||||||||||
|
|
|
|
|
|
|
|
|
|||||||||
| Balance as of March 31, 2021 |
9,818,495 | 197,036,176 | 103,235 | 206,957,906 | ||||||||||||
|
|
|
|
|
|
|
|
|
|||||||||
12
THE MACERICH COMPANY
CONSOLIDATED STATEMENTS OF OPERATIONS (UNAUDITED)
(Dollars in thousands)
| For the Three Months Ended March 31, 2021 |
||||
| Revenues: |
||||
| Leasing revenue |
$ | 179,535 | ||
| Other income |
5,321 | |||
| Management Companies’ revenues |
5,568 | |||
|
|
|
|||
| Total revenues |
190,424 | |||
|
|
|
|||
| Expenses: |
||||
| Shopping center and operating expenses |
76,155 | |||
| Management Companies’ operating expenses |
14,843 | |||
| Leasing expenses |
5,166 | |||
| REIT general and administrative expenses |
8,087 | |||
| Depreciation and amortization |
78,396 | |||
| Interest expense |
53,896 | |||
|
|
|
|||
| Total expenses |
236,543 | |||
| Equity in income of unconsolidated joint ventures |
1,910 | |||
| Income tax expense |
(2,238 | ) | ||
| Loss on sale or write down of assets, net |
(21,283 | ) | ||
|
|
|
|||
| Net loss |
(67,730 | ) | ||
| Less net loss attributable to noncontrolling interests |
(4,126 | ) | ||
|
|
|
|||
| Net loss attributable to the Company |
$ | (63,604 | ) | |
|
|
|
|||
13
TH MACERICH COMPANY
CONSOLIDATED BALANCE SHEET (UNAUDITED)
AS OF MARCH 31, 2021
(Dollars in thousands)
| ASSETS: |
||||
| Property, net (a) |
$ | 6,517,852 | ||
| Cash and cash equivalents |
1,083,813 | |||
| Restricted cash |
67,255 | |||
| Tenant and other receivables, net |
227,829 | |||
| Right-of-use assets, net |
117,388 | |||
| Deferred charges and other assets, net |
293,790 | |||
| Due from affiliates |
5,231 | |||
| Investments in unconsolidated joint ventures |
1,356,426 | |||
|
|
|
|||
| Total assets |
$ | 9,669,584 | ||
|
|
|
|||
| LIABILITIES AND EQUITY: |
||||
| Mortgage notes payable |
$ | 4,534,585 | ||
| Bank and other notes payable |
1,478,716 | |||
| Accounts payable and accrued expenses |
59,316 | |||
| Lease liabilities |
89,000 | |||
| Other accrued liabilities |
258,029 | |||
| Distributions in excess of investments in unconsolidated joint ventures |
119,118 | |||
| Financing arrangement obligation |
133,515 | |||
|
|
|
|||
| Total liabilities |
6,672,279 | |||
|
|
|
|||
| Commitments and contingencies |
||||
| Equity: |
||||
| Stockholders’ equity: |
||||
| Common stock |
1,971 | |||
| Additional paid-in capital |
5,263,994 | |||
| Accumulated deficit |
(2,426,555 | ) | ||
| Accumulated other comprehensive loss |
(5,514 | ) | ||
|
|
|
|||
| Total stockholders’ equity |
2,833,896 | |||
| Noncontrolling interests |
163,409 | |||
|
|
|
|||
| Total equity |
2,997,305 | |||
|
|
|
|||
| Total liabilities and equity |
$ | 9,669,584 | ||
|
|
|
|||
| (a) | Includes construction in progress of $174,077. |
14
THE MACERICH COMPANY
NON-GAAP PRO RATA FINANCIAL INFORMATION (UNAUDITED)
(DOLLARS IN THOUSANDS)
| For the Three Months Ended March 31, 2021 |
||||||||
| Noncontrolling Interests of Consolidated Joint Ventures (a) |
Company’s Share of Unconsolidated Joint Ventures |
|||||||
| Revenues: |
||||||||
| Leasing revenue |
$ | (10,857 | ) | $ | 97,149 | |||
| Other income |
(673 | ) | 14,414 | |||||
|
|
|
|
|
|||||
| Total revenues |
(11,530 | ) | 111,563 | |||||
|
|
|
|
|
|||||
| Expenses: |
||||||||
| Shopping center and operating expenses |
(4,334 | ) | 34,575 | |||||
| Leasing expenses |
(277 | ) | 934 | |||||
| Depreciation and amortization |
(4,075 | ) | 47,106 | |||||
| Interest expense |
(2,568 | ) | 27,065 | |||||
|
|
|
|
|
|||||
| Total expenses |
(11,254 | ) | 109,680 | |||||
| Equity in income of unconsolidated joint ventures |
— | (1,910 | ) | |||||
| Loss/gain on sale or write down of assets, net |
46 | 27 | ||||||
|
|
|
|
|
|||||
| Net income |
(230 | ) | — | |||||
| Less net income attributable to noncontrolling interests |
(230 | ) | — | |||||
|
|
|
|
|
|||||
| Net income attributable to the Company |
$ | — | $ | — | ||||
|
|
|
|
|
|||||
| (a) | Represents the Company’s partners’ share of consolidated joint ventures. |
15
THE MACERICH COMPANY
NON-GAAP PRO RATA FINANCIAL INFORMATION (UNAUDITED)
(DOLLARS IN THOUSANDS)
| As of March 31, 2021 | ||||||||
| Noncontrolling Interests of Consolidated Joint Ventures (a) |
Company’s Share of Unconsolidated Joint Ventures |
|||||||
| ASSETS: |
||||||||
| Property, net (b) |
$ | (489,435 | ) | $ | 4,159,360 | |||
| Cash and cash equivalents |
(15,061 | ) | 98,137 | |||||
| Restricted cash |
(2,734 | ) | 13,152 | |||||
| Tenant and other receivables, net |
(11,987 | ) | 97,555 | |||||
| Right-of-use assets, net |
(684 | ) | 59,559 | |||||
| Deferred charges and other assets, net |
(30,541 | ) | 108,152 | |||||
| Due from affiliates |
1,642 | (3,009 | ) | |||||
| Investments in unconsolidated joint ventures, at equity |
— | (1,356,426 | ) | |||||
|
|
|
|
|
|||||
| Total assets |
$ | (548,800 | ) | $ | 3,176,480 | |||
|
|
|
|
|
|||||
| LIABILITIES AND EQUITY: |
||||||||
| Mortgage notes payable |
$ | (459,864 | ) | $ | 3,069,120 | |||
| Bank and other notes payable |
— | 32,707 | ||||||
| Accounts payable and accrued expenses |
(3,947 | ) | 40,820 | |||||
| Lease liabilities |
(2,727 | ) | 60,491 | |||||
| Other accrued liabilities |
(26,517 | ) | 92,460 | |||||
| Distributions in excess of investments in unconsolidated joint ventures |
— | (119,118 | ) | |||||
| Financing arrangement obligation |
(133,515 | ) | — | |||||
|
|
|
|
|
|||||
| Total liabilities |
(626,570 | ) | 3,176,480 | |||||
|
|
|
|
|
|||||
| Equity: |
||||||||
| Stockholders’ equity |
99,856 | — | ||||||
| Noncontrolling interests |
(22,086 | ) | — | |||||
|
|
|
|
|
|||||
| Total equity |
77,770 | — | ||||||
|
|
|
|
|
|||||
| Total liabilities and equity |
$ | (548,800 | ) | $ | 3,176,480 | |||
|
|
|
|
|
|||||
| (a) | Represents the Company’s partners’ share of consolidated joint ventures. |
| (b) | This includes $13,582 of construction in progress relating to the Company’s partners’ share from consolidated joint ventures and $337,627 of construction in progress relating to the Company’s share from unconsolidated joint ventures. |
16
THE MACERICH COMPANY
NON-GAAP PRO RATA SCHEDULE OF LEASING REVENUE (UNAUDITED)
(Dollars in thousands)
| For the Three Months Ended March 31, 2021 | ||||||||||||||||||||
| Consolidated | Non- Controlling Interests (a) |
Company’s Consolidated Share |
Company’s Share of Unconsolidated Joint Ventures |
Company’s Total Share |
||||||||||||||||
| Revenues: |
||||||||||||||||||||
| Minimum rents |
$ |
116,145 |
|
$ |
(6,738 |
) |
$ |
109,407 |
|
$ |
67,069 |
|
$ |
176,476 |
| |||||
| Percentage rents |
|
6,920 |
|
|
(539 |
) |
|
6,381 |
|
|
3,234 |
|
|
9,615 |
| |||||
| Tenant recoveries |
|
55,162 |
|
|
(3,186 |
) |
|
51,976 |
|
|
24,521 |
|
|
76,497 |
| |||||
| Other |
|
4,516 |
|
|
(241 |
) |
|
4,275 |
|
|
1,786 |
|
|
6,061 |
| |||||
| Less: Bad debt expense |
|
(3,208 |
) |
|
(153 |
) |
|
(3,361 |
) |
|
539 |
|
|
(2,822 |
) | |||||
|
|
|
|
|
|
|
|
|
|
|
|||||||||||
| Total leasing revenue |
$ |
179,535 |
|
$ |
(10,857 |
) |
$ |
168,678 |
|
$ |
97,149 |
|
$ |
265,827 |
| |||||
|
|
|
|
|
|
|
|
|
|
|
|||||||||||
17
The Macerich Company
2021 Earnings Guidance (unaudited)
The Company is amending its 2021 guidance for estimated EPS-diluted and re-affirming its guidance for estimated FFO per share-diluted. A reconciliation of estimated EPS-diluted to FFO per share-diluted follows:
| Year 2021 Guidance | ||
| Earnings per share-diluted |
($0.55 - $0.35) | |
| Plus: real estate depreciation and amortization |
$2.32 - $2.32 | |
|
| ||
| FFO per share-diluted |
$1.77 - $1.97 | |
|
|
This guidance range assumes no further government mandated shutdowns of our retail properties. This guidance range also assumes $732 million of common equity issued through the Company’s at-the-market offering programs at an average price of $13.15 per share.
| Underlying Assumptions to 2021 Guidance: |
| Year 2021 ($ millions)(a) |
Year 2021 FFO / Share Impact | |||||
| Lease termination income |
$15 | $0.07 | ||||
| Bad debt expense |
($10) | ($0.05) | ||||
| Amortization of acquired above and below-market leases (net-revenue) |
$4 | $0.02 | ||||
| Interest expense(b) |
$290 | $1.45 | ||||
| Capitalized interest |
$23 | $0.11 | ||||
| (a) | All joint venture amounts included at pro rata. |
| (b) | This amount represents the Company’s pro rata share of interest expense, excluding any financing expense in connection with Chandler Freehold, and is reduced by capitalized interest. |
18
The Macerich Company
Supplemental Financial and Operating Information (unaudited)
Supplemental FFO Information(a)
| As of March 31, | ||||||||
| 2021 | 2020 | |||||||
| dollars in millions | ||||||||
| Straight-line rent receivable |
$ | 169.2 | $ | 130.9 | ||||
| For the Three Months Ended March 31, |
||||||||
| 2021 | 2020 | |||||||
| dollars in millions | ||||||||
| Lease termination income |
$ | 4.5 | $ | 1.2 | ||||
| Straight-line rental income |
$ | 9.4 | $ | 3.1 | ||||
| Business development and parking income (b) |
$ | 9.9 | $ | 14.1 | ||||
| Gain on sales or write down of undepreciated assets |
$ | 2.9 | $ | — | ||||
| Amortization of acquired above and below-market leases (net revenue) |
$ | 1.4 | $ | 10.0 | ||||
| Amortization of debt (discounts) premiums |
$ | (0.3 | ) | $ | 0.2 | |||
| Bad debt expense (c) |
$ | 2.8 | $ | 2.5 | ||||
| Leasing expenses |
$ | 5.8 | $ | 8.2 | ||||
| Interest capitalized |
$ | 4.3 | $ | 5.4 | ||||
| Chandler Freehold financing arrangement (d): |
||||||||
| Distributions equal to partners’ share of net (loss) income |
$ | (1.2 | ) | $ | 1.5 | |||
| Distributions in excess of partners’ share of net income (e) |
3.4 | 2.7 | ||||||
| Fair value adjustment (e) |
(0.9 | ) | (48.4 | ) | ||||
|
|
|
|
|
|||||
| Total Chandler Freehold financing arrangement expense (income) (d) |
$ | 1.3 | $ | (44.2 | ) | |||
|
|
|
|
|
|||||
| (a) | All joint venture amounts included at pro rata. |
| (b) | Included in leasing revenue and other income. |
| (c) | Included in leasing revenue for the three months ended March 31, 2021 and 2020. |
| (d) | Included in interest expense. |
| (e) | The Company presents FFO excluding the expenses related to changes in fair value of the financing arrangement and the payments to such joint venture partner less than or in excess of their pro rata share of net income. |
19
The Macerich Company
Supplemental Financial and Operating Information (unaudited)
Capital Expenditures(a)
| For the Three Months Ended March 31, 2021 |
Year Ended 12/31/2020 |
Year Ended 12/31/2019 |
||||||||||
| dollars in millions |
||||||||||||
| Consolidated Centers |
||||||||||||
| Acquisitions of property, building improvement and equipment |
$ | 3.7 | $ | 9.6 | $ | 34.8 | ||||||
| Development, redevelopment, expansions and renovations of Centers |
6.6 | 38.4 | 112.3 | |||||||||
| Tenant allowances |
4.7 | 12.4 | 18.9 | |||||||||
| Deferred leasing charges |
0.5 | 3.0 | 3.2 | |||||||||
|
|
|
|
|
|
|
|||||||
| Total |
$ | 15.5 | $ | 63.4 | $ | 169.2 | ||||||
|
|
|
|
|
|
|
|||||||
| Unconsolidated Joint Venture Centers |
||||||||||||
| Acquisitions of property, building improvement and equipment |
$ | 0.8 | $ | 6.5 | $ | 12.3 | ||||||
| Development, redevelopment, expansions and renovations of Centers |
12.2 | 109.9 | 210.6 | |||||||||
| Tenant allowances |
2.6 | 4.8 | 9.3 | |||||||||
| Deferred leasing charges |
0.8 | 2.1 | 3.4 | |||||||||
|
|
|
|
|
|
|
|||||||
| Total |
$ | 16.4 | $ | 123.3 | $ | 235.6 | ||||||
|
|
|
|
|
|
|
|||||||
| (a) | All joint venture amounts at pro rata. |
20
The Macerich Company
Supplemental Financial and Operating Information (unaudited)
Occupancy(a)
| Regional Shopping Centers: |
Consolidated Centers |
Unconsolidated Joint Venture Centers |
Total Centers |
|||||||||
| 03/31/2021 |
87.9 | % | 89.2 | % | 88.5 | % | ||||||
| 03/31/2020 |
92.8 | % | 93.4 | % | 93.1 | % | ||||||
| 12/31/2020 |
89.6 | % | 89.8 | % | 89.7 | % | ||||||
| 12/31/2019 |
93.7 | % | 94.4 | % | 94.0 | % | ||||||
| (a) | Occupancy is the percentage of mall and freestanding GLA leased as of the last day of the reporting period. Occupancy excludes Centers under development and redevelopment. |
21
The Macerich Company
Supplemental Financial and Operating Information (unaudited)
Average Base Rent Per Square Foot(a)
| Average Base Rent PSF(b) |
Average Base Rent PSF on Leases Executed during the trailing twelve months ended(c) |
Average Base Rent PSF on Leases Expiring during the trailing twelve months ended(d) |
||||||||||
| Consolidated Centers |
||||||||||||
| 03/31/2021 |
$ | 61.08 | $ | 51.24 | $ | 53.77 | ||||||
| 03/31/2020 |
$ | 60.08 | $ | 53.48 | $ | 52.88 | ||||||
| 12/31/2020 |
$ | 59.63 | $ | 48.06 | $ | 52.60 | ||||||
| 12/31/2019 |
$ | 58.76 | $ | 53.29 | $ | 53.20 | ||||||
| Unconsolidated Joint Venture Centers |
||||||||||||
| 03/31/2021 |
$ | 68.22 | $ | 57.10 | $ | 54.94 | ||||||
| 03/31/2020 |
$ | 67.13 | $ | 71.98 | $ | 61.51 | ||||||
| 12/31/2020 |
$ | 66.34 | $ | 57.23 | $ | 52.62 | ||||||
| 12/31/2019 |
$ | 65.67 | $ | 73.05 | $ | 65.22 | ||||||
| All Regional Shopping Centers |
||||||||||||
| 03/31/2021 |
$ | 63.47 | $ | 52.94 | $ | 54.10 | ||||||
| 03/31/2020 |
$ | 62.44 | $ | 58.88 | $ | 55.28 | ||||||
| 12/31/2020 |
$ | 61.87 | $ | 50.69 | $ | 52.60 | ||||||
| 12/31/2019 |
$ | 61.06 | $ | 59.15 | $ | 56.50 | ||||||
| (a) | Average base rent per square foot is based on spaces 10,000 square feet and under. All joint venture amounts are included at pro rata. Centers under development and redevelopment are excluded. |
| (b) | Average base rent per square foot gives effect to the terms of each lease in effect, as of the applicable date, including any concessions, abatements and other adjustments or allowances that have been granted to the tenants. |
| (c) | The average base rent per square foot on leases executed during the period represents the actual rent to be paid during the first twelve months. |
| (d) | The average base rent per square foot on leases expiring during the period represents the final year minimum rent on a cash basis. |
22
The Macerich Company
Supplemental Financial and Operating Information (unaudited)
Percentage of Net Operating Income by State
| State |
% of Portfolio 2020 Real Estate Pro Rata NOI(a) |
|||
| California |
25.8 | % | ||
| New York |
23.1 | % | ||
| Arizona |
17.6 | % | ||
| Pennsylvania & Virginia |
9.1 | % | ||
| Colorado, Illinois & Missouri |
8.8 | % | ||
| New Jersey & Connecticut |
6.7 | % | ||
| Oregon |
4.6 | % | ||
| Other(b) |
4.3 | % | ||
|
|
|
|||
| Total |
100.0 | % | ||
|
|
|
|||
| (a) | The percentage of Portfolio 2020 Real Estate Pro Rata NOI excludes lease termination revenue, straight-line and above/below market adjustments to minimum rents. Portfolio 2020 Real Estate Pro Rata NOI excludes REIT general and administrative expenses, management company revenues, management company expenses and leasing expenses (including joint ventures at pro rata). |
| (b) | “Other” includes Indiana, Iowa, Kentucky, North Dakota and Texas. |
23
The Macerich Company
Property Listing
March 31, 2021
The following table sets forth certain information regarding the Centers and other locations that are wholly owned or partly owned by the Company.
| Count |
Company’s Ownership(a) |
Name of |
Year of Original Construction/ Acquisition |
Year of Most Recent Expansion/ Renovation |
Total GLA(b) |
|||||||||||
| CONSOLIDATED CENTERS: |
|
|||||||||||||||
| 1 | 50.1% | Chandler Fashion Center |
2001/2002 | ongoing | 1,318,000 | |||||||||||
| 2 | 100% | Danbury Fair Mall |
1986/2005 | 2016 | 1,226,000 | |||||||||||
| 3 | 100% | Desert Sky Mall |
1981/2002 | 2007 | 720,000 | |||||||||||
| 4 | 100% | Eastland Mall(c) |
1978/1998 | 1996 | 1,025,000 | |||||||||||
| 5 | 100% | Fashion Outlets of Chicago |
2013/— | — | 538,000 | |||||||||||
| 6 | 100% | Fashion Outlets of Niagara Falls USA |
1982/2011 | 2014 | 689,000 | |||||||||||
| 7 | 50.1% | Freehold Raceway Mall |
1990/2005 | 2007 | 1,552,000 | |||||||||||
| 8 | 100% | Fresno Fashion Fair |
1970/1996 | 2006 | 979,000 | |||||||||||
| 9 | 100% | Green Acres Mall(c) |
1956/2013 | 2016 | 2,069,000 | |||||||||||
| 10 | 100% | Inland Center |
1966/2004 | 2016 | 627,000 | |||||||||||
| 11 | 100% | Kings Plaza Shopping Center(c) |
1971/2012 | 2018 | 1,137,000 | |||||||||||
| 12 | 100% | La Cumbre Plaza(c) |
1967/2004 | 1989 | 492,000 | |||||||||||
| 13 | 100% | NorthPark Mall |
1973/1998 | 2001 | 929,000 | |||||||||||
| 14 | 100% | Oaks, The |
1978/2002 | 2017 | 1,205,000 | |||||||||||
| 15 | 100% | Pacific View |
1965/1996 | 2001 | 886,000 | |||||||||||
| 16 | 100% | Queens Center(c) |
1973/1995 | 2004 | 965,000 | |||||||||||
| 17 | 100% | Santa Monica Place |
1980/1999 | 2015 | 527,000 | |||||||||||
| 18 | 84.9% | SanTan Village Regional Center |
2007/— | 2018 | 1,151,000 | |||||||||||
| 19 | 100% | SouthPark Mall |
1974/1998 | 2015 | 860,000 | |||||||||||
| 20 | 100% | Stonewood Center(c) |
1953/1997 | 1991 | 932,000 | |||||||||||
| 21 | 100% | Superstition Springs Center |
1990/2002 | 2002 | 917,000 | |||||||||||
| 22 | 100% | Towne Mall |
1985/2005 | 1989 | 350,000 | |||||||||||
24
The Macerich Company
Property Listing
March 31, 2021
| Count |
Company’s Ownership(a) |
Name of |
Year of Original Construction/ Acquisition |
Year of Most Recent Expansion/ Renovation |
Total GLA(b) |
|||||||||
| 23 |
100% | Tucson La Encantada |
2002/2002 | 2005 | 246,000 | |||||||||
| 24 |
100% | Valley Mall |
1978/1998 | 1992 | 505,000 | |||||||||
| 25 |
100% | Valley River Center |
1969/2006 | 2007 | 808,000 | |||||||||
| 26 |
100% | Victor Valley, Mall of |
1986/2004 | 2012 | 580,000 | |||||||||
| 27 |
100% | Vintage Faire Mall |
1977/1996 | ongoing | 914,000 | |||||||||
| 28 |
100% | Wilton Mall |
1990/2005 | 2020 | 738,000 | |||||||||
|
|
|
|||||||||||||
| Total Consolidated Centers | 24,885,000 | |||||||||||||
|
|
|
|||||||||||||
| UNCONSOLIDATED JOINT VENTURE CENTERS: |
|
|||||||||||||
| 29 |
60% | Arrowhead Towne Center |
1993/2002 | 2015 | 1,076,000 | |||||||||
| 30 |
50% | Biltmore Fashion Park |
1963/2003 | 2020 | 597,000 | |||||||||
| 31 |
50% | Broadway Plaza |
1951/1985 | 2016 | 912,000 | |||||||||
| 32 |
50.1% | Corte Madera, The Village at |
1985/1998 | 2020 | 500,000 | |||||||||
| 33 |
50% | Country Club Plaza |
1922/2016 | 2015 | 947,000 | |||||||||
| 34 |
51% | Deptford Mall |
1975/2006 | 2020 | 950,000 | |||||||||
| 35 |
51% | FlatIron Crossing |
2000/2002 | 2009 | 1,428,000 | |||||||||
| 36 |
50% | Kierland Commons |
1999/2005 | 2003 | 437,000 | |||||||||
| 37 |
60% | Lakewood Center |
1953/1975 | 2008 | 2,071,000 | |||||||||
| 38 |
60% | Los Cerritos Center |
1971/1999 | 2016 | 1,022,000 | |||||||||
| 39 |
50% | North Bridge, The Shops at(c) |
1998/2008 | — | 669,000 | |||||||||
| 40 |
50% | Scottsdale Fashion Square |
1961/2002 | 2020 | 1,843,000 | |||||||||
| 41 |
60% | South Plains Mall |
1972/1998 | 2017 | 1,152,000 | |||||||||
| 42 |
51% | Twenty Ninth Street(c) |
1963/1979 | 2007 | 845,000 | |||||||||
| 43 |
50% | Tysons Corner Center |
1968/2005 | 2014 | 1,971,000 | |||||||||
| 44 |
60% | Washington Square |
1974/1999 | 2005 | 1,296,000 | |||||||||
| 45 |
19% | West Acres |
1972/1986 | 2001 | 693,000 | |||||||||
|
|
|
|||||||||||||
| Total Unconsolidated Joint Venture Centers | 18,409,000 | |||||||||||||
|
|
|
|||||||||||||
25
The Macerich Company
Property Listing
March 31, 2021
| Count |
Company’s Ownership(a) |
Name of |
Year of Original Construction/ Acquisition |
Year of Most Recent Expansion/ Renovation |
Total GLA(b) |
|||||||||||
| REGIONAL SHOPPING CENTERS UNDER REDEVELOPMENT: |
|
|||||||||||||||
| 46 |
50% | Fashion District Philadelphia(c)(d)(e) |
1977/2014 | 2019 | 850,000 | |||||||||||
|
|
|
|||||||||||||||
| Total Regional Shopping Centers | 44,144,000 | |||||||||||||||
|
|
|
|||||||||||||||
| COMMUNITY / POWER CENTERS: |
|
|||||||||||||||
| 1 |
50% | Atlas Park, The Shops at(f) |
2006/2011 | 2013 | 374,000 | |||||||||||
| 2 |
50% | Boulevard Shops(f) |
2001/2002 | 2004 | 184,000 | |||||||||||
| 3 |
100% | Southridge Center(d) |
1975/1998 | 2013 | 803,000 | |||||||||||
| 4 |
100% | Superstition Springs Power Center(d) |
1990/2002 | — | 206,000 | |||||||||||
| 5 |
100% | The Marketplace at Flagstaff(c)(d) |
2007/— | — | 268,000 | |||||||||||
|
|
|
|||||||||||||||
| Total Community / Power Centers | 1,835,000 | |||||||||||||||
|
|
|
|||||||||||||||
| OTHER ASSETS: |
||||||||||||||||
| 100% | Various(d)(g) |
— | — | 348,000 | ||||||||||||
| 83.2% | Estrella Falls(d) |
2016 | 2016 | 79,000 | ||||||||||||
| 50% | Scottsdale Fashion Square-Office(f) |
1984/2002 | 2016 | 123,000 | ||||||||||||
| 50% | Tysons Corner Center-Office(f) |
1999/2005 | 2012 | 174,000 | ||||||||||||
| 50% | Hyatt Regency Tysons Corner Center(f) |
2015 | 2015 | 290,000 | ||||||||||||
| 50% | VITA Tysons Corner Center(f) |
2015 | 2015 | 510,000 | ||||||||||||
| 50% | Tysons Tower(f) |
2014 | 2014 | 529,000 | ||||||||||||
| OTHER ASSETS UNDER REDEVELOPMENT: |
||||||||||||||||
| 25% | One Westside(f)(h) |
1985/1998 | ongoing | 680,000 | ||||||||||||
| 5% | Paradise Valley Mall(f)(i) |
1979/2002 | |
ongoing |
|
1,198,000 | ||||||||||
|
|
|
|||||||||||||||
| Total Other Assets | 3,931,000 | |||||||||||||||
|
|
|
|||||||||||||||
| Grand Total | 49,910,000 | |||||||||||||||
|
|
|
|||||||||||||||
| (a) | The Company’s ownership interest in this table reflects its legal ownership interest. See footnotes (a) and (b) on pages 28 and 29 regarding the legal versus economic ownership of joint venture entities. |
| (b) | Includes GLA attributable to anchors (whether owned or non-owned) and mall and freestanding stores. |
| (c) | Portions of the land on which the Center is situated are subject to one or more long-term ground leases. With respect to 42 Centers, the underlying land controlled by the Company is owned in fee entirely by the Company, or, in the case of jointly-owned Centers, by the joint venture property partnership or limited liability company. |
| (d) | Included in Consolidated Centers. |
26
The Macerich Company
Property Listing
March 31, 2021
| (e) | On September 19, 2019, the Company’s joint venture opened Fashion District Philadelphia in downtown Philadelphia. |
| (f) | Included in Unconsolidated Joint Venture Centers. |
| (g) | The Company owns an office building and four stores located at shopping centers not owned by the Company. Of the four stores, one is leased to Kohl’s, and three have been leased for non-Anchor uses. With respect to the office building and two of the four stores, the underlying land is owned in fee entirely by the Company. With respect to the remaining two stores, the underlying land is owned by third parties and leased to the Company pursuant to long-term building or ground leases. |
| (h) | Construction is underway to convert former regional shopping center Westside Pavilion, which closed in January 2019, into an approximately 584,000 square foot Class A creative office campus called One Westside leased solely to Google, while maintaining approximately 96,000 square feet of adjacent entertainment and retail space at 10850 Pico Boulevard. |
| (i) | On March 29, 2021, the Company sold the former Paradise Valley Mall for $100 million to a newly formed joint venture and retained a 5% joint venture interest. Construction is anticipated to begin in Summer 2021 on the first phase of a multi-phase, multi-year project to convert this former regional shopping center Paradise Valley Mall into a mixed-use development with high-end grocery, restaurants, multi-family residences, offices, retail shops and other elements on the 92-acre site. The existing Costco and JC Penney stores currently remain open, while most of the other stores at the property have closed. |
27
The Macerich Company
Joint Venture List as of March 31, 2021
The following table sets forth certain information regarding the Centers and other operating properties that are not wholly owned by the Company. This list of properties includes unconsolidated joint ventures, consolidated joint ventures, and financing arrangements. The percentages shown are the effective legal ownership and economic ownership interests of the Company as of March 31, 2021.
| Properties |
Legal Ownership(a) |
Economic Ownership(b) |
Joint Venture |
Total GLA(c) | ||||||||||
| Arrowhead Towne Center |
60 | % | 60 | % | New River Associates LLC | 1,076,000 | ||||||||
| Atlas Park, The Shops at |
50 | % | 50 | % | WMAP, L.L.C. | 374,000 | ||||||||
| Biltmore Fashion Park |
50 | % | 50 | % | Biltmore Shopping Center Partners LLC | 597,000 | ||||||||
| Boulevard Shops |
50 | % | 50 | % | Propcor II Associates, LLC | 184,000 | ||||||||
| Broadway Plaza(e) |
50 | % | 50 | % | Macerich HHF Broadway Plaza LLC | 912,000 | ||||||||
| Chandler Fashion Center(d)(f) |
50.1 | % | 50.1 | % | Freehold Chandler Holdings LP | 1,318,000 | ||||||||
| Corte Madera, The Village at |
50.1 | % | 50.1 | % | Corte Madera Village, LLC | 500,000 | ||||||||
| Country Club Plaza |
50 | % | 50 | % | Country Club Plaza KC Partners LLC | 947,000 | ||||||||
| Deptford Mall(d) |
51 | % | 51 | % | Macerich HHF Centers LLC | 950,000 | ||||||||
| Estrella Falls |
83.2 | % | 83.2 | % | Westcor Goodyear RSC LLC | 79,000 | ||||||||
| Fashion District Philadelphia |
50 | % | (g | ) | Various Entities | 850,000 | ||||||||
| FlatIron Crossing |
51 | % | 51 | % | Macerich HHF Centers LLC | 1,428,000 | ||||||||
| Freehold Raceway Mall(d)(f) |
50.1 | % | 50.1 | % | Freehold Chandler Holdings LP | 1,552,000 | ||||||||
| Hyatt Regency Tysons Corner Center |
50 | % | 50 | % | Tysons Corner Hotel I LLC | 290,000 | ||||||||
| Kierland Commons |
50 | % | 50 | % | Kierland Commons Investment LLC | 437,000 | ||||||||
| Lakewood Center |
60 | % | 60 | % | Pacific Premier Retail LLC | 2,071,000 | ||||||||
| Los Angeles Premium Outlets |
50 | % | 50 | % | CAM-CARSON LLC | — | ||||||||
| Los Cerritos Center(d) |
60 | % | 60 | % | Pacific Premier Retail LLC | 1,022,000 | ||||||||
| North Bridge, The Shops at |
50 | % | 50 | % | North Bridge Chicago LLC | 669,000 | ||||||||
| Paradise Valley Mall(h) |
5 | % | 5 | % | PV Land SPE, LLC | |
1,198,000 |
| ||||||
| SanTan Village Regional Center |
84.9 | % | 84.9 | % | Westcor SanTan Village LLC | 1,151,000 | ||||||||
| Scottsdale Fashion Square |
50 | % | 50 | % | Scottsdale Fashion Square Partnership | 1,843,000 | ||||||||
| Scottsdale Fashion Square-Office |
50 | % | 50 | % | Scottsdale Fashion Square Partnership | 123,000 | ||||||||
| Macerich Seritage Portfolio(i) |
50 | % | 50 | % | MS Portfolio LLC | 795,000 | ||||||||
| South Plains Mall |
60 | % | 60 | % | Pacific Premier Retail LLC | 1,152,000 | ||||||||
| Twenty Ninth Street |
51 | % | 51 | % | Macerich HHF Centers LLC | 845,000 | ||||||||
| Tysons Corner Center |
50 | % | 50 | % | Tysons Corner LLC | 1,971,000 | ||||||||
| Tysons Corner Center-Office |
50 | % | 50 | % | Tysons Corner Property LLC | 174,000 | ||||||||
| Tysons Tower |
50 | % | 50 | % | Tysons Corner Property LLC | 529,000 | ||||||||
| VITA Tysons Corner Center |
50 | % | 50 | % | Tysons Corner Property LLC | 510,000 | ||||||||
| Washington Square(d) |
60 | % | 60 | % | Pacific Premier Retail LLC | 1,296,000 | ||||||||
| West Acres |
19 | % | 19 | % | West Acres Development, LLP | 693,000 | ||||||||
| One Westside(j) |
25 | % | 25 | % | HPP-MAC WSP, LLC | 680,000 | ||||||||
| (a) | This column reflects the Company’s legal ownership in the listed properties as of March 31, 2021. Legal ownership may, at times, not equal the Company’s economic interest in the listed properties because of various provisions in certain joint venture agreements regarding distributions of cash flow based on capital account balances, allocations of profits and losses and payments of preferred returns. As a result, the Company’s actual economic interest (as distinct from its legal ownership interest) in certain of the properties could fluctuate from time to time and may not wholly align with its legal ownership interests. Substantially all of the Company’s joint venture agreements contain rights of first refusal, buy-sell provisions, exit rights, default dilution remedies and/or other break up provisions or remedies which are customary in real estate joint venture agreements and which may, positively or negatively, affect the ultimate realization of cash flow and/or capital or liquidation proceeds. |
28
The Macerich Company
Joint Venture List as of March 31, 2021
| (b) | Economic ownership represents the allocation of cash flow to the Company as of March 31, 2021, except as noted below. In cases where the Company receives a current cash distribution greater than its legal ownership percentage due to a capital account greater than its legal ownership percentage, only the legal ownership percentage is shown in this column. The Company’s economic ownership of these properties may fluctuate based on a number of factors, including mortgage refinancings, partnership capital contributions and distributions, and proceeds and gains or losses from asset sales, and the matters set forth in the preceding paragraph. |
| (c) | Includes GLA attributable to anchors (whether owned or non-owned) and mall and freestanding stores as of March 31, 2021. |
| (d) | These centers have a former Sears store which is owned by MS Portfolio LLC, see footnote (i) below. The GLA of the former Sears store, or tenant replacing the former Sears store, at the five centers indicated with footnote (d) in the table above is included in Total GLA at the center level. The GLA for the former Sears store at these five centers plus the GLA of the former Sears store at two wholly owned centers, Danbury Fair Mall and Vintage Faire Mall, are also aggregated into the 795,000 square feet in the MS Portfolio LLC above. |
| (e) | In October 2018, the Company’s joint venture partner in Broadway Plaza sold its 50% interest to a third party investor. Thereafter, the joint venture restated its governing documents and changed its name to Macerich HHF Broadway Plaza LLC. |
| (f) | The joint venture entity was formed in September 2009. Upon liquidation of the partnership, distributions are made in the following order: to the third-party partner until it receives a 13% internal rate of return on and of its aggregate unreturned capital contributions; to the Company until it receives a 13% internal rate of return on and of its aggregate unreturned capital contributions; and, thereafter, pro rata 35% to the third-party partner and 65% to the Company. |
| (g) | On December 10, 2020, the Company made a loan (the Partnership Loan) to the 50/50 joint venture that owns Fashion District Philadelphia to fund the entirety of a $100 million repayment to reduce the mortgage loan on Fashion District Philadelphia from $301 million to $201 million. Pursuant to the joint venture partnership agreement, the Partnership Loan plus 15% accrued interest must first be repaid prior to the resumption of 50/50 cash distributions to the Company and its joint venture partner. |
| (h) | On March 29, 2021, the Company sold the former Paradise Valley Mall for $100 million to a newly formed joint venture and retained a 5% joint venture interest. Construction is anticipated to begin in Summer 2021 on the first phase of a multi-phase, multi-year project to convert this former regional shopping center Paradise Valley Mall into a mixed-use development with high-end grocery, restaurants, multi-family residences, offices, retail shops and other elements on the 92-acre site. The existing Costco and JC Penney stores currently remain open, while most of the other stores at the property have closed. |
| (i) | On April 30, 2015, Sears Holdings Corporation (“Sears”) and the Company announced that they had formed a joint venture, MS Portfolio LLC. Sears contributed nine stores (located at Arrowhead Towne Center, Chandler Fashion Center, Danbury Fair Mall, Deptford Mall, Freehold Raceway Mall, Los Cerritos Center, South Plains Mall, Vintage Faire Mall and Washington Square) to the joint venture and the Company contributed $150 million in cash to the joint venture. On July 7, 2015, Sears assigned its ownership interest in MS Portfolio LLC to Seritage MS Holdings LLC. On December 31, 2020, the Company traded its 50% interest in the former Sears parcel at Arrowhead Towne Center for its partner’s 50% interest in the former Sears parcel at South Plains Mall, such that the Company now owns 100% of the former Sears parcel at South Plains Mall. The Company expects to create additional value through re-leasing the former Sears boxes. For example, Primark has leased space in portions of the Sears stores at Danbury Fair Mall and Freehold Raceway Mall. Refer to the Development Pipeline Forecast on page 34 for details of the Former Sears Redevelopments at these properties. |
| (j) | Construction is underway to convert former regional shopping center Westside Pavilion, which closed in January 2019, into an approximately 584,000 square foot Class A creative office campus called One Westside leased solely to Google, while maintaining approximately 96,000 square feet of adjacent entertainment and retail space at 10850 Pico Boulevard. The Company contributed the existing buildings and land valued at $190.0 million to the joint venture on August 31, 2018. |
29
The Macerich Company
Supplemental Financial and Operating Information (Unaudited)
Debt Summary (at Company’s pro rata share) (a)
| As of March 31, 2021 | ||||||||||||
| Fixed Rate | Floating Rate | Total | ||||||||||
| (Dollars in thousands) | ||||||||||||
| Mortgage notes payable |
$ | 3,910,201 | $ | 624,384 | $ | 4,534,585 | ||||||
| Bank and other notes payable |
400,000 | 1,078,716 | 1,478,716 | |||||||||
|
|
|
|
|
|
|
|||||||
| Total debt per Consolidated Balance Sheet |
4,310,201 | 1,703,100 | 6,013,301 | |||||||||
| Adjustments: |
||||||||||||
| Less: Noncontrolling interests or financing arrangement share of debt from consolidated joint ventures |
(359,364 | ) | (100,500 | ) | (459,864 | ) | ||||||
|
|
|
|
|
|
|
|||||||
| Adjusted Consolidated Debt |
3,950,837 | 1,602,600 | 5,553,437 | |||||||||
| Add: Company’s share of debt from unconsolidated joint ventures |
3,019,276 | 82,551 | 3,101,827 | |||||||||
|
|
|
|
|
|
|
|||||||
| Total Company’s Pro Rata Share of Debt |
$ | 6,970,113 | $ | 1,685,151 | $ | 8,655,264 | ||||||
|
|
|
|
|
|
|
|||||||
| Weighted average interest rate |
4.00 | % | 2.23 | % | 3.66 | % | ||||||
| Weighted average maturity (years) |
4.07 | |||||||||||
| (a) | The Company’s pro rata share of debt represents (i) consolidated debt, minus the Company’s partners’ share of the amount from consolidated joint ventures (calculated based upon the partners’ percentage ownership interest); plus (ii) the Company’s share of debt from unconsolidated joint ventures (calculated based upon the Company’s percentage ownership interest). Management believes that this measure provides useful information to investors regarding the Company’s financial condition because it includes the Company’s share of debt from unconsolidated joint ventures and, for consolidated debt, excludes the Company’s partners’ share from consolidated joint ventures, in each case presented on the same basis. The Company has several significant joint ventures and presenting its pro rata share of debt in this manner can help investors better understand the Company’s financial condition after taking into account the Company’s economic interest in these joint ventures. The Company’s pro rata share of debt should not be considered as a substitute to the Company’s total debt determined in accordance with GAAP or any other GAAP financial measures and should only be considered together with and as a supplement to the Company’s financial information prepared in accordance with GAAP. |
30
The Macerich Company
Supplemental Financial and Operating Information (Unaudited)
Outstanding Debt by Maturity Date
| As of March 31, 2021 | ||||||||||||||||||||
| Center/Entity (dollars in thousands) |
Maturity Date |
Effective Interest Rate (a) |
Fixed | Floating | Total Debt Balance (a) |
|||||||||||||||
| I. Consolidated Assets: |
||||||||||||||||||||
| Danbury Fair Mall |
07/01/21 | 5.56 | % | $ | 184,775 | $ | — | $ | 184,775 | |||||||||||
| The Macerich Partnership, L.P. - Line of Credit (b) (c) (d) |
07/06/21 | 4.50 | % | 400,000 | — | 400,000 | ||||||||||||||
| Tucson La Encantada |
03/01/22 | 4.23 | % | 61,480 | — | 61,480 | ||||||||||||||
| Pacific View |
04/01/22 | 4.08 | % | 114,065 | — | 114,065 | ||||||||||||||
| Oaks, The |
06/05/22 | 4.14 | % | 180,731 | — | 180,731 | ||||||||||||||
| Towne Mall |
11/01/22 | 4.48 | % | 19,690 | — | 19,690 | ||||||||||||||
| Green Acres Mall (d) |
02/03/23 | 3.94 | % | 257,115 | — | 257,115 | ||||||||||||||
| Fashion Outlets of Niagara Falls USA |
10/06/23 | 6.45 | % | 100,820 | — | 100,820 | ||||||||||||||
| Chandler Fashion Center (e) |
07/05/24 | 4.18 | % | 127,959 | — | 127,959 | ||||||||||||||
| Victor Valley, Mall of |
09/01/24 | 4.00 | % | 114,806 | — | 114,806 | ||||||||||||||
| Queens Center |
01/01/25 | 3.49 | % | 600,000 | — | 600,000 | ||||||||||||||
| Vintage Faire Mall |
03/06/26 | 3.55 | % | 244,808 | — | 244,808 | ||||||||||||||
| Fresno Fashion Fair |
11/01/26 | 3.67 | % | 323,907 | — | 323,907 | ||||||||||||||
| SanTan Village Regional Center (f) |
07/01/29 | 4.34 | % | 186,234 | — | 186,234 | ||||||||||||||
| Freehold Raceway Mall (e) |
11/01/29 | 3.94 | % | 199,692 | — | 199,692 | ||||||||||||||
| Kings Plaza Shopping Center |
01/01/30 | 3.71 | % | 535,542 | — | 535,542 | ||||||||||||||
| Fashion Outlets of Chicago |
02/01/31 | 4.61 | % | 299,213 | — | 299,213 | ||||||||||||||
|
|
|
|
|
|
|
|
|
|||||||||||||
| Total Fixed Rate Debt for Consolidated Assets |
4.09 | % | $ | 3,950,837 | $ | — | $ | 3,950,837 | ||||||||||||
|
|
|
|
|
|
|
|
|
|||||||||||||
| The Macerich Partnership, L.P. - Line of Credit (b) (c) (d) |
07/06/21 | 2.08 | % | $ | — | $ | 1,078,716 | $ | 1,078,716 | |||||||||||
| Santa Monica Place (d) |
12/09/22 | 1.83 | % | — | 298,753 | 298,753 | ||||||||||||||
| Green Acres Commons |
03/29/23 | 3.13 | % | — | 124,631 | 124,631 | ||||||||||||||
| Fashion District Philadelphia (d) (g) |
01/22/24 | 4.00 | % | — | 100,500 | 100,500 | ||||||||||||||
|
|
|
|
|
|
|
|
|
|||||||||||||
| Total Floating Rate Debt for Consolidated Assets |
2.23 | % | $ | — | $ | 1,602,600 | $ | 1,602,600 | ||||||||||||
|
|
|
|
|
|
|
|
|
|||||||||||||
| Total Debt for Consolidated Assets |
3.55 | % | $ | 3,950,837 | $ | 1,602,600 | $ | 5,553,437 | ||||||||||||
|
|
|
|
|
|
|
|
|
|||||||||||||
| II. Unconsolidated Assets (At Company’s pro rata share): |
||||||||||||||||||||
| FlatIron Crossing (51%) |
01/05/22 | 4.38 | % | $ | 102,056 | $ | — | $ | 102,056 | |||||||||||
| One Westside - defeased (25%) |
10/01/22 | 4.77 | % | 32,707 | — | 32,707 | ||||||||||||||
| Washington Square Mall (60%) |
11/01/22 | 3.65 | % | 321,719 | — | 321,719 | ||||||||||||||
| Deptford Mall (51%) |
04/03/23 | 3.55 | % | 87,262 | — | 87,262 | ||||||||||||||
| Scottsdale Fashion Square (50%) |
04/03/23 | 3.02 | % | 215,040 | — | 215,040 | ||||||||||||||
| Tysons Corner Center (50%) |
01/01/24 | 4.13 | % | 361,297 | — | 361,297 | ||||||||||||||
| Paradise Valley (5%) (d) |
09/29/24 | 5.00 | % | 2,791 | — | 2,791 | ||||||||||||||
| South Plains Mall (60%) |
11/06/25 | 4.22 | % | 120,000 | — | 120,000 | ||||||||||||||
| Twenty Ninth Street (51%) |
02/06/26 | 4.10 | % | 76,500 | — | 76,500 | ||||||||||||||
| Country Club Plaza (50%) |
04/01/26 | 3.88 | % | 154,121 | — | 154,121 | ||||||||||||||
| Lakewood Center (60%) |
06/01/26 | 4.15 | % | 209,591 | — | 209,591 | ||||||||||||||
| Kierland Commons (50%) |
04/01/27 | 3.98 | % | 104,075 | — | 104,075 | ||||||||||||||
31
The Macerich Company
Supplemental Financial and Operating Information (Unaudited)
Outstanding Debt by Maturity Date
| As of March 31, 2021 | ||||||||||||||||||||
| Center/Entity (dollars in thousands) |
Maturity Date | Effective Interest Rate (a) |
Fixed | Floating | Total Debt Balance (a) |
|||||||||||||||
| Los Cerritos Center (60%) |
11/01/27 | 4.00 | % | 315,000 | — | 315,000 | ||||||||||||||
| Arrowhead Towne Center (60%) |
02/01/28 | 4.05 | % | 240,000 | — | 240,000 | ||||||||||||||
| North Bridge, The Shops at (50%) |
06/01/28 | 3.71 | % | 187,113 | — | 187,113 | ||||||||||||||
| Corte Madera, The Village at (50.1%) |
09/01/28 | 3.53 | % | 112,435 | — | 112,435 | ||||||||||||||
| West Acres - Development (19%) |
10/10/29 | 3.72 | % | 431 | — | 431 | ||||||||||||||
| Tysons Tower (50%) |
10/11/29 | 3.38 | % | 94,458 | — | 94,458 | ||||||||||||||
| Broadway Plaza (50%) |
04/01/30 | 4.19 | % | 224,528 | — | 224,528 | ||||||||||||||
| Tysons VITA (50%) |
12/01/30 | 3.43 | % | 44,426 | — | 44,426 | ||||||||||||||
| West Acres (19%) |
03/01/32 | 4.61 | % | 13,726 | — | 13,726 | ||||||||||||||
|
|
|
|
|
|
|
|
|
|||||||||||||
| Total Fixed Rate Debt for Unconsolidated Assets |
3.89 | % | $ | 3,019,276 | $ | — | $ | 3,019,276 | ||||||||||||
|
|
|
|
|
|
|
|
|
|||||||||||||
| Atlas Park (50%) |
10/28/21 | 2.39 | % | $ | — | $ | 34,110 | $ | 34,110 | |||||||||||
| Boulevard Shops (50%) |
12/05/23 | 2.29 | % | — | 9,642 | 9,642 | ||||||||||||||
| One Westside - Development (25%) (d) |
12/18/24 | 2.13 | % | — | 38,799 | 38,799 | ||||||||||||||
|
|
|
|
|
|
|
|
|
|||||||||||||
| Total Floating Rate Debt for Unconsolidated Assets |
2.26 | % | $ | — | $ | 82,551 | $ | 82,551 | ||||||||||||
|
|
|
|
|
|
|
|
|
|||||||||||||
| Total Debt for Unconsolidated Assets |
3.85 | % | $ | 3,019,276 | $ | 82,551 | $ | 3,101,827 | ||||||||||||
|
|
|
|
|
|
|
|
|
|||||||||||||
| Total Debt |
3.66 | % | $ | 6,970,113 | $ | 1,685,151 | $ | 8,655,264 | ||||||||||||
|
|
|
|
|
|
|
|
|
|||||||||||||
| Percentage to Total |
80.53 | % | 19.47 | % | 100.00 | % | ||||||||||||||
| (a) | The debt balances include the unamortized debt premiums/discounts and loan finance costs. Debt premiums/discounts represent the excess of the fair value of debt over the principal value of debt assumed in various acquisitions. Debt premiums/discounts and loan finance costs are amortized into interest expense over the remaining term of the related debt in a manner that approximates the effective interest method. The annual interest rate in the table represents the effective interest rate, including the debt premiums/discounts and loan finance costs. |
| (b) | On April 14, 2021, the Company renewed its corporate credit facility. The $700 million facility includes both a revolving line of credit totaling $525 million and a term loan totaling $175 million. The revolver has a two-year initial term plus a one-year extension option and the term loan has a three-year term. At closing, the facility was $495 million, including $320 million drawn on the revolver and $175 million on the term loan, and at closing, the floating interest rate on the facility was LIBOR plus 2.75%. |
| (c) | The revolving line of credit includes an interest rate swap that effectively converts $400 million of the outstanding balance to fixed rate debt through September 30, 2021. |
| (d) | The maturity date assumes that all available extension options are fully exercised and that the Company and/or its affiliates do not opt to refinance the debt prior to these dates. |
| (e) | The property is owned by a consolidated joint venture. The loan amount represents the Company’s pro rata share of 50.1%. |
| (f) | The property is owned by a consolidated joint venture. The loan amount represents the Company’s pro rata share of 84.9%. |
| (g) | The property is owned by a consolidated joint venture. The loan amount represents the Company’s pro rata share of 50.0%. |
32
The Macerich Company
Supplemental Financial and Operating Information (Unaudited)
Development Pipeline Forecast
(Dollars in millions)
as of March 31, 2021
In-Process Developments and Redevelopments:
| Property |
Project Type |
Total Cost(a)(b) |
Ownership |
Total Cost(a)(b) |
Pro Rata Capitalized Costs(b) Incurred-to-date 3/31/2021 |
Expected |
Stabilized | |||||||||
| One Westside fka Westside Pavilion |
Redevelopment of an existing retail center into an approximately 584,000 sf Class A creative office campus leased solely to Google | $500 - $550(d) |
25.0% | $125 - $138(d) |
$ | 86 | Q3 2022(e) |
7.50% - 8.00%(d) | ||||||||
| (a) | Much of this information is estimated and may change from time to time. See the Company’s forward-looking disclosure on pages 4 and 5 for factors that may affect the information provided in this table. |
| (b) | This excludes GAAP allocations of non cash and indirect costs. |
| (c) | Stabilized Yield is calculated based on stabilized income after development divided by project direct costs excluding GAAP allocations of non cash and indirect costs. |
| (d) | Includes $140 million ($35 million at the Company’s share), which is an allocable share of the total $190 million purchase price paid by the joint venture in August 2018 for the existing buildings and land. |
| (e) | Monthly base rent payments are anticipated to commence during the third quarter of 2022, with base rent abatements from the second through ninth month following rent commencement. |
33
The Macerich Company
Supplemental Financial and Operating Information (Unaudited)
Development Pipeline Forecast (Continued)
(Dollars in millions)
as of March 31, 2021
Pipeline of Former Sears Redevelopments:
| Project Type |
Ownership | Total Cost (a)(b) Pro rata |
Pro
rata Capitalized Costs 3/31/21 Incurred-to-Date(b) |
Stabilized Yield(a)(b)(c) | ||||||||||
| Retail Redevelopment | $75 - $90 | $ | 34 | 8.0% - 9.0% | ||||||||||
| Mixed-Use Densification |
|
55 - 70 | 4 | 9.0% - 10.5% | ||||||||||
| (d) |
Future Phases | TBD | 0 | TBD | ||||||||||
|
|
|
|
||||||||||||
| Total | various | $130 - $160 | $ | 38 | ||||||||||
|
|
|
|
||||||||||||
| Property |
Description |
Delivered/ Expected Delivery(e) |
||||||
| Retail Redevelopment: | ||||||||
| (f) | Chandler Fashion Center | Redevelop existing store for a Harkins entertainment concept and additional retail uses | TBD | |||||
| (f) | Deptford Mall | Redevelop existing store for: Dick’s Sporting Goods Round 1 additional retail uses |
|
Q3-2020 Q4-2020 TBD |
| |||
| South Plains Mall | Demolish box; site densification with retail and restaurants uses | TBD | ||||||
| (f) | Vintage Faire Mall | Redevelop existing store for: | ||||||
| Dick’s Sporting Goods |
Q4-2020 | |||||||
| Dave & Busters and additional retail uses |
TBD | |||||||
| Wilton Mall | Redevelop existing store with a medical center/medical office use | Q1-2020 | ||||||
| Mixed-Use Densification: | ||||||||
| (f) | Los Cerritos Center | Demolish box; site densification with residential, hotel and restaurant uses | TBD | |||||
| (f) | Washington Square | Demolish box; site densification with hotel, entertainment and restaurant uses | TBD | |||||
| (a) | Much of this information is estimated and may change from time to time. See the Company’s forward-looking disclosure on pages 1 and 2 for factors that may affect the information provided in this table. This estimated range of incremental redevelopment costs could increase if the Company and its joint ventures decide to expand the scope as the redevelopment plans get refined. |
| (b) | This excludes GAAP allocations of non cash and indirect costs. |
| (c) | Stabilized Yield represents estimated replacement net operating income at stabilization divided by direct redevelopment costs, excluding GAAP allocations of non cash and indirect costs. |
| (d) | Future demand-driven development phases are possible at Los Cerritos Center and Washington Square. |
| (e) | Given the uncertainties resulting from the COVID-19 pandemic, the expected delivery dates for many of these projects are not currently determinable. |
| (f) | These former Sears stores are owned by a 50/50 joint venture between the Company and Seritage Growth Properties. |
34
The Macerich Company
Corporate Information
Stock Exchange Listing
New York Stock Exchange
Symbol: MAC
The following table shows high and low sales prices per share of common stock during each quarter in 2021, 2020 and 2019 and dividends per share of common stock declared and paid by quarter:
| Market Quotation per Share |
Dividends | |||||||||||
| Quarter Ended: |
High | Low | Declared and Paid |
|||||||||
| March 31, 2019 |
$ | 47.05 | $ | 41.63 | $ | 0.75 | ||||||
| June 30, 2019 |
$ | 44.73 | $ | 32.04 | $ | 0.75 | ||||||
| September 30, 2019 |
$ | 34.15 | $ | 27.54 | $ | 0.75 | ||||||
| December 31, 2019 |
$ | 31.77 | $ | 25.53 | $ | 0.75 | ||||||
| March 31, 2020 |
$ | 26.98 | $ | 5.49 | $ | 0.75 | ||||||
| June 30, 2020 |
$ | 13.18 | $ | 4.81 | $ | 0.50 | (a) | |||||
| September 30, 2020 |
$ | 9.24 | $ | 6.55 | $ | 0.15 | ||||||
| December 31, 2020 |
$ | 12.47 | $ | 6.42 | $ | 0.15 | ||||||
| March 31, 2021 |
$ | 25.99 | $ | 10.31 | $ | 0.15 | ||||||
| (a) | The dividend of $0.50 per share of the Company’s common stock declared on March 16, 2020, consisted of a combination of 80% shares of common stock and 20% in cash. |
Dividend Reinvestment Plan
Stockholders may automatically reinvest their dividends in additional common stock of the Company through the Direct Investment Program, which also provides for purchase by voluntary cash contributions. For additional information, please contact Computershare Trust Company, N.A. at 877-373-6374.
| Corporate Headquarters The Macerich Company 401 Wilshire Boulevard, Suite 700 Santa Monica, California 90401 310-394-6000 www.macerich.com |
Transfer Agent Computershare P.O. Box 30170 College Station, TX 77842-3170 877-373-6374 www.computershare.com |
Macerich Website
For an electronic version of our annual report, our SEC filings and documents relating to Corporate Governance, please visit macerich.com.
Investor Relations
| Jean Wood Vice President, Investor Relations Phone: 424-229-3366 [email protected] |
35
Serious News for Serious Traders! Try StreetInsider.com Premium Free!
You May Also Be Interested In
- Metals Acquisition Limited Announces Updated Resource and Reserve Statement and Production Guidance
- Power Nickel Extends Momentum - Closes Acquisition on 80% of Nisk
- Title correction: EXEL Industries : Second quarter 2023–2024 sales down 1.8%
Create E-mail Alert Related Categories
SEC FilingsSign up for StreetInsider Free!
Receive full access to all new and archived articles, unlimited portfolio tracking, e-mail alerts, custom newswires and RSS feeds - and more!
