

Form 8-K Kaleyra, Inc. For: Aug 08
 Tweet
Tweet Share
Share
UNITED STATES
SECURITIES AND EXCHANGE COMMISSION
WASHINGTON, D.C. 20549
FORM
CURRENT REPORT
PURSUANT TO SECTION 13 OR 15(d)
OF THE SECURITIES EXCHANGE ACT OF 1934
Date of Report (Date of earliest event reported):
(Exact Name of Registrant as Specified in Charter)
| (State or other jurisdiction of incorporation) |
(Commission File Number) |
(IRS Employer Identification No.) |
| (Address of Principal Executive Offices) | (Zip Code) |
+
(Registrant’s telephone number, including area code)
Check the appropriate box below if the Form 8-K filing is intended to simultaneously satisfy the filing obligation of the registrant under any of the following provisions (see General Instruction A.2. below):
| Written communications pursuant to Rule 425 under the Securities Act (17 CFR 230.425) |
| Soliciting material pursuant to Rule 14a-12 under the Exchange Act (17 CFR 240.14a-12) |
| Pre-commencement communications pursuant to Rule 14d-2(b) under the Exchange Act (17 CFR 240.14d-2(b)) |
| Pre-commencement communications pursuant to Rule 13e-4(c) under the Exchange Act (17 CFR 240.13e 4(c)) |
Securities registered pursuant to Section 12(b) of the Act:
| Title of each class |
Trading |
Name of each exchange | ||
Indicate by check mark whether the registrant is an emerging growth company as defined in Rule 405 of the Securities Act of 1933 (§230.405 of this chapter) or Rule 12b-2 of the Securities Exchange Act of 1934 (§240.12b-2 of this chapter).
Emerging growth company
If an emerging growth company, indicate by check mark if the registrant has elected not to use the extended transition period for complying with any new or revised financial accounting standards provided pursuant to Section 13(a) of the Exchange Act.
| Item 2.02 | Results of Operations and Financial Condition. |
On August 8, 2022, Kaleyra, Inc. (the “Company”) issued a press release announcing its financial results for the quarter ended June 30, 2022. A copy of the Company’s press release is attached as Exhibit 99.1 to this Current Report and is incorporated herein by reference.
The information contained in this Item 2.02, including Exhibit 99.1 attached hereto, shall not be deemed “filed” with the Securities and Exchange Commission nor incorporated by reference in any registration statement filed by the Company under the Securities Act of 1933, as amended.
| Item 7.01 | Regulation FD Disclosure |
The Company will host a conference call to discuss its second quarter 2022 financial results on August 8, 2022, at 4:30 p.m. Eastern time. On August 8, 2022, the Company posted an investor presentation to the Investor Relations section of its website www.kaleyra.com, in connection with the earnings call for the quarter ended June 30, 2022. A copy of the investor presentation is being furnished as Exhibit 99.2 to this Current Report on Form 8-K.
The information contained in, or incorporated into, this Item 7.01 of this Report, including Exhibit 99.2 attached hereto, is furnished under Item 7.01 of Form 8-K and shall not be deemed “filed” for the purposes of Section 18 of the Exchange Act or otherwise subject to the liabilities of that section, and shall not be deemed to be incorporated by reference into the filings of the Company under the Securities Act or the Exchange Act regardless of any general incorporation language in such filings.
This Report shall not be deemed an admission as to the materiality of any information in this Report that is being disclosed pursuant to Regulation FD.
Please refer to Exhibit 99.2 for a discussion of certain forward-looking statements included therein and the risks and uncertainties related thereto.
- 2 -
| Item 9.01 | Financial Statements and Exhibits. |
(a) Not applicable.
(b) Not applicable.
(c) Not applicable.
(d) Exhibits.
The exhibits required by this item are set forth on the Exhibit Index attached hereto.
| Exhibit Number |
||
| 99.1 | Press Release dated August 8, 2022. | |
| 99.2 | Investor Presentation dated August 8, 2022. | |
| 104 | Cover Page Interactive Data File (embedded within the Inline XBRL document). | |
- 3 -
SIGNATURE
Pursuant to the requirements of the Securities Exchange Act of 1934, the registrant has duly caused this report to be signed on its behalf by the undersigned hereunto duly authorized.
Dated: August 8, 2022
| By: | /s/ Dario Calogero | |
| Name: | Dario Calogero | |
| Title: | Chief Executive Officer and President |
- 4 -
Exhibit 99.1

Kaleyra Announces Second Quarter 2022 Results
Second Quarter Performance Highlighted by Revenue Increase to $81.1 Million, up 50% Year-Over-Year
Continued Strong Profitability Metrics, Including 78% Gross Profit Increase to $18.7 Million
NEW YORK – August 8, 2022 – Kaleyra, Inc. (NYSE: KLR) (NYSE American: KLR WS) (“Kaleyra” or the “Company”), an omnichannel business communications platform, reported financial results for the second quarter ended June 30, 2022.
Second Quarter 2022 Operational and Financial Highlights
| • | Quarterly Revenue of $81.1 million and Gross Profit of $18.7 million, representing 50% and 78% growth, respectively, over the comparable year-ago period |
| • | Quarterly Adjusted Gross Profit of $20.2 million, representing 82% growth over the comparable year-ago period |
| • | Dollar-Based Net Expansion Rate of 103% in Q2 2022 |
| • | Strong Balance Sheet with $74.8 million in cash and cash equivalents, including restricted cash, and short-term investments |
| • | Delivered 13.4 billion billable messages (58% growth year-over-year) and connected 1.8 billion voice calls (32% growth year-over-year) for our global customer base in the second quarter |
| • | Joined the broad-market Russell 3000® Index at the conclusion of the 2022 Russell indexes annual reconstitution |
| • | Expanded investor-oriented communication efforts by appointing experienced equity research analyst Colin Gillis as Vice President of Investor Relations |
| • | Bolstered leadership team by appointing five-time start-up founder and CEO Zephrin Lasker as Senior Vice President of Marketing and Strategic Alliances |
Management Commentary
“Our team displayed commendable determination in the face of ongoing global economic uncertainty in our second quarter,” said Kaleyra Founder and Chief Executive Officer Dario Calogero. “Despite challenges and the adverse effects of the foreign exchange environment, we met our revenue estimate and reaffirmed our steadfast relationships with existing partners, highlighted by our 50% year-over-year revenue increase and dollar-based net expansion rate of 103%. In addition, our adjusted gross profit increased by 82% and our adjusted gross margin increased to 25% year-over-year, exemplifying our commitment to profitability and showcasing the fact that Kaleyra has more than adequate capital to support our business over the long-term.
“Kaleyra is facing the same overlapping group of factors as other multi-national companies, including a slowing global economy with contraction in the United States and major European economies, increased caution from enterprise executives weighing new initiatives, and consumers who are facing food and energy costs that consume more disposable income than before. When combined with pressure from a strengthening U.S. dollar and industry-wide demand and pricing considerations, we believe that it is prudent to revise our revenue for the third quarter and full year to reflect the current global economic and geopolitical environment. Every economic cycle turns, and with our strong base of existing customers and meaningful pipeline of new potential customers, we are encouraged that we will maximize the healthy landscape of opportunities ahead in new markets and geographies. Our customers value that Kaleyra has strong fundamentals and a comfortable balance sheet. We look forward to serving them for years to come.”
Second Quarter 2022 Financial Results
Results compare the 2022 second quarter ended June 30, 2022 to the 2021 second quarter ended June 30, 2021 unless otherwise indicated.
| • | Total revenue increased 50% to $81.1 million from $54.0 million in the comparable year-ago period. This increase was mainly driven by the effects of the business combination with mGage, which contributed $30.2 million, and the organic growth of the Kaleyra legacy businesses, representing 16% of the aggregate growth period over period, despite headwinds in the foreign exchange environment. |
| • | Gross profit increased 78% to $18.7 million from $10.5 million in the comparable year-ago period. The increase in gross profit was mainly driven by the effects of the business combination with mGage. Gross margin for the second quarter of 2022 increased to 23.0% compared to 19.4% for the second quarter of 2021. The increase in gross margin was mainly due to the mGage and Bandyer integrations and increased performance by Kaleyra Video and Kaleyra Voice, as well as by The Campaign Registry. |
| • | Net loss totaled $15.8 million, or $0.36 per share based on 43.4 million weighted-average shares outstanding, compared to a net loss of $4.5 million, or $0.13 per share based on 34.3 million weighted-average shares outstanding, in the comparable year-ago period. The increase in net loss was mainly driven by the amortization of acquired intangibles and the accrued interest on convertible notes. |
| • | Adjusted gross profit, a non-GAAP measurement of operating performance reconciled below, increased 82% to $20.2 million from $11.1 million in the comparable year-ago period. Adjusted gross margin for the second quarter of 2022 was 25.0% compared to 20.6% in the comparable year-ago period. |
| • | Adjusted net income, a non-GAAP measurement of operating performance reconciled below, decreased by 89% to $55,000, or $0.00 per both basic and diluted share based on 43.4 million weighted-average shares outstanding and 53.7 million weighted-average shares outstanding, respectively, from $504,000, or $0.01 per both basic and diluted share based on 34.3 million weighted-average shares outstanding and 44.9 million weighted-average shares outstanding, respectively, in the comparable year-ago period. |
| • | Adjusted EBITDA, a non-GAAP measurement of operating performance reconciled below, increased 177% to $6.0 million (7.4% of total revenue) compared to $2.2 million (4.0% of total revenue) in the comparable year-ago period. The increase in adjusted EBITDA was primarily due to the effects of the business combinations with mGage and Bandyer and cost synergies between the newly acquired entities and the legacy business. |
| • | At the end of the second quarter, cash and cash equivalents, restricted cash, and short-term investments were $74.8 million, compared to $97.9 million as of December 31, 2021, mainly due to changes in net working capital, the payment of interest on convertible notes and the adverse effects of the foreign exchange environment. |
2022 Financial Outlook
Kaleyra’s outlook takes into consideration broader geopolitical and macroeconomic factors such as the adverse effects of the foreign exchange environment, the war in Ukraine, and inflation. Kaleyra remains confident in its growth strategy and ability to capture its multinational market opportunity. As a result of the Company’s performance in the second quarter, the Company is introducing financial projections for the third quarter and adjusting projections for the full year 2022 as follows:
| • | Third Quarter 2022: Total revenue is expected to be in the range of $83 – $87 million, compared to $84.0 million in the comparable year-ago period. |
| • | Full Year 2022: Total revenue is expected to be in the range of $345 – $350 million, compared to $267.7 million in the comparable year-ago period. |
Conference Call
Kaleyra will hold a conference call today, Monday, August 8, 2022, at 4:30 p.m. Eastern time (1:30 p.m. Pacific time) to discuss these results. A question-and-answer session will follow management’s presentation.
U.S. dial-in: 855-327-6837
International dial-in: 631-891-4304
Please call the conference telephone number 10 minutes prior to the start time. An operator will register your name and organization. If you have any difficulty connecting with the conference call, please contact Gateway Investor Relations at 949-574-3860.
The conference call will be broadcast live and available for replay here and via the Investor Relations section of Kaleyra’s website.
A telephonic replay of the conference call will be available after 7:30 p.m. Eastern time on the same day through August 15, 2022.
Toll-free replay number: 844-512-2921
International replay number: 412-317-6671
Replay ID: 10019918
About Kaleyra
Kaleyra, Inc. is a global group providing mobile communication services to financial institutions, ecommerce players, OTTs, software companies, logistic enablers, healthcare providers, retailers, and other large organizations worldwide.
Kaleyra today has a customer base of 3,800+ companies spread around the world. Through its proprietary platform and robust APIs, Kaleyra manages multi-channel integrated communication services, consisting of messaging, rich messaging and instant messaging, video, push notifications, email, voice services, and chatbots.
Kaleyra’s technology makes it possible to safely and securely manage billions of messages monthly with over 1,800 operator connections in 190+ countries, including all tier-1 US carriers.
Non-GAAP Financial Measures and Related Information
To provide investors and others with additional information regarding Kaleyra’s results, the following non-GAAP financial measures, not prepared in accordance with accounting principles generally accepted in the United States (“GAAP”), are disclosed:
| • | Non-GAAP Adjusted Gross Profit and Non-GAAP Adjusted Gross Margin. For the periods presented, Kaleyra defines non-GAAP Adjusted Gross Profit and non-GAAP Gross Margin as GAAP gross profit and GAAP gross margin, respectively, adjusted to exclude, as applicable, certain expenses as presented in the table below; |
| • | Non-GAAP Adjusted EBITDA is defined as of any date of calculation, as the consolidated earnings/(loss) of Kaleyra and its subsidiaries, before finance income and finance cost (including |
| bank charges), tax, depreciation and amortization, plus (i) transaction and one-off expenses, (ii) without duplication of clause (i), severance or change of control payments, (iii) any expenses related to company restructuring, (iv) any compensation expenses relating to stock options, restricted stock units, restricted stock or similar equity interests as may be issued by Kaleyra or any of its subsidiaries to its or their employees (v) any provision for the write down of assets, (vi) the amortization of acquired intangible assets and (vii) the amortization of issuance costs of convertible financial instruments; and |
| • | Non-GAAP Adjusted Net Income (Loss) Per Share, Basic and Diluted. For the periods presented, Kaleyra defines non-GAAP net income (loss) and non-GAAP net income (loss) per share, basic and diluted, as GAAP net loss and GAAP net loss per share, basic and diluted, respectively, adjusted to exclude, as applicable, certain expenses presented in the table below. |
Management uses the foregoing non-GAAP financial information, collectively, to evaluate its ongoing operations and for internal planning and forecasting purposes. Kaleyra’s management believes that non-GAAP financial information, when taken collectively, may be helpful to investors because it provides consistency and comparability with past financial performance, facilitates period-to-period comparisons of results of operations, and assists in comparisons with other companies, many of which use similar non-GAAP financial information to supplement their GAAP results. Non-GAAP financial information is presented for supplemental informational purposes only, should not be considered a substitute for financial information presented in accordance with GAAP, and may be different from similarly-titled non-GAAP measures used by other companies. Whenever Kaleyra uses a non-GAAP financial measure, a reconciliation is provided to the most closely applicable financial measure stated in accordance with GAAP. Investors are encouraged to review the related GAAP financial measures and the reconciliation of these non-GAAP financial measures to their most directly comparable GAAP financial measures.
Operating Metrics
Dollar-Based Net Expansion Rate. Kaleyra’s ability to drive growth and generate incremental revenue depends, in part, on the Company’s ability to maintain and grow its relationships with Active Existing Customer Accounts and to increase their use of the platform. An important way in which Kaleyra has historically tracked performance in this area is by measuring the Dollar-Based Net Expansion Rate for those customer accounts. Kaleyra’s Dollar-Based Net Expansion Rate increases when such customer accounts increase their usage of a product, extend their usage of a product to new applications or adopt a new product. Kaleyra’s Dollar-Based Net Expansion Rate decreases when such customer accounts cease or reduce their usage of a product or when the Company lowers usage prices on a product. Kaleyra believes that measuring Dollar-Based Net Expansion Rate provides a more meaningful indication of the performance of the Company’s efforts to increase revenue from existing customers. As a result of the introduction of Dollar-Based Net Expansion Rate disclosure by Kaleyra in the SEC filing, press release and presentation for the three months ended December 31, 2021, no comparable period is provided prior to that date. To calculate the Dollar-Based Net Expansion Rate, the Company first identifies the cohort of customer accounts that were customer accounts in the same quarter of the prior year. The Dollar-Based Net Expansion Rate is the quotient obtained by dividing the revenue generated from that cohort in a quarter, by the revenue generated from that same cohort in the corresponding quarter in the prior year. The Q2 2022 Dollar-Based Net Expansion Rate has been calculated by making reference to the Pro Forma (PF) revenue generated from the same customer base in the corresponding year-ago comparable period.
Active Existing Customer Accounts. Kaleyra believes that the number of Active Customer Accounts is an important indicator of the growth of its business, the market acceptance of its platform and future revenue trends. Kaleyra defines an Active Customer Account at the end of any reporting period as an individual account, as identified by a unique account identifier, for which Kaleyra has recognized revenue in the period.
Important Cautions Regarding Forward-Looking Statements
This press release contains forward-looking statements within the meaning of U.S. federal securities laws. Such forward-looking statements include, but are not limited to, statements regarding the financial statements of Kaleyra, its omnichannel and other product and global customer developments, its expectations, beliefs, intentions, plans, prospects or strategies regarding the future revenue (including revenue guidance) and the business plans of Kaleyra’s management team, and the impact of the COVID-19 pandemic, and any anticipated lessening of such impact, and the broader market volatility and geopolitical and macroeconomic factors on its business and financial performance. Any statements contained herein that are not statements of historical fact may be deemed to be forward-looking statements. In addition, any statements that refer to projections, forecasts or other characterizations of future events or circumstances, including any underlying assumptions, are forward-looking statements. The words “anticipate,” “believe,” “continue,” “could,” “estimate,” “expect,” “intends,” “may,” “might,” “plan,” “possible,” “potential,” “predict,” “project,” “should,” “would” and similar expressions may identify forward-looking statements, but the absence of these words does not mean that a statement is not forward-looking. The forward-looking statements contained in this press release are based on certain assumptions and analyses made by Kaleyra in light of its experience and perception of historical trends, current conditions and expected future developments and their potential effects on Kaleyra as well as other factors they believe are appropriate in the circumstances. There can be no assurance that future developments affecting Kaleyra will be those anticipated. These forward-looking statements involve a number of risks, uncertainties (some of which are beyond the control of the parties) or other assumptions that may cause actual results or performance to be materially different from those expressed or implied by these forward-looking statements, including the mix of services utilized by Kaleyra’s customers and such customers’ needs for these services, including any variability by geography, market acceptance of new service offerings, the ability of Kaleyra to expand what it does for existing customers as well as to add new customers, that Kaleyra will have sufficient capital to operate as anticipated, and the impact that the novel coronavirus and the illness, COVID-19, that it causes, as well as governmental responses to deal with the spread of this illness and the reopening of economies that have been closed as part of these responses, and the impact of other geopolitical and macroeconomic factors such as the war in Ukraine, may have on Kaleyra’s operations, the demand for Kaleyra’s products, global supply chains and economic activity in general. Should one or more of these risks or uncertainties materialize or should any of the assumptions being made prove incorrect, actual results may vary in material respects from those projected in these forward-looking statements. We undertake no obligation to update or revise any forward-looking statements, whether as a result of new information, future events or otherwise, except as may be required under applicable securities laws.
Investor Contacts:
Colin Gillis
Vice President of Investor Relations
Tom Colton or Matt Glover
Gateway Investor Relations
949-574-3860
-Financial Tables to Follow-
KALEYRA, INC.
Condensed Consolidated Balance Sheets
(Unaudited, in thousands)
| June 30, 2022 |
December 31, 2021 |
|||||||
| ASSETS |
||||||||
| Current assets: |
||||||||
| Cash and cash equivalents |
$ | 73,622 | $ | 90,001 | ||||
| Restricted cash |
468 | 1,701 | ||||||
| Short-term investments |
680 | 6,236 | ||||||
| Trade receivables, net |
95,768 | 85,945 | ||||||
| Deferred cost |
329 | 341 | ||||||
| Prepaid expenses |
4,340 | 5,357 | ||||||
| Other current assets |
1,436 | 2,599 | ||||||
|
|
|
|
|
|||||
| Total current assets |
176,643 | 192,180 | ||||||
| Property and equipment, net |
20,384 | 18,811 | ||||||
| Intangible assets, net |
115,146 | 125,396 | ||||||
| Goodwill |
111,893 | 110,465 | ||||||
| Deferred tax assets |
376 | 1,230 | ||||||
| Other long-term assets |
1,525 | 399 | ||||||
|
|
|
|
|
|||||
| Total Assets |
$ | 425,967 | $ | 448,481 | ||||
|
|
|
|
|
|||||
| LIABILITIES AND STOCKHOLDERS’ EQUITY (DEFICIT) |
||||||||
| Current liabilities: |
||||||||
| Accounts payable |
$ | 71,934 | $ | 70,942 | ||||
| Lines of credit |
3,182 | 5,256 | ||||||
| Current portion of bank and other borrowings |
10,581 | 10,508 | ||||||
| Current portion of notes payable |
405 | — | ||||||
| Deferred revenue |
6,934 | 9,553 | ||||||
| Payroll and payroll related accrued liabilities |
6,567 | 6,907 | ||||||
| Other current liabilities |
6,327 | 8,274 | ||||||
|
|
|
|
|
|||||
| Total current liabilities |
105,930 | 111,440 | ||||||
| Long-term portion of bank and other borrowings |
15,928 | 22,910 | ||||||
| Long-term portion of notes payable |
190,733 | 190,147 | ||||||
| Long-term portion of employee benefit obligation |
2,377 | 2,338 | ||||||
| Deferred tax liabilities |
5,205 | 2,384 | ||||||
| Other long-term liabilities |
892 | 1,840 | ||||||
|
|
|
|
|
|||||
| Total Liabilities |
321,065 | 331,059 | ||||||
|
|
|
|
|
|||||
| Stockholders’ equity (deficit): |
| |||||||
| Common stock |
5 | 4 | ||||||
| Additional paid-in capital |
270,672 | 251,659 | ||||||
| Treasury stock, at cost |
(30,431 | ) | (30,431 | ) | ||||
| Accumulated other comprehensive loss |
(4,535 | ) | (2,010 | ) | ||||
| Accumulated deficit |
(130,809 | ) | (101,800 | ) | ||||
|
|
|
|
|
|||||
| Total stockholders’ equity |
104,902 | 117,422 | ||||||
|
|
|
|
|
|||||
| Total liabilities and stockholders’ equity (deficit) |
$ | 425,967 | $ | 448,481 | ||||
|
|
|
|
|
|||||
KALEYRA, INC.
Condensed Consolidated Statements of Operations
(Unaudited, in thousands, except share and per share data)
| Three Months Ended June 30, | Six Months Ended June 30, | |||||||||||||||
| 2022 | 2021 | 2022 | 2021 | |||||||||||||
| Revenue |
$ | 81,109 | $ | 53,992 | $ | 161,590 | $ | 93,706 | ||||||||
| Cost of revenue |
62,459 | 43,529 | 125,202 | 76,919 | ||||||||||||
|
|
|
|
|
|
|
|
|
|||||||||
| Gross profit |
18,650 | 10,463 | 36,388 | 16,787 | ||||||||||||
|
|
|
|
|
|
|
|
|
|||||||||
| Operating expenses: |
||||||||||||||||
| Research and development |
6,265 | 4,282 | 11,155 | 7,150 | ||||||||||||
| Sales and marketing |
7,226 | 4,660 | 14,326 | 7,519 | ||||||||||||
| General and administrative |
16,594 | 12,364 | 31,974 | 22,966 | ||||||||||||
|
|
|
|
|
|
|
|
|
|||||||||
| Total operating expenses |
30,085 | 21,306 | 57,455 | 37,635 | ||||||||||||
|
|
|
|
|
|
|
|
|
|||||||||
| Loss from operations |
(11,435 | ) | (10,843 | ) | (21,067 | ) | (20,848 | ) | ||||||||
| Other income, net |
37 | 47 | 83 | 92 | ||||||||||||
| Financial expense, net |
(3,417 | ) | (908 | ) | (6,569 | ) | (1,627 | ) | ||||||||
| Foreign currency income (loss) |
(1,117 | ) | (191 | ) | (860 | ) | 164 | |||||||||
|
|
|
|
|
|
|
|
|
|||||||||
| Loss before income tax expense (benefit) |
(15,932 | ) | (11,895 | ) | (28,413 | ) | (22,219 | ) | ||||||||
| Income tax expense (benefit) |
(95 | ) | (7,408 | ) | 596 | (7,374 | ) | |||||||||
|
|
|
|
|
|
|
|
|
|||||||||
| Net loss |
$ | (15,837 | ) | $ | (4,487 | ) | $ | (29,009 | ) | $ | (14,845 | ) | ||||
|
|
|
|
|
|
|
|
|
|||||||||
| Net loss per common share, basic and diluted |
$ | (0.36 | ) | $ | (0.13 | ) | $ | (0.68 | ) | $ | (0.46 | ) | ||||
|
|
|
|
|
|
|
|
|
|||||||||
| Weighted-average shares used in computing net loss per common share, basic and diluted |
43,410,858 | 34,292,874 | 42,829,188 | 32,328,909 | ||||||||||||
|
|
|
|
|
|
|
|
|
|||||||||
KALEYRA, INC.
Condensed Consolidated Statements of Cash Flows
(Unaudited, in thousands)
| Six Months Ended June 30, | ||||||||
| 2022 | 2021 | |||||||
| Cash Flows from Operating Activities: |
||||||||
| Net loss |
$ | (29,009 | ) | $ | (14,845 | ) | ||
| Adjustments to reconcile net loss to net cash used in operating activities: |
||||||||
| Depreciation and amortization |
11,838 | 3,460 | ||||||
| Stock-based compensation |
15,249 | 9,270 | ||||||
| Provision for doubtful accounts |
925 | 808 | ||||||
| Realized gains on marketable securities |
9 | 21 | ||||||
| Employee benefit obligation |
752 | 122 | ||||||
| Change in fair value of warrant liability |
(810 | ) | 830 | |||||
| Reversal of accrued interest on forward share purchase agreement |
— | (659 | ) | |||||
| Non-cash interest expense |
1,014 | 325 | ||||||
| Deferred taxes |
176 | (6,804 | ) | |||||
| Change in operating assets and liabilities: |
||||||||
| Trade receivables |
(13,319 | ) | (7,259 | ) | ||||
| Other current assets |
1,916 | (2,359 | ) | |||||
| Deferred cost |
12 | 46 | ||||||
| Other long-term assets |
(1,187 | ) | 1,483 | |||||
| Accounts payable |
5,361 | (1,882 | ) | |||||
| Other current liabilities |
1,678 | (2,508 | ) | |||||
| Deferred revenue |
(2,389 | ) | 6,920 | |||||
| Long-term liabilities |
(87 | ) | (82 | ) | ||||
|
|
|
|
|
|||||
| Net cash used in operating activities |
(7,871 | ) | (13,113 | ) | ||||
|
|
|
|
|
|||||
| Cash Flows from Investing Activities: |
||||||||
| Purchase of short-term investments |
(1,165 | ) | (1,882 | ) | ||||
| Sale of short-term investments |
6,459 | 546 | ||||||
| Purchase of property and equipment |
(966 | ) | (177 | ) | ||||
| Capitalized software development costs |
(4,502 | ) | (1,633 | ) | ||||
| Purchase of intangible assets |
(17 | ) | (3 | ) | ||||
| Acquisition of mGage, net of cash acquired |
— | (195,709 | ) | |||||
| Acquisition of Bandyer, net of cash acquired |
(1,005 | ) | — | |||||
|
|
|
|
|
|||||
| Net cash used in investing activities |
(1,196 | ) | (198,858 | ) | ||||
|
|
|
|
|
|||||
| Cash Flows from Financing Activities: |
||||||||
| Proceeds from (repayments on) line of credit, net |
(1,776 | ) | 203 | |||||
| Repayments on term loans |
(4,493 | ) | (3,451 | ) | ||||
| Proceeds from issuance of convertible notes, net of issuance costs |
— | 188,637 | ||||||
| Repayments on notes |
— | (7,500 | ) | |||||
| Receipts related to forward share purchase agreements |
— | 17,045 | ||||||
| Proceeds from issuance of common stock in Private Investment in Public Equity offering, net of issuance costs |
— | 99,051 | ||||||
| Proceeds related to settlement of non-forfeited 2020 Sponsor Earnout Shares |
— | 1,244 | ||||||
| Proceeds from the exercise of common stock warrants |
— | 2,872 | ||||||
| Repayments on capital lease |
(46 | ) | (66 | ) | ||||
|
|
|
|
|
|||||
| Net cash provided by (used in) financing activities |
(6,315 | ) | 298,035 | |||||
|
|
|
|
|
|||||
| Effect of exchange rate changes on cash, cash equivalents and restricted cash |
(2,230 | ) | (409 | ) | ||||
|
|
|
|
|
|||||
| Net increase (decrease) in cash, cash equivalents and restricted cash |
(17,612 | ) | 85,655 | |||||
| Cash, cash equivalents and restricted cash, beginning of period |
91,702 | 32,970 | ||||||
|
|
|
|
|
|||||
| Cash, cash equivalents and restricted cash, end of period |
$ | 74,090 | $ | 118,625 | ||||
|
|
|
|
|
|||||
KALEYRA, Inc.
Adjusted Gross Profit and Adjusted Gross Margin Reconciliation of GAAP to Non-GAAP Financial Information
For the Three and the Six Months Ended June 30, 2022 and 2021
(Unaudited, in thousands)
| Three Months Ended June 30, | Six Months Ended June 30, | |||||||||||||||
| 2022 | 2021 | 2022 | 2021 | |||||||||||||
| Consolidated Gross Profit |
$ | 18,650 | $ | 10,463 | $ | 36,388 | $ | 16,787 | ||||||||
| Consolidated Gross Margin % |
23.0 | % | 19.4 | % | 22.5 | % | 17.9 | % | ||||||||
| Amortization of acquired intangibles |
1,588 | 674 | 3,187 | 834 | ||||||||||||
| Non-GAAP Adjusted Gross Profit |
$ | 20,238 | $ | 11,137 | $ | 39,575 | $ | 17,621 | ||||||||
| Non-GAAP Adjusted Gross Margin % |
25.0 | % | 20.6 | % | 24.5 | % | 18.8 | % | ||||||||
KALEYRA, Inc.
Adjusted EBITDA Reconciliation of GAAP to Non-GAAP Financial Information
For the Three and the Six Months Ended June 30, 2022 and 2021
(Unaudited, in thousands)
| Three Months Ended June 30, | Six Months Ended June 30, | |||||||||||||||
| 2022 | 2021 | 2022 | 2021 | |||||||||||||
| Net loss |
$ | (15,837 | ) | $ | (4,487 | ) | $ | (29,009 | ) | $ | (14,845 | ) | ||||
| Other income, net |
(37 | ) | (47 | ) | (83 | ) | (92 | ) | ||||||||
| Financial expense, net |
3,417 | 908 | 6,569 | 1,627 | ||||||||||||
| Foreign currency income (loss) |
1,117 | 191 | 860 | (164 | ) | |||||||||||
| Income tax expense (benefit) |
(95 | ) | (7,408 | ) | 596 | (7,374 | ) | |||||||||
|
|
|
|
|
|
|
|
|
|||||||||
| Loss from operations |
$ | (11,435 | ) | $ | (10,843 | ) | $ | (21,067 | ) | $ | (20,848 | ) | ||||
| Depreciation and amortization |
5,936 | 2,551 | 11,838 | 3,460 | ||||||||||||
| Stock-based compensation and others |
10,160 | 5,987 | 18,412 | 11,442 | ||||||||||||
| Transaction and one-off costs (incl. severance) |
1,330 | 4,467 | 2,908 | 6,964 | ||||||||||||
| Company restructuring |
— | — | 85 | — | ||||||||||||
|
|
|
|
|
|
|
|
|
|||||||||
| Non-GAAP Adjusted EBITDA |
$ | 5,991 | $ | 2,162 | $ | 12,176 | $ | 1,018 | ||||||||
|
|
|
|
|
|
|
|
|
|||||||||
KALEYRA, Inc.
Adjusted Net Income (Loss) per share Reconciliation of GAAP to Non-GAAP Financial Information
For the Three and the Six Months Ended June 30, 2022 and 2021
(Unaudited, in thousands except share and per share data)
| Three Months Ended June 30, | Six Months Ended June 30, | |||||||||||||||
| 2022 | 2021 | 2022 | 2021 | |||||||||||||
| Net Loss |
$ | (15,837 | ) | $ | (4,487 | ) | $ | (29,009 | ) | $ | (14,845 | ) | ||||
| Stock-based compensation and others |
10,160 | 5,987 | 18,412 | 11,442 | ||||||||||||
| Transaction and one-off costs (incl. severance) |
1,330 | 4,467 | 2,908 | 6,964 | ||||||||||||
| Amortization of acquired intangibles |
3,984 | 1,775 | 8,407 | 2,173 | ||||||||||||
| Amortization of issuance costs for convertible debt |
513 | 196 | 991 | 196 | ||||||||||||
| Estimated tax effects of adjustments (1) |
(169 | ) | (617 | ) | 474 | (590 | ) | |||||||||
| Net tax benefits related to discrete tax items |
74 | (6,817 | ) | 220 | (6,817 | ) | ||||||||||
|
|
|
|
|
|
|
|
|
|||||||||
| Non-GAAP Net Income (Loss) |
$ | 55 | $ | 504 | $ | 2,403 | $ | (1,477 | ) | |||||||
|
|
|
|
|
|
|
|
|
|||||||||
| Net Loss per share |
||||||||||||||||
| Basic |
$ | (0.36 | ) | $ | (0.13 | ) | $ | (0.68 | ) | $ | (0.46 | ) | ||||
| Diluted |
$ | (0.36 | ) | $ | (0.13 | ) | $ | (0.68 | ) | $ | (0.46 | ) | ||||
| Non-GAAP Adjusted Net Income (Loss) per share |
||||||||||||||||
| Basic |
$ | 0.00 | $ | 0.01 | $ | 0.06 | $ | (0.05 | ) | |||||||
| Diluted |
$ | 0.00 | $ | 0.01 | $ | 0.05 | $ | (0.05 | ) | |||||||
| Weighted Average number of Shares Outstanding (basic) |
43,410,858 | 34,292,874 | 42,829,188 | 32,328,909 | ||||||||||||
| Weighted Average number of Shares Outstanding (diluted) |
53,749,617 | 44,946,532 | 52,925,570 | 32,328,909 | ||||||||||||
| (1) | The Non-GAAP tax-effect is determined using the period Effective Tax Rate (ETR) calculated for the periods, excluding discrete tax items. |

Exhibit 99.2 Trusted Communication Platform Investors Presentation August 2022 Copyright © Kaleyra, Inc. 2022

DISCLAIMER FORWARD LOOKING STATEMENTS This presentation contains forward-looking statements within the meaning of U.S. federal securities laws. Such forward-looking statements include, but are not limited to, statements regarding the expectations, beliefs, intentions, plans, prospects or strategies regarding the future business plans of Kaleyra, Inc. (“Kaleyra” or the “Company”) and the Company’s financial results, as well as future size and growth of addressable markets. Any statements contained herein that are not statements of historical fact may be deemed to be forward-looking statements. In addition, any statements that refer to projections, forecasts or other characterizations of future events or circumstances, including any underlying assumptions, are forward-looking statements. The words anticipate, believe, continue, could, estimate, expect, intends, may, might,” plan, possible, potential, predict, project, should, would and similar expressions may identify forward-looking statements, but the absence of these words does not mean that a statement is not forward-looking. The forward-looking statements contained in this presentation are based on certain assumptions of Kaleyra in light of its experience and perception of historical trends, current conditions, and expected future developments and their potential eects ff on Kaleyra as well as other factors that Kaleyra believes are appropriate in the circumstances. There can be no assurance that future developments aecting ff Kaleyra will be those anticipated. These forward-looking statements involve a number of risks, uncertainties (some of which are beyond the control of Kaleyra), or other assumptions that may cause actual results or performance to be materially different from those expressed or implied by these forward-looking statements. Should one or more of these risks or uncertainties materialize, or should any of the assumptions being made prove incorrect, actual results may vary in material respects from those projected in these forward-looking statements. Kaleyra undertakes no obligation to update or revise any forward-looking statements, whether as a result of new information, future events, or otherwise, except as may be required under applicable securities laws. Certain industry, market and competitive position data included in this presentation is based on research, surveys and other data obtained from third party sources and the Company’s own internal estimates and research. While Kaleyra believes these third party sources to be reliable, it has not independently verified, and makes no representation as to the accuracy or completeness of any information obtained from third party sources. In addition, certain of this data involves a number of assumptions and limitations, and there can be no guarantee as to the accuracy or reliability of such assumptions. NON-GAAP FINANCIAL MEASURE AND RELATED INFORMATION This presentation includes references to Adjusted Gross Margin, Adjusted EBITDA and Adjusted Earnings Per Share (EPS), i.e. financial measures that are not prepared in accordance with U.S. generally accepted accounting principles (“GAAP”). Adjusted Gross Margin is defined as of any date of calculation, the consolidated revenues of Kaleyra and its subsidiaries, net of the cost of goods sold calculated from the unaudited consolidated financial statements of such party and its subsidiaries, plus the amortization of acquired intangible assets running through cost of goods sold, divided by the consolidated revenues. Adjusted EBITDA is defined as of any date of calculation, the consolidated earnings of Kaleyra and its subsidiaries, before finance income and finance cost (including bank charges), tax, depreciation and amortization calculated from the unaudited consolidated financial statements of such party and its subsidiaries, plus (i) transaction and one-o e ff xpenses, (ii) without duplication of clause (i), severance or change of control payments, (iii) any expenses related to company restructuring, (iv) the Adjusted EBITDA for pre-acquisition period of subsidiaries, (v) any compensation expenses relating to stock options, restricted stock units, restricted stock or similar equity interests as may be issued by Kaleyra or any of its subsidiaries to its or their employees and (vi) any provision for the write down of assets. Adjusted EPS is calculated by dividing the adjusted net income (loss) by the weighted number of shares outstanding. Adjusted net income (loss) is defined as of any date of calculation, the net income (loss) of Kaleyra and its subsidiaries, plus: (i) transaction and one-o ff expenses, (ii) without duplication of clause (i), severance or change of control payments, (iii) any expenses related to company restructuring, (iv) any compensation expenses relating to stock options, restricted stock units, restricted stock or similar equity interests as may be issued by Kaleyra or any of its subsidiaries to its or their employees, (v) any provision for the write down of assets, (vi) the amortization of acquired intangible assets and (vii) the amortization of debt discount and issuance costs of convertible financial instruments. Kaleyra’s management believes that these non-GAAP measures of Kaleyra’s financial results will provide useful information to investors regarding certain financial and business trends relating to Kaleyra’s anticipated financial condition and results of operations. Internally, management uses these Non-GAAP financial measures in assessing the Company's operating results and in planning and forecasting. Investors should not rely on any single financial measure to evaluate Kaleyra’s business. Certain of the financial metrics in this presentation can be found in Kaleyra’s Form 10-Q for the quarter ended June 30, 2022, filed with the “SEC” on August 8, 2022, and the reconciliation of Adjusted Gross Margin, Adjusted EBITDA and Adjusted EPS can be found on slide 21-23 of this presentation. This presentation also includes reference to the non-GAAP operating metric Dollar-Based Net Expansion Rate, whose definition can be found on slide 24 of this presentation. TRADEMARKS AND INTELLECTUAL PROPERTY All trademarks, service marks, and trade names of Kaleyra and its subsidiaries or affiliates used herein are trademarks, service marks, or registered trademarks of Kaleyra as noted herein. Any other product, company names, or logos mentioned herein are the trademarks and/or intellectual property of their respective owners. 2 Copyright © Kaleyra, Inc. 2022

The Trusted Communication Platform as a Service (CPaaS) Kaleyra’s omnichannel platform helps businesses around the world connect with customers on their preferred channels 3 Copyright © Kaleyra, Inc. 2022
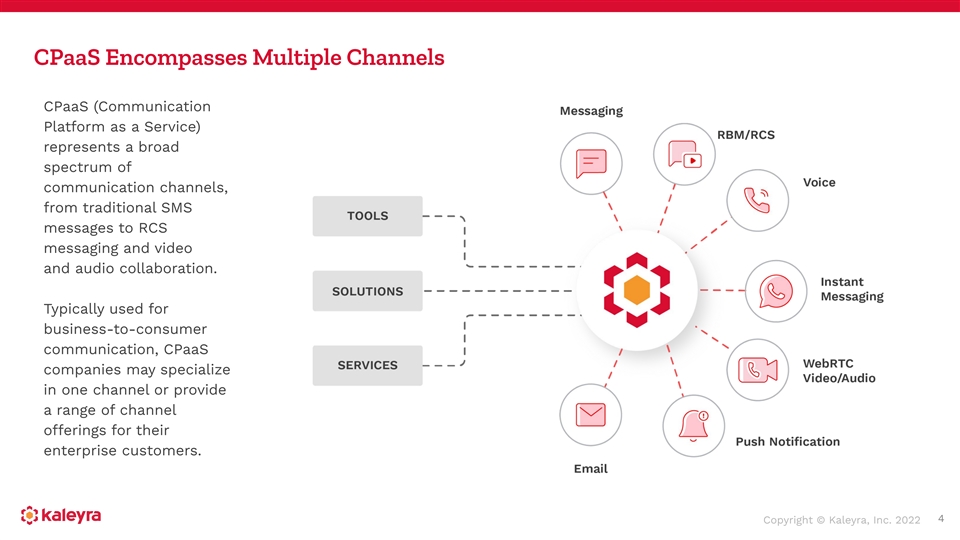
CPaaS Encompasses Multiple Channels CPaaS (Communication Platform as a Service) represents a broad spectrum of communication channels, from traditional SMS messages to RCS messaging and video and audio collaboration. Typically used for business-to-consumer communication, CPaaS companies may specialize in one channel or provide a range of channel oerings ff for their enterprise customers. 4 Copyright © Kaleyra, Inc. 2022

Overview 5

Omnichannel Offering for B2C Communication Video and audio WhatsApp RCS Messaging SMS collaboration Kaleyra oer ff s a wide variety of mobile communications channels, tools, solutions, and services that large businesses can access through APIs or a user-friendly web interface. We cater to businesses across many verticals including financial services, e-commerce, retail, healthcare, travel, and education. 6 Copyright © Kaleyra, Inc. 2022

International Presence, Global Footprint Q2 2022 Geographic Revenue Mix Termination countries Main countries of operations 7 Copyright © Kaleyra, Inc. 2022

Exceptional Standard for Trusted Service and Industry-Specific Compliance Kaleyra is committed to providing trusted, transparent, and high-quality service. Customer satisfaction is key – Kaleyra’s dedicated team of professionals oer ff s prompt, around-the-clock assistance. Retention is high – the average engagement tenure is >10 years for international clientele and >15 years for banking customers. 8 Copyright © Kaleyra, Inc. 2022

Enterprise-Focused and Experienced in Highly-Regulated Sectors Q2 2022 Sector Revenue Split Some of Our Customers 9 Copyright © Kaleyra, Inc. 2022

Top-Notch Partnerships * *Kaleyra is a proud member of Oracle PartnerNetwork and a provider of integrations to Oracle Marketing solutions. Kaleyra is also powered by Oracle Cloud Infrastructure with the goal to oer ff improved security, better service-level agreements, global scalability, and faster deployment. 10 Copyright © Kaleyra, Inc. 2022

Competitive Landscape Year 2021 CPaaS Vendors Ranking Kaleyra was included as a top five global CPaaS ‘Established Leader’ in the latest Competitor Leaderboard produced by Juniper Research, one of the leading independent analyst firms in the mobile and digital tech sector. Kaleyra highly compares to its peers for its strength and depth of operator partnerships, segment coverage and experience in CPaaS service provision, and is well positioned for its size of operations, innovation in CPaaS, Future CPaaS Market Prospects and Market Presence. Source: Juniper Research CPaaS Competitor Leaderboard, October 2021 11 Copyright © Kaleyra, Inc. 2022

Globally Recognized for Excellent Products, Customer Service, and Security 12 Copyright © Kaleyra, Inc. 2022

Financial Overview Q2 2022 13

Kaleyra’s Q2 2022 at a Glance Customer Highlights for the Fiscal Quarter Ended Q2 2022 Data June 30, 2022 13.4B 1.8B (1) • +103% Dollar-Based Net Expansion Rate of Messages Voice Calls quarterly revenues • 94.9% of revenue came from customers which have been on the platform for at least one year 1,800+ 90%+ • 38.3% of revenue is related to the top 10 Network Operator Revenue from customers with a churn rate of zero in the last year Connections Long-Tenure • Revenue by country breakdown: US (33.8%), India Customers (24.2%), Italy (20.5%), European Countries - excl Italy (7.3%), South America (6.9%) and Other and 607 18 Asian Countries (7.3%) Employees Global Offices Worldwide • No individual customer accounting for more than (APAC - EU - Americas) 10% of revenue 1 See definition of this non-GAAP operating metric on slide 24 14 Copyright © Kaleyra, Inc. 2022
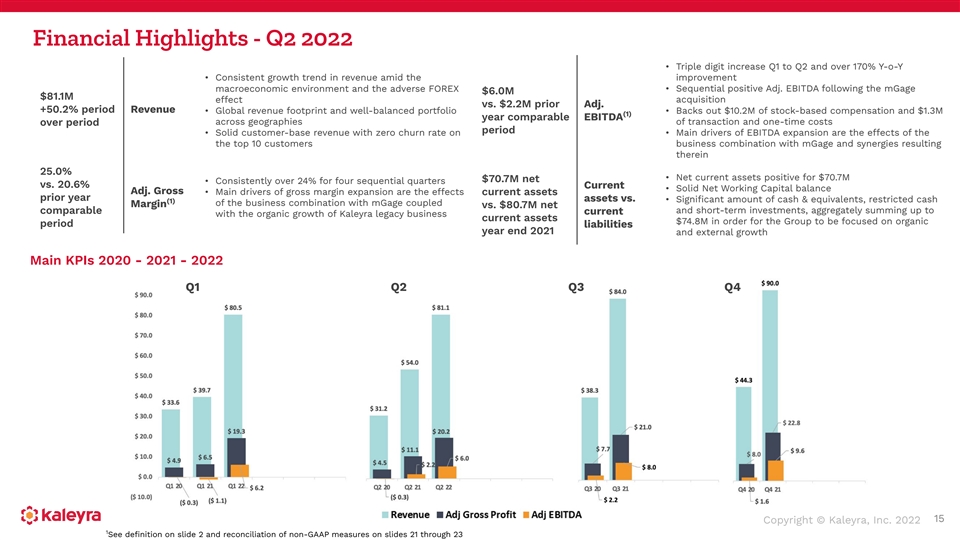
Financial Highlights - Q2 2022 • Triple digit increase Q1 to Q2 and over 170% Y-o-Y • Consistent growth trend in revenue amid the improvement macroeconomic environment and the adverse FOREX • Sequential positive Adj. EBITDA following the mGage $6.0M $81.1M eect ff acquisition vs. $2.2M prior Adj. +50.2% period Revenue • Global revenue footprint and well-balanced portfolio • Backs out $10.2M of stock-based compensation and $1.3M (1) year comparable EBITDA over period across geographies of transaction and one-time costs period • Solid customer-base revenue with zero churn rate on • Main drivers of EBITDA expansion are the eects o ff f the the top 10 customers business combination with mGage and synergies resulting therein 25.0% • Net current assets positive for $70.7M $70.7M net • Consistently over 24% for four sequential quarters vs. 20.6% Current • Solid Net Working Capital balance Adj. Gross • Main drivers of gross margin expansion are the eects ff current assets prior year assets vs. • Significant amount of cash & equivalents, restricted cash (1) of the business combination with mGage coupled Margin vs. $80.7M net and short-term investments, aggregately summing up to comparable current with the organic growth of Kaleyra legacy business current assets $74.8M in order for the Group to be focused on organic period liabilities year end 2021 and external growth Main KPIs 2020 - 2021 - 2022 Q1 Q2 Q3 Q4 15 Copyright © Kaleyra, Inc. 2022 1 See definition on slide 2 and reconciliation of non-GAAP measures on slides 21 through 23

Our Leadership Team Dario Calogero Giacomo Dall’Aglio Mauro Carobene Geoff Grauer Chief Executive Officer EVP, Chief Financial Officer EVP, Chief Business Officer EVP, Operations & Customer Success Nicola Jr Vitto Filippo Monastra Zephrin Lasker Colin Gillis EVP, Chief Product Officer SVP, Chief People Officer SVP, Marketing & Strategic Alliances Vice President of Investor Relations Copyright © Kaleyra, Inc. 2022 16

Thank You Investor Contacts: For further details, scan this QR code: Colin Gillis Vice President of Investor [email protected] Relations [email protected] Tom Colton or Matt Glover Gateway Investor Relations Copyright © Kaleyra, Inc. 2022 949-574-3860 [email protected]

Appendix 18
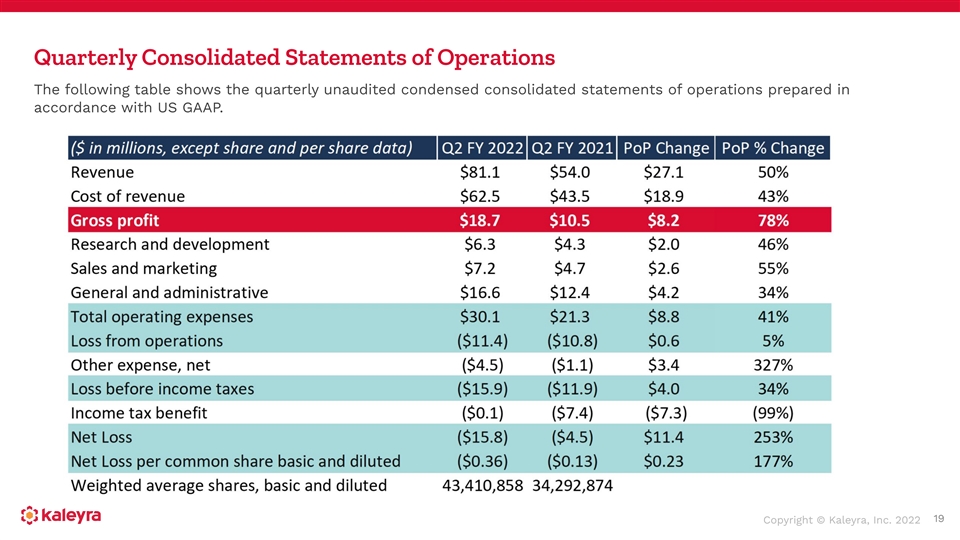
Quarterly Consolidated Statements of Operations The following table shows the quarterly unaudited condensed consolidated statements of operations prepared in accordance with US GAAP. 19 Copyright © Kaleyra, Inc. 2022

Consolidated Balance Sheets Note: Figures derived from US GAAP financials, except as otherwise indicated. 20 Copyright © Kaleyra, Inc. 2022

Quarterly Non-GAAP Adjusted Gross Margin Reconciliation The following table shows the reconciliation of the unaudited Non-GAAP Adjusted Gross Margin as reported in the investors presentation. The unaudited figures have been derived from financials prepared in accordance with US GAAP. (1) (1) Amortization of acquired intangible assets mainly includes the amortization of acquired intangible assets following the business combination with mGage and Bandyer. Note: Management uses non-GAAP financial measures to evaluate period-to-period comparisons. Management believes these measures provide useful information about the Company’s operating results and financial performance. These non-GAAP financial measures are not measures prepared in accordance with GAAP and might not be consistent with similar measures used by other companies. These non-GAAP financial measures shall not be considered as an alternative to any other measures of performance prepared under generally accepted accounting principles. 21 Copyright © Kaleyra, Inc. 2022

Quarterly Non-GAAP Adjusted EBITDA Reconciliation The following table shows the reconciliation of the unaudited Non-GAAP Adjusted EBITDA as reported in the investors presentation. The unaudited figures have been derived from financials prepared in accordance with US GAAP. Note: Management uses non-GAAP financial measures to evaluate period-to-period comparisons. Management believes these measures provide useful information about the Company’s operating results and financial performance. These non-GAAP financial measures are not measures prepared in accordance with GAAP and might not be consistent with similar measures used by other companies. These non-GAAP financial measures shall not be considered as an alternative to any other measures of performance prepared under generally accepted accounting principles. 22 Copyright © Kaleyra, Inc. 2022

Quarterly Non-GAAP Adjusted Earnings Per Share (EPS) Reconciliation The following table shows the reconciliation of the unaudited Non-GAAP Adjusted EPS as reported in the investors presentation. The unaudited figures have been derived from financials prepared in accordance with US GAAP. (1) The Non-GAAP estimated tax eects o ff f adjustments is determined by using the Eective ff Tax Rate (ETR) calculated for the three-month period, excluding discrete tax items. Note: Management uses non-GAAP financial measures to evaluate period-to-period comparisons. Management believes these measures provide useful information about the Company’s operating results and financial performance. These non-GAAP financial measures are not measures prepared in accordance with GAAP and might not be consistent with similar measures used by other companies. These non-GAAP financial measures shall not be considered as an alternative to any other measures of performance prepared under generally accepted accounting principles. 23 Copyright © Kaleyra, Inc. 2022

Operating Metrics Dollar-Based Net Expansion Rate. Kaleyra’s ability to drive growth and generate incremental revenue depends, in part, on the Company’s ability to maintain and grow its relationships with Active Existing Customer Accounts and to increase their use of the platform. An important way in which Kaleyra has historically tracked performance in this area is by measuring the Dollar-Based Net Expansion Rate for those customer accounts. Kaleyra’s Dollar-Based Net Expansion Rate increases when such customer accounts increase their usage of a product, extend their usage of a product to new applications or adopt a new product. Kaleyra’s Dollar-Based Net Expansion Rate decreases when such customer accounts cease or reduce their usage of a product or when the Company lowers usage prices on a product. Kaleyra believes that measuring Dollar-Based Net Expansion Rate provides a more meaningful indication of the performance of the Company’s eor ff ts to increase revenue from existing customers. As a result of the introduction of Dollar-Based Net Expansion Rate disclosure by Kaleyra in the SEC filing, press release and presentation for the three months ended December 31, 2021, no comparable period is provided prior to that date. To calculate the Dollar-Based Net Expansion Rate, the Company first identifies the cohort of customer accounts that were customer accounts in the same quarter of the prior year. The Dollar-Based Net Expansion Rate is the quotient obtained by dividing the revenue generated from that cohort in a quarter, by the revenue generated from that same cohort in the corresponding quarter in the prior year. The Q2 2022 Dollar-Based Net Expansion Rate has been calculated by making reference to the Pro Forma (PF) revenue generated from the same customer base in the corresponding year-ago comparable period. Active Existing Customer Accounts. Kaleyra believes that the number of Active Customer Accounts is an important indicator of the growth of its business, the market acceptance of its platform and future revenue trends. Kaleyra defines an Active Customer Account at the end of any reporting period as an individual account, as identified by a unique account identifier, for which Kaleyra has recognized revenue in the period. 24 Copyright © Kaleyra, Inc. 2022

Share Count of Kaleyra Common Stock KLR (NYSE) shares of Common Stock as of June 30, 2022: - issued and outstanding: 44,344,364 Note: Shares beneficially owned by management (other than Directors and Officers) are included in the Implied Retail Float 25 Copyright © Kaleyra, Inc. 2022 Note: Employees’ RSUs are included in the Implied Retail Float
Serious News for Serious Traders! Try StreetInsider.com Premium Free!
You May Also Be Interested In
- Jaxon Announces Resignation of CFO
- Business growth stunted by manual tasks, Tipalti study finds
- Proactive Service Focus: Optimizing Power Business Environment
Create E-mail Alert Related Categories
SEC FilingsSign up for StreetInsider Free!
Receive full access to all new and archived articles, unlimited portfolio tracking, e-mail alerts, custom newswires and RSS feeds - and more!
