

Form 8-K Greenrose Acquisition For: Jul 28
 Tweet
Tweet Share
Share
UNITED STATES
SECURITIES AND EXCHANGE COMMISSION
Washington, D.C. 20549
FORM 8-K
CURRENT REPORT
Pursuant to Section 13 or Section 15(d) of the Securities Exchange Act of 1934
July 28, 2021
Date of Report (Date of earliest event reported):
GREENROSE ACQUISITION CORP.
(Exact name of registrant as specified in its charter)
| Delaware | 001-39217 | 84-2845696 | ||
| (State
or other jurisdiction of incorporation or organization) |
(Commission File Number) | (I.R.S.
Employer Identification Number) |
111 Broadway Amityville, NY 11701 |
11701 | |
| (Address of principal executive offices) | (Zip Code) |
Registrant’s telephone number, including area code: (516) 346-6270
Not Applicable
(Former name or former address, if changed since last report)
Check the appropriate box below if the Form 8-K filing is intended to simultaneously satisfy the filing obligation to the registrant under any of the following provisions:
| ☐ | Written communications pursuant to Rule 425 under the Securities Act (17 CFR 230.425) |
| ☒ | Soliciting material pursuant to Rule 14a-12 under the Exchange Act (17 CFR 240.14a-12) |
| ☐ | Pre-commencement communications pursuant to Rule 14d-2(b) under the Exchange Act (17 CFR 240.14d-2(b)) |
| ☐ | Pre-commencement communications pursuant to Rule 13e-4(c) under the Exchange Act (17 CFR 240.13e-4(c)) |
Indicate by check mark whether the registrant is an emerging growth company as defined in Rule 405 of the Securities Act of 1933 (§230.405 of this chapter) or Rule 12b-2 of the Securities Exchange Act of 1934 (§240.12b-2 of this chapter).
Emerging growth company ☒
If an emerging growth company, indicate by check mark if the registrant has elected not to use the extended transition period for complying with any new or revised financial accounting standards provided pursuant to Section 13(a) of the Exchange Act. ☐
Securities registered pursuant to Section 12(b) of the Act:
| Title of Each Class | Name of Each Exchange on Which Registered | |
| Units, each consisting of one share of common stock and one redeemable warrant | OTCQX | |
| Common stock, par value $0.0001 per share | OTCQX | |
| Redeemable warrants, exercisable for shares of common stock at an exercise price of $11.50 per share | OTCQX |
Item 8.01 Other Events
On July 28, 2021, in light of ongoing regulatory, market and environmental developments impacting Greenrose Acquisition Corp.’s (“Greenrose” or the “Company”) business projections, Greenrose issued an updated presentation (the “Investor Presentation”) included as Exhibit 99.1 hereto and incorporated by reference into this Item 8.01. Greenrose provides the Investor Presentation as an update to the Investor Presentation filed by Greenrose on its Current Report on Form 8-K filed June 16, 2021 (the “June 16, 2021 Presentation”).
The Investor Presentation filed herewith and the financial information and projections reflected therein replace and supersede in all respects the June 16, 2021 Presentation. The June 16, 2021 Presentation should no longer be relied upon by investors, potential investors or other third parties.
The Investor Presentation includes financial information not prepared in accordance with generally accepted accounting principles.
The information contained in the Investor Presentation is summary information that is intended to be considered in the context of Greenrose’s SEC filings and other public announcements that Greenrose may make, by press release or otherwise, from time to time. Greenrose undertakes no duty or obligation to publicly update or revise the information contained in this report, although it may do so from time to time as its management believes is warranted. Any such updating may be made through the filing of other reports or documents with the SEC, through press releases or through other public disclosure.
By filing this Current Report on Form 8-K and furnishing the information contained herein, Greenrose makes no admission as to the materiality of any information in this report that is required to be disclosed solely by reason of Regulation FD.
Forward Looking Statements
This Current Report on Form 8-K includes certain statements that are not historical facts but are forward-looking statements for purposes of the safe harbor provisions under the United States Private Securities Litigation Reform Act of 1995. Forward-looking statements generally are accompanied by words such as “believe,” “may,” “will,” “estimate,” “continue,” “anticipate,” “intend,” “expect,” “should,” “would,” “plan,” “predict,” “potential,” “seem,” “seek,” “future,” “outlook,” and similar expressions that predict or indicate future events or trends or that are not statements of historical matters. These forward-looking statements include, but are not limited to, statements regarding estimates and forecasts of revenue and other financial and performance metrics and projections of market opportunity and expectations, Greenrose’s ability to enter into definitive agreements or consummate a transaction with any of Shango Holdings Inc., or Shango, Futureworks LLC (d/b/a The Health Center), or Futureworks, Theraplant, LLC, or Theraplant, or True Harvest, LLC, or True Harvest to obtain the financing necessary consummate its previously announced proposed transactions; and the expected timing of completion of the Proposed Transactions. These statements are based on various assumptions and on the current expectations of Greenrose’s and any of Shango, Theraplant, True Harvest, or Futureworks’ management and are not predictions of actual performance. These forward-looking statements are provided for illustrative purposes only and are not intended to serve as, and must not be relied on by any investor as, a guarantee, an assurance, a prediction or a definitive statement of fact or probability. Actual events and circumstances are difficult or impossible to predict and will differ from assumptions. Many actual events and circumstances are beyond the control of Greenrose and any of Shango, Theraplant, True Harvest, or Futureworks. These forward-looking statements are subject to a number of risks and uncertainties, including general economic, financial, legal, political and business conditions and changes in domestic and foreign markets; the inability of the parties to enter into definitive agreements or successfully or timely consummate the Proposed Transactions or to satisfy the other conditions to the closing of the Proposed Transactions, including the risk that any required regulatory approvals are not obtained, are delayed or are subject to unanticipated conditions that could adversely affect the combined company; the risk that the approval of the Greenrose Stockholders for the Proposed Transactions is not obtained; failure to realize the anticipated benefits of the Proposed Transactions, including as a result of a delay in consummating any of the Proposed Transactions or difficulty in, or costs associated with, integrating the businesses of Greenrose and any of Shango, Theraplant, True Harvest, or Futureworks; the amount of redemption requests made by the Greenrose Stockholders; the occurrence of events that may give rise to a right of Greenrose and any of Shango, Theraplant, True Harvest, or Futureworks to terminate the respective Merger Agreements or Asset Purchase Agreements, as applicable; risks related to the rollout of Greenrose’ business and the timing of expected business milestones; the effects of competition on Greenrose’s business; and those factors discussed in Greenrose’s Annual Report on Form 10-K for the fiscal year ended December 31, 2020 under the heading “Risk Factors,” and other documents of Greenrose filed, or to be filed, with the SEC. If the risks materialize or assumptions prove incorrect, actual results could differ materially from the results implied by these forward-looking statements. There may be additional risks that neither Greenrose nor any of Shango, Theraplant, True Harvest, or Futureworks presently know or that Greenrose and any of Shango, Theraplant, True Harvest, or Futureworks currently believe are immaterial that could also cause actual results to differ from those contained in the forward-looking statements. In addition, forward-looking statements reflect Greenrose’s and each of Shango, Theraplant, True Harvest, or Futureworks’ expectations, plans or forecasts of future events and views as of the date of this Current Report on Form 8-K. Greenrose and each of Shango, Theraplant, True Harvest, and Futureworks anticipate that subsequent events and developments will cause their assessments to change. However, while Greenrose and any of Shango, Theraplant, True Harvest, or Futureworks may elect to update these forward-looking statements at some point in the future, Greenrose and each of Shango, Theraplant, True Harvest, and Futureworks specifically disclaim any obligation to do so. These forward-looking statements should not be relied upon as representing Greenrose’s or any of any of Shango, Theraplant, True Harvest, or Futureworks’ assessments as of any date subsequent to the date of this Current Report on Form 8-K. Accordingly, undue reliance should not be placed upon the forward-looking statements.
1
Item 9.01 Financial Statements and Exhibits.
(d) Exhibits
| Exhibit No. | Description | |
| 99.1 | Investor Presentation |
2
SIGNATURE
Pursuant to the requirements of the Securities Exchange Act of 1934, the Registrant has duly caused this report to be signed on its behalf by the undersigned hereunto duly authorized.
| GREENROSE ACQUISITION CORP. | ||
| Date: July 28, 2021 | By: | /s/ William F. Harley III |
| Name: | William F. Harley III | |
| Title: | Chief Executive Officer | |
3
Exhibit 99.1

1 1 1 Business Combination Summary July 2021

2 2 2 Disclaimer This Presentation (together with oral statements made in connection herewith, this “Presentation”) contains selected confidential information about Greenrose Acquisition Corp . (“GREENROSE”) and information relating to GREENROSE’S potential business combination transactions with the companies for which summary overview information is provided herein . By receiving and participating in this Presentation, you expressly agree to keep confidential all otherwise non - public information disclosed in the Presentation, whether orally or in writing . You also agree not to distribute, disclose, or use such information for any purpose, other than for the purpose of you or your firm’s participation in this Presentation and to return to GREENROSE, delete or destroy this Presentation upon GREENROSE’s request . You are advised that the United States securities laws restrict persons in possession of material non - public information relating to a company whose securities are publicly traded – whether such material non - public information is obtained directly or indirectly from that company, its representatives or any party under a duty of confidentiality -- from purchasing or selling securities of such company, or from communicating such information to any other person under circumstances in which it is reasonably foreseeable that such person is likely to purchase or sell such securities on the basis of such information . NEITHER THE SECURITIES AND EXCHANGE COMMISSION NOR ANY STATE SECURITIES COMMISSION HAS APPROVED OR DISAPPROVED OF THE SECURITIES OR DETERMINED IF THIS PRESENTATION IS TRUTHFUL OR COMPLETE . This Presentation contains financial forecasts with respect to GREENROSE’s projected Revenues, EBITDA, and Net Income . GREENROSE’s independent auditors have not audited, reviewed, compiled, or performed any procedures with respect to the projections for the purpose of their inclusion in this Presentation and accordingly, they have not expressed an opinion or provided any other form of assurance with respect thereto for the purpose of this Presentation . These projections should not be relied upon as being necessarily indicative of future results . The assumptions and estimates underlying the prospective financial information are inherently uncertain and are subject to a wide variety of significant business, economic and competitive risks and uncertainties that could cause such estimates to change and actual results to differ materially from those contained in the forward - looking financial information . Accordingly, there can be no assurance that forward - looking statements or projections are indicative of the future performance of GREENROSE, or that actual results will not differ materially from those presented in the prospective or projected financial information . Inclusion of any projection, prospective information, or forward - looking statement in this Presentation should not be regarded as a representation by any person that the projections contained in the prospective financial information will be achieved . Neither GREENROSE, nor any of its respective affiliates or advisors have any obligation to update this Presentation . Although all information and opinions expressed in this Presentation were obtained in good faith from sources believed to be reliable, independent verification has not been made by GREENROSE and no representation or warranty, express or implied, is made as to its accuracy or completeness . This Presentation contains preliminary information only, is subject to change at any time and is not, and should not be assumed to be, complete or to constitute all the information necessary to adequately make an informed decision regarding your evaluation of your possible engagement with GREENROSE . Forward - Looking Statements . Statements made in this presentation that are not historical facts are “forward - looking statements” within the meaning of Section 21 E of the Securities Exchange Act of 1934 , as amended, and the Private Securities Litigation Reform Act of 1995 . Forward - looking statements may relate to the business combination and any other statements relating to future results, strategy and plans of GREENROSE (including certain projections and business trends, and statements which may be identified by the use of the words “plans”, “expects” or “does not expect”, “estimated”, “is expected”, “budget”, “scheduled”, “estimates”, “forecasts”, “intends”, “anticipates” or “does not anticipate”, or “believes”, or variations of such words and phrases or state that certain actions, events or results “may”, “could”, “would”, “might”, “projects”, “will” or “will be taken”, “occur” or “be achieved”) . Such statements are provided for illustrative purposes only and are not to be relied upon as predictions or any assurance or guarantee by any party of actual performance of GREENROSE and the proposed acquisitions . Forward - looking statements are based on the opinions and estimates of management of GREENROSE and/or the estimates of management of the companies GREENROSE proposes to acquire, as the case may be, as of the date such statements are made, and they are subject to known and unknown risks, uncertainties, assumptions and other factors that may cause the actual results, level of activity, performance or achievements to be materially different from those expressed or implied by such forward - looking statements . These risks and uncertainties include, but are not limited to, the occurrence of any event, change or other circumstances that could give rise to a delay in or the failure to close any business combination ; the amount of any redemptions ; the ability to attract and retain key personnel ; the ability to achieve timely stockholder and regulatory approvals ; prevailing industry trends including consumer spending as well as in cannabis markets ; legislation or regulatory requirements and developments in the global economy in general and the regulation of cannabis in particular ; the public health crisis related to the coronavirus (COVID - 19 ) pandemic and resulting significant negative effects to the global economy ; disruption of global supply chains and distribution channels ; as well as significant volatility in and possible disruption of financial markets ; increased operating costs, decreased ability to profitably develop and operate cultivation and processing facilities as well as retail points of sale ; competition in the US cannabis markets ; and the impact of government shutdowns or other limitations impacting business activity generally . This Presentation also contains estimates, projections and other information concerning our industry, our business, and the markets for our products and services . Some data and other information related to our businesses are based on internal estimates and calculations that are derived from research we conducted and budgetary information, estimates and projections of management of the companies GREENROSE seeks to acquire . You are cautioned not to give undue weight to any such estimates, projections and other forward - looking information . Use of Projections . This Presentation contains projected financial information with respect to the companies GREENROSE proposes to acquire as well as GREENROSE as a combined operating entity assuming the proposed acquisitions are completed . Such projected financial information constitutes forward - looking information, is for illustrative purposes only and should not be relied upon as being indictive of future results . The assumptions and estimates underlying such projections are inherently uncertain, subject to a wide variety of significant business, economic, competitive and other risks and uncertainties as noted above in “Forward - looking statements” . Actual results may differ materially from financial forecasts contained in this Presentation, and the inclusion of such projections in this Presentation shall not constitute, and should not be regarded as, a representation by any person that such forecasts will be achieved . This Presentation also contains trademarks, service marks and trade names of third parties, which are the property of their respective owners . The use or display of third parties’ trademarks, service marks, trade names or products in this Presentation is not intended to, and does not imply, any relationship with GREENROSE, or an endorsement or sponsorship by or of GREENROSE . Solely for convenience, the trademarks, service marks and trade names referred to in this Presentation may appear without the ®, TM or SM symbols, but such references are not intended to indicate, in any way, that GREENROSE will not assert, to the fullest extent under applicable law, their rights or the right of the applicable licensor to these trademarks, service marks and trade names . Nothing herein should be construed as legal, financial, tax, investment management or other advice . You should consult your own advisers concerning any legal, financial, tax, investment management or other considerations concerning the opportunity described herein . The general explanations included in this Presentation cannot address, and are not intended to address, your specific investment objectives, financial situation or financial needs . This Presentation relates to the prospective acquisition by GREENROSE of several companies and may be deemed to be solicitation material in respect of the prospective business combinations . The business proposed combinations will be submitted to the stockholders of GREENROSE and the respective target companies for their approval . This Presentation is for informational purposes only and is neither an offer to sell or purchase, nor the solicitation of an offer to buy or sell any securities, nor is it a solicitation of any vote, consent, or approval in any jurisdiction pursuant to or in connection with the business combination or otherwise, nor shall there be any sale, issuance or transfer of securities in any jurisdiction in contravention of applicable law .

3 3 3 Table of Contents I. Executive Summary of Business Combinations (“BC”)…………………………………….…… 4 II. Combined Company Overview…………………………………………………………………….. 10 III. Financial Overview and Valuation…………………….………………………………………….... 18 IV. Appendix ............................................................................................................................. ... 26 A. Market Overview………………………………………………………………………………….. 27 B. Target Company Detail …………………………………………………………………………... 31 This Company presentation dated July 2021 and the financial information and projections reflected herein replace and supersede in all respects the presentation filed by the Company as an exhibit to the Company’s Form 8 - K filed with the SEC in June 2021. This updated presentation reflects anticipated impact of the June 27, 2021 legalization of adult use cannabis market in Connecticut in which Theraplant operates as well as an amendment to the True Harvest Asset Purchase Agreement to provide additional earnout consideration in the event of meeting agreed milestones. The June 2021 Presentation should no longer be relied upon by investors, potential investors or other third parties.

4 4 4 I. Executive Summary of Business Combinations
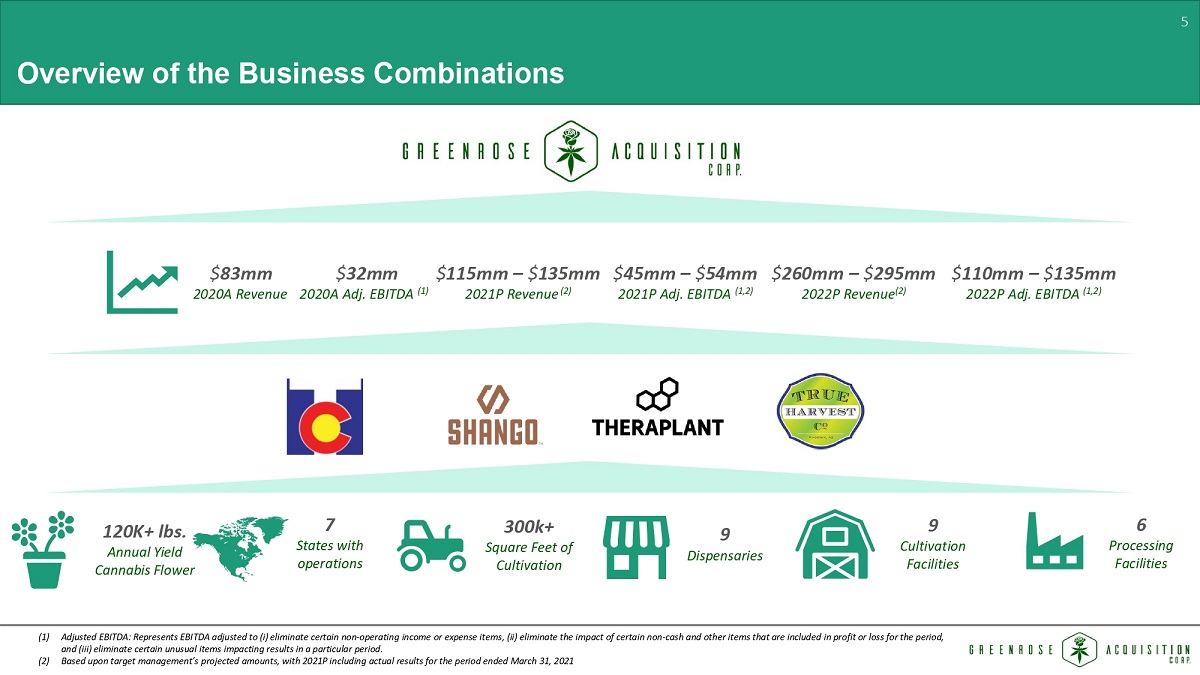
5 5 5 Overview of the Business Combinations 9 Dispensaries 7 States with operations 300k+ Square Feet of Cultivation 9 Cultivation Facilities 6 Processing Facilities 120K+ lbs. Annual Yield Cannabis Flower $ 83mm 2020A Revenue $ 32mm 2020A Adj. EBITDA (1) $ 115mm – $ 135mm 2021P Revenue (2) $ 45mm – $ 54mm 2021P Adj. EBITDA (1,2) $ 260mm – $ 295mm 2022P Revenue (2) $ 110mm – $ 135mm 2022P Adj. EBITDA (1,2) (1) Adjusted EBITDA: Represents EBITDA adjusted to ( i ) eliminate certain non - operating income or expense items, (ii) eliminate the impact of certain non - cash and other items that ar e included in profit or loss for the period, and (iii) eliminate certain unusual items impacting results in a particular period. (2) Based upon target management’s projected amounts, with 2021P including actual results for the period ended March 31, 2021

6 6 6 Summary of Greenrose Growth Strategy Premium “Top - Shelf’ Market Alignment ▪ Target acquisitions with top - quality product retail alignment, selling the most reputable products in their respective markets a t premium prices ▪ Leverage scalable cultivation operations Emerging REC Markets ( AZ, MI, NV, CT) ▪ Expand existing cultivation to support new retail outlets tapping rising wholesale prices and market demand ▪ Add new REC stores as townships and local municipalities opt into the market and vertically integrate into Greenrose’s existing grow and manufacturing supply chain Developing / Mature REC Markets (CA, CO, OR) ▪ Build upon initial position by acquiring assets that can provide revenue and/or cost synergies ▪ Focus will be increasing retail footprint, vertically integrating existing grow and manufacturing supply chain, improve produ ct offering, and eliminating duplicative overhead ▪ Profit growth driven by consolidation, vertical integration, and migration away from illicit markets ▪ Post - BC Company cash flow / EBITDA positive ▪ “Grow - centric” focus – we want to have the best flower at every price point Medical Markets ( CT) ▪ Increase retail footprint through acquisitions or new store build - outs, and vertically integrate into the existing grow and manu facturing supply chain ▪ As this state migrates to REC, participates in the significant growth these transitions offer by positioning the asset base d epe nding on how the state’s new laws and regulations are written ▪ Continue to analyze medical markets on the east coast, strategically seize opportunities as they arise Distressed Opportunity ▪ By assembling a group of proven, veteran industry operators, Greenrose will be positioned to take advantage of the increasing number of “distressed” opportunities in the market Holistic Growth Strategy SC19 SC20 SC24

7 7 7 Mickey Harley CEO, Director ▪ 25 - year career on Wall street ▪ 10 - year career in agricultural investments, start - ups, and operations 35 - year career driving innovation and growth through operational management, business consulting and venture capital 35 - year career in commercial banking and acquisition integration 30 - year career in human resources and career development ▪ 30 - year career in financial technology ▪ Seasoned experience in cannabis start - ups 35 years of experience in investment management, corporate finance, and investment banking 50 - year career of business leadership and operational management Bio Experience Greenrose Management Team Paul Otto Wimer President Jack Falcon Chairman Jeffrey Stegner CFO Nicole Conboy Chief Admin Officer Brendan Sheehan EVP Corp. Strat., Director Daniel Harley EVP IR Director Allen & Co Allen & Co

8 8 8 Shango Founder, CEO Gary “Brandon” Rexroad Theraplant Co - Founder, CEO/COO & Managing Member Daniel Emmans Co - Founder Futureworks , LLC Chris Schonbachler • Expected to become Regional President of Greenrose • Expected to become Chief Operating Officer of Greenrose • Expected to become Regional President of Greenrose Greenrose Management Team Continued Involvement of Senior Management
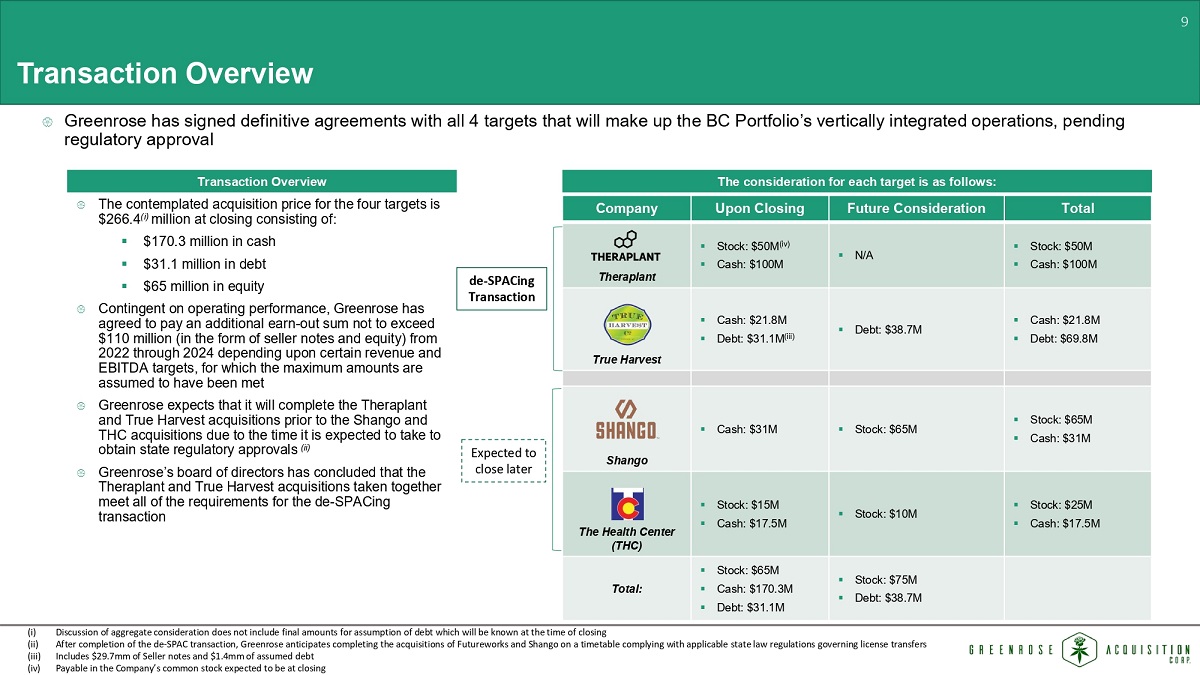
9 9 9 The contemplated acquisition price for the four targets is $266.4 ( i ) million at closing consisting of: ▪ $170.3 million in cash ▪ $31.1 million in debt ▪ $65 million in equity Contingent on operating performance, Greenrose has agreed to pay an additional earn - out sum not to exceed $110 million (in the form of seller notes and equity) from 2022 through 2024 depending upon certain revenue and EBITDA targets, which the maximums are assumed to have been met Greenrose expects that it will complete the Theraplant and True Harvest acquisitions prior to the Shango and THC acquisitions due to the time it is expected to take to obtain state regulatory approvals (ii) Greenrose’s board of directors has concluded that the Theraplant and True Harvest acquisitions taken together meet all of the requirements for the de - SPACing transaction Greenrose has signed definitive agreements with all 4 targets that will make up the BC Portfolio’s vertically integrated operations, pe nd ing regulatory approval Transaction Overview Transaction Overview Company Upon Closing Future Consideration Total Theraplant ▪ Stock: $50M ▪ Cash: $100M ▪ N/A ▪ Stock: $50M ▪ Cash: $100M True Harvest ▪ Cash: $21.8M ▪ Debt: $31.1M (iii) ▪ Debt: $35M ▪ Cash: $21.8M ▪ Debt: $66.1M Shango ▪ Cash: $31M ▪ Stock: $65M ▪ Stock: $65M ▪ Cash: $31M The Health Center (THC) ▪ Stock: $15M ▪ Cash: $17.5M ▪ Stock: $10M ▪ Stock: $25M ▪ Cash: $17.5M Total: ▪ Stock: $65M ▪ Cash: $170.3M ▪ Debt: $31.1M ▪ Stock: $75M ▪ Debt: $35M The consideration for each target is as follows: de - SPACing Transaction Expected to close later (i) Discussion of aggregate consideration does not include final amounts for assumption of debt which will be known at the time o f c losing (ii) After completion of the de - SPAC transaction, Greenrose anticipates completing the acquisitions of Futureworks and Shango on a timetable complying with applicable state law regulations governing license transfers (iii) Includes $29.7mm of Seller notes and $1.4mm of assumed debt SC21
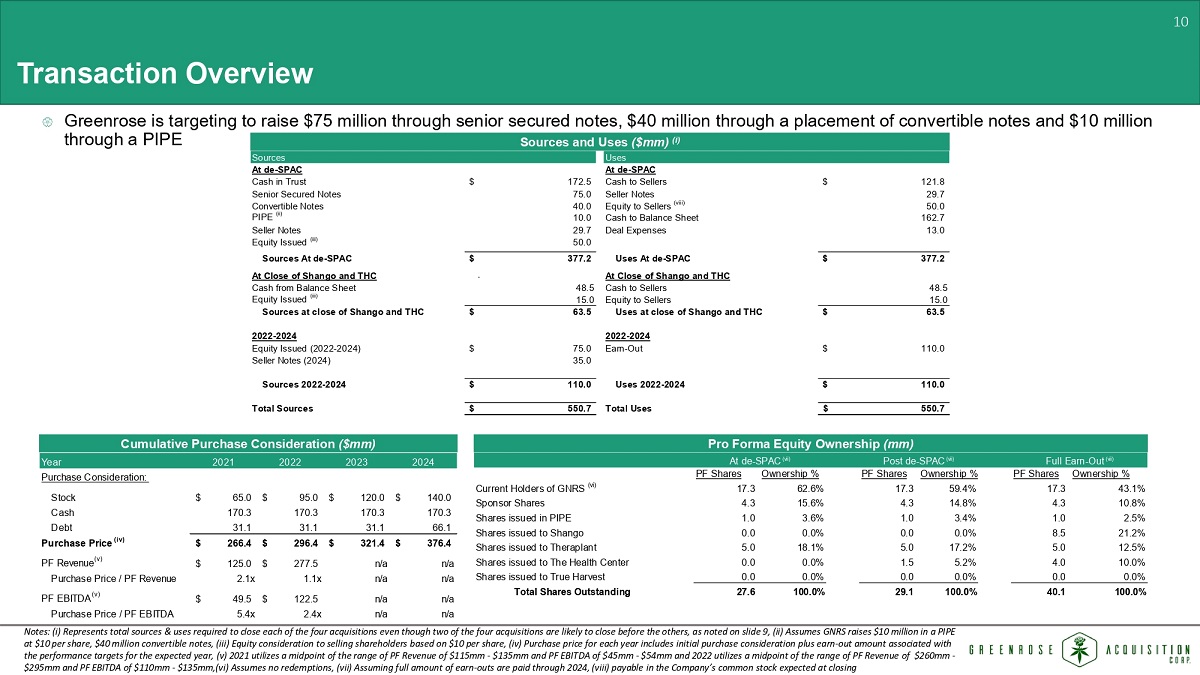
10 10 10 Transaction Overview Notes: ( i ) Represents total sources & uses required to close each of the four acquisitions even though two of the four acquisitions ar e l ikely to close before the others, as noted on slide 9, (ii) Assumes GNRS raises $10 million in a PIPE at $10 per share, $40 million convertible notes, (iii) Equity consideration to selling shareholders based on $10 per sha re, (iv) Purchase price for each year includes initial purchase consideration plus earn - out amount associated with the performance targets for the expected year, (v) 2021 utilizes a midpoint of the range of PF Revenue of $11 5mm - $135mm and PF EBITDA of $45mm - $54mm and 2022 utilizes a midpoint of the range of PF Revenue of $260mm - $295mm and PF EBITDA of $110mm - $135mm,(vi) Assumes no redemptions, (vii) Assuming full amount of earn - out s are paid through 2024 Sources and Uses ($mm) ( i ) Cumulative Purchase Consideration ($mm) Pro Forma Equity Ownership (mm) Greenrose is targeting to raise $75 million through senior secured notes, $40 million through a placement of convertible note s a nd $10 million through a PIPE Sources Uses At de-SPAC At de-SPAC Cash in Trust 172.5$ Cash to Sellers 121.8$ Senior Secured Notes 75.0 Seller Notes 29.7 Convertible Notes 40.0 Equity to Sellers 50.0 PIPE (ii) 10.0 Cash to Balance Sheet 162.7 Seller Notes 29.7 Deal Expenses 13.0 Equity Issued (iii) 50.0 Sources At de-SPAC 377.2$ Uses At de-SPAC 377.2$ At Close of Shango and THC At Close of Shango and THC Cash from Balance Sheet 48.5 Cash to Sellers 48.5 Equity Issued (iii) 15.0 Equity to Sellers 15.0 Sources at close of Shango and THC 63.5$ Uses at close of Shango and THC 63.5$ 2022-2024 2022-2024 Equity Issued (2022-2024) 75.0$ Earn-Out 110.0$ Seller Notes (2024) 35.0 Sources 2022-2024 110.0$ Uses 2022-2024 110.0$ Total Sources 550.7$ Total Uses 550.7$ Year 2021 2022 2023 2024 Purchase Consideration: Stock 65.0$ 95.0$ 120.0$ 140.0$ Cash 170.3 170.3 170.3 170.3 Debt 31.1 31.1 31.1 66.1 Purchase Price (iv) 266.4$ 296.4$ 321.4$ 376.4$ PF Revenue (v) 125.0$ 277.5$ n/a n/a Purchase Price / PF Revenue 2.1x 1.1x n/a n/a PF EBITDA (v) 49.5$ 122.5$ n/a n/a Purchase Price / PF EBITDA 5.4x 2.4x n/a n/a PF Shares Ownership % PF Shares Ownership % PF Shares Ownership % Current Holders of GNRS (vi) 17.3 62.6% 17.3 59.4% 17.3 43.1% Sponsor Shares 4.3 15.6% 4.3 14.8% 4.3 10.8% Shares issued in PIPE 1.0 3.6% 1.0 3.4% 1.0 2.5% Shares issued to Shango 0.0 0.0% 0.0 0.0% 8.5 21.2% Shares issued to Theraplant 5.0 18.1% 5.0 17.2% 5.0 12.5% Shares issued to The Health Center 0.0 0.0% 1.5 5.2% 4.0 10.0% Shares issued to True Harvest 0.0 0.0% 0.0 0.0% 0.0 0.0% Total Shares Outstanding 27.6 100.0% 29.1 100.0% 40.1 100.0% At de-SPAC (vii) Full Earn-Out (vii) Post de-SPAC (vii) SC22 SC23

11 11 11 Proven success in operating “grow centric” vertically integrated businesses Vertical operations in Oregon, Nevada, Colorado, and Michigan Experience in limited license medical markets and recreational use markets Best practices / standard operating procedures will be applied across markets and utilized as medical only states adopt recre ati onal use and/or hybrid regulations Cash flow positive Will have liquidity needed to execute strategic objectives with additional financing to effect future acquisitions Comprehensive management team in place Greenrose brings “Corporate - level” operational, financial, legal and public company experience along with key managers of cultiv ation, product development and retail from the target companies Optimal time to pursue growth strategy in cannabis industry Market is enjoying strong growth but attractively priced assets remain due to capital constraints and companies with non - core as sets Key Investment Highlights

12 12 12 II. Combined Company Overview

13 13 13 Company Status Key Geography & Assets Summary Theraplant ▪ Entered into Theraplant Merger Agreement ▪ Connecticut ▪ 1 cultivation and 1 processing facility ▪ 1 of 4 cultivators in Connecticut ▪ Cultivation facility with 68,000 ft 2 of capacity, with an additional 30,000 ft 2 of capacity under construction that is expected to be completed in the second half of fiscal 2021 ▪ High barriers to entry ▪ Room to expand facility ▪ Looking to acquire a dispensary to begin vertically integrating True Harvest ▪ Entered into True Harvest Asset Purchase Agreement ▪ Arizona ▪ 1 cultivation and 1 processing facility ▪ Large 74,000 ft² wholesale cultivation facility currently under expansion to double capacity, run by Shango growers ▪ Expands Shango footprint into Arizona ▪ Anticipated expansion of demand in new REC market ▪ Room to expand facility Shango ▪ Entered into Shango Merger Agreement ▪ Oregon, California, Michigan, Nevada, Arizona ▪ 6 dispensaries and 1 additional Oregon license ▪ 4 cultivation and 3 processing facilities ▪ Vertically integrated in Oregon with one dispensary and two cultivation facilities with total cultivation capacity of 19,000 ft 2 ▪ 1 dispensary and distribution company in California ▪ Vertically integrated in Nevada with one dispensary, one 40,000 ft 2 cultivation facility, with room to expand to 75,000 ft 2 , and one processing facility ▪ Vertically integrated in Michigan with three dispensaries, one 35,000 ft 2 cultivation facility and two processing facilities ▪ High - end flower and concentrates that command premium prices The Health Center (THC) ▪ Entered into Futureworks Merger Agreement ▪ Colorado ▪ 3 dispensaries ▪ 3 cultivation and 1 processing facility ▪ Vertically integrated in Colorado with three dispensaries and three cultivation facilities totaling 58,500 ft 2 ▪ Focus on the Denver metro market place ▪ High - end products at affordable prices Overview of BC Companies / Assets SC28
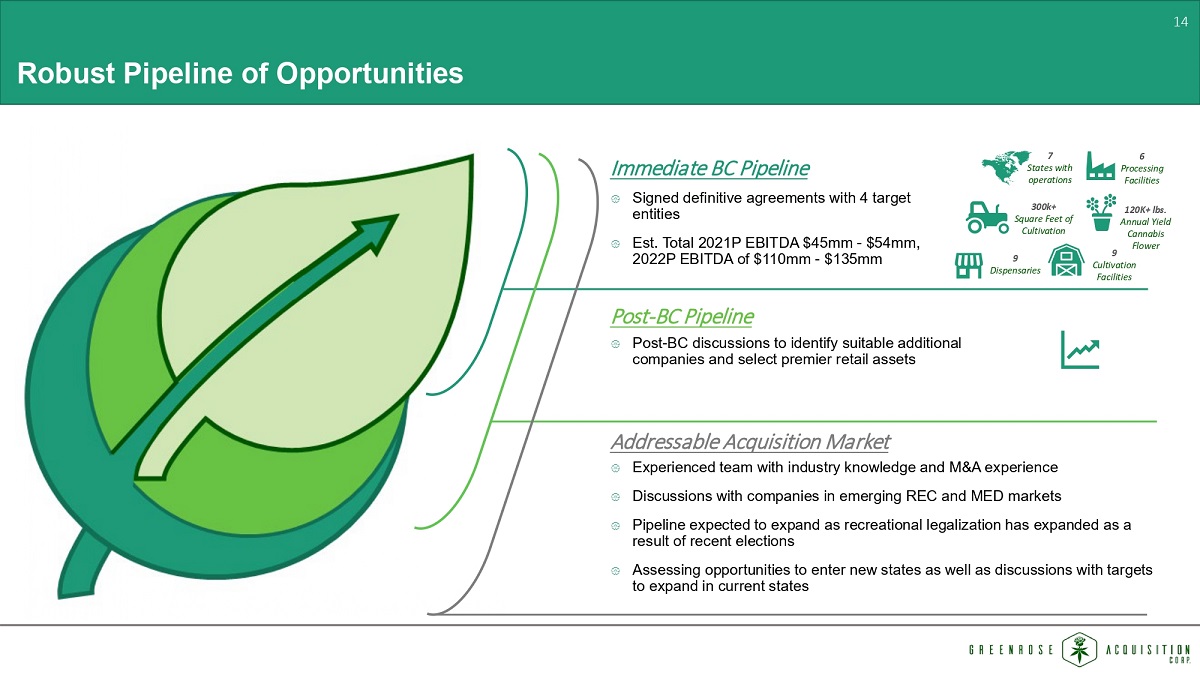
14 14 14 Robust Pipeline of Opportunities Signed definitive agreements with 4 target entities Est. Total 2021P EBITDA $45mm - $54mm, 2022P EBITDA of $110mm - $135mm 9 Dispensaries 7 States with operations 300k+ Square Feet of Cultivation 9 Cultivation Facilities 6 Processing Facilities 120K+ lbs. Annual Yield Cannabis Flower Immediate BC Pipeline Post - BC Pipeline Addressable Acquisition Market Post - BC discussions to identify suitable additional companies and select premier retail assets Experienced team with industry knowledge and M&A experience Discussions with companies in emerging REC and MED markets Pipeline expected to expand as recreational legalization has expanded as a result of recent elections Assessing opportunities to enter new states as well as discussions with targets to expand in current states
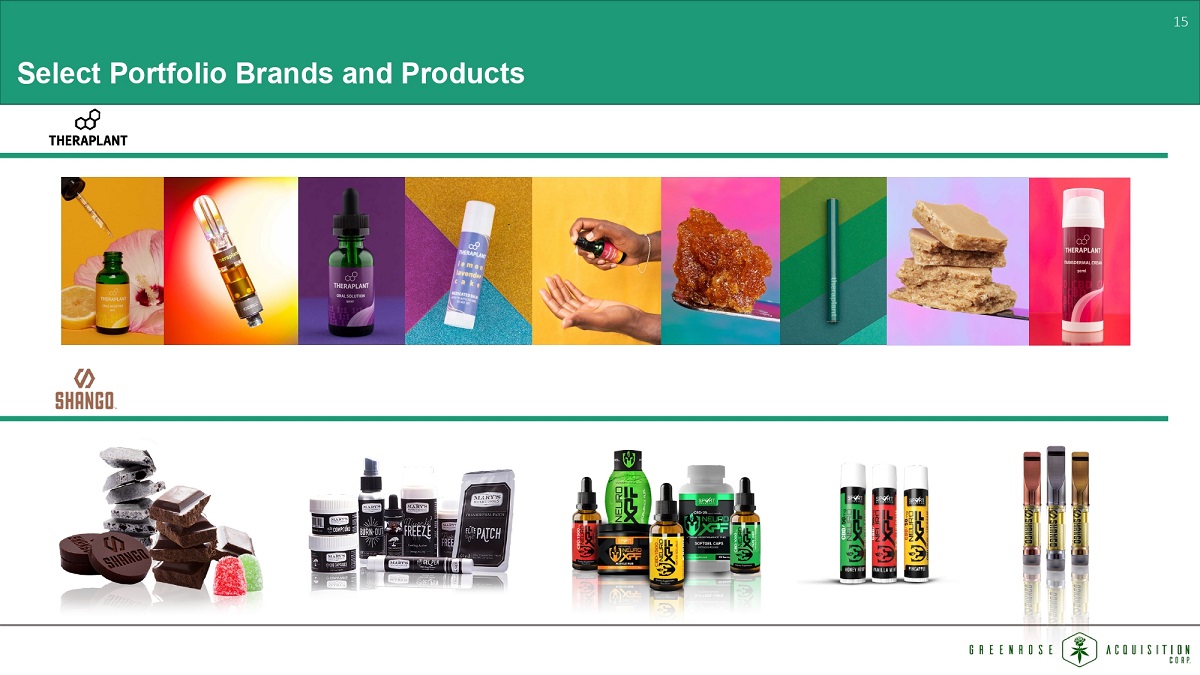
15 15 15 Select Portfolio Brands and Products

16 16 16 Select Portfolio Flower Product

17 17 17 Retail and Facilities

18 18 18 Geographic Footprint 9 Dispensaries across 7 states | 300k+ square feet in Cultivation | Extraction / Processing facilities in 5 states | Over 120k+ lbs. flower per year Sources: Marijuana and the Law as of June 16, 2021 Note: In late June, 2021 Connecticut legalized adult use cannabis; regulatory framework is being developed and implemented Target Company Operations Recreational and Medical Use Comprehensive Medical Cannabis Program CBD/Low THC Program No Recreational or Medical
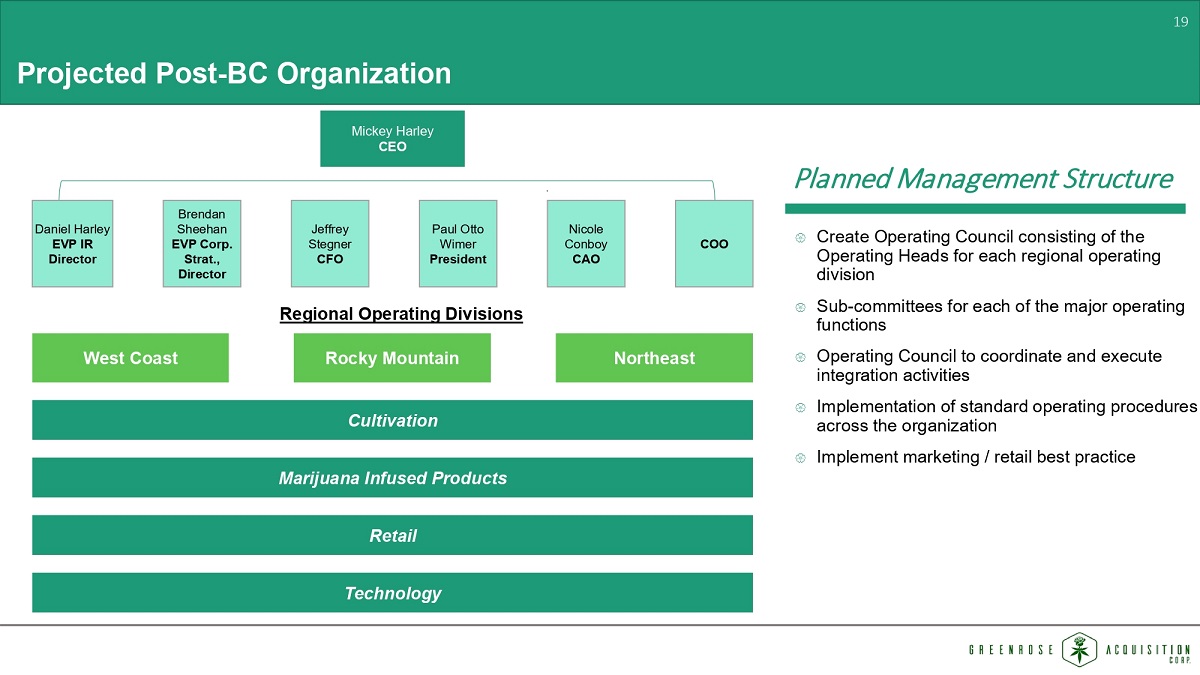
19 19 19 Mickey Harley CEO Paul Otto Wimer President Daniel Harley EVP IR Director Brendan Sheehan EVP Corp. Strat., Director Jeffrey Stegner CFO Nicole Conboy CAO Projected Post - BC Organization Create Operating Council consisting of the Operating Heads for each regional operating division Sub - committees for each of the major operating functions Operating Council to coordinate and execute integration activities Implementation of standard operating procedures across the organization Implement marketing / retail best practice Planned Management Structure Cultivation Marijuana Infused Products Retail Technology COO West Coast Rocky Mountain Northeast Regional Operating Divisions

20 20 20 III. Financial Overview and Valuation

21 21 21 Pro Forma Combined de - SPAC Operations (1) Pro Forma Combined de - SPAC Financial Summary for Theraplant and True Harvest ($000s) (1) Represents combined financials for Theraplant and True Harvest (2) Based upon audited amounts (3) Based upon target management’s projected amounts, with 2021P including actual results for the period ended March 31, 2021 (4) EBITDA and Adjusted EBITDA for the combined entity excludes Corporate Overhead expenses of $1.75mm in 2021P and $10mm in 2022 P. (5) Adjusted EBITDA numbers provided by target management. Adjusted for transaction related expenses and non - recurring expenses Greenrose 2020A (2) 2021P (3) 2022P (3) Revenue $ 36,411 $ 55,000 – $ 65,000 $ 140,000 – $ 160,000 EBITDA (4) $ 17,765 $ 32,000 – $ 38,000 $ 85,000 – $ 100,000 Adj. EBITDA (4),(5) $ 20,378 $ 32,000 – $ 38,000 $ 85,000 – $ 100,000

22 22 22 Greenrose 2020A (2) 2021P (3) 2022P (3) Revenue $ 82,928 $ 115,000 – $ 135,000 $ 260,000 – $ 295,000 EBITDA (4) $ 25,448 $ 45,000 – $ 54,000 $ 110,000 – $ 135,000 Adj. EBITDA (4),(5) $ 32,205 $ 45,000 – $ 54,000 $ 110,000 – $ 135,000 Pro Forma Combined Operations (1) Pro Forma Combined Financial Summary for all 4 Targets ($000s) (1) Represents combined financials for all four targets even though two of the four acquisitions are likely to close before the o the rs, as noted on slide 9 (2) Based upon audited amounts (3) Based upon target management’s projected amounts, with 2021P including actual results for the period ended March 31, 2021 (4) EBITDA and Adjusted EBITDA for the combined entity excludes Corporate Overhead expenses of $1.75mm in 2021P and $10mm in 2022 P (5) Adjusted EBITDA numbers provided by target management. Adjusted for transaction related expenses and non - recurring expenses

23 23 23 2020A (1) 2021P (2) 2022P (2) Revenue $28,375 $30,000 – $35,000 $95,000 – $110,000 EBITDA (3) $16,669 $17,000 – $21,000 $55,000 – $65,000 Adj. EBITDA (3),(4) $19,023 $17,000 – $21,000 $55,000 – $65,000 2020A (1) 2021P (2) 2022P (2) Revenue $8,036 $25,000 – $30,000 $45,000 – $50,000 EBITDA (3) $1,096 $15,000 – $17,000 $30,000 – $35,000 Adj. EBITDA (3),(4) $1,355 $15,000 – $17,000 $30,000 – $35,000 Theraplant True Harvest 2020A (1) 2021P (2) 2022P (2) Revenue $21,474 $20,000 – $25,000 $32,000 – $39,000 EBITDA (3) $5,266 $4,000 – $5,000 $6,000 – $11,000 Adj. EBITDA (3),(4) $5,531 $4,000 – $5,000 $6,000 – $11,000 2020A (1) 2021P (2) 2022P (2) Revenue $25,042 $40,000 – $45,000 $88,000 – $96,000 EBITDA (3) $2,417 $9,000 – $11,000 $19,000 – $24,000 Adj. EBITDA (3),(4) $6,296 $9,000 – $11,000 $19,000 – $24,000 THC Shango Financial Summary – BC Transactions ($000s) (1) Based upon audited amounts (2) Based upon target management’s projected amounts, with 2021P including actual results for the period ended March 31, 2021 (3) EBITDA and Adjusted EBITDA for the combined entity excludes $1.75mm of expenses in 2021P and $10mm in 2022P (4) Adjusted EBITDA numbers provided by management; Adjusted for transaction related expenses and non - recurring expenses

24 24 24 Revenue Bridge ($mm) Commentary: CO – Complete build - out of MIP facility & expansion of cultivation facilities NV – Reopening operations stalled by COVID - 19 and revival of tourism MI – 2 new stores come online, optimization of cultivation facilities CA – Same store sales increase and expansion of distribution footprint AZ – Full year of the initial 4 cultivation rooms & expansion with 4 additional cultivation rooms in a new REC market CT – Complete phase 2 of build - out of cultivation facility; the Phase 2 Buildout and Expanded Medical/Recreational legalization is anticipated to impact the second half of 2021 2021 Revenue Bridge (1) (2) (1) Represents combined financials for all four targets even though two of the four acquisitions are likely to close before the o the rs, as noted on slide 9 (2) Represents the midpoint of the Greenrose Combined Revenue range

25 25 25 Comparable Company Summary ($mm) Source: Capital IQ as of July 26, 2021 Comparable Company Analysis Price Market Enterprise Revenue EBITDA Enterprise Value / Company Name 7/26/2021 Cap Value 2020 2021 2022 2020 2021 2022 2020 Revenue 2021 Revenue 2022 Revenue 2020 EBITDA 2021 EBITDA 2022 EBITDA Curaleaf Holdings, Inc. 12.38$ 8,709.5$ 9,022.1$ 634.6$ 1,296.3$ 1,901.2$ 141.6$ 373.8$ 640.5$ 14.2x 7.0x 4.7x 63.7x 24.1x 14.1x Green Thumb Industries Inc. 30.51 6,863.3 6,846.1 547.8 874.1 1,156.7 173.3 320.7 443.4 12.5x 7.8x 5.9x 39.5x 21.3x 15.4x Trulieve Cannabis Corp. 32.22 4,133.4 4,266.0 515.5 871.2 1,146.9 252.7 391.1 507.4 8.3x 4.9x 3.7x 16.9x 10.9x 8.4x Cresco Labs Inc. 10.52 3,556.7 3,778.3 475.3 842.8 1,226.8 110.0 213.8 395.2 7.9x 4.5x 3.1x 34.3x 17.7x 9.6x Columbia Care Inc. 4.65 1,695.9 1,800.8 182.8 515.1 789.4 (5.9) 101.7 225.5 9.9x 3.5x 2.3x n/a 17.7x 8.0x Harvest Health & Recreation Inc. 3.57 1,520.7 1,791.0 228.0 403.4 529.4 18.9 103.2 168.9 7.9x 4.4x 3.4x 94.7x 17.4x 10.6x Ayr Wellness Inc. 28.87 1,706.3 1,773.4 155.6 385.5 719.0 56.6 127.7 296.7 11.4x 4.6x 2.5x 31.3x 13.9x 6.0x TerrAscend Corp. 8.48 1,564.7 1,549.7 155.1 293.3 433.1 45.1 126.2 199.5 10.0x 5.3x 3.6x 34.3x 12.3x 7.8x Planet 13 Holdings Inc. 5.85 1,148.4 1,030.2 73.1 139.2 206.3 14.0 39.3 70.5 14.1x 7.4x 5.0x 73.8x 26.2x 14.6x Jushi Holdings Inc. 4.83 758.4 694.3 80.8 225.6 408.3 (2.2) 38.2 127.7 8.6x 3.1x 1.7x n/a 18.2x 5.4x Average 10.5x 5.2x 3.6x 48.6x 18.0x 10.0x Median 9.9x 4.7x 3.5x 36.9x 17.7x 9.0x

26 26 26 Comparable Revenue Multiples 2021 Revenue Mean: 5.2x 2022 Revenue 4.5x Greenrose Acquisition Corp. Source: Capital IQ. 1.8x Greenrose Acquisition Corp. (1), (2), (3) 1.7x Greenrose Acquisition Corp. (1), (2), (3) 3.8x Greenrose Acquisition Corp. Mean: 3.6x de - SPAC Post de - SPAC de - SPAC Post de - SPAC (4) Represents combined financials for all four targets even though two of the four acquisitions are likely to close before t he others, as noted on slide 9, as well as the full earn - out amount assuming the company hits the earnings targets, (5) Corresponds to a pro forma enterprise value of $477.7 million, which is equal to: ( i ) pro forma equity value of $401 million, consisting of 40.1 million shares at $10 per share (17.3 million shares held by the pu blic, 4.3 million shares held by the Greenrose sponsor, 9 million shares issued to selling shareholders at close, 8.5 million shares for all earn - outs associated with 2021 targets, and 1.0 million shares held by PIPE investors); plus (ii) pro forma debt of $139.7 million composed of $75 million senior secured notes and $64.7 million of s eller notes; plus (iii) $40 million of convertible notes; plus (iv) $11.2 million of assumed debt; less (v) pro forma cash of $114.2 million, ( 6) 2021 and 2022 utilize a midpoint of the range of PF Revenue of $115 million - $135 million and $260 million - $290 million, resp ectively (1) Represents combined financials for True Harvest and Theraplant , (2) Corresponds to a pro forma enterprise value of $269 million, which is equal to: ( i ) pro forma equity value of $276 million, consisting of 27.6 million shares at $10 per share (17.3 million shares held by the public, 4.3 million shares held by the Greenrose sponsor, 5 million shares issued to selling shareholders at close, and 1.0 million shares held by PIPE investors); plus (ii) pr o forma debt of $104.7 million of debt composed of $29.7 million seller notes and $75 million senior secured notes; plus (iii) $40 million of convertible notes; plus (iv) $11.2 million of assumed debt; less (v) pro form a c ash of $162.7 million, (3) 2021 and 2022 utilize a midpoint of the range of PF Revenue of $55 million - $65 million and $140 mil lion - $160 million, respectively (4), (5), (6) (4), (5), (6) 7.8x 7.4x 7.0x 5.3x 4.9x 4.6x 4.5x 4.4x 3.5x 3.1x Green Thumb Industries Inc. Planet 13 Holdings Inc. Curaleaf Holdings, Inc. TerrAscend Corp. Trulieve Cannabis Corp. Ayr Wellness Inc. Cresco Labs Inc. Harvest Health & Recreation Inc. Columbia Care Inc. Jushi Holdings Inc. 5.9x 5.0x 4.7x 3.7x 3.6x 3.4x 3.1x 2.5x 2.3x 1.7x Green Thumb Industries Inc. Planet 13 Holdings Inc. Curaleaf Holdings, Inc. Trulieve Cannabis Corp. TerrAscend Corp. Harvest Health & Recreation Inc. Cresco Labs Inc. Ayr Wellness Inc. Columbia Care Inc. Jushi Holdings Inc.

27 27 27 Comparable EBITDA Multiples 2021 EBITDA 2022 EBITDA Mean: 18.0x Source: Capital IQ. 7.9x Greenrose Acquisition Corp. 2.9x Greenrose Acquisition Corp. 9.7x Greenrose Acquisition Corp. 3.9x Greenrose Acquisition Corp. Mean: 10.0x de - SPAC Post de - SPAC de - SPAC Post de - SPAC (1), (2), (3) (1), (2), (3) (4), (5), (6) (4), (5), (6) (4) Represents combined financials for all four targets even though two of the four acquisitions are likely to close before t he others, as noted on slide 9, as well as the full earn - out amount assuming the company hits the earnings targets, (5) Corresponds to a pro forma enterprise value of $477.7 million, which is equal to: ( i ) pro forma equity value of $401 million, consisting of 40.1 million shares at $10 per share (17.3 million shares held by the pu blic, 4.3 million shares held by the Greenrose sponsor, 9 million shares issued to selling shareholders at close, 8.5 million shares for all earn - outs associated with 2021 targets, and 1.0 million shares held by PIPE investors); plus (ii) pro forma debt of $139.7 million composed of $75 million senior secured notes and $64.7 million of s eller notes; plus (iii) $40 million of convertible notes; plus (iv) $11.2 million of assumed debt; less (v) pro forma cash of $114.2 million, ( 6) 2021 and 2022 utilize a midpoint of the range of PF EBITDA of $45 million - $54 million and $110 million - $135 million, respect ively (1) Represents combined financials for True Harvest and Theraplant , (2) Corresponds to a pro forma enterprise value of $269 million, which is equal to: ( i ) pro forma equity value of $276 million, consisting of 27.6 million shares at $10 per share (17.3 million shares held by the public, 4.3 million shares held by the Greenrose sponsor, 5 million shares issued to selling shareholders at close, and 1.0 million shares held by PIPE investors); plus (ii) pr o forma debt of $104.7 million of debt composed of $29.7 million seller notes and $75 million senior secured notes; plus (iii) $40 million of convertible notes; plus (iv) $11.2 million of assumed debt; less (v) pro forma cash of $162.7 million, (3) 2021 and 2022 utilize a midpoint of the range of PF EBITDA of $32 million - $38 million and $ 85 million - $100 million, respectively 26.2x 24.1x 21.3x 18.2x 17.7x 17.7x 17.4x 13.9x 12.3x 10.9x Planet 13 Holdings Inc. Curaleaf Holdings, Inc. Green Thumb Industries Inc. Jushi Holdings Inc. Columbia Care Inc. Cresco Labs Inc. Harvest Health & Recreation Inc. Ayr Wellness Inc. TerrAscend Corp. Trulieve Cannabis Corp. 15.4x 14.6x 14.1x 10.6x 9.6x 8.4x 8.0x 7.8x 6.0x 5.4x Green Thumb Industries Inc. Planet 13 Holdings Inc. Curaleaf Holdings, Inc. Harvest Health & Recreation Inc. Cresco Labs Inc. Trulieve Cannabis Corp. Columbia Care Inc. TerrAscend Corp. Ayr Wellness Inc. Jushi Holdings Inc.

28 28 28 IV. Appendix

29 29 29 A. Market Overview
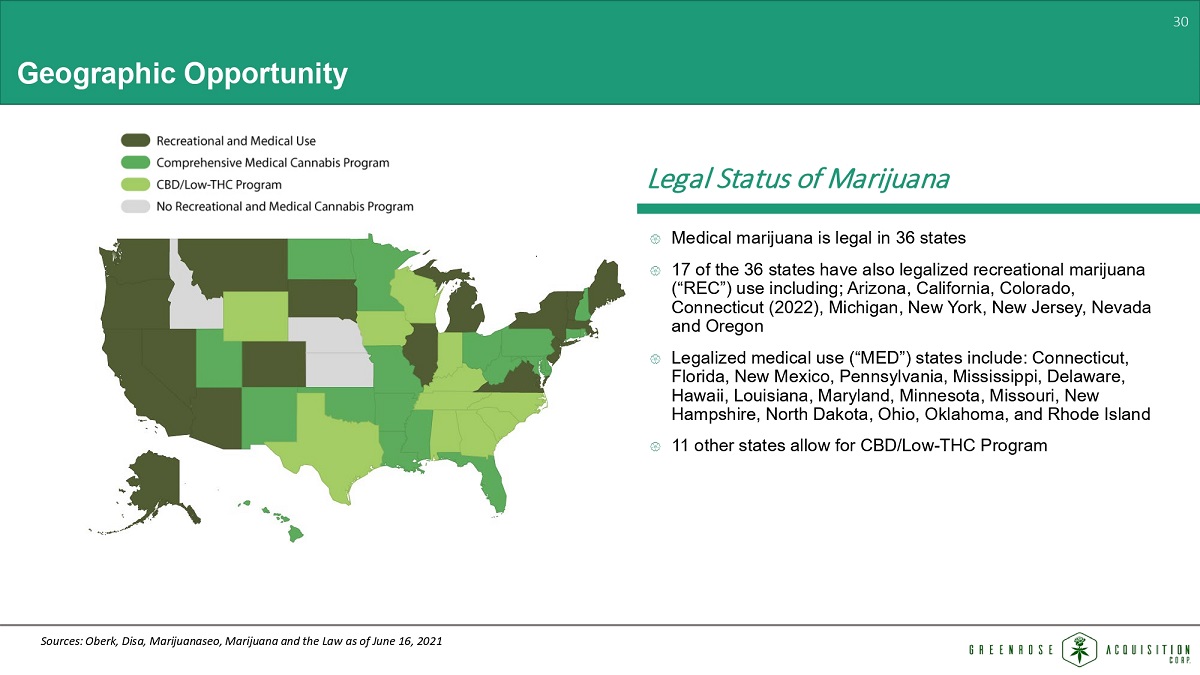
30 30 30 Medical marijuana is legal in 36 states 17 of the 36 states have also legalized recreational marijuana (“REC”) use including; Arizona, California, Colorado, Connecticut (2022), Michigan, New York, New Jersey, Nevada and Oregon Legalized medical use (“MED”) states include: Connecticut, Florida, New Mexico, Pennsylvania, Mississippi, Delaware, Hawaii, Louisiana, Maryland, Minnesota, Missouri, New Hampshire, North Dakota, Ohio, Oklahoma, and Rhode Island 11 other states allow for CBD/Low - THC Program Legal Status of Marijuana Geographic Opportunity Sources: Oberk , Disa , Marijuanaseo , Marijuana and the Law as of June 16, 2021

31 31 31 Adult Use markets are projected to grow 31.5% from 2021 to 2022 Medical markets are projected to grow 17.9% from 2021 to 2022 General Market Growth Market Statistics Source: MJBizDaily Projected Cannabis Market Growth in the U.S. ($bn) 2 2.4 2.7 3.7 3.5 4.9 7.6 9.5 11.2 12.3 13.2 0.4 1 1.8 2.8 5.2 8.1 14 18.1 23.8 27.7 30.2 $- $5 $10 $15 $20 $25 $30 $35 $40 $45 $50 2014 2015 2016 2017 2018 2019 2020 2021 2022 2023 2024 Medical Adult Use $2 - $2.4 Total $3 - $3.4 Total $4 - $4.5 Total $5.8 - $6.5 Total $7.8 - $8.7 Total $10.6 - $13 Total $18 - $21.6 Total $23.1 - $27.6 Total $29.2 - $35 Total $33.5 - $40 Total $36.2 - $43.4 Total

32 32 32 Arizona : $770 - 910 million California : $3.8 billion Colorado : $1.82 billion Connecticut : $130 - 160 million Michigan : $1 billion Nevada : $600 - 675 million Oregon : $1.11 billion Sources: Cannabis Business Plan, Marijuana Business Daily, Marijuana Business Factbook, Portland Business Journal, Colorado D epa rtment of Revenue, Arcview Market Research and BDS Analytics, Headset Data, Oregon Liquor Control Commission Market Leading States Applicable Market Size (Estimated 2020) CA 31.7% CO 15.0% WA 9.2% FL 8.3% MI 8.3% NV 5.0% OR 9.3% AZ 5.9% MA 4.0% PA 2.5% Other 0.9% Market Share by State, Medical and Recreational (2019) Greenrose will have operations in states that capture about 2/3 of the addressable national market

33 33 33 B. Target Company Detail

34 34 34 Key Highlights: ( i ) Proven cultivators/processors, (ii) Growth coming from “chronic pain” being added as an acceptable condition for MED mariju ana patients, (iii) Opportunity to vertically integrate through dispensary acquisitions, (iv) Growth from the introduction of REC in coming years Deal terms: $100 million cash and $50 million stock at close, no earn - out Summary of Theraplant Market Highlights and Footprint State Market Highlights Footprint Connecticut Limited license medical market and upcoming limited license adult - use market in 2H 2022 Currently 4 cultivators, and 4 additional cultivation licenses will be granted 18 dispensaries, maximum number of additional dispensaries licenses to be determined Current cultivators will have the opportunity to convert to recreational licenses and become minority partners in 2 dispensaries Estimated $165 - $200 million medical sales 2021 Estimated $250 million adult - use sales in year 1, projected to reach $725 million in year 4 50% of each license type are reserved for social equity applicants Lottery for social equity applications first, and after, the lottery for the remaining 50% will commence 38 qualifying conditions for medical licenses; chronic pain added to list in June 2020 Biggest cultivation + processing facility in state 1 of 4 cultivators Targeting dispensary acquisition to begin vertically integrating Sources: Cannabis Business Plan, Marijuana Business Daily, Marijuana Business Factbook, Portland Business Journal, Arcview Market Research and BDS Analytics, Headset Data SC29 SC30 SC31
35 35 35 Key Highlights: Adds large - scale cultivation and expands Greenrose footprint into Arizona Deal terms: $52.9 million paid at close, consisting of $21.8 million in cash and $31.1 million in debt; YE 2024 earn - out of $38. 7 million in notes (3 year, interest only, 6%) including incorporating $3.7 million in additional consideration Summary of True Harvest Market Highlights and Footprint State Market Highlights Footprint Arizona Estimated $1 - $1.2 billion in medical sales by end of year 2021 Proposition 207 to legalize REC passed in November 2020, and adult - use sales commenced in late January 2021 Estimated $250 - $300 million in sales for 2021 Estimated $550 - $700 million in sales for first complete year (2022) Estimated $1.1 - $1.3 billion in sales in 2024 Large - scale cultivation 15 - 20k pounds flower per year Expands Shango footprint to Arizona Sources: Cannabis Business Plan, Marijuana Business Daily, Marijuana Business Factbook, Arcview Market Research and BDS Analytics, Headset Data SC32

36 36 36 Summary of Shango Market Highlights and Footprint State Market Highlights Footprint Oregon REC market with estimated $1.1 - $1.4 billion 2021 sales Highly fragmented market, no limit on medical or REC licenses 1,256 adult - use cultivator licenses and 749 dispensaries 1 operational dispensary 2 cultivation facilities Second retail license Michigan REC Launched 2019 with estimated $1 billion 2020 sales $950 million - $1.2 billion in 2021 216 REC Dispensaries About 412 MED&REC grower licenses Vertically integrated license 1 cultivation facility, 2 processing facilities, and 3 dispensaries Nevada REC Market with estimated $800 million - $1.1 billion 2021 sales 80 dispensaries 160 production licenses 152 adult - use cultivator licenses, no limit on medical or REC licenses Vertically integrated dispensary with cultivation and processing facility Off - strip location serves Vegas locals ▪ More frequent/consistent buyers than tourists California REC Market with estimated total REC Cannabis sales of $4.7 - $5.5 billion 2021 sales and $5.3 - $6.2 billion in 2022 Highly fragmented market No recognizable retail chains, thousands of brands Significant black market competes with legal market 1 retail location + distribution business Distribution business one of the safest and most profitable positions in CA Market ▪ Distribution businesses package (white label) and distribute for the thousands of growers and brands ▪ Brands / growers will pay top - dollar for retail space Key Highlights: ( i ) Proven cultivators/processors – distressed asset opportunities, (ii) Grow - centric focus in each state (except California), (ii i) Growth through consolidation in Oregon, Nevada, and Arizona, (iv) Growth in California through vertical integration, (v) “early - bird” position in Michigan Deal terms: At close: $31 million paid at close, consisting of $31 million cash; YE 2021 earn - out of $20 million in stock; YE 2 022 earn - out of $25 million in stock; YE 2023 earn - out of $20 million in stock Sources: Cannabis Business Plan, Marijuana Business Daily, Marijuana Business Factbook, Portland Business Journal, Arcview Market Research and BDS Analytics, Headset Data SC34

37 37 37 Summary of THC Market Highlights and Footprint State Market Highlights Footprint Colorado Estimated $370 - $410 million in medical sales in 2021 Estimated $1.8 - $2.1 billion in REC sales in 2021, and $2.0 - $2.4 billion in REC in 2022 Highly fragmented 609 dispensaries 719 cultivation facilities Largest chain has about 26 dispensaries 3 dispensaries 3 cultivation + 1 processing facility Flower quality among best in state at all price points Key Highlights: ( i ) Growth through vertical integration, consolidation, and distressed asset purchases, (ii) Proven growers fit grow - centric focus , (iii) New processing facility provides enhanced capabilities Deal terms: $32.5 million paid at close, consisting of $17.5 million in cash and $15 million in stock; YE 2021 earn - out of $10 m illion in stock. Sources: Cannabis Business Plan, Marijuana Business Daily, Marijuana Business Factbook, Portland Business Journal, Arcview Market Research and BDS Analytics, Headset Data https://www.flowerfieldz.com/cannabis/cannabis - companies/marijuana - dispensaries/colorado/colorados - largest - dispensary - chain s - april - 2020 - edition/ SC33
Serious News for Serious Traders! Try StreetInsider.com Premium Free!
You May Also Be Interested In
- IBM tumbles on soft Q1 revenue; announces HashiCorp $6.4bn acquisition
- Meta earnings, IBM to acquire HashiCorp, U.S. GDP ahead - what's moving markets
- XOMA (XOMA) Earns $9M Milestone as FDA Grants Accelerated Approval to Day One’s OJEMDATM
Create E-mail Alert Related Categories
SEC FilingsRelated Entities
Definitive AgreementSign up for StreetInsider Free!
Receive full access to all new and archived articles, unlimited portfolio tracking, e-mail alerts, custom newswires and RSS feeds - and more!
