

Form 8-K Global Net Lease, Inc. For: May 11
 Tweet
Tweet Share
Share
Exhibit 99.1

Global Net Lease Common Stock Offering Investor Presentation

DISCLAIMER 2 References in this presentation to the "Company," "we," "us" and "our" refer to Global Net Lease, Inc . ("GNL") and its consolidated subsidiaries . This presentation makes no representations or warranties and no person has been authorized to make any representations on behalf of the Company or any of its affiliates or to give any information other than that contained in this presentation . Nothing contained in this presentation is, or shall be relied upon as, a promise or representation, whether as to the past, present or the future . Certain of the economic and market information contained herein has been obtained from published sources and/or prepared by other parties . None of the Company or any of its directors, partners, stockholders, officers, affiliates, employees, agents or advisers nor any other person assumes any responsibility for the accuracy, reliability or completeness of any information in this presentation, and the Company expressly disclaims any obligation or undertaking to release publicly any updates or revisions to any forward - looking statements to reflect any change in expectations or events, conditions or circumstances on which statements are based . This presentation includes certain non - GAAP financial measures, including EBITDA, Adjusted EBITDA, FFO, Core FFO, AFFO, NOI and Cash NOI . EBITDA, Adjusted EBITDA, FFO, Core FFO, AFFO, NOI and Cash NOI are non - GAAP measures of our financial performance and should not be considered as alternatives to net income as a measure of financial performance, or any other performance measure derived in accordance with GAAP and they should not be construed as an inference that our future results will be unaffected by unusual or non - recurring items . Additionally, EBITDA, Adjusted EBITDA, FFO, Core FFO, AFFO, NOI and Cash NOI are not intended to be measures of liquidity or free cash flow for management's discretionary use . In addition, these non - GAAP measures exclude certain non - recurring and other charges . Each of these non - GAAP measures has its limitations as an analytical tool, and you should not consider them in isolation or as a substitute for analysis of our results as reported under GAAP . In evaluating EBITDA, Adjusted EBITDA, FFO, Core FFO, AFFO, NOI and Cash NOI, you should be aware that in the future we will incur expenses that are the same as or similar to some of the items eliminated in the adjustments made to determine EBITDA, Adjusted EBITDA, FFO, Core FFO, AFFO, NOI and Cash NOI, such as pre - opening expenses, stock compensation expense, loss (gain) on asset disposal, executive recruiting/relocation, and other adjustments . Our presentation of EBITDA, Adjusted EBITDA, FFO, Core FFO, AFFO, NOI and Cash NOI should not be construed to imply that our future results will be unaffected by any such adjustments . Definitions and calculations of EBITDA, Adjusted EBITDA, FFO, Core FFO, AFFO, NOI and Cash NOI differ among companies in the retail industry, and therefore EBITDA, Adjusted EBITDA, FFO, Core FFO, AFFO, NOI and Cash NOI disclosed by us may not be comparable to the metrics disclosed by other companies . The reconciliations of net income to EBITDA, Adjusted EBITDA, FFO, Core FFO, AFFO, NOI and Cash NOI for the applicable period, as well as a description of how we use calculate these measures, noted below are set forth in the appendix to this presentation . The statements in this presentation that are not historical facts may be forward - looking statements . These forward - looking statements involve risks and uncertainties that could cause actual results or events to be materially different . In addition, words such as “may,” “will,” “seeks,” “anticipates,” “believes,” “estimates,” “expects,” “plans,” “intends,” “would,” or the negatives of these words or variations of them or similar expressions indicate a forward - looking statement, although not all forward - looking statements contain these identifying words . Any statements referring to the future value of an investment in GNL, as well as the success that GNL may have in executing its business plan, are also forward - looking statements . There are a number of risks, uncertainties and other important factors that could cause GNL’s actual results to differ materially from those contemplated by such forward - looking statements, including those risks, uncertainties and other important factors set forth in the “Risk Factors” and “Management’s Discussion and Analysis of Financial Condition and Results of Operations” sections of GNL’s Annual Report on Form 10 - K for the year ended December 31 , 2020 filed with the SEC on February 26 , 2021 and all other filings with the SEC after that date, as such risks, uncertainties and other important factors may be updated from time to time in GNL’s subsequent reports . Some of these risks and uncertainties are also summarized in the appendix to this presentation . Further, forward looking statements speak only as of the date they are made, and GNL undertakes no obligation to update or revise forward - looking statements to reflect changed assumptions, the occurrence of unanticipated events or changes to future operating results over time, except as required by law . This presentation contains certain statements that are the Company’s and management’s hopes, intentions, beliefs, expectations, or projections of the future and might be considered to be forward - looking statements under Federal Securities laws . Prospective investors are cautioned that any such forward - looking statements are not guarantees of future performance, and involve risks and uncertainties . The company’s actual future results may differ significantly from the matters discussed in these forward - looking statements, and we may not release revisions to these forward - looking statements to reflect changes after we’ve made the statements . Any investment in the Company will be subject to certain risks related to the nature of the Company's business and the structure and operations of the Company . Any investment in the Company should be made only with an appreciation of the applicable risks, which will be described in the Company's filings with the SEC . This presentation includes estimated projections of future operating results These projections were not prepared in accordance with published guidelines of the SEC or the guidelines established by the American Institute of Certified Public Accountants for preparation and presentation of financial projections . This information is not fact and should not be relied upon as being necessarily indicative of future results the projections were prepared in good faith by management and are based on numerous assumptions that may prove to be wrong . The projections also reflect assumptions as to certain business decisions that are subject to change . As a result, actual results may differ materially from those contained in the estimates Accordingly, there can be no assurance that the estimates will be realized . This presentation contains estimates and information concerning the Company’s industry and the Company’s peer companies that are based on industry publications, reports and peer company public filings . The Company has not independently verified the accuracy of the data contained in these industry publications, reports and peer company public filings . These estimates and information involve a number of assumptions and limitations, and you are cautioned not to rely on or give undue weight to this information . All of the concessions granted to the Company's tenants as a result of the COVID - 19 pandemic are rent deferrals with the original lease term unchanged and collection of deferred rent deemed probable . The Company's revenue recognition policy requires that it must be probable that the Company will collect virtually all of the lease payments due and does not provide for partial reserves, or the ability to assume partial recovery . In light of the COVID - 19 pandemic, the FASB and SEC agreed that for leases where the total lease cash flows will remain substantially the same or less than those after the COVID - 19 related effects, companies may choose to forgo the evaluation of the enforceable rights and obligations of the original lease contract as a practical expedient and account for rent concessions as if they were part of the enforceable rights and obligations of the parties under the existing lease contract . As a result, rental revenue used to calculate Net Income and NAREIT FFO has not, and the Company does not expect it to be, significantly impacted by deferrals its has entered into . In addition, since the Company currently believes that these deferral amounts are collectable, it has excluded from the increase in straight line rent for AFFO purposes the amounts recognized under GAAP relating to rent deferrals .

COMPANY HIGHLIGHTS High - Quality, Mission Critical, Net Lease Focused Portfolio : High portfolio occupancy of 99.7% coupled with complete first quarter original Cash Rent collection of 100% (1) , highlighting strong overall operating performance 1 Strong Balance Sheet: Includes $500 million of senior unsecured notes, rated investment grade by S&P and BB+ from Fitch, plus $1.8 billion of secured debt with a weighted average interest rate of 3.3% 5 Fully Aligned and Experienced Management Team: Fully integrated external management team creates highly scalable platform with an acquisition pipeline generated by a proven, country - focused origination network 6 Robust Acquisition Pipeline to Drive Long Term Value: Total second quarter closed and pipeline (3) acquisitions of $257 million with a weighted average Cap Rate of 10.5% and a weighted average Remaining Lease Term of 19.4 years 4 Differentiated Strategy with International Diversification: Portfolio of 237 properties in the U.S. and Canada complimented by 69 properties in Europe that are diversified across 130 tenants in 48 industries 2 3 Long - Term, Embedded Rental Growth From Primarily Investment Grade (2) Rated Tenants: 66% of portfolio annualized straight - line rent is derived from Investment Grade rated tenants 3 1. Refer to page 5 for further details. 2. As used herein, Investment Grade includes both actual investment grade ratings of the tenant or guarantor, if available, or i mpl ied investment grade. Implied investment grade may include actual ratings of tenant parent, guarantor parent (regardless of w het her or not the parent has guaranteed the tenant’s obligation under the lease) or by using a proprietary Moody’s analytical tool, whi ch generates an implied rating by measuring a company’s probability of default. The term “parent” for these purposes includes an y e ntity, including any governmental entity, owning more than 50% of the voting stock in a tenant. Ratings information is as of March 3 1, 2021. For the first quarter 2021, GNL’s portfolio was 36% actual investment grade rated and 30% implied investment grade rate d. 3. Refer to page 13 for further details.

4 PORTFOLIO HIGHLIGHTS Portfolio Overview Q1’21 Q1’20 Properties 306 288 Square Feet (millions) 37.2 34.2 Tenants 130 126 Industries 48 46 Countries 10 9 Leased 99.7% 99.6% Weighted - Average Remaining Lease Term (1) 8.3 years 9.0 years % of SLR derived from Investment Grade Tenants (2)(3) 66.3% 66.7% % of leases with contractual rent increases (4) 93.9% 93.7% Metrics for Q1’21 as of March 31 , 2021 and as of March 31, 2020 for Q1’20. 1. Weighted - average remaining lease term in years is based on square feet as of March 31, 2021 for Q1’21 and as of March 31, 2020 for Q1’20. 2. Refer to Investment Grade Rating definition included in the footnotes on page 3. For Q1’21, comprised of 36 % leased to tenants with an actual investment grade rating and 30 % leased to tenants with an implied investment grade rating as of March 31, 2021. For Q1’20, comprised of 36% leased to tenants with an actual investment grade rating and 31% leased to tenants with an implied investment grade rating as of March 31, 2020. 3. For Q1’21, calculated as of March 31, 2021 using annualized straight - line rent (“SLR”) converted from local currency into USD as of March 31, 2021 and for Q1’20 , calculated as of March 31, 2020 using annualized straight - line rent (“SLR”) converted from local currency into USD as of March 31, 2020 for the in - place lease on the property on a straight - line basis, which includes tenant concessions such as free rent, as applica ble. 4. Contractual rent increases include fixed percent or actual increases, or country CPI - indexed increases. For Q1’21, percentage of leases with rent increases is based on square feet as of March 31 , 2021 and March 31, 2020 for Q1’20.

5 STRONG CASH RENT COLLECTION Mission critical industrial and distribution assets and high Investment Grade rated tenancy (1) continued to support GNL’s strong first quarter collection rate of 100% of Original Cash Rent (2) First Quarter 2021 Rent Collection (Total Portfolio) First Quarter 2021 Rent Collection (United Kingdom) First Quarter 2021 Rent Collection (United States) First Quarter 2021 Rent Collection (Europe) Note: First quarter Cash Rent collection as of April 30, 2021. Excludes Cash Rent collected after April 30, 2021 that would apply to first quarter Original Cash Rent. This inf ormation may not be indicative of any future period. The impact of the COVID - 19 pandemic on our future results of operations and liquidity will depend on the overall length and severity of the pandemic, which management is unabl e t o predict. 1. Refer to Investment Grade Rating definition included in the footnotes on page 3. Comprised of 36% leased to tenants with an a ctu al investment grade rating and 30% leased to tenants with an implied investment grade rating as of March 31, 2021. 2. “Original Cash Rent” refers to contractual rents on a cash basis due from tenants as stipulated in their originally executed lea se agreement at inception or as amended, prior to any rent deferral agreement. We calculate “Original Cash Rent collections” by comparing the total amount of rent collected during the period to the Original Cash Rent due. Total rent collected during the period includes bot h O riginal Cash Rent due and payments made by tenants pursuant to rent deferral agreements. Eliminating the impact of deferred r ent paid, we collected 99% of Original Cash Rent due on a total portfolio basis, 99% of Original Cash Rent due with respect to the United Sta tes portfolio, and 100% of Original Cash Rent due with respect to the United Kingdom and European portfolios in the first qua rte r of 2021. 100% Collected 100% Collected 100% Collected 100% Collected
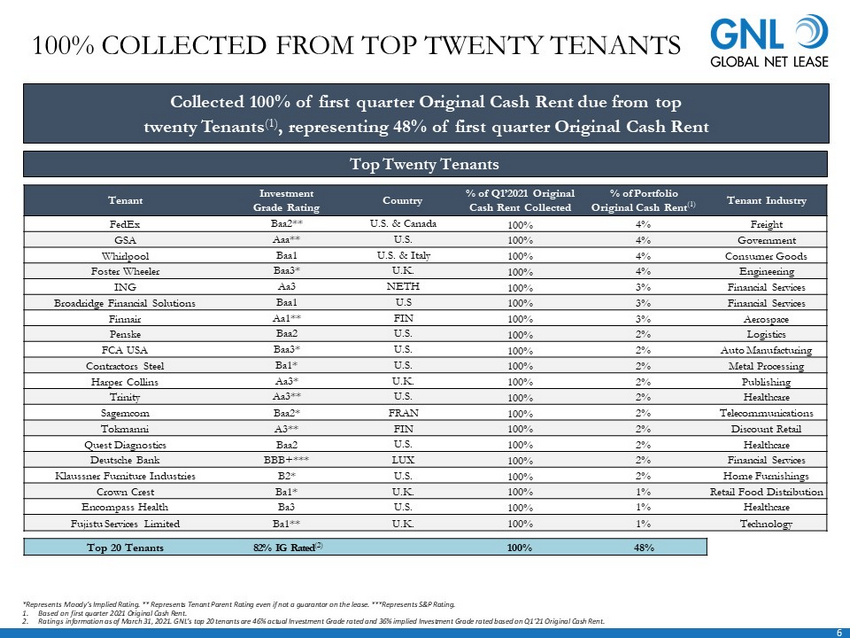
6 100% COLLECTED FROM TOP TWENTY TENANTS Collected 100% of first quarter Original Cash Rent due from top twenty Tenants (1) , representing 48% of first quarter Original Cash Rent Top Twenty Tenants Tenant Investment Grade Rating Country % of Q1’2021 Original Cash Rent Collected % of Portfolio Original Cash Rent (1) Tenant Industry FedEx Baa2** U.S. & Canada 100% 4% Freight GSA Aaa** U.S. 100% 4% Government Whirlpool Baa1 U.S. & Italy 100% 4% Consumer Goods Foster Wheeler Baa3* U.K. 100% 4% Engineering ING Aa3 NETH 100% 3% Financial Services Broadridge Financial Solutions Baa1 U.S 100% 3% Financial Services Finnair Aa1** FIN 100% 3% Aerospace Penske Baa2 U.S. 100% 2% Logistics FCA USA Baa3* U.S. 100% 2% Auto Manufacturing Contractors Steel Ba1* U.S. 100% 2% Metal Processing Harper Collins Aa3* U.K. 100% 2% Publishing Trinity Aa3** U.S. 100% 2% Healthcare Sagemcom Baa2* FRAN 100% 2% Telecommunications Tokmanni A3** FIN 100% 2% Discount Retail Quest Diagnostics Baa2 U.S. 100% 2% Healthcare Deutsche Bank BBB+*** LUX 100% 2% Financial Services Klaussner Furniture Industries B2* U.S. 100% 2% Home Furnishings Crown Crest Ba1* U.K. 100% 1% Retail Food Distribution Encompass Health Ba3 U.S. 100% 1% Healthcare Fujistu Services Limited Ba1** U.K. 100% 1% Technology Top 20 Tenants 82% IG Rated (2) 100% 48% *Represents Moody’s Implied Rating. ** Represents Tenant Parent Rating even if not a guarantor on the lease . ***Represents S&P Rating. 1. Based on first quarter 2021 Original Cash Rent. 2. Ratings information as of March 31, 2021. GNL’s top 20 tenants are 46% actual Investment Grade rated and 36% implied Investme nt Grade rated based on Q1’21 Original Cash Rent.

7 Investment Grade 66% Non - Investment Grade 34% Metal Processing 4% WELL BALANCED PORTFOLIO SUPPORTS CONTINUED GROWTH As of March 31, 2021. 1. Metric based on SLR . Refer to SLR definition included in the footnotes on page 4. 2. Refer to Investment Grade Rating definition included in the footnotes on page 3. Credit Rating (1) Tenant Industry (1) Geography (1) Asset Type (1) (2) Financial Services 12% Healthcare 7% Technology 6% Auto Manufacturing 6% Consumer Goods 5% Freight 4% Aerospace 4% Government 4% Metal Processing 4% Logistics 4% Telecommunications 4% Energy 4% Engineering 3% Pharmaceuticals 3% Automotive Parts 3% All Other 27% United States 65% United Kingdom 17% Netherlands 4% Finland 4% France 4% Germany 3% Luxembourg 2% Italy , Canada & Spain 1% Retail 5% Industrial/ Distribution 49% Office 46%
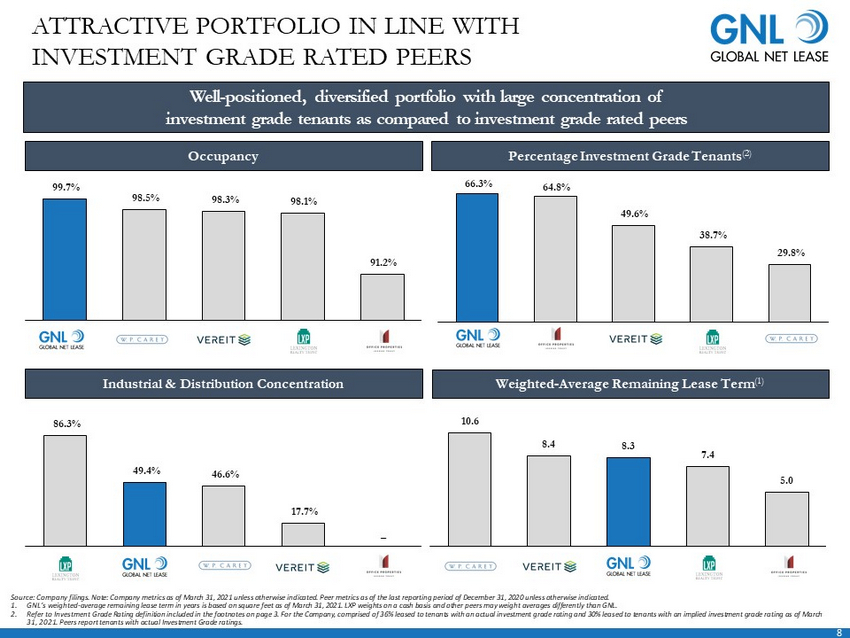
8 ATTRACTIVE PORTFOLIO IN LINE WITH INVESTMENT GRADE RATED PEERS Well - positioned, diversified portfolio with large concentration of investment grade tenants as compared to investment grade rated peers Weighted - Average Remaining Lease Term (1) Occupancy Percentage Investment Grade Tenants (2) Industrial & Distribution Concentration 10.6 8.4 8.3 7.4 5.0 WPC VER GNL LXP OPI 66.3% 64.8% 49.6% 38.7% 29.8% GNL OPI LXP VER WPC 99.7% 98.5% 98.3% 98.1% 91.2% GNL WPC LXP VER OPI 86.3% 49.4% 46.6% 17.7% – LXP GNL WPC VER OPI Source: Company filings. Note: Company metrics as of March 31, 2021 unless otherwise indicated. Peer metrics as of the last r epo rting period of December 31, 2020 unless otherwise indicated. 1. GNL’s weighted - average remaining lease term in years is based on square feet as of March 31, 2021. LXP weights on a cash basis a nd other peers may weight averages differently than GNL. 2. Refer to Investment Grade Rating definition included in the footnotes on page 3. For the Company, comprised of 36% leased to ten ants with an actual investment grade rating and 30% leased to tenants with an implied investment grade rating as of March 31, 2021. Peers report tenants with actual Investment Grade ratings.

9 Significant Upside Potential $60.1 $68.1 Q4'19 Q1'21 GNL METRICS BACK TO OR ABOVE PRE - PANDEMIC LEVEL 1. Cash Rent collected includes both contractual rents and deferred rents paid during the period. See Slide 4 for further detail s. 2. For Q1’21 Net Loss per Share was ($0.01) and for Q1’20, Net Income per Share was $0.05. For a detailed reconciliation of non - GAA P measures, refer to slide 33. 3. For Q1’2020, represents the closing stock price based on the January 31, 2020 closing price. For Q1’2021, represents the stoc k p rice based on the March 31, 2021 closing price. 4. For Q1’2020, calculated as the common stock closing price on January 31, 2020 of $20.82 divided by AFFO per share of $0.44 fo r Q 4’2019 multiplied by four. For Q1’2021, calculated as the common stock closing price on March 31, 2021 of $18.06 divided by AFFO per share of $0.44 for Q1’2021 multiplied by four. Actual AFFO per share for full year periods may differ. 5. Peer Group comprised of LXP, VER, WPC and OPI. Price to AFFO calculated as the closing price on March 31, 2021 for each peer div ided by fourth quarter 2020 AFFO per share multiplied by four. For OPI, CAD is used instead of AFFO per share. Peers may calculate AFFO and CAD differently than we calculate AFFO and actual AFFO per share for full year periods may differ. ($ in millions) Q1’2020 Q1’2021 Trend Portfolio Portfolio Cash Rent Collection (1) 99% 100% +1% _ Portfolio Occupancy 99.6% 99.7% +0.1% _ Square Footage 34.2 37.2 +3.0 _ Industrial/Distribution Exposure (% of SLR) 47.0% 49.4% +2.4% _ Percent of Leases Expiring After 2025 (% of SLR) 54.7% 58.9% +4.2% _ Financial Cash NOI $70.6 $80.9 +$10.3 _ Adjusted EBITDA $60.1 $68.1 +$8.0 _ AFFO per Share (2) $0.44 $0.44 No change _ Trading Stock Price (3) $20.82 $18.06 - $2.76 _ Price to Annualized AFFO (4) 11.8x 10.3x - 1.5x _ GNL’s Portfolio is Back to or Above Pre - Pandemic Levels, Which the Public Markets Have Yet to Materialize, Offering Significant Upside Potential 99% 100% Q4'19 Q1'21 $0.44 $0.44 Q4'19 Q1'21 Cash Rent Collection AFFO per Share Adjusted EBITDA $70.6 $80.9 Q4'19 Q1'21 Cash NOI Q1’20 Q1’21 Price / AFFO per Share (4) 10.3x 12.5x GNL Peer Group (5) 47% 49% Q4'19 Q1'21 Industrial/Distribution Exposure GNL’s proactive management throughout the COVID - 19 pandemic and robust acquisition program has delivered significant portfolio growth and improvement, which management believes has yet to materialize in the public markets, providing significant upside potential in GNL’s common stock

10 Tenant Rating Country Property Type % of SLR (1) Baa2** U.S. / Canada Distribution 4% Baa1 U.S. / Italy Industrial / Distribution 4% Aaa** U.S. Office 4% Baa3* U.K. Office 3% Aa3 NETH Office 3% Baa3* U.S. Industrial / Distribution 3% Baa1 U.S. Industrial 3% Baa2 U.S. Distribution 3% Aa1** FIN Industrial 2% Ba1* U.S. Industrial 2% WELL DIVERSIFIED TENANT BASE Top Ten Tenants As of March 31, 2021. *Represents Moody’s Implied Rating. ** Represents Tenant Parent Rating even if not a guarantor on the lease. 1. Metric based on SLR. Refer to SLR definition included in the footnotes on page 4. Top Ten Tenants Represent 31 % of SLR (1)

11 Office Distribution Industrial FOCUS ON HIGH - QUALITY TENANTS Only Focused on Markets with Quality Sovereign Debt Ratings (S&P) U.S. Luxembourg Germany The Netherlands Canada Finland U.K. France Spain Italy AA+ AAA AAA AAA AAA AA+ AA AA A BBB Moody’s: A1 Moody’s: Aaa Moody’s: Aa3 Moody’s: Aa3 Moody’s: Baa2 Moody’s: Baa2 Moody’s: Baa2 Moody’s: Aa1 Moody’s: Baa1 Moody’s: A2 Moody’s: A2 Best - in - class portfolio leased to primarily Investment Grade (1) rated tenants in well established markets in the U.S. and Europe 1. Refer to Investment Grade Rating definition included in the footnotes to page 3. Comprised of 36% leased to tenants with an a ctu al investment grade rating and 30% leased to tenants with an implied investment grade rating as of March 31, 2021. Moody’s: Baa3
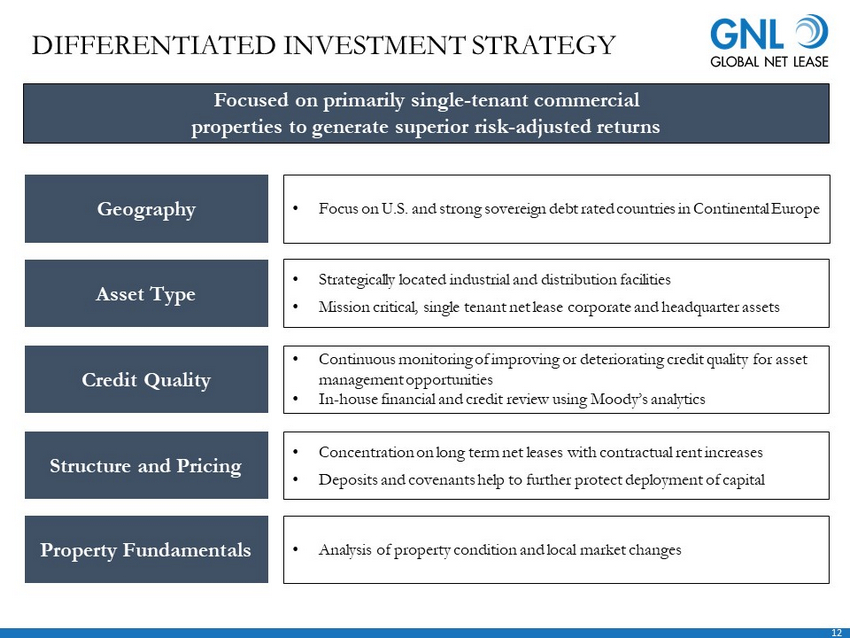
12 DIFFERENTIATED INVESTMENT STRATEGY Geography Asset Type Property Fundamentals Credit Quality Structure and Pricing • Focus on U.S. and strong sovereign debt rated countries in Continental Europe • Strategically located industrial and distribution facilities • Mission critical, single tenant net lease corporate and headquarter assets • Continuous monitoring of improving or deteriorating credit quality for asset management opportunities • In - house financial and credit review using Moody’s analytics • Analysis of property condition and local market changes • Concentration on long term net leases with contractual rent increases • Deposits and covenants help to further protect deployment of capital Focused on primarily single - tenant commercial properties to generate superior risk - adjusted returns

13 *Represents Moody’s Implied Rating’ ** Represents Tenant or Guarantor Parent Rating even if not a guarantor on the lease. 1. Represents the contract purchase price and excludes acquisitions costs which are capitalized per GAAP. 2. Average Cap Rate is a rate of return on a real estate investment property based on the expected, annualized SLR that the prop ert y will generate under its existing lease or leases. Average Cap Rate is calculated by dividing the annualized SLR the propert y w ill generate (before debt service and depreciation and after fixed costs and variable costs) by the purchase price of the property, excluding acquisition costs. Th e w eighted - average capitalization rate is based upon square footage as of the date of acquisition. 3. Represents remaining lease term as of closing date, or expected closing date, and is weighted based on square feet. 4. Based on information as of April 30 , 2021. PSAs are subject to conditions and pending acquisitions may not be completed on their contemplated terms, or at all. 5. There is no assurance that we will enter into a definitive agreement or agreements to acquire these properties on terms and c ond itions acceptable to us, if at all. 6. Implied investment grade may include actual ratings of tenant parent, guarantor parent (regardless of whether or not the pare nt has guaranteed the tenant’s obligation under the lease) or by using a proprietary Moody’s analytical tool, which generates an im plied rating by measuring a company’s probability of default. The term “parent” for these purposes includes any entity, including any governmental entity , o wning more than 50% of the voting stock in a tenant. 7. Going - in Cap Rate is a rate of return on a real estate investment property based on the expected, cash rental income that the pr operty will generate under its existing lease or leases during the first year of the lease. Going - in Cap Rate is calculated by d ividing the cash rental income the property will generate during the first year of the lease (before debt service and depreciation and after fixed costs and variable cos ts) by the purchase price of the property, excluding acquisition costs. The weighted - average capitalization rate is based upon squa re footage as of the date of acquisition. 8. Even if we enter into a definitive agreement, the purchase price we agree to pay may be different from the $90 million aggreg ate price we have proposed or our estimate of net operating income may change. ROBUST ACQUISITIONS DRIVE CONTINUED GROWTH Second quarter acquisitions and pipeline reflect management’s ability to generate high - quality, global, sale - leaseback transactions with world - class tenants A cquisition Name A cquisition Status Credit Rating Property Type Purchase Price (in millions) (1) Average Cap Rate (2) Lease Term Remaining (3) McLaren Campus 3 - Pack Closed: Q2’2021 Caa2 Industrial $236.3 20.0 Schlumberger Closed: Q2’2021 Baa1 Industrial/Office $7.0 7.6 Momentum Manufacturing Group Closed: Q2’2021 Caa2* Industrial $6.6 20.0 Total Closed Q2’2021 $249.9 10.5% 19.4 FCA US Executed PSA – Expected: Q3’2021 Ba1** Other $6.9 9.5 Total Q2’2021 Pipeline (4) $6.9 9.5 Total Closed + Q2’2021 Pipeline $256.8 10.5% 19.4 Consistent with our announced acquisition strategy, we continuously source investment opportunities throughout the year. As o f A pril 30, 2021, we have submitted letters of intent on two opportunities to acquire a total of 17 properties aggregating over $90 m ill ion (5) . These potential investments are both industrial assets that are approximately 80% leased to implied (6) investment grade rated tenants, with a weighted average l ease term remaining of approximately 19 years and, based on the purchase price we have proposed and our estimate of net operating income, a Going - in Cap Rate (7) and a weighted Average Cap Rate equal to approximately 7.4% and 9.0%, respectively (8)

14 Transaction Overview Tenants McLaren Services Limited (2) McLaren Automotive (1) Property Type Industrial Location Woking , United Kingdom Purchase Price (1) $236.3 Square Feet 841,000 Lease Term (years) 20 Years Weighted Average Annual Rent Escalator 1.25% to 4.00% x In the second quarter 2021, GNL completed a $236 million sale leaseback transaction for a three - property campus leased to two subsidiaries of McLaren Holdings Limited. x GNL leveraged its high - quality execution and market knowledge to diligently structure and complete the complex transaction. x McLaren is a leading luxury automotive, motorsport, and technology company with over 57 - years of technological innovation. x The 841k SF campus features three, mission - critical, state - of - the - art buildings that are well geographically located with access to major avenues of air and land transportation. x Upon closing, McLaren signed new 20 - year NNN leases with an average annual rental increase between 1.25% and 4.00%. x The acquisition was acquired at a Going - in Cap Rate of 9.5% (2) and an average Cap Rate of 10.8%, with a potential one - time rent adjustment (3) . SECOND QUARTER ACQUISITION: MCLAREN GROUP GLOBAL HEADQUARTERS Transaction Highlights 1. Based on the exchange rate of 1.39 U.S. dollars to one British Pound. 2. Going - in Cap Rate is a rate of return on a real estate investment property based on the expected, cash rental income that the pr operty will generate under its existing lease or leases during the first year of the lease. Going - in Cap Rate is calculated by dividing the cash rental income the property will generate during the first year of the lease (before debt service and deprec iat ion and after fixed costs and variable costs) by the purchase price of the property, excluding acquisition costs. 3. The annual base rent is subject to a one - time contingent adjustment which only occurs upon a McLaren Holdings Limited corporate credit rating enhancement to B - (or equivalent) from one of S&P, Moody’s or Fitch by May 2023 and the Company refinances the debt incurred to acquire the property by December 2024. If these conditions are not met, the adjustment will not occur. The Company is under no obligation to complete a refinancing of this loan, and the Company does not expect to do so during the first year of the lease.

15 State - of - the - Art, Mission - Critical Campus : The award - winning campus serves as the world headquarters for McLaren and is well geographically located near Central London and Heathrow Airport, and hosts approximately 1,000 workers SECOND QUARTER ACQUISITION: MCLAREN GROUP GLOBAL HEADQUARTERS (CONT.) GNL’s $236 million (1) acquisition of the state - of - the - art, mission - critical, campus leased to The McLaren Group exemplifies GNL’s ability to complete large global sale - leaseback transactions World - Renowned Tenants: The McLaren Group is a British automotive, motorsport, and technology company with a 57 - year history of technological innovation and cutting - edge l uxury design Superior Execution: GNL’s robust European network and market presence strongly positioned the Company to complete and diligently structure such a large, global sale - leaseback transaction Attractive Acquisition: GNL acquired the state - of - the - art campus at a Going - in Cap Rate of 9.5% and an average Cap Rate of 10.8% (2) and is expected to increase GNL’s exposure to industrial and distribution assets New 20 - Year Leases Executed at Closing: Upon closing, GNL and McLaren entered into 20 - year NNN leases with annual rental escalations linked to CPI indexation between 1.25% and 4.00 % (2) Diligently Structured: Negotiated a one - time rent adjustment that is contingent upon ( i ) McLaren receiving a credit upgrade to B - or equivalent and (ii) GNL completes a refinancing of the incurred debt on the property. If these conditions are not met, the adjustment wi ll not occur (2) 1. Based on the exchange rate of 1.39 U.S. dollars to one British Pound. 2. See page 14 for more details regarding a potential one - time contingent rent adjustment.

16 GLOBAL GEOGRAPHIC BALANCE Note: Metrics as of March 31, 2021 unless otherwise noted. 1. Refer to basis for metric calculation included in the footnotes on page 4. 2. Metric based on SLR. Refer to SLR definition included in the footnotes on page 4. U.S. and Canada Number of Assets: 237 Weighted - Average Remaining Lease Term: 8.9 years (1) % of GNL SLR: 64.6% (2) Europe Number of Assets: 69 Weighted - Average Remaining Lease Term: 6 .8 years (1) % of GNL SLR: 35.4 % (2)

17 Office 48% Industrial/Distribution 47% Retail 5% United States & Canada 65% Europe 35% Office 46% Industrial/Distribution 49% Retail 5% PORTFOLIO ENHANCEMENT Continued Focus Towards Industrial and Distribution Properties and Geographic Diversification United States 65% Europe 35% Property Type Concentration (1) Geographic Concentration (1) As of March 31, 2020 As of March 31, 2020 As of March 31, 2021 2020 vs 2019: Industrial / Distribution concentration increased to 49% from 47% as management sourced and identified large sale leaseback transactions at attractive cap rates As of March 31, 2021 2020 vs 2019: GNL’s geographic concentration was unchanged as management identified a balance of attractive domestic and cross boarder acquisition opportunities Note: Metrics as of March 31, 2021 unless otherwise noted. 1. Metric based on SLR. Refer to SLR definition included in the footnotes on page 4.
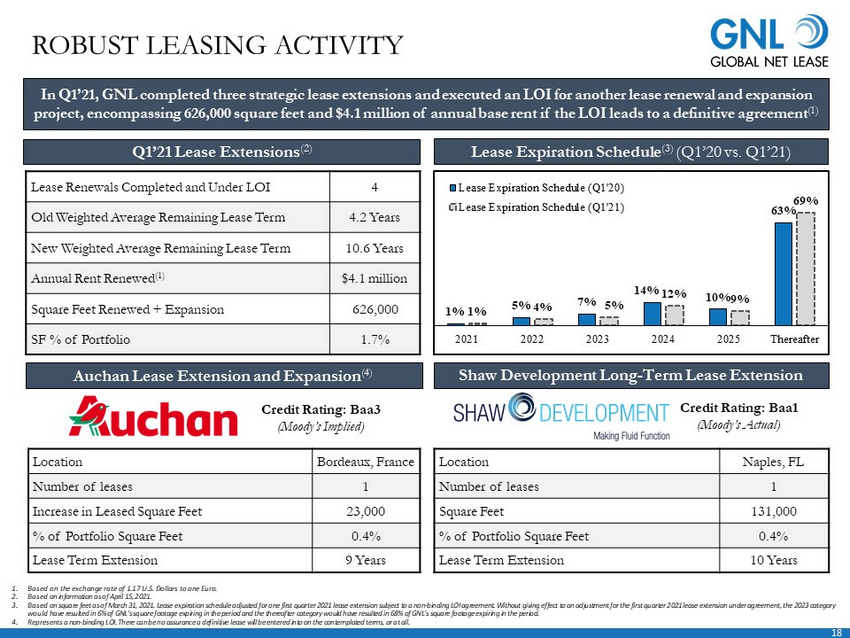
18 In Q1’21, GNL completed three strategic lease extensions and executed an LOI for another lease renewal and expansion project, encompassing 626,000 square feet and $4.1 million of annual base rent if the LOI leads to a definitive agreement (1) Q1’21 Lease Extensions (2) Auchan Lease Extension and Expansion (4) Lease Expiration Schedule (3) (Q1’20 vs. Q1’21) Shaw Development Long - Term Lease Extension Lease Renewals Completed and Under LOI 4 Old Weighted Average Remaining Lease Term 4.2 Years New Weighted Average Remaining Lease Term 10.6 Years Annual Rent Renewed (1) $4.1 million Square Feet Renewed + Expansion 626,000 SF % of Portfolio 1.7% 1% 5% 7% 14% 10% 63% 1% 4% 5% 12% 9% 69% 2021 2022 2023 2024 2025 Thereafter Lease Expiration Schedule (Q1'20) Lease Expiration Schedule (Q1'21) Location Bordeaux, France Number of leases 1 Increase in Leased Square Feet 23,000 % of Portfolio Square Feet 0.4% Lease Term Extension 9 Years Location Naples, FL Number of leases 1 Square Feet 131,000 % of Portfolio Square Feet 0.4% Lease Term Extension 10 Years 1. Based on the exchange rate of 1.17 U.S. Dollars to one Euro. 2. Based on information as of April 15, 2021. 3. Based on square feet as of March 31, 2021. Lease expiration schedule adjusted for one first quarter 2021 lease extension subj ect to a non - binding LOI agreement. Without giving effect to an adjustment for the first quarter 2021 lease extension under agreeme nt, the 2023 category would have resulted in 6% of GNL’s square footage expiring in the period and the thereafter category would have resulted in 6 8% of GNL’s square footage expiring in the period. 4. Represents a non - binding LOI. There can be no assurance a definitive lease will be entered into on the contemplated terms, or at all. ROBUST LEASING ACTIVITY Credit Rating: Baa3 (Moody’s Implied) Credit Rating: Baa1 (Moody’s Actual)

19 • Joined GNL as an Independent Board Member on March 2017 • Currently serves as an independent director and chairman of the audit committee for Roman DBDR Tech Acquisition Corp. • Previously served in various roles on the Boards of Herbalife Nutrition Ltd., Caesars Entertainment Inc., Icahn Enterprises, and Take Two Interactive Software, Inc. • Previously served as CEO of Orbitex Management and Eaglescliff Corporation James L. Nelson Chief Executive Officer and President No transactional fees allows for low general and administrative costs, which allows AR Global to provide greater resources at a lower cost (1) Lower Overhead Costs AR Global has sponsored or co - sponsored 15 REITs which have acquired more than $40 billion of real estate since 2007 Experience The audit, compensation, nominating and corporate governance and conflicts committees are comprised of independent directors Corporate Governance Performance Alignment Management structure fully aligned to compensate based on operational outperformance, in turn delivering increased value to shareholders Company is supported by a dedicated financial accounting and reporting team, and maintains its own financial reporting processes, controls, and procedures Operational Efficiencies • Currently serves as Chief Financial Officer of New York City REIT • Previously served as Chief Accounting Officer of Global Net Lease • Past experience includes accounting positions with Goldman Sachs and KPMG • Certified Public Accountant in New York State 1. As compared to fees associated with the prior management contract. Chris Masterson FULLY ALIGNED MANAGEMENT STRUCTURE Fully integrated external management team creates highly scalable platform with an acquisition pipeline generated by a proven, country - focused origination network Chief Financial Officer, Treasurer and Secretary

20 $36.2 $40.4 Net Loss Common Stock Dividends AFFO ($0.8) Net Loss Common Stock Dividends AFFO Q1’21 Net Loss, AFFO (5) and Common Stock Dividends ($mm) First Quarter 2021 Key Highlights • Total second quarter closed and pipeline acquisitions of $257 million with a Going - in Cap Rate of 9.3% and an average Cap Rate o f 10.5% (1) • In the second quarter, GNL acquired the world headquarters for McLaren Automotive, Racing and Applied Divisions in Woking , Surrey, England for $236 million (2) and executed new 20 - year NNN leases • The award - winning campus serves as the world headquarters for McLaren and well geographically located near Central London and Heathrow Airport, and hosts approximately 1,000 workers • McLaren would represent 7% of first quarter 2021 portfolio SLR and is expected to increase GNL’s exposure to industrial and distribution assets to 53% (3) • Collected 100% of first quarter Original Cash Rent due across the portfolio, including 100% from the Company’s top twenty ten ant s (4) • Year over year, annualized straight - line rent derived from industrial and distribution assets increased from 47% to 49% • As of March 31, 2021, GNL had ample liquidity of $352 million, including $263 million of cash and cash equivalents and $89 mi lli on available for future borrowings under the Company's revolving credit facility, before giving effect to second quarter acquisi tio ns • Year - to - date, GNL’s Common Stock has returned 18.5% (5) PERFORMANCE METRICS 1. Refer to page 13 for further details. 2. Based on the exchange rate of 1.39 U.S. dollars to one British Pound. 3. Calculated giving effect to the completion of the acquisition as if had occurred on March 31, 2021. 4. Refer to pages 5 and 6 for further details. 5. Based on GNL’s Common Stock total return between January 1, 2021 and May 3, 2021. 6. Adjusted Funds from Operations (“AFFO”). See “Non - GAAP measures” on pages 29 and 30 for a description of AFFO and page 33 for a reconciliation of AFFO to net income, the most directly comparable GAAP Financial measure. ($ in millions) Q1 2021 Q1 2020 Net Income (Loss) ($0.8) $5.0 Adjusted Funds From Operations (6) $40.4 $39.8 Adjusted Funds From Operations per Share (6) $0.44 $0.44 Dividends Paid to Common Stockholders $36.2 $47.6 Weighted - Average Shares Outstanding, Fully Diluted 91.5 89.5

21 Transaction Highlights • On December 16, 2020, GNL completed a $500 million senior unsecured notes offering. The notes are rated investment grade by S &P and BB+ rated by Fitch. The notes issuance represents a significant milestone as GNL focuses on issuing more unsecured debt on attractive term s a nd improving GNL’s corporate rating • Term: 7 - Year • Coupon: 3.75% • Notes Rating: BBB - (S&P) | BB+ (Fitch) • Corporate Credit Rating: BB+ (S&P and Fitch) • GNL leveraged the Company’s long - standing relationship with its banking partners to ensure superior execution and pricing during a period of historically low interest rates during the COVID - 19 global pandemic RECENT $500 MILLION NOTES OFFERING Over Half of GNL’s Debt Maturities Mature After 2025 Prior to Notes Issuance (Q3’20) Post Notes Issuance (Q4’20) Notes Credit Rating N/A BBB - (S&P) | BB+ (Fitch) Corporate Credit Rating N/A BB+ (S&P & Fitch) Weighted Average Debt Maturity 5.1 Years 5.4 Years % of Debt Maturing After 2025 36.4% 51.9% % of Debt Unsecured (1) 32.3% 39.9% Enhanced Capital Structure 1% 1% 28% 31% 4% 36% 1% 1% 20% 24% 4% 52% 2021 2022 2023 2024 2025 Thereafter Prior to Notes Issuance (Q3'20) Post Notes Issuance (Q4'20) At the end of the fourth quarter, GNL completed a $500 million senior unsecured notes offering that enhanced the Company’s capital structure and improved its ability to issue unsecured notes on attractive terms in the future 1. The unsecured notes are guaranteed by each subsidiary that is a guarantor under the Company's credit facility, and each futur e s ubsidiary that subsequently guarantees indebtedness under the credit facility.

22 $3,173 $3,421 $3,763 $4,319 $4,295 1/1/2017 1/1/2018 1/1/2019 1/1/2020 1/1/2021 CONTINUED FOCUS ON DRIVING EARNINGS GROWTH Historical Revenue Growth Core Funds From Operations (1) Real Estate Assets at Cost Adjusted Funds From Operations (1) $259 $282 $306 $330 $358 2017 2018 2019 2020 Q1'21 Annualized $ in millions $141 $147 $160 $161 $162 2017 2018 2019 2020 Q1'21 Annualized $ in millions $ in millions $ in millions $135 $149 $146 $135 $155 2017 2018 2019 2020 Q1'21 Annualized 22 Note: Metrics as of the end and for the twelve months ended March 31, 2021 except for Q1'21 Annualized numbers, which represe nt metrics for the quarter ended March 31, 2021 multiplied by four. Future quarters may not be comparable to the quarter ended M arc h 31, 2021. 1. See “Non - GAAP measures” on pages 29 and 30 for a description of Core FFO and AFFO and page 33 and 34 for a reconciliation of Cor e FFO and AFFO to net income, the most directly comparable GAAP Financial measure. 12/31/17 12/31/18 12/31/19 12/31/20 3/31/21

23 $11 $21 $331 $227 $82 $690 $126 $290 $ 500 $0 $200 $400 $600 $800 $1,000 $1,200 $1,400 2021 2022 2023 2024 2025 Thereafter Mortgages Credit Facility Unsecured Notes 1% 4% 6% 12% 9% 6% 2% 11% 49% KEY METRICS Metric Q1’2021 Net Debt to Enterprise Value (1) 49.9% Net Debt to Adjusted EBITDA (annualized) (2) 7.4x Interest Coverage Ratio (3) 3.6x Weighted - Average Interest Rate (4) 3.3% Weighted - Average Debt Maturity (5) 5.1 Years Floating Rate / Fixed Rate (6) 4.2% / 95.8% Debt Metrics Debt by Currency Debt Maturity 1. Enterprise value of $4.0 billion is calculated based on the March 31, 2021 closing price of $18.06 per common share, $26.66 p er Series A Preferred Share, $25.55 per Series B Preferred Share and net debt of $2.1 billion, comprised of the principal amount of GNL’s debt totaling $2.3 billion less cash and cash equivalents totaling $263 million, as of March 31, 2021. 2. For the first quarter 2021, represents net debt equal to $2.0 billion (total debt outstanding of $2.3 billion less cash and c ash equivalents of $263 million) to Adjusted Earnings before Interest, Taxes, Depreciation and Amortization (“EBITDA”), annualize d based on first quarter 2021 Adjusted EBITDA multiplied by four. See “Non - GAAP Measures” on page 31 for a description of Adjusted EBITDA. 3. The interest coverage ratio is calculated by dividing Adjusted EBITDA for the applicable quarter by cash paid for interest (c alc ulated based on the interest expense less non - cash portion of interest expense including amortization of mortgage (discount) pre mium, net). See “Non - GAAP Measures” page 32 for a reconciliation of Adjusted EBITDA and cash paid for interest. 4. The weighted - average interest rate cost is based on the outstanding principal balance of the debt of the applicable quarter. 5. Weighted average debt maturity based on outstanding principal balance of the debt as of the last day of the applicable quarte r. 6. Fixed rate debt includes floating rate debt fixed by swaps. 7. The unsecured notes are guaranteed by each subsidiary that is a guarantor under the Company's credit facility, and each futur e s ubsidiary that subsequently guarantees indebtedness under the credit facility. 8. Weighted - average remaining lease term in years is based on square feet as of the last day of the applicable quarter. Weighted - Average Remaining Lease Term: 8.3 years (8) Lease Expiration Schedule (% of SF Per Year ) (in millions) USD 60% EUR 30% GBP 10% (7)

24 5.4 5.2 5.1 5.4 5.1 3.1% 3.2% 3.1% 3.3% 3.3% 1.0% 1.5% 2.0% 2.5% 3.0% 3.5% 4.0% 4.5% 5.0% 0.0 1.0 2.0 3.0 4.0 5.0 6.0 Q1 2020 Q2 2020 Q3 2020 Q4 2020 Q1 2021 Weighted-Average Maturity Weighted-Average Interest Rate ENHANCED CAPITAL STRUCTURE GNL’s recent $500 million notes offering added capital diversification to the Company’s capital structure and laid the foundation for future unsecured note issuances on attractive terms while maintaining moderate leverage Debt Maturity and Interest Expense by Quarter GNL Capital Structure by Quarter (1) (in millions) (years) (WAVG interest expense) 1. As of the final day of the applicable quarter or for the applicable quarter (based on closing price for common equity and preferred equity) . 2. The unsecured notes are guaranteed by each subsidiary that is a guarantor under the Company's credit facility, and each futur e s ubsidiary that subsequently guarantees indebtedness under the credit facility. $1,814 $1,497 $1,425 $1,536 $1,725 $268 $244 $267 $276 $296 $500 500 $1,249 $1,303 $1,418 $1,379 $1,362 $790 $744 $681 $414 $416 $4,121 $3,788 $3,791 $4,105 $4,299 $0 $500 $1,000 $1,500 $2,000 $2,500 $3,000 $3,500 $4,000 $4,500 $5,000 Q1 2020 Q2 2020 Q3 2020 Q4 2020 Q1 2021 Common Equity Preferred Equity Unsecured Notes Mortgage Debt Credit Facility (2)

APPENDIX

26 COMPREHENSIVE HEDGING PROGRAM Hedging Foreign Currency Exchange Risk • Provides protection against a weakening in the value of EUR and GBP versus the U.S. Dollar associated with the Company’s foreign property operations Interest Rate Swaps: Fixing Interest on Floating Rate Debt • Cost effective tools that mitigate against adverse fluctuations in interest rates; effectively acting to convert variable rate debt into fixed rate debt resulting in reduced exposure to variability in cash flows related to interest payments GNL uses a comprehensive hedging program, with a number of components designed to limit the impact of currency and interest rate movements to its European portfolio
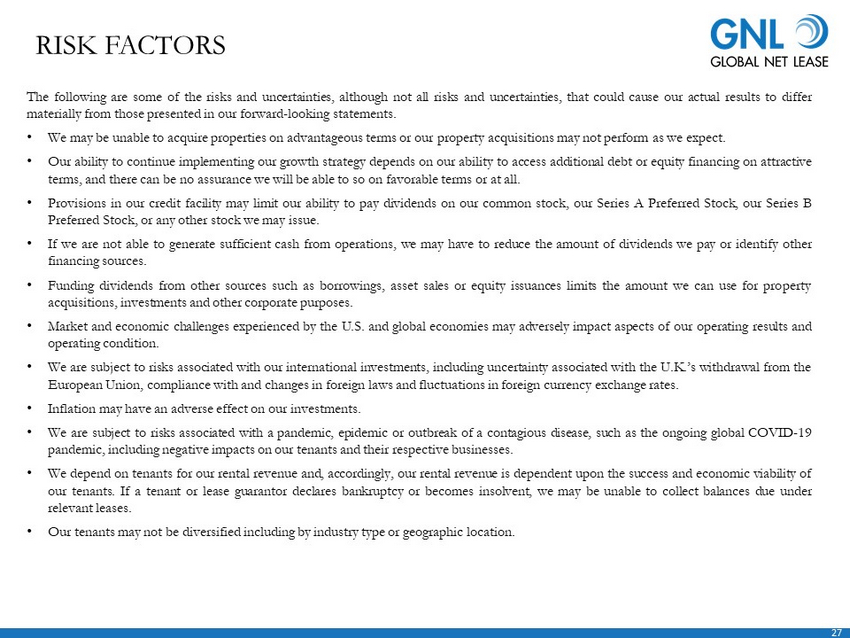
27 RISK FACTORS The following are some of the risks and uncertainties, although not all risks and uncertainties, that could cause our actual results to differ materially from those presented in our forward - looking statements . • We may be unable to acquire properties on advantageous terms or our property acquisitions may not perform as we expect . • Our ability to continue implementing our growth strategy depends on our ability to access additional debt or equity financing on attractive terms, and there can be no assurance we will be able to so on favorable terms or at all . • Provisions in our credit facility may limit our ability to pay dividends on our common stock, our Series A Preferred Stock, our Series B Preferred Stock, or any other stock we may issue . • If we are not able to generate sufficient cash from operations, we may have to reduce the amount of dividends we pay or identify other financing sources . • Funding dividends from other sources such as borrowings, asset sales or equity issuances limits the amount we can use for property acquisitions, investments and other corporate purposes . • Market and economic challenges experienced by the U . S . and global economies may adversely impact aspects of our operating results and operating condition . • We are subject to risks associated with our international investments, including uncertainty associated with the U . K . ’s withdrawal from the European Union, compliance with and changes in foreign laws and fluctuations in foreign currency exchange rates . • Inflation may have an adverse effect on our investments . • We are subject to risks associated with a pandemic, epidemic or outbreak of a contagious disease, such as the ongoing global COVID - 19 pandemic, including negative impacts on our tenants and their respective businesses . • We depend on tenants for our rental revenue and, accordingly, our rental revenue is dependent upon the success and economic viability of our tenants . If a tenant or lease guarantor declares bankruptcy or becomes insolvent, we may be unable to collect balances due under relevant leases . • Our tenants may not be diversified including by industry type or geographic location .

28 RISK FACTORS (CONTINUED) • In owning properties we may experience, among other things, unforeseen costs associated with complying with laws and regulations and other costs, potential difficulties selling properties and potential damages or losses resulting from climate change . • We depend on our Advisor and our Property Manager to provide us with executive officers, key personnel and all services required for us to conduct our operations . • All of our executive officers face conflicts of interest, such as conflicts created by the terms of our agreements with the Advisor and compensation payable thereunder, conflicts allocating investment opportunities to us, and conflicts in allocating their time and attention to our matters . Conflicts that arise may not be resolved in our favor and could result in actions that are adverse to us . • We have long - term agreements with our Advisor and its affiliates that may be terminated only in limited circumstances and may require us to pay a termination fee in some cases . • We have substantial indebtedness and may be unable to repay, refinance, restructure or extend our indebtedness as it becomes due . Increases in interest rates could increase the amount of our debt payments . We may incur additional indebtedness in the future . • The stockholder rights plan adopted by our board of directors, our classified board and other aspects of our corporate structure and Maryland law may discourage a third party from acquiring us in a manner that might result in a premium price to our stockholders . • Restrictions on share ownership contained in our charter may inhibit market activity in shares of our stock and restrict our business combination opportunities . • We may fail to continue to qualify as a real estate investment trust for U . S . federal income tax purposes .
29 DEFINITIONS • Due to certain unique operating characteristics of real estate companies, as discussed below, the National Association of Real Estate Investment Trusts ("NAREIT"), an industry trade group, has promulgated a measure known as funds from operations ("FFO"), which we believe to be an appropriate supplemental measure to reflect the operating performance of a REIT . FFO is not equivalent to net income or loss as determined under accounting principles generally accepted in the United States ("GAAP") . • We calculate FFO, a non - GAAP measure, consistent with the standards established over time by the Board of Governors of NAREIT, as restated in a White Paper approved by the Board of Governors of NAREIT effective in December 2018 (the "White Paper") . The White Paper defines FFO as net income or loss computed in accordance with GAAP, excluding depreciation and amortization related to real estate, gain and loss from the sale of certain real estate assets, gain and loss from change in control and impairment write - downs of certain real estate assets and investments in entities when the impairment is directly attributable to decreases in the value of depreciable real estate held by the entity . Our FFO calculation complies with NAREIT's definition . • The historical accounting convention used for real estate assets requires straight - line depreciation of buildings and improvements, and straight - line amortization of intangibles, which implies that the value of a real estate asset diminishes predictably over time . We believe that, because real estate values historically rise and fall with market conditions, including inflation, interest rates, unemployment and consumer spending, presentations of operating results for a REIT using historical accounting for depreciation and certain other items may be less informative . Historical accounting for real estate involves the use of GAAP . Any other method of accounting for real estate such as the fair value method cannot be construed to be any more accurate or relevant than the comparable methodologies of real estate valuation found in GAAP . Nevertheless, we believe that the use of FFO, which excludes the impact of real estate related depreciation and amortization, among other things, provides a more complete understanding of our performance to investors and to management, and, when compared year over year, reflects the impact on our operations from trends in occupancy rates, rental rates, operating costs, general and administrative expenses, and interest costs, which may not be immediately apparent from net income . However, FFO, core funds from operations ("Core FFO") and adjusted funds from operations (“AFFO”), as described below, should not be construed to be more relevant or accurate than the current GAAP methodology in calculating net income or in its applicability in evaluating our operating performance . The method utilized to evaluate the value and performance of real estate under GAAP should be construed as a more relevant measure of operational performance and considered more prominently than the non - GAAP FFO, Core FFO and AFFO measures and the adjustments to GAAP in calculating FFO, Core FFO and AFFO . Other REITs may not define FFO in accordance with the current NAREIT definition (as we do) or may interpret the current NAREIT definition differently than we do or calculate Core FFO or AFFO differently than we do . Consequently, our presentation of FFO, Core FFO and AFFO may not be comparable to other similarly titled measures presented by other REITs . Adjustments for unconsolidated partnerships and joint ventures are calculated to reflect the proportionate share of adjustments for non - controlling interest to arrive at FFO, Core FFO and AFFO, as applicable . • We consider FFO, Core FFO and AFFO useful indicators of our performance . Because FFO calculations exclude such factors as depreciation and amortization of real estate assets and gain or loss from sales of operating real estate assets (which can vary among owners of identical assets in similar conditions based on historical cost accounting and useful - life estimates), FFO facilitates comparisons of operating performance between periods and between other REITs .
30 DEFINITIONS (CONTINUED) • In calculating Core FFO, we start with FFO, then we exclude certain non - core items such as acquisition, transaction and other costs, as well as certain other costs that are considered to be non - core, such as debt extinguishment costs, fire loss and other costs related to damages at our properties . The purchase of properties, and the corresponding expenses associated with that process, is a key operational feature of our core business plan to generate operational income and cash flows in order to make dividend payments to stockholders . In evaluating investments in real estate, we differentiate the costs to acquire the investment from the subsequent operations of the investment . We also add back non - cash write - offs of deferred financing costs and prepayment penalties incurred with the early extinguishment of debt which are included in net income but are considered financing cash flows when paid in the statement of cash flows . We consider these write - offs and prepayment penalties to be capital transactions and not indicative of operations . By excluding expensed acquisition, transaction and other costs as well as non - core costs, we believe Core FFO provides useful supplemental information that is comparable for each type of real estate investment and is consistent with management's analysis of the investing and operating performance of our properties . • In calculating AFFO, we start with Core FFO, then we exclude certain income or expense items from AFFO that we consider more reflective of investing activities, other non - cash income and expense items and the income and expense effects of other activities that are not a fundamental attribute of our business plan . These items include early extinguishment of debt and other items excluded in Core FFO as well as unrealized gain and loss, which may not ultimately be realized, such as gain or loss on derivative instruments, gain or loss on foreign currency transactions, and gain or loss on investments . In addition, by excluding non - cash income and expense items such as amortization of above - market and below - market leases intangibles, amortization of deferred financing costs, straight - line rent and equity - based compensation from AFFO, we believe we provide useful information regarding income and expense items which have a direct impact on our ongoing operating performance . We also include the realized gain or loss on foreign currency exchange contracts for AFFO as such items are part of our ongoing operations and affect the current operating performance of the Company . By providing AFFO, we believe we are presenting useful information that can be used to better assess the sustainability of our ongoing operating performance without the impact of transactions or other items that are not related to the ongoing performance of our portfolio of properties . AFFO presented by us may not be comparable to AFFO reported by other REITs that define AFFO differently . • In calculating AFFO, we exclude certain expenses, which under GAAP are characterized as operating expenses in determining operating net income . All paid and accrued merger, acquisition, transaction and other costs (including prepayment penalties for debt extinguishments) and certain other expenses negatively impact our operating performance during the period in which expenses are incurred or properties are acquired will also have negative effects on returns to investors, but are not reflective of our on - going performance . Further, under GAAP, certain contemplated non - cash fair value and other non - cash adjustments are considered operating non - cash adjustments to net income . In addition, as discussed above, we view gain and loss from fair value adjustments as items which are unrealized and may not ultimately be realized and not reflective of ongoing operations and are therefore typically adjusted for when assessing operating performance .

31 DEFINITIONS (CONTINUED) • Excluding income and expense items detailed above from our calculation of AFFO provides information consistent with management's analysis of the operating performance of the Company . Additionally, fair value adjustments, which are based on the impact of current market fluctuations and underlying assessments of general market conditions, but can also result from operational factors such as rental and occupancy rates, may not be directly related or attributable to our current operating performance . By excluding such changes that may reflect anticipated and unrealized gain or loss, we believe AFFO provides useful supplemental information . • As a result, we believe that the use of FFO, Core FFO and AFFO, together with the required GAAP presentations, provide a more complete understanding of our performance including relative to our peers and a more informed and appropriate basis on which to make decisions involving operating, financing, and investing activities . • We believe that earnings before interest, taxes, depreciation and amortization (“EBITDA”) adjusted for acquisition, transaction and other costs, other non - cash items and including our pro - rata share from unconsolidated joint ventures ("Adjusted EBITDA") is an appropriate measure of our ability to incur and service debt . Adjusted EBITDA should not be considered as an alternative to cash flows from operating activities, as a measure of our liquidity or as an alternative to net income as an indicator of our operating activities . Other REITs may calculate Adjusted EBITDA differently and our calculation should not be compared to that of other REITs . • NOI is a non - GAAP financial measure equal to net income (loss), the most directly comparable GAAP financial measure, less discontinued operations, interest, other income and income from preferred equity investments and investment securities, plus corporate general and administrative expense, acquisition, transaction and other costs, depreciation and amortization, other non - cash expenses and interest expense . We use NOI internally as a performance measure and believe NOI provides useful information to investors regarding our financial condition and results of operations because it reflects only those income and expense items that are incurred at the property level . Therefore, we believe NOI is a useful measure for evaluating the operating performance of our real estate assets and to make decisions about resource allocations . Further, we believe NOI is useful to investors as a performance measure because, when compared across periods, NOI reflects the impact on operations from trends in occupancy rates, rental rates, operating costs and acquisition activity on an unlevered basis, providing perspective not immediately apparent from net income . NOI excludes certain components from net income in order to provide results that are more closely related to a property's results of operations . For example, interest expense is not necessarily linked to the operating performance of a real estate asset and is often incurred at the corporate level as opposed to the property level . In addition, depreciation and amortization, because of historical cost accounting and useful life estimates, may distort operating performance at the property level . NOI presented by us may not be comparable to NOI reported by other REITs that define NOI differently . We believe that in order to facilitate a clear understanding of our operating results, NOI should be examined in conjunction with net income (loss) as presented in our consolidated financial statements . NOI should not be considered as an alternative to net income (loss) as an indication of our performance or to cash flows as a measure of our liquidity . • Cash NOI, is a non - GAAP financial measure that is intended to reflect the performance of our properties . We define Cash NOI as net operating income (which is separately defined herein) excluding amortization of above/below market lease intangibles and straight - line adjustments that are included in GAAP lease revenues . We believe that Cash NOI is a helpful measure that both investors and management can use to evaluate the current financial performance of our properties and it allows for comparison of our operating performance between periods and to other REITs . Cash NOI should not be considered as an alternative to net income, as an indication of our financial performance, or to cash flows as a measure of liquidity or our ability to fund all needs . The method by which we calculate and present Cash NOI may not be directly comparable to the way other REITs present Cash NOI .
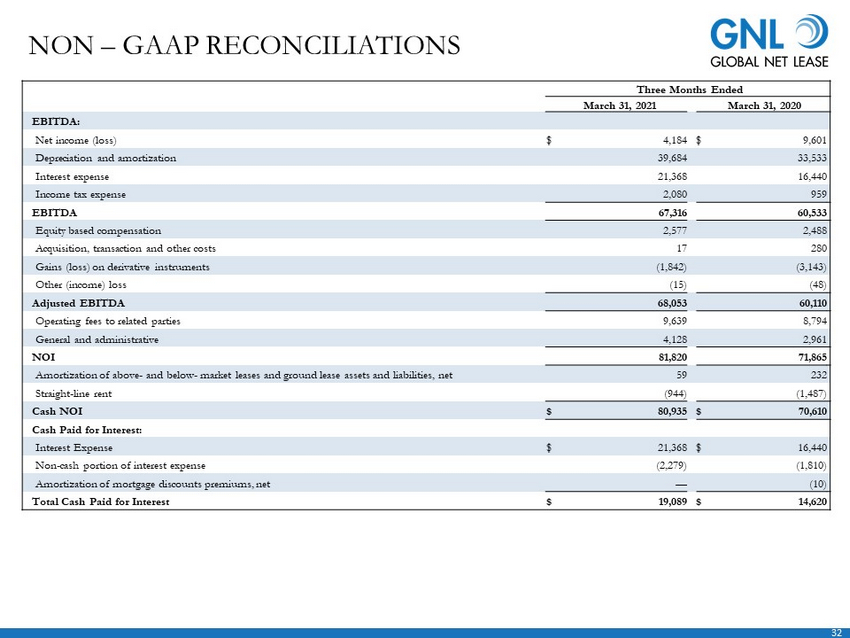
32 NON – GAAP RECONCILIATIONS Three Months Ended March 31, 2021 March 31, 2020 EBITDA: Net income (loss) $ 4,184 $ 9,601 Depreciation and amortization 39,684 33,533 Interest expense 21,368 16,440 Income tax expense 2,080 959 EBITDA 67,316 60,533 Equity based compensation 2,577 2,488 Acquisition, transaction and other costs 17 280 Gains (loss) on derivative instruments (1,842) (3,143) Other (income) loss (15) (48) Adjusted EBITDA 68,053 60,110 Operating fees to related parties 9,639 8,794 General and administrative 4,128 2,961 NOI 81,820 71,865 Amortization of above - and below - market leases and ground lease assets and liabilities, net 59 232 Straight - line rent (944) (1,487) Cash NOI $ 80,935 $ 70,610 Cash Paid for Interest: Interest Expense $ 21,368 $ 16,440 Non - cash portion of interest expense (2,279) (1,810) Amortization of mortgage discounts premiums, net — (10) Total Cash Paid for Interest $ 19,089 $ 14,620
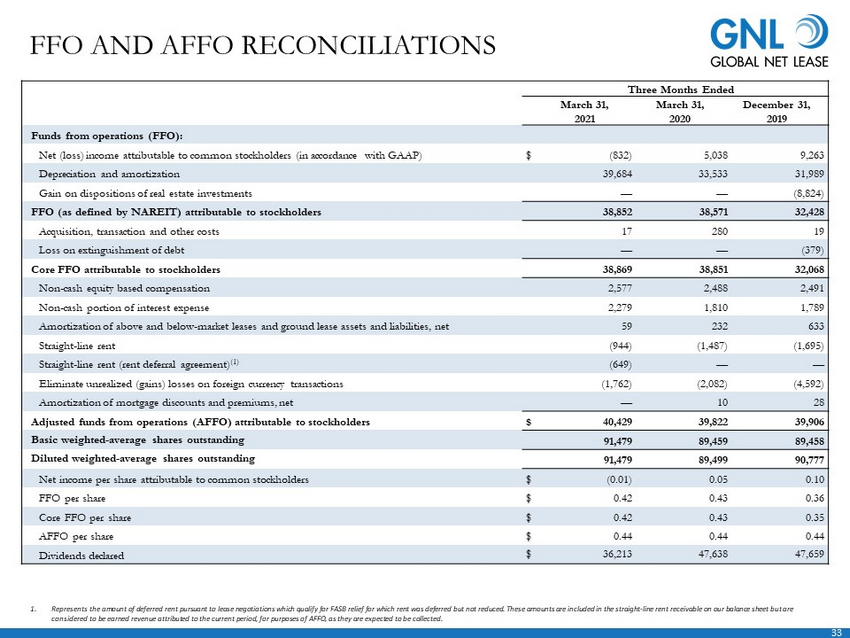
33 FFO AND AFFO RECONCILIATIONS Three Months Ended March 31, 2021 March 31, 2020 December 31, 2019 Funds from operations (FFO): Net (loss) income attributable to common stockholders (in accordance with GAAP) $ (832) 5,038 9,263 Depreciation and amortization 39,684 33,533 31,989 Gain on dispositions of real estate investments — — (8,824) FFO (as defined by NAREIT) attributable to stockholders 38,852 38,571 32,428 Acquisition, transaction and other costs 17 280 19 Loss on extinguishment of debt — — (379) Core FFO attributable to stockholders 38,869 38,851 32,068 Non - cash equity based compensation 2,577 2,488 2,491 Non - cash portion of interest expense 2,279 1,810 1,789 Amortization of above and below - market leases and ground lease assets and liabilities, net 59 232 633 Straight - line rent (944) (1,487) (1,695) Straight - line rent (rent deferral agreement) (1) (649) — — Eliminate unrealized (gains) losses on foreign currency transactions (1,762) (2,082) (4,592) Amortization of mortgage discounts and premiums, net — 10 28 Adjusted funds from operations (AFFO) attributable to stockholders $ 40,429 39,822 39,906 Basic weighted - average shares outstanding 91,479 89,459 89,458 Diluted weighted - average shares outstanding 91,479 89,499 90,777 Net income per share attributable to common stockholders $ (0.01) 0.05 0.10 FFO per share $ 0.42 0.43 0.36 Core FFO per share $ 0.42 0.43 0.35 AFFO per share $ 0.44 0.44 0.44 Dividends declared $ 36,213 47,638 47,659 1. Represents the amount of deferred rent pursuant to lease negotiations which qualify for FASB relief for which rent was deferr ed but not reduced. These amounts are included in the straight - line rent receivable on our balance sheet but are considered to be earned revenue attributed to the current period, for purposes of AFFO, as they are expected to be collected.

34 ANNUAL FFO AND AFFO RECONCILIATIONS Twelve Months Ended December 31, 2017 December 31, 2018 December 31, 2019 December 31, 2020 Funds from operations (FFO): Net income (loss) attributable to common stockholders (in accordance with GAAP) $ 20,731 1,082 34,535 (7,775) Impairment charges — 5,000 6,375 — Depreciation and amortization 113,048 119,582 125,996 138,543 Gain (loss) on dispositions of real estate investments (1,089) — (23,616) (153) Proportionate share of adjustments for non - controlling interest to arrive at FFO (78) — — — FFO (as defined by NAREIT) attributable to stockholders 132,612 131,415 143,290 130,921 Acquisition, transaction and other costs 1,979 13,850 1,320 663 Loss on extinguishment of debt — 3,897 949 3,601 Fire (recovery) loss 45 (50) — — Proportionate share of adjustments for non - controlling interest to arrive at Core FFO (1) — — — Core FFO attributable to stockholders 134,635 149,112 145,559 135,185 Non - cash equity based compensation (3,787) 2,649 9,530 10,065 Non - cash portion of interest expense 4,420 5,193 6,614 7,809 Amortization of above and below - market leases and ground lease assets and liabilities, net 1,930 2,130 1,655 791 Straight - line rent (10,537) (6,310) (6,758) (7,937) Straight - line rent (rent deferral agreement) (1) — — — 1,808 Realized losses on investment securities — — — — Unrealized (income) loss on undesignated foreign currency advances and other hedge ineffectiveness 3,679 434 (76) 6,039 Eliminate unrealized (gains) losses on foreign currency transactions 10,182 (7,127) 2,919 6,752 Amortization of mortgage discounts and premiums, net 827 1,249 260 13 Deferred tax benefit (693) — — — Proportionate share of adjustments for non - controlling interest to arrive at AFFO (4) — — — Adjusted funds from operations (AFFO) attributable to stockholders $ 140,652 147,330 159,703 160,525 Basic weighted - average shares outstanding 66,878 69,411 85,031 89,483 Diluted weighted - average shares outstanding 66,878 69,663 86,350 89,483 Net income (loss) per share attributable to common stockholders $ 0.31 0.01 0.39 (0.09) FFO per share $ 1.98 1.89 1.66 1.46 Core FFO per share $ 2.01 2.14 1.69 1.51 AFFO per share $ 2.10 2.11 1.85 1.79 Dividends declared $ 142,592 157,841 162,048 155,086 1. Represents the amount of deferred rent pursuant to lease negotiations which qualify for FASB relief for which rent was deferr ed but not reduced. These amounts are included in the straight - line rent receivable on our balance sheet but are considered to be earned revenue attributed to the current period, for purposes of AFFO, as they are expected to be collected.
Serious News for Serious Traders! Try StreetInsider.com Premium Free!
You May Also Be Interested In
- Global Net Lease Announces $462 Million of Dispositions Closed or Under Agreement¹ as Part of Strategic Disposition Plan
- NV Gold Announces Secured Loan Terms
- Vaxxinity Issues Shareholder Letter
Create E-mail Alert Related Categories
SEC FilingsSign up for StreetInsider Free!
Receive full access to all new and archived articles, unlimited portfolio tracking, e-mail alerts, custom newswires and RSS feeds - and more!
