

Form 8-K Freshpet, Inc. For: Aug 08
 Tweet
Tweet Share
Share|
|
|
|
|
(State or Other Jurisdiction
of Incorporation)
|
(Commission File Number)
|
(IRS Employer
Identification No.)
|
|
|
|
|
|
(Address of Principal Executive Offices)
|
(Zip Code)
|
|
|
Written communications pursuant to Rule 425 under the Securities Act (17 CFR 230.425)
|
|
|
Soliciting material pursuant to Rule 14a-12 under the Exchange Act (17 CFR 240.14a-12)
|
|
|
Pre-commencement communications pursuant to Rule 14d-2(b) under the Exchange Act (17 CFR 240.14d-2(b))
|
|
|
Pre-commencement communications pursuant to Rule 13e-4(c) under the Exchange Act (17 CFR 240.13e-4(c))
|
|
Title of each class
|
Trading Symbol(s)
|
Name of each exchange on which registered
|
|
|
|
|
|
Exhibit
Number
|
Description
|
|
|
99.1
|
||
|
99.2
|
||
|
104
|
Cover Page Interactive Data File (embedded within the Inline XBRL document).
|
|
FRESHPET, INC.
|
||||||
|
Date: August 8, 2022
|
By:
|
/s/ Heather Pomerantz
|
||||
|
Name: Heather Pomerantz
|
||||||
|
Title: Chief Financial Officer
|
||||||
Exhibit 99.1

Freshpet, Inc. Reports Second Quarter 2022 Financial Results
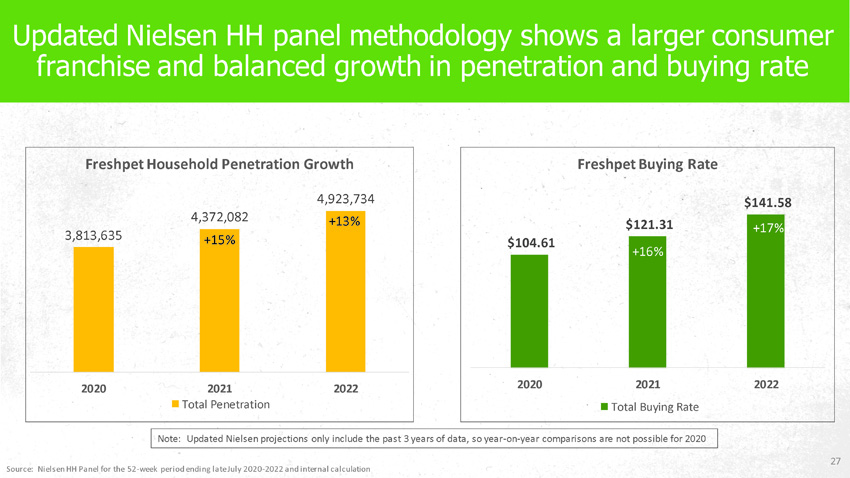
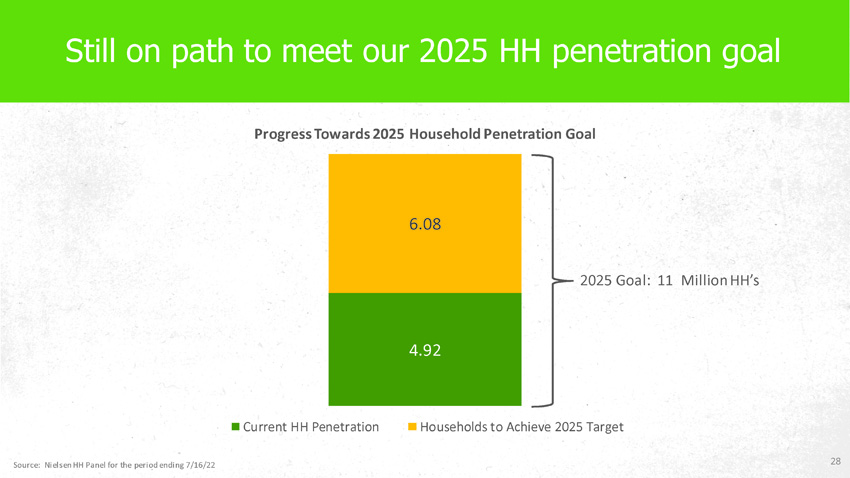
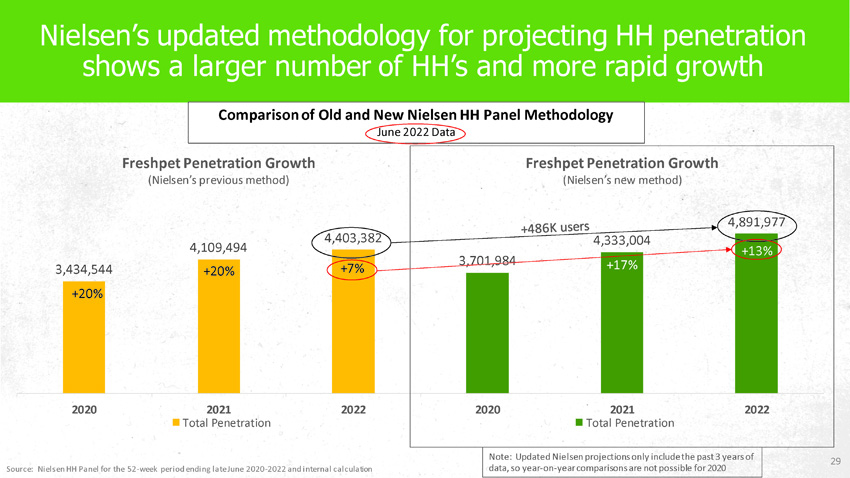
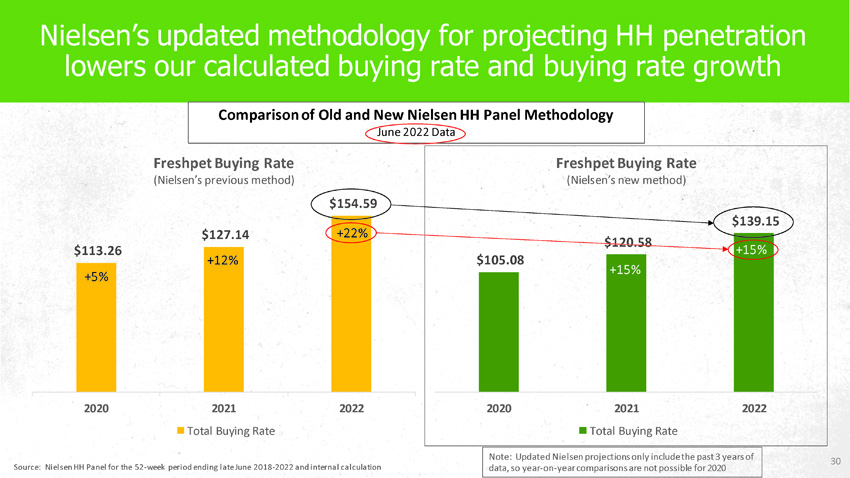
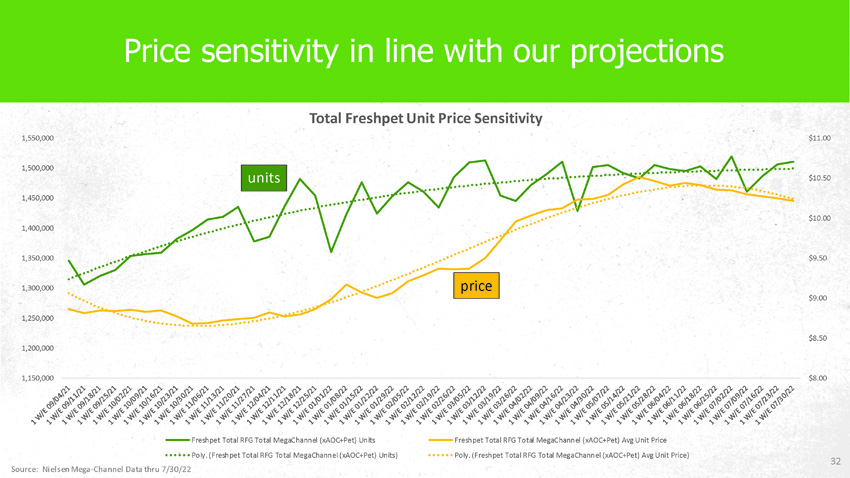
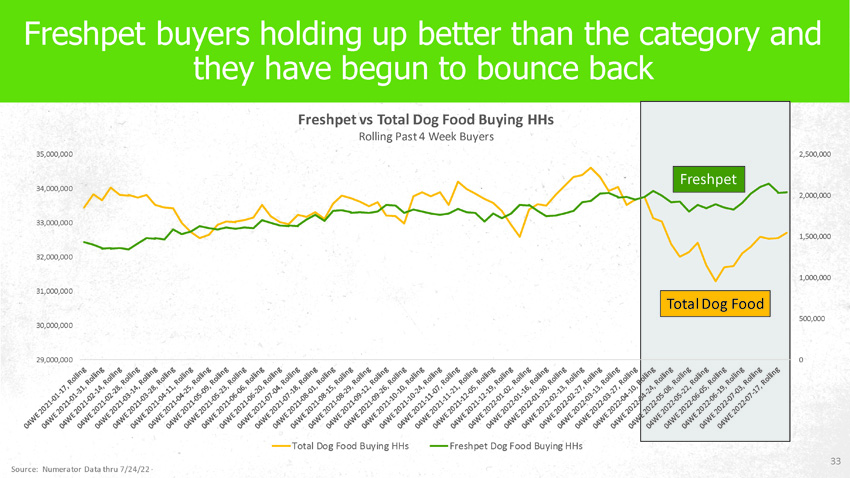
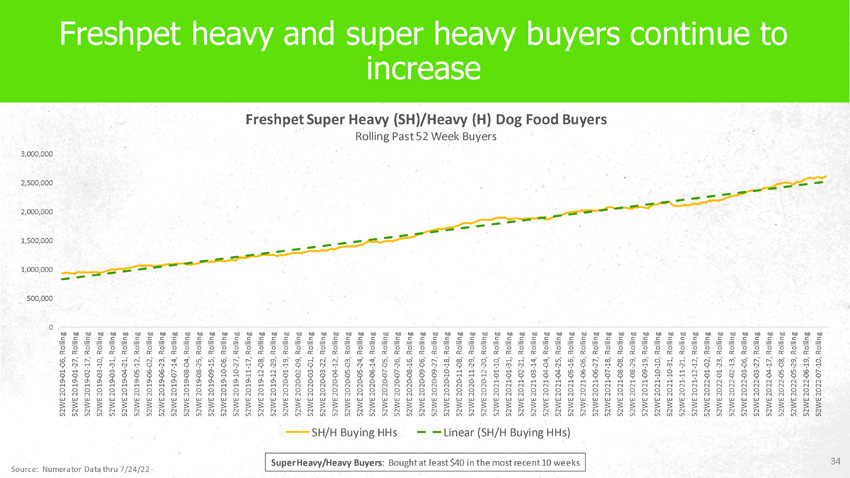
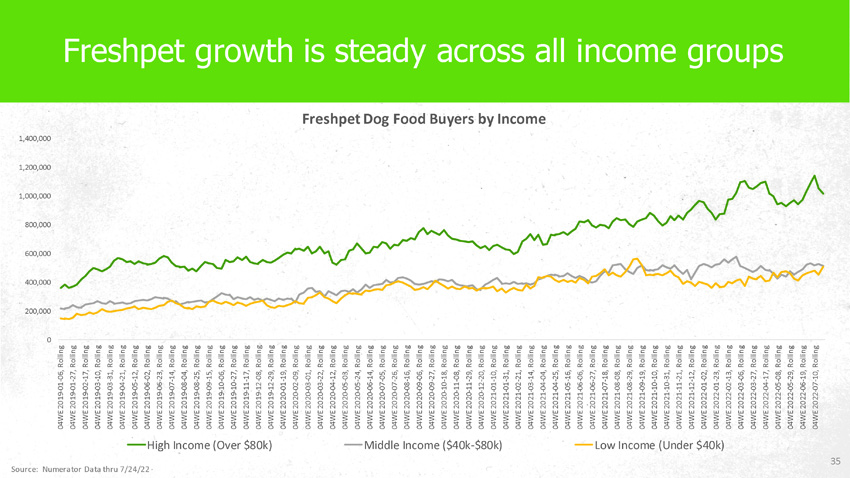
Strong Topline and Household Penetration Growth Despite Higher Pricing
Revises Adjusted EBITDA Guidance to Reflect Inflation and Quality Issue
Refines CAPEX forecast to reflect new efficiencies
SECAUCUS, N.J. – August 8, 2022 – Freshpet, Inc. (“Freshpet” or the “Company”) (Nasdaq: FRPT) today reported financial results for its second quarter ended June 30, 2022.
Second Quarter 2022 Financial Highlights Compared to Prior Year Period
|
● |
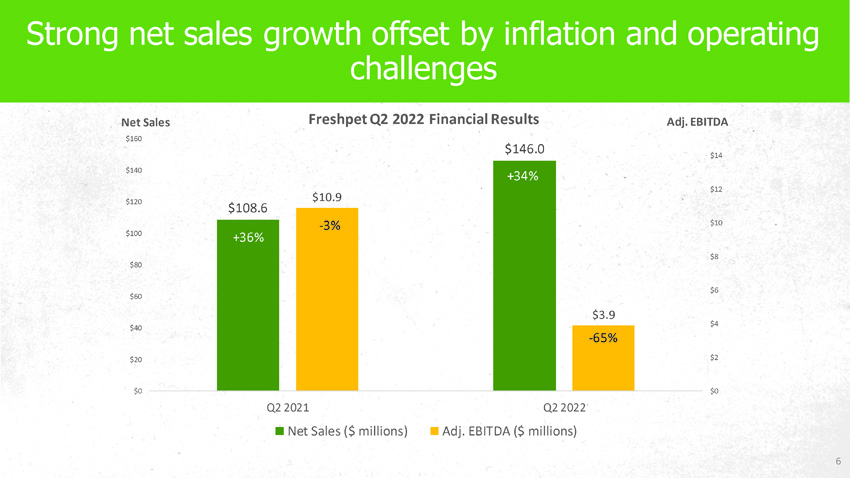
Net sales of $146.0 million, an increase of 34.4% |
|
● |
Net loss of $20.6 million, compared with prior year net loss of $7.5 million |
|
● |
Adjusted EBITDA of $3.9 million, compared to prior year of $10.9 million 1 |
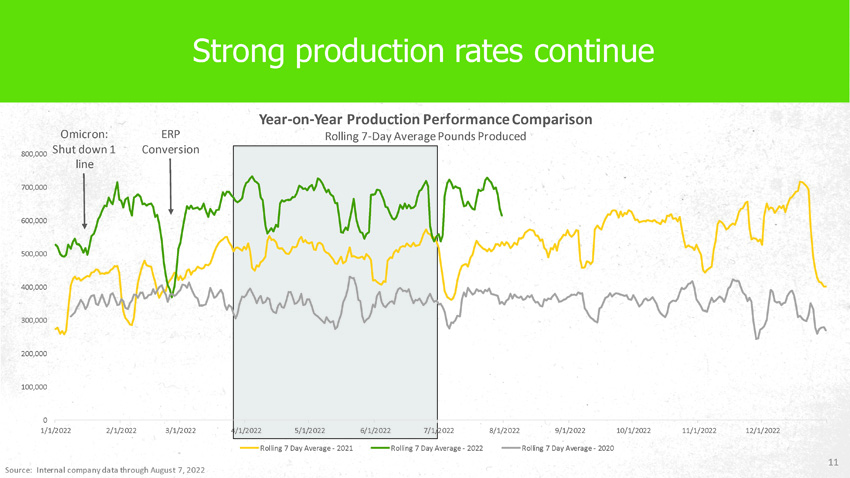
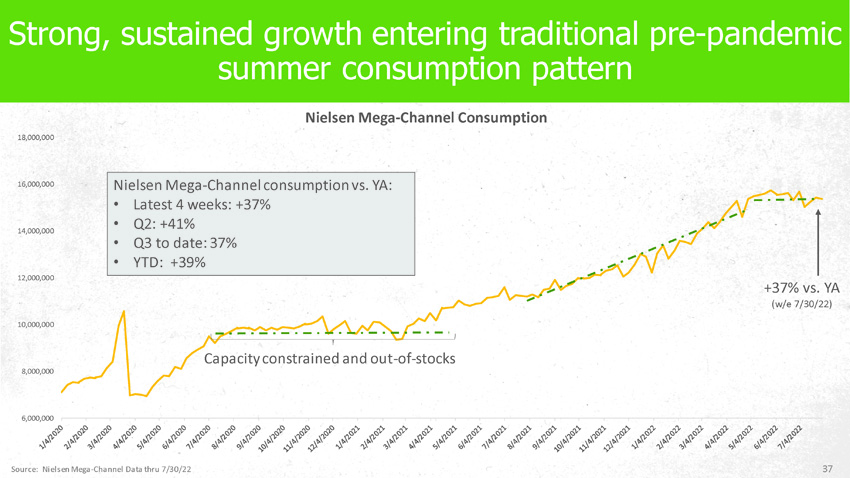
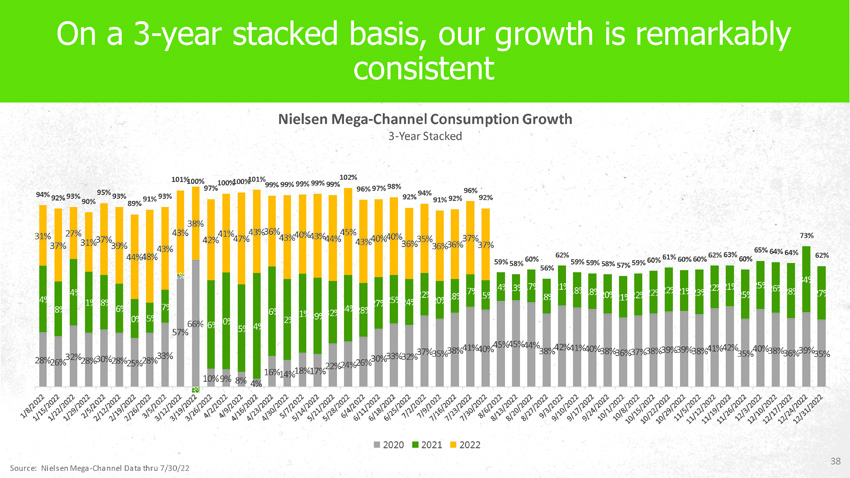
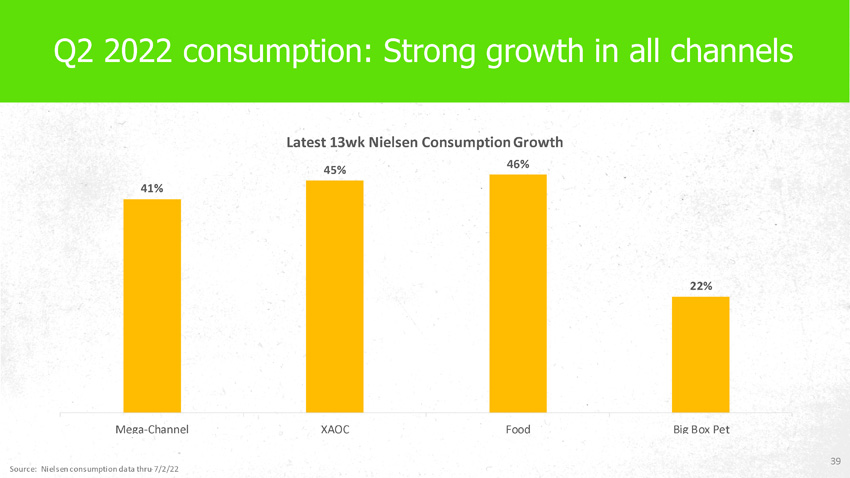
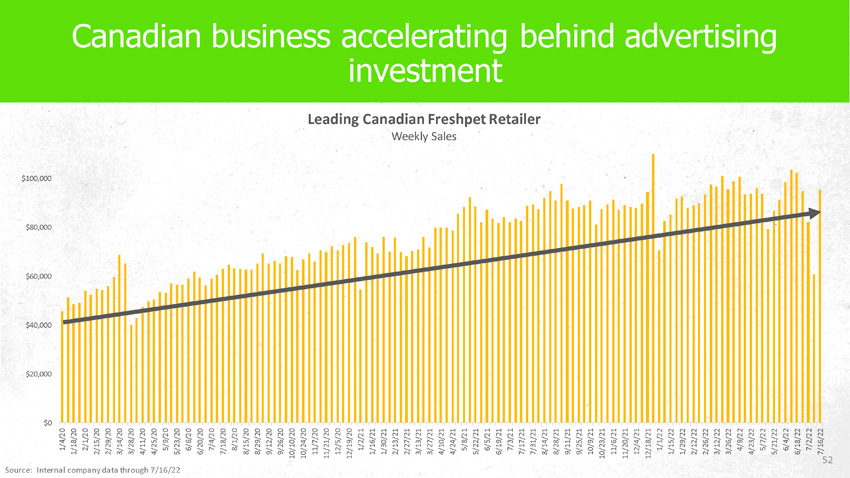
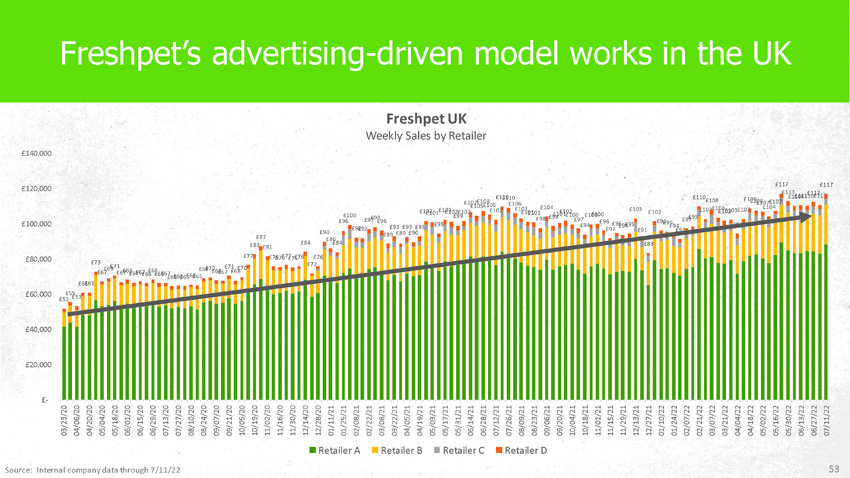
"We made solid progress on our most important long-term value drivers in the second quarter, despite external challenges such as inflation and some short-term internal challenges with our operations," commented Billy Cyr, Freshpet's Chief Executive Officer. "We are encouraged by our strong consumption growth in the face of higher pricing, the acceleration in our household penetration growth, and our strong production performance that supported it. However, the combination of inflation and short-term operating challenges negatively impacted our bottom line in the quarter, and we are reflecting those factors in our 2022 outlook. We continue to take the necessary corrective actions, such as another price increase to offset inflation, and are steadfastly committed to fixing the operational issues so that the rewards of our strong growth become more apparent."
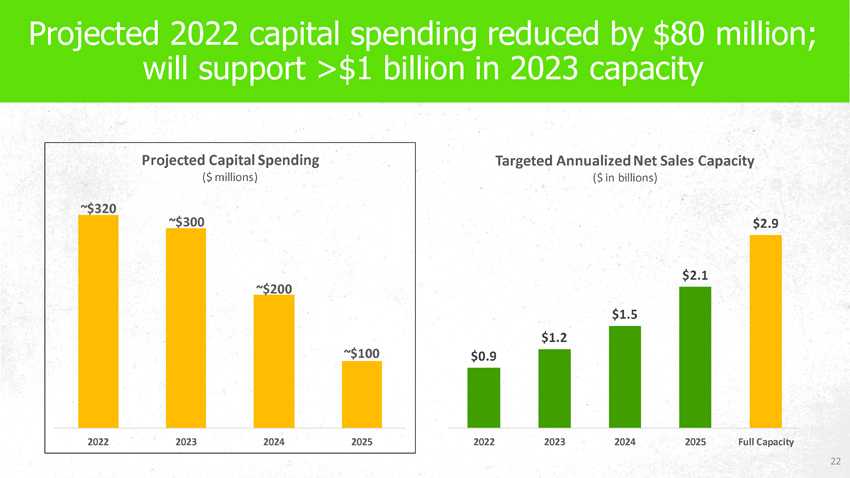
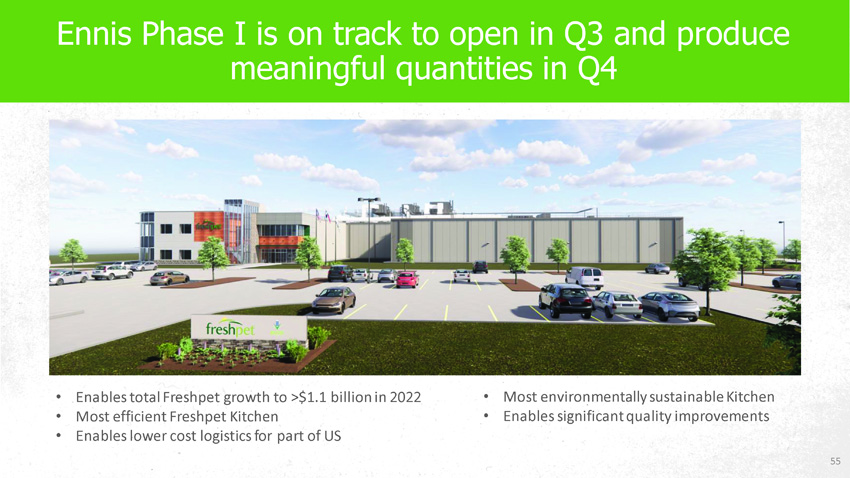
Mr. Cyr continued, "We look forward to opening our new, state-of-the art Freshpet Kitchen in Ennis, TX, next month, which — when it is fully operational — will take our total capacity over $1 billion. In connection with that, we have further refined — and reduced by $80 million — our capital spending forecast for this year with an eye on maximizing near term efficiencies while enabling us to continue driving towards our long-term growth objectives."
Second Quarter 2022
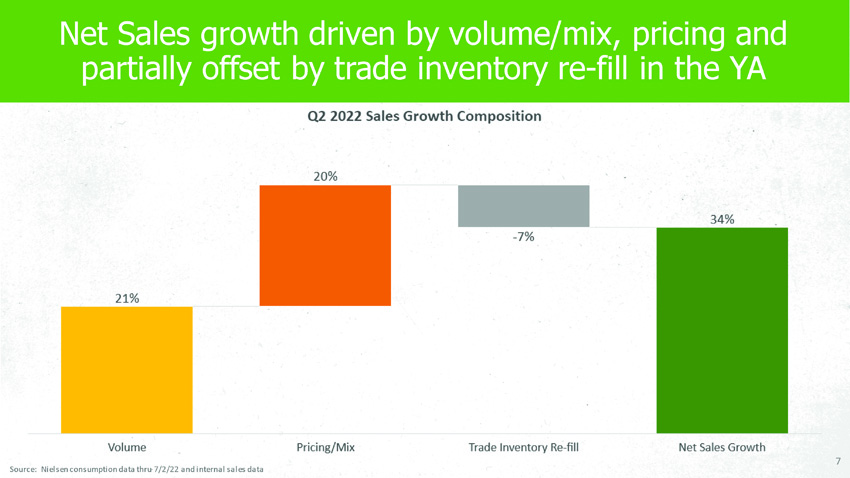
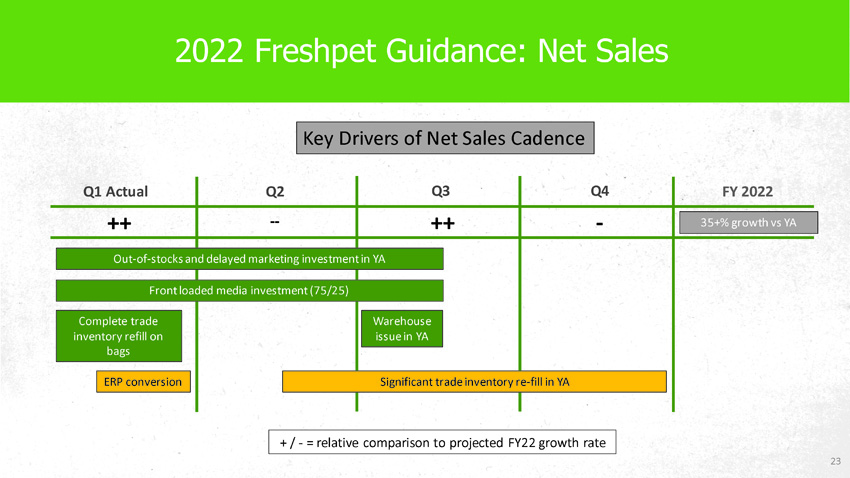
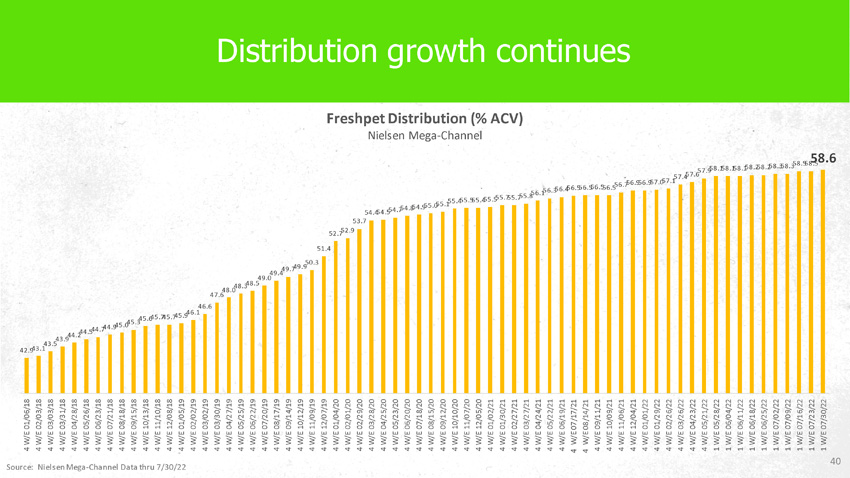
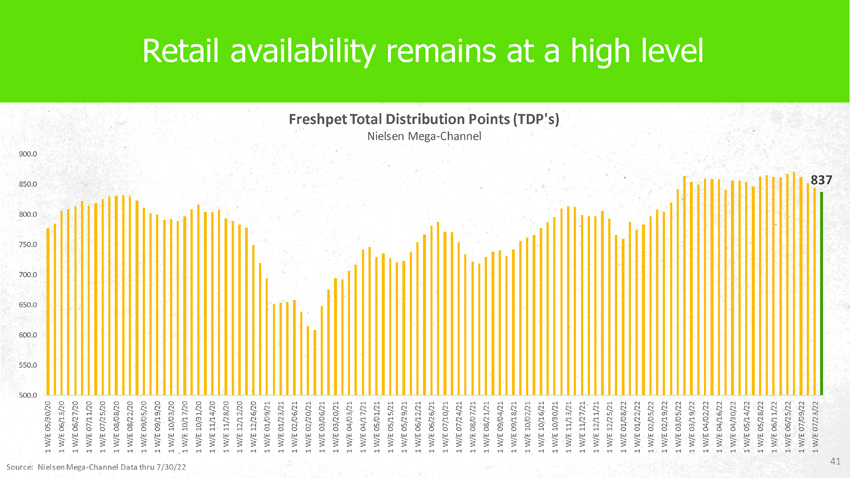
Net sales increased 34.4% to $146.0 million for the second quarter of 2022 compared to $108.6 million for the second quarter of 2021. Net sales for the second quarter of 2022 were driven by velocity, pricing, distribution gains and innovation.
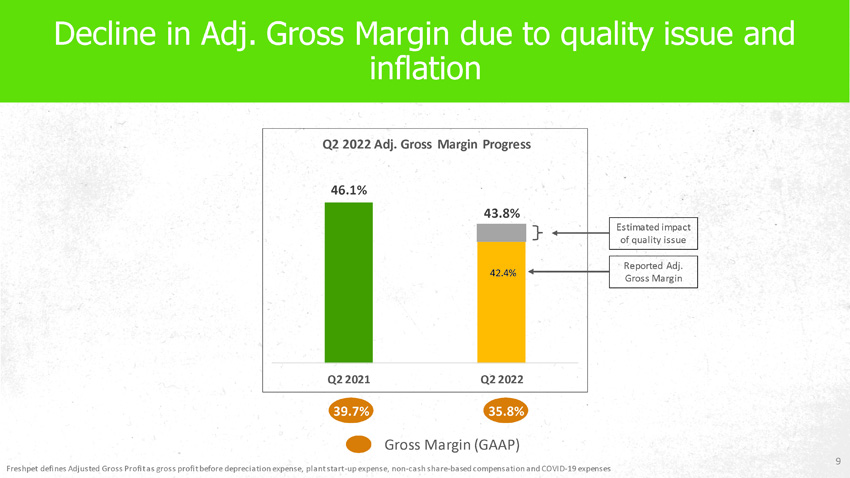
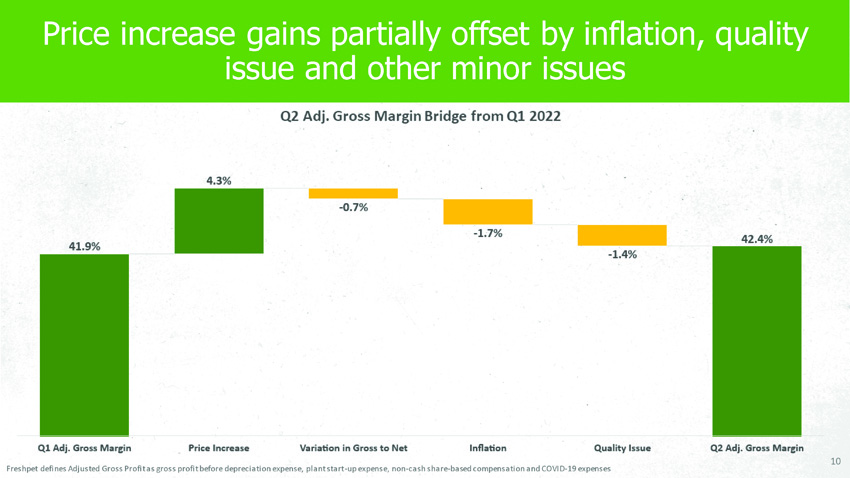
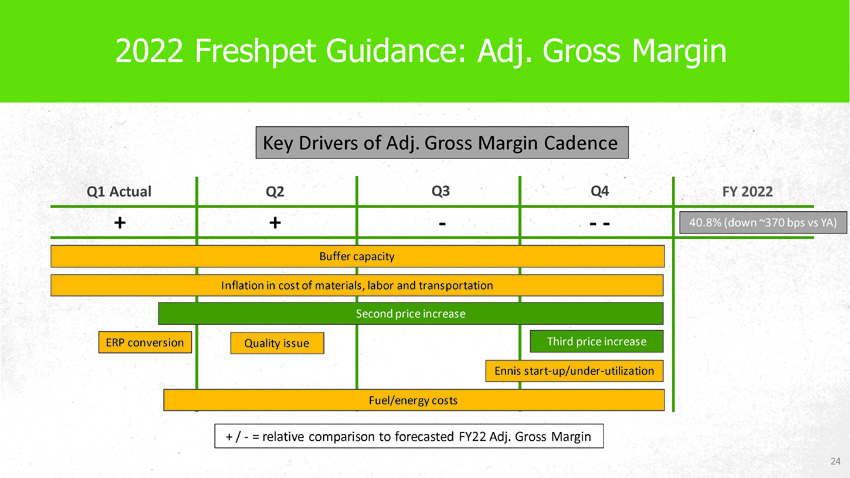
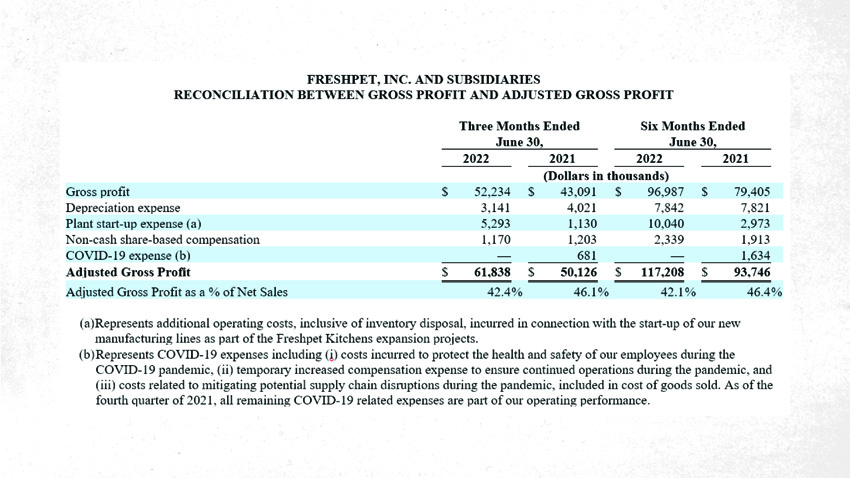
Gross profit was $52.2 million, or 35.8% as a percentage of net sales, for the second quarter of 2022, compared to $43.1 million, or 39.7% as a percentage of net sales, in the prior year period. For the second quarter of 2022, Adjusted Gross Profit was $61.8 million, or 42.4% as a percentage of net sales, compared to $50.1 million, or 46.1% as a percentage of net sales, in the prior year period. The decrease in gross profit as a percentage of net sales and Adjusted Gross Profit as a percentage of net sales was primarily due to inflation of ingredient cost and labor, and quality issues, partially offset by increased pricing. Adjusted Gross Profit is a non-GAAP financial measure defined under “Non-GAAP Measures” and is reconciled to gross profit in the financial tables that accompany this release.
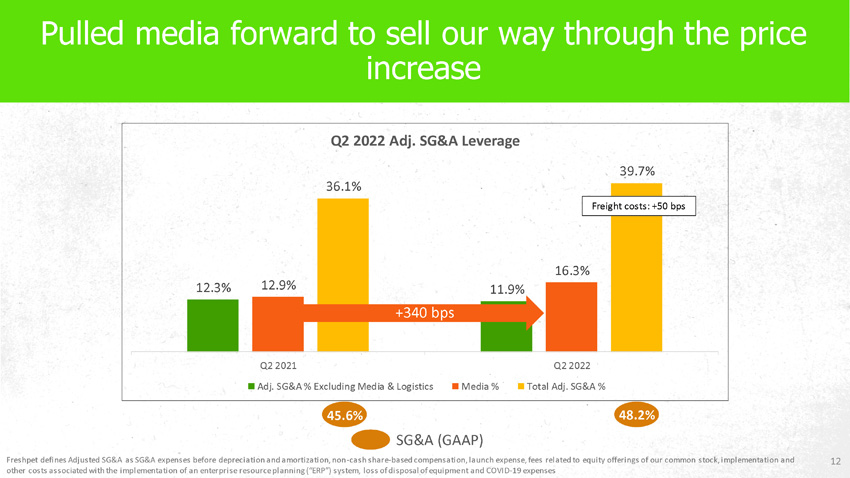
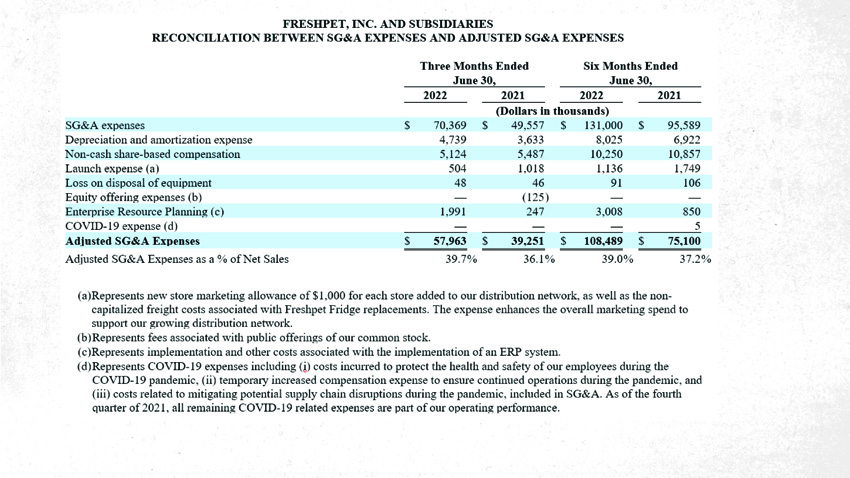
Selling, general and administrative expenses (“SG&A”) were $70.4 million for the second quarter of 2022 compared to $49.6 million in the prior year period. As a percentage of net sales, SG&A increased to 48.2% for the second quarter of 2022 compared to 45.6% in the prior year period. The increase in SG&A as a percentage of net sales was a result of increased media spend as a percentage of net sales of 350 basis points, offset by increased selling, general and administrative expense leverage of 90 basis points due to higher net sales. Adjusted SG&A for the second quarter of 2022 was $58.0 million, or 39.7% as a percentage of net sales, compared to $39.3 million, or 36.1% as a percentage of net sales, in the prior year period. The increase in Adjusted SG&A as a percentage of net sales was mainly a result of increased media spend as a percentage of net sales of 350 basis points. Adjusted SG&A is a non-GAAP financial measure defined under “Non-GAAP Measures” and is reconciled to SG&A in the financial tables that accompany this release.
Net loss was $20.6 million for the second quarter of 2022 compared to net loss of $7.5 million for the prior year period. The increase in net loss was due to increased SG&A, which includes increased media spend of $9.9 million, partially offset by higher net sales and increased gross profit.
1 Adjusted EBITDA, as well as certain other measures in this release, is a non-GAAP financial measure. See "Non-GAAP Measures" for how we define these measures and the financial tables that accompany this release for reconciliations of these measures to the closest comparable GAAP measures.
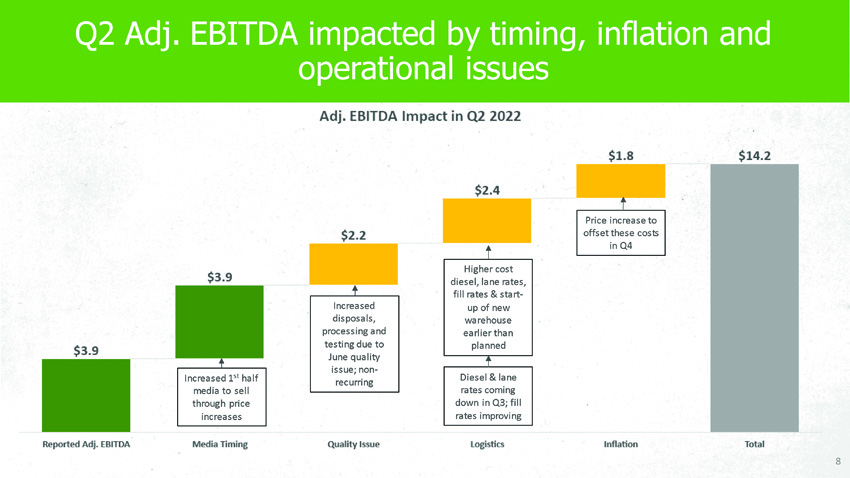
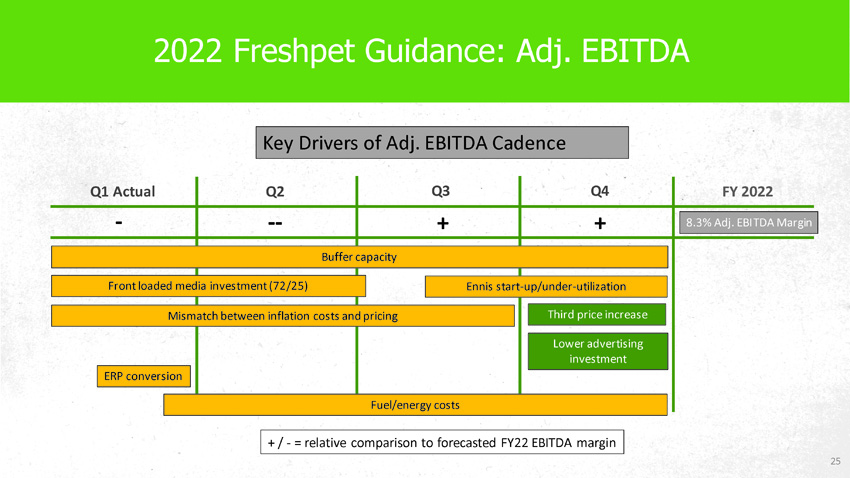
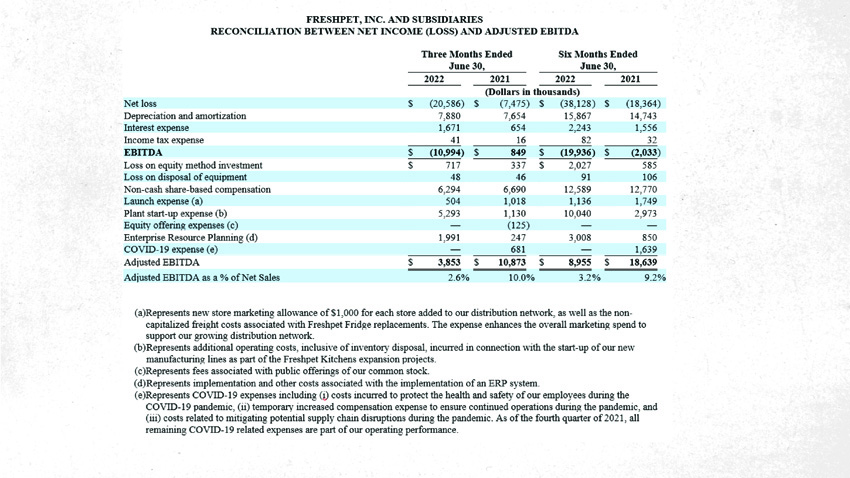
Adjusted EBITDA was $3.9 million, or 2.6% as a percentage of net sales, for the second quarter of 2022, compared to $10.9 million, or 10.0% as a percentage of net sales, in the prior year period. The decrease in Adjusted EBITDA was a result of increased Adjusted SG&A expense partially offset by higher net sales and Adjusted Gross Profit. Adjusted EBITDA is a non-GAAP financial measure defined under “Non-GAAP Measures” and is reconciled to net loss in the financial tables that accompany this release.
First Six Months of 2022
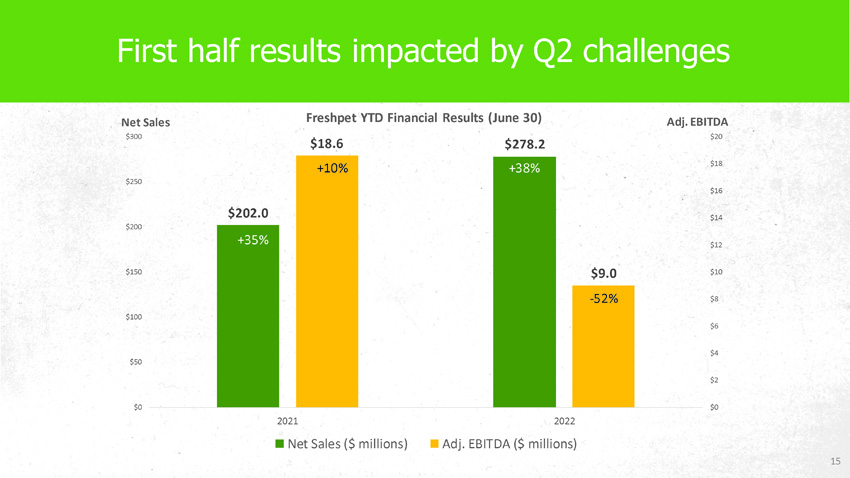
Net sales increased 37.7% to $278.2 million for the first six months of 2022 compared to $202.0 million for the first six months of 2021. Net sales for the first six months of 2022 were driven by velocity, pricing, distribution gains and innovation.
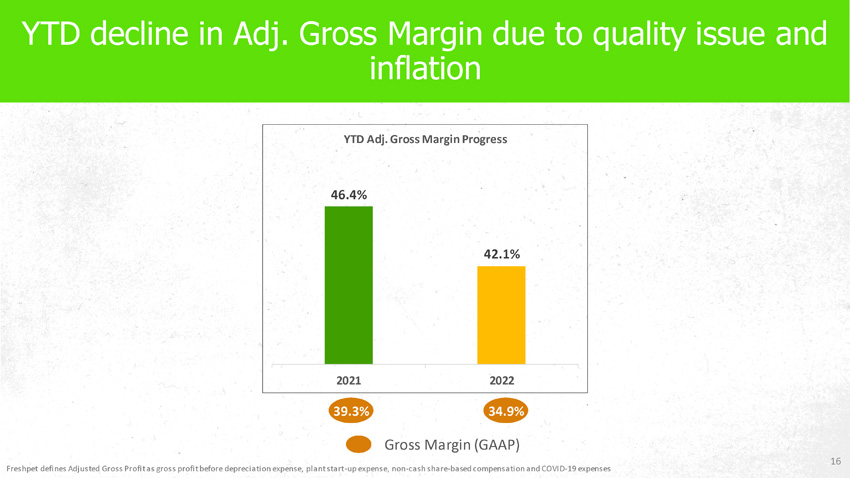
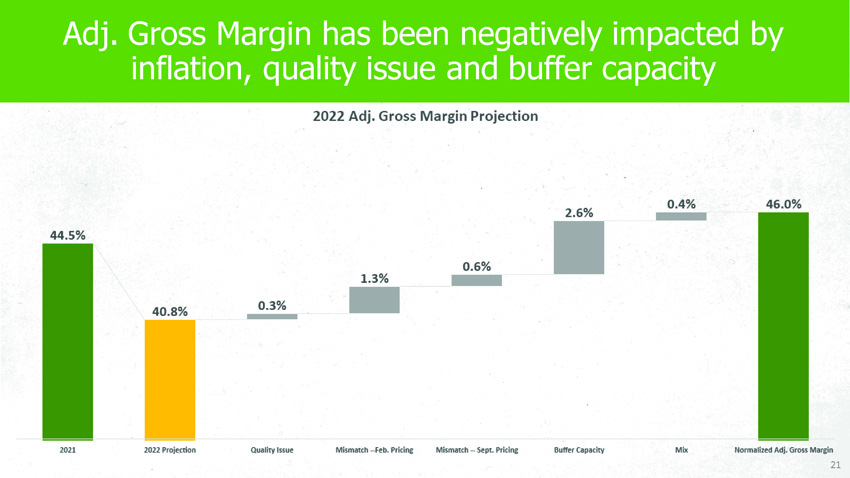
Gross profit was $97.0 million, or 34.9% as a percentage of net sales, for the first six months of 2022, compared to $79.4 million, or 39.3% as a percentage of net sales, in the prior year period. For the first six months of 2022, Adjusted Gross Profit was $117.2 million, or 42.1% as a percentage of net sales, compared to $93.7 million, or 46.4% as a percentage of net sales, in the prior year period. The decrease in gross profit as a percentage of net sales and Adjusted Gross Profit as a percentage of net sales was primarily due to inflation of ingredient cost and labor, and quality issues, partially offset by increased pricing. Adjusted Gross Profit is a non-GAAP financial measure defined under “Non-GAAP Measures” and is reconciled to gross profit in the financial tables that accompany this release.
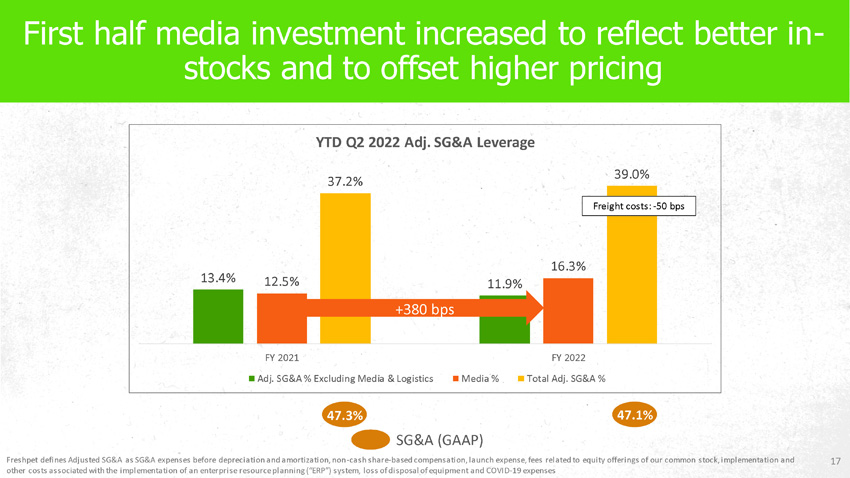
Selling, general and administrative expenses (“SG&A”) were $131.0 million for the first six months of 2022 compared to $95.6 million in the prior year period. As a percentage of net sales, SG&A decreased to 47.1% for the first six months of 2022 compared to 47.3% in the prior year period. The decrease in SG&A as a percentage of net sales was a result of increased selling, general and administrative expense leverage of 400 basis points due to higher net sales, partially offset by increased media as a percentage of net sales of 380 basis points. Adjusted SG&A for the first six months of 2022 was $108.6 million, or 39.0% as a percentage of net sales, compared to $75.1 million, or 37.2% as a percentage of net sales, in the prior year period. The increase in Adjusted SG&A as a percentage of net sales was a result of increased media as a percentage of net sales of 380 basis points offset by increased selling, general and administrative expense leverage of 200 basis points due to higher net sales. Adjusted SG&A is a non-GAAP financial measure defined under “Non-GAAP Measures” and is reconciled to SG&A in the financial tables that accompany this release.
Net loss was $38.1 million for the first six months of 2022 compared to net loss of $18.4 million for the prior year period. The increase in net loss was due to increased SG&A, partially offset by higher net sales and increased gross profit.
Adjusted EBITDA was $9.0 million, or 3.2% as a percentage of net sales, for the first six months of 2022, compared to $18.6 million, or 9.2% as a percentage of net sales, in the prior year period. The decrease in Adjusted EBITDA was a result of increased Adjusted SG&A expense partially offset by higher net sales and Adjusted Gross Profit. Adjusted EBITDA is a non-GAAP financial measure defined under “Non-GAAP Measures” and is reconciled to net loss in the financial tables that accompany this release.
Balance Sheet
As of June 30, 2022, the Company had cash and cash equivalents of $307.3 million with $78.0 million of debt outstanding.
Outlook
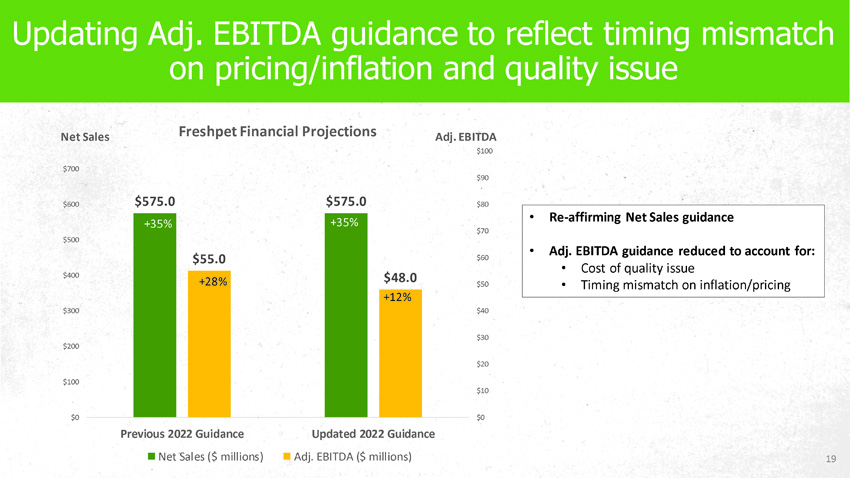
For full year 2022, the Company updated its Adj. EBITDA guidance. The Company now expects the following results:
|
● |
Net sales of >$575 million, an increase of ~35% from 2021 |
|
● |
Adjusted EBITDA of >$48 million, an increase of ~12% from 2021 |
|
● |
Capital expenditures of approximately $320 million, reflecting a reduction of approximately $80 million versus prior forecast |
The Company does not provide guidance for the most directly comparable GAAP measure, net income, and similarly cannot provide a reconciliation between its forecasted adjusted EBITDA and net income metrics without unreasonable effort due to the unavailability of reliable estimates for certain components of net income and the respective reconciliations, including the timing of and amount of costs of goods sold and selling, general and administrative expenses. These items are not within the Company's control and may vary greatly between periods and could significantly impact future results.
Conference Call & Earnings Presentation Webcast Information
As previously announced, today, August 8, 2022, the Company will host a conference call beginning at 4:30 p.m. Eastern Time with members of its leadership team. The conference call webcast will be available live over the Internet through the "Investors" section of the Company's website at www.freshpet.com. To participate on the live call, listeners in North America may dial (877) 407-0792 and international listeners may dial (201) 689-8263.
A replay of the conference call will be archived on the Company's website and telephonic playback will be available from 7:30 p.m. Eastern Time today through August 22, 2022. North American listeners may dial (844) 512-2921 and international listeners may dial (412) 317-6671; the passcode is 13730982.
About Freshpet
Freshpet’s mission is to improve the lives of dogs and cats through the power of fresh, real food. Freshpet foods are blends of fresh meats, vegetables and fruits farmed locally and made at our Freshpet Kitchens. We thoughtfully prepare our foods using natural ingredients, cooking them in small batches at lower temperatures to preserve the natural goodness of the ingredients. Freshpet foods and treats are kept refrigerated from the moment they are made until they arrive at Freshpet Fridges in your local market.
Our foods are available in select mass, grocery (including online), natural food, club, and pet specialty retailers across the United States, Canada and Europe. From the care, we take to source our ingredients and make our food, to the moment it reaches your home, our integrity, transparency and social responsibility are the way we like to run our business. To learn more, visit www.freshpet.com.
Connect with Freshpet:
https://www.facebook.com/Freshpet
https://twitter.com/Freshpet
http://instagram.com/Freshpet
http://pinterest.com/Freshpet
https://www.tiktok.com/@Freshpet
https://en.wikipedia.org/wiki/Freshpet
https://www.youtube.com/user/freshpet400
Forward Looking Statements
Certain statements in this release constitute “forward-looking” statements, including statements relating to our long-term capacity planning, net sales guidance and Adjusted EBITDA guidance. These statements are based on management's current opinions, expectations, beliefs, plans, objectives, assumptions or projections regarding future events or future results. These forward-looking statements, including our updated guidance, are only predictions, not historical fact, and involve certain risks and uncertainties, as well as assumptions. Actual results, levels of activity, performance, achievements and events could differ materially from those stated, anticipated or implied by such forward-looking statements. While Freshpet believes that its assumptions are reasonable, it is very difficult to predict the impact of known factors, and, of course, it is impossible to anticipate all factors that could affect actual results. There are several risks and uncertainties that could cause actual results to differ materially from forward-looking statements made herein including, most prominently, the risks discussed under the heading “Risk Factors” in the Company's latest annual report on Form 10-K and its quarterly reports on Form 10-Q filed with the Securities and Exchange Commission. Such forward-looking statements are made only as of the date of this release. Freshpet undertakes no obligation to publicly update or revise any forward-looking statement because of new information, future events or otherwise, except as otherwise required by law. If we do update one or more forward-looking statements, no inference should be made that we will make additional updates with respect to those or other forward-looking statements.
Non-GAAP Financial Measures
Freshpet uses the following non-GAAP financial measures in its financial communications. These non-GAAP financial measures should be considered as supplements to the GAAP reported measures, should not be considered replacements for, or superior to, the GAAP measures and may not be comparable to similarly named measures used by other companies.
|
● |
Adjusted Gross Profit |
|
● |
Adjusted Gross Profit as a % of net sales (Adjusted Gross Margin) |
|
● |
Adjusted SG&A |
|
● |
Adjusted SG&A as a % of net sales |
|
● |
EBITDA |
|
● |
Adjusted EBITDA |
|
● |
Adjusted EBITDA as a % of net sales |
Adjusted Gross Profit: Freshpet defines Adjusted Gross Profit as gross profit before depreciation expense, plant start-up expense, non-cash share-based compensation and COVID-19 expenses.
Adjusted SG&A Expenses: Freshpet defines Adjusted SG&A as SG&A expenses before depreciation and amortization, non-cash share-based compensation, launch expense, fees related to equity offerings of our common stock, implementation and other costs associated with the implementation of an enterprise resource planning ("ERP") system, loss on disposal of equipment and COVID-19 expenses.
EBITDA and Adjusted EBITDA: EBITDA represents net income (loss) plus interest expense, income tax expense and depreciation and amortization expense, and Adjusted EBITDA represents EBITDA plus loss on equity method investment, non-cash share-based compensation expense, launch expenses, fees related to equity offerings, plant start-up expense, implementation and other costs associated with the implementation of an ERP system, loss on disposal of equipment and COVID-19 expenses. Beginning with the period ending September 30, 2022, we anticipate no longer adding back launch expenses and plant start-up expense in our calculation of Adjusted EBITDA. This change is part of a renewed focus on capital efficiency, that will provide greater clarity on our path toward generating positive net income as the business scales further following our planned capacity additions.
Management believes that the non-GAAP financial measures are meaningful to investors because they provide a view of the Company with respect to ongoing operating results. The non-GAAP financial measures are shown as supplemental disclosures in this release because they are widely used by the investment community for analysis and comparative evaluation. They also provide additional metrics to evaluate the Company’s operations and, when considered with both the Company’s GAAP results and the reconciliation to the most comparable GAAP measures, provide a more complete understanding of the Company’s business than could be obtained absent this disclosure. The non-GAAP measures are not and should not be considered an alternative to the most comparable GAAP measures or any other figure calculated in accordance with GAAP, or as an indicator of operating performance. The Company’s calculation of the non-GAAP financial measures may differ from methods used by other companies. Management believes that the non-GAAP measures are important to an understanding of the Company's overall operating results in the periods presented. The non-GAAP financial measures are not recognized in accordance with GAAP and should not be viewed as an alternative to GAAP measures of performance.
Contact
ICR
Jeff Sonnek
646-277-1263
FRESHPET, INC. AND SUBSIDIARIES
CONSOLIDATED BALANCE SHEETS
(In thousands, except per share data)
|
June 30, |
December 31, |
|||||||
|
2022 |
2021 |
|||||||
|
ASSETS |
||||||||
|
CURRENT ASSETS: |
||||||||
|
Cash and cash equivalents |
$ | 307,345 | $ | 72,788 | ||||
|
Short-term investments |
19,840 | — | ||||||
|
Accounts receivable, net of allowance for doubtful accounts |
62,090 | 34,780 | ||||||
|
Inventories, net |
60,679 | 35,574 | ||||||
|
Prepaid expenses |
2,547 | 5,834 | ||||||
|
Other current assets |
2,220 | 1,349 | ||||||
|
Total Current Assets |
454,721 | 150,325 | ||||||
|
Property, plant and equipment, net |
662,527 | 583,922 | ||||||
|
Deposits on equipment |
1,084 | 4,100 | ||||||
|
Operating lease right of use assets |
5,862 | 6,537 | ||||||
|
Equity method investment |
27,123 | 25,856 | ||||||
|
Other assets |
22,197 | 13,670 | ||||||
|
Total Assets |
$ | 1,173,514 | $ | 784,410 | ||||
|
LIABILITIES AND STOCKHOLDERS' EQUITY |
||||||||
|
CURRENT LIABILITIES: |
||||||||
|
Accounts payable |
$ | 39,507 | $ | 42,612 | ||||
|
Accrued expenses |
19,437 | 14,950 | ||||||
|
Current operating lease liabilities |
1,446 | 1,384 | ||||||
|
Current portion of long-term debt |
10,449 | - | ||||||
|
Total Current Liabilities |
$ | 70,839 | $ | 58,946 | ||||
|
Long term debt |
65,036 | — | ||||||
|
Long term operating lease liabilities |
4,971 | 5,710 | ||||||
|
Total Liabilities |
$ | 140,846 | $ | 64,656 | ||||
|
STOCKHOLDERS' EQUITY: |
||||||||
|
Common stock — voting, $0.001 par value, 200,000 shares authorized, 47,834 issued and 47,820 outstanding on June 30, 2022, and 43,449 issued and 43,435 outstanding on December 31, 2021 |
48 | 43 | ||||||
|
Additional paid-in capital |
1,305,260 | 955,710 | ||||||
|
Accumulated deficit |
(273,751 | ) | (235,623 | ) | ||||
|
Accumulated other comprehensive income (loss) |
1,367 | (120 | ) | |||||
|
Treasury stock, at cost — 14 shares on June 30, 2022 and on December 31, 2021 |
(256 | ) | (256 | ) | ||||
|
Total Stockholders' Equity |
1,032,668 | 719,754 | ||||||
|
Total Liabilities and Stockholders' Equity |
$ | 1,173,514 | $ | 784,410 | ||||
FRESHPET, INC. AND SUBSIDIARIES
CONSOLIDATED STATEMENTS OF OPERATIONS AND COMPREHENSIVE LOSS
(In thousands, except per share data)
|
For the Three Months Ended |
For the Six Months Ended |
|||||||||||||||
|
June 30, |
June 30, |
|||||||||||||||
|
2022 |
2021 |
2022 |
2021 |
|||||||||||||
|
NET SALES |
$ | 146,007 | $ | 108,616 | $ | 278,179 | $ | 202,029 | ||||||||
|
COST OF GOODS SOLD |
93,773 | 65,525 | 181,192 | 122,624 | ||||||||||||
|
GROSS PROFIT |
52,234 | 43,091 | 96,987 | 79,405 | ||||||||||||
|
SELLING, GENERAL, AND ADMINISTRATIVE EXPENSES |
70,369 | 49,557 | 131,000 | 95,589 | ||||||||||||
|
LOSS FROM OPERATIONS |
(18,135 | ) | (6,466 | ) | (34,013 | ) | (16,184 | ) | ||||||||
|
OTHER (EXPENSES)/INCOME: |
||||||||||||||||
|
Other (Expenses)/Income, net |
(21 | ) | (2 | ) | 237 | (7 | ) | |||||||||
|
Interest Expense |
(1,672 | ) | (654 | ) | (2,243 | ) | (1,556 | ) | ||||||||
| (1,693 | ) | (656 | ) | (2,006 | ) | (1,563 | ) | |||||||||
|
LOSS BEFORE INCOME TAXES |
(19,828 | ) | (7,122 | ) | (36,019 | ) | (17,747 | ) | ||||||||
|
INCOME TAX EXPENSE |
41 | 16 | 82 | 32 | ||||||||||||
|
LOSS ON EQUITY METHOD INVESTMENT |
717 | 337 | 2,027 | 585 | ||||||||||||
|
LOSS ATTRIBUTABLE TO COMMON STOCKHOLDERS |
$ | (20,586 | ) | $ | (7,475 | ) | $ | (38,128 | ) | $ | (18,364 | ) | ||||
|
OTHER COMPREHENSIVE (LOSS) INCOME: |
||||||||||||||||
|
Change in foreign currency translation |
$ | 1,849 | (91 | ) | $ | 1,487 | $ | 169 | ||||||||
|
TOTAL OTHER COMPREHENSIVE INCOME (LOSS) |
1,849 | (91 | ) | 1,487 | 169 | |||||||||||
|
TOTAL COMPREHENSIVE LOSS |
$ | (18,737 | ) | $ | (7,566 | ) | $ | (36,641 | ) | $ | (18,194 | ) | ||||
|
NET LOSS PER SHARE ATTRIBUTABLE TO COMMON STOCKHOLDERS |
||||||||||||||||
|
-BASIC |
$ | (0.45 | ) | $ | (0.17 | ) | $ | (0.85 | ) | $ | (0.43 | ) | ||||
|
-DILUTED |
$ | (0.45 | ) | $ | (0.17 | ) | $ | (0.85 | ) | $ | (0.43 | ) | ||||
|
WEIGHTED AVERAGE SHARES OF COMMON STOCK OUTSTANDING USED IN COMPUTING NET (LOSS) INCOME PER SHARE ATTRIBUTABLE TO COMMON STOCKHOLDERS |
||||||||||||||||
|
-BASIC |
45,636 | 43,303 | 44,691 | 42,470 | ||||||||||||
|
-DILUTED |
45,636 | 43,303 | 44,691 | 42,470 | ||||||||||||
FRESHPET, INC. AND SUBSIDIARIES
CONDENSED CONSOLIDATED STATEMENT OF CASH FLOWS
(In thousands)
|
For the Six Months Ended |
||||||||
|
June 30, |
||||||||
|
2022 |
2021 |
|||||||
|
CASH FLOWS FROM OPERATING ACTIVITIES: |
||||||||
|
Net loss |
$ | (38,128 | ) | $ | (18,364 | ) | ||
|
Adjustments to reconcile net loss to net cash flows provided by operating activities: |
||||||||
|
Provision for loss (gains) on accounts receivable |
(14 | ) | 5 | |||||
|
Loss on disposal of equipment |
89 | 106 | ||||||
|
Share-based compensation |
12,589 | 12,770 | ||||||
|
Inventory obsolescence |
3,455 | 253 | ||||||
|
Depreciation and amortization |
15,888 | 14,743 | ||||||
|
Amortization of deferred financing costs and loan discount |
398 | 815 | ||||||
|
Change in operating lease right of use asset |
675 | 661 | ||||||
|
Loss on equity method investment |
2,027 | 585 | ||||||
|
Changes in operating assets and liabilities: |
||||||||
|
Accounts receivable |
(36,268 | ) | (15,529 | ) | ||||
|
Inventories |
(28,560 | ) | (5,731 | ) | ||||
|
Prepaid expenses and other current assets |
2,416 | (1,443 | ) | |||||
|
Other assets |
(358 | ) | (2,156 | ) | ||||
|
Accounts payable |
(421 | ) | 15,494 | |||||
|
Accrued expenses |
4,487 | 1,369 | ||||||
|
Other lease liabilities |
(677 | ) | (643 | ) | ||||
|
Net cash flows used in operating activities |
(62,402 | ) | 2,935 | |||||
|
CASH FLOWS FROM INVESTING ACTIVITIES: |
||||||||
|
Purchase of short-term investments |
(19,840 | ) | — | |||||
|
Investments in equity method investment |
(3,294 | ) | — | |||||
|
Acquisitions of property, plant and equipment, software and deposits on equipment |
(94,872 | ) | (117,592 | ) | ||||
|
Net cash flows used in investing activities |
(118,006 | ) | (117,592 | ) | ||||
|
CASH FLOWS FROM FINANCING ACTIVITIES: |
||||||||
|
Proceeds from common shares issued in primary offering, net of issuance cost |
337,849 | 332,172 | ||||||
|
Proceeds from exercise of options to purchase common stock |
329 | 1,740 | ||||||
|
Tax withholdings related to net shares settlements of restricted stock units |
(1,213 | ) | (2,917 | ) | ||||
|
Proceeds from borrowings under Credit Facility |
78,000 | — | ||||||
|
Fees paid in connection with financing agreements |
— | (3,262 | ) | |||||
|
Net cash flows provided by financing activities |
414,965 | 327,733 | ||||||
|
NET CHANGE IN CASH AND CASH EQUIVALENTS |
234,557 | 213,076 | ||||||
|
CASH AND CASH EQUIVALENTS, BEGINNING OF YEAR |
72,788 | 67,247 | ||||||
|
CASH AND CASH EQUIVALENTS, END OF PERIOD |
$ | 307,345 | $ | 280,323 | ||||
FRESHPET, INC. AND SUBSIDIARIES
RECONCILIATION BETWEEN GROSS PROFIT AND ADJUSTED GROSS PROFIT
|
Three Months Ended |
Six Months Ended |
|||||||||||||||
|
June 30, |
June 30, |
|||||||||||||||
|
2022 |
2021 |
2022 |
2021 |
|||||||||||||
|
(Dollars in thousands) |
||||||||||||||||
|
Gross profit |
$ | 52,234 | $ | 43,091 | $ | 96,987 | $ | 79,405 | ||||||||
|
Depreciation expense |
3,141 | 4,021 | 7,842 | 7,821 | ||||||||||||
|
Plant start-up expense (a) |
5,293 | 1,130 | 10,040 | 2,973 | ||||||||||||
|
Non-cash share-based compensation |
1,170 | 1,203 | 2,339 | 1,913 | ||||||||||||
|
COVID-19 expense (b) |
— | 681 | — | 1,634 | ||||||||||||
|
Adjusted Gross Profit |
$ | 61,838 | $ | 50,126 | $ | 117,208 | $ | 93,746 | ||||||||
|
Adjusted Gross Profit as a % of Net Sales |
42.4 | % | 46.1 | % | 42.1 | % | 46.4 | % | ||||||||
| (a) | Represents additional operating costs, inclusive of inventory disposal, incurred in connection with the start-up of our new manufacturing lines as part of the Freshpet Kitchens expansion projects. |
| (b) | Represents COVID-19 expenses including (i) costs incurred to protect the health and safety of our employees during the COVID-19 pandemic, (ii) temporary increased compensation expense to ensure continued operations during the pandemic, and (iii) costs related to mitigating potential supply chain disruptions during the pandemic, included in cost of goods sold. As of the fourth quarter of 2021, all remaining COVID-19 related expenses are part of our operating performance. |
FRESHPET, INC. AND SUBSIDIARIES
RECONCILIATION BETWEEN SG&A EXPENSES AND ADJUSTED SG&A EXPENSES
|
Three Months Ended |
Six Months Ended |
|||||||||||||||
|
June 30, |
June 30, |
|||||||||||||||
|
2022 |
2021 |
2022 |
2021 |
|||||||||||||
|
(Dollars in thousands) |
||||||||||||||||
|
SG&A expenses |
$ | 70,369 | $ | 49,557 | $ | 131,000 | $ | 95,589 | ||||||||
|
Depreciation and amortization expense |
4,739 | 3,633 | 8,025 | 6,922 | ||||||||||||
|
Non-cash share-based compensation |
5,124 | 5,487 | 10,250 | 10,857 | ||||||||||||
|
Launch expense (a) |
504 | 1,018 | 1,136 | 1,749 | ||||||||||||
|
Loss on disposal of equipment |
48 | 46 | 91 | 106 | ||||||||||||
|
Equity offering expenses (b) |
— | (125 | ) | — | — | |||||||||||
|
Enterprise Resource Planning (c) |
1,991 | 247 | 3,008 | 850 | ||||||||||||
|
COVID-19 expense (d) |
— | — | — | 5 | ||||||||||||
|
Adjusted SG&A Expenses |
$ | 57,963 | $ | 39,251 | $ | 108,489 | $ | 75,100 | ||||||||
|
Adjusted SG&A Expenses as a % of Net Sales |
39.7 | % | 36.1 | % | 39.0 | % | 37.2 | % | ||||||||
| (a) | Represents new store marketing allowance of $1,000 for each store added to our distribution network, as well as the non-capitalized freight costs associated with Freshpet Fridge replacements. The expense enhances the overall marketing spend to support our growing distribution network. |
| (b) | Represents fees associated with public offerings of our common stock. |
| (c) | Represents implementation and other costs associated with the implementation of an ERP system. |
| (d) | Represents COVID-19 expenses including (i) costs incurred to protect the health and safety of our employees during the COVID-19 pandemic, (ii) temporary increased compensation expense to ensure continued operations during the pandemic, and (iii) costs related to mitigating potential supply chain disruptions during the pandemic, included in SG&A. As of the fourth quarter of 2021, all remaining COVID-19 related expenses are part of our operating performance. |
FRESHPET, INC. AND SUBSIDIARIES
RECONCILIATION BETWEEN NET INCOME (LOSS) AND ADJUSTED EBITDA
|
Three Months Ended |
Six Months Ended |
|||||||||||||||
|
June 30, |
June 30, |
|||||||||||||||
|
2022 |
2021 |
2022 |
2021 |
|||||||||||||
|
(Dollars in thousands) |
||||||||||||||||
|
Net loss |
$ | (20,586 | ) | $ | (7,475 | ) | $ | (38,128 | ) | $ | (18,364 | ) | ||||
|
Depreciation and amortization |
7,880 | 7,654 | 15,867 | 14,743 | ||||||||||||
|
Interest expense |
1,671 | 654 | 2,243 | 1,556 | ||||||||||||
|
Income tax expense |
41 | 16 | 82 | 32 | ||||||||||||
|
EBITDA |
$ | (10,994 | ) | $ | 849 | $ | (19,936 | ) | $ | (2,033 | ) | |||||
|
Loss on equity method investment |
$ | 717 | 337 | $ | 2,027 | 585 | ||||||||||
|
Loss on disposal of equipment |
48 | 46 | 91 | 106 | ||||||||||||
|
Non-cash share-based compensation |
6,294 | 6,690 | 12,589 | 12,770 | ||||||||||||
|
Launch expense (a) |
504 | 1,018 | 1,136 | 1,749 | ||||||||||||
|
Plant start-up expense (b) |
5,293 | 1,130 | 10,040 | 2,973 | ||||||||||||
|
Equity offering expenses (c) |
— | (125 | ) | — | — | |||||||||||
|
Enterprise Resource Planning (d) |
1,991 | 247 | 3,008 | 850 | ||||||||||||
|
COVID-19 expense (e) |
— | 681 | — | 1,639 | ||||||||||||
|
Adjusted EBITDA |
$ | 3,853 | $ | 10,873 | $ | 8,955 | $ | 18,639 | ||||||||
|
Adjusted EBITDA as a % of Net Sales |
2.6 | % | 10.0 | % | 3.2 | % | 9.2 | % | ||||||||
| (a) | Represents new store marketing allowance of $1,000 for each store added to our distribution network, as well as the non-capitalized freight costs associated with Freshpet Fridge replacements. The expense enhances the overall marketing spend to support our growing distribution network. |
| (b) | Represents additional operating costs, inclusive of inventory disposal, incurred in connection with the start-up of our new manufacturing lines as part of the Freshpet Kitchens expansion projects. |
| (c) | Represents fees associated with public offerings of our common stock. |
| (d) | Represents implementation and other costs associated with the implementation of an ERP system. |
| (e) | Represents COVID-19 expenses including (i) costs incurred to protect the health and safety of our employees during the COVID-19 pandemic, (ii) temporary increased compensation expense to ensure continued operations during the pandemic, and (iii) costs related to mitigating potential supply chain disruptions during the pandemic. As of the fourth quarter of 2021, all remaining COVID-19 related expenses are part of our operating performance. |
Exhibit 99.2


Serious News for Serious Traders! Try StreetInsider.com Premium Free!
You May Also Be Interested In
- Freshpet, Inc. to Report First Quarter 2024 Results on Monday, May 6, 2024
- Port Houston Regular Commission Meeting
- Vaxxinity Issues Shareholder Letter
Create E-mail Alert Related Categories
SEC FilingsSign up for StreetInsider Free!
Receive full access to all new and archived articles, unlimited portfolio tracking, e-mail alerts, custom newswires and RSS feeds - and more!
