

Form 8-K Focus Financial Partners For: May 06
 Tweet
Tweet Share
Share
Exhibit 99.1

Focus Financial Partners Reports First Quarter Results
Performance Exceeds Expectations, Reinforcing Strong Momentum
New York, New York – May 6, 2021 – Focus Financial Partners Inc. (Nasdaq: FOCS) (“Focus Inc.”, “Focus”, the “Company”, “we”, “us” or “our”), a leading partnership of independent, fiduciary wealth management firms, today reported results for its first quarter ended March 31, 2021.
First Quarter 2021 Highlights
| · | Total revenues of $394.2 million, 16.9% growth year over year | |
| · | Organic revenue growth(1) rate of 12.2% year over year | |
| · | GAAP net income of $2.5 million | |
| · | GAAP basic and diluted net income per share attributable to common shareholders of $0.00 on a rounded basis | |
| · | Adjusted Net Income Excluding Tax Adjustments(2) of $63.4 million and Tax Adjustments of $10.5 million | |
| · | Adjusted Net Income Excluding Tax Adjustments Per Share(2) of $0.80 and Tax Adjustments Per Share(2) of $0.13 | |
| · | Net Leverage Ratio(3) of 3.79x | |
| · | Net cash provided by operating activities for the trailing 4-quarters ended March 31, 2021 of $242.1 million, 32.8% higher than the prior year period | |
| · | LTM Cash Flow Available for Capital Allocation(2) for the trailing 4-quarters ended March 31, 2021 of $219.9 million, 51.8% higher than the prior year period | |
| · | Raised $500 million under First Lien Term Loan at LIBOR + 200 and repaid borrowings under First Lien Revolver | |
| · | Formed a joint venture with Orion Advisor Solutions that will add cash and credit solutions and related services developed by Focus Client Solutions to Orion’s WealthTech platform | |
| · | Launched Beryllus Capital, a global multi-family office, in a joint venture with the Hinduja Group |
| (1) | Please see footnote 2 under “How We Evaluate Our Business” later in this press release. |
| (2) | Non-GAAP financial measures. Please see “Reconciliation of Non-GAAP Financial Measures” later in this press release for a reconciliation and more information on these measures. |
| (3) | Please see footnote 8 under “How We Evaluate Our Business” later in this press release. |
“This morning we announced another quarter of excellent performance and year-over-year growth, reflecting a continued acceleration of our overall business momentum,” said Rudy Adolf, Founder, CEO and Chairman. “Our partner firms generated outstanding results, delivering exceptional service to their clients and growing their businesses despite the unsettled macro backdrop. We had another strong quarter for M&A, following the most active quarter in our history, and our pipeline is building. The Focus model continues to resonate, creating an enduring source of competitive differentiation. We further expanded our presence in the ultra-high net worth market during the quarter, which is an important strategic focus for us, and grew our international footprint. We also substantially increased the range of value-added services that we can offer our partner firms, in areas that are integral to addressing their clients’ most complex wealth management and planning needs.”
1
“We delivered strong results in the 2021 first quarter, above the upper end of our guidance on all measures, and we are very pleased with the overall performance and growth of our business. We also reported our first quarter of Adjusted EBITDA(2) in excess of $100 million, which is a substantial milestone and reinforces the operating leverage that results from our scale,” said Jim Shanahan, Chief Financial Officer. “Our net leverage ratio was 3.79x as of March 31st, and we remain committed to our net leverage ratio range of 3.5x to 4.5x. The excellent performance of our partner firms, together with our sustained M&A momentum and further build-out our value-added offerings all create levers of future growth for our partnership. We firmly believe that the uniqueness of our value proposition will continue to make us the partner of choice and enhance our already strong leadership position.”
First Quarter 2021 Financial Highlights
Total revenues were $394.2 million, 16.9%, or $57.1 million higher than the 2020 first quarter. The primary driver of this increase was revenue growth from our existing partner firms of approximately $42.4 million. The majority of this growth was driven by higher wealth management fees, which includes the effect of mergers completed by our partner firms. The balance of the increase of $14.7 million was due to revenues from new partner firms acquired during the last twelve months. Our year-over-year organic revenue growth rate(1) was 12.2%, slightly above our expected 7% to 10% range for the quarter.
An estimated 77.7%, or $306.4 million, of total revenues in the quarter were correlated to the financial markets. Of this amount, 67.2%, or $206.0 million, were generated from advance billings generally based on market levels in the 2020 fourth quarter. The remaining 22.3%, or $87.8 million, were not correlated to the markets. These revenues typically consist of family office type services, tax advice and fixed fees for investment advice, primarily for high and ultra-high net worth clients.
GAAP net income was $2.5 million compared to $34.0 million in the prior year quarter. GAAP basic and diluted net income per share attributable to common shareholders were both $0.00, as compared to $0.43 for both basic and diluted net income per share in the prior year quarter.
Adjusted EBITDA(2) was $101.0 million, 29.4%, or $23.0 million, higher than the prior year period, and our Adjusted EBITDA margin(3) was 25.6%, well ahead of our outlook of 24.5% for the quarter due to the higher organic revenue growth and lower operating costs relative to revenue.
Adjusted Net Income Excluding Tax Adjustments(2) was $63.4 million and Tax Adjustments were $10.5 million. Adjusted Net Income Excluding Tax Adjustments Per Share(2) was $0.80, up 29.0% compared to the prior year period, and Tax Adjustments Per Share(2) were $0.13, up 8.3% compared to the prior year period.
| (1) | Please see footnote 2 under “How We Evaluate Our Business” later in this press release. |
| (2) | Non-GAAP financial measures. Please see “Reconciliation of Non-GAAP Financial Measures” later in this press release for a reconciliation and more information on these measures. |
| (3) | Calculated as Adjusted EBITDA divided by Revenues. |
2
Balance Sheet and Liquidity
As of March 31, 2021, cash and cash equivalents were $169.7 million and debt outstanding under the Company’s credit facilities was approximately $1.6 billion, all of which were borrowings under our First Lien Term Loan. There were no outstanding borrowings under our First Lien Revolver. Our Net Leverage Ratio(1) at March 31, 2021 was 3.79x. We remain committed to maintaining our Net Leverage Ratio(1) between 3.5x to 4.5x and believe this is the appropriate range for our business given our highly acquisitive nature.
Our net cash provided by operating activities for the trailing four quarters ended March 31, 2021 increased 32.8% to $242.1 million from $182.2 million for the comparable period ended March 31, 2020. Our Cash Flow Available for Capital Allocation(2) for the trailing four quarters ended March 31, 2021 increased 51.8% to $219.9 million from $144.8 million for the comparable period ended March 31, 2020. These increases reflect the earnings growth of our partner firms, the addition of new partner firms and the increase in our Adjusted EBITDA margin. In the 2021 first quarter, we paid $10.0 million of earn-out obligations and $4.2 million of required amortization under our Term Loan.
As of March 31, 2021, $850 million, or approximately 52%, of our Term Loan had been swapped from a floating rate to a weighted average fixed rate of 2.62%. The residual amount of approximately $773.4 million under the Term Loan remain at floating rates.
| (1) | Please see footnote 8 under “How We Evaluate Our Business” later in this press release. |
| (2) | Non-GAAP financial measure. See ‘‘Reconciliation of Non-GAAP Financial Measures—Cash Flow Available for Capital Allocation” later in this press release. |
Teleconference, Webcast and Presentation Information
Founder, CEO and Chairman, Rudy Adolf, and Chief Financial Officer, Jim Shanahan, will host a conference call today, May 6, 2021 at 8:30 a.m. Eastern Time to discuss the Company’s 2021 first quarter results and outlook. The call can be accessed by dialing +1-877-407-0989 (inside the U.S.) or +1-201-389-0921 (outside the U.S.).
A live, listen-only webcast, together with a slide presentation titled “First Quarter 2021 Earnings Release Supplement” dated May 6, 2021 will be available under “Events” in the “Investor Relations” section of the Company’s website, www.focusfinancialpartners.com. A webcast replay of the call will be available shortly after the event at the same address. Registration for the call will begin 20 minutes prior to the start of the call, using the following link.
About Focus Financial Partners Inc.
Focus Financial Partners is a leading partnership of independent, fiduciary wealth management firms. Focus provides access to best practices, resources, and continuity planning for its partner firms who serve individuals, families, employers and institutions with comprehensive wealth management services. Focus partner firms maintain their operational independence, while they benefit from the synergies, scale, economics and best practices offered by Focus to achieve their business objectives.
3
Cautionary Note Concerning Forward-Looking Statements
The foregoing information contains certain forward-looking statements that reflect the Company’s current views with respect to certain current and future events and financial performance. These forward-looking statements are and will be, as the case may be, subject to many risks, uncertainties and factors relating to the Company’s operations and business environment, including the impact and duration of the outbreak of Covid-19, which may cause the Company’s actual results to be materially different from any future results, expressed or implied, in these forward-looking statements. Any forward-looking statements in this release are based upon information available to the Company on the date of this release. The Company does not undertake to publicly update or revise its forward-looking statements even if experience or future changes make it clear that any statements expressed or implied therein will not be realized. Additional information on risk factors that could potentially affect the Company’s financial results may be found in the Company’s annual report on Form 10-K for the year ended December 31, 2020 filed and our other filings with the Securities and Exchange Commission.
Investor and Media Contact
Tina Madon
Head of Investor Relations & Corporate Communications
Tel: (646) 813-2909
4
How We Evaluate Our Business
We focus on several key financial metrics in evaluating the success of our business, the success of our partner firms and our resulting financial position and operating performance. Key metrics for the three months ended March 31, 2020 and 2021 include the following:
| Three Months Ended | ||||||||
| March 31, | ||||||||
| 2020 | 2021 | |||||||
| (dollars in thousands, except per share data) | ||||||||
| Revenue Metrics: | ||||||||
| Revenues | $ | 337,054 | $ | 394,175 | ||||
| Revenue growth (1) from prior period | 29.7 | % | 16.9 | % | ||||
| Organic revenue growth (2) from prior period | 21.2 | % | 12.2 | % | ||||
| Management Fees Metrics (operating expense): | ||||||||
| Management fees | $ | 83,693 | $ | 102,072 | ||||
| Management fees growth (3) from prior period | 46.8 | % | 22.0 | % | ||||
| Organic management fees growth (4) from prior period | 33.7 | % | 15.7 | % | ||||
| Net Income Metrics: | ||||||||
| Net income | $ | 34,019 | $ | 2,482 | ||||
| Net income growth from prior period | * | * | ||||||
| Income per share of Class A common stock: | ||||||||
| Basic | $ | 0.43 | $ | 0.00 | ||||
| Diluted | $ | 0.43 | $ | 0.00 | ||||
| Income per share of Class A common stock growth from prior period: | ||||||||
| Basic | * | * | ||||||
| Diluted | * | * | ||||||
| Adjusted EBITDA Metrics: | ||||||||
| Adjusted EBITDA (6) | $ | 78,020 | $ | 100,995 | ||||
| Adjusted EBITDA growth (6) from prior period | 43.1 | % | 29.4 | % | ||||
| Adjusted Net Income Excluding Tax Adjustments Metrics: | ||||||||
| Adjusted Net Income Excluding Tax Adjustments (5)(6) | $ | 45,515 | $ | 63,449 | ||||
| Adjusted Net Income Excluding Tax Adjustments growth (5)(6) from prior period | 58.6 | % | 39.4 | % | ||||
| Tax Adjustments | ||||||||
| Tax Adjustments (5)(6)(7) | $ | 8,935 | $ | 10,492 | ||||
| Tax Adjustments growth from prior period (5)(6)(7) | 27.2 | % | 17.4 | % | ||||
5
| Three Months Ended | ||||||||
| March 31, | ||||||||
| 2020 | 2021 | |||||||
| (dollars in thousands, except per share data) | ||||||||
| Adjusted Net Income Excluding Tax Adjustments Per Share and Tax Adjustments Per Share Metrics: | ||||||||
| Adjusted Net Income Excluding Tax Adjustments Per Share (5)(6) | $ | 0.62 | $ | 0.80 | ||||
| Tax Adjustments Per Share (5)(6)(7) | $ | 0.12 | $ | 0.13 | ||||
| Adjusted Net Income Excluding Tax Adjustments Per Share growth (5)(6) from prior period | 63.2 | % | 29.0 | % | ||||
| Tax Adjustments Per Share growth from prior period (5)(6)(7) | 33.3 | % | 8.3 | % | ||||
| Adjusted Shares Outstanding | ||||||||
| Adjusted Shares Outstanding (6) | 73,132,756 | 79,606,295 | ||||||
| Other Metrics: | ||||||||
| Net Leverage Ratio (8) at period end | 4.00 | x | 3.79 | x | ||||
| Acquired Base Earnings (9) | $ | 3,190 | $ | 663 | ||||
| Number of partner firms at period end (10) | 64 | 72 | ||||||
* Not meaningful
| (1) | Represents period-over-period growth in our GAAP revenue. |
| (2) | Organic revenue growth represents the period-over-period growth in revenue related to partner firms, including growth related to acquisitions of wealth management practices and customer relationships by our partner firms, including Connectus, and partner firms that have merged, that for the entire periods presented, are included in our consolidated statements of operations for each of the entire periods presented. We believe these growth statistics are useful in that they present full-period revenue growth of partner firms on a “same store” basis exclusive of the effect of the partial period results of partner firms that are acquired during the comparable periods. |
| (3) | The terms of our management agreements entitle the management companies to management fees typically consisting of all Earnings Before Partner Compensation (“EBPC”) in excess of Base Earnings up to Target Earnings, plus a percentage of any EBPC in excess of Target Earnings. Management fees growth represents the period-over-period growth in GAAP management fees earned by management companies. While an expense, we believe that growth in management fees reflect the strength of the partnership. |
| (4) | Organic management fees growth represents the period-over-period growth in management fees earned by management companies related to partner firms, including growth related to acquisitions of wealth management practices and customer relationships by our partner firms and partner firms that have merged, that for the entire periods presented, are included in our consolidated statements of operations for each of the entire periods presented. We believe that these growth statistics are useful in that they present full-period growth of management fees on a “same store” basis exclusive of the effect of the partial period results of partner firms that are acquired during the comparable periods. |
| (5) | In disclosures, including filings with the SEC, made prior to the quarter ended September 30, 2020, “Adjusted Net Income Excluding Tax Adjustments” and “Tax Adjustments” were presented together as “Adjusted Net Income.” Additionally, “Adjusted Net Income Excluding Tax Adjustments Per Share” and “Tax Adjustments Per Share” were presented together as “Adjusted Net Income Per Share.” |
6
| (6) | For additional information regarding Adjusted EBITDA, Adjusted Net Income Excluding Tax Adjustments, Adjusted Net Income Excluding Tax Adjustments Per Share, Tax Adjustments, Tax Adjustments Per Share and Adjusted Shares Outstanding, including a reconciliation of Adjusted EBITDA, Adjusted Net Income Excluding Tax Adjustments and Adjusted Net Income Excluding Tax Adjustments Per Share to the most directly comparable GAAP financial measure, please read “—Adjusted EBITDA” and “—Adjusted Net Income Excluding Tax Adjustments and Adjusted Net Income Excluding Tax Adjustments Per Share.” |
| (7) | Tax Adjustments represent the tax benefits of intangible assets, including goodwill, associated with deductions allowed for tax amortization of intangible assets in the respective periods based on a pro forma 27% income tax rate. Such amounts were generated from acquisitions completed where we received a step-up in basis for tax purposes. Acquired intangible assets may be amortized for tax purposes, generally over a 15-year period. Due to our acquisitive nature, tax deductions allowed on acquired intangible assets provide additional significant supplemental economic benefit. The tax benefit from amortization is included to show the full economic benefit of deductions for acquired intangible assets with the step-up in tax basis. As of March 31, 2021, estimated Tax Adjustments from intangible asset related income tax benefits from closed acquisitions based on a pro forma 27% income tax rate for the next 12 months is $41,907. |
| (8) | Net Leverage Ratio represents the First Lien Leverage Ratio (as defined in the Credit Facility), and means the ratio of amounts outstanding under the First Lien Term Loan and First Lien Revolver plus other outstanding debt obligations secured by a lien on the assets of Focus LLC (excluding letters of credit other than unpaid drawings thereunder) minus unrestricted cash and cash equivalents to Consolidated EBITDA (as defined in the Credit Facility). |
| (9) | The terms of our management agreements entitle the management companies to management fees typically consisting of all future EBPC of the acquired wealth management firm in excess of Base Earnings up to Target Earnings, plus a percentage of any EBPC in excess of Target Earnings. Acquired Base Earnings is equal to our retained cumulative preferred position in Base Earnings. We are entitled to receive these earnings notwithstanding any earnings that we are entitled to receive in excess of Target Earnings. Base Earnings may change in future periods for various business or contractual matters. For example, from time to time when a partner firm consummates an acquisition, the management agreement among the partner firm, the management company and the principals is amended to adjust Base Earnings and Target Earnings to reflect the projected post acquisition earnings of the partner firm. |
| (10) | Represents the number of partner firms on the last day of the period presented. |
7
Unaudited Condensed Consolidated Financial Statements
FOCUS FINANCIAL PARTNERS INC.
Unaudited condensed consolidated statements of operations
(in thousands, except share and per share amounts)
| For the three months ended | ||||||||
| March 31, | ||||||||
| 2020 | 2021 | |||||||
| REVENUES: | ||||||||
| Wealth management fees | $ | 318,603 | $ | 374,845 | ||||
| Other | 18,451 | 19,330 | ||||||
| Total revenues | 337,054 | 394,175 | ||||||
| OPERATING EXPENSES: | ||||||||
| Compensation and related expenses | 117,844 | 141,043 | ||||||
| Management fees | 83,693 | 102,072 | ||||||
| Selling, general and administrative | 62,595 | 63,826 | ||||||
| Intangible amortization | 35,723 | 42,983 | ||||||
| Non-cash changes in fair value of estimated contingent consideration | (31,373 | ) | 25,936 | |||||
| Depreciation and other amortization | 2,982 | 3,607 | ||||||
| Total operating expenses | 271,464 | 379,467 | ||||||
| INCOME FROM OPERATIONS | 65,590 | 14,708 | ||||||
| OTHER INCOME (EXPENSE): | ||||||||
| Interest income | 285 | 47 | ||||||
| Interest expense | (13,586 | ) | (10,521 | ) | ||||
| Amortization of debt financing costs | (782 | ) | (852 | ) | ||||
| Loss on extinguishment of borrowings | (6,094 | ) | — | |||||
| Other income—net | 612 | 3 | ||||||
| Income from equity method investments | 64 | 283 | ||||||
| Total other expense—net | (19,501 | ) | (11,040 | ) | ||||
| INCOME BEFORE INCOME TAX | 46,089 | 3,668 | ||||||
| INCOME TAX EXPENSE | 12,070 | 1,186 | ||||||
| NET INCOME | 34,019 | 2,482 | ||||||
| Non-controlling interest | (13,623 | ) | (2,226 | ) | ||||
| NET INCOME ATTRIBUTABLE TO | ||||||||
| COMMON SHAREHOLDERS | $ | 20,396 | $ | 256 | ||||
| Income per share of Class A common stock: | ||||||||
| Basic | $ | 0.43 | $ | 0.00 | ||||
| Diluted | $ | 0.43 | $ | 0.00 | ||||
| Weighted average shares of Class A common stock outstanding: | ||||||||
| Basic | 47,436,555 | 52,200,029 | ||||||
| Diluted | 47,441,172 | 52,654,822 | ||||||
8
FOCUS FINANCIAL PARTNERS INC.
Unaudited condensed consolidated balance sheets
(in thousands, except share and per share amounts)
| December 31, | March 31, | |||||||
| 2020 | 2021 | |||||||
| ASSETS | ||||||||
| Cash and cash equivalents | $ | 65,858 | $ | 169,715 | ||||
| Accounts receivable less allowances of $2,178 at 2020 and $2,135 at 2021 | 169,220 | 176,558 | ||||||
| Prepaid expenses and other assets | 65,581 | 87,594 | ||||||
| Fixed assets—net | 49,209 | 48,711 | ||||||
| Operating lease assets | 229,748 | 229,132 | ||||||
| Debt financing costs—net | 6,950 | 6,276 | ||||||
| Deferred tax assets—net | 107,289 | 160,247 | ||||||
| Goodwill | 1,255,559 | 1,253,976 | ||||||
| Other intangible assets—net | 1,113,467 | 1,082,254 | ||||||
| TOTAL ASSETS | $ | 3,062,881 | $ | 3,214,463 | ||||
| LIABILITIES AND EQUITY | ||||||||
| LIABILITIES | ||||||||
| Accounts payable | $ | 9,634 | $ | 7,809 | ||||
| Accrued expenses | 53,862 | 55,626 | ||||||
| Due to affiliates | 66,428 | 26,638 | ||||||
| Deferred revenue | 9,190 | 9,783 | ||||||
| Other liabilities | 222,911 | 238,089 | ||||||
| Operating lease liabilities | 253,295 | 255,145 | ||||||
| Borrowings under credit facilities (stated value of $1,507,622 and $1,623,449 at December 31, 2020 and March 31, 2021, respectively) | 1,507,119 | 1,619,831 | ||||||
| Tax receivable agreements obligations | 81,563 | 123,895 | ||||||
| TOTAL LIABILITIES | 2,204,002 | 2,336,816 | ||||||
| EQUITY | ||||||||
| Class A common stock, par value $0.01, 500,000,000 shares authorized; 51,158,712 and 55,114,842 shares issued and outstanding at December 31, 2020 and March 31, 2021, respectively | 512 | 551 | ||||||
| Class B common stock, par value $0.01, 500,000,000 shares authorized; 20,661,595 and 17,019,104 shares issued and outstanding at December 31, 2020 and March 31, 2021, respectively | 207 | 170 | ||||||
| Additional paid-in capital | 526,664 | 590,022 | ||||||
| Retained earnings | 14,583 | 14,839 | ||||||
| Accumulated other comprehensive income (loss) | (2,167 | ) | 917 | |||||
| Total shareholders' equity | 539,799 | 606,499 | ||||||
| Non-controlling interest | 319,080 | 271,148 | ||||||
| Total equity | 858,879 | 877,647 | ||||||
| TOTAL LIABILITIES AND EQUITY | $ | 3,062,881 | $ | 3,214,463 | ||||
9
FOCUS FINANCIAL PARTNERS INC.
Unaudited condensed consolidated statements of cash flows
(in thousands)
| For the three months ended | ||||||||
| March 31, | ||||||||
| 2020 | 2021 | |||||||
| CASH FLOWS FROM OPERATING ACTIVITIES: | ||||||||
| Net income | $ | 34,019 | $ | 2,482 | ||||
| Adjustments to reconcile net income to net cash provided by operating activities—net of effect of acquisitions: | ||||||||
| Intangible amortization | 35,723 | 42,983 | ||||||
| Depreciation and other amortization | 2,982 | 3,607 | ||||||
| Amortization of debt financing costs | 782 | 852 | ||||||
| Non-cash equity compensation expense | 5,034 | 12,356 | ||||||
| Non-cash changes in fair value of estimated contingent consideration | (31,373 | ) | 25,936 | |||||
| Income from equity method investments | (64 | ) | (283 | ) | ||||
| Distributions received from equity method investments | 25 | 176 | ||||||
| Deferred taxes and other non-cash items | 4,104 | 436 | ||||||
| Loss on extinguishment of borrowings | 6,094 | — | ||||||
| Changes in cash resulting from changes in operating assets and liabilities: | ||||||||
| Accounts receivable | (9,047 | ) | (7,393 | ) | ||||
| Prepaid expenses and other assets | (1,705 | ) | (5,098 | ) | ||||
| Accounts payable | 1,281 | (1,637 | ) | |||||
| Accrued expenses | (1,612 | ) | 2,169 | |||||
| Due to affiliates | (41,785 | ) | (39,818 | ) | ||||
| Other liabilities | (2,815 | ) | (3,023 | ) | ||||
| Deferred revenue | 1,739 | 383 | ||||||
| Net cash provided by operating activities | 3,382 | 34,128 | ||||||
| CASH FLOWS FROM INVESTING ACTIVITIES: | ||||||||
| Cash paid for acquisitions and contingent consideration—net of cash acquired | (52,188 | ) | (7,925 | ) | ||||
| Purchase of fixed assets | (3,188 | ) | (2,835 | ) | ||||
| Investment and other, net | — | (17,500 | ) | |||||
| Net cash used in investing activities | (55,376 | ) | (28,260 | ) | ||||
| CASH FLOWS FROM FINANCING ACTIVITIES: | ||||||||
| Borrowings under credit facilities | 285,000 | 524,375 | ||||||
| Repayments of borrowings under credit facilities | (37,892 | ) | (409,173 | ) | ||||
| Proceeds from issuance of common stock, net | — | 12,119 | ||||||
| Payments in connection with unit redemption, net | — | (12,119 | ) | |||||
| Payments in connection with tax receivable agreements | — | (4,112 | ) | |||||
| Contingent consideration paid | (21,428 | ) | (4,172 | ) | ||||
| Payments of debt financing costs | (634 | ) | (2,700 | ) | ||||
| Proceeds from exercise of stock options | 77 | 2,863 | ||||||
| Payments on finance lease obligations | (34 | ) | (33 | ) | ||||
| Distributions for unitholders | (4,567 | ) | (9,055 | ) | ||||
| Net cash provided by financing activities | 220,522 | 97,993 | ||||||
| EFFECT OF EXCHANGE RATES ON CASH AND CASH EQUIVALENTS | (667 | ) | (4 | ) | ||||
| CHANGE IN CASH AND CASH EQUIVALENTS | 167,861 | 103,857 | ||||||
| CASH AND CASH EQUIVALENTS: | ||||||||
| Beginning of period | 65,178 | 65,858 | ||||||
| End of period | $ | 233,039 | $ | 169,715 | ||||
10
Reconciliation of Non-GAAP Financial Measures
Adjusted EBITDA
Adjusted EBITDA is a non-GAAP measure. Adjusted EBITDA is defined as net income (loss) excluding interest income, interest expense, income tax expense (benefit), amortization of debt financing costs, intangible amortization and impairments, if any, depreciation and other amortization, non-cash equity compensation expense, non-cash changes in fair value of estimated contingent consideration, loss on extinguishment of borrowings, other expense/income, net, and secondary offering expenses, if any. We believe that Adjusted EBITDA, viewed in addition to and not in lieu of, our reported GAAP results, provides additional useful information to investors regarding our performance and overall results of operations for various reasons, including the following:
| · | non-cash equity grants made to employees or non-employees at a certain price and point in time do not necessarily reflect how our business is performing at any particular time; stock-based compensation expense is not a key measure of our operating performance; | |
| · | contingent consideration or earn outs can vary substantially from company to company and depending upon each company’s growth metrics and accounting assumption methods; the non-cash changes in fair value of estimated contingent consideration is not considered a key measure in comparing our operating performance; and | |
| · | amortization expenses can vary substantially from company to company and from period to period depending upon each company’s financing and accounting methods, the fair value and average expected life of acquired intangible assets and the method by which assets were acquired; the amortization of intangible assets obtained in acquisitions are not considered a key measure in comparing our operating performance. |
We use Adjusted EBITDA:
| · | as a measure of operating performance; | |
| · | for planning purposes, including the preparation of budgets and forecasts; | |
| · | to allocate resources to enhance the financial performance of our business; and | |
| · | to evaluate the effectiveness of our business strategies. |
Adjusted EBITDA does not purport to be an alternative to net income (loss) or cash flows from operating activities. The term Adjusted EBITDA is not defined under GAAP, and Adjusted EBITDA is not a measure of net income (loss), operating income or any other performance or liquidity measure derived in accordance with GAAP. Therefore, Adjusted EBITDA has limitations as an analytical tool and should not be considered in isolation or as a substitute for analysis of our results as reported under GAAP. Some of these limitations are:
| · | Adjusted EBITDA does not reflect all cash expenditures, future requirements for capital expenditures or contractual commitments; |
11
| · | Adjusted EBITDA does not reflect changes in, or cash requirements for, working capital needs; and | |
| · | Adjusted EBITDA does not reflect the interest expense on our debt or the cash requirements necessary to service interest or principal payments. |
In addition, Adjusted EBITDA can differ significantly from company to company depending on strategic decisions regarding capital structure, the tax jurisdictions in which companies operate and capital investments. We compensate for these limitations by also relying on the GAAP results and using Adjusted EBITDA as supplemental information.
Set forth below is a reconciliation of net income to Adjusted EBITDA for the three months ended March 31, 2020 and 2021:
| Three Months Ended | ||||||||
| March 31, | ||||||||
| 2020 | 2021 | |||||||
| (in thousands) | ||||||||
| Net income | $ | 34,019 | $ | 2,482 | ||||
| Interest income | (285 | ) | (47 | ) | ||||
| Interest expense | 13,586 | 10,521 | ||||||
| Income tax expense | 12,070 | 1,186 | ||||||
| Amortization of debt financing costs | 782 | 852 | ||||||
| Intangible amortization | 35,723 | 42,983 | ||||||
| Depreciation and other amortization | 2,982 | 3,607 | ||||||
| Non-cash equity compensation expense | 5,034 | 12,356 | ||||||
| Non-cash changes in fair value of estimated contingent consideration | (31,373 | ) | 25,936 | |||||
| Loss on extinguishment of borrowings | 6,094 | — | ||||||
| Other income, net | (612 | ) | (3 | ) | ||||
| Secondary offering expenses | — | 1,122 | ||||||
| Adjusted EBITDA | $ | 78,020 | $ | 100,995 | ||||
12
Adjusted Net Income Excluding Tax Adjustments and Adjusted Net Income Excluding Tax Adjustments Per Share
We analyze our performance using Adjusted Net Income Excluding Tax Adjustments and Adjusted Net Income Excluding Tax Adjustments Per Share. Adjusted Net Income Excluding Tax Adjustments and Adjusted Net Income Excluding Tax Adjustments Per Share are non-GAAP measures. We define Adjusted Net Income Excluding Tax Adjustments as net income (loss) excluding income tax expense (benefit), amortization of debt financing costs, intangible amortization and impairments, if any, non-cash equity compensation expense, non-cash changes in fair value of estimated contingent consideration, loss on extinguishment of borrowings and secondary offering expenses, if any. The calculation of Adjusted Net Income Excluding Tax Adjustments also includes adjustments to reflect a pro forma 27% income tax rate reflecting the estimated U.S. Federal, state, local and foreign income tax rates applicable to corporations in the jurisdictions we conduct business.
Adjusted Net Income Excluding Tax Adjustments Per Share is calculated by dividing Adjusted Net Income Excluding Tax Adjustments by the Adjusted Shares Outstanding. Adjusted Shares Outstanding includes: (i) the weighted average shares of Class A common stock outstanding during the periods, (ii) the weighted average incremental shares of Class A common stock related to stock options outstanding during the periods, (iii) the weighted average incremental shares of Class A common stock related to unvested Class A common stock outstanding during the periods, (iv) the weighted average incremental shares of Class A common stock related to restricted stock units outstanding during the periods, (v) the weighted average number of Focus LLC common units outstanding during the periods (assuming that 100% of such Focus LLC common units have been exchanged for Class A common stock), (vi) the weighted average number of Focus LLC restricted common units outstanding during the periods (assuming that 100% of such Focus LLC restricted common units have been exchanged for Class A common stock) and (vii) the weighted average number of common unit equivalents of Focus LLC vested and unvested incentive units outstanding during the periods based on the closing price of our Class A common stock on the last trading day of the periods (assuming that 100% of such Focus LLC common units have been exchanged for Class A common stock).
We believe that Adjusted Net Income Excluding Tax Adjustments and Adjusted Net Income Excluding Tax Adjustments Per Share, viewed in addition to and not in lieu of, our reported GAAP results, provide additional useful information to investors regarding our performance and overall results of operations for various reasons, including the following:
| · | non-cash equity grants made to employees or non-employees at a certain price and point in time do not necessarily reflect how our business is performing at any particular time; stock-based compensation expense is not a key measure of our operating performance; | |
| · | contingent consideration or earn outs can vary substantially from company to company and depending upon each company’s growth metrics and accounting assumption methods; the non-cash changes in fair value of estimated contingent consideration is not considered a key measure in comparing our operating performance; and | |
| · | amortization expenses can vary substantially from company to company and from period to period depending upon each company’s financing and accounting methods, the fair value and average expected life of acquired intangible assets and the method by which assets were acquired; the amortization of intangible assets obtained in acquisitions are not considered a key measure in comparing our operating performance. |
13
Adjusted Net Income Excluding Tax Adjustments and Adjusted Net Income Excluding Tax Adjustments Per Share do not purport to be an alternative to net income (loss) or cash flows from operating activities. The terms Adjusted Net Income Excluding Tax Adjustments and Adjusted Net Income Excluding Tax Adjustments Per Share are not defined under GAAP, and Adjusted Net Income Excluding Tax Adjustments and Adjusted Net Income Excluding Tax Adjustments Per Share are not a measure of net income (loss), operating income or any other performance or liquidity measure derived in accordance with GAAP. Therefore, Adjusted Net Income Excluding Tax Adjustments and Adjusted Net Income Excluding Tax Adjustments Per Share have limitations as an analytical tool and should not be considered in isolation or as a substitute for analysis of our results as reported under GAAP. Some of these limitations are:
| · | Adjusted Net Income Excluding Tax Adjustments and Adjusted Net Income Excluding Tax Adjustments Per Share do not reflect all cash expenditures, future requirements for capital expenditures or contractual commitments; | |
| · | Adjusted Net Income Excluding Tax Adjustments and Adjusted Net Income Excluding Tax Adjustments Per Share do not reflect changes in, or cash requirements for, working capital needs; and | |
| · | Other companies in the financial services industry may calculate Adjusted Net Income Excluding Tax Adjustments and Adjusted Net Income Excluding Tax Adjustments Per Share differently than we do, limiting its usefulness as a comparative measure. |
In addition, Adjusted Net Income Excluding Tax Adjustments and Adjusted Net Income Excluding Tax Adjustments Per Share can differ significantly from company to company depending on strategic decisions regarding capital structure, the tax jurisdictions in which companies operate and capital investments. We compensate for these limitations by relying also on the GAAP results and use Adjusted Net Income Excluding Tax Adjustments and Adjusted Net Income Excluding Tax Adjustments Per Share as supplemental information.
14
Tax Adjustments and Tax Adjustments Per Share
Tax Adjustments represent the tax benefits of intangible assets, including goodwill, associated with deductions allowed for tax amortization of intangible assets in the respective periods based on a pro forma 27% income tax rate. Such amounts were generated from acquisitions completed where we received a step-up in basis for tax purposes. Acquired intangible assets may be amortized for tax purposes, generally over a 15-year period. Due to our acquisitive nature, tax deductions allowed on acquired intangible assets provide additional significant supplemental economic benefit. The tax benefit from amortization is included to show the full economic benefit of deductions for acquired intangible assets with the step-up in tax basis.
Tax Adjustments Per Share is calculated by dividing
Tax Adjustments by the Adjusted Shares Outstanding.
Set forth below is a reconciliation of net income to Adjusted Net Income Excluding Tax Adjustments and Adjusted Net Income Excluding Tax Adjustments Per Share for the three months ended March 31, 2020 and 2021:
15
| Three Months Ended March 31, | ||||||||
| 2020 | 2021 | |||||||
| (dollars in thousands, except per share data) | ||||||||
| Net income | $ | 34,019 | $ | 2,482 | ||||
| Income tax expense | 12,070 | 1,186 | ||||||
| Amortization of debt financing costs | 782 | 852 | ||||||
| Intangible amortization | 35,723 | 42,983 | ||||||
| Non-cash equity compensation expense | 5,034 | 12,356 | ||||||
| Non-cash changes in fair value of estimated | ||||||||
| contingent consideration | (31,373 | ) | 25,936 | |||||
| Loss on extinguishment of borrowings | 6,094 | — | ||||||
| Secondary offering expenses (1) | — | 1,122 | ||||||
| Subtotal | 62,349 | 86,917 | ||||||
| Pro forma income tax expense (27%) (2) | (16,834 | ) | (23,468 | ) | ||||
| Adjusted Net Income Excluding Tax Adjustments | $ | 45,515 | $ | 63,449 | ||||
| Tax Adjustments (3) | $ | 8,935 | $ | 10,492 | ||||
| Adjusted Net Income Excluding Tax Adjustments Per Share | $ | 0.62 | $ | 0.80 | ||||
| Tax Adjustments Per Share (3) | $ | 0.12 | $ | 0.13 | ||||
| Adjusted Shares Outstanding | 73,132,756 | 79,606,295 | ||||||
| Calculation of Adjusted Shares Outstanding: Weighted average shares of Class A common stock outstanding—basic (4) | 47,436,555 | 52,200,029 | ||||||
| Adjustments: | ||||||||
| Weighted average incremental shares of Class A common stock related to stock options, unvested Class A common stock and restricted stock units | 4,617 | 454,793 | ||||||
| Weighted average Focus LLC common units outstanding (5) | 22,020,124 | 19,723,223 | ||||||
| Weighted average Focus LLC restricted common units outstanding (6) | — | 71,374 | ||||||
| Weighted average common unit equivalent of Focus LLC incentive units outstanding (7) | 3,671,460 | 7,156,876 | ||||||
| Adjusted Shares Outstanding | 73,132,756 | 79,606,295 | ||||||
| (1) | Relates to offering expenses associated with the March 2021 secondary equity offering. |
| (2) | The pro forma income tax rate of 27% reflects the estimated U.S. Federal, state, local and foreign income tax rates applicable to corporations in the jurisdictions we conduct business. |
16
| (3) | Tax Adjustments represent the tax benefits of intangible assets, including goodwill, associated with deductions allowed for tax amortization of intangible assets in the respective periods based on a pro forma 27% income tax rate. Such amounts were generated from acquisitions completed where we received a step-up in basis for tax purposes. Acquired intangible assets may be amortized for tax purposes, generally over a 15-year period. Due to our acquisitive nature, tax deductions allowed on acquired intangible assets provide additional significant supplemental economic benefit. The tax benefit from amortization is included to show the full economic benefit of deductions for acquired intangible assets with the step-up in tax basis. As of March 31, 2021, estimated Tax Adjustments from intangible asset related income tax benefits from closed acquisitions based on a pro forma 27% income tax rate for the next 12 months is $41,907. |
| (4) | Represents our GAAP weighted average Class A common stock outstanding—basic. |
| (5) | Assumes that 100% of the Focus LLC common units were exchanged for Class A common stock. |
| (6) | Assumes that 100% of Focus LLC restricted common units were exchanged for Class A common stock. |
| (7) | Assumes that 100% of the vested and unvested Focus LLC incentive units were converted into Focus LLC common units based on the closing price of our Class A common stock at the end of the respective period and such Focus LLC common units were exchanged for Class A common stock. |
Adjusted Free Cash Flow and Cash Flow Available for Capital Allocation
To supplement our statements of cash flows presented on a GAAP basis, we use non-GAAP liquidity measures on a trailing 4-quarter basis to analyze cash flows generated from our operations. We consider Adjusted Free Cash Flow and Cash Flow Available for Capital Allocation to be liquidity measures that provide useful information to investors about the amount of cash generated by the business and are two factors in evaluating the amount of cash available to pay contingent consideration, make strategic acquisitions and repay outstanding borrowings. Adjusted Free Cash Flow and Cash Flow Available for Capital Allocation do not represent our residual cash flow available for discretionary expenditures as they do not deduct our mandatory debt service requirements and other non-discretionary expenditures. We define Adjusted Free Cash Flow as net cash provided by operating activities, less purchase of fixed assets, distributions for Focus LLC unitholders and payments under tax receivable agreements (if any). We define Cash Flow Available for Capital Allocation as Adjusted Free Cash Flow plus the portion of contingent consideration paid which is classified as operating cash flows under GAAP. The balance of such contingent consideration is classified as investing and financing cash flows under GAAP; therefore, we add back the amount included in operating cash flows so that the full amount of contingent consideration payments is treated consistently. Adjusted Free Cash Flow and Cash Flow Available for Capital Allocation are not defined under GAAP and should not be considered as alternatives to net cash from operating, investing or financing activities. In addition, Adjusted Free Cash Flow and Cash Flow Available for Capital Allocation can differ significantly from company to company.
17
Set forth below is a reconciliation of net cash provided by operating activities to Adjusted Free Cash Flow and Cash Flow Available for Capital Allocation for the trailing 4-quarters ended March 31, 2020 and 2021:
| Trailing 4-Quarters Ended | ||||||||
| March 31, | ||||||||
| 2020 | 2021 | |||||||
| (in thousands) | ||||||||
| Net cash provided by operating activities | $ | 182,243 | $ | 242,107 | ||||
| Purchase of fixed assets | (26,785 | ) | (18,996 | ) | ||||
| Distributions for unitholders | (24,612 | ) | (26,945 | ) | ||||
| Payments under tax receivable agreements | — | (4,112 | ) | |||||
| Adjusted Free Cash Flow | $ | 130,846 | $ | 192,054 | ||||
| Portion of contingent consideration paid included in operating activities (1) | 13,996 | 27,845 | ||||||
| Cash Flow Available for Capital Allocation (2) | $ | 144,842 | $ | 219,899 | ||||
| (1) | A portion of contingent consideration paid is classified as operating cash outflows in accordance with GAAP, with the balance reflected in investing and financing cash outflows. Contingent consideration paid classified as operating cash outflows for each of the trailing 4-quarters ended March 31, 2020 was $4.0 million, $0.8 million $0.8 million and $8.4 million, respectively, totaling $14.0 million for the trailing 4-quarters ended March 31, 2020. Contingent consideration paid classified as operating cash outflows for each of the trailing 4-quarters ended March 31, 2021 was $16.4 million, $3.8 million, $2.4 million and $5.2 million, respectively, totaling $27.8 million for the trailing 4-quarters ended March 31, 2021. |
| (2) | Cash Flow Available for Capital Allocation excludes all contingent consideration that was included in either operating, investing or financing activities of our consolidated statements of cash flows. |
18
Supplemental Information
Economic Ownership
The following table provides supplemental information regarding the economic ownership of Focus Financial Partners, LLC as of March 31, 2021:
| March 31, 2021 | ||||||||
| Economic Ownership of Focus Financial Partners, LLC Interests: | Interest | % | ||||||
| Focus Financial Partners Inc. (1) | 55,114,842 | 69.6 | % | |||||
| Non-Controlling Interests (2) | 24,097,103 | 30.4 | % | |||||
| Total | 79,211,945 | 100.0 | % | |||||
| (1) | Includes 7,006,625 Focus LLC common units issuable upon conversion of the outstanding 16,728,882 vested and unvested incentive units (assuming vesting of the unvested incentive units and a March 31, 2021 period end value of the Focus LLC common units equal to $41.62) and includes 71,374 Focus LLC restricted common units. |
Class A and Class B Common Stock Outstanding
The following table provides supplemental information regarding the Company’s Class A and Class B common stock:
| Q1 2021 Weighted Average Outstanding | Number of Shares Outstanding at March 31, 2021 | Number of Shares Outstanding at May 3, 2021 | ||||||||||
| Class A | 52,200,029 | 55,114,842 | 55,114,842 | |||||||||
| Class B | 19,723,223 | 17,019,104 | 17,025,646 | |||||||||
19
Incentive Units
The following table provides supplemental information regarding the outstanding Focus LLC vested and unvested Incentive Units (“IUs”) at March 31, 2021. The vested IUs in future periods can be exchanged into shares of Class A common stock (after conversion into a number of Focus LLC common units that takes into account the then-current value of common units and such IUs aggregate hurdle amount), and therefore, the Company calculates the Class A common stock equivalent of such IUs for purposes of calculating per share data. The period-end share price of the Company’s Class A common stock is used to calculate the intrinsic value of the outstanding Focus LLC IUs in order to calculate a Focus LLC common unit equivalent of the Focus LLC IUs.
| Hurdle Rates | Number Outstanding |
|||||
| $ | 1.42 | 421 | ||||
| $ | 5.50 | 798 | ||||
| $ | 6.00 | 386 | ||||
| $ | 7.00 | 1,081 | ||||
| $ | 9.00 | 1,323,708 | ||||
| $ | 11.00 | 841,706 | ||||
| $ | 12.00 | 520,000 | ||||
| $ | 13.00 | 548,750 | ||||
| $ | 14.00 | 17,848 | ||||
| $ | 16.00 | 45,191 | ||||
| $ | 17.00 | 20,000 | ||||
| $ | 19.00 | 549,643 | ||||
| $ | 21.00 | 3,440,620 | ||||
| $ | 22.00 | 888,417 | ||||
| $ | 23.00 | 524,828 | ||||
| $ | 26.26 | 18,750 | ||||
| $ | 27.00 | 29,484 | ||||
| $ | 27.90 | 1,951,339 | ||||
| $ | 28.50 | 1,492,088 | ||||
| $ | 30.48 | 30,000 | ||||
| $ | 33.00 | 3,617,500 | ||||
| $ | 36.64 | 30,000 | ||||
| $ | 43.50 | 30,000 | ||||
| $ | 44.71 | 806,324 | ||||
| 16,728,882 | ||||||
20
Exhibit 99.2

Focus Financial Partners Inc. First Quarter 2021 Earnings Release Supplement May 6, 2021

2 Disclaimer Special Note Regarding Forward - Looking Statements Some of the information in this presentation may contain forward - looking statements . Forward - looking statements give our current expectations, contain projections of results of operations or of financial condition, or forecasts of future events . Words such as “may,” “assume,” “forecast,” “position,” “predict,” “strategy,” “expect,” “intend,” “plan,” “estimate,” “anticipate,” “believe,” “project,” “budget,” “potential,” “continue,” “will” and similar expressions are used to identify forward - looking statements . They can be affected by assumptions used or by known or unknown risks or uncertainties . Consequently, no forward - looking statements can be guaranteed . When considering these forward - looking statements, you should keep in mind the risk factors and other cautionary statements in this presentation . Actual results may vary materially . You are cautioned not to place undue reliance on any forward - looking statements . You should also understand that it is not possible to predict or identify all such factors and should not consider the following list to be a complete statement of all potential risks and uncertainties . Factors that could cause our actual results to differ materially from the results contemplated by such forward - looking statements include the impact and duration of the outbreak of the novel coronavirus, fluctuations in wealth management fees, our reliance on our partner firms and the principals who manage their businesses, our ability to make successful acquisitions, unknown liabilities of or poor performance by acquired businesses, harm to our reputation, our inability to facilitate smooth succession planning at our partner firms, our inability to compete, our reliance on key personnel, our inability to attract, develop and retain talented wealth management professionals, our inability to retain clients following an acquisition, write down of goodwill and other intangible assets, our failure to maintain and properly safeguard an adequate technology infrastructure, cyber - attacks, our inability to recover from business continuity problems, inadequate insurance coverage, the termination of management agreements by management companies, our inability to generate sufficient cash to service all of our indebtedness, the failure of our partner firms to comply with applicable U . S . and non - U . S . regulatory requirements, legal proceedings and governmental inquiries and certain other factors . All forward - looking statements are expressly qualified in their entirety by the foregoing cautionary statements . Our forward - looking statements speak only as of the date of this presentation or as of the date as of which they are made . Except as required by applicable law, including federal securities laws, we do not intend to update or revise any forward - looking statements . Non - GAAP Financial Measures Adjusted EBITDA is a non - GAAP measure . Adjusted EBITDA is defined as net income (loss) excluding interest income, interest expense, income tax expense (benefit), amortization of debt financing costs, intangible amortization and impairments, if any, depreciation and other amortization, non - cash equity compensation expense, non - cash changes in fair value of estimated contingent consideration, gain on sale of investment, loss on extinguishment of borrowings, other expense/income, net, impairment of equity method investment, management contract buyout, delayed offering cost expense, secondary offering expenses and other one time transaction expenses . We believe that Adjusted EBITDA, viewed in addition to and not in lieu of, our reported GAAP results, provides additional useful information to investors regarding our performance and overall results of operations for various reasons, including the following : ( i ) non - cash equity grants made to employees or non - employees at a certain price and point in time do not necessarily reflect how our business is performing at any particular time ; stock - based compensation expense is not a key measure of our operating performance, (ii) contingent consideration or earn outs can vary substantially from company to company and depending upon each company’s growth metrics and accounting assumption methods ; the non - cash changes in fair value of estimated contingent consideration is not considered a key measure in comparing our operating performance, and (iii) amortization expenses can vary substantially from company to company and from period to period depending upon each company’s financing and accounting methods, the fair value and average expected life of acquired intangible assets and the method by which assets were acquired ; the amortization of intangible assets obtained in acquisitions are not considered a key measure in comparing our operating performance . We use Adjusted EBITDA ( i ) as a measure of operating performance, (ii) for planning purposes, including the preparation of budgets and forecasts, (iii) to allocate resources to enhance the financial performance of our business, and (iv) to evaluate the effectiveness of our business strategies . Adjusted EBITDA does not purport to be an alternative to net income (loss) or cash flows from operating activities . The term Adjusted EBITDA is not defined under GAAP, and Adjusted EBITDA is not a measure of net income (loss), operating income or any other performance or liquidity measure derived in accordance with GAAP . Therefore, Adjusted EBITDA has limitations as an analytical tool and should not be considered in isolation or as a substitute for analysis of our results as reported under GAAP . Some of these limitations are : ( i ) Adjusted EBITDA does not reflect all cash expenditures, future requirements for capital expenditures or contractual commitments, (ii) Adjusted EBITDA does not reflect changes in, or cash requirements for, working capital needs, and (iii) Adjusted EBITDA does not reflect the interest expense on our debt or the cash requirements necessary to service interest or principal payments . In addition, Adjusted EBITDA can differ significantly from company to company depending on strategic decisions regarding capital structure, the tax jurisdictions in which companies operate and capital investments . We compensate for these limitations by relying also on the GAAP results and using Adjusted EBITDA as supplemental information . We analyze our performance using Adjusted Net Income Excluding Tax Adjustments and Adjusted Net Income Excluding Tax Adjustments Per Share . Adjusted Net Income Excluding Tax Adjustments and Adjusted Net Income Excluding Tax Adjustments Per Share are non - GAAP measures . We define Adjusted Net Income Excluding Tax Adjustments as net income (loss) excluding income tax expense (benefit), amortization of debt financing costs, intangible amortization and impairments, if any, non cash equity compensation expense, non cash changes in fair value of estimated contingent consideration, gain on sale of investment, loss on extinguishment of borrowings, management contract buyout, if any, delayed offering cost expense, secondary offering expenses and other one time transaction expenses . The calculation of Adjusted Net Income Excluding Tax Adjustments also includes adjustments to reflect a pro forma 27 % income tax rate reflecting the estimated U . S . Federal, state, local and foreign income tax rates applicable to corporations in the jurisdictions we conduct business . We believe that Adjusted Net Income Excluding Tax Adjustments and Adjusted Net Income Excluding Tax Adjustments Per Share, viewed in addition to and not in lieu of, our reported GAAP results, provide additional useful information to investors regarding our performance and overall results of operations for various reasons, including the following : ( i ) non - cash equity grants made to employees or non - employees at a certain price and point in time do not necessarily reflect how our business is performing at any particular time ; stock - based compensation expense is not a key measure of our operating performance, (ii) contingent consideration or earn outs can vary substantially from company to company and depending upon each company’s growth metrics and accounting assumption methods ; the non - cash changes in fair value of estimated contingent consideration is not considered a key measure in comparing our operating performance, and (iii) amortization expenses can vary substantially from company to company and from period to period depending upon each company’s financing and accounting methods, the fair value and average expected life of acquired intangible assets and the method by which assets were acquired ; the amortization of intangible assets obtained in acquisitions are not considered a key measure in comparing our operating performance . Adjusted Net Income Excluding Tax Adjustments and Adjusted Net Income Excluding Tax Adjustments Per Share do not purport to be an alternative to net income (loss) or cash flows from operating activities . The terms Adjusted Net Income Excluding Tax Adjustments and Adjusted Net Income Excluding Tax Adjustments Per Share are not defined under GAAP, and Adjusted Net Income Excluding Tax Adjustments and Adjusted Net Income Excluding Tax Adjustments Per Share are not a measure of net income (loss), operating income or any other performance or liquidity measure derived in accordance with GAAP . Therefore, Adjusted Net Income Excluding Tax Adjustments and Adjusted Net Income Excluding Tax Adjustments Per Share have limitations as an analytical tool and should not be considered in isolation or as a substitute for analysis of our results as reported under GAAP . Some of these limitations are : ( i ) Adjusted Net Income Excluding Tax Adjustments and Adjusted Net Income Excluding Tax Adjustments Per Share do not reflect all cash expenditures, future requirements for capital expenditures or contractual commitments, (ii) Adjusted Net Income Excluding Tax Adjustments and Adjusted Net Income Excluding Tax Adjustments Per Share do not reflect changes in, or cash requirements for, working capital needs, and (iii) Other companies in the financial services industry may calculate Adjusted Net Income Excluding Tax Adjustments and Adjusted Net Income Excluding Tax Adjustments Per Share differently than we do, limiting its usefulness as a comparative measure . In addition, Adjusted Net Income Excluding Tax Adjustments and Adjusted Net Income Excluding Tax Adjustments Per Share can differ significantly from company to company depending on strategic decisions regarding capital structure, the tax jurisdictions in which companies operate and capital investments . We compensate for these limitations by relying also on the GAAP results and use Adjusted Net Income Excluding Tax Adjustments and Adjusted Net Income Excluding Tax Adjustments Per Share as supplemental information . To supplement our statements of cash flows presented on a GAAP basis, we use non - GAAP liquidity measures on a trailing 4 - quarter basis to analyze cash flows generated from our operations . We consider Adjusted Free Cash Flow and Cash Flow Available for Capital Allocation to be liquidity measures that provide useful information to investors about the amount of cash generated by the business and are two factors in evaluating the amount of cash available to pay contingent consideration, make strategic acquisitions and repay outstanding borrowings . Adjusted Free Cash Flow and Cash Flow Available for Capital Allocation do not represent our residual cash flow available for discretionary expenditures as they do not deduct our mandatory debt service requirements and other non - discretionary expenditures . We define Adjusted Free Cash Flow as net cash provided by operating activities, less purchase of fixed assets, distributions for unitholders and payments under tax receivable agreements (if any) . We define Cash Flow Available for Capital Allocation as Adjusted Free Cash Flow plus the portion of contingent consideration paid which is classified as operating cash flows under GAAP . Adjusted Free Cash Flow and Cash Flow Available for Capital Allocation are not defined under GAAP and should not be considered as alternatives to net cash from operating, investing or financing activities . In addition, Adjusted Free Cash Flow and Cash Flow Available for Capital Allocation can differ significantly from company to company .

Table of Contents 3 Pages Long - Term Growth Trends 4 - 8 First Quarter 2021 Recap 9 - 16 Second Quarter 2021 Outlook 17 - 18 A Diversified Portfolio of Complementary Businesses 19 - 20 Evolution in our Value - Added Services 21 - 23 Leverage 24 - 26 Cash Flows 27 - 29 Appendix 30 - 34

Long - Term Growth Trends 4

$45.9 $46.7 $45.8 $57.8 $68.7 $75.2 $19.3 $336.5 $438.8 $617.1 $853.0 $1,149.7 $1,286.1 $374.8 FY 2015 FY 2016 FY 2017 FY 2018 FY 2019 FY 2020 Q1 21 88.0% 90.4% 93.1% 93.6% 94.4% 94.5% 95.1% $382.3 $485.4 $662.9 $910.9 $1,218.3 $1,361.3 $394.2 FY 2015 FY 2016 FY 2017 FY 2018 FY 2019 FY 2020 Q1 21 CAGR: 28.9% Wealth Management Fees Allocation ($ in millions (3) , % of Revenues) 1. Non - GAAP financial measure. See Appendix for reconciliations. 2. Calculated as Adjusted EBITDA divided by revenues. 3. The sum of wealth management fees and other revenues as presented in this chart may not agree to total revenues as presented due to rounding. Strong and Sustained Revenue and Adjusted EBITDA Growth… 5 Revenues ($ in millions) Adjusted EBITDA (1) ($ in millions) Adjusted EBITDA Margin (2) (% o f Revenues) Wealth management fees Other revenues $75.4 $103.0 $145.2 $203.4 $269.8 $321.8 $101.0 FY 2015 FY 2016 FY 2017 FY 2018 FY 2019 FY 2020 Q1 21 CAGR: 33.7% 19.7% 21.2% 21.9% 22.3% 22.1% 23.6% 25.6% FY 2015 FY 2016 FY 2017 FY 2018 FY 2019 FY 2020 Q1 21 Margin: +3.9%

1. Non - GAAP financial measure. See Appendix for reconciliations. 2. Tax Adjustments represent the tax benefits of intangible assets, including goodwill, associated with deductions allowed for t ax amortization of intangible assets in the respective periods based on a pro forma 27% income tax rate. Such amounts were generated from acquisitions completed where the Company received a step - up in basis for tax purposes. Acquired intangible assets may be amortized for tax purposes, generally over a 15 - year period. Due to the Company’s acquisitive nature, tax deductions allowed on acquired intangible assets provide additional significant supplemental economic benefit. The tax benefit from amortization is identified to show the full economic benefit of deduction s f or acquired intangible assets with the step - up in tax basis. … Drives Strong Bottom - Line Performance Enhanced by a Tax Efficient Structure 6 Adjusted Net Income Excluding Tax Adjustments (1) ($ in millions) ANI Excluding Tax Adjustments Per Share (1) Tax Adjustments (2) ($ in millions) Tax Adjustments Per Share (1) $44.2 $56.6 $70.5 $102.5 $146.7 $195.6 $63.4 FY 2015 FY 2016 FY 2017 FY 2018 FY 2019 FY 2020 Q1 21 CAGR: 34.6% $8.1 $12.0 $16.2 $22.8 $31.9 $37.3 $10.5 FY 2015 FY 2016 FY 2017 FY 2018 FY 2019 FY 2020 Q1 21 CAGR: 35.8% $0.62 $0.78 $0.98 $1.42 $1.96 $2.46 $0.80 FY 2015 FY 2016 FY 2017 FY 2018 FY 2019 FY 2020 Q1 21 CAGR: 31.7% $0.11 $0.17 $0.23 $0.32 $0.42 $0.47 $0.13 FY 2015 FY 2016 FY 2017 FY 2018 FY 2019 FY 2020 Q1 21 CAGR: 33.7%

1. The weightings are based on the March 31, 2021 LTM revenues of the respective partner firms. 2. Inception means first full four quarters as a Focus partner firm and reflects activity through all market cycles during that tim e. The analysis includes the 63 firms since inception (out of the 72 firms) that have been with us for at least 2 years as of March 31, 2021 in order to determine a baseline revenue growth rate. I f Focus partner firms merged together, their financials have been combined. 3. The 63 partner firms have been with Focus for a weighted average of ~6 years and a median period of ~5 years. 6.2% 13.8% 9.2% 5.8% 14.8% 12.8% Firms that have not completed a merger (26 firms) Firms that have completed at least one merger (37 firms) Entire portfolio of 63 partner firms Revenue CAGR Since Inception (2) Median Revenue CAGR Weighted Average Revenue CAGR Mergers Substantially Accelerate Our Partner Firms’ Revenue Growth 7 ▪ Partner firms who grow through mergers in addition to traditional client acquisition strategies have transformed their businesses through accelerated growth. ▪ Mergers enable efficient access to large pools of client assets, new spheres of influence, distribution channels and exceptional advisor talent. 63 partner firms (3) represented ~94% of our Q1 2021 LTM revenues (1) (1) (1)

Organic Revenue Trend Demonstrates Strong Partner Firm Revenue Growth and Resilience ▪ Organic growth has been consistently strong, with an average of 13.4% over the last 16 quarters 1. Organic revenue growth represents the period - over - period growth in revenue related to partner firms, including growth related to acquisitions of wealth management practices and customer relationships by Focus's partner firms, including Connectus , and partner firms that have merged, that for the entire periods presented are included in Focus's consolidated statements of operations for the entire periods presented. Focus believes these growth statistics are us eful in that they present full - period revenue growth of partner firms on a ‘‘same store’’ basis exclusive of the effect of the partial period results of partner fi rms that are acquired during the comparable periods. 8 11.9% 14.4% 17.9% 17.6% 16.7% 9.7% 10.7% 7.7% 18.0% 22.4% 25.2% 21.2% (0.3%) 2.4% 7.3% 12.2% -30% -20% -10% 0% 10% 20% 30% Q2'17 Q3'17 Q4'17 Q1'18 Q2'18 Q3'18 Q4'18 Q1'19 Q2'19 Q3'19 Q4'19 Q1'20 Q2'20 Q3'20 Q4'20 Q1'21 Quarterly Organic Revenue Growth (1) Percentage Organic Revenue Growth Quarterly Average: 13.4% Average: 13.4%

First Quarter 2021 Recap 9
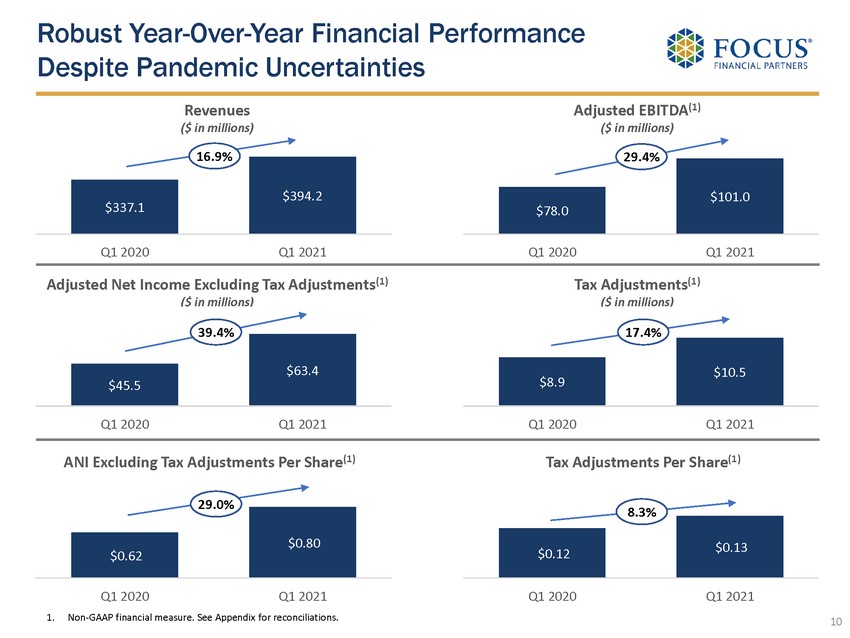
Robust Year - Over - Year Financial Performance Despite Pandemic Uncertainties 10 Adjusted Net Income Excluding Tax Adjustments (1) ($ in millions) 1. Non - GAAP financial measure. See Appendix for reconciliations. Revenues ($ in millions) Adjusted EBITDA (1) ($ in millions) ANI Excluding Tax Adjustments Per Share (1) Tax Adjustments (1) ($ in millions) Tax Adjustments Per Share (1) $337.1 $394.2 Q1 2020 Q1 2021 16.9% $78.0 $101.0 Q1 2020 Q1 2021 29.4% $45.5 $63.4 Q1 2020 Q1 2021 39.4% $8.9 $10.5 Q1 2020 Q1 2021 17.4% $0.62 $0.80 Q1 2020 Q1 2021 29.0% $0.12 $0.13 Q1 2020 Q1 2021 8.3%

▪ GAAP Net Income: $2.5 million, compared to net income of $34.0 million in Q1 2020 ▪ GAAP basic and diluted net income per share attributable to common shareholders: $0.00 and $0.00 ▪ Adjusted Net Income Excluding Tax Adjustments: (2) $63.4 million, +39.4% year - over - year growth ▪ Tax Adjustments: (5) $10.5 million, +17.4% year - over - year growth ▪ Adjusted Net Income Excluding Tax Adjustments Per Share: (2) $0.80, +29.0% year - over - year growth ▪ Tax Adjustments Per Share: (2) $0.13, +8.3% year - over - year ▪ Adjusted EBITDA: (2) $101.0 million, +29.4% year - over - year growth ▪ Adjusted EBITDA margin: (3) 25.6 % ▪ No significant Adjusted EBITDA (2) attributable to new partner firm closing in late Q1 ▪ Acquired Base Earnings: (4) $0.7 million ▪ Revenues: $394.2 million, +16.9% year - over - year growth ▪ Organic revenue growth rate: (1) +12.2 % year - over - year growth ▪ No significant revenue contribution from partner firm closing in late Q1 Adjusted EBITDA Q1 2021 Financial Snapshot Revenues Net Income and Per Share Amounts 1. Organic revenue growth represents the period - over - period growth in revenues related to partner firms, including growth related t o acquisitions of wealth management practices and customer relationships by our partner firms, including Connectus , and partner firms that have merged, that for the entire periods presented, are included in our consolidated statements of o per ations for each of the entire periods presented. We believe these growth statistics are useful in that they present full period revenue growth of partner firms on a ‘‘same store’’ basis exclusive of th e effect of the partial period results of partner firms that are acquired during the comparable periods. 2. Non - GAAP financial measure. See Appendix for reconciliations. 3. Calculated as Adjusted EBITDA divided by revenues. 4. The terms of our management agreements entitle the management companies to management fees typically consisting of all future EB PC of the acquired wealth management firm in excess of Base Earnings up to Target Earnings, plus a percentage of any EBPC in excess of Target Earnings. Acquired Base Earnings is equal to our retained cumulat ive preferred position in Base Earnings. We are entitled to receive these earnings notwithstanding any earnings that we are entitled to receive in excess of Target Earnings. Base Earnings may change in future periods for various bu siness or contractual matters. 5. Tax Adjustments represent the tax benefits of intangible assets, including goodwill, associated with deductions allowed for t ax amortization of intangible assets in the respective periods based on a pro forma 27% income tax rate. Such amounts were generated from acquisitions completed where the Company received a step - up in basis for tax purposes. Ac quired intangible assets may be amortized for tax purposes, generally over a 15 - year period. Due to the Company’s acquisitive nature, tax deductions allowed on acquired intangible assets provide additional significant sup plemental economic benefit. The tax benefit from amortization is identified to show the full economic benefit of deductions for acquired intangible assets with the step - up in tax basis. 6. Net leverage ratio represents the First Lien Leverage Ratio (as defined in the Credit Facility) and means the ratio of amount s o utstanding under the First Lien Term Loan and First Lien Revolver plus other outstanding debt obligations secured by a lien on the assets of Focus LLC (excluding letters of credit other than unpaid drawings thereunder) min us unrestricted cash and cash equivalents to Consolidated EBITDA (as defined in the Credit Facility). 11 Net Leverage & Cash Flow ▪ Q4 Net Leverage Ratio: (6) 3 .79x ▪ Net cash provided by operating activities: $ 242.1 million (LTM Q1 2021), +32.8% year - over - year ▪ Cash Flow Available for Capital Allocation: (2) $219.9 million (LTM Q1 2021), +51.8% year - over - year ▪ Unamortized Gross Tax Shield at March 31, 2021 of $1.7+ billion ▪ Tax receivable agreement payments: $4.1 million

$374.8m , 95.1% $19.4m , 4.9% Wealth Management Fees Other ▪ Holistic wealth management fees tied to team - based service model ▪ Not a commission or interest revenue based model We Have Multiple Sources of Revenue Diversification $306.4m , 77.7% $87.8m , 22.3% Revenues Correlated to Markets Correlated to Markets Not Correlated to Markets ▪ Advance billing structure used by majority of partner firms gives visibility into subsequent quarter ▪ High diversification of billing practices across 72 partner firms is an embedded revenue hedge ▪ Non - correlated revenues typically include fixed fees for investment advice, tax fees and family office type services ▪ Diversification reduces market risk to revenue stream ▪ International sources provide some revenue diversification ▪ 7 partner firms across Australia, Canada, and the UK, together with partner firm Connectus , are platforms for growth $371.0m , 94.1% $23.2m , 5.9% Domestic International Q1 2021 Revenues by Source Q1 2021 Revenues by Region Q1 2021 Revenues Correlated to Markets 12 $206.0m , 67.2% $100.4m , 32.8% Billing Structure of Market - Correlated Revenues Advance Arrears

Q1 Performance Reflected Continued Strong Execution and Acceleration of Business Momentum 13 Q1 2021 results exceeded our expectations and demonstrated strong year - over - year growth ▪ Q1 revenues of $394.2 million, above the top of the $375 - $385 million Q1 outlook. ▪ Adjusted EBITDA margin (1) was 25.6%, compared to 24.5% Q1 outlook; embedded operating leverage another benefit of our growing scale. ▪ Net Leverage Ratio (2) of 3.79x as of March 31, 2021, at the low end of our Q1 outlook of 3.75x to 4.00x. ▪ Cash Flow Available for Capital Allocation (3) of $219.9 million (LTM Q1 2021), up 51.8% year - over - year. Our year - to - date M&A momentum has been strong ▪ Closed 3 new partner firms and mergers for SCS Financial and LaFleur & Godfrey. ▪ Expanded partner firm Connectus globally through mergers in the UK and Australia. ▪ Our pipeline is excellent and building as our value proposition continues to resonate in the market. We expanded our presence in the UHNW market, an increasing strategic focus ▪ Launched Beryllus Capital, a global multi - family office, in a joint - venture with the Hinduja Group. We evolved our value - added services in areas integral to holistic wealth management services • We are adding capabilities in insurance, trust and fiduciary solutions, valuation services, business development and alternative investments, and we continue to enhance our cash management and credit capabilities. 1. Calculated as Adjusted EBITDA divided by revenues. 2. Net leverage ratio represents the First Lien Leverage Ratio (as defined in the Credit Facility) and means the ratio of amount s o utstanding under the First Lien Term Loan and First Lien Revolver plus other outstanding debt obligations secured by a lien on the assets of Focus LLC (excluding letters of credit other than unpai d d rawings thereunder) minus unrestricted cash and cash equivalents to Consolidated EBITDA (as defined in the Credit Facility). 3. Non - GAAP financial measure. See appendix for reconciliations.
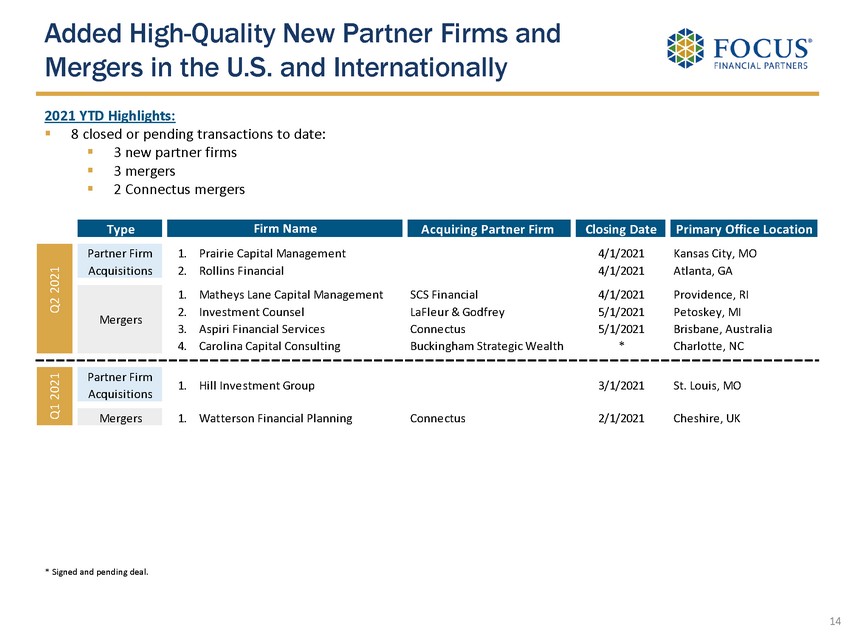
Added High - Quality New Partner Firms and Mergers in the U.S. and Internationally 14 2021 YTD Highlights: ▪ 8 closed or pending transactions to date: ▪ 3 new partner firms ▪ 3 mergers ▪ 2 Connectus mergers * Signed and pending deal. Type Acquiring Partner Firm Closing Date Primary Office Location 1. Prairie Capital Management 4/1/2021 Kansas City, MO 2. Rollins Financial 4/1/2021 Atlanta, GA 1. Matheys Lane Capital Management SCS Financial 4/1/2021 Providence, RI 2. Investment Counsel LaFleur & Godfrey 5/1/2021 Petoskey, MI 3. Aspiri Financial Services Connectus 5/1/2021 Brisbane, Australia 4. Carolina Capital Consulting Buckingham Strategic Wealth * Charlotte, NC Partner Firm Acquisitions 1. Hill Investment Group 3/1/2021 St. Louis, MO Mergers 1. Watterson Financial Planning Connectus 2/1/2021 Cheshire, UK Firm Name Q1 2021 Partner Firm Acquisitions Q2 2021 Mergers

Our Business Model Has Multiple Elements Which Contribute to its Strength and Resiliency ~95%+ (1) of Revenues are Fee - Based and Recurring with No Interest Income Dependency Preference Creates Downside Earnings Protection 22% (1) of Revenues Not Correlated to the Markets Client Portfolios are Balanced and Allocated Across Asset Classes UHNW - HNW Client Base is Sticky ~70 Partner Firms Have Their Own Investment Philosophies Management Fees are Tied to Partner Firm Profitability Highly Variable and Cap - Ex Light Cost Structure 15 1. For Q1 2021.

We are Well Positioned for Strong Growth Over the Long Term Due t o Our… 16 Industry - Leading Scale Leading Partnership of 70+ Independent Fiduciary Firms 16 - Year Track Record High Growth, Resilient Business Model Strong Financial Fundamentals Ample Growth Capital 1 6 2 5 3 4

17 Second Quarter 2021 Outlook

▪ Estimated revenues of ~$ 405 to $ 415 million ▪ Estimated Q2 organic revenue growth of ~23 to 26% (1) ; Q2 2020 prior year revenues reflected Covid related decline in market levels on advance billings ▪ Estimated revenue attributable to new partner firms closing: $7 million* * Relates to closing of Hill Investment Group on 3/1/21, Prairie Capital Management and Rollins Financial on 4/1/21. ▪ Estimated Adjusted EBITDA (2) margin (3) of approximately ~25.5% ▪ Estimated Adjusted EBITDA (2) attributable to new partner firms closing: $2.6 million* ▪ Estimated Acquired Base Earnings (4) : $10 million** ** Relates to closing of Prairie Capital Management and Rollins Financial on 4/1/21. ▪ Q2 2021 Net Leverage Ratio (6) ~3.5 - 3.75x ▪ Estimated cash earnout payments in Q2 2021 of ~$55 million ▪ Next twelve months Tax Adjustments (5) of ~$41.9 million Q2 2021 Outlook 1. Organic revenue growth represents the period - over - period growth in revenue related to partner firms, including growth related to acquisitions of wealth management practices and customer relationships by our partner firms, including Connectus , and partner firms that have merged, that for the entire periods presented, are included in our consolidated statements of o per ations for each of the entire periods presented. We believe these growth statistics are useful in that they present full period revenue growt h o f partner firms on a ‘‘same store’’ basis exclusive of the effect of the partial period results of partner firms that are acquired during the comparable periods. 2. Non - GAAP financial measure. The Company is not providing a quantitative reconciliation of its forward - looking estimate of Adjust ed EBITDA or Adjusted EBITDA margin to its most directly comparable GAAP financial measure because such GAAP measure, which is not included in the Company’s outlook, is difficult to rel iably predict or estimate without unreasonable effort due to its dependency on future uncertainties such as the items noted under the heading “Special Note Regarding Forward - Looking Statements. ” In addition, we believe such a reconciliation could imply a degree of precision that might be confusing or misleading to investors. 3. Calculated as Adjusted EBITDA divided by revenues. 4. The terms of our management agreements entitle the management companies to management fees typically consisting of all future EB PC of the acquired wealth management firm in excess of Base Earnings up to Target Earnings, plus a percentage of any EBPC in excess of Target Earnings. Acquired Base Earnings is equal t o o ur retained cumulative preferred position in Base Earnings. We are entitled to receive these earnings notwithstanding any earnings that we are entitled to receive in excess of Target Earnings. Ba se Earnings may change in future periods for various business or contractual matters. 5. See note 5 on page 11 for additional information regarding Tax Adjustments. Based on a 27.0% tax rate. 6. Net Leverage Ratio represents the First Lien Leverage Ratio (as defined in the Credit Facility), and means the ratio of amoun ts outstanding under the First Lien Term Loan and First Lien Revolver plus other outstanding debt obligations secured by a lien on the assets of Focus LLC (excluding letters of credit other than unpai d d rawings thereunder) minus unrestricted cash and cash equivalents to Consolidated EBITDA (as defined in the Credit Facility). 18 Revenues Adjusted EBITDA Tax Adjustments Net Leverage and Cash Flow

A Diversified Portfolio of Complementary Businesses 19

RETIREMENT PLAN ADMINISTRATION INSURANCE & RISK MANAGEMENT LEGACY, FOUNDATION, GOVERNANCE & EDUCATION PHILANTHROPY CASH & CREDIT SOLUTIONS FINANCIAL & ESTATE PLANNING PORTFOLIO MANAGEMENT PERSONAL CFO TAX ADVICE & PREPARATION ARTIST & ENTERTAINER SERVICES UHNW & HNW CLIENTS Our Diverse Mix of Partner Firms Drives Outstanding Long - Term Growth 2015 – 2020 CAGR Revenues +28.9% Adjusted EBITDA (1) +33.7% Adjusted Net Income Excl Tax Adjustments (1) +34.6% Tax Adjustments (2) +35.8% 1. Non - GAAP financial measure. See Appendix for reconciliations. 2. See note 5 on page 11 for additional information regarding Tax Adjustments. Based on a 27.0% tax rate. 20

Evolution in our Value - Added Services 21

Value - Added Services: Supporting Partner Firm Growth & Value Creation 22 x Mergers & Acquisitions x Strategy x Marketing & Organic Growth x Operations & Technology x Portfolio Analytics x Talent Management & Leadership x Finance, Legal & Regulatory x Best Practices & Knowledge Sharing Enhances client outcomes by expanding services & capabilities through the power of the Focus partnership Supports strategic vision and accelerates growth through the extension of resources, capital and scale x Cash & Credit Solutions x Trust Solutions x Portfolio Optimization x Valuation Services x Insurance Solutions x Family Office Services CLIENT SOLUTIONS BUSINESS SOLUTIONS

Broad range of valuation services x Estate planning x Shareholder buyouts x Fairness & solvency opinions x Trademarks & copyrights x Royalty agreements x Publishing libraries & rights Expanded Value - Added Services to our Partner Firms and their Clients 23 Trust Insurance Trust Trust Solutions Trust Alternative Investments Valuation Services Trust Business Development Trust Cash and Credit Traditional & specialized banking services x Cash management x Bespoke credit solutions x Mortgage lending x Commercial / business lending x Hybrid security lines x Debit card / mobile banking Dedicated trust solutions x Trust jurisdictions: SD, DE & TN x Independent trustees with scale and deep expertise x Competitive pricing and service requirements x Focus Trust & Estate Officer Access to high - quality alternative investments x Industry - leading private equity strategies through Focus partner firm x Specially negotiated pricing x Central theme for sophisticated client portfolios Comprehensive portfolio of offerings x Property & casualty x Life & disability x Executive benefits x Individual & business health x Curated concierge services Catalyst for organic growth x Client referrals x Lead generation capabilities x PR & marketing programs x Coaching and best practices x Proprietary COI network Providing our partner firms with sophisticated client service capabilities by leveraging our scale and relationships with premier service providers

Leverage 24

Strong Credit and Liquidity Profile (1) Creates an Important Margin of Safety Low debt cost ~2.4% weighted average interest rate on funded borrowings Limited duration risk ~3.25 years remaining to maturity for Term Loan (July 2024) ~2.25 years remaining to maturity for Revolver (July 2023) Interest rates Beneficiary of favorable rate environment 95%+ fee - based and recurring revenues, variable management fees and earnings preference protect cash flows Downside protection 25 1. As of March 31, 2021. Ample liquidity ~$0.6 billion undrawn revolver + ~$170 million cash

$12m $19m $35m $35m $38m $39m $39m $57m $58m Q1 2019 Q2 2019 Q3 2019 Q4 2019 Q1 2020 Q2 2020 Q3 2020 Q4 2020 Q1 2021 Cumulative Acquired Base Earnings (4) Q1 2019 to Q1 2021 Equity market decline (20)% (40)% Assumed Client Portfolio Allocation to Equities 50% 50% Decline in market-correlated revenues (1) (10)% (20)% ($ in millions) Reported Q1'21 Market-Correlated Revenues 306.4$ 275.8$ 245.1$ Q1'21 Non-Correlated Revenues 87.8$ 87.8$ 87.8$ Total Revenue - Q1 394.2$ 363.6$ 332.9$ Covenant EBITDA (2) - LTM 383.4$ 369.0$ 358.3$ Net Debt (3) 1,454.0$ 1,454.0$ 1,454.0$ Net Leverage Ratio (2) 3.79x 3.94x 4.06x Change from Q1 Reported 0.15x 0.27x Sensitivity Analysis (Illustrative Only) Earnings Preference Provides Strong Downside Earnings Protection 1. The analysis depicts the impact on our Net Leverage Ratio (as defined in the Credit Facility) resulting from a hypothetical c han ge in Q1 market correlated revenues only. All other revenues/expenses were kept constant except management fees, which are tied to the profitability of our partner firms. 2. Net leverage ratio represents the First Lien Leverage Ratio (as defined in the Credit Facility), and means the ratio of amoun ts outstanding under the First Lien Term Loan and First Lien Revolver plus other outstanding debt obligations secured by a lien on the assets of Focus LLC (excluding letters of credit other than unpaid drawings thereunder) min us unrestricted cash and cash equivalents to Consolidated EBITDA (as defined in the Credit Facility), which in the above table is referred to as “Covenant EBITDA.” 3. Net Debt represents amounts outstanding under the First Lien Term Loan and First Lien Revolver plus other outstanding debt ob lig ations secured by a lien on the assets of Focus LLC (excluding letters of credit other than unpaid drawings thereunder) minus unrestricted cash and cash equivalents. 4. The terms of our management agreements entitle the management companies to management fees typically consisting of all future EB PC of the acquired wealth management firm in excess of Base Earnings up to Target Earnings, plus a percentage of any EBPC in excess of Target Earnings. Acquired Base Earnings is equal to our retained cumulat ive preferred position in Base Earnings. We are entitled to receive these earnings notwithstanding any earnings that we are entitled to receive in excess of Target Earnings. Base Earnings may change in future periods for var iou s business or contractual matters. ▪ Reflects one - quarter impact to revenues and Covenant EBITDA (1)(2) ▪ Assumes all other revenue sources and expenses remain unchanged except for management fees ▪ In the event of a multi - quarter downturn ▪ Partner firms would further reduce their cost structure ▪ M&A activity would moderate ▪ Cash flow would be available for debt r epayment ▪ Significant head room on covenant ▪ Q1 Covenant EBITDA - LTM (2) would need to drop to $150.7 million, or decline by 39%, to reach 6.25x net leverage ratio covenant 26

Cash Flows 27

$182.2 $144.8 $242.1 $219.9 Net cash provided by operating activities Cash Flow Available for Capital Allocation Q1 2020 LTM Q1 2021 LTM Q2 2021 Primary Uses, Excluding Future M&A Activities Sustained Strong Growth in Cash Flow As % of Adjusted EBITDA (1) 49% 64% Cash Flows ▪ Q2 2021 estimated cash earnouts of ~$55 million (2) ▪ Tax Receivable Agreements (“TRA”) payments: ▪ No significant TRA payments expected in Q2 or the remainder of the year ▪ TRA liability will be paid out over 15+ years, subject to utilization of tax deductions ▪ Q2 2021 required term loan amortization of ~$4.2 million ($16.7 million per year) ▪ Based on the terms of the Credit Facility, no excess cash flow payments required in 2021 ($ in millions) 1. Non - GAAP financial measure. See Appendix for reconciliations. 2. Based on certain assumptions that could change materially. 28 Q2 2021 Capital Allocation Priorities ▪ Strategic M&A to continue capitalizing on industry consolidation ▪ Fund earnout payments + 33 % (1) +52%
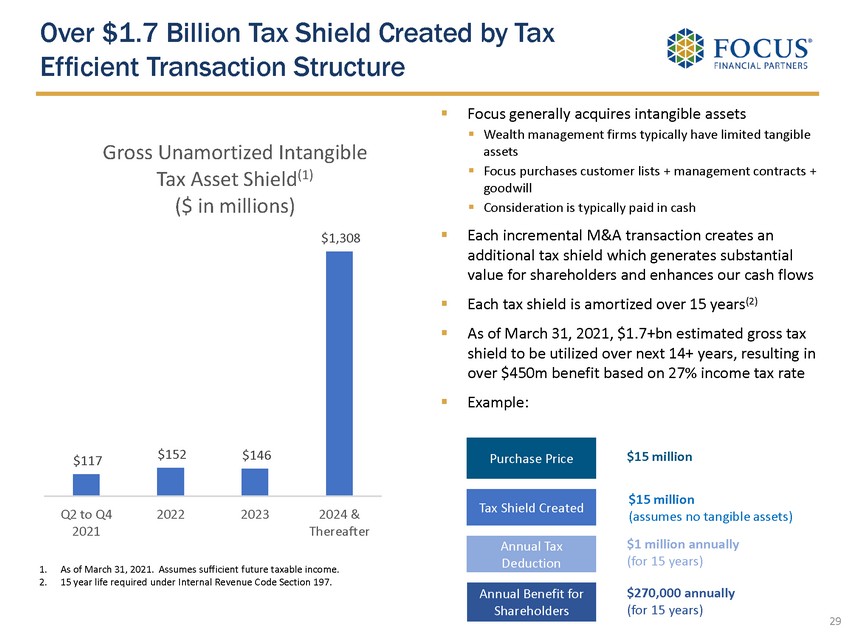
Over $1.7 Billion Tax Shield Created by Tax Efficient Transaction Structure 29 $117 $152 $146 $1,308 Q2 to Q4 2021 2022 2023 2024 & Thereafter Gross Unamortized Intangible Tax Asset Shield (1) ($ in millions) 1. As of March 31, 2021. Assumes sufficient future taxable income. 2. 15 year life required under Internal Revenue Code Section 197. ▪ Focus generally acquires intangible assets ▪ Wealth management firms typically have limited tangible assets ▪ Focus purchases customer lists + management contracts + goodwill ▪ Consideration is typically paid in cash ▪ Each incremental M&A transaction creates an additional tax shield which generates substantial value for shareholders and enhances our cash flows ▪ Each tax shield is amortized over 15 years (2) ▪ As of March 31, 2021, $1.7+bn estimated gross tax shield to be utilized over next 14+ years, resulting in over $450m benefit based on 27% income tax rate ▪ Example: Purchase Price $15 million Tax Shield Created $15 million (assumes no tangible assets) $1 million annually (for 15 years) Annual Tax Deduction $270,000 annually (for 15 years) Annual Benefit for Shareholders
Appendix 30

Net Income (Loss) to Adjusted EBITDA Reconciliation 1. Represents one - time expenses primarily related to an acquisition and our IPO and Reorganization Transactions. Refer to our 10 - Q and 10 - K filings for additional details. 31 ($ in thousands) 2015 2016 2017 2018 2019 2020 March 31, 2020 March 31, 2021 Net income (loss) 9,321$ 15,722$ (48,359)$ (41,087)$ (12,025)$ 48,965$ 34,019$ 2,482$ Interest income (90) (88) (222) (1,266) (1,164) (453) (285) (47) Interest expense 9,977 21,327 41,861 56,448 58,291 41,658 13,586 10,521 Income tax expense (benefit) 649 981 (1,501) 9,450 7,049 20,660 12,070 1,186 Amortization of debt financing costs 1,770 2,482 4,084 3,498 3,452 2,909 782 852 Intangible amortization 35,421 50,942 64,367 90,381 130,718 147,783 35,723 42,983 Depreciation and other amortization 5,327 5,680 6,686 8,370 10,675 12,451 2,982 3,607 Non-cash equity compensation expense 13,537 8,520 34,879 44,468 18,329 22,285 5,034 12,356 Non-cash changes in fair value of estimated contingent consideration (160) (1,143) 22,294 6,638 38,797 19,197 (31,373) 25,936 Gain on sale of investment — — — (5,509) — — — — Loss on extinguishment of borrowings — — 8,106 21,071 — 6,094 6,094 — Other expense (income), net (310) (1,385) 3,191 2,350 1,049 214 (612) (3) Impairment of equity method investment — — — — 11,749 — — — Management contract buyout — — — — 1,428 — — — Delayed offering cost expense — — 9,840 — — — — — Secondary offering expenses — — — — — — — 1,122 Other one-time transaction expenses (1) — — — 8,590 1,486 — — — Adjusted EBITDA 75,442$ 103,038$ 145,226$ 203,402$ 269,834$ 321,763$ 78,020$ 100,995$ Three months ended

Net Income (Loss) to Adjusted Net Income Excluding Tax Adjustments and Adjusted Net Income Excluding Tax Adjustments Per Share Reconciliation * Refer to the following pages for footnotes 32 2015 2016 2017 2018 2019 2020 March 31, 2020 March 31, 2021 ($ in thousands, except share and per share data) Net income (loss) 9,321$ 15,722$ (48,359)$ (41,087)$ (12,025)$ 48,965$ 34,019$ 2,482$ Income tax expense (benefit) 649 981 (1,501) 9,450 7,049 20,660 12,070 1,186 Amortization of debt financing costs 1,770 2,482 4,084 3,498 3,452 2,909 782 852 Intangible amortization 35,421 50,942 64,367 90,381 130,718 147,783 35,723 42,983 Non-cash equity compensation expense 13,537 8,520 34,879 44,468 18,329 22,285 5,034 12,356 Non-cash changes in fair value of estimated contingent consideration (160) (1,143) 22,294 6,638 38,797 19,197 (31,373) 25,936 Gain on sale of investment — — — (5,509) — — — — Loss on extinguishment of borrowings — — 8,106 21,071 — 6,094 — — Impairment of equity method investment — — — — 11,749 — 6,094 — Delayed offering cost expense — — 9,840 — — — — — Management contract buyout — — — — 1,428 — — — Secondary offering expenses — — — — — — — 1,122 Other one-time transaction expenses (1) — — 2,843 11,529 1,486 — — — Subtotal 60,538 77,504 96,553 140,439 200,983 267,893 62,349 86,917 Pro forma income tax (27%) (2) (16,345) (20,926) (26,069) (37,919) (54,265) (72,331) (16,834) (23,468) Adjusted Net Income Excluding Tax Adjustments 44,193$ 56,578$ 70,484$ 102,520$ 146,718$ 195,562$ 45,515$ 63,449$ Tax Adjustments (3) 8,080$ 11,991$ 16,217$ 22,828$ 31,860$ 37,254$ 8,935$ 10,492$ Adjusted Net Income Excluding Tax Adjustments Per Share 0.62$ 0.78$ 0.98$ 1.42$ 1.96$ 2.46$ 0.62$ 0.80$ Tax Adjustments Per Share (3) 0.11$ 0.17$ 0.23$ 0.32$ 0.42$ 0.47$ 0.12$ 0.13$ Adjusted Shares Outstanding (4) 71,843,916 71,843,916 71,843,916 71,960,540 75,039,357 79,397,568 73,132,756 79,606,295 Calculation of Adjusted Shares Outstanding: Weighted average shares of Class A common stock outstanding—basic (5) — — — 43,122,782 46,792,389 48,678,584 47,436,555 52,200,029 Adjustments: Shares of Class A common stock issued in connection with the IPO and Reorganization Transactions (6) 42,529,651 42,529,651 42,529,651 — — — — — Weighted average incremental shares of Class A common stock related to stock options, unvested Class A common stock and restricted stock units (7) — — — 102,549 20,428 118,029 4,617 454,793 Weighted average Focus LLC common units outstanding (8) 22,499,665 22,499,665 22,499,665 22,630,668 22,424,378 21,461,080 22,020,124 19,723,223 Weighted average Focus LLC restricted common units outstanding (9) — — — — — 5,005 — 71,374 Weighted average common unit equivalent of Focus LLC incentive units outstanding (10) 6,814,600 6,814,600 6,814,600 6,104,541 5,802,162 9,134,870 3,671,460 7,156,876 Adjusted Shares Outstanding 71,843,916 71,843,916 71,843,916 71,960,540 75,039,357 79,397,568 73,132,756 79,606,295 Three months ended
* These footnotes refer to the tables on the previous pages. 1. In 2017, related to insurance fees associated with the investment by our private equity investors. In 2018 and 2019, represen ts one - time expenses primarily related to an acquisition and our IPO and Reorganization Transactions. Refer to our 10 - Q and 10 - K filings for additional details. 2. The pro forma income tax rate of 27% reflects the estimated U.S. Federal, state, local and foreign income tax rates applicabl e t o corporations in the jurisdictions we conduct business. 3. Tax Adjustments represent the tax benefits of intangible assets, including goodwill, associated with deductions allowed for t ax amortization of intangible assets in the respective periods based on a pro forma 27% income tax rate. Such amounts were generated from acquisitions completed where we received a step - up in basis for tax purposes. Acquired intangible assets may be amortized for tax purposes, generally over a 15 - year period. Due to our acquisitive nature, tax deductions allowed on acquired intangible assets provide additional significant supplemental economic benefit. The tax benefit from amortization is included to show the full economic benefit of deductions for acquired intangible assets with the step - up in tax basis. As of March 31, 2021, estimated Tax Adjustments from intangible asset related income tax benefits from closed acquisitions based on a pro forma 27% income tax rate for the next 12 months is $41.9 million. 4. For periods ended prior to the closing of the IPO and the consummation of the Reorganization Transactions on July 30, 2018, the Adjusted Shares Outstanding are deemed to be outstanding for comparative purposes only. 5. Represents our GAAP weighted average Class A common stock outstanding – basic. 6. The issuance of Class A common stock that occurred upon closing of the IPO and the consummation of the Reorganization Transactions on July 30, 2018 is assumed to have occurred as of January 1, 2015 for comparative purposes. 7. Represents the incremental shares related to stock options, unvested Class A common stock and restricted stock units as calculated under the treasury stock method. 8. Assumes that 100% of the Focus LLC common units were exchanged for Class A common stock. 9. Assumes that 100% of the Focus LLC restricted common units were exchanged for Class A common stock. 10. Assumes that 100% of the vested and unvested Focus LLC incentive units were converted into Focus LLC common units based on the closing price of our Class A common stock at the end of the respective period and such Focus LLC common units were exchanged for Class A common stock. For the periods ending prior to July 30, 2018, the conversion to Focus LLC common units was based on the $33.00 IPO price. 33 Net Income (Loss) to Adjusted Net Income Excluding Tax Adjustments and Adjusted Net Income Excluding Tax Adjustments Per Share Reconciliation
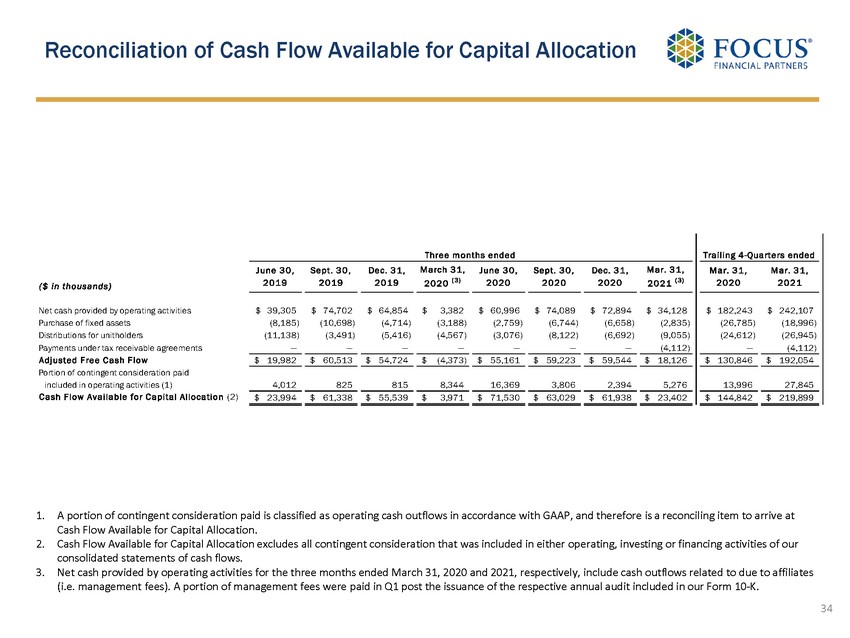
Reconciliation of Cash Flow Available for Capital Allocation 34 1. A portion of contingent consideration paid is classified as operating cash outflows in accordance with GAAP, and therefore is a reconciling item to arrive at Cash Flow Available for Capital Allocation. 2. Cash Flow Available for Capital Allocation excludes all contingent consideration that was included in either operating, inves tin g or financing activities of our consolidated statements of cash flows. 3. Net cash provided by operating activities for the three months ended March 31, 2020 and 2021, respectively, include cash outf low s related to due to affiliates (i.e. management fees). A portion of management fees were paid in Q1 post the issuance of the respective annual audit included in our Form 10 - K. ($ in thousands) June 30, 2019 Sept. 30, 2019 Dec. 31, 2019 March 31, 2020 (3) June 30, 2020 Sept. 30, 2020 Dec. 31, 2020 Mar. 31, 2021 (3) Mar. 31, 2020 Mar. 31, 2021 Net cash provided by operating activities 39,305$ 74,702$ 64,854$ 3,382$ 60,996$ 74,089$ 72,894$ 34,128$ 182,243$ 242,107$ Purchase of fixed assets (8,185) (10,698) (4,714) (3,188) (2,759) (6,744) (6,658) (2,835) (26,785) (18,996) Distributions for unitholders (11,138) (3,491) (5,416) (4,567) (3,076) (8,122) (6,692) (9,055) (24,612) (26,945) Payments under tax receivable agreements — — — — — — — (4,112) — (4,112) Adjusted Free Cash Flow 19,982$ 60,513$ 54,724$ (4,373)$ 55,161$ 59,223$ 59,544$ 18,126$ 130,846$ 192,054$ Portion of contingent consideration paid included in operating activities (1) 4,012 825 815 8,344 16,369 3,806 2,394 5,276 13,996 27,845 Cash Flow Available for Capital Allocation (2) 23,994$ 61,338$ 55,539$ 3,971$ 71,530$ 63,029$ 61,938$ 23,402$ 144,842$ 219,899$ Trailing 4-Quarters endedThree months ended
Serious News for Serious Traders! Try StreetInsider.com Premium Free!
You May Also Be Interested In
- Linde to Increase Green Hydrogen Production in Brazil
- Henry Schein Supports The ‘Carry The Load’ Memorial May Campaign For Third Consecutive Year
- Cerevel Therapeutics Announces Positive Topline Results for Tavapadon in Phase 3 Adjunctive Trial for People Living with Parkinson’s Disease
Create E-mail Alert Related Categories
SEC FilingsSign up for StreetInsider Free!
Receive full access to all new and archived articles, unlimited portfolio tracking, e-mail alerts, custom newswires and RSS feeds - and more!
