

Form 8-K FLUSHING FINANCIAL CORP For: Jul 28
 Tweet
Tweet Share
ShareExhibit 99.1
| “Small Enough To Know You. Large Enough To Help You.” 2Q21 Earnings Conference Call July 28, 2021 “Small Enough To Know You. Large Enough To Help You.” |

| Safe Harbor Statement “Safe Harbor” Statement under the Private Securities Litigation Reform Act of 1995: Statements in this Presentation relating to plans, strategies, economic performance and trends, projections of results of specific activities or investments and other statements that are not descriptions of historical facts may be forward- looking statements within the meaning of the Private Securities Litigation Reform Act of 1995, Section 27A of the Securities Act of 1933 and Section 21E of the Securities Exchange Act of 1934. Forward-looking information is inherently subject to risks and uncertainties, and actual results could differ materially from those currently anticipated due to a number of factors, which include, but are not limited to, risk factors discussed in the Company’s Annual Report on Form 10-K for the fiscal year ended December 31, 2020 and in other documents filed by the Company with the Securities and Exchange Commission from time to time. Forward- looking statements may be identified by terms such as “may”, “will”, “should”, “could”, “expects”, “plans”, “intends”, “anticipates”, “believes”, “estimates”, “predicts”, “forecasts”, “goals”, “potential” or “continue” or similar terms or the negative of these terms. Although we believe that the expectations reflected in the forward- looking statements are reasonable, we cannot guarantee future results, levels of activity, performance or achievements. The Company has no obligation to update these forward-looking statements. 2 |
| Emerging from the Pandemic a Stronger Company • Since the end of 2019 (the last pre-pandemic year): ‒ Closed the Empire National Bank acquisition; adding $1 billion of assets ‒ Enhanced earnings power • NIM expansion • Improved efficiency ‒ Asset quality remains pristine with minimal credit losses ‒ Tangible book value has increased, even with the dilution from the Empire Bank acquisition ‒ Significantly enhanced digital banking platforms • GAAP and Core EPS in 1H21 running at 84% and 76%, respectively, of full year 2019 levels • The Board of Directors authorized a 1MM share increase in share repurchase authorization 3 Overall Flushing Financial is a More Resilient Company |
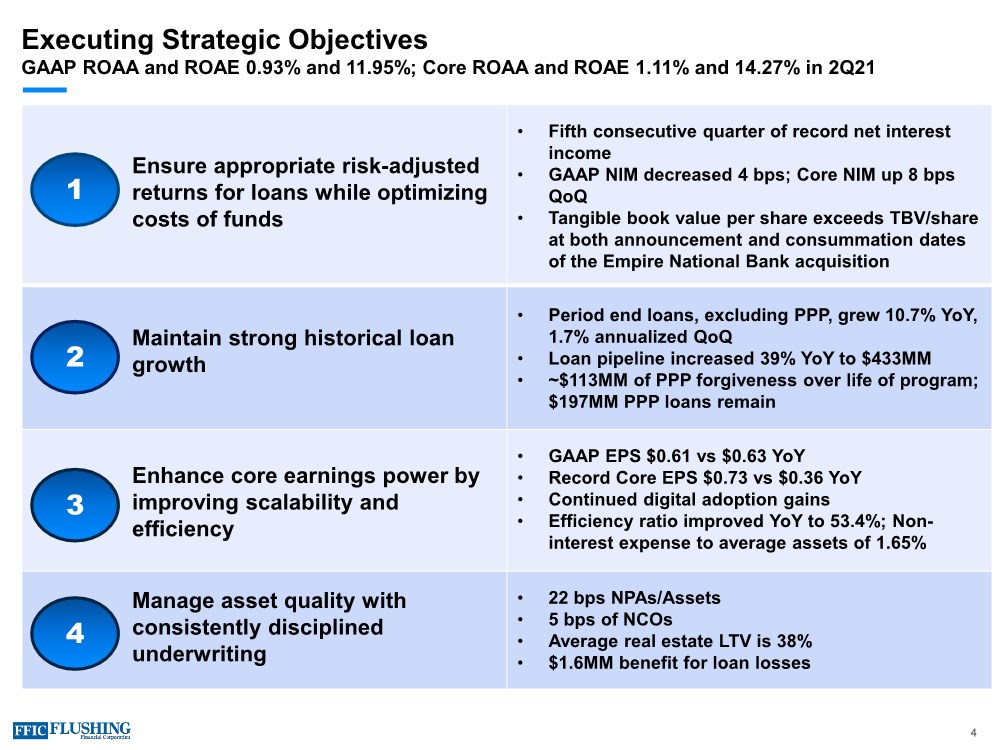
| Ensure appropriate risk-adjusted returns for loans while optimizing costs of funds • Fifth consecutive quarter of record net interest income • GAAP NIM decreased 4 bps; Core NIM up 8 bps QoQ • Tangible book value per share exceeds TBV/share at both announcement and consummation dates of the Empire National Bank acquisition Maintain strong historical loan growth • Period end loans, excluding PPP, grew 10.7% YoY, 1.7% annualized QoQ • Loan pipeline increased 39% YoY to $433MM • ~$113MM of PPP forgiveness over life of program; $197MM PPP loans remain Enhance core earnings power by improving scalability and efficiency • GAAP EPS $0.61 vs $0.63 YoY • Record Core EPS $0.73 vs $0.36 YoY • Continued digital adoption gains • Efficiency ratio improved YoY to 53.4%; Non- interest expense to average assets of 1.65% Manage asset quality with consistently disciplined underwriting • 22 bps NPAs/Assets • 5 bps of NCOs • Average real estate LTV is 38% • $1.6MM benefit for loan losses Executing Strategic Objectives GAAP ROAA and ROAE 0.93% and 11.95%; Core ROAA and ROAE 1.11% and 14.27% in 2Q21 4 1 2 3 4 |
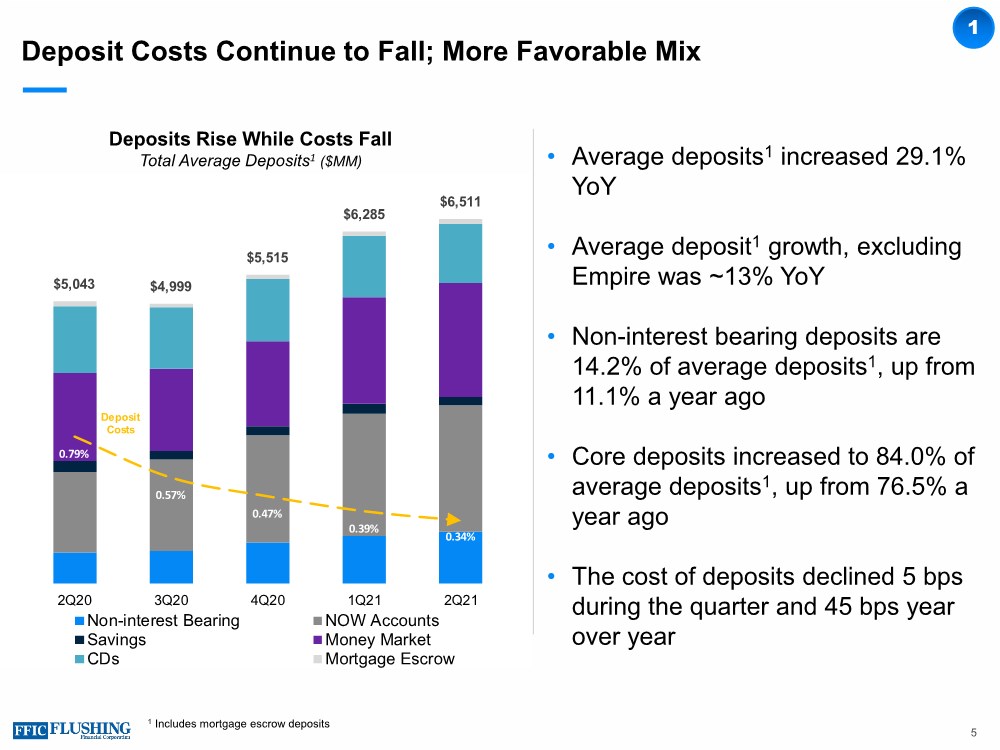
| Deposit Costs Continue to Fall; More Favorable Mix • Average deposits1 increased 29.1% YoY • Average deposit1 growth, excluding Empire was ~13% YoY • Non-interest bearing deposits are 14.2% of average deposits1, up from 11.1% a year ago • Core deposits increased to 84.0% of average deposits1, up from 76.5% a year ago • The cost of deposits declined 5 bps during the quarter and 45 bps year over year 5 Deposits Rise While Costs Fall Total Average Deposits1 ($MM) 1 $5,043 $4,999 $5,515 $6,285 $6,511 0.79% 0.57% 0.47% 0.39% 0.34% 0 1000 2000 3000 4000 5000 6000 7000 2Q20 3Q20 4Q20 1Q21 2Q21 Non-interest Bearing NOW Accounts Savings Money Market CDs Mortgage Escrow Deposit Costs 1 Includes mortgage escrow deposits |
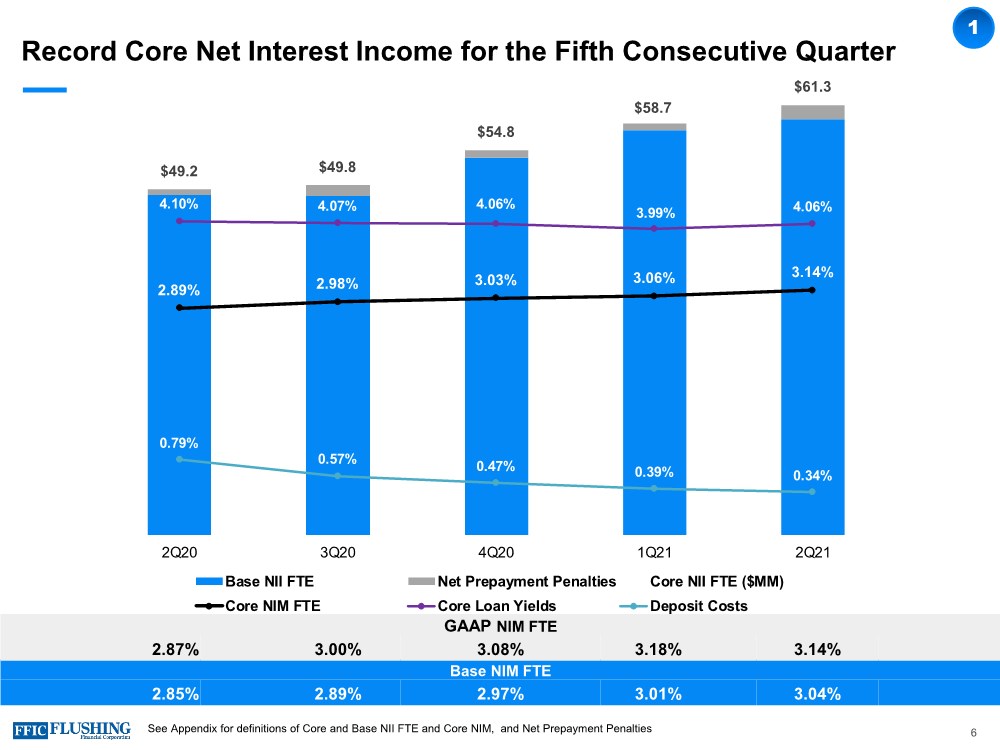
| $49.2 $49.8 $54.8 $58.7 $61.3 2.89% 2.98% 3.03% 3.06% 3.14% 4.10% 4.07% 4.06% 3.99% 4.06% 0.79% 0.57% 0.47% 0.39% 0.34% -0.25% 0.75% 1.75% 2.75% 3.75% 4.75% 5.75% 6.75% $0.0 $10.0 $20.0 $30.0 $40.0 $50.0 $60.0 $70.0 2Q20 3Q20 4Q20 1Q21 2Q21 Base NII FTE Net Prepayment Penalties Core NII FTE ($MM) Core NIM FTE Core Loan Yields Deposit Costs Record Core Net Interest Income for the Fifth Consecutive Quarter 6 1 See Appendix for definitions of Core and Base NII FTE and Core NIM, and Net Prepayment Penalties Base NIM FTE 2.85% 2.89% 2.97% 3.01% 3.04% GAAP NIM FTE 2.87% 3.00% 3.08% 3.18% 3.14% |
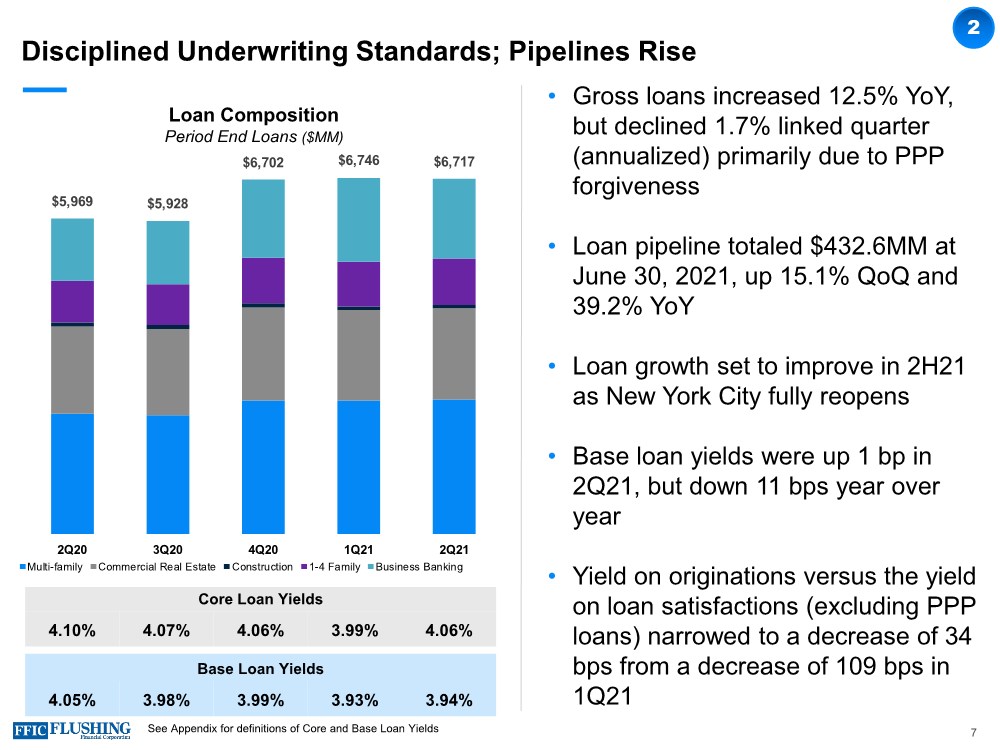
| Disciplined Underwriting Standards; Pipelines Rise 7 2 Core Loan Yields 4.10% 4.07% 4.06% 3.99% 4.06% Period End Loans Rise ___% ($MM) • Gross loans increased 12.5% YoY, but declined 1.7% linked quarter (annualized) primarily due to PPP forgiveness • Loan pipeline totaled $432.6MM at June 30, 2021, up 15.1% QoQ and 39.2% YoY • Loan growth set to improve in 2H21 as New York City fully reopens • Base loan yields were up 1 bp in 2Q21, but down 11 bps year over year • Yield on originations versus the yield on loan satisfactions (excluding PPP loans) narrowed to a decrease of 34 bps from a decrease of 109 bps in 1Q21 $5,969 $5,928 $6,702 $6,746 $6,717 - 1, 000 2, 000 3, 000 4, 000 5, 000 6, 000 7, 000 8, 000 2Q20 3Q20 4Q20 1Q21 2Q21 Multi-family Commercial Real Estate Construction 1-4 Family Business Banking Loan Composition Period End Loans ($MM) Base Loan Yields 4.05% 3.98% 3.99% 3.93% 3.94% See Appendix for definitions of Core and Base Loan Yields |
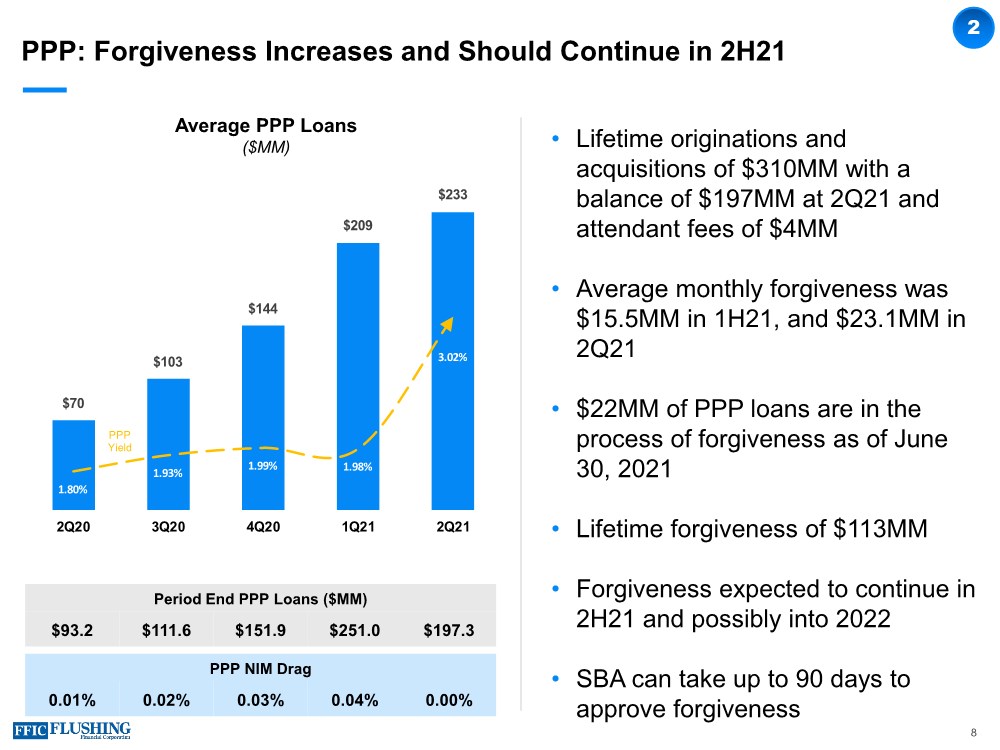
| $70 $103 $144 $209 $233 1.80% 1.93% 1.99% 1.98% 3.02% 0 50 100 150 200 250 2Q20 3Q20 4Q20 1Q21 2Q21 PPP Yield PPP: Forgiveness Increases and Should Continue in 2H21 8 2 Period End PPP Loans ($MM) $93.2 $111.6 $151.9 $251.0 $197.3 • Lifetime originations and acquisitions of $310MM with a balance of $197MM at 2Q21 and attendant fees of $4MM • Average monthly forgiveness was $15.5MM in 1H21, and $23.1MM in 2Q21 • $22MM of PPP loans are in the process of forgiveness as of June 30, 2021 • Lifetime forgiveness of $113MM • Forgiveness expected to continue in 2H21 and possibly into 2022 • SBA can take up to 90 days to approve forgiveness Average PPP Loans ($MM) PPP NIM Drag 0.01% 0.02% 0.03% 0.04% 0.00% |
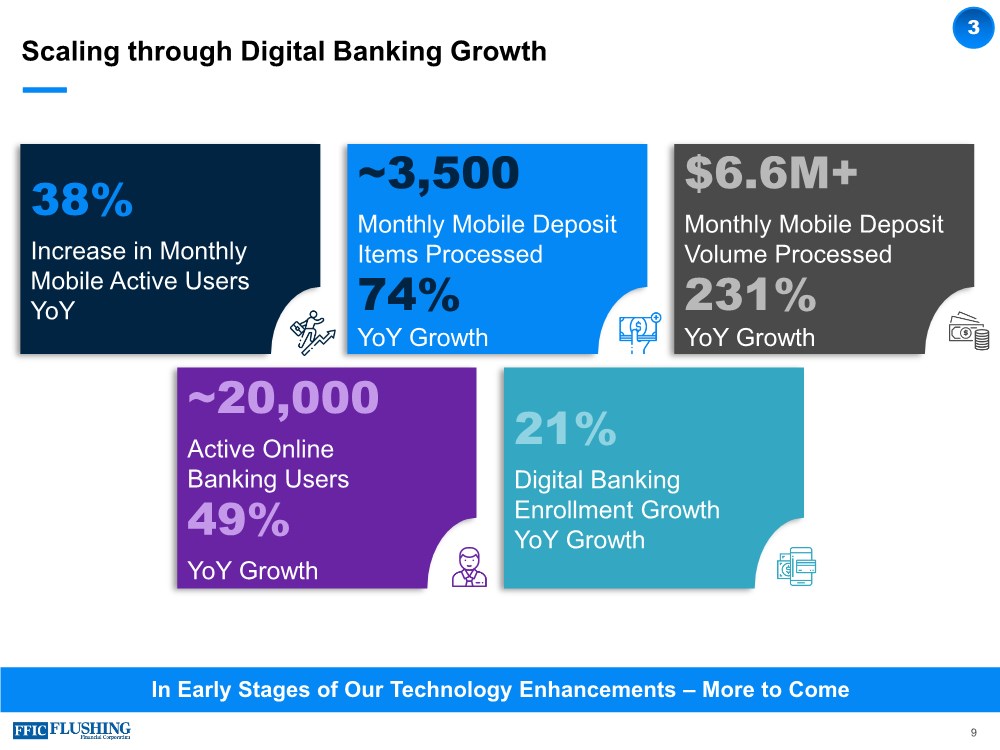
| In Early Stages of Our Technology Enhancements – More to Come 38% Increase in Monthly Mobile Active Users YoY ~3,500 Monthly Mobile Deposit Items Processed 74% YoY Growth $6.6M+ Monthly Mobile Deposit Volume Processed 231% YoY Growth 21% Digital Banking Enrollment Growth YoY Growth ~20,000 Active Online Banking Users 49% YoY Growth Scaling through Digital Banking Growth 9 3 |
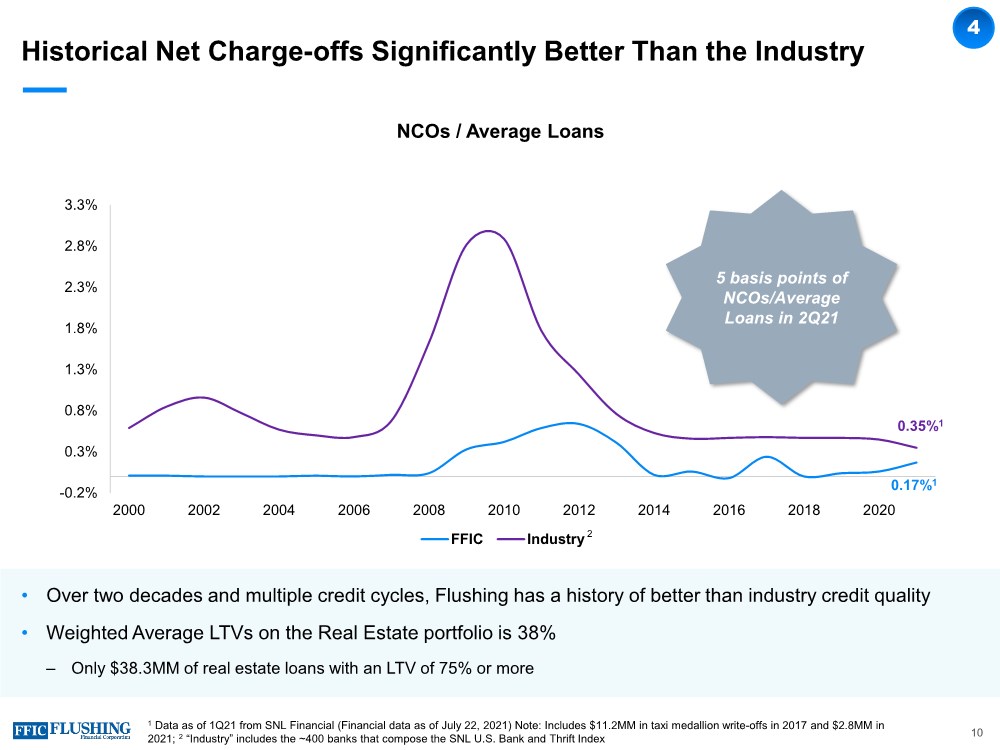
| Historical Net Charge-offs Significantly Better Than the Industry • Over two decades and multiple credit cycles, Flushing has a history of better than industry credit quality • Weighted Average LTVs on the Real Estate portfolio is 38% ‒ Only $38.3MM of real estate loans with an LTV of 75% or more 1 Data as of 1Q21 from SNL Financial (Financial data as of July 22, 2021) Note: Includes $11.2MM in taxi medallion write-offs in 2017 and $2.8MM in 2021; 2 “Industry” includes the ~400 banks that compose the SNL U.S. Bank and Thrift Index NCOs / Average Loans 0.17%1 0.35%1 -0.2% 0.3% 0.8% 1.3% 1.8% 2.3% 2.8% 3.3% 2000 2002 2004 2006 2008 2010 2012 2014 2016 2018 2020 FFIC Industry 5 basis points of NCOs/Average Loans in 2Q21 2 4 10 |
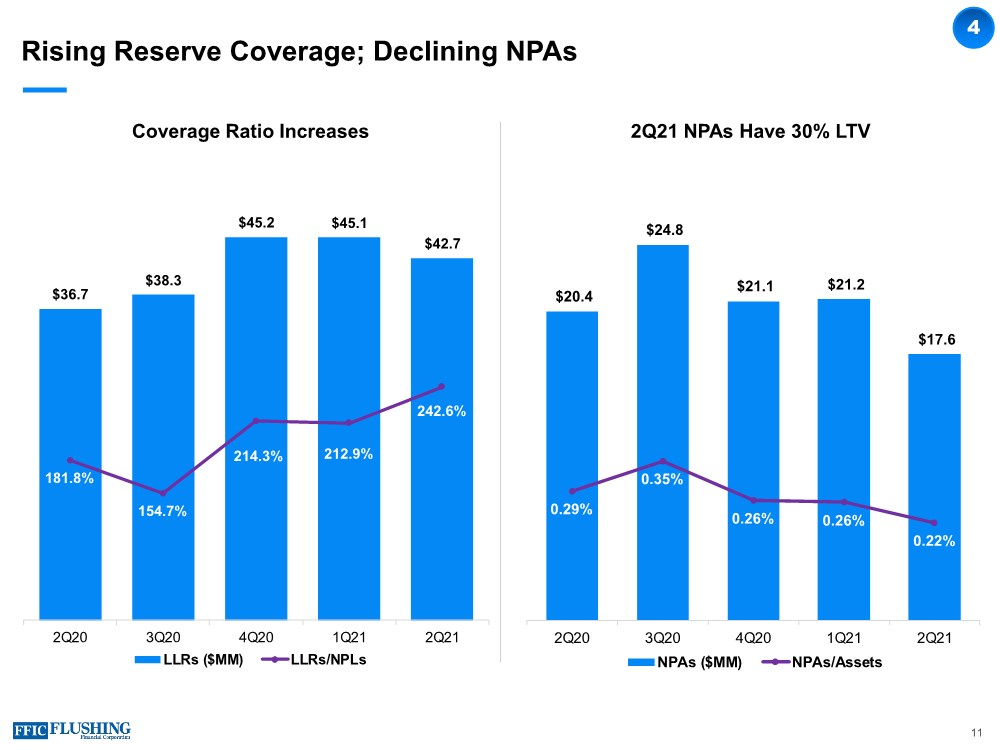
| Rising Reserve Coverage; Declining NPAs Coverage Ratio Increases 2Q21 NPAs Have 30% LTV 4 11 $36.7 $38.3 $45.2 $45.1 $42.7 181.8% 154.7% 214.3% 212.9% 242.6% 0.5 1 1.5 2 2.5 3 3.5 4 $0.0 $5.0 $10.0 $15.0 $20.0 $25.0 $30.0 $35.0 $40.0 $45.0 $50.0 2Q20 3Q20 4Q20 1Q21 2Q21 LLRs ($MM) LLRs/NPLs $20.4 $24.8 $21.1 $21.2 $17.6 0.29% 0.35% 0.26% 0.26% 0.22% 0.00% 0.10% 0.20% 0.30% 0.40% 0.50% 0.60% 0.70% 0.80% 0.90% 1.00% $- $5.0 $10.0 $15.0 $20.0 $25.0 $30.0 2Q20 3Q20 4Q20 1Q21 2Q21 NPAs ($MM) NPAs/Assets |
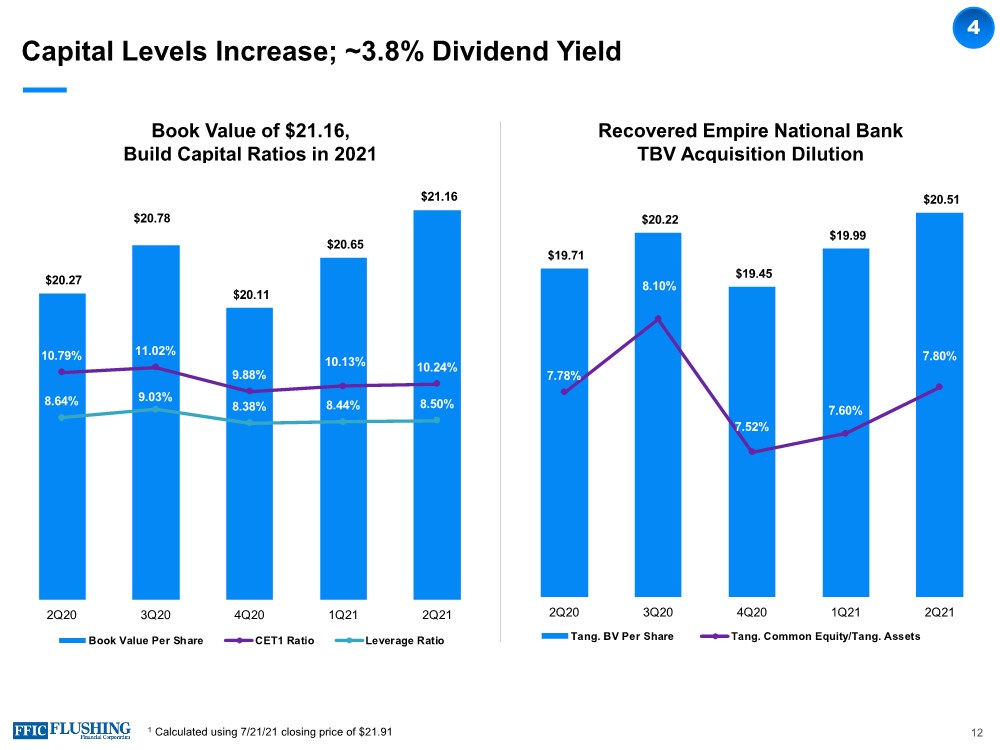
| Capital Levels Increase; ~3.8% Dividend Yield Book Value of $21.16, Build Capital Ratios in 2021 Recovered Empire National Bank TBV Acquisition Dilution 1 Calculated using 7/21/21 closing price of $21.91 12 $20.27 $20.78 $20.11 $20.65 $21.16 10.79% 11.02% 9.88% 10.13% 10.24% 8.64% 9.03% 8.38% 8.44% 8.50% 0.00% 2.00% 4.00% 6.00% 8.00% 10.00% 12.00% 14.00% 16.00% 18.00% 20.00% $17. 00 $17. 50 $18. 00 $18. 50 $19. 00 $19. 50 $20. 00 $20. 50 $21. 00 $21. 50 2Q20 3Q20 4Q20 1Q21 2Q21 Book Value Per Share CET1 Ratio Leverage Ratio $19.71 $20.22 $19.45 $19.99 $20.51 7.78% 8.10% 7.52% 7.60% 7.80% 6.90% 7.10% 7.30% 7.50% 7.70% 7.90% 8.10% 8.30% 8.50% 8.70% $15. 00 $16. 00 $17. 00 $18. 00 $19. 00 $20. 00 $21. 00 2Q20 3Q20 4Q20 1Q21 2Q21 Tang. BV Per Share Tang. Common Equity/Tang. Assets 4 |
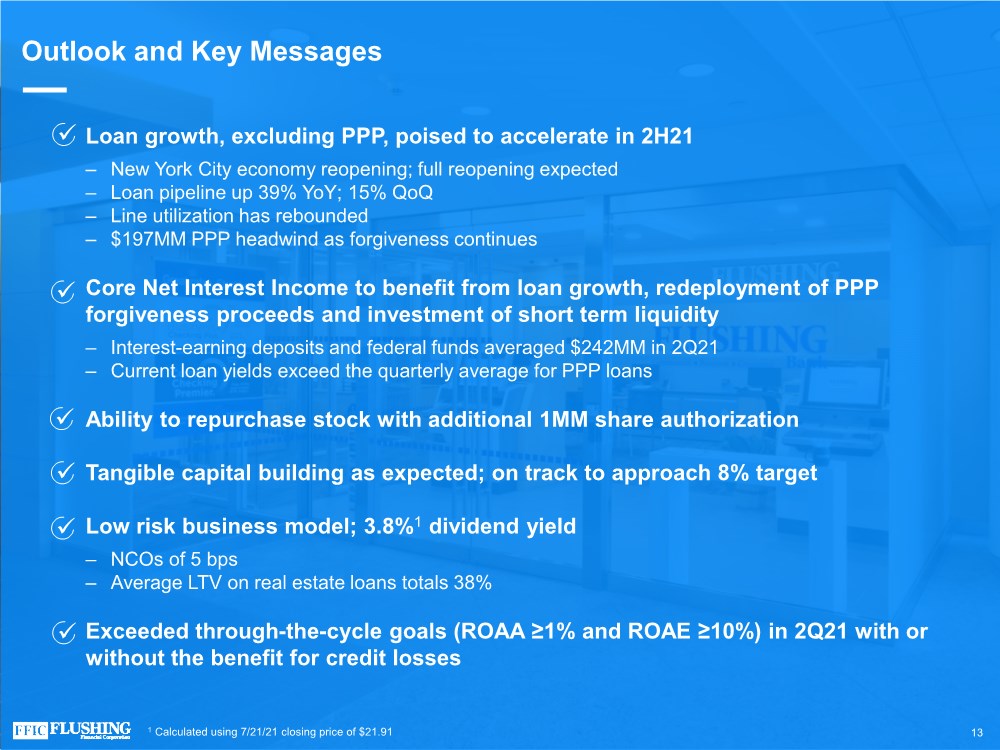
| Outlook and Key Messages Loan growth, excluding PPP, poised to accelerate in 2H21 ‒ New York City economy reopening; full reopening expected ‒ Loan pipeline up 39% YoY; 15% QoQ ‒ Line utilization has rebounded ‒ $197MM PPP headwind as forgiveness continues Core Net Interest Income to benefit from loan growth, redeployment of PPP forgiveness proceeds and investment of short term liquidity ‒ Interest-earning deposits and federal funds averaged $242MM in 2Q21 ‒ Current loan yields exceed the quarterly average for PPP loans • Ability to repurchase stock with additional 1MM share authorization • Tangible capital building as expected; on track to approach 8% target Low risk business model; 3.8%1 dividend yield ‒ NCOs of 5 bps ‒ Average LTV on real estate loans totals 38% Exceeded through-the-cycle goals (ROAA ≥1% and ROAE ≥10%) in 2Q21 with or without the benefit for credit losses 13 1 Calculated using 7/21/21 closing price of $21.91 |
| Appendix |

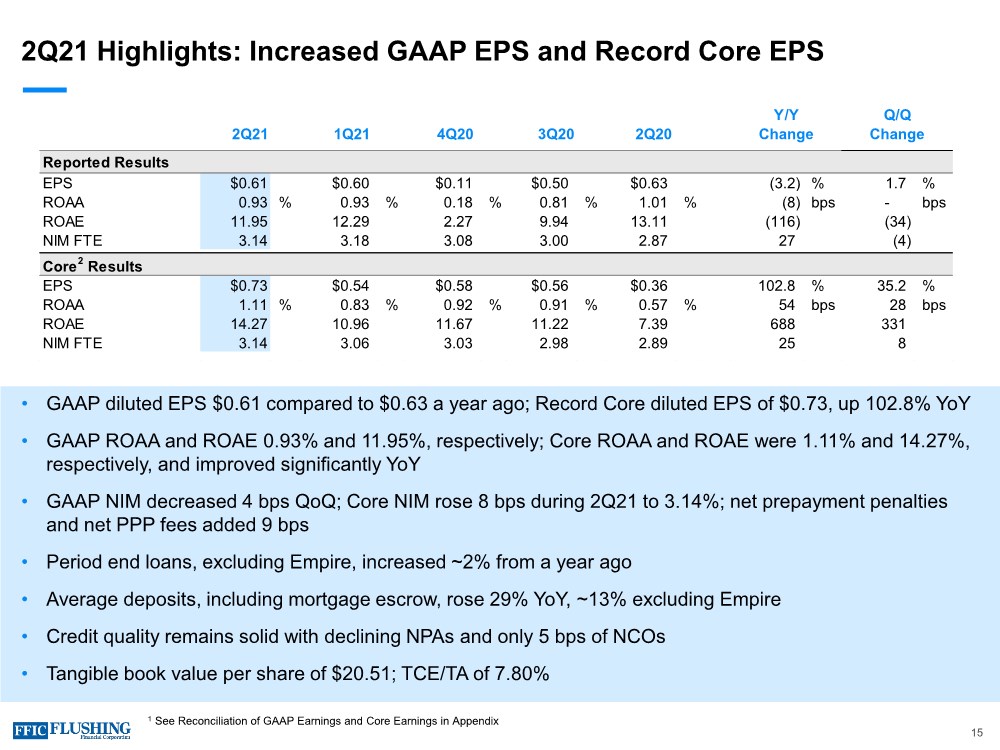
| 2Q21 Highlights: Increased GAAP EPS and Record Core EPS • GAAP diluted EPS $0.61 compared to $0.63 a year ago; Record Core diluted EPS of $0.73, up 102.8% YoY • GAAP ROAA and ROAE 0.93% and 11.95%, respectively; Core ROAA and ROAE were 1.11% and 14.27%, respectively, and improved significantly YoY • GAAP NIM decreased 4 bps QoQ; Core NIM rose 8 bps during 2Q21 to 3.14%; net prepayment penalties and net PPP fees added 9 bps • Period end loans, excluding Empire, increased ~2% from a year ago • Average deposits, including mortgage escrow, rose 29% YoY, ~13% excluding Empire • Credit quality remains solid with declining NPAs and only 5 bps of NCOs • Tangible book value per share of $20.51; TCE/TA of 7.80% 15 1 See Reconciliation of GAAP Earnings and Core Earnings in Appendix Reported Results EPS $0.61 $0.60 $0.11 $0.50 $0.63 (3.2) % 1.7 % ROAA 0.93 % 0.93 % 0.18 % 0.81 % 1.01 %(8) bps - bps ROAE 11.95 12.29 2.27 9.94 13.11 (116) (34) NIM FTE 3.14 3.18 3.08 3.00 2.87 27 (4) Core2 Results EPS $0.73 $0.54 $0.58 $0.56 $0.36 102.8 % 35.2 % ROAA 1.11 % 0.83 % 0.92 % 0.91 % 0.57 % 54 bps 28 bps ROAE 14.27 10.96 11.67 11.22 7.39 688 331 NIM FTE 3.14 3.06 3.03 2.98 2.89 25 8 2Q21 1Q21 4Q20 3Q20 2Q20 Y/Y Q/Q Change Change |
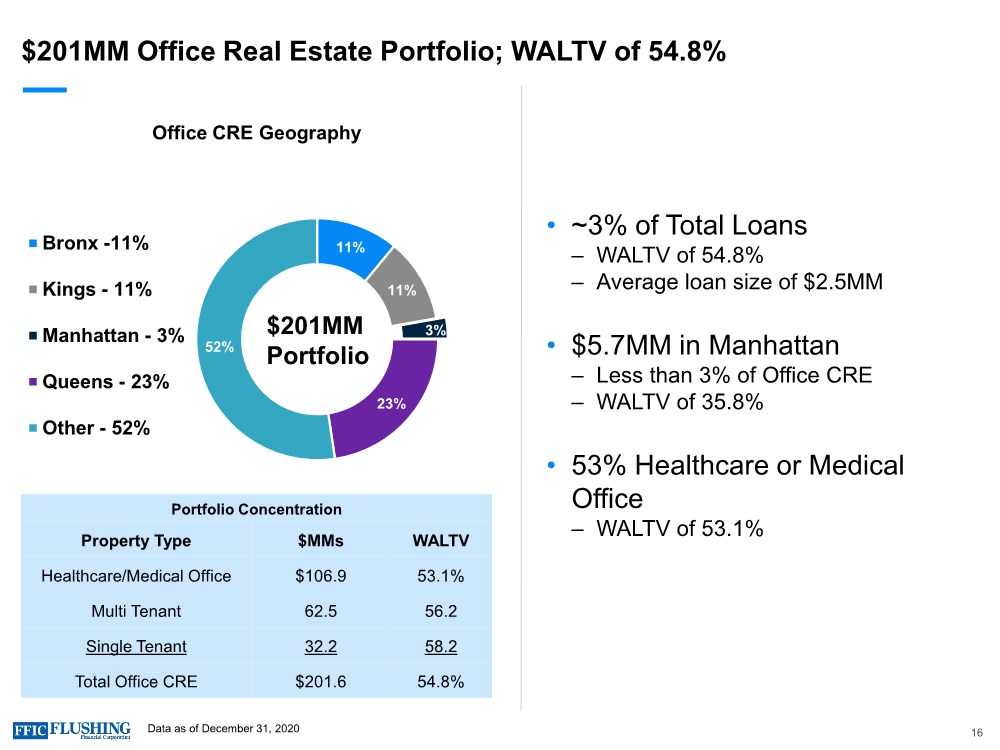
| $201MM Office Real Estate Portfolio; WALTV of 54.8% 16 • ~3% of Total Loans ‒ WALTV of 54.8% ‒ Average loan size of $2.5MM • $5.7MM in Manhattan ‒ Less than 3% of Office CRE ‒ WALTV of 35.8% • 53% Healthcare or Medical Office ‒ WALTV of 53.1% Office CRE Geography Portfolio Concentration Property Type $MMs WALTV Healthcare/Medical Office $106.9 53.1% Multi Tenant 62.5 56.2 Single Tenant 32.2 58.2 Total Office CRE $201.6 54.8% Data as of December 31, 2020 11% 11% 3% 23% 52% Bronx -11% Kings - 11% Manhattan - 3% Queens - 23% Other - 52% $201MM Portfolio |
| Reconciliation of GAAP Earnings and Core Earnings Non-cash Fair Value Adjustments to GAAP Earnings The variance in GAAP and core earnings is partly driven by the impact of non-cash net gains and losses from fair value adjustments. These fair value adjustments relate primarily to swaps designated to protect against rising rates and borrowing carried at fair value under the fair value option. As the swaps get closer to maturity, the volatility in fair value adjustments will dissipate. In a declining interest rate environment, the movement in the curve exaggerates our mark-to-market loss position. In a rising interest rate environment or a steepening of the yield curve, the loss position would experience an improvement. Core Net Income, Core Diluted EPS, Core ROAE, Core ROAA, Core Net Interest Income FTE, Core Net Interest Margin FTE, Base Net Interest Income FTE, Base Net Interest Margin FTE, Core Interest Income and Yield on Total Loans, Base Interest Income and Yield on Total Loans, Core Non-interest Income, Core Non- interest Expense and Tangible Book Value per common share are each non-GAAP measures used in this presentation.A reconciliation to the most directly comparable GAAP financial measures appears below in tabular form. The Company believes that these measures are useful for both investors and management to understand the effects of certain interest and non-interest items and provide an alternative view of the Company's performance over time and in comparison to the Company's competitors. These measures should not be viewed as a substitute for net income. The Company believes that tangible book value per common share is useful for both investors and management as these are measures commonly used by financial institutions, regulators and investors to measure the capital adequacy of financial institutions. The Company believes these measures facilitate comparison of the quality and composition of the Company's capital over time and in comparison to its competitors. These measures should not be viewed as a substitute for total shareholders' equity. These non-GAAP measures have inherent limitations, are not required to be uniformly applied and are not audited. They should not be considered in isolation or as a substitute for analysis of results reported under GAAP. These non-GAAP measures may not be comparable to similarly titled measures reported by other companies. 17 |
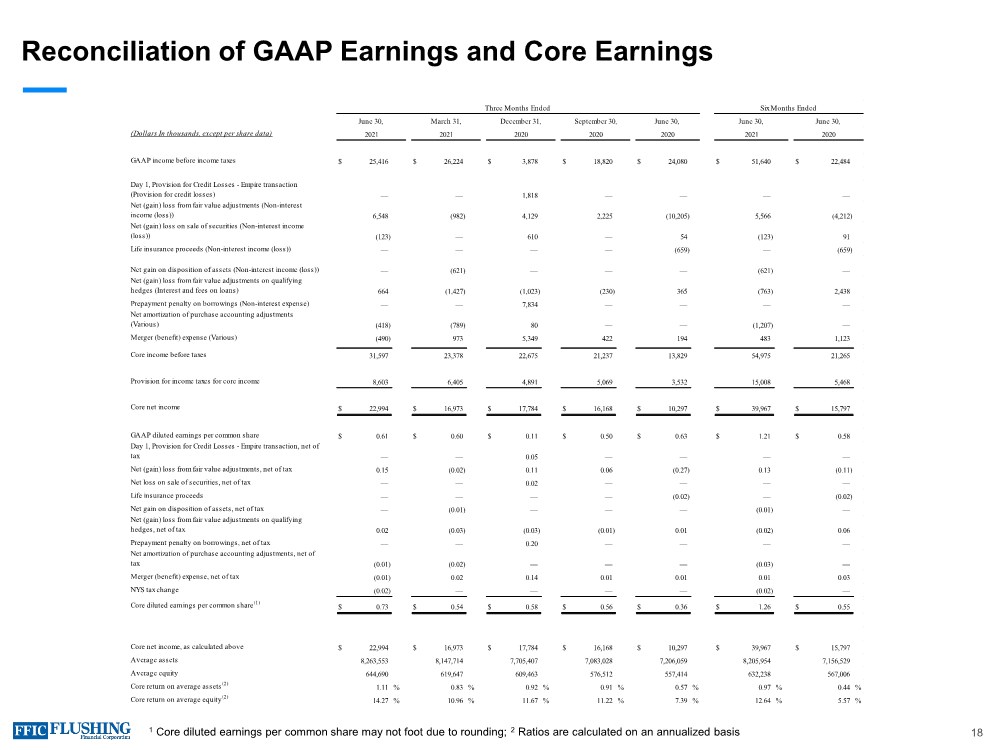
| Reconciliation of GAAP Earnings and Core Earnings 1 Core diluted earnings per common share may not foot due to rounding; 2 Ratios are calculated on an annualized basis 18 (Dollars In thousands, except per share data) GAAP income before income taxes $ 25,416 $ 26,224 $ 3,878 $ 18,820 $ 24,080 $ 51,640 $ 22,484 Day 1, Provision for Credit Losses - Empire transaction (Provision for credit losses) — — 1,818 — — — — Net (gain) loss from fair value adjustments (Non-interest income (loss)) 6,548 (982) 4,129 2,225 (10,205) 5,566 (4,212) Net (gain) loss on sale of securities (Non-interest income (loss)) (123) — 610 — 54 (123) 91 Life insurance proceeds (Non-interest income (loss)) — — — — (659) — (659) Net gain on disposition of assets (Non-interest income (loss)) — (621) — — — (621) — Net (gain) loss from fair value adjustments on qualifying hedges (Interest and fees on loans) 664 (1,427) (1,023) (230) 365 (763) 2,438 Prepayment penalty on borrowings (Non-interest expense) — — 7,834 — — — — Net amortization of purchase accounting adjustments (Various) (418) (789) 80 — — (1,207) — Merger (benefit) expense (Various) (490) 973 5,349 422 194 483 1,123 Core income before taxes 31,597 23,378 22,675 21,237 13,829 54,975 21,265 Provision for income taxes for core income 8,603 6,405 4,891 5,069 3,532 15,008 5,468 Core net income $ 22,994 $ 16,973 $ 17,784 $ 16,168 $ 10,297 $ 39,967 $ 15,797 GAAP diluted earnings per common share $ 0.61 $ 0.60 $ 0.11 $ 0.50 $ 0.63 $ 1.21 $ 0.58 Day 1, Provision for Credit Losses - Empire transaction, net of tax — — 0.05 — — — — Net (gain) loss from fair value adjustments, net of tax 0.15 (0.02) 0.11 0.06 (0.27) 0.13 (0.11) Net loss on sale of securities, net of tax — — 0.02 — — — — Life insurance proceeds — — — — (0.02) — (0.02) Net gain on disposition of assets, net of tax — (0.01) — — — (0.01) — Net (gain) loss from fair value adjustments on qualifying hedges, net of tax 0.02 (0.03) (0.03) (0.01) 0.01 (0.02) 0.06 Prepayment penalty on borrowings, net of tax — — 0.20 — — — — Net amortization of purchase accounting adjustments, net of tax (0.01) (0.02) — — — (0.03) — Merger (benefit) expense, net of tax (0.01) 0.02 0.14 0.01 0.01 0.01 0.03 NYS tax change (0.02) — — — — (0.02) — Core diluted earnings per common share(1) $ 0.73 $ 0.54 $ 0.58 $ 0.56 $ 0.36 $ 1.26 $ 0.55 Core net income, as calculated above $ 22,994 $ 16,973 $ 17,784 $ 16,168 $ 10,297 $ 39,967 $ 15,797 Average assets 8,263,553 8,147,714 7,705,407 7,083,028 7,206,059 8,205,954 7,156,529 Average equity 644,690 619,647 609,463 576,512 557,414 632,238 567,006 Core return on average assets(2) 1.11 % 0.83 % 0.92 % 0.91 % 0.57 % 0.97 % 0.44 % Core return on average equity(2) 14.27 % 10.96 % 11.67 % 11.22 % 7.39 % 12.64 % 5.57 % Three Months Ended Six Months Ended June 30, 2021 2020 June 30, December 31, September 30, 2020 2020 June 30, 2021 June 30, March 31, 2021 2020 |
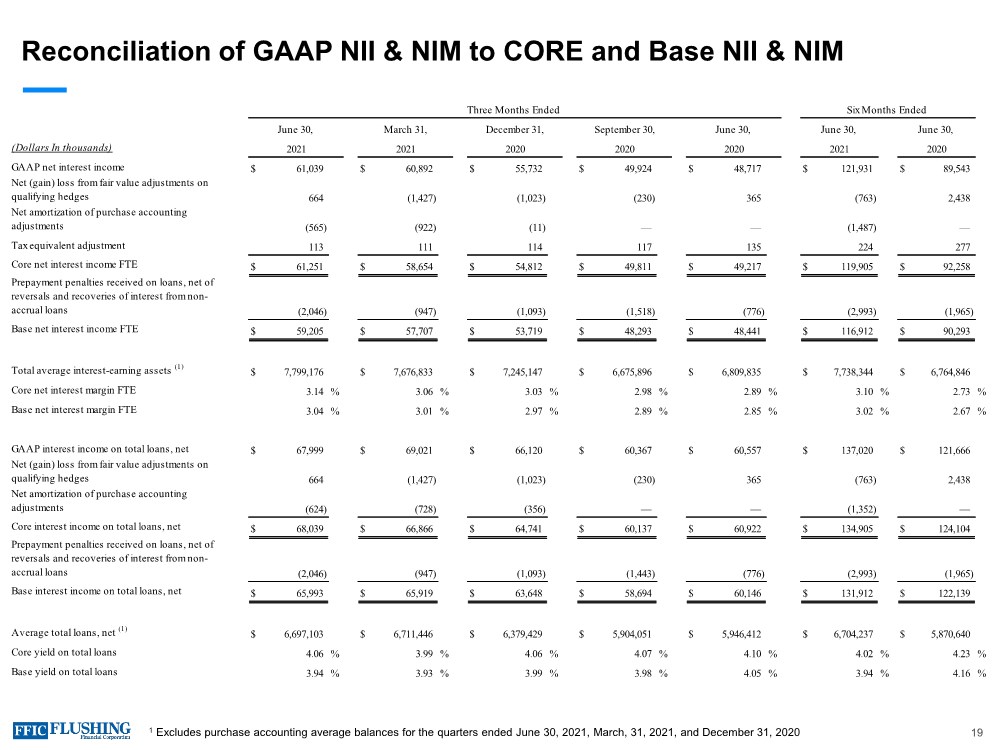
| Reconciliation of GAAP NII & NIM to CORE and Base NII & NIM 1 Excludes purchase accounting average balances for the quarters ended June 30, 2021, March, 31, 2021, and December 31, 2020 19 (Dollars In thousands) GAAP net interest income $ 61,039 $ 60,892 $ 55,732 $ 49,924 $ 48,717 $ 121,931 $ 89,543 Net (gain) loss from fair value adjustments on qualifying hedges 664 (1,427) (1,023) (230) 365 (763) 2,438 Net amortization of purchase accounting adjustments (565) (922) (11) — — (1,487) — Tax equivalent adjustment 113 111 114 117 135 224 277 Core net interest income FTE $ 61,251 $ 58,654 $ 54,812 $ 49,811 $ 49,217 $ 119,905 $ 92,258 Prepayment penalties received on loans, net of reversals and recoveries of interest from non- accrual loans (2,046) (947) (1,093) (1,518) (776) (2,993) (1,965) Base net interest income FTE $ 59,205 $ 57,707 $ 53,719 $ 48,293 $ 48,441 $ 116,912 $ 90,293 Total average interest-earning assets (1) $ 7,799,176 $ 7,676,833 $ 7,245,147 $ 6,675,896 $ 6,809,835 $ 7,738,344 $ 6,764,846 Core net interest margin FTE 3.14 % 3.06 % 3.03 % 2.98 % 2.89 % 3.10 % 2.73 % Base net interest margin FTE 3.04 % 3.01 % 2.97 % 2.89 % 2.85 % 3.02 % 2.67 % GAAP interest income on total loans, net $ 67,999 $ 69,021 $ 66,120 $ 60,367 $ 60,557 $ 137,020 $ 121,666 Net (gain) loss from fair value adjustments on qualifying hedges 664 (1,427) (1,023) (230) 365 (763) 2,438 Net amortization of purchase accounting adjustments (624) (728) (356) — — (1,352) — Core interest income on total loans, net $ 68,039 $ 66,866 $ 64,741 $ 60,137 $ 60,922 $ 134,905 $ 124,104 Prepayment penalties received on loans, net of reversals and recoveries of interest from non- accrual loans (2,046) (947) (1,093) (1,443) (776) (2,993) (1,965) Base interest income on total loans, net $ 65,993 $ 65,919 $ 63,648 $ 58,694 $ 60,146 $ 131,912 $ 122,139 Average total loans, net (1) $ 6,697,103 $ 6,711,446 $ 6,379,429 $ 5,904,051 $ 5,946,412 $ 6,704,237 $ 5,870,640 Core yield on total loans 4.06 % 3.99 % 4.06 % 4.07 % 4.10 % 4.02 % 4.23 % Base yield on total loans 3.94 % 3.93 % 3.99 % 3.98 % 4.05 % 3.94 % 4.16 % Six Months Ended June 30, June 30, 2021 2020 2021 2021 2020 2020 2020 Three Months Ended June 30, March 31, December 31, September 30, June 30, |
| Contact Details Susan K. Cullen SEVP, CFO & Treasurer Phone: (718) 961-5400 Email: [email protected] Al Savastano, CFA Director of Investor Relations Phone: (516) 820-1146 Email: [email protected] 20 |

|

Serious News for Serious Traders! Try StreetInsider.com Premium Free!
You May Also Be Interested In
- Orosur Mining Inc Announces Results for Third Quarter Ended February 29, 2024
- Maximize Your Forex Trading Strategy - Harness the Market Momentum for Enhanced Results.
- Ceres Holographics Advances Hologram Mastering and Replication to Enable Multiple Customized Display HUD in a Single Windshield Enhancing Safety and In-Vehicle UX
Create E-mail Alert Related Categories
SEC FilingsSign up for StreetInsider Free!
Receive full access to all new and archived articles, unlimited portfolio tracking, e-mail alerts, custom newswires and RSS feeds - and more!
