

Form 8-K FIVE STAR BANCORP For: Jul 26
 Tweet
Tweet Share
ShareExhibit 99.1

| PRESS RELEASE | FOR IMMEDIATE RELEASE | |
| July 26, 2021 |
Five Star Bancorp Announces Second Quarter 2021 Results
Rancho Cordova, CA (July 26, 2021) – Five Star Bancorp (Nasdaq: FSBC) (“Five Star” or the “Company”), the holding company for Five Star Bank (the “Bank”), today reported net income of $9.8 million for the quarter ended June 30, 2021, compared to $10.3 million during the quarter ended March 31, 2021 and $10.1 million during the quarter ended June 30, 2020. Diluted earnings per share were $0.67 for the second quarter of 2021, compared to $0.93 for the first quarter of 2021 and $1.05 for the second quarter of 2020.
Financial Highlights
During the quarter, the Company terminated its status as a “Subchapter S” corporation in connection with its initial public offering (“IPO”). As such, results presented for the periods ended March 31, 2021 and June 30, 2020 have been calculated using a 3.5% S Corporation tax rate, while results presented for the three months ended June 30, 2021 have been calculated using a weighted average tax rate of 20.77% as noted in the section titled “Provision for Income Taxes” herein. Performance highlights and other developments for the Company as of and for the three months ended June 30, 2021 included the following:
| · | Loan and deposit growth as of June 30, 2021, as compared to March 31, 2021, were as follows: |
| As of | ||||||||||||||||
| (dollars in thousands) | Jun 30, 2021 | Mar 31, 2021 | $ Change | % Change | ||||||||||||
| Total loans, excluding Paycheck Protection Program (“PPP”) loans | $ | 1,466,866 | $ | 1,363,678 | $ | 103,188 | 7.57 | % | ||||||||
| PPP loans | 120,936 | 182,876 | (61,940 | ) | (33.87 | )% | ||||||||||
| PPP deferred fees | 3,534 | 4,761 | (1,227 | ) | (25.77 | )% | ||||||||||
| Noninterest-bearing deposits | 829,036 | 798,825 | 30,211 | 3.78 | % | |||||||||||
| Interest-bearing deposits | 1,237,249 | 1,184,285 | 52,964 | 4.47 | % | |||||||||||
| · | As of June 30, 2021, the Company reported total loans, total assets, and total deposits of $1.6 billion, $2.3 billion, and $2.1 billion, respectively, as compared to $1.5 billion, $2.0 billion, and $1.8 billion, respectively, at December 31, 2020. |
| · | During the three months ended June 30, 2021, the Company did not record a provision for loan losses, as compared to a provision of $0.2 million recorded during the three months ended March 31, 2021 and $1.6 million recorded during the three months ended June 30, 2020. |
| · | As of June 30, 2021, nonperforming loans to period end loans of 0.03% remained stable as compared to December 31, 2020. |
| · | For the quarter ended June 30, 2021, net interest margin was 3.48% as compared to 3.83% in the quarter ended March 31, 2021 and 3.42% in the quarter ended June 30, 2020. |
| · | Net income, when applying a 29.56% C Corporation tax rate, would have been $7.4 million for the three months ended June 30, 2021. |
| · | The Company’s Board of Directors declared, and the Company paid, a cash dividend of $0.80 per share, and paid an aggregate distribution of $27.0 million for the accumulated adjustments account payout as a result of the Company’s conversion to a C Corporation, during the three months ended June 30, 2021. |
| · | For the three months ended June 30, 2021, the Company’s return on average assets (“ROAA”) was 1.75% and the return on average equity (“ROAE”) was 24.25%. |
| · | The Company completed its IPO, and issued 6,054,750 shares of common stock, no par value, inclusive of the full exercise of the underwriters’ option to purchase an additional 789,750 shares. The securities were sold at a price to the public of $20.00 per share and began trading on the Nasdaq Stock Market LLC on May 5, 2021. On May 7, 2021, the closing date of the IPO, the Company received total net proceeds of $109.1 million. |
| · | During the three months ended June 30, 2021, the Company recorded $0.7 million in expenses incurred to support corporate organizational matters leading up to the IPO and $0.8 million in stock compensation expense for non-recurring stock grants related to the IPO to certain members of the Company’s Board of Directors. |
President and Chief Executive Officer James Beckwith commented, “We completed an initial public offering on May 7, 2021, to build upon the success of our organic growth strategy. As we expand our industry verticals to meet customer demand, we continue to benefit from growth in loans and deposits. Our organic growth strategy, which included the effort of becoming a public company and the addition of new staff as we pursue opportunities in the markets we serve, are expected to benefit the Company and its shareholders, and we expect those benefits to continue as we grow.”
Summary Results
For the three months ended June 30, 2021, the Company’s ROAA was 1.75% and the ROAE was 24.25%. For the three months ended June 30, 2020, the Company’s ROAA was 2.17% and the ROAE was 36.92%. The declines in ROAA and ROAE are a result of (i) lower net income due to the higher effective tax rate used in the three months ended June 30, 2021 and (ii) increases in our asset base and average equity balances during the quarter ended June 30, 2021 as compared to the quarter ended June 30, 2020.
The following is a summary of the components of the Company’s operating results and performance ratios for the periods indicated:
| For the three months ended | ||||||||||||||||
| (dollars in thousands, except per share data) | Jun 30, 2021 | Mar 31, 2021 | $ Change | % Change | ||||||||||||
| Selected operating data: | ||||||||||||||||
| Net interest income | $ | 18,296 | $ | 18,048 | $ | 248 | 1.37 | % | ||||||||
| Provision for loan losses | — | 200 | (200 | ) | (100.00 | )% | ||||||||||
| Non-interest income | 1,846 | 1,616 | 230 | 14.23 | % | |||||||||||
| Non-interest expense | 9,580 | 8,804 | 776 | 8.81 | % | |||||||||||
| Net income | 9,828 | 10,278 | (450 | ) | (4.38 | )% | ||||||||||
| Earnings per common share: | ||||||||||||||||
| Basic | $ | 0.67 | $ | 0.93 | $ | (0.26 | ) | (27.96 | )% | |||||||
| Diluted | 0.67 | 0.93 | (0.27 | ) | (29.03 | )% | ||||||||||
| Performance and other financial ratios: | ||||||||||||||||
| ROAA | 1.75 | % | 2.05 | % | ||||||||||||
| ROAE | 24.25 | % | 32.08 | % | ||||||||||||
| Net interest margin | 3.48 | % | 3.83 | % | ||||||||||||
| Cost of deposits | 0.20 | % | 0.24 | % | ||||||||||||
| For the three months ended | ||||||||||||||||
| (dollars in thousands, except per share data) | Jun 30, 2021 | Jun 30, 2020 | $ Change | % Change | ||||||||||||
| Selected operating data: | ||||||||||||||||
| Net interest income | $ | 18,296 | $ | 15,583 | $ | 2,713 | 17.41 | % | ||||||||
| Provision for loan losses | — | 1,550 | (1,550 | ) | (100.00 | )% | ||||||||||
| Non-interest income | 1,846 | 2,474 | (628 | ) | (25.38 | )% | ||||||||||
| Non-interest expense | 9,580 | 6,016 | 3,564 | 59.24 | % | |||||||||||
| Net income | 9,828 | 10,123 | (295 | ) | (2.91 | )% | ||||||||||
| Earnings per common share: | ||||||||||||||||
| Basic | $ | 0.67 | $ | 1.05 | $ | (0.38 | ) | (36.19 | )% | |||||||
| Diluted | 0.67 | 1.05 | (0.39 | ) | (37.14 | )% | ||||||||||
| Performance and other financial ratios: | ||||||||||||||||
| ROAA | 1.75 | % | 2.17 | % | ||||||||||||
| ROAE | 24.25 | % | 36.92 | % | ||||||||||||
| Net interest margin | 3.48 | % | 3.42 | % | ||||||||||||
| Cost of deposits | 0.20 | % | 0.62 | % | ||||||||||||
Balance Sheet Summary
Total assets at June 30, 2021 were $2.3 billion, an increase of $374.1 million from $2.0 billion at December 31, 2020. The increase was primarily due to a $246.1 million increase in cash and cash equivalents, an $82.3 million increase in loans, net of allowance for loan losses, and a $43.6 million increase in total investments. The increase of $246.1 million in cash and cash equivalents was primarily a result of net income recognized of $20.1 million, an increase in deposits of $282.3 million, and proceeds of $109.1 million from the issuance of 6,054,750 shares of common stock in our IPO. These increases were partially offset by purchases of securities of $69.1 million, loan originations, net of repayments, of $82.3 million, and cash distributions of $46.8 million during the period. Of the $82.3 million increase in loans between December 31, 2020 and June 31, 2021, $102.5 million related to PPP loan originations and $300.9 million related to non-PPP loan originations, partially offset by $137.6 million in PPP loan forgiveness and $183.5 million in non-PPP loan payoffs and paydowns.
Total liabilities were $2.1 billion at June 30, 2021, an increase of $289.6 million from $1.8 billion at December 31, 2020. The increase in total liabilities was primarily attributable to growth in deposits of $282.3 million, largely due to increases in money market deposits of $128.3 million and increases of non-interest-bearing deposits of $131.5 million.
Total shareholders’ equity increased by $84.5 million, from $133.8 million at December 31, 2020 to $218.3 million at June 30, 2021, primarily as a result of net income recognized during the period of $20.1 million and common stock recorded of $111.2 million from the issuance of 6,054,750 shares of common stock in our IPO, partially offset by $46.8 million in cash distributions paid during the period.
| Balance Sheet Change | ||||||||||||||||
| Ending balances | As of | |||||||||||||||
| (dollars in thousands) | Jun 30, 2021 | Dec 31, 2020 | $ Change | % Change | ||||||||||||
| Selected financial condition data: | ||||||||||||||||
| Total assets | $ | 2,327,867 | $ | 1,953,765 | $ | 374,102 | 19.15 | % | ||||||||
| Cash and cash equivalents | 536,604 | 290,493 | 246,111 | 84.72 | % | |||||||||||
| Total loans, net | 1,563,309 | 1,480,970 | 82,339 | 5.56 | % | |||||||||||
| Total investments | 166,547 | 122,928 | 43,619 | 35.48 | % | |||||||||||
| Total liabilities | 2,109,553 | 1,819,990 | 289,563 | 15.91 | % | |||||||||||
| Total deposits | 2,066,285 | 1,784,001 | 282,284 | 15.82 | % | |||||||||||
| Subordinated notes, net | 28,353 | 28,320 | 33 | 0.12 | % | |||||||||||
| Total shareholders’ equity | 218,314 | 133,775 | 84,539 | 63.19 | % | |||||||||||
Net Interest Income and Net Interest Margin
The following is a summary of the components of net interest income for the periods indicated:
| For the three months ended | ||||||||||||||||
| (dollars in thousands) | Jun 30, 2021 | Mar 31, 2021 | $ Change | % Change | ||||||||||||
| Interest income | $ | 19,308 | $ | 19,190 | $ | 118 | 0.61 | % | ||||||||
| Interest expense | 1,012 | 1,142 | (130 | ) | (11.38 | )% | ||||||||||
| Net interest income | 18,296 | 18,048 | 248 | 1.37 | % | |||||||||||
| Net interest margin | 3.48 | % | 3.83 | % | ||||||||||||
| For the three months ended | ||||||||||||||||
| (dollars in thousands) | Jun 30, 2021 | Jun 30, 2020 | $ Change | % Change | ||||||||||||
| Interest income | $ | 19,308 | $ | 18,285 | $ | 1,023 | 5.59 | % | ||||||||
| Interest expense | 1,012 | 2,702 | (1,690 | ) | (62.55 | )% | ||||||||||
| Net interest income | 18,296 | 15,583 | 2,713 | 17.41 | % | |||||||||||
| Net interest margin | 3.48 | % | 3.42 | % | ||||||||||||
The following table shows the components of net interest income and net interest margin for the quarterly periods indicated:
| Analysis of Change in Net Interest Margin on Earning Assets | ||||||||||||||||||||||||||||||||||||
| (dollars in thousands) | ||||||||||||||||||||||||||||||||||||
| Three months ended June 30, 2021 | Three months ended March 31, 2021 | Three months ended June 30, 2020 | ||||||||||||||||||||||||||||||||||
| Average Balance | Interest Income/ Expense | Yield/ Rate | Average Balance | Interest Income/ Expense | Yield/ Rate | Average Balance | Interest Income/ Expense | Yield/ Rate | ||||||||||||||||||||||||||||
| Assets | ||||||||||||||||||||||||||||||||||||
| Interest-earning deposits with banks | $ | 378,000 | $ | 125 | 0.13 | % | $ | 263,120 | $ | 104 | 0.16 | % | $ | 294,687 | $ | 371 | 0.51 | % | ||||||||||||||||||
| Investment securities | 149,814 | 557 | 1.49 | % | 121,862 | 473 | 1.57 | % | 75,256 | 392 | 2.09 | % | ||||||||||||||||||||||||
| Loans | 1,578,438 | 18,626 | 4.73 | % | 1,526,120 | 18,613 | 4.95 | % | 1,461,437 | 17,522 | 4.82 | % | ||||||||||||||||||||||||
| Total interest-earning assets | 2,106,252 | 19,308 | 3.68 | % | 1,911,112 | 19,190 | 4.07 | % | 1,831,380 | 18,285 | 4.02 | % | ||||||||||||||||||||||||
| Other assets, net | 140,757 | 125,981 | 43,854 | |||||||||||||||||||||||||||||||||
| Total assets | $ | 2,247,009 | $ | 2,037,093 | $ | 1,875,234 | ||||||||||||||||||||||||||||||
| Liability and Shareholders’ Equity | ||||||||||||||||||||||||||||||||||||
| Interest-bearing transaction accounts | $ | 150,852 | $ | 37 | 0.10 | % | $ | 154,678 | $ | 38 | 0.10 | % | $ | 144,339 | $ | 103 | 0.29 | % | ||||||||||||||||||
| Savings accounts | 75,424 | 19 | 0.10 | % | 60,885 | 16 | 0.10 | % | 34,738 | 24 | 0.28 | % | ||||||||||||||||||||||||
| Money market accounts | 949,448 | 475 | 0.20 | % | 867,374 | 581 | 0.27 | % | 850,548 | 1,665 | 0.79 | % | ||||||||||||||||||||||||
| Time accounts including CDARS | 36,773 | 37 | 0.40 | % | 46,171 | 64 | 0.56 | % | 144,604 | 467 | 1.30 | % | ||||||||||||||||||||||||
| Borrowings and other obligations | — | — | 0.00 | % | — | — | 0.00 | % | — | — | 0.00 | % | ||||||||||||||||||||||||
| Subordinated debenture | 28,339 | 444 | 6.27 | % | 28,326 | 443 | 6.36 | % | 28,275 | 443 | 6.31 | % | ||||||||||||||||||||||||
| Total interest-bearing liabilities | 1,240,836 | 1,012 | 0.33 | % | 1,157,434 | 1,142 | 0.40 | % | 1,202,504 | 2,702 | 0.90 | % | ||||||||||||||||||||||||
| Demand accounts | 827,992 | 745,605 | 562,932 | |||||||||||||||||||||||||||||||||
| Interest payable and other liabilities | 15,621 | 5,418 | (484 | ) | ||||||||||||||||||||||||||||||||
| Shareholders’ equity | 162,560 | 128,636 | 110,282 | |||||||||||||||||||||||||||||||||
| Total liabilities & shareholders’ equity | $ | 2,247,009 | $ | 2,037,093 | $ | 1,875,234 | ||||||||||||||||||||||||||||||
| Net interest spread | 3.35 | % | 3.67 | % | 3.11 | % | ||||||||||||||||||||||||||||||
| Net interest income/margin | $ | 18,296 | 3.48 | % | $ | 18,048 | 3.83 | % | $ | 15,583 | 3.42 | % | ||||||||||||||||||||||||
During the three months ended June 30, 2021, net interest income increased $0.3 million, or 1.37%, to $18.3 million compared to $18.0 million during the three months ended March 31, 2021. Additionally, net interest margin declined 35 basis points to 3.48% during the three months ended June 30, 2021 as compared to 3.83% during the three months ended March 31, 2021. The decline in net interest margin was due primarily to a decline in yield on interest earning assets, which was 3.68% for the quarter ended June 30, 2021, representing a decrease of 39 basis points from the quarter ended March 31, 2021. Average loan yields, excluding PPP loans, decreased 11 basis points from 4.87% during the three months ended March 31, 2021 to 4.76% during the three months ended June 30, 2021. A reconciliation of this non-GAAP measure is set forth in the “Non-GAAP Reconciliation (Unaudited)” table below. The decline in interest expense is primarily attributed to the reduction in the cost of interest-bearing liabilities, which decreased by 7 basis points as of June 30, 2021 to 0.33% from 0.40% at March 31, 2021, as a direct result of the declining interest rate environment.
During the three months ended June 30, 2021, net interest income increased $2.7 million, or 17.41%, to $18.3 million compared to $15.6 million during the three months ended June 30, 2020. Additionally, net interest margin increased six basis points to 3.48% during the three months ended June 30, 2021 as compared to 3.42% during the three months ended June 30, 2020. The increase in net interest margin was due primarily to an increase in interest earning assets, which increased from an average balance of $1.9 billion as for the three months ended June 30, 2020 to an average balance of $2.1 billion for the three months ended June 30, 2021. Average loan yields, excluding PPP loans, decreased 43 basis points from 5.19% during the three months ended June 30, 2020 to 4.76% during the three months ended June 30, 2021. A reconciliation of this non-GAAP measure is set forth in the “Non-GAAP Reconciliation (Unaudited)” table below. The decline in interest expense is primarily attributed to the reduction in the cost of interest-bearing liabilities, which decreased by 57 basis points as of June 30, 2021 to 0.33% from 0.90% at June 30, 2020, as a direct result of the declining interest rate environment.
Asset Quality
Small Business Administration (“SBA”) PPP
In March 2020, the SBA PPP was created to help small businesses keep workers employed during the COVID-19 pandemic. As an SBA Preferred Lender, the Company was able to provide PPP loans to small business customers. As of June 30, 2021, there were 416 PPP loans outstanding totaling $120.9 million, which included 393 loans totaling $102.5 million funded during the first six months of 2021 under the second round of the PPP stimulus plan. Approximately 211 of these PPP loans, or 50.72% of total PPP loans as of June 30, 2021, totaling $13.3 million were less than or equal to $0.2 million and had access to streamlined forgiveness processing. As of June 30, 2021, 1,028 PPP loan forgiveness applications had been submitted to the SBA and forgiveness payments had been received on 1,012 of these PPP loans, totaling $232.9 million in principal and interest. We expect full forgiveness of the first round of PPP loans to be completed in the near future.
COVID-19 Deferments
Following the passage of the Coronavirus Aid, Relief, and Economic Security Act (“CARES Act”), the “Interagency Statement on Loan Modifications and Reporting for Financial Institutions Working with Customers Affected by the Coronavirus (Revised)” was issued by federal bank regulators, which offers temporary relief from troubled debt restructuring accounting for loan payment deferrals for certain customers whose businesses are experiencing economic hardship due to COVID-19. The Company is closely monitoring the effects of the pandemic on our loan and deposit customers. Our management team continues to be focused on assessing the risks in our loan portfolio and working with our customers to mitigate where possible the risk of potential losses. The Company implemented loan programs to allow certain consumers and businesses impacted by the pandemic to defer loan principal and interest payments. As of June 30, 2021, eight borrowing relationships with ten loans totaling $12.9 million were on COVID-19 deferment. All loans that ended COVID-19 deferments in the quarter ended June 30, 2021 returned to their contractual payment structures prior to the COVID-19 pandemic with no risk rating downgrades to classified nor any troubled debt restructuring (“TDR”), and we anticipate that the remaining loans on COVID-19 deferment will return to their pre-COVID-19 contractual payment status after their COVID-19 deferments end.
Allowance for Loan Losses
At June 30, 2021 and December 31, 2020, the Company’s allowance for loan losses of $22.2 million and ratio of nonperforming loans to period end loans of 0.03% remained unchanged. At June 30, 2021, ten loans totaling $12.9 million, or 0.81% of the loan portfolio, were in a COVID-19 deferment period and three loans totaling $4.5 million had been in a COVID-19 deferment in the first quarter of 2021 but were not in such deferment as of June 30, 2021. Loans designated as watch and substandard decreased slightly to $57.8 million at June 30, 2021 from $60.1 million at December 31, 2020, which did not have an impact to the reserve overall. There were no loans with doubtful risk grades at June 30, 2021 or December 31, 2020. A summary of the allowance for loan losses by loan class is as follows:
| Allowance for Loan Losses | June 30, 2021 | December 31, 2020 | ||||||||||||||
| (dollars in thousands) | Amount | % of Total | Amount | % of Total | ||||||||||||
| Collectively evaluated for impairment | ||||||||||||||||
| Real Estate: | ||||||||||||||||
| Commercial | $ | 10,108 | 45.63 | % | $ | 9,358 | 42.17 | % | ||||||||
| Commercial land and development | 75 | 0.34 | % | 77 | 0.35 | % | ||||||||||
| Commercial construction | 491 | 2.22 | % | 821 | 3.70 | % | ||||||||||
| Residential construction | 46 | 0.21 | % | 87 | 0.39 | % | ||||||||||
| Residential | 188 | 0.85 | % | 220 | 0.99 | % | ||||||||||
| Farmland | 594 | 2.68 | % | 615 | 2.77 | % | ||||||||||
| Commercial: | ||||||||||||||||
| Secured | 9,194 | 41.50 | % | 9,476 | 42.71 | % | ||||||||||
| Unsecured | 209 | 0.94 | % | 179 | 0.81 | % | ||||||||||
| Paycheck Protection Program (PPP) | — | 0.00 | % | — | 0.00 | % | ||||||||||
| Consumer and other | 484 | 2.18 | % | 632 | 2.85 | % | ||||||||||
| Unallocated | 764 | 3.45 | % | 724 | 3.26 | % | ||||||||||
| 22,153 | 100.00 | % | 22,189 | 100.0 | % | |||||||||||
| Individually evaluated for impairment | — | 0.00 | % | — | 0.00 | % | ||||||||||
| Total allowance for loan losses | $ | 22,153 | 100.00 | % | $ | 22,189 | 100.00 | % | ||||||||
The ratio of allowance for loan losses to total loans was 1.39% at June 30, 2021, compared to 1.47% at December 31, 2020. Excluding SBA-guaranteed PPP loans, the ratio of the allowance for loan losses to total loans was 1.51% and 1.63% at June 30, 2021 and December 31, 2020, respectively. A reconciliation of this non-GAAP measure is set forth in the “Non-GAAP Reconciliation (Unaudited)” table below.
Non-interest Income
The following table presents the key components of non-interest income for the periods indicated:
| Non-interest Income | For the three months ended | $ | % | |||||||||||||
| (dollars in thousands) | Jun 30, 2021 | Mar 31, 2021 | Change | Change | ||||||||||||
| Service charges on deposit accounts | $ | 106 | $ | 90 | $ | 16 | 17.78 | % | ||||||||
| Gain on sale of securities | 92 | 182 | (90 | ) | (49.45 | )% | ||||||||||
| Gain on sale of loans | 1,091 | 931 | 160 | 17.19 | % | |||||||||||
| Loan-related fees | 211 | 122 | 89 | 72.95 | % | |||||||||||
| Dividends on FHLB stock | 92 | 78 | 14 | 17.95 | % | |||||||||||
| Earnings on bank-owned life insurance | 60 | 52 | 8 | 15.38 | % | |||||||||||
| Other Income | 194 | 161 | 33 | 20.50 | % | |||||||||||
| Total non-interest income | $ | 1,846 | $ | 1,616 | $ | 230 | 14.23 | % | ||||||||
Non-interest income during the three months ended June 30, 2021 increased $0.2 million or 14.23% to $1.8 million compared to $1.6 million during the three months ended March 31, 2021. Gain on sale of loans increased $0.2 million, or 17.19%, during the quarter, totaling $1.1 million during the three months ended June 30, 2021, as compared to $0.9 million during the three months ended March 31, 2021. This increase was due primarily to: (i) an increase in the aggregate principal balance of SBA 7(a) guaranteed loans sold during the quarter; and (ii) an increase in the weighted average premium received. The aggregate principal balance of SBA 7(a) guaranteed portions sold during the quarter ended June 30, 2021 was $11.1 million compared to $10.0 million during the quarter ended March 31, 2021. The weighted average premium received was 9.82% during the quarter ended June 30, 2021 compared to 7.91% during the quarter ended March 31, 2021. Loan-related expenses during the three months ended June 30, 2021 increased $0.1 million, or 72.95%, to $0.2 million compared to $0.1 million during the three months ended March 31, 2021, which is primarily related to an increase in swap referral fees during the quarter. These increases were partially offset by a decline in gain on sale of securities during the three months ended June 30, 2021 of $0.1 million, or 49.45%, when comparing to the three months ended March 31, 2021. The decline related to a lower volume of securities sold in the quarter ended June 30, 2021 compared to March 31, 2021.
The following table presents the key components of non-interest income for the periods indicated:
| Non-interest Income | For the three months ended | $ | % | |||||||||||||
| (dollars in thousands) | Jun 30, 2021 | Jun 30, 2020 | Change | Change | ||||||||||||
| Service charges on deposit accounts | $ | 106 | $ | 76 | $ | 30 | 39.47 | % | ||||||||
| Gain on sale of securities | 92 | 434 | (342 | ) | (78.80 | )% | ||||||||||
| Gain on sale of loans | 1,091 | 802 | 289 | 36.03 | % | |||||||||||
| Loan-related fees | 211 | 947 | (736 | ) | (77.72 | )% | ||||||||||
| Dividends on FHLB stock | 92 | 64 | 28 | 43.75 | % | |||||||||||
| Earnings on bank-owned life insurance | 60 | 58 | 2 | 3.45 | % | |||||||||||
| Other Income | 194 | 93 | 101 | 108.60 | % | |||||||||||
| Total non-interest income | $ | 1,846 | $ | 2,474 | $ | (628 | ) | (25.38 | )% | |||||||
Non-interest income during the three months ended June 30, 2021 decreased $0.6 million, or 25.38%, to $1.8 million compared to $2.5 million during the three months ended June 30, 2020. Loan-related expenses during the three months ended June 30, 2021 decreased $0.7 million, or 77.72%, to $0.2 million compared to $0.9 million during the three months ended June 30, 2020, which is primarily related to a decrease in swap referral fees. Gain on sale of securities declined during the three months ended June 30, 2021 by $0.3 million, or 78.80%, to $0.1 million compared to $0.4 million during the three months ended June 30, 2020. During the three months ended June 30, 2021, approximately $4.7 million of municipal securities were sold for a net gain of $0.1 million, compared to approximately $10 million of corporate bonds which were sold for a net gain of $0.4 million during the three months ended June 30, 2020. These declines were partially offset by an increase in gain on sale of loans of $0.3 million, or 36.03%, totaling $1.1 million during the three months ended June 30, 2021, as compared to $0.8 million during the three months ended June 30, 2020. The aggregate principal balance of SBA 7(a) guaranteed portions sold during the quarter ended June 30, 2021 was $11.1 million compared to $16.4 million in the quarter ended June 30, 2020. The weighted average premium received was 9.82% during the quarter ended June 30, 2021 compared to 5.37% during the quarter ended June 30, 2020. Other income during the three months ended June 30, 2021 increased $0.1 million, or 108.60%, to $0.2 million compared to $0.1 million during the three months ended June 30, 2020, which is primarily due to an increase in credit card related income.
Non-interest Expense
The following table presents the key components of non-interest expense for the periods indicated:
| Non-interest Expense | For the three months ended | $ | % | |||||||||||||
| (dollars in thousands) | Jun 30, 2021 | Mar 31, 2021 | Change | Change | ||||||||||||
| Salaries and employee benefits | $ | 4,939 | $ | 4,697 | $ | 242 | 5.15 | % | ||||||||
| Occupancy and equipment | 441 | 451 | (10 | ) | (2.22 | )% | ||||||||||
| Data processing and software | 598 | 629 | (31 | ) | (4.93 | )% | ||||||||||
| Federal Deposit Insurance Corporation insurance | 150 | 280 | (130 | ) | (46.43 | )% | ||||||||||
| Professional services | 1,311 | 1,532 | (221 | ) | (14.43 | )% | ||||||||||
| Advertising and promotional | 265 | 170 | 95 | 55.88 | % | |||||||||||
| Loan-related expenses | 218 | 229 | (11 | ) | (4.80 | )% | ||||||||||
| Other operating expenses | 1,658 | 816 | 842 | 103.19 | % | |||||||||||
| Total non-interest expense | $ | 9,580 | $ | 8,804 | $ | 776 | 8.81 | % | ||||||||
Non-interest expense for the quarter ended June 30, 2021 increased $0.8 million, or 8.81%, to $9.6 million as compared to $8.8 million during the quarter ended March 31, 2021, primarily as a result of a $0.2 million, or 5.15%, increase in salaries and employee benefits and a $0.8 million, or 103.19%, increase in other operating expenses, partially offset by decreases of $0.1 million and $0.2 million, or 46.63% and 14.43%, in Federal Deposit Insurance Corporation (“FDIC”) insurance and professional services, respectively. The $0.2 million increase in salaries and employee benefits was primarily due to restricted stock compensation expense recognized for employee grants of $0.1 million. The remainder of the change in salaries and employee benefits is related to an increase in full-time equivalent employees and increased commissions related to our loan and deposit growth for the quarter ended June 30, 2021 compared to the quarter ended March 31, 2021. Other operating expenses, which are comprised of travel, insurance, postage and supplies, director fees, other employee expenses, armored car expenses, courier services, and other miscellaneous administrative expenses, increased by $0.8 million, primarily due to stock compensation expense recognized for director grants of $0.8 million. Professional services expenses decreased by $0.2 million quarter-over-quarter to $1.3 million for the quarter ended June 30, 2021 due to a decline in audit, consulting, and legal costs incurred compared to the first quarter to support corporate organizational matters leading up to the Company’s IPO in May 2021 which was expensed as incurred in prior quarters. FDIC insurance expense decreased by $0.1 million quarter-over-quarter, primarily as a result of an improved leverage ratio. Other expenditures for the quarter ended June 30, 2021 resulted in less significant quarter-over-quarter variances with a net increase totaling $0.1 million.
The following table presents the key components of non-interest expense for the periods indicated:
| Non-interest Expense | For the three months ended | $ | % | |||||||||||||
| (dollars in thousands) | Jun 30, 2021 | Jun 30, 2020 | Change | Change | ||||||||||||
| Salaries and employee benefits | $ | 4,939 | $ | 3,029 | $ | 1,910 | 63.06 | % | ||||||||
| Occupancy and equipment | 441 | 412 | 29 | 7.04 | % | |||||||||||
| Data processing and software | 598 | 452 | 146 | 32.30 | % | |||||||||||
| Federal Deposit Insurance Corporation insurance | 150 | 342 | (192 | ) | (56.14 | )% | ||||||||||
| Professional services | 1,311 | 368 | 943 | 256.25 | % | |||||||||||
| Advertising and promotional | 265 | 247 | 18 | 7.29 | % | |||||||||||
| Loan-related expenses | 218 | 194 | 24 | 12.37 | % | |||||||||||
| Other operating expenses | 1,658 | 972 | 686 | 70.58 | % | |||||||||||
| Total non-interest expense | $ | 9,580 | $ | 6,016 | $ | 3,564 | 59.24 | % | ||||||||
Non-interest expense increased by $3.6 million, or 59.24%, to $9.6 million during the three months ended June 30, 2021 as compared to $6.0 million for the three months ended June 30, 2020, primarily as a result of a $1.9 million, or 63.06%, increase in salaries and employee benefits, a $0.1 million, or 32.30%, increase in data processing and software, a $0.9 million, or 256.25%, increase in professional services, and a $0.7 million, or 70.58%, increase in other operating expenses, partially offset by a $0.2 million, or 56.14%, decrease in FDIC insurance. Salaries and employee benefits increased by $1.9 million to $4.9 million during the three months ended June 30, 2021 as compared to $3.0 million for the quarter ended June 30, 2020. This increase was primarily related to an increase of full-time equivalent employees from 124 as of June 30, 2020 to 156 as of June 30, 2021, a 25.81% increase, increased commissions related to our loan and deposit growth for the quarter ended June 30, 2021 compared to June 30, 2020, and restricted stock compensation expense recognized for employee grants of $0.1 million during the three months ended June 30, 2021. Professional services expenses increased by $0.9 million period-over-period to $1.3 million for the quarter ended June 30, 2021, due to increased audit, consulting, and legal costs incurred to support corporate organizational matters leading up to the IPO during the quarter ended June 30, 2021, which did not occur during the same quarter of the prior year. Data processing and software expenses increased by $0.1 million period-over-period to $0.6 million for the quarter ended June 30, 2021. The increase was primarily due to: (i) increased usage of our digital banking platform; (ii) higher transaction volumes related to the increased number of loan and deposit accounts; (iii) increased costs related to improved collateral tracking, electronic statements, and mobile payment solutions; and (iv) increased number of licenses for new users on our loan origination and documentation system. Other operating expenses, as defined above, increased by $0.7 million, primarily as a result of stock compensation expense recognized for director grants of $0.8 million. FDIC insurance expense decreased by $0.2 million period-over-period to $0.2 million for the quarter ended June 30, 2021. This decrease was primarily a result of an improved leverage ratio. Other expenditures for the quarter ended June 30, 2021 resulted in less significant period-over-period variances, with a net decrease totaling $0.1 million.
Provision for Income Taxes
The Company terminated its status as a “Subchapter S” corporation as of May 5, 2021, in connection with the Company’s IPO and became a C Corporation. Prior to that date, as an S Corporation, the Company had no U.S. federal income tax expense. The provision recorded for the three months ended June 30, 2021 was calculated using an effective tax rate of 20.77%, representing the weighted average rate between the S Corporation tax rate of 3.50% and the C Corporation tax rate of 29.56% based on the number of days as each type of corporation during 2021. As such, a $2.4 million adjustment to increase tax expense for the S Corporation period was required. Refer to the section entitled “Pro Forma C Corporation Income Tax Expense” below for a discussion on what the Company’s income tax expense and net income would have been had the Company been taxed as a C Corporation for the periods ended March 31, 2021 and June 30, 2020.
In conjunction with the termination of the Subchapter S corporation status as of May 5, 2021, the C Corporation deferred tax assets and liabilities were estimated for future tax consequences attributable to differences between the financial statement carrying amounts of the Company’s existing assets and liabilities and their respective tax bases. The deferred tax assets and liabilities were measured using tax rates expected to apply to taxable income in the years in which those temporary differences are expected to be recovered or settled. The effect on deferred tax assets and liabilities of the change in tax rates resulting from becoming a C Corporation was recognized as a net deferred tax asset of $5.4 million and a reduction to the provision for income taxes of $4.6 million during the three months ended June 30, 2021.
Provision for income taxes for the quarter ended June 30, 2021 increased $0.3 million, or 92.15%, to $0.7 million as compared to $0.4 million during the quarter ended March 31, 2021. This increase is due to the increase of the effective tax rate used from 3.50% to 20.77%, as previously noted above, and was partially offset by the $4.6 million reduction to the provision for income taxes for the adjustment of the net deferred tax assets due to the termination of the Company’s S Corporation status.
Provision for income taxes increased by $0.3 million, or 99.46%, to $0.7 million during the three months ended June 30, 2021 as compared to $0.4 million for the three months ended June 30, 2020. This increase is due to the increase of the effective tax rate used from 3.50% to 20.77%, as previously noted above, and was partially offset by the $4.6 million reduction to the provision for income taxes for the adjustment of the net deferred tax assets due to the termination of the Company’s S Corporation status.
Pro Forma C Corporation Income Tax Expense
Because of the Company’s status as a Subchapter S Corporation, no U.S. federal income tax expense was recorded for a portion of the three months ended June 30, 2021, the three months ended March 31, 2021, and the three months ended June 30, 2020. Had the Company been taxed as a C Corporation and paid U.S. federal income tax for such periods, the combined statutory income tax rate would have been 29.56% in each period. These pro forma statutory rates reflect a U.S. federal income tax rate of 21.0% and a California income tax rate of 8.56%, after adjustment for the federal tax benefit, on corporate taxable income. Had the Company been subject to U.S. federal income tax for each of these periods, on a statutory income tax rate pro forma basis, the provision for combined federal and state income tax would have been $3.1 million, $3.2 million and $3.1 million, for the three months ended June 30, 2021, March 31, 2021 and June 30, 2020, respectively. As a result of the foregoing factors, the Company’s pro forma net income (after U.S. federal and California state income tax) for the three months ended June 30, 2021, March 31, 2021 and June 30, 2020 would have been $7.4 million, $7.5 million, and $7.4 million, respectively.
Webcast Details
Five Star Bancorp will host a webcast on Tuesday, July 27, 2021, at 10:00 a.m. PT (1:00 p.m. ET), to discuss its second quarter results. To view the live webcast, visit the “News & Events” section of the Company’s website under “Events” at https://investors.fivestarbank.com/news-events/events. The webcast will be archived on the Company’s website for a period of 90 days.
About Five Star Bancorp
Five Star is a bank holding company headquartered in Rancho Cordova, California. Five Star operates through its wholly owned banking subsidiary, Five Star Bank. Five Star has seven branches and two loan production offices throughout Northern California.
Forward-Looking Statements
This press release contains forward-looking statements within the meaning of the Private Securities Litigation Reform Act of 1995. These forward-looking statements represent plans, estimates, objectives, goals, guidelines, expectations, intentions, projections and statements of the Company’s beliefs concerning future events, business plans, objectives, expected operating results and the assumptions upon which those statements are based. Forward-looking statements include without limitation, any statement that may predict, forecast, indicate or imply future results, performance or achievements, and are typically identified with words such as “may,” “could,” “should,” “will,” “would,” “believe,” “anticipate,” “estimate,” “expect,” “aim,” “intend,” “plan” or words or phases of similar meaning. The Company cautions that the forward-looking statements are based largely on the Company’s expectations and are subject to a number of known and unknown risks and uncertainties that are subject to change based on factors which are, in many instances, beyond the Company’s control. Such forward-looking statements are based on various assumptions (some of which may be beyond the Company’s control) and are subject to risks and uncertainties, which change over time, and other factors which could cause actual results to differ materially from those currently anticipated. New risks and uncertainties may emerge from time to time, and it is not possible for the Company to predict their occurrence or how they will affect the Company. If one or more of the factors affecting the Company’s forward-looking information and statements proves incorrect, then the Company’s actual results, performance or achievements could differ materially from those expressed in, or implied by, forward-looking information and statements contained in this press release. Therefore, the Company cautions you not to place undue reliance on the Company’s forward-looking information and statements. Important factors that could cause actual results to differ materially from those in the forward-looking statements are set forth in the Company’s Quarterly Report on Form 10-Q for the quarter ended March 31, 2021 under the section entitled “Risk Factors,” and other documents filed by the Company with the Securities and Exchange Commission from time to time.
The Company disclaims any duty to revise or update the forward-looking statements, whether written or oral, to reflect actual results or changes in the factors affecting the forward-looking statements, except as specifically required by law.
Condensed Financial Data (Unaudited)
| For the three months ended | ||||||||||||
| (dollars in thousands, except share and per share data) | June 30, 2021 | March 31, 2021 | June 30, 2020 | |||||||||
| Revenue and Expense Data | ||||||||||||
| Interest income | $ | 19,308 | $ | 19,190 | $ | 18,285 | ||||||
| Interest expense | 1,012 | 1,142 | 2,702 | |||||||||
| Net interest income | 18,296 | 18,048 | 15,583 | |||||||||
| Provision for loan losses | — | 200 | 1,550 | |||||||||
| Net interest income after provision | 18,296 | 17,848 | 14,033 | |||||||||
| Non-interest income: | ||||||||||||
| Service charges on deposit accounts | 106 | 90 | 76 | |||||||||
| Gain (loss) on sale of securities | 92 | 182 | 434 | |||||||||
| Gain on sale of loans | 1,091 | 931 | 802 | |||||||||
| Loan-related fees | 211 | 122 | 947 | |||||||||
| Dividends on FHLB stock | 92 | 78 | 64 | |||||||||
| Earnings on bank-owned life insurance | 60 | 52 | 58 | |||||||||
| Other Income | 194 | 161 | 93 | |||||||||
| Total non-interest income | 1,846 | 1,616 | 2,474 | |||||||||
| Non-interest expense: | ||||||||||||
| Salaries and employee benefits | 4,939 | 4,697 | 3,029 | |||||||||
| Occupancy and equipment | 441 | 451 | 412 | |||||||||
| Data processing and software | 598 | 629 | 452 | |||||||||
| Federal Deposit Insurance Corporation insurance | 150 | 280 | 342 | |||||||||
| Professional services | 1,311 | 1,532 | 368 | |||||||||
| Advertising and promotional | 265 | 170 | 247 | |||||||||
| Loan-related expenses | 218 | 229 | 194 | |||||||||
| Other operating expenses | 1,658 | 816 | 972 | |||||||||
| Total non-interest expense | 9,580 | 8,804 | 6,016 | |||||||||
| Total income before taxes | 10,562 | 10,660 | 10,491 | |||||||||
| Provision for income taxes | 734 | 382 | 368 | |||||||||
| Net income | $ | 9,828 | $ | 10,278 | $ | 10,123 | ||||||
| Share Data | ||||||||||||
| Earnings per common share: | ||||||||||||
| Basic | $ | 0.67 | $ | 0.93 | $ | 1.05 | ||||||
| Diluted | $ | 0.67 | $ | 0.93 | $ | 1.05 | ||||||
| Weighted average basic common shares outstanding | 14,650,208 | 10,998,041 | 9,671,455 | |||||||||
| Weighted average diluted common shares | 14,667,804 | 11,004,337 | 9,683,023 | |||||||||
| Credit Quality | ||||||||||||
| Allowance for loan losses to period end nonperforming loans | 5139.91 | % | 4341.52 | % | 4712.11 | % | ||||||
| Nonperforming loans to period end loans | 0.03 | % | 0.03 | % | 0.02 | % | ||||||
| Nonperforming assets to total assets | 0.02 | % | 0.02 | % | 0.02 | % | ||||||
| Nonperforming loans plus performing TDRs to total loans | 0.03 | % | 0.03 | % | 0.02 | % | ||||||
| COVID-19 deferments to period end loans | 0.81 | % | 1.11 | % | 5.02 | % | ||||||
| Selected Financial Ratios | ||||||||||||
| ROAA | 1.75 | % | 2.05 | % | 2.17 | % | ||||||
| ROAE | 24.25 | % | 32.08 | % | 36.92 | % | ||||||
| Net interest margin | 3.48 | % | 3.83 | % | 3.42 | % | ||||||
| Loan to deposit | 76.84 | % | 77.99 | % | 77.69 | % | ||||||
| (dollars in thousands) | June 30, 2021 | March 31, 2021 | December 31, 2020 | |||||||||
| Balance Sheet Data | ||||||||||||
| Cash and due from financial institutions | $ | 165,927 | $ | 44,720 | $ | 46,028 | ||||||
| Interest-bearing deposits | 370,677 | 389,872 | 244,465 | |||||||||
| Time deposits in banks | 19,451 | 25,696 | 23,705 | |||||||||
| Securities - available-for-sale, at fair value | 160,074 | 127,251 | 114,949 | |||||||||
| Securities - held-to-maturity, at amortized cost | 6,473 | 6,486 | 7,979 | |||||||||
| Loans held for sale | 2,340 | 3,060 | 4,820 | |||||||||
| Loans, gross | 1,585,462 | 1,543,493 | 1,503,159 | |||||||||
| Allowance for loan losses | (22,153 | ) | (22,271 | ) | (22,189 | ) | ||||||
| Loans, net | 1,563,309 | 1,521,222 | 1,480,970 | |||||||||
| Federal Home Loan Bank stock | 6,723 | 6,232 | 6,232 | |||||||||
| Premises and equipment, net | 1,649 | 1,645 | 1,663 | |||||||||
| Bank owned life insurance | 11,074 | 8,714 | 8,662 | |||||||||
| Interest receivable and other assets | 20,170 | 15,839 | 14,292 | |||||||||
| Total assets | $ | 2,327,867 | $ | 2,150,737 | $ | 1,953,765 | ||||||
| Deposits: | ||||||||||||
| Noninterest-bearing | $ | 829,036 | $ | 798,825 | $ | 695,687 | ||||||
| Interest-bearing | 1,237,249 | 1,184,285 | 1,088,314 | |||||||||
| Total deposits | 2,066,285 | 1,983,110 | 1,784,001 | |||||||||
| Subordinated notes, net | 28,353 | 28,336 | 28,320 | |||||||||
| Interest payable and other liabilities | 14,915 | 7,914 | 7,669 | |||||||||
| Total liabilities | 2,109,553 | 2,019,360 | 1,819,990 | |||||||||
| Common stock | 218,026 | 110,144 | 110,082 | |||||||||
| Retained earnings | — | 21,623 | 22,348 | |||||||||
| Accumulated other comprehensive income (loss), net | 288 | (390 | ) | 1,345 | ||||||||
| Total shareholders’ equity | $ | 218,314 | $ | 131,377 | $ | 133,775 | ||||||
| Quarterly Average Balance Data | ||||||||||||
| Average loans | $ | 1,578,438 | $ | 1,526,130 | $ | 1,530,227 | ||||||
| Average interest-earning assets | $ | 2,106,252 | $ | 1,911,112 | $ | 1,866,372 | ||||||
| Average total assets | $ | 2,247,009 | $ | 2,037,093 | $ | 1,983,049 | ||||||
| Average deposits | $ | 2,040,489 | $ | 1,874,713 | $ | 1,818,360 | ||||||
| Average borrowings and subordinated debt | $ | 28,339 | $ | 28,326 | $ | 28,311 | ||||||
| Average total equity | $ | 162,560 | $ | 128,673 | $ | 129,762 | ||||||
| Capital Ratio Data | ||||||||||||
| Equity to total assets | 9.38 | % | 6.11 | % | 6.85 | % | ||||||
| Tangible common equity to tangible assets(1) | 9.38 | % | 6.11 | % | 6.85 | % | ||||||
| Total capital (to risk-weighted assets) | 16.41 | % | 12.09 | % | 12.18 | % | ||||||
| Tier 1 capital (to risk-weighted assets) | 13.39 | % | 8.89 | % | 8.98 | % | ||||||
| Common equity Tier 1 capital (to risk-weighted assets) | 13.39 | % | 8.89 | % | 8.98 | % | ||||||
| Tier 1 leverage ratio | 9.59 | % | 6.37 | % | 6.58 | % | ||||||
(1) See “Non-GAAP Reconciliation (Unaudited)” table for reconciliation of non-GAAP measure.
Non-GAAP Reconciliation (Unaudited)
| (dollars in thousands) | June 30, 2021 | March 31, 2021 | December 31, 2020 | |||||||||
| Tangible common equity to tangible assets | ||||||||||||
| Tangible common equity (numerator) | $ | 218,314 | $ | 131,377 | $ | 133,775 | ||||||
| Tangible assets (denominator) | 2,327,867 | 2,150,737 | 1,953,765 | |||||||||
| Tangible common equity to tangible assets | 9.38 | % | 6.11 | % | 6.85 | % | ||||||
| (dollars in thousands) | June 30, 2021 | March 31, 2021 | June 30, 2020 | |||||||||
| Average loan yield, excluding PPP loans | ||||||||||||
| Interest income on loans, excluding PPP loans | $ | 16,855 | $ | 16,213 | $ | 16,210 | ||||||
| Annualized interest income on loans, excluding PPP loans (numerator) | 67,605 | 65,753 | 65,196 | |||||||||
| Average total loans, excluding PPP loans (denominator) | 1,419,870 | 1,349,746 | 1,255,041 | |||||||||
| Average loan yield, excluding PPP loans | 4.76 | % | 4.87 | % | 5.19 | % | ||||||
| (dollars in thousands) | June 30, 2021 | December 31, 2020 | ||||||
| Allowance for loan losses to total loans, excluding SBA PPP loans | ||||||||
| Allowance for loan losses | $ | 22,153 | $ | 22,189 | ||||
| Total loans | 1,587,802 | 1,507,979 | ||||||
| Less: SBA-guaranteed PPP loans | 120,936 | 147,965 | ||||||
| Allowance for loan losses to total loans, excluding SBA PPP loans | 1.51 | % | 1.63 | % | ||||
Media Contact:
Heather Luck, CFO
Five Star Bancorp
(916) 626-5008
[email protected]
Shelley Wetton, CMO
Five Star Bancorp
(916) 284-7827
[email protected]
Exhibit 99.2

July 2021
2 Forward - Looking Statements This presentation contains forward - looking statements within the meaning of the Private Securities Litigation Reform Act of 1995 . These forward - looking statements represent plans, estimates, objectives, goals, guidelines, expectations, intentions, projections and statements of the Company’s beliefs concerning future events, business plans, objectives, expected operating results and the assumptions upon which those statements are based . Forward - looking statements include without limitation, any statement that may predict, forecast, indicate or imply future results, performance or achievements, and are typically identified with words such as “may,” “could,” “should,” “will,” “would,” “believe,” “anticipate,” “estimate,” “expect,” “aim,” “intend,” “plan” or words or phases of similar meaning . The Company cautions that the forward - looking statements are based largely on the Company’s expectations and are subject to a number of known and unknown risks and uncertainties that are subject to change based on factors which are, in many instances, beyond the Company’s control . Such forward - looking statements are based on various assumptions (some of which may be beyond the Company’s control) and are subject to risks and uncertainties, which change over time, and other factors which could cause actual results to differ materially from those currently anticipated . New risks and uncertainties may emerge from time to time, and it is not possible for the Company to predict their occurrence or how they will affect the Company . If one or more of the factors affecting the Company’s forward - looking information and statements proves incorrect, then the Company’s actual results, performance or achievements could differ materially from those expressed in, or implied by, forward - looking information and statements contained in this press release . Therefore, the Company cautions you not to place undue reliance on the Company’s forward - looking information and statements . Important factors that could cause actual results to differ materially from those in the forward - looking statements are set forth in the Company’s Quarterly Report on Form 10 - Q for the quarter ended March 31 , 2021 under the section entitled “Risk Factors,” and other documents filed by the Company with the Securities and Exchange Commission from time to time . The Company disclaims any duty to revise or update the forward - looking statements, whether written or oral, to reflect actual results or changes in the factors affecting the forward - looking statements, except as specifically required by law . Industry Information This presentation includes statistical and other industry and market data that we obtained from government reports and other third - party sources . Our internal data, estimates, and forecasts are based on information obtained from government reports, trade and business organizations and other contacts in the markets in which we operate and our management’s understanding of industry conditions . Although we believe that this information (including the industry publications and third - party research, surveys, and studies) is accurate and reliable, we have not independently verified such information . In addition, estimates, forecasts and assumptions are necessarily subject to a high degree of uncertainty and risk due to a variety of factors . Finally, forward - looking information obtained from these sources is subject to the same qualifications and the additional uncertainties regarding the other forward - looking statements in this presentation . June 30, 2021 Numbers contained in this presentation for the quarter ended June 30, 2021 are unaudited. As a result, subsequent information ma y cause a change in certain accounting estimates and other financial information, including the Company’s allowance for loan losses, fair values, and income taxes. All figures presented as 2021 (YT D) represent unaudited results from January 1, 2021 through June 30, 2021 and unaudited balances as of June 30, 2021.

1. Q2 2021 Overview 2. Financial Highlights 3. Company Overview 3

4 • Net interest income growth driven by lower cost of funds, growth in interest - earning assets, and Paycheck Protection Program (“P PP”) forgiveness • Continued balance sheet growth with $103.2 million in non - PPP loan growth and $83.2 million in deposit growth since March 31, 20 21 • Closed Initial Public Offering on May 7, 2021, receiving total net proceeds of $109.1 million • Terminated status as a “Subchapter S” corporation as of May 5, 2021 • As of June 30, 2021, we had 8 borrowers totaling $12.9 million in the aggregate still on a COVID - 19 deferment; one borrower is a theater and the remaining seven are Small Business Administration (“SBA”) borrowers – We anticipate all borrowers to return to their pre - COVID - 19 contractual payment status after their COVID - 19 deferments end – All loans to date, that came off COVID - 19 deferments, went back to their contractual payment structures that were in place prior to the COVID - 19 pandemic with no risk rating downgrades to classified nor any Troubled Debt Restructures (“TDR”) Q2 2021 Highlights Q2 2021 Unaudited Financial Results


Total Deposits ($mm) 6 Total Assets ($mm) $840 $973 $1,272 $1,480 $1,954 $2,328 2016 2017 2018 2019 2020 2021 (YTD) $761 $865 $1,161 $1,312 $1,784 $2,066 $235 $264 $335 $387 $696 $829 2016 2017 2018 2019 2020 2021 (YTD) Total Deposits NIB Total Loans ($mm) $642 $776 $967 $1,187 $1,508 $1,588 $642 $776 $967 $1,187 $1,360 $1,467 2016 2017 2018 2019 2020 2021 (YTD) Gross Loans Non-PPP Loans

Total Loan Growth ($mm) 4.86% 4.93% 5.28% 5.45% 4.96% 4.84% 2016 2017 2018 2019 2020 2021 (YTD) Yield on Loans Loan Composition, as of June 30, 2021 (1) Real Estate Loan Balances by Geography (1) 7 (1) Net book value at period end, excluding $2.3 million in loans held for sale as of 06/30/2021. Loan balances are as of June 30, 2021. $642 $776 $967 $1,187 $1,508 $1,588 2016 2017 2018 2019 2020 2021 (YTD)
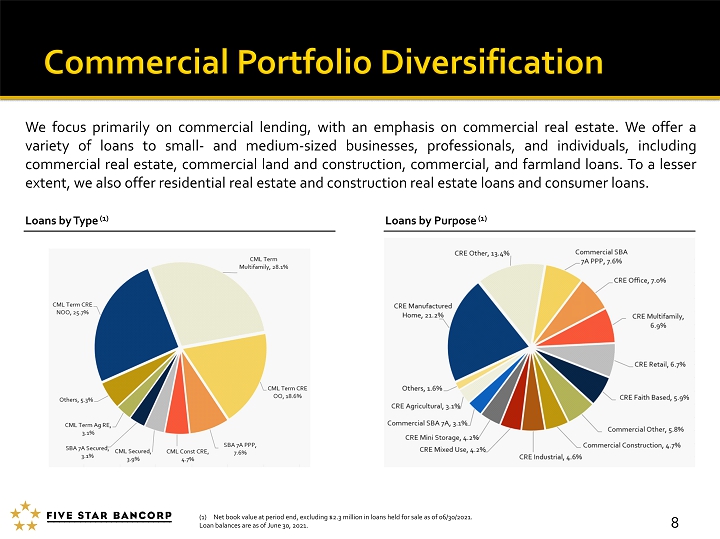
We focus primarily on commercial lending, with an emphasis on commercial real estate . We offer a variety of loans to small - and medium - sized businesses, professionals, and individuals, including commercial real estate, commercial land and construction, commercial, and farmland loans . To a lesser extent, we also offer residential real estate and construction real estate loans and consumer loans . Loans by Type (1) Loans by Purpose (1) 8 (1) Net book value at period end, excluding $2.3 million in loans held for sale as of 06/30/2021. Loan balances are as of June 30, 2021.

9 Non - performing Assets (“NPAs”) (Including Troubled Debt Restructurings) Allowance for Loan Losses (“ALLL”) / Loans HFI & Net Charge - offs (“NCOs”) / Average Loans • Our primary objective is to maintain a high level of asset quality in our loan portfolio. In order to maintain our strong ass et quality, we: – Place an emphasis on our commercial portfolio where risk assessments are reevaluated as a result of reviewing commercial prop ert y operating statements and borrower financials – Monitor payment performance, delinquencies, and tax and property insurance compliance – Design our practices to facilitate the early detection and remediation of problems within our loan portfolio – Employ the use of an outside independent consulting firm to evaluate our underwriting and risk assessment process • As of June 30, 2021, 10 loans totaling $12.9 million, or 0.81% of the loan portfolio, were in a COVID - 19 deferral period 1.30% 1.25% 1.21% 1.26% 1.47% 1.39% (0.01%) 0.03% 0.23% 0.21% 0.12% 0.00% 2016 2017 2018 2019 2020 2021 (YTD) ALLL / Loans HFI NCOs / Avg Loans $1.5 $3.1 $2.1 $0.8 $0.5 $0.4 0.23% 0.41% 0.22% 0.07% 0.03% 0.03% 2016 2017 2018 2019 2020 2021 (YTD) Nonperforming Assets (Including TDRs) NPAs ($mm) NPAs / Loans (%)

Total Deposit Growth ($mm) Noninterest Bearing (“NIB”) Deposit Growth ($mm) Deposit Composition (1) Cost of Interest - Bearing Liabilities 10 0.35% 0.55% 0.97% 1.26% 0.78% 0.36% 2016 2017 2018 2019 2020 2021 (YTD) $761 $865 $1,161 $1,312 $1,784 $2,066 2016 2017 2018 2019 2020 2021 (YTD) $235 $264 $335 $387 $696 $829 2016 2017 2018 2019 2020 2021 (YTD) Noninterest bearing 40% Savings 4% Money market 47% Interest checking 7% Time, over $250K 1% Other time 1% (1) Deposit balances are as of June 30, 2021.
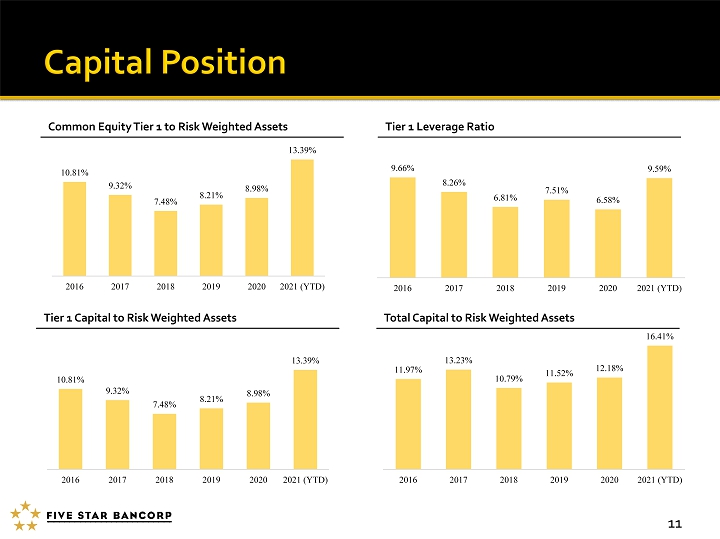
Common Equity Tier 1 to Risk Weighted Assets 11 Tier 1 Leverage Ratio Tier 1 Capital to Risk Weighted Assets Total Capital to Risk Weighted Assets 10.81% 9.32% 7.48% 8.21% 8.98% 13.39% 2016 2017 2018 2019 2020 2021 (YTD) 9.66% 8.26% 6.81% 7.51% 6.58% 9.59% 2016 2017 2018 2019 2020 2021 (YTD) 10.81% 9.32% 7.48% 8.21% 8.98% 13.39% 2016 2017 2018 2019 2020 2021 (YTD) 11.97% 13.23% 10.79% 11.52% 12.18% 16.41% 2016 2017 2018 2019 2020 2021 (YTD)

12 • Net income was $9.8 million, ROAA was 1.75% and ROAE was 24.25%. • Net interest margin was 3.48% as a result of the following: • Q2 2021 average loan yield was 4.73%, and excluding PPP loans, was 4.76% (1) • Q2 2021 cost of deposits was 0.20% • $1.2 million of PPP fee income recognized on $63 million of PPP loans forgiven during the quarter • Slight increase in non - interest income since March 31, 2021 due to increased premiums on SBA loans sold • $1.5 million of IPO - related expenses incurred in Q2 2021: • $0.7 million for corporate organizational matters leading up to the IPO • $0.8 million in stock compensation expense for non - recurring IPO - related stock grants to certain members of the Board of Directors • Increased headcount by 8 employees since March 31, 2021 • C Corp Conversion: • $4.6 million tax benefit recorded for deferred tax asset true - up • $2.4 million tax expense recorded to true - up year to date tax expense to effective tax rate of 20.77% • Net income would have been $7.4 million after application of full 29.56% statutory tax rate (1) See “Non - GAAP Reconciliation (Unaudited)” table on next slide for reconciliation of this non - GAAP measure. Q2 2021 unaudited financial results

13

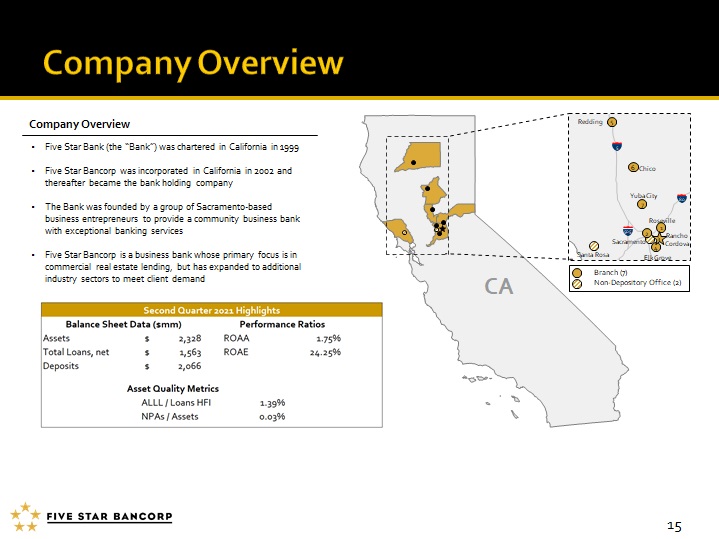
CA Redding 5 5 Chico 6 Yuba City 80 7 Roseville 1 Elk Grove 4 Sacramento Santa Rosa Rancho Cordova 3 2 • Branch (7) • Non - Depository Office (2) 505 Company Overview • Five Star Bank (the “Bank”) was chartered in California in 1999 • Five Star Bancorp was incorporated in California in 2002 and thereafter became the bank holding company • The Bank was founded by a group of Sacramento - based business entrepreneurs to provide a community business bank with exceptional banking services • Five Star Bancorp is a business bank whose primary focus is in commercial real estate lending, but has expanded to additional industry sectors to meet client demand 15

16 James Beckwith President and Chief Executive Officer Five Star since 2003 Heather Luck Senior Vice President and Chief Financial Officer Five Star since 2018 John W. Dalton Senior Vice President and Chief Credit Officer Five Star since 2011 Mike E. Lee Senior Vice President and Chief Regulatory Officer Five Star since 2005 Shelley R. Wetton Senior Vice President and Chief Marketing Officer Five Star since 2015 Michael A. Rizzo Senior Vice President and Chief Banking Officer Five Star since 2005 Brett Wait Senior Vice President and Chief Information Officer Five Star since 2011 Lydia Ramirez Senior Vice President and Chief Operations and DE&I Officer Five Star since 2017 Kristine Hyde Senior Vice President and Chief Human Resources Officer Five Star since 2020

Name Title Current / Prior Experience David J. Lucchetti Chairperson of the Board • Has served as Chairman of the Board since 2019 • Currently serves as Executive Chairman of the Board of Directors of Pacific Coast Building Products and Director of the Greater Sacramento Economic Council David F. Nickum Vice Chairperson • Currently serves as President & CEO of Valley Farm Transport, Inc. Larry Allbaugh Director • Currently serves as CEO of Buzz Oates Group and Director of Teichert Inc. and the Greater Sacramento Economic Council James Beckwith Director • Joined the Company in 2003 • Currently the Chairman of the Western Bankers Association • Previously served as CFO, CCO, and COO at National Bank of the Redwoods in Santa Rosa, CA Michael Campbell Director • One of the founders of Five Star Bank • CEO of California Trucking Association (2005 – 2013) • CFO of Surewest Communications (NASDAQ: SURW) (1994 – 2004) • Former Partner at Ernst & Young in the Seattle, WA office Shannon Deary - Bell Director • Currently serves as President, CEO, & Director of Nor - Cal Beverage Philip M. Joffe Director • Has served as a director of Five Star Bank since its inception • COO of CalFarm Insurance prior to their sale to Nationwide (1986 – 1999) • President of CalFarm Life Insurance prior to their sale to SunAmerica , Inc. (1993 – 1995) Robert T. Perry - Smith Director • Former CEO and founder of Perry - Smith LLP Kevin Ramos Director • Currently serves as Chief Investment Officer of Buzz Oates Group and Director of Saint John’s Program for Change Judson Riggs Director • Currently serves as CEO & Chairman of Teichert Inc. and Director of PRIDE Industries and the Greater Sacramento Economic Council Randall Reynoso Director • EVP and Commercial Banking Market Executive at Wells Farg0 (2007 – 2020) • President and COO of Placer Sierra Bancshares and Placer Sierra Bank (2000 – 2007) Leigh White Director • Over 30 years of experience in key positions in television broadcast management • Most recently, VP and GM of KTXL - TV in Sacramento (FOX, Tribune Broadcasting) 17
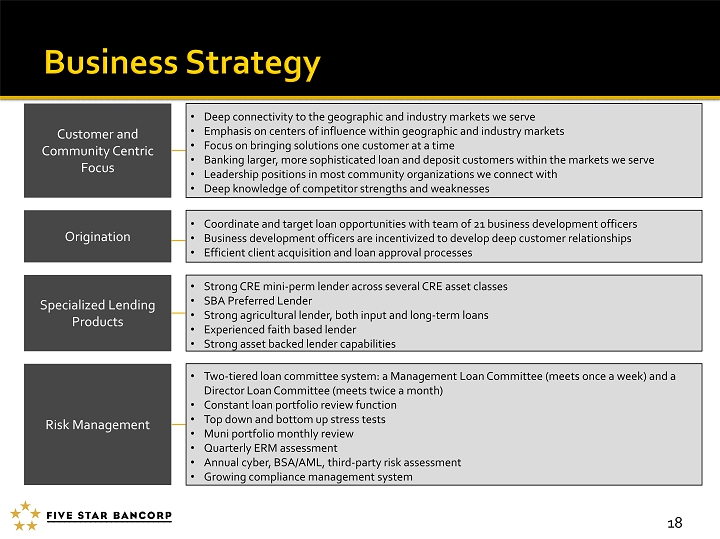
Customer and Community Centric Focus Specialized Lending Products Risk Management • Deep connectivity to the geographic and industry markets we serve • Emphasis on centers of influence within geographic and industry markets • Focus on bringing solutions one customer at a time • Banking larger, more sophisticated loan and deposit customers within the markets we serve • Leadership positions in most community organizations we connect with • Deep knowledge of competitor strengths and weaknesses • Strong CRE mini - perm lender across several CRE asset classes • SBA Preferred Lender • Strong agricultural lender, both input and long - term loans • Experienced faith based lender • Strong asset backed lender capabilities • Two - tiered loan committee system: a Management Loan Committee (meets once a week) and a Director Loan Committee (meets twice a month) • Constant loan portfolio review function • Top down and bottom up stress tests • Muni portfolio monthly review • Quarterly ERM assessment • Annual cyber, BSA/AML, third - party risk assessment • Growing compliance management system 18 Origination • Coordinate and target loan opportunities with team of 21 business development officers • Business development officers are incentivized to develop deep customer relationships • Efficient client acquisition and loan approval processes

19 Commercial Real Estate SBA Construction Faith - Based Lending Agriculture Manufacturing & Distribution Manufactured Home Communities Healthcare Venture Banking & Technology Professional Services Non - Profit Government
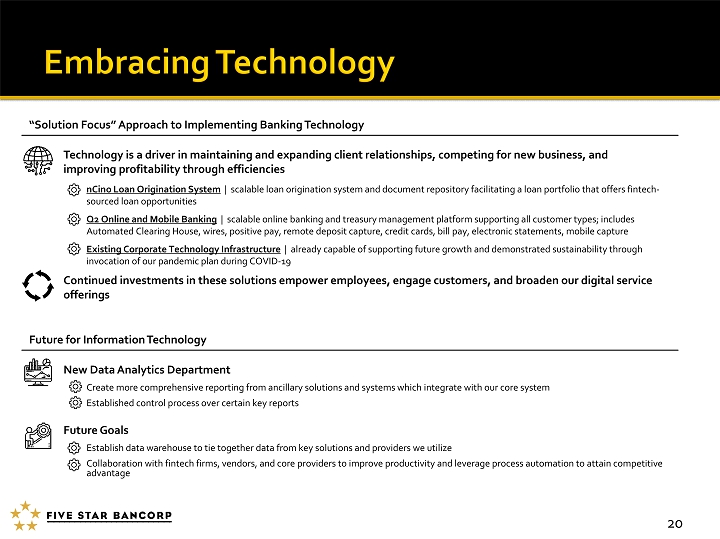
Technology is a driver in maintaining and expanding client relationships, competing for new business, and improving profitability through efficiencies nCino Loan Origination System | scalable loan origination system and document repository facilitating a loan portfolio that offers fintech - sourced loan opportunities Q2 Online and Mobile Banking | scalable online banking and treasury management platform supporting all customer types; includes Automated Clearing House, wires, positive pay, remote deposit capture, credit cards, bill pay, electronic statements, mobile cap ture Existing Corporate Technology Infrastructure | already capable of supporting future growth and demonstrated sustainability through invocation of our pandemic plan during COVID - 19 Continued investments in these solutions empower employees, engage customers, and broaden our digital service offerings 20 New Data Analytics Department Create more comprehensive reporting from ancillary solutions and systems which integrate with our core system Established control process over certain key reports Future Goals Establish data warehouse to tie together data from key solutions and providers we utilize Collaboration with fintech firms, vendors, and core providers to improve productivity and leverage process automation to attain competitive advantage “Solution Focus” Approach to Implementing Banking Technology Future for Information Technology
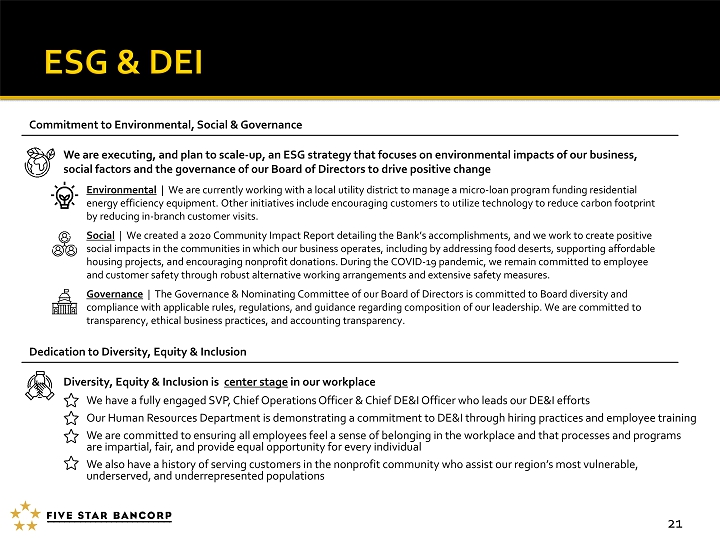
Commitment to Environmental, Social & Governance Dedication to Diversity, Equity & Inclusion We are executing, and plan to scale - up, an ESG strategy that focuses on environmental impacts of our business, social factors and the governance of our Board of Directors to drive positive change Environmental | We are currently working with a local utility district to manage a micro - loan program funding residential energy efficiency equipment. Other initiatives include encouraging customers to utilize technology to reduce carbon footprint by reducing in - branch customer visits. Social | We created a 2020 Community Impact Report detailing the Bank’s accomplishments, and we work to create positive social impacts in the communities in which our business operates, including by addressing food deserts, supporting affordable housing projects, and encouraging nonprofit donations. During the COVID - 19 pandemic, we remain committed to employee and customer safety through robust alternative working arrangements and extensive safety measures. Governance | The Governance & Nominating Committee of our Board of Directors is committed to Board diversity and compliance with applicable rules, regulations, and guidance regarding composition of our leadership. We are committed to transparency, ethical business practices, and accounting transparency. Diversity, Equity & Inclusion is center stage in our workplace We have a fully engaged SVP, Chief Operations Officer & Chief DE&I Officer who leads our DE&I efforts Our Human Resources Department is demonstrating a commitment to DE&I through hiring practices and employee training We are committed to ensuring all employees feel a sense of belonging in the workplace and that processes and programs are impartial, fair, and provide equal opportunity for every individual We also have a history of serving customers in the nonprofit community who assist our region’s most vulnerable, underserved, and underrepresented populations 21

Our Mission We strive to become the top business bank in all markets we serve through exceptional service, deep connectivity and customer empathy. We are dedicated to serving real estate, agricultural, faith based, and small to medium - sized enterprises. We aim to consistently deliver value that meets or exceeds expectations of our shareholders, customers, employees, business partners, and community. Our Core Values • Purpose - Driven and Integrity - Centered Banking • Community Stewardship • Regional and Industry Expertise • A Speed to Serve • A Commitment to Economic Development 22

• Experienced board of directors and management team • Attractive markets driving future growth potential • Proven organic growth capabilities • Attractive core deposit franchise • Scalable and efficient operating model • Differentiated approach to banking • Committed to serving and developing the local economy • Shareholder alignment and performance driven culture 23

24
Serious News for Serious Traders! Try StreetInsider.com Premium Free!
You May Also Be Interested In
- Five Star Bancorp Declares First Quarter Cash Dividend
- Verizon readies for 2024 wildfire season
- Ohmium Partners with Tata Projects to Advance Green Hydrogen Initiatives in India
Create E-mail Alert Related Categories
SEC FilingsSign up for StreetInsider Free!
Receive full access to all new and archived articles, unlimited portfolio tracking, e-mail alerts, custom newswires and RSS feeds - and more!
