Form 8-K CURO Group Holdings Corp For: Jun 22


2 IMPORTANT: You must read the following information before continuing to the rest of the presentation, which is being provided to you for informational purposes only. This presentation contains forward-looking statements. These forward-looking statements include projections, estimates and assumptions about various matters including our addressable markets and our position in them; future financial and operational performance, including revenue, pre-tax income, P/E multiples, originations, pre-tax margins, earnings, purchase accounting adjustments, debt capitalization and liquidity and our Q2 2021 outlook; run-off of merchant contracts following exit of Desjardins; the impact of the consumer financing agreement with LFL Group on us, including product expansion and cross-selling opportunities; proceeds to us from the Katapult transaction and underlying assumptions; implied U.S. outlook, including revenue, pre-tax income, loan balances, loan loss provision effect on net revenue, advertising spend as a percentage of revenue and growth scenarios. In addition, words such as “guidance,” “estimate,” “anticipate,” “believe,” “forecast,” “step,” “plan,” “predict,” “focused,” “project,” “is likely,” “expect,” “intend,” “should,” “will,” “confident,” variations of such words and similar expressions are intended to identify forward-looking statements. Our ability to achieve these forward-looking statements is based on certain assumptions, judgments and other factors, both within and outside of our control, that could cause actual results to differ materially from those in the forward-looking statements, the success of the parties under the LFL consumer financing agreement and the level of customers’ use of the POS product; the effects of competition on the company’s business; our ability to attract and retain customers; market, financial, political and legal conditions; the future impact of COVID-19 pandemic on the company’s business and the global economy; our dependence on third-party lenders to provide the cash we need to fund our loans and our ability to affordably access third-party financing; errors in our internal forecasts; our level of indebtedness; our ability to integrate acquired businesses; actions of regulators and the negative impact of those actions on our business; our ability to protect our proprietary technology and analytics and keep up with that of our competitors; disruption of our information technology systems that adversely affect our business operations; ineffective pricing of the credit risk of our prospective or existing customers; inaccurate information supplied by customers or third parties that could lead to errors in judging customers’ qualifications to receive loans; improper disclosure of customer personal data; failure of third parties who provide products, services or support to us; any failure of third-party lenders upon whom we rely to conduct business in certain states; disruption to our relationships with banks and other third-party electronic payment solutions providers as well as other factors discussed in our filings with the Securities and Exchange Commission. These projections, estimates and assumptions may prove to be inaccurate in the future. These forward-looking statements are not guarantees of future performance and involve known and unknown risks and uncertainties that are difficult to predict with regard to timing, extent, likelihood and degree of occurrence. There may be additional risks that we presently do not know or that we currently believe are immaterial that could also cause actual results to differ from those contained in the forward-looking statements. Given these risks and uncertainties, investors should not place undue reliance on forward-looking statements as a prediction of actual future results. We undertake no obligation to update, amend or clarify any forward-looking statement for any reason. NOTE: On March 10, 2021, CURO completed its previously announced acquisition of Flexiti. Throughout this presentation, we refer to addressable markets, customers we serve and growth opportunities after close of this transaction. In addition to the financial information prepared in conformity with U.S. GAAP, we provide in this presentation certain “non-GAAP financial measures,” including: Adjusted Net Income (Net Income from continuing operations minus certain non-cash and other adjusting items); Adjusted Earnings Per Share (Adjusted net income divided by diluted weighted average shares outstanding); Adjusted EBITDA (EBITDA plus or minus certain non-cash and other adjusting items); Gross Combined Loans Receivable (includes loans originated by third-party lenders through CSO programs which are not included in our consolidated financial statements); Adjusted Return on Average Assets; and Cash Earnings (Pretax Income plus or minus Non-Cash Accounting Impacts and Cash-Basis Impacts). Such measures are intended as a supplemental measure of the Company’s performance that are not required by, or presented in accordance with, GAAP. The Company presents Adjusted Net Income, Adjusted Earnings Per Share, Adjusted EBITDA, Gross Combined Loans Receivable, Adjusted Return on Average Assets and Cash Earnings because it believes that, when viewed with the Company’s GAAP results and the accompanying reconciliation, such measures provide useful information for comparing the Company’s performance over various reporting periods as they remove from the Company’s operating results the impact of items that the Company believes do not reflect its core operating performance. Adjusted Net Income, Adjusted Earnings Per Share, Adjusted EBITDA, Gross Combined Loans Receivable, Adjusted Return on Average Assets and Cash Earnings are not substitutes for net earnings, pretax earnings, cash flows provided by operating activities or any other measure prescribed by GAAP. There are limitations to using non-GAAP measures such as Adjusted Net Income, Adjusted Earnings Per Share, Adjusted EBITDA, Gross Combined Loans Receivable and Adjusted Return on Average Assets. Although the Company believes that Adjusted Net Income, Adjusted Earnings Per Share, Adjusted EBITDA, Gross Combined Loans Receivable, Adjusted Return on Average Assets and Cash Earnings can make an evaluation of its operating performance more consistent because they remove items that do not reflect its core operations, other companies in the Company’s industry may define Adjusted Net Income, Adjusted Earnings Per Share, Adjusted EBITDA, Gross Combined Loans Receivable, Adjusted Return on Average Assets and Cash Earnings differently than the Company does. As a result, it may be difficult to use Adjusted Net Income, Adjusted Earnings Per Share, Adjusted EBITDA, Gross Combined Loans Receivable, Adjusted Return on Average Assets and Cash Earnings to compare the performance of those companies to the Company’s performance. Adjusted Net Income, Adjusted Earnings Per Share, Adjusted EBITDA, Gross Combined Loans Receivable, Adjusted Return on Average Assets and Cash Earnings should not be considered as measures of the income generated by the Company’s business or discretionary cash available to it to invest in the growth of its business. The Company’s management compensates for these limitations by reference to its GAAP results and using Adjusted Net Income, Adjusted Earnings Per Share, Adjusted EBITDA, Gross Combined Loans Receivable, Adjusted Return on Average Assets and Cash Earnings as supplemental measures. Reconciliation of non-GAAP metrics to the closest comparable GAAP metrics included on slides 36-40. All product names, logos, brands, trademarks and registered trademarks are property of their respective owners.

3
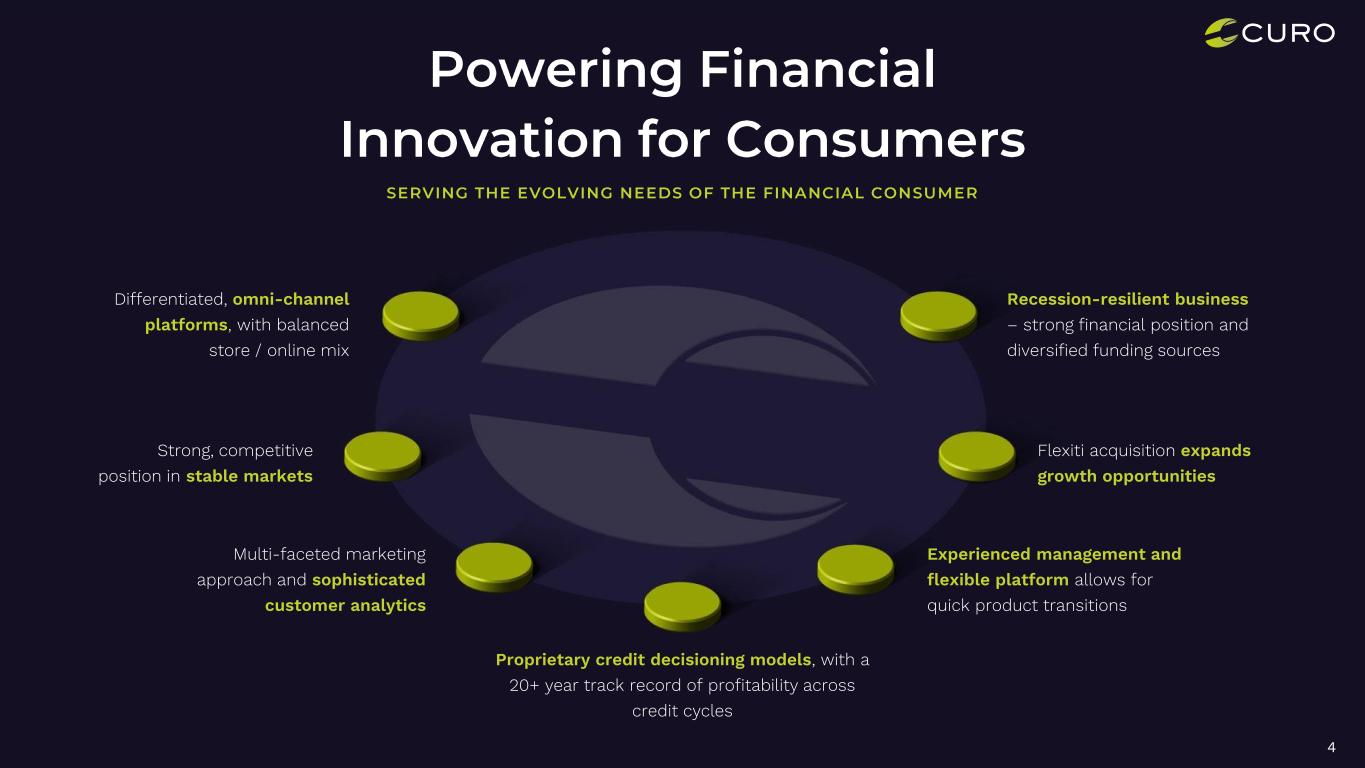
4 Differentiated, omni-channel platforms, with balanced store / online mix Multi-faceted marketing approach and sophisticated customer analytics Strong, competitive position in stable markets Flexiti acquisition expands growth opportunities Proprietary credit decisioning models, with a 20+ year track record of profitability across credit cycles Recession-resilient business – strong financial position and diversified funding sources Experienced management and flexible platform allows for quick product transitions
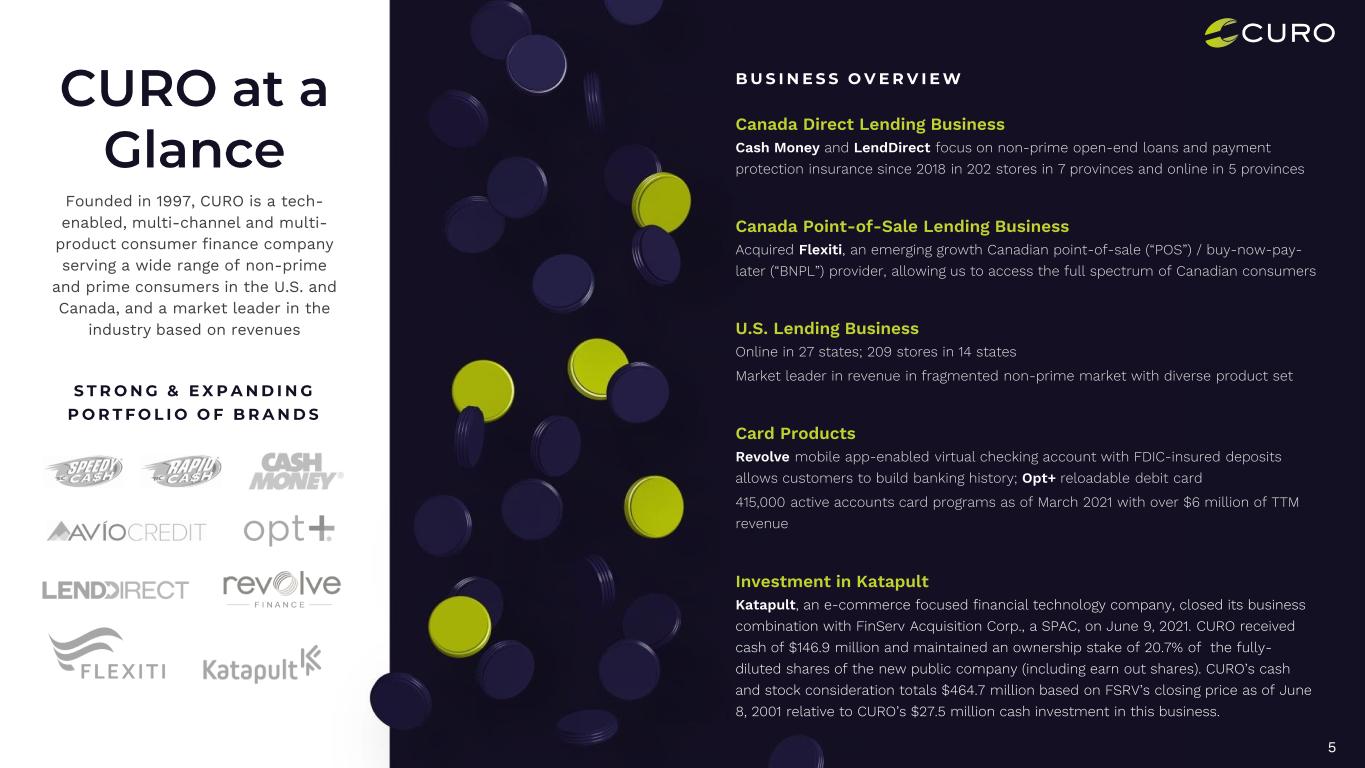
5 Canada Direct Lending Business Cash Money and LendDirect focus on non-prime open-end loans and payment protection insurance since 2018 in 202 stores in 7 provinces and online in 5 provinces Founded in 1997, CURO is a tech- enabled, multi-channel and multi- product consumer finance company serving a wide range of non-prime and prime consumers in the U.S. and Canada, and a market leader in the industry based on revenues Canada Point-of-Sale Lending Business Acquired Flexiti, an emerging growth Canadian point-of-sale (“POS”) / buy-now-pay- later (“BNPL”) provider, allowing us to access the full spectrum of Canadian consumers U.S. Lending Business Online in 27 states; 209 stores in 14 states Market leader in revenue in fragmented non-prime market with diverse product set Card Products Revolve mobile app-enabled virtual checking account with FDIC-insured deposits allows customers to build banking history; Opt+ reloadable debit card 415,000 active accounts card programs as of March 2021 with over $6 million of TTM revenue Investment in Katapult Katapult, an e-commerce focused financial technology company, closed its business combination with FinServ Acquisition Corp., a SPAC, on June 9, 2021. CURO received cash of $146.9 million and maintained an ownership stake of 20.7% of the fully- diluted shares of the new public company (including earn out shares). CURO’s cash and stock consideration totals $464.7 million based on FSRV’s closing price as of June 8, 2001 relative to CURO’s $27.5 million cash investment in this business.
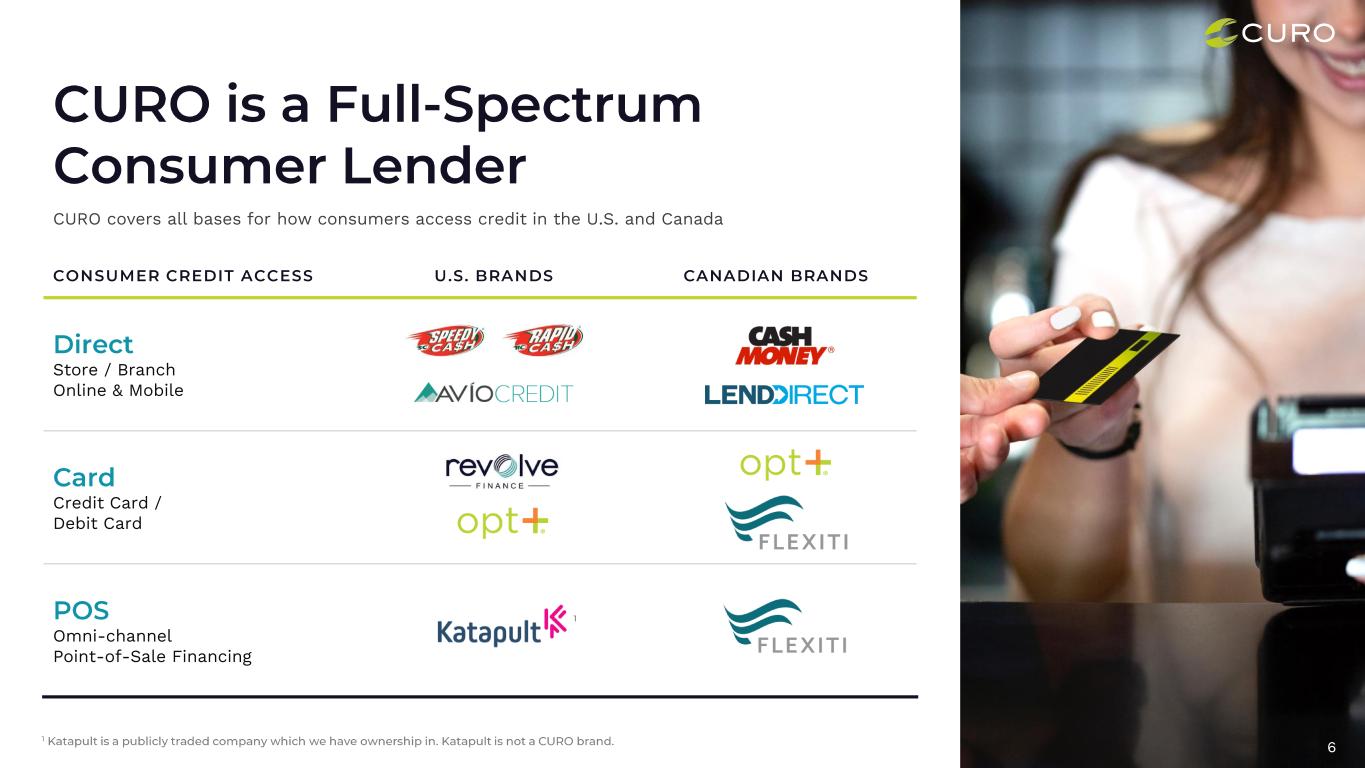
6 CURO covers all bases for how consumers access credit in the U.S. and Canada Store / Branch Online & Mobile Credit Card / Debit Card Omni-channel Point-of-Sale Financing
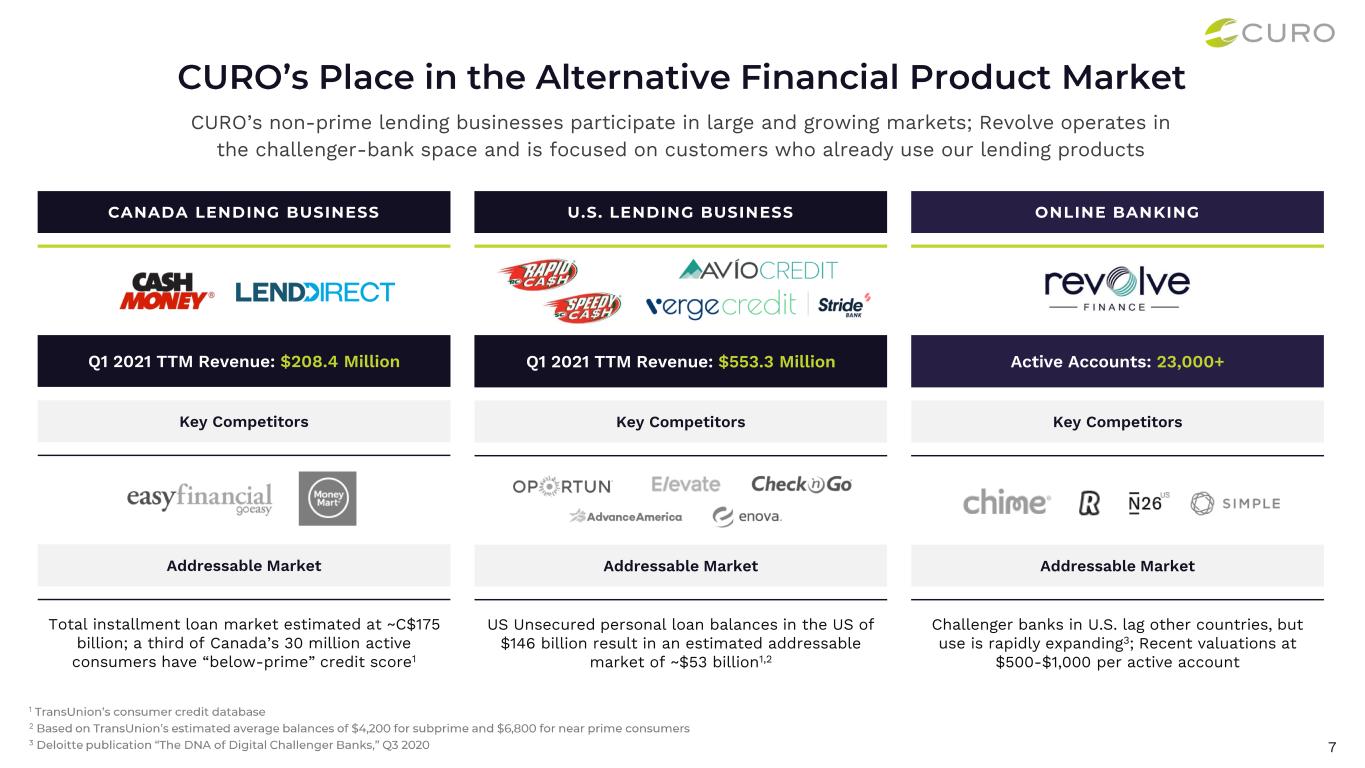
7 Q1 2021 TTM Revenue: $208.4 Million Key Competitors Addressable Market Total installment loan market estimated at ~C$175 billion; a third of Canada’s 30 million active consumers have “below-prime” credit score1 Q1 2021 TTM Revenue: $553.3 Million Key Competitors Addressable Market US Unsecured personal loan balances in the US of $146 billion result in an estimated addressable market of ~$53 billion1,2 Active Accounts: 23,000+ Key Competitors Addressable Market Challenger banks in U.S. lag other countries, but use is rapidly expanding3; Recent valuations at $500-$1,000 per active account CURO’s non-prime lending businesses participate in large and growing markets; Revolve operates in the challenger-bank space and is focused on customers who already use our lending products
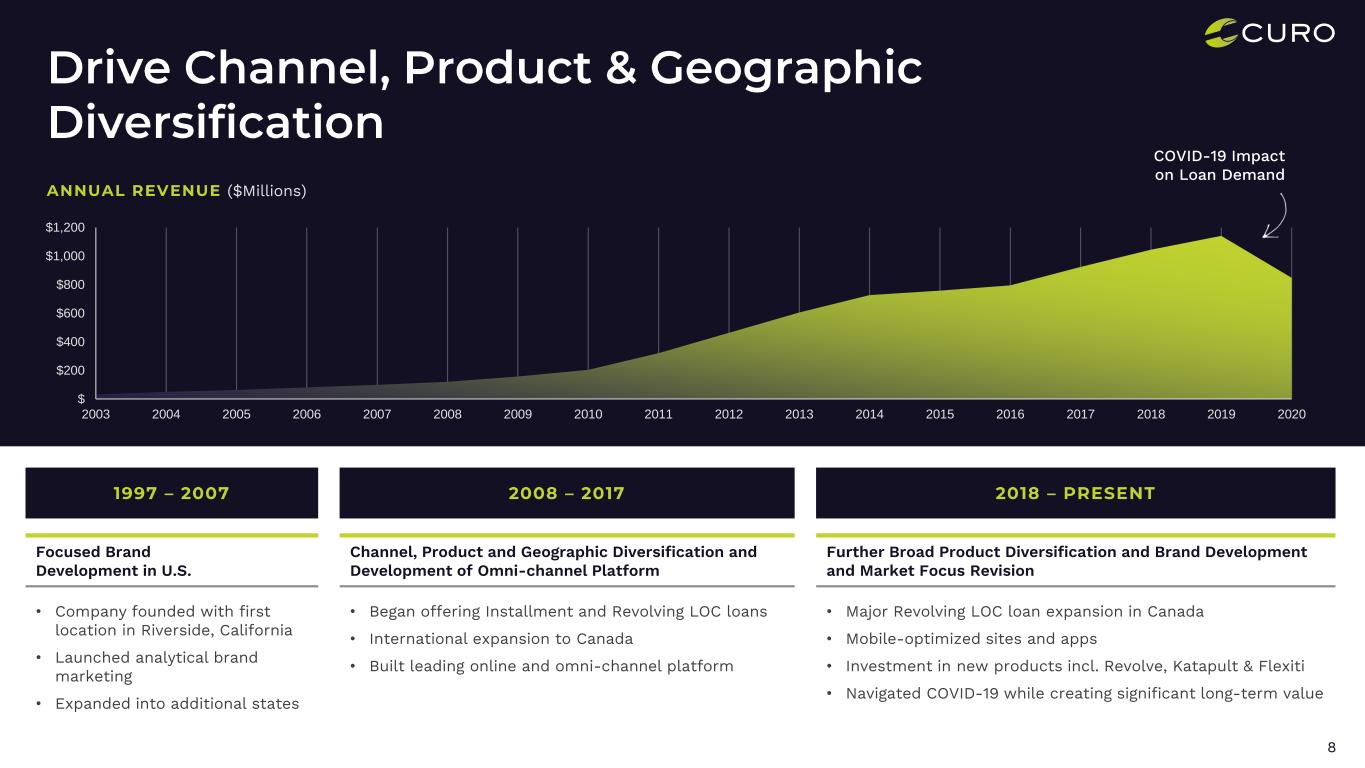
8 $ $200 $400 $600 $800 $1,000 $1,200 2003 2004 2005 2006 2007 2008 2009 2010 2011 2012 2013 2014 2015 2016 2017 2018 2019 2020 ($Millions) COVID-19 Impact on Loan Demand Focused Brand Development in U.S. • Company founded with first location in Riverside, California • Launched analytical brand marketing • Expanded into additional states Channel, Product and Geographic Diversification and Development of Omni-channel Platform • Began offering Installment and Revolving LOC loans • International expansion to Canada • Built leading online and omni-channel platform Further Broad Product Diversification and Brand Development and Market Focus Revision • Major Revolving LOC loan expansion in Canada • Mobile-optimized sites and apps • Investment in new products incl. Revolve, Katapult & Flexiti • Navigated COVID-19 while creating significant long-term value
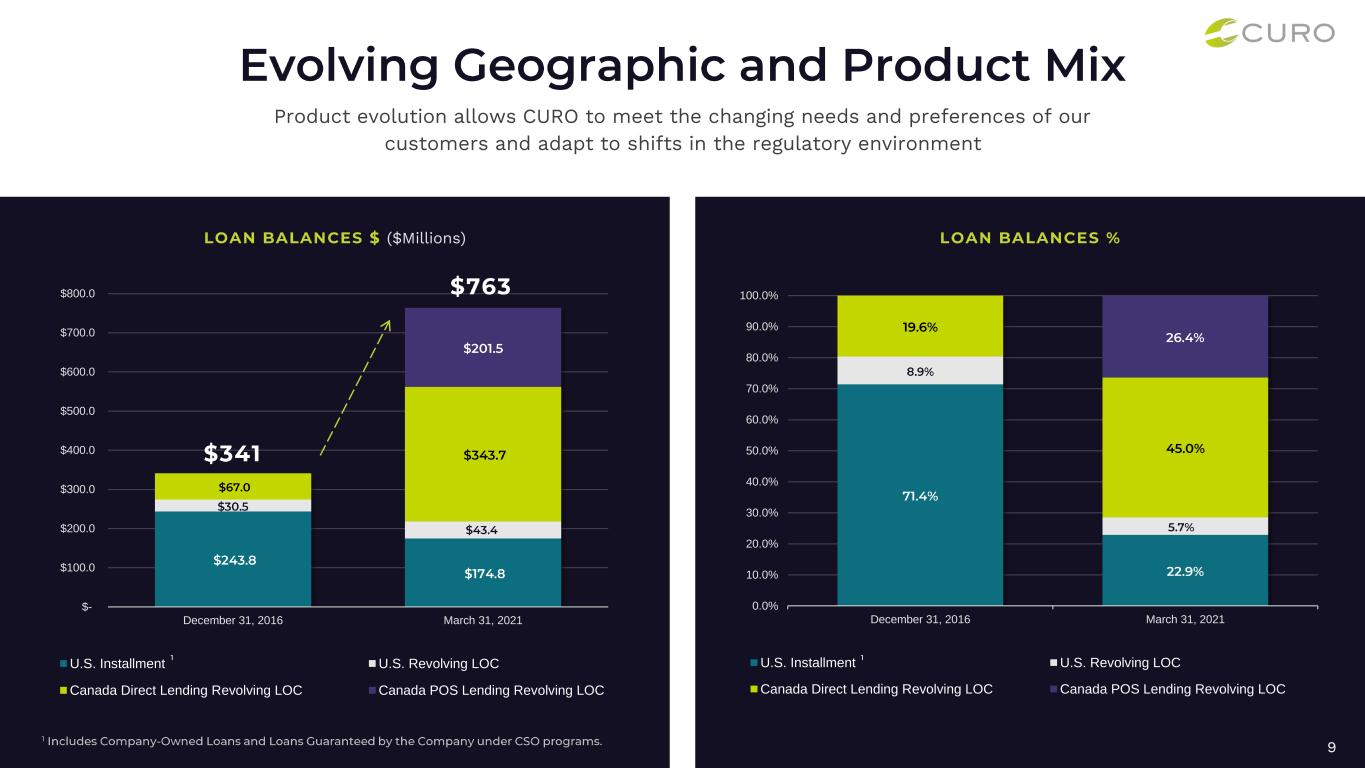
9 Product evolution allows CURO to meet the changing needs and preferences of our customers and adapt to shifts in the regulatory environment ($Millions) $- $100.0 $200.0 $300.0 $400.0 $500.0 $600.0 $700.0 $800.0 December 31, 2016 March 31, 2021 U.S. Installment U.S. Revolving LOC Canada Direct Lending Revolving LOC Canada POS Lending Revolving LOC 0.0% 10.0% 20.0% 30.0% 40.0% 50.0% 60.0% 70.0% 80.0% 90.0% 100.0% December 31, 2016 March 31, 2021 U.S. Installment U.S. Revolving LOC Canada Direct Lending Revolving LOC Canada POS Lending Revolving LOC
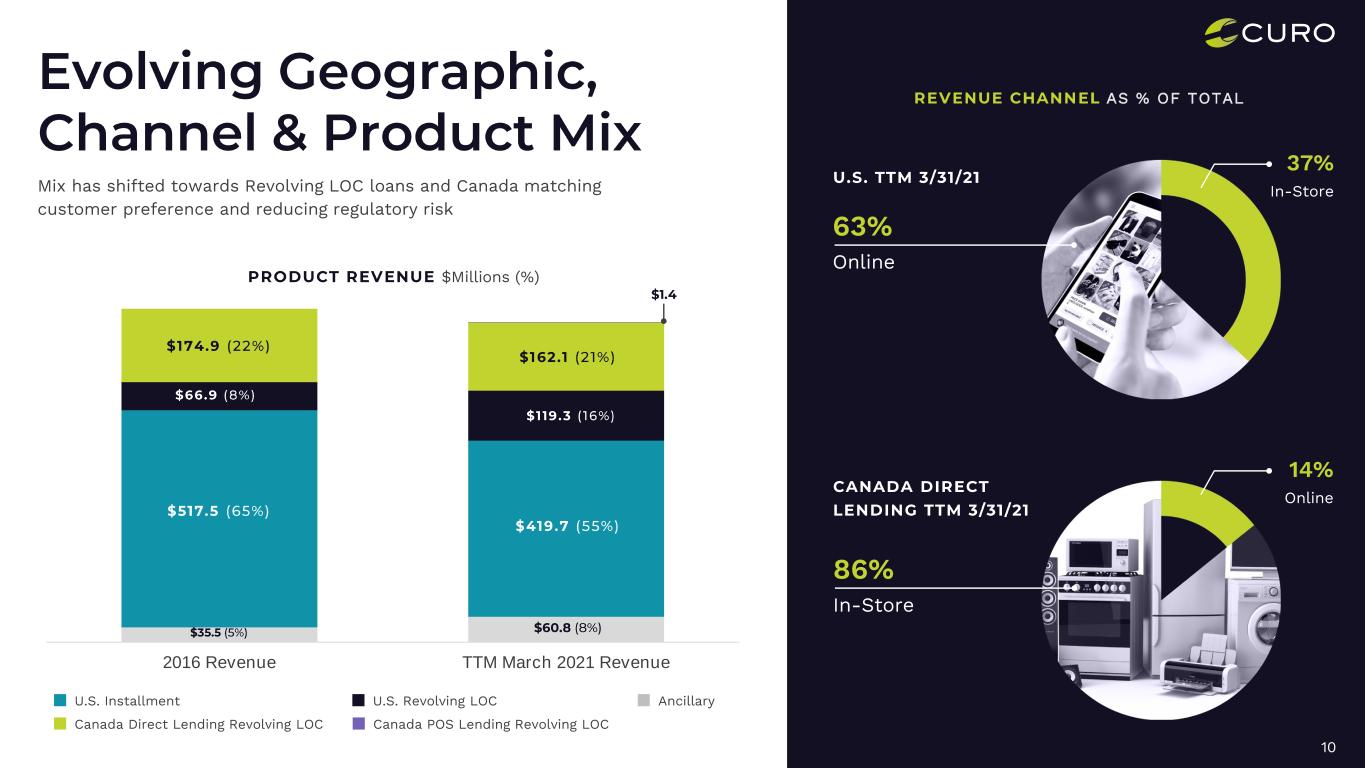
10 Mix has shifted towards Revolving LOC loans and Canada matching customer preference and reducing regulatory risk 2016 Revenue TTM March 2021 Revenue $Millions (%) Canada Direct Lending Revolving LOC U.S. Installment Canada POS Lending Revolving LOC U.S. Revolving LOC Ancillary AS % OF TOTAL 63% Online 37% In-Store 86% In-Store 14% Online
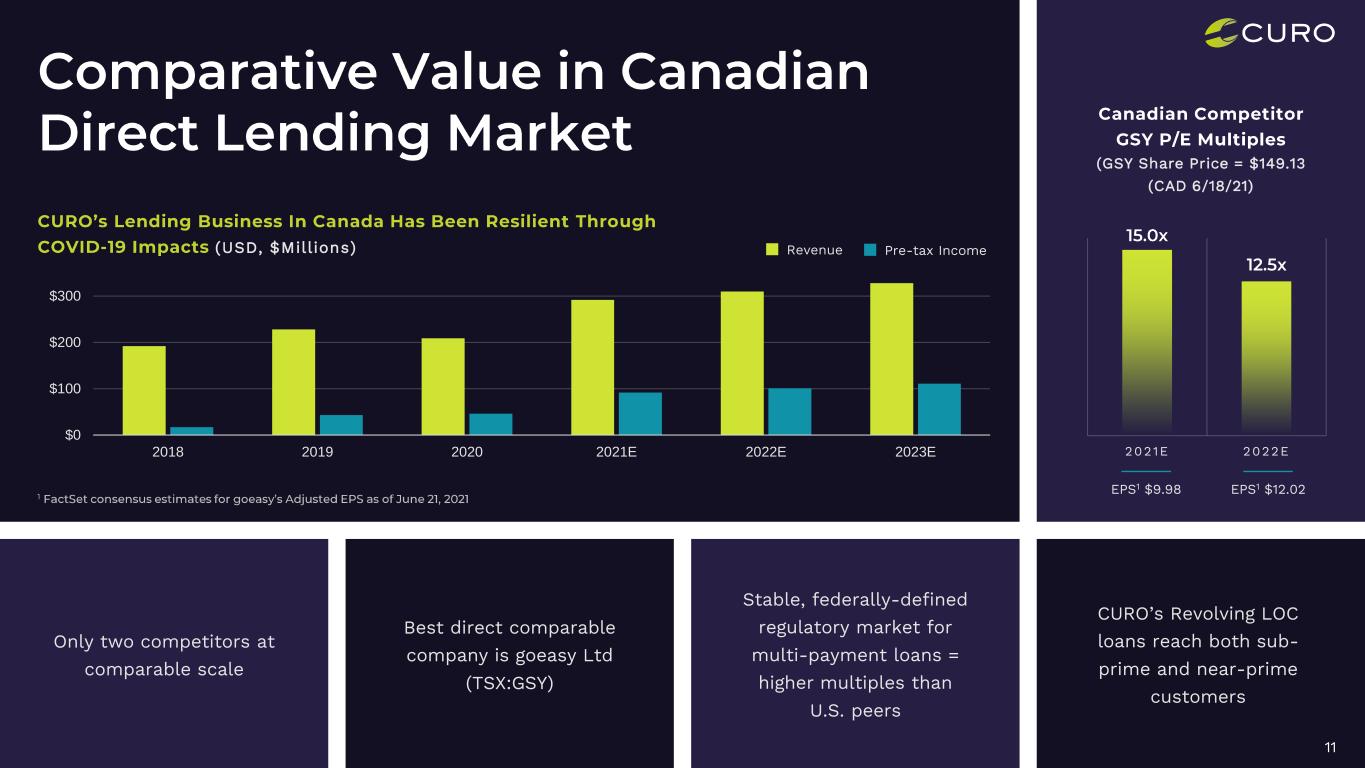
11 (USD, $Millions) $0 $100 $200 $300 2018 2019 2020 2021E 2022E 2023E Revenue Pre-tax Income 2021E 2022E (GSY Share Price = $149.13 (CAD 6/18/21) EPS1 $9.98 EPS1 $12.02 Stable, federally-defined regulatory market for multi-payment loans = higher multiples than U.S. peers Only two competitors at comparable scale Best direct comparable company is goeasy Ltd (TSX:GSY) CURO’s Revolving LOC loans reach both sub- prime and near-prime customers

12
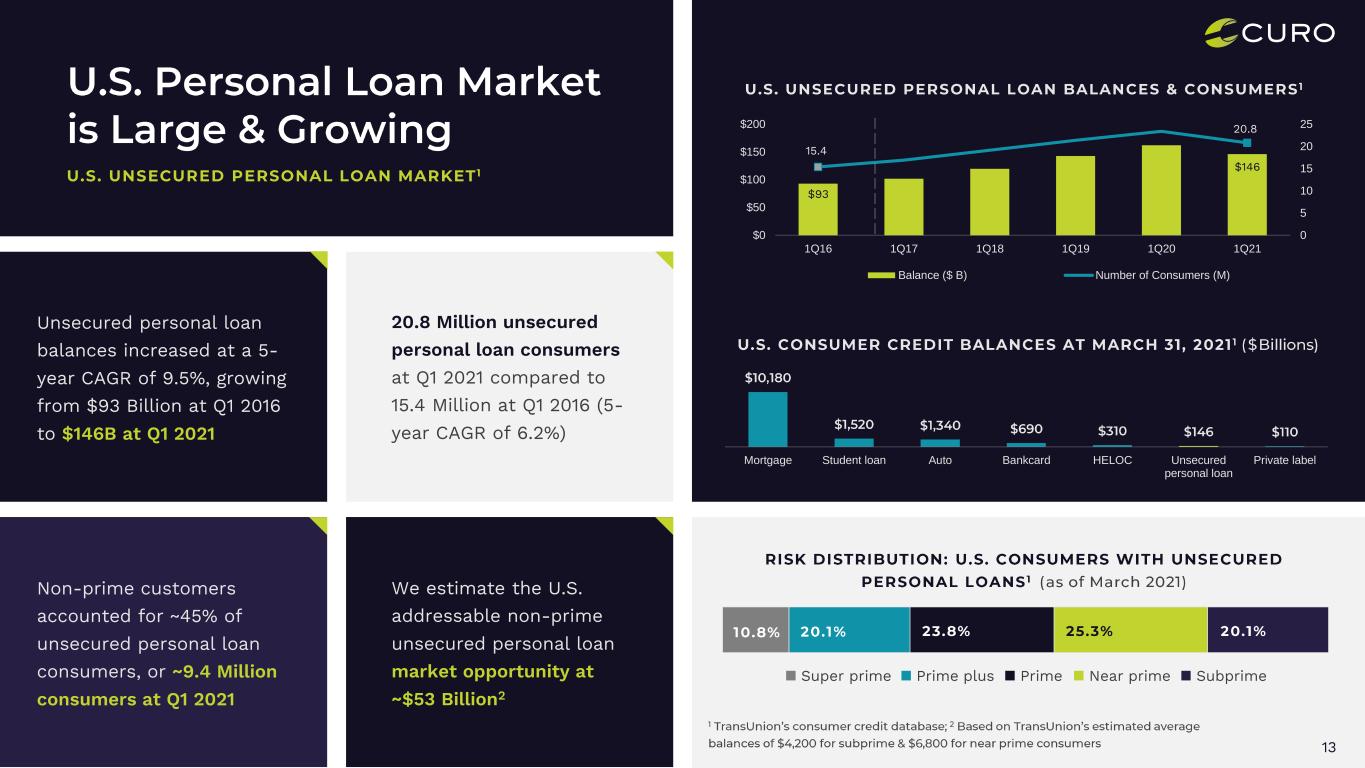
Super prime Prime plus Prime Near prime Subprime 13 Unsecured personal loan balances increased at a 5- year CAGR of 9.5%, growing from $93 Billion at Q1 2016 to $146B at Q1 2021 Non-prime customers accounted for ~45% of unsecured personal loan consumers, or ~9.4 Million consumers at Q1 2021 We estimate the U.S. addressable non-prime unsecured personal loan market opportunity at ~$53 Billion2 20.8 Million unsecured personal loan consumers at Q1 2021 compared to 15.4 Million at Q1 2016 (5- year CAGR of 6.2%) Mortgage Student loan Auto Bankcard HELOC Unsecured personal loan Private label $93 $146 15.4 20.8 0 5 10 15 20 25 $0 $50 $100 $150 $200 1Q16 1Q17 1Q18 1Q19 1Q20 1Q21 Balance ($ B) Number of Consumers (M)
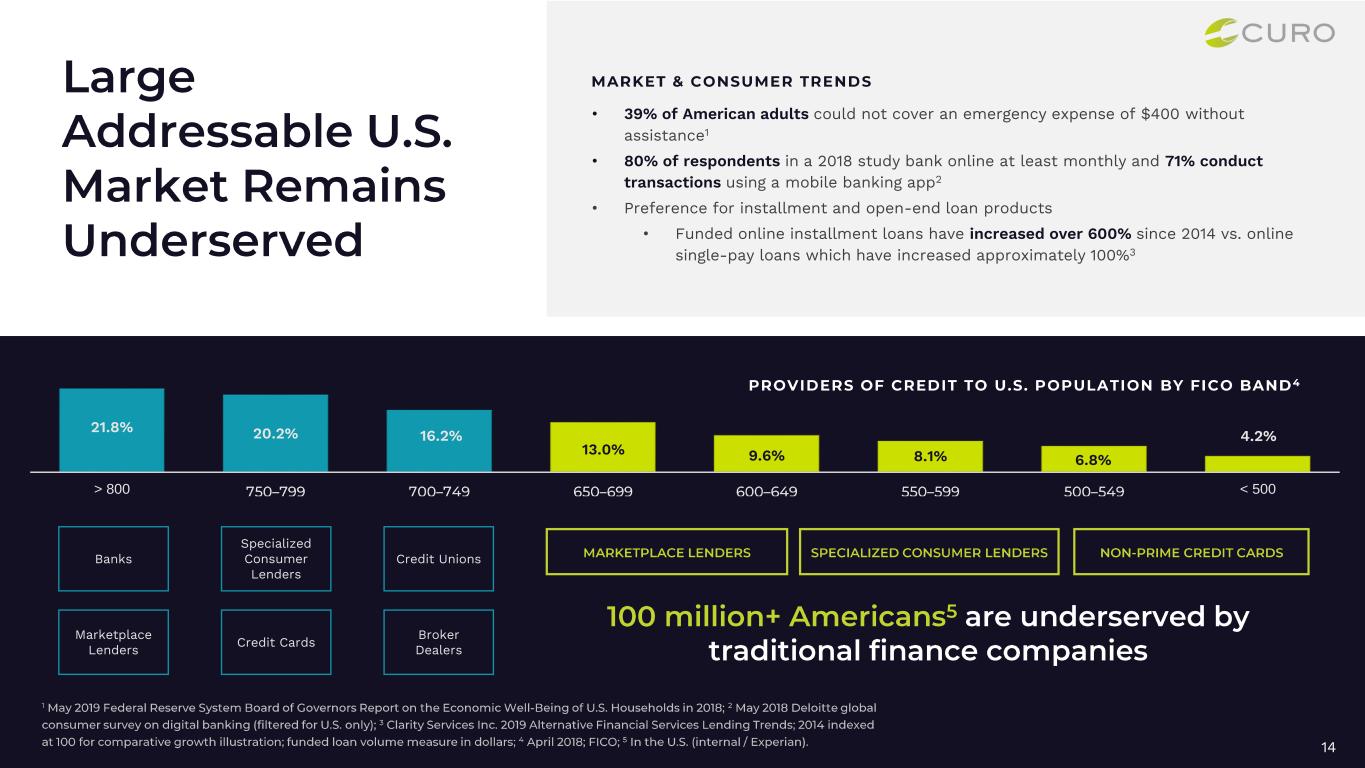
14 21.8% 20.2% 16.2% 13.0% 9.6% 8.1% 6.8% 4.2% > 800 < 500 Banks Specialized Consumer Lenders Credit Unions Marketplace Lenders Credit Cards Broker Dealers • 39% of American adults could not cover an emergency expense of $400 without assistance1 • 80% of respondents in a 2018 study bank online at least monthly and 71% conduct transactions using a mobile banking app2 • Preference for installment and open-end loan products • Funded online installment loans have increased over 600% since 2014 vs. online single-pay loans which have increased approximately 100%3
15

Super-prime Prime Plus Prime Below Prime 16 • Consumer installment balances totaled C$102 Billion at Q1 2021 • Around 28% of Canada’s nearly 27 Million active consumers have “below- prime” credit scores • Below-prime consumers hold about a fifth, or C$419 Billion, of Canada’s total outstanding household debt2 • Below-prime credit addressable market is estimated at ~C$200 Billion3 • Canadian market share is led by CURO’s Cash Money and Lend Direct brands as well as competitors goeasy and Money Mart Mortgage Line of Credit Installment Bankcard Auto
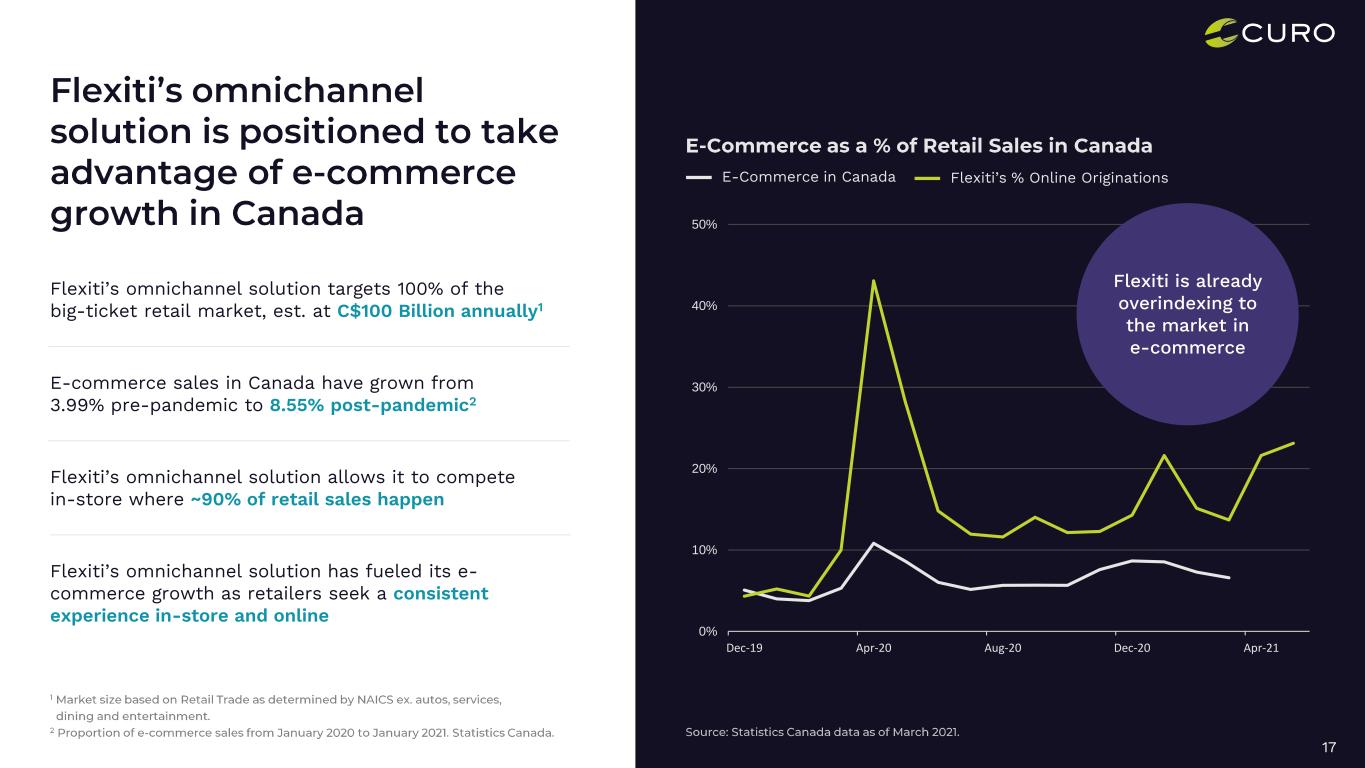
0% 10% 20% 30% 40% 50% Dec-19 Apr-20 Aug-20 Dec-20 Apr-21 17 Flexiti’s % Online OriginationsE-Commerce in Canada Flexiti is already overindexing to the market in e-commerce Flexiti’s omnichannel solution targets 100% of the big-ticket retail market, est. at C$100 Billion annually1 E-commerce sales in Canada have grown from 3.99% pre-pandemic to 8.55% post-pandemic2 Flexiti’s omnichannel solution allows it to compete in-store where ~90% of retail sales happen Flexiti’s omnichannel solution has fueled its e- commerce growth as retailers seek a consistent experience in-store and online
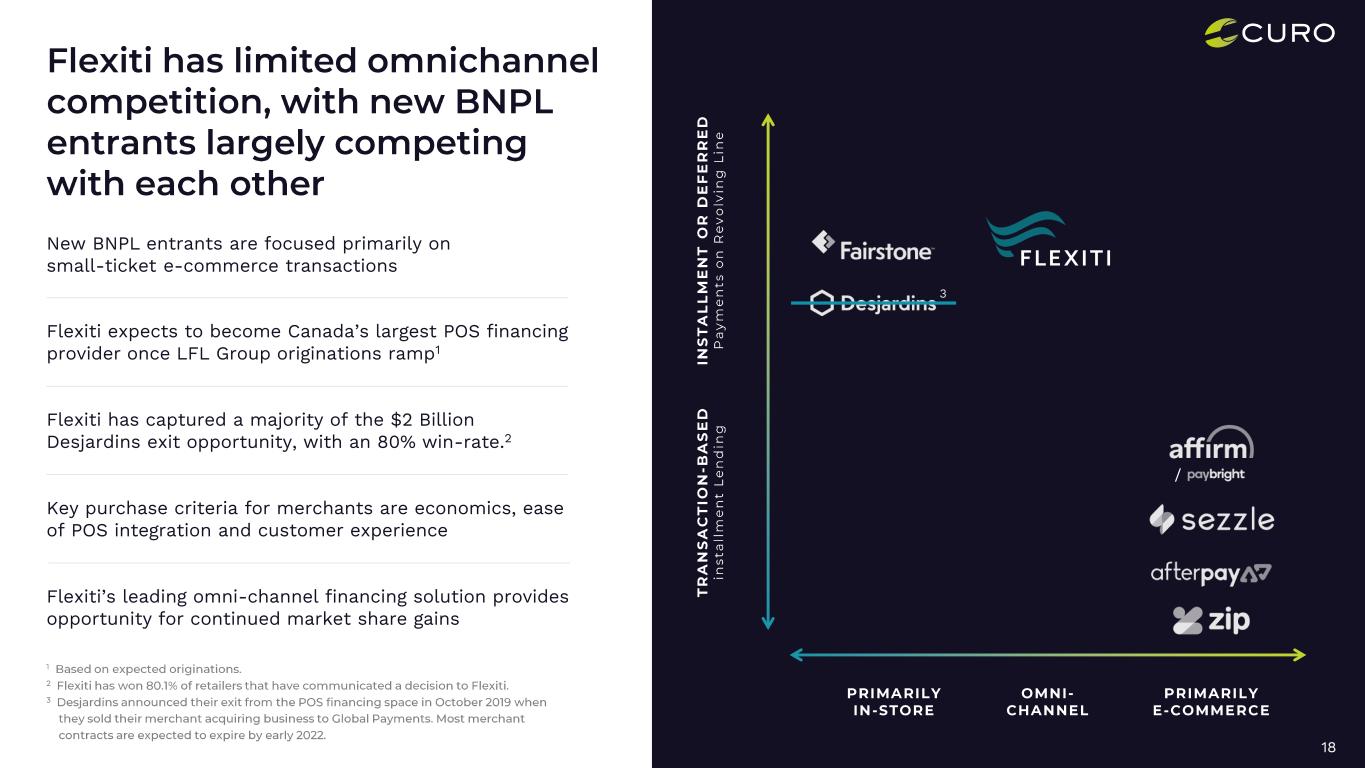
18 Flexiti expects to become Canada’s largest POS financing provider once LFL Group originations ramp1 Flexiti has captured a majority of the $2 Billion Desjardins exit opportunity, with an 80% win-rate.2 New BNPL entrants are focused primarily on small-ticket e-commerce transactions Key purchase criteria for merchants are economics, ease of POS integration and customer experience Flexiti’s leading omni-channel financing solution provides opportunity for continued market share gains / 3
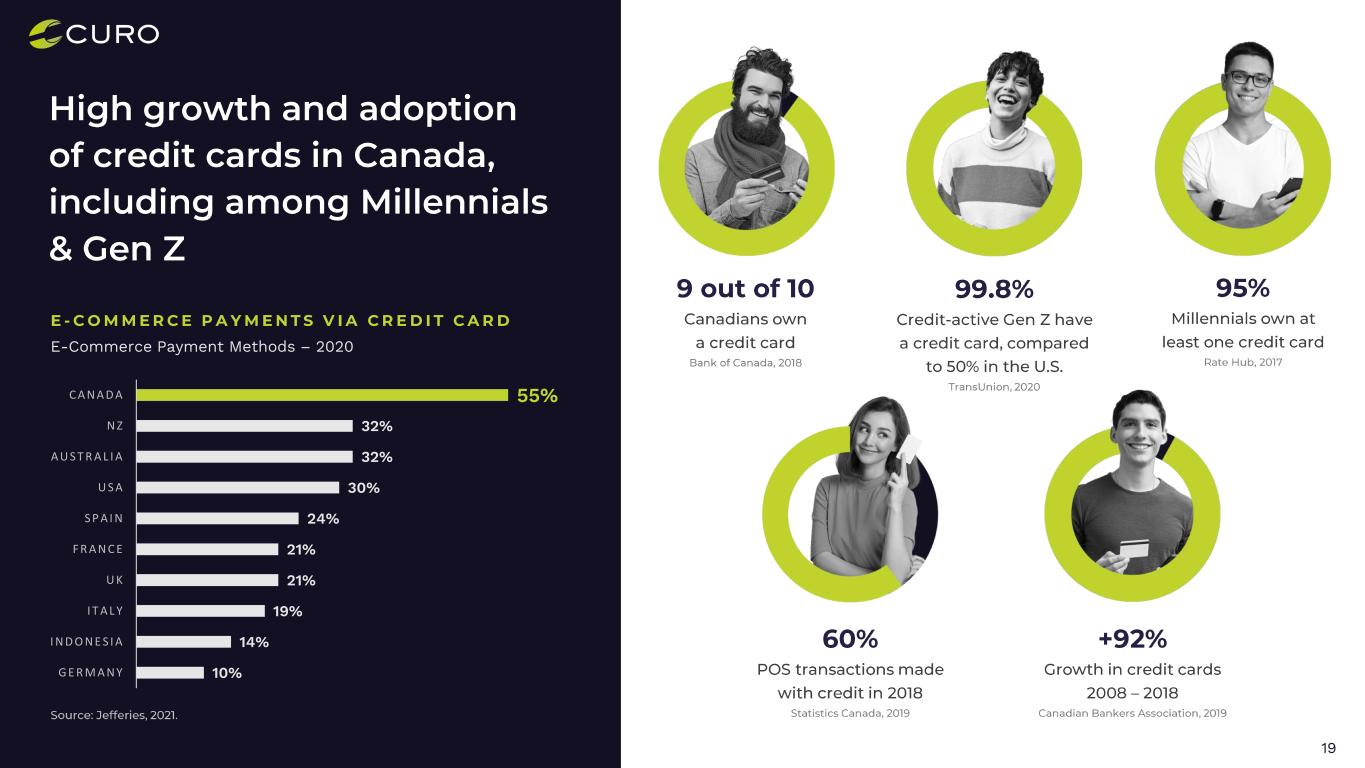
19 10% 14% 19% 21% 21% 24% 30% 32% 32% 55% GERMANY INDONES IA I TALY UK FRANCE SPA IN USA AUSTRAL IA NZ CANADA E-Commerce Payment Methods – 2020

20
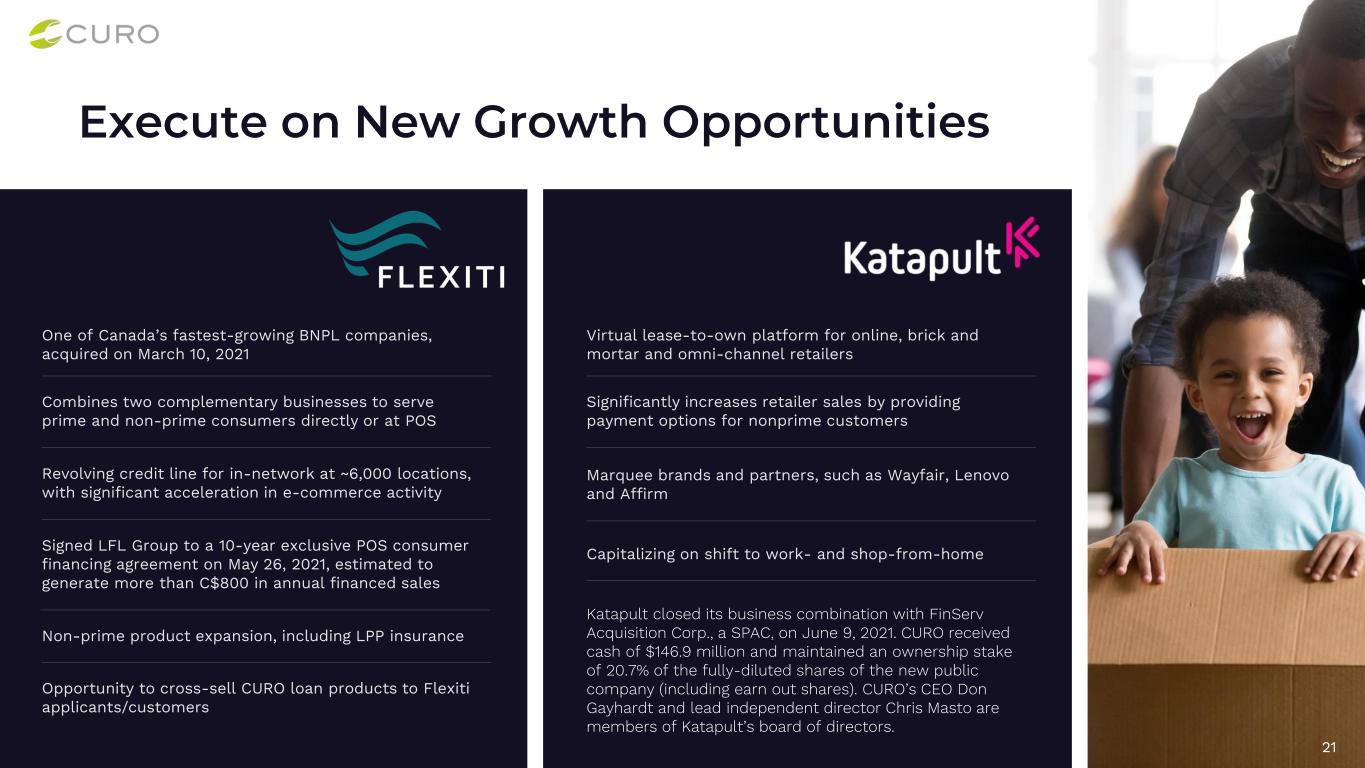
21 One of Canada’s fastest-growing BNPL companies, acquired on March 10, 2021 Combines two complementary businesses to serve prime and non-prime consumers directly or at POS Revolving credit line for in-network at ~6,000 locations, with significant acceleration in e-commerce activity Signed LFL Group to a 10-year exclusive POS consumer financing agreement on May 26, 2021, estimated to generate more than C$800 in annual financed sales Non-prime product expansion, including LPP insurance Opportunity to cross-sell CURO loan products to Flexiti applicants/customers Virtual lease-to-own platform for online, brick and mortar and omni-channel retailers Significantly increases retailer sales by providing payment options for nonprime customers Marquee brands and partners, such as Wayfair, Lenovo and Affirm Capitalizing on shift to work- and shop-from-home Katapult closed its business combination with FinServ Acquisition Corp., a SPAC, on June 9, 2021. CURO received cash of $146.9 million and maintained an ownership stake of 20.7% of the fully-diluted shares of the new public company (including earn out shares). CURO’s CEO Don Gayhardt and lead independent director Chris Masto are members of Katapult’s board of directors.

22 Deferred Payments Payments are deferred until end of promo period 0% interest1, 3-24 months Monthly Installments Split purchase into equal monthly payments 0% interest1, 3-72 months Revolving Credit Purchase Like a regular credit card Up to 30 days interest free Founded in 2013 by Peter Kalen, Flexiti is one of Canada's fastest-growing point-of-sale fintech lenders, offering customers 0% interest1 financing at retailers that sell big- ticket goods like furniture, appliances, jewelry and electronics.
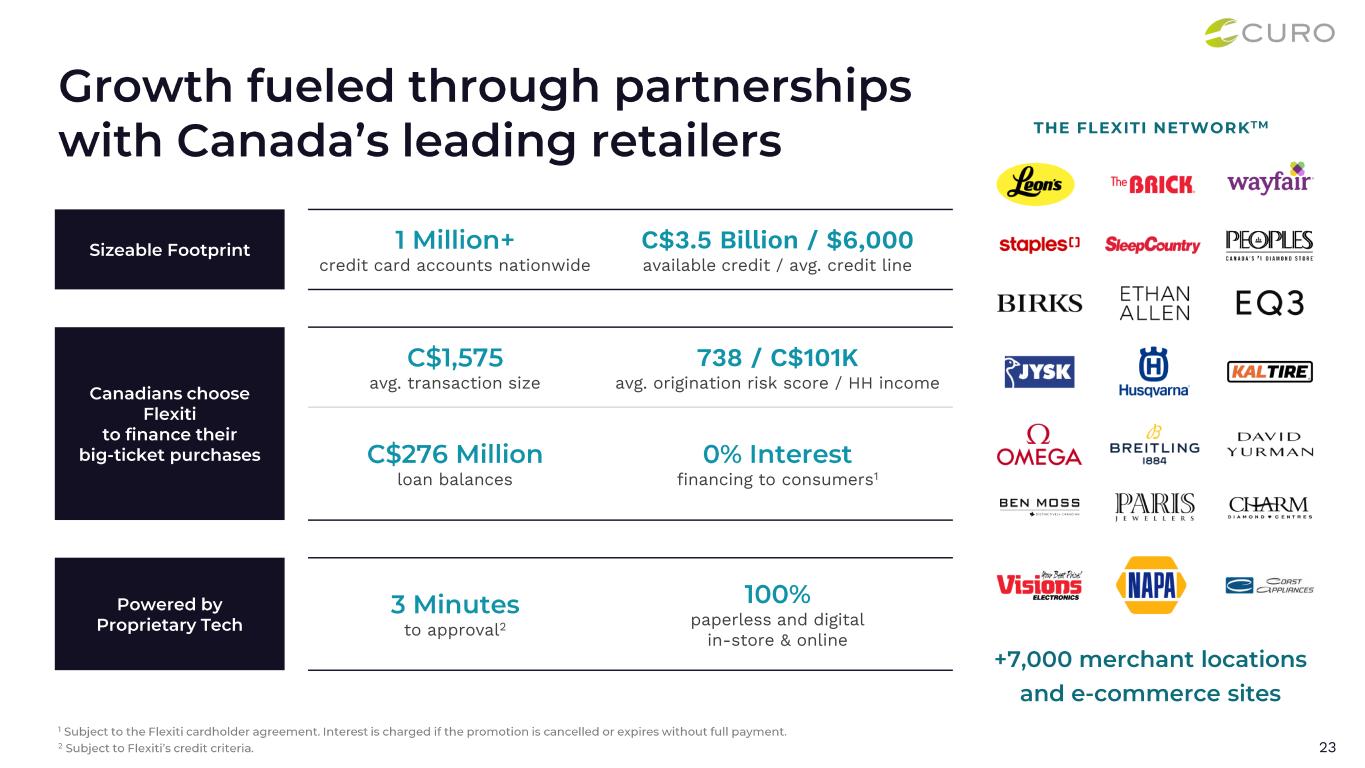
23 credit card accounts nationwide C$3.5 Billion / $6,000 available credit / avg. credit line avg. transaction size 738 / C$101K avg. origination risk score / HH income loan balances financing to consumers1 to approval2 paperless and digital in-store & online
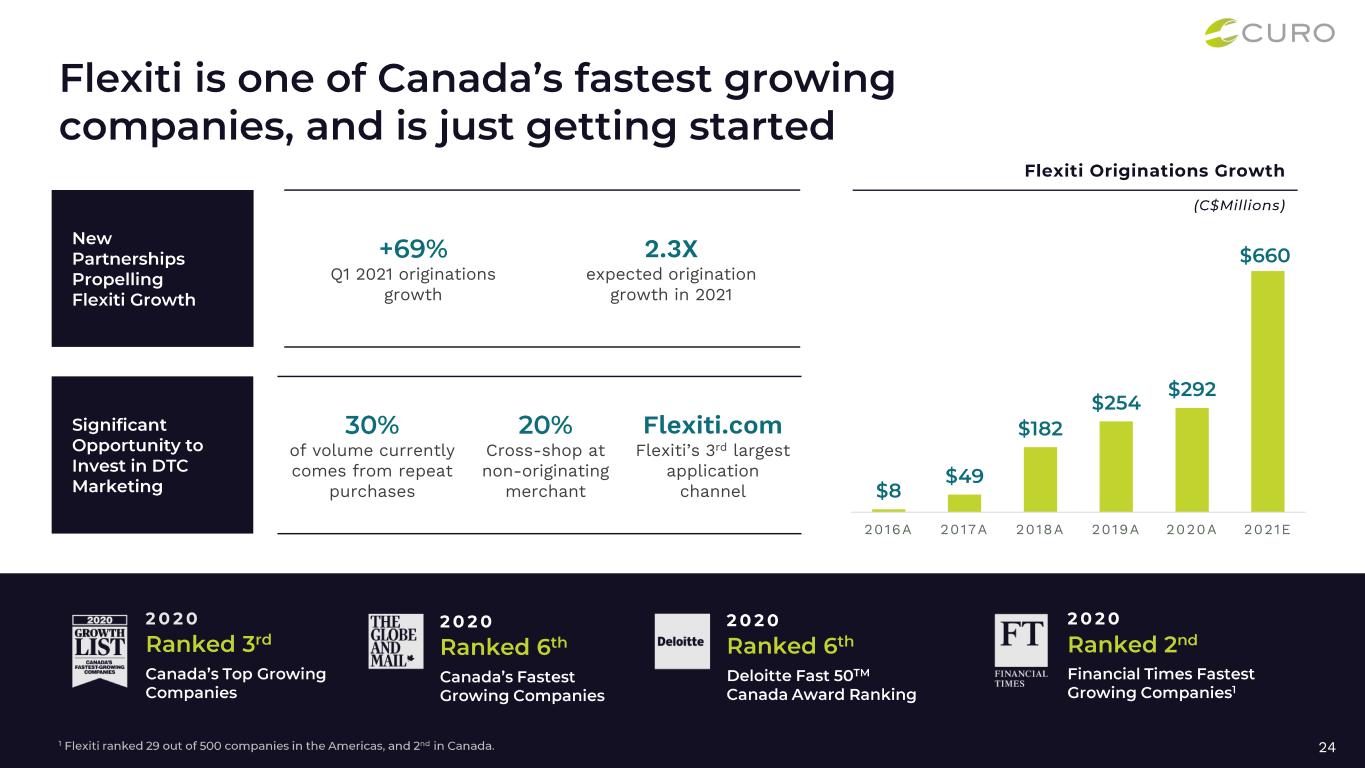
24 Q1 2021 originations growth 2.3X expected origination growth in 2021 of volume currently comes from repeat purchases Cross-shop at non-originating merchant Flexiti.com Flexiti’s 3rd largest application channel 2016A 2017A 2018A 2019A 2020A 2021E
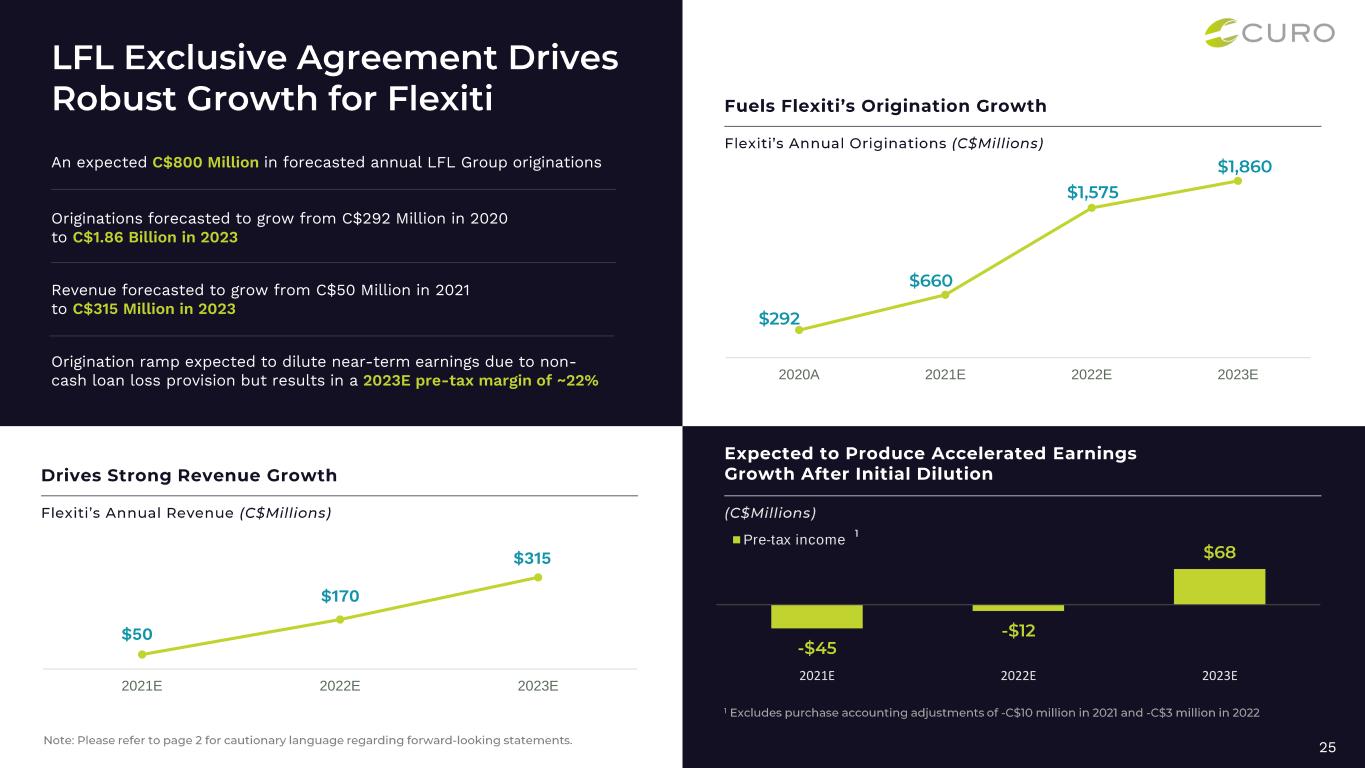
2020A 2021E 2022E 2023E 25 An expected C$800 Million in forecasted annual LFL Group originations Originations forecasted to grow from C$292 Million in 2020 to C$1.86 Billion in 2023 Revenue forecasted to grow from C$50 Million in 2021 to C$315 Million in 2023 Origination ramp expected to dilute near-term earnings due to non- cash loan loss provision but results in a 2023E pre-tax margin of ~22% $50 $170 $315 2021E 2022E 2023E 2021E 2022E 2023E Pre-tax income
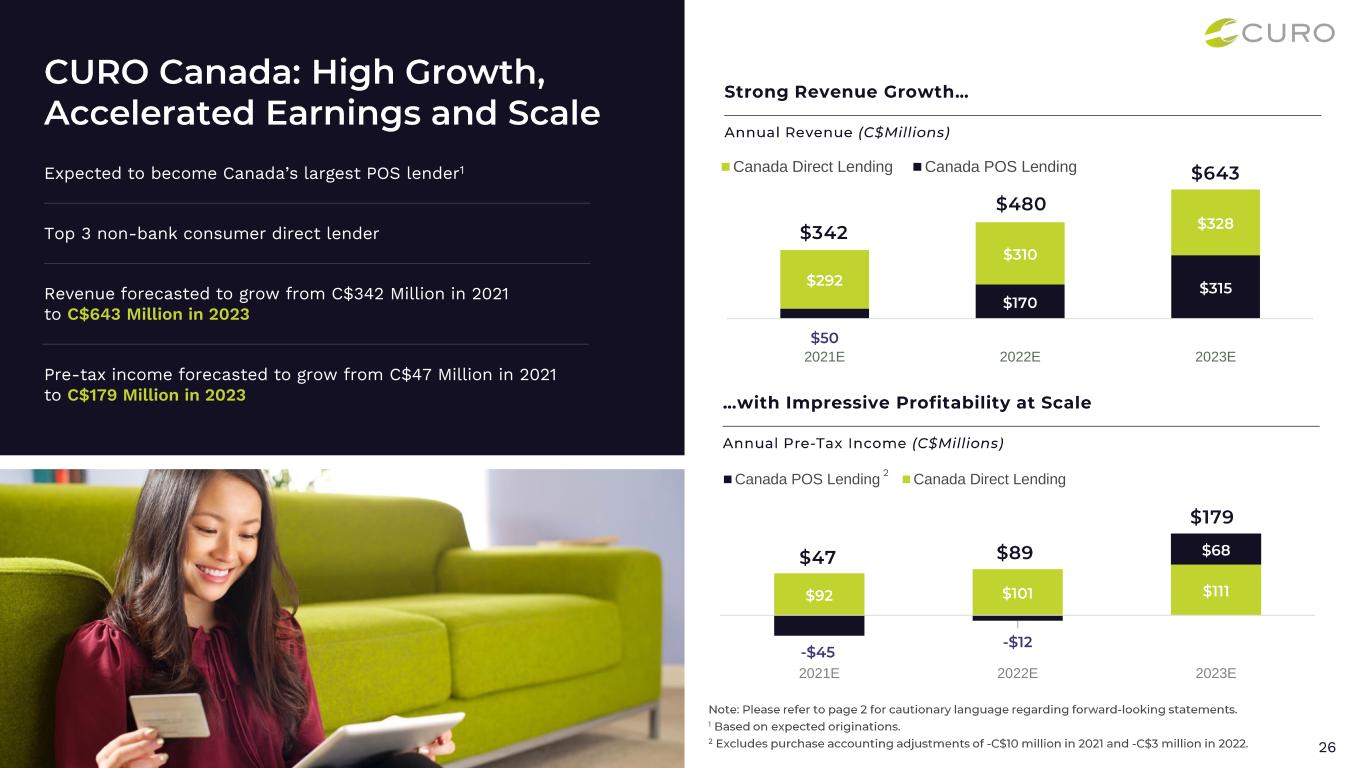
26 Expected to become Canada’s largest POS lender1 Top 3 non-bank consumer direct lender Revenue forecasted to grow from C$342 Million in 2021 to C$643 Million in 2023 Pre-tax income forecasted to grow from C$47 Million in 2021 to C$179 Million in 2023 2021E 2022E 2023E Canada Direct Lending Canada POS Lending 2021E 2022E 2023E Canada POS Lending Canada Direct Lending 2
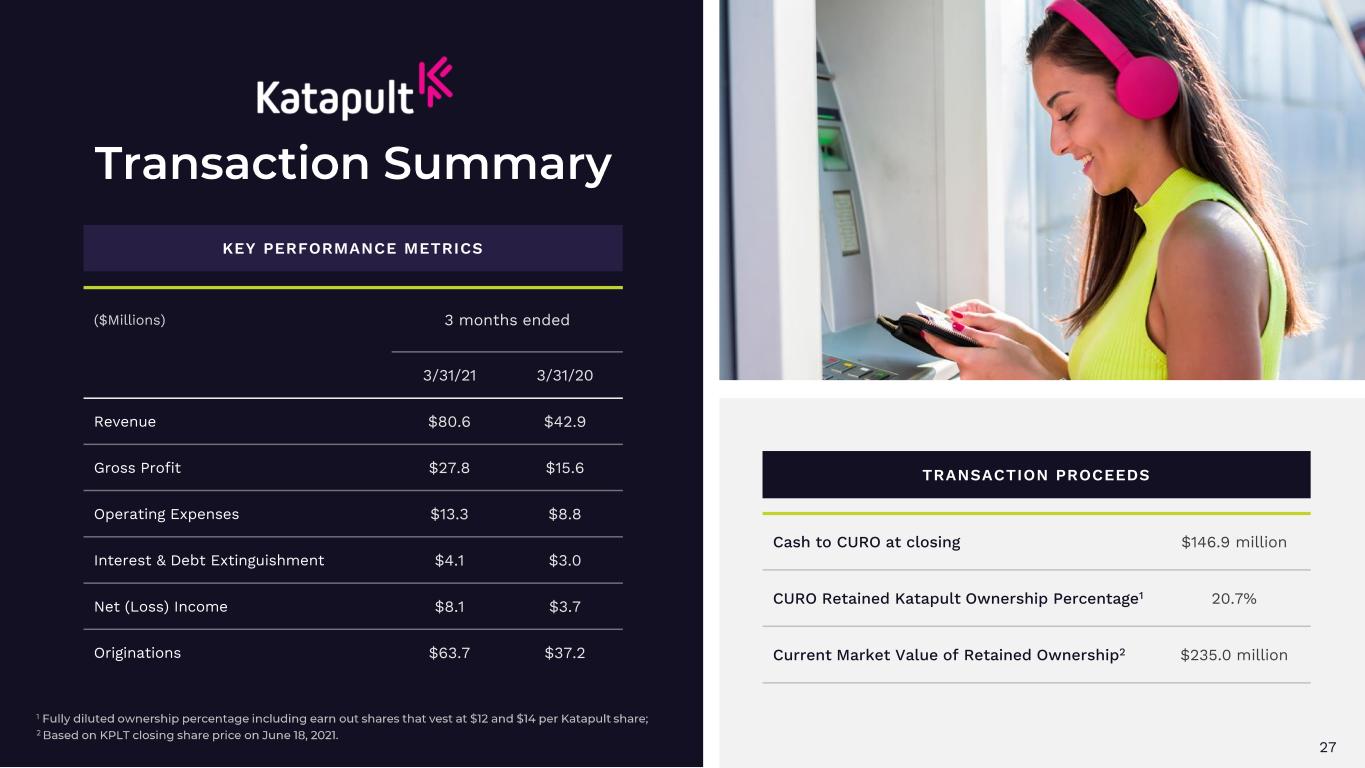
27 KEY PERFORMANCE METRICS ($Millions) 3 months ended 3/31/21 3/31/20 Revenue $80.6 $42.9 Gross Profit $27.8 $15.6 Operating Expenses $13.3 $8.8 Interest & Debt Extinguishment $4.1 $3.0 Net (Loss) Income $8.1 $3.7 Originations $63.7 $37.2 TRANSACTION PROCEEDS Cash to CURO at closing $146.9 million CURO Retained Katapult Ownership Percentage1 20.7% Current Market Value of Retained Ownership2 $235.0 million

28
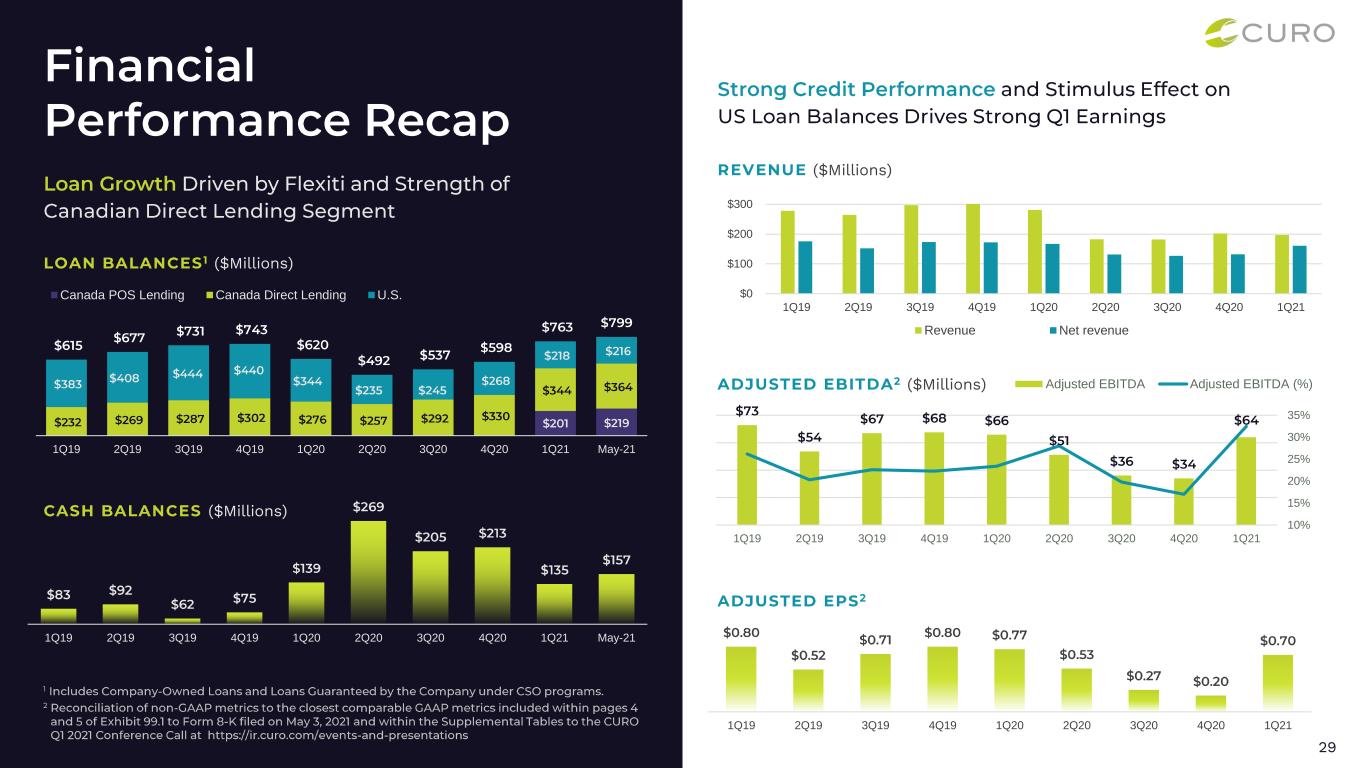
29 ($Millions) ($Millions) ($Millions) ($Millions) 1Q19 2Q19 3Q19 4Q19 1Q20 2Q20 3Q20 4Q20 1Q21 May-21 Canada POS Lending Canada Direct Lending U.S. 1Q19 2Q19 3Q19 4Q19 1Q20 2Q20 3Q20 4Q20 1Q21 May-21 $0 $100 $200 $300 1Q19 2Q19 3Q19 4Q19 1Q20 2Q20 3Q20 4Q20 1Q21 Revenue Net revenue 10% 15% 20% 25% 30% 35% 1Q19 2Q19 3Q19 4Q19 1Q20 2Q20 3Q20 4Q20 1Q21 Adjusted EBITDA Adjusted EBITDA (%) 1Q19 2Q19 3Q19 4Q19 1Q20 2Q20 3Q20 4Q20 1Q21
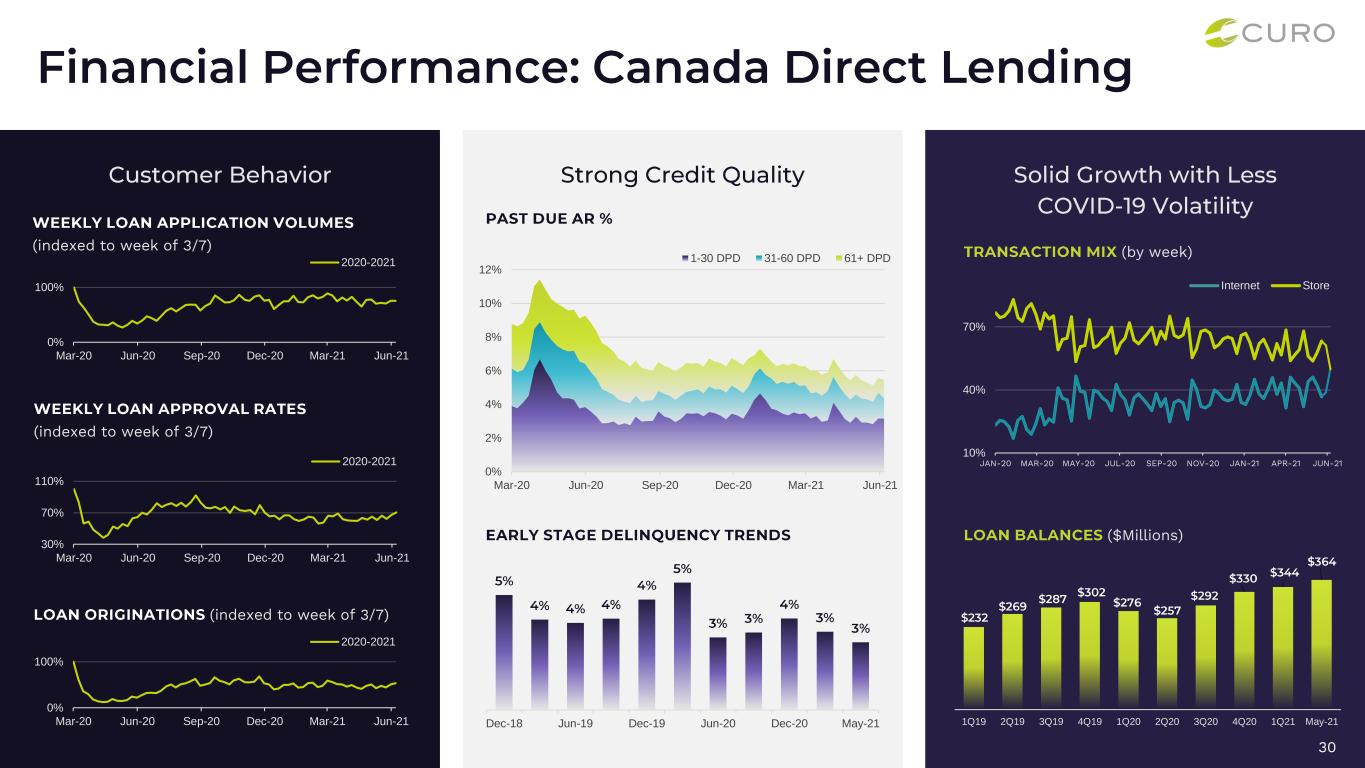
30 (indexed to week of 3/7) (indexed to week of 3/7) (indexed to week of 3/7) ($Millions) (by week) Dec-18 Jun-19 Dec-19 Jun-20 Dec-20 May-21 1Q19 2Q19 3Q19 4Q19 1Q20 2Q20 3Q20 4Q20 1Q21 May-21 0% 100% Mar-20 Jun-20 Sep-20 Dec-20 Mar-21 Jun-21 2020-2021 0% 100% Mar-20 Jun-20 Sep-20 Dec-20 Mar-21 Jun-21 2020-2021 30% 70% 110% Mar-20 Jun-20 Sep-20 Dec-20 Mar-21 Jun-21 2020-2021 10% 40% 70% JAN-20 MAR-20 MAY-20 JUL-20 SEP-20 NOV-20 JAN-21 APR-21 JUN-21 Internet Store 0% 2% 4% 6% 8% 10% 12% Mar-20 Jun-20 Sep-20 Dec-20 Mar-21 Jun-21 1-30 DPD 31-60 DPD 61+ DPD
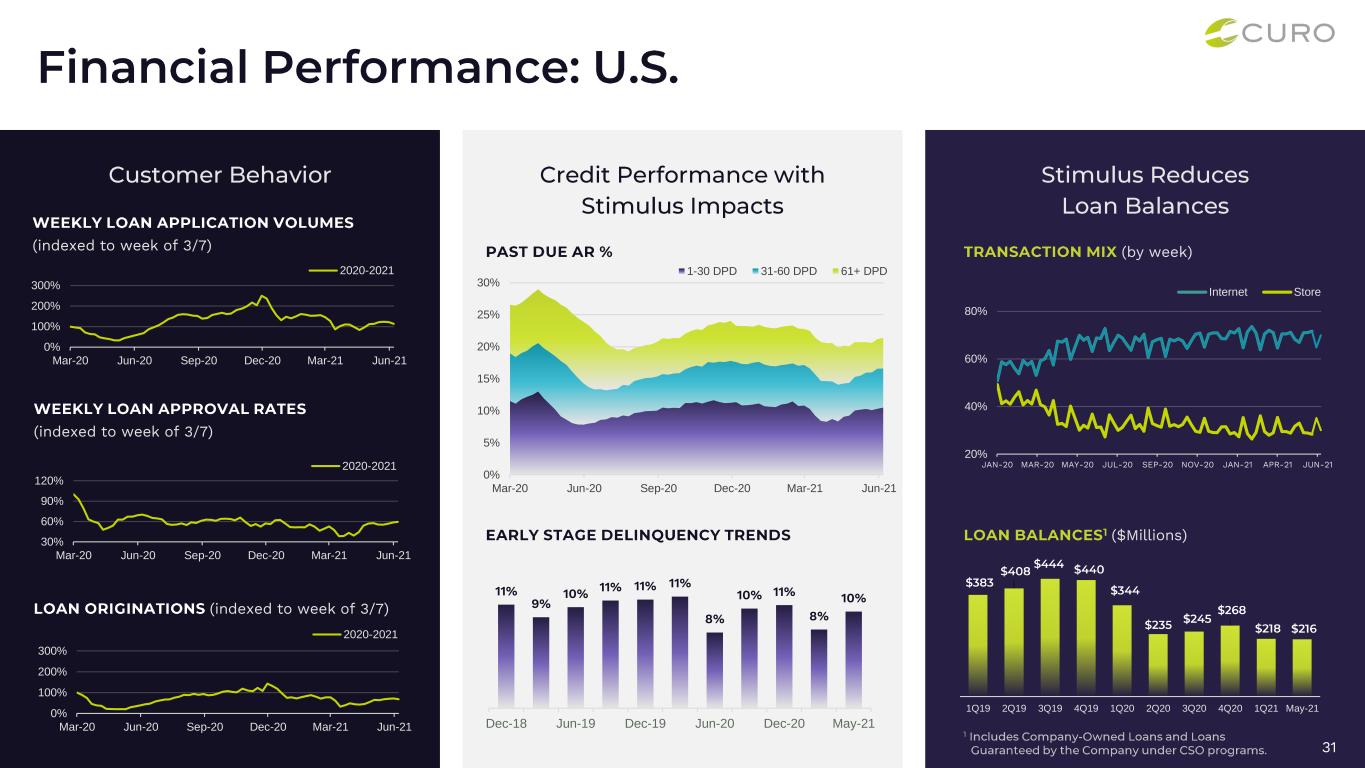
31 (indexed to week of 3/7) (indexed to week of 3/7) (indexed to week of 3/7) ($Millions) (by week) 1Q19 2Q19 3Q19 4Q19 1Q20 2Q20 3Q20 4Q20 1Q21 May-21 11% 9% 10% 11% 11% 11% 8% 10% 11% 8% 10% Dec-18 Jun-19 Dec-19 Jun-20 Dec-20 May-21 0% 100% 200% 300% Mar-20 Jun-20 Sep-20 Dec-20 Mar-21 Jun-21 2020-2021 30% 60% 90% 120% Mar-20 Jun-20 Sep-20 Dec-20 Mar-21 Jun-21 2020-2021 0% 100% 200% 300% Mar-20 Jun-20 Sep-20 Dec-20 Mar-21 Jun-21 2020-2021 20% 40% 60% 80% JAN-20 MAR-20 MAY-20 JUL-20 SEP-20 NOV-20 JAN-21 APR-21 JUN-21 Internet Store 0% 5% 10% 15% 20% 25% 30% Mar-20 Jun-20 Sep-20 Dec-20 Mar-21 Jun-21 1-30 DPD 31-60 DPD 61+ DPD
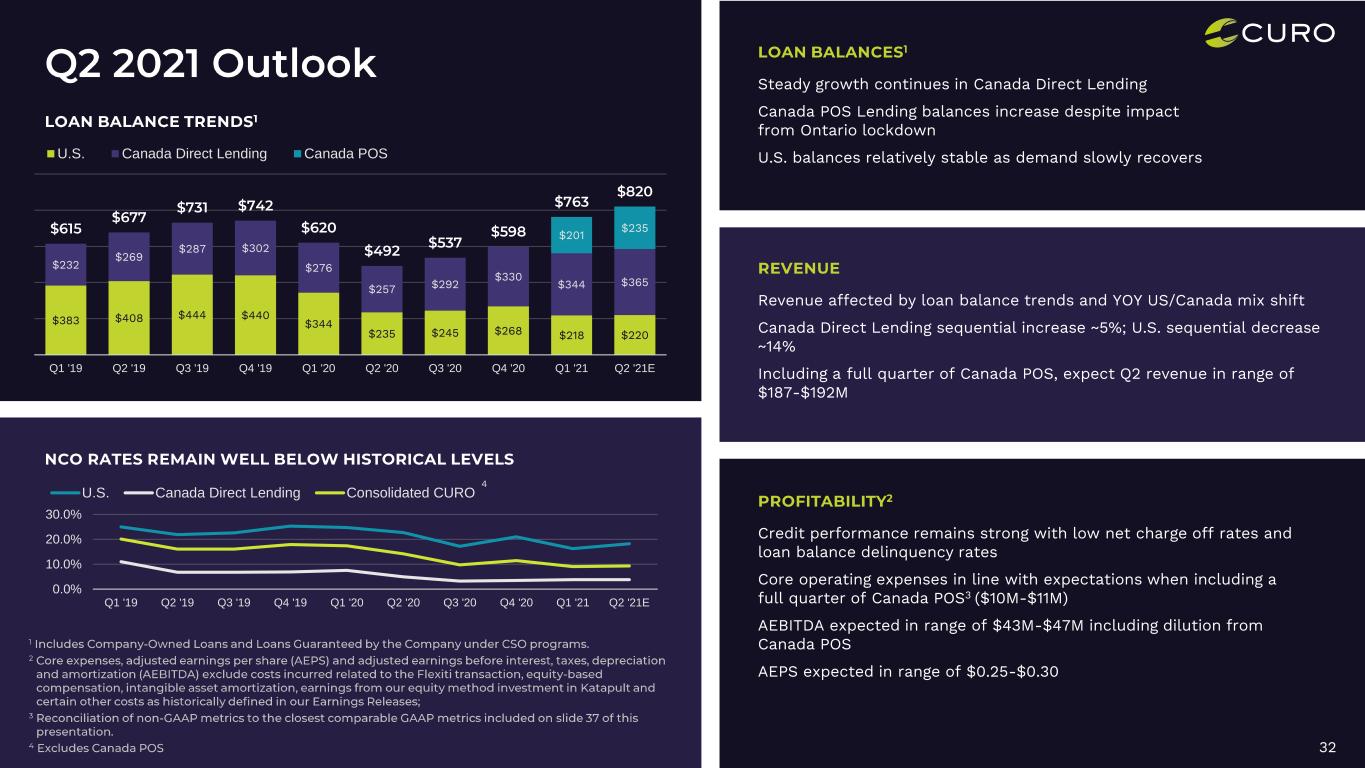
32 Steady growth continues in Canada Direct Lending Canada POS Lending balances increase despite impact from Ontario lockdown U.S. balances relatively stable as demand slowly recovers Revenue affected by loan balance trends and YOY US/Canada mix shift Canada Direct Lending sequential increase ~5%; U.S. sequential decrease ~14% Including a full quarter of Canada POS, expect Q2 revenue in range of $187-$192M Credit performance remains strong with low net charge off rates and loan balance delinquency rates Core operating expenses in line with expectations when including a full quarter of Canada POS3 ($10M-$11M) AEBITDA expected in range of $43M-$47M including dilution from Canada POS AEPS expected in range of $0.25-$0.30 0.0% 10.0% 20.0% 30.0% Q1 '19 Q2 '19 Q3 '19 Q4 '19 Q1 '20 Q2 '20 Q3 '20 Q4 '20 Q1 '21 Q2 '21E U.S. Canada Direct Lending Consolidated CURO 4 $383 $408 $444 $440 $344 $235 $245 $268 $218 $220 $232 $269 $287 $302 $276 $257 $292 $330 $344 $365 $201 $235 Q1 '19 Q2 '19 Q3 '19 Q4 '19 Q1 '20 Q2 '20 Q3 '20 Q4 '20 Q1 '21 Q2 '21E U.S. Canada Direct Lending Canada POS
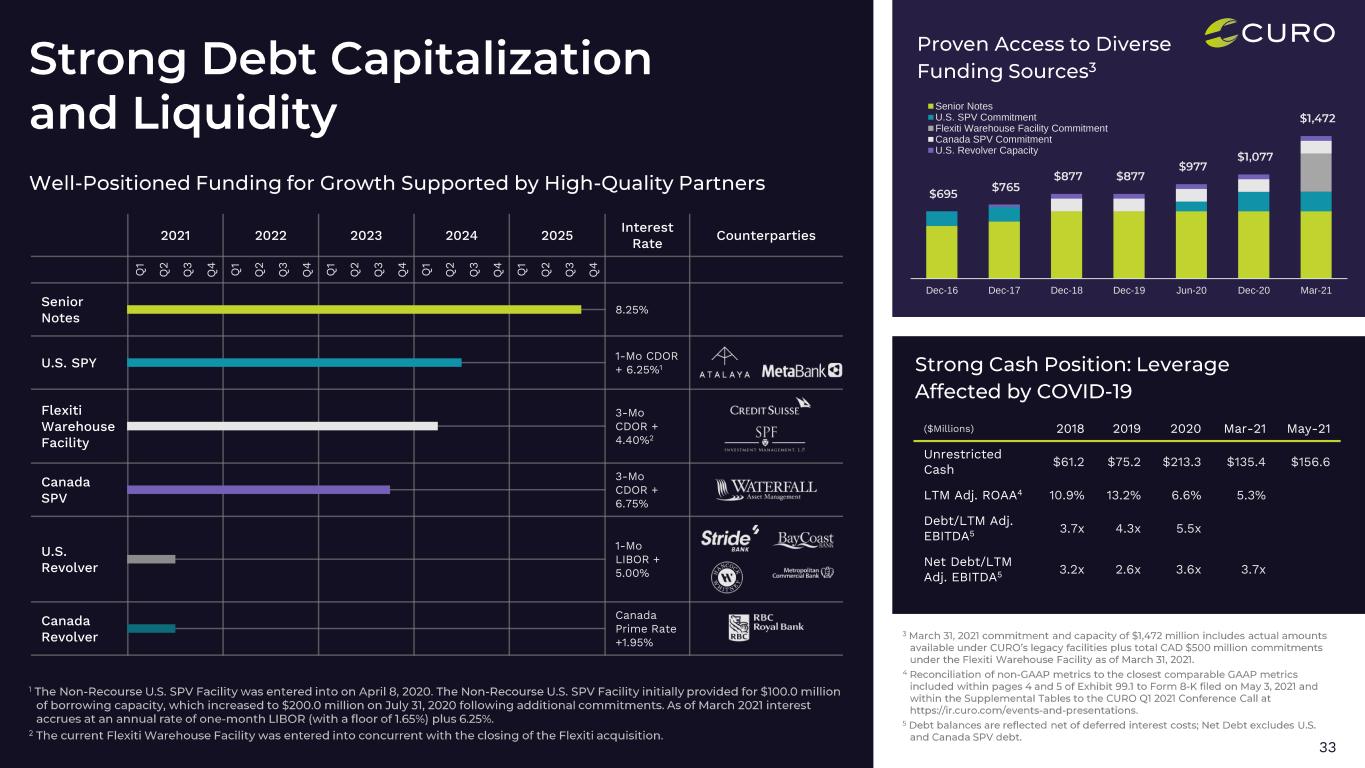
33 2021 2022 2023 2024 2025 Interest Rate Counterparties Q 1 Q 2 Q 3 Q 4 Q 1 Q 2 Q 3 Q 4 Q 1 Q 2 Q 3 Q 4 Q 1 Q 2 Q 3 Q 4 Q 1 Q 2 Q 3 Q 4 Senior Notes 8.25% U.S. SPY 1-Mo CDOR + 6.25%1 Flexiti Warehouse Facility 3-Mo CDOR + 4.40%2 Canada SPV 3-Mo CDOR + 6.75% U.S. Revolver 1-Mo LIBOR + 5.00% Canada Revolver Canada Prime Rate +1.95% Dec-16 Dec-17 Dec-18 Dec-19 Jun-20 Dec-20 Mar-21 Senior Notes U.S. SPV Commitment Flexiti Warehouse Facility Commitment Canada SPV Commitment U.S. Revolver Capacity ($Millions) 2018 2019 2020 Mar-21 May-21 Unrestricted Cash $61.2 $75.2 $213.3 $135.4 $156.6 LTM Adj. ROAA4 10.9% 13.2% 6.6% 5.3% Debt/LTM Adj. EBITDA5 3.7x 4.3x 5.5x Net Debt/LTM Adj. EBITDA5 3.2x 2.6x 3.6x 3.7x

34 Through May 29, 2021, we have provided substantial financial support to our customers in the form of Payment Waivers, Due Date Changes and Payment Plans on over 88,000 loans or 19% of our active loans Cashed stimulus checks worth $112 million free of charge, saving customers approximately $2.1 million Over $6.4 million of payments waived on 31,000 accounts 28,000 Due Date changes and over 11,000 payment plans Committed $700,000 to Frontline Foods to help feed healthcare workers Waived 42,000 Returned Item fees, saving customers over $10.2 million $10.2 million

35
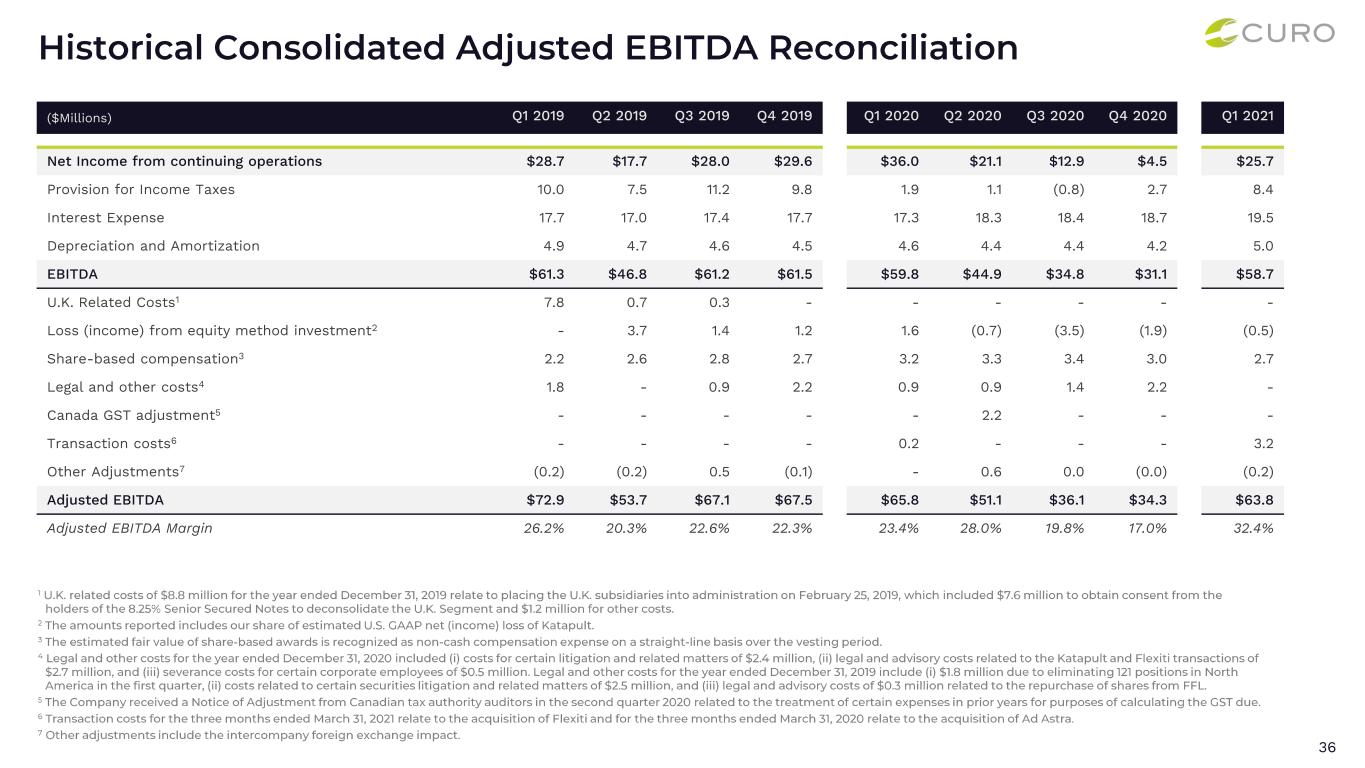
36 ($Millions) Q1 2019 Q2 2019 Q3 2019 Q4 2019 Q1 2020 Q2 2020 Q3 2020 Q4 2020 Q1 2021 Net Income from continuing operations $28.7 $17.7 $28.0 $29.6 $36.0 $21.1 $12.9 $4.5 $25.7 Provision for Income Taxes 10.0 7.5 11.2 9.8 1.9 1.1 (0.8) 2.7 8.4 Interest Expense 17.7 17.0 17.4 17.7 17.3 18.3 18.4 18.7 19.5 Depreciation and Amortization 4.9 4.7 4.6 4.5 4.6 4.4 4.4 4.2 5.0 EBITDA $61.3 $46.8 $61.2 $61.5 $59.8 $44.9 $34.8 $31.1 $58.7 U.K. Related Costs1 7.8 0.7 0.3 - - - - - - Loss (income) from equity method investment2 - 3.7 1.4 1.2 1.6 (0.7) (3.5) (1.9) (0.5) Share-based compensation3 2.2 2.6 2.8 2.7 3.2 3.3 3.4 3.0 2.7 Legal and other costs4 1.8 - 0.9 2.2 0.9 0.9 1.4 2.2 - Canada GST adjustment5 - - - - - 2.2 - - - Transaction costs6 - - - - 0.2 - - - 3.2 Other Adjustments7 (0.2) (0.2) 0.5 (0.1) - 0.6 0.0 (0.0) (0.2) Adjusted EBITDA $72.9 $53.7 $67.1 $67.5 $65.8 $51.1 $36.1 $34.3 $63.8 Adjusted EBITDA Margin 26.2% 20.3% 22.6% 22.3% 23.4% 28.0% 19.8% 17.0% 32.4%
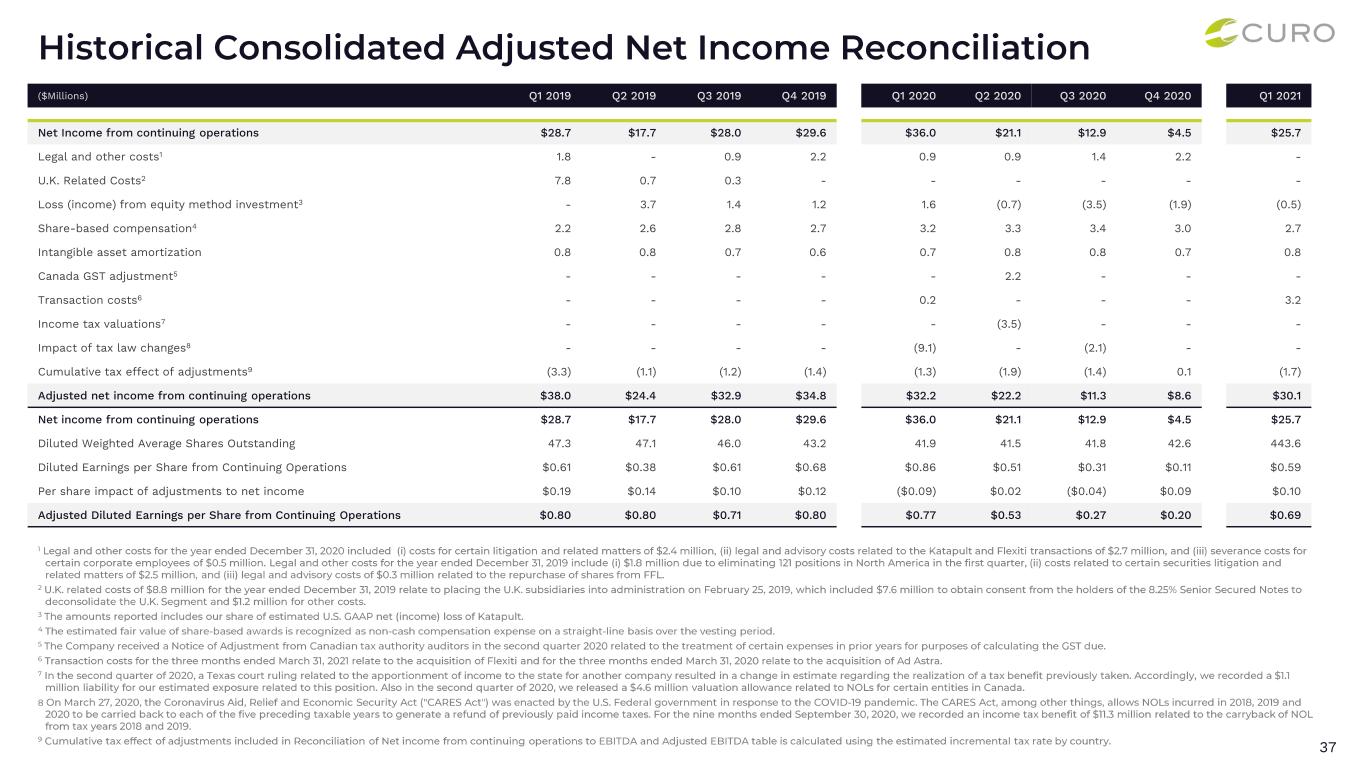
37 ($Millions) Q1 2019 Q2 2019 Q3 2019 Q4 2019 Q1 2020 Q2 2020 Q3 2020 Q4 2020 Q1 2021 Net Income from continuing operations $28.7 $17.7 $28.0 $29.6 $36.0 $21.1 $12.9 $4.5 $25.7 Legal and other costs1 1.8 - 0.9 2.2 0.9 0.9 1.4 2.2 - U.K. Related Costs2 7.8 0.7 0.3 - - - - - - Loss (income) from equity method investment3 - 3.7 1.4 1.2 1.6 (0.7) (3.5) (1.9) (0.5) Share-based compensation4 2.2 2.6 2.8 2.7 3.2 3.3 3.4 3.0 2.7 Intangible asset amortization 0.8 0.8 0.7 0.6 0.7 0.8 0.8 0.7 0.8 Canada GST adjustment5 - - - - - 2.2 - - - Transaction costs6 - - - - 0.2 - - - 3.2 Income tax valuations7 - - - - - (3.5) - - - Impact of tax law changes8 - - - - (9.1) - (2.1) - - Cumulative tax effect of adjustments9 (3.3) (1.1) (1.2) (1.4) (1.3) (1.9) (1.4) 0.1 (1.7) Adjusted net income from continuing operations $38.0 $24.4 $32.9 $34.8 $32.2 $22.2 $11.3 $8.6 $30.1 Net income from continuing operations $28.7 $17.7 $28.0 $29.6 $36.0 $21.1 $12.9 $4.5 $25.7 Diluted Weighted Average Shares Outstanding 47.3 47.1 46.0 43.2 41.9 41.5 41.8 42.6 443.6 Diluted Earnings per Share from Continuing Operations $0.61 $0.38 $0.61 $0.68 $0.86 $0.51 $0.31 $0.11 $0.59 Per share impact of adjustments to net income $0.19 $0.14 $0.10 $0.12 ($0.09) $0.02 ($0.04) $0.09 $0.10 Adjusted Diluted Earnings per Share from Continuing Operations $0.80 $0.80 $0.71 $0.80 $0.77 $0.53 $0.27 $0.20 $0.69
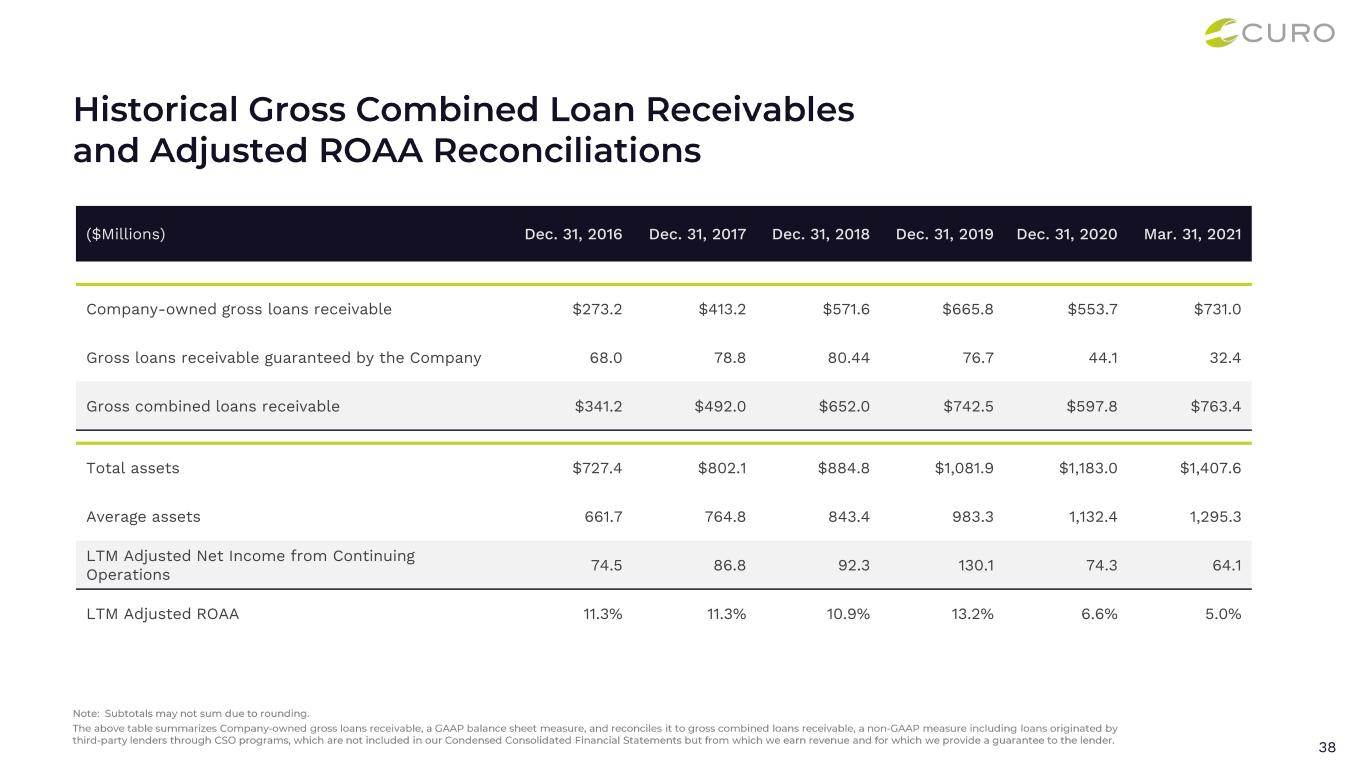
38 ($Millions) Dec. 31, 2016 Dec. 31, 2017 Dec. 31, 2018 Dec. 31, 2019 Dec. 31, 2020 Mar. 31, 2021 Company-owned gross loans receivable $273.2 $413.2 $571.6 $665.8 $553.7 $731.0 Gross loans receivable guaranteed by the Company 68.0 78.8 80.44 76.7 44.1 32.4 Gross combined loans receivable $341.2 $492.0 $652.0 $742.5 $597.8 $763.4 Total assets $727.4 $802.1 $884.8 $1,081.9 $1,183.0 $1,407.6 Average assets 661.7 764.8 843.4 983.3 1,132.4 1,295.3 LTM Adjusted Net Income from Continuing Operations 74.5 86.8 92.3 130.1 74.3 64.1 LTM Adjusted ROAA 11.3% 11.3% 10.9% 13.2% 6.6% 5.0%
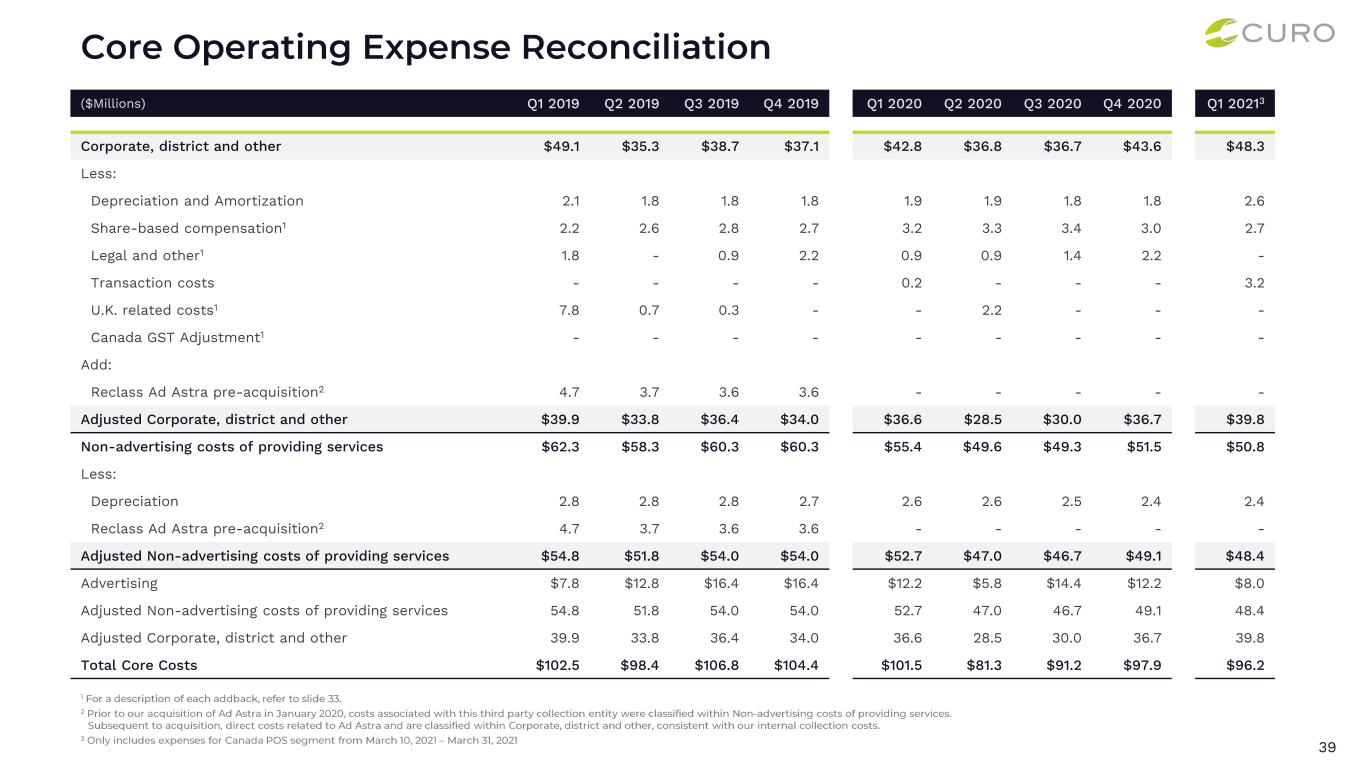
39 ($Millions) Q1 2019 Q2 2019 Q3 2019 Q4 2019 Q1 2020 Q2 2020 Q3 2020 Q4 2020 Q1 20213 Corporate, district and other $49.1 $35.3 $38.7 $37.1 $42.8 $36.8 $36.7 $43.6 $48.3 Less: Depreciation and Amortization 2.1 1.8 1.8 1.8 1.9 1.9 1.8 1.8 2.6 Share-based compensation1 2.2 2.6 2.8 2.7 3.2 3.3 3.4 3.0 2.7 Legal and other1 1.8 - 0.9 2.2 0.9 0.9 1.4 2.2 - Transaction costs - - - - 0.2 - - - 3.2 U.K. related costs1 7.8 0.7 0.3 - - 2.2 - - - Canada GST Adjustment1 - - - - - - - - - Add: Reclass Ad Astra pre-acquisition2 4.7 3.7 3.6 3.6 - - - - - Adjusted Corporate, district and other $39.9 $33.8 $36.4 $34.0 $36.6 $28.5 $30.0 $36.7 $39.8 Non-advertising costs of providing services $62.3 $58.3 $60.3 $60.3 $55.4 $49.6 $49.3 $51.5 $50.8 Less: Depreciation 2.8 2.8 2.8 2.7 2.6 2.6 2.5 2.4 2.4 Reclass Ad Astra pre-acquisition2 4.7 3.7 3.6 3.6 - - - - - Adjusted Non-advertising costs of providing services $54.8 $51.8 $54.0 $54.0 $52.7 $47.0 $46.7 $49.1 $48.4 Advertising $7.8 $12.8 $16.4 $16.4 $12.2 $5.8 $14.4 $12.2 $8.0 Adjusted Non-advertising costs of providing services 54.8 51.8 54.0 54.0 52.7 47.0 46.7 49.1 48.4 Adjusted Corporate, district and other 39.9 33.8 36.4 34.0 36.6 28.5 30.0 36.7 39.8 Total Core Costs $102.5 $98.4 $106.8 $104.4 $101.5 $81.3 $91.2 $97.9 $96.2

Serious News for Serious Traders! Try StreetInsider.com Premium Free!
You May Also Be Interested In
- VINCI finalizes the acquisition of the Northwest Parkway section of the Denver ring road (Colorado, USA)
- NOTICE TO THE ANNUAL GENERAL MEETING OF QPR SOFTWARE PLC
- NEXEN Tire hosts ‘2024 Purple Summit Korea’
Create E-mail Alert Related Categories
SEC FilingsSign up for StreetInsider Free!
Receive full access to all new and archived articles, unlimited portfolio tracking, e-mail alerts, custom newswires and RSS feeds - and more!


 Tweet
Tweet Share
Share