

Form 8-K CHOICEONE FINANCIAL SERV For: May 25
 Tweet
Tweet Share
ShareEXHIBIT 99.1
Choiceone FINANCIAL SERVICES, INC.
| |
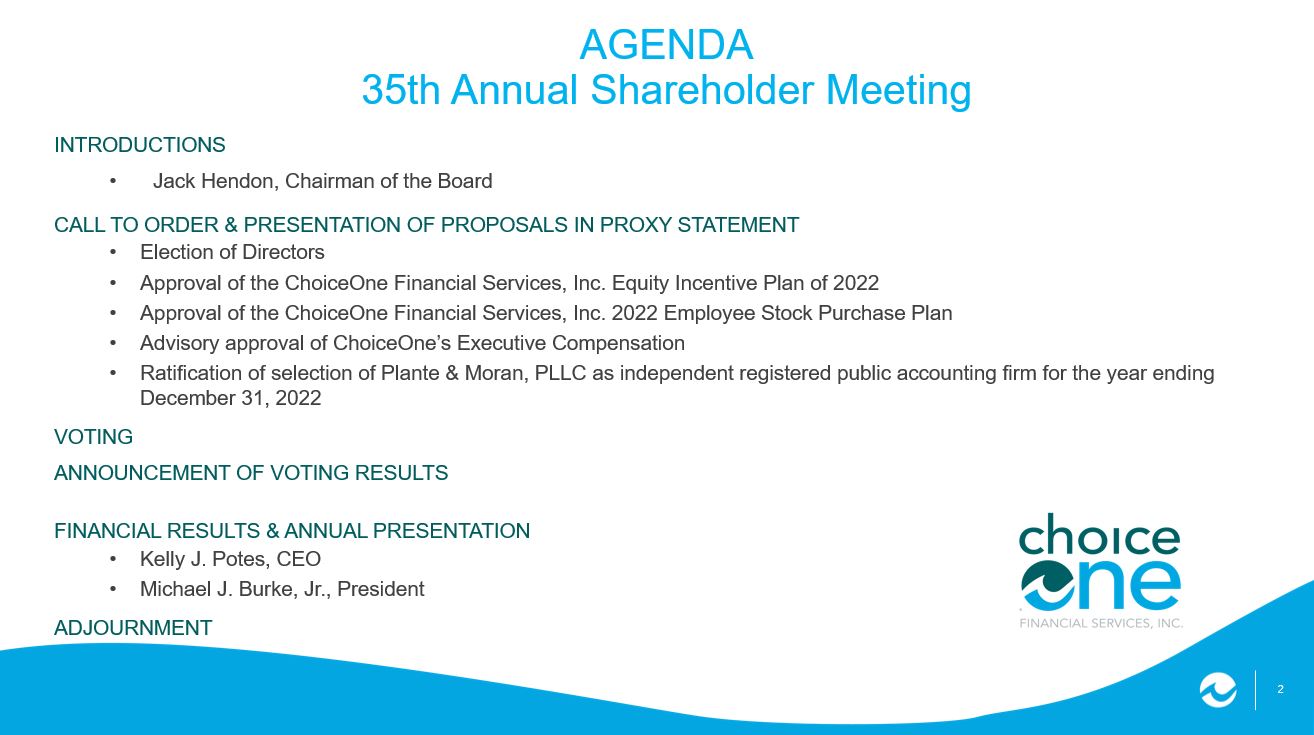
AGENDA 35th Annual Shareholder Meeting INTRODUCTIONS • Jack Hendon, Chairman of the Board CALL TO ORDER & PRESENTATION OF PROPOSALS IN PROXY STATEMENT • Election of Directors • Approval of the ChoiceOne Financial Services, Inc. Equity Incentive Plan of 2022 • Approval of the ChoiceOne Financial Services, Inc. 2022 Employee Stock Purchase Plan • Advisory approval of ChoiceOne's Executive Compensation • Ratification of selection of Plante & Moran, PLLC as independent registered public accounting firm for the year ending December 31, 2022 VOTING ANNOUNCEMENT OF VOTING RESULTS FINANCIAL RESULTS & ANNUAL PRESENTATION • Kelly J. Potes, CEO • Michael J. Burke, Jr., President ADJOURNMENT

Forward-looking Statements • This presentation contains forward-looking statements that are based on management's beliefs, assumptions, current expectations, estimates and projections about the financial services industry, the economy, and ChoiceOne. Words such as “anticipates,” “believes,” “estimates,” “expects,” “forecasts,” “intends,” “is likely,” “plans,” “predicts,” “projects,” “may,” “could,” “look forward,” “continue”, “future”, and variations of such words and similar expressions are intended to identify such forward-looking statements. • Examples of forward-looking statements also include, but are not limited to, statements related to risks and uncertainties related to, and the impact of, the global coronavirus (COVID-19) pandemic on the businesses, financial condition and results of operations of ChoiceOne and its customers and statements regarding the outlook and expectations of ChoiceOne and its customers. The COVID-19 pandemic is adversely affecting ChoiceOne and its customers, counterparties, employees, and third-party service providers. • The ultimate extent of the impacts on ChoiceOne's business, financial position, results of operations, liquidity, and prospects is uncertain. All statements with references to future time periods are forward-looking. These statements are not guarantees of future performance and involve certain risks, uncertainties and assumptions (“risk factors”) that are difficult to predict with regard to timing, extent, likelihood, and degree of occurrence. Therefore, actual results and outcomes may materially differ from what may be expressed, implied or forecasted in such forward-looking statements. Furthermore, ChoiceOne undertakes no obligation to update, amend, or clarify forward-looking statements, whether as a result of new information, future events, or otherwise. • Additional risk factors include, but are not limited to, the risk factors described in Item 1A in ChoiceOne's Annual Report on Form 10-K for the year ended December 31, 2021.

Company Profile ChoiceOne Financial Services, Inc. (“COFS”) was incorporated in 1986 as a Michigan corporation . ChoiceOne Bank was founded in 1898 (then called Sparta State Bank) in Sparta, MI at the corner of Division and Union Street. Over its more than 120-year history, COFS has grown significantly, due in part to its merger with County Bank Corp. ($673 million in assets) and acquisition of Community Shores Bank Corporation ($244 million in assets). Today, COFS is a $2.4 billion bank holding company listed on the NASDAQ stock exchange with a market capitalization of $199 million as of December 31, 2021. COFS prides itself on maintaining the community feel of a small-town bank with the technological capabilities and product offerings of a larger bank. Numbers based on ChoiceOne internal data as of 12/31/2021 Note: All dollars in thousands COMPANY OVERVIEW Personal Banking Provides full array of banking services including checking, savings, CDs/money markets and HSAs, complete with online and mobile banking solutions COMPANY SUMMARY FINANCIALS Total Assets $2,367,000 Deposits $2,052,000 Gross Loans (Incl. HFS) $1,069,000 Total Equity $222,000 Year to Date ROAA 1.02% Year to Date ROAE 9.79% Consol. CET-1 Ratio 11.3% PPP Outstanding $33,100 MAP OF LOCATIONS Branch Location Business Banking Business banking offers business and agriculture loans, treasury services and public funds Mortgage Lending A comprehensive offering of residential mortgage options including fixed and adjustable-rate mortgages Insurance Insurance subsidiary offers customers a variety of options including life insurance, disability insurance and accidental death insurance Trust / Fiduciary Provides corporate trustee services, as well as estate planning including testamentary trusts and revocable living trusts Investment Services & Wealth Management Services offered include estate planning, retirement planning, college planning, charitable giving, risk management, tax management, stocks, bonds and mutual funds and asset preservation strategies Coast to Coast Coverage Through 36 locations across western and southeastern Michigan, ChoiceOne Bank leverages advanced technology, innovative services and tailored solutions for its customers ChoiceOne Bank maintains the community feel of a small-town bank with the technological capabilities and product offerings of a larger bank

Transaction Overview Deal Profile (Announcement) Target Operating Metrics (Quarter Before Announcement) Target Target City, State Announcement Date Deal Value ($M) Consideration Total Assets Gross Loans LTM ROAA Muskegon, MI 1/6/2020 $21.9 76.5% Stock / 23.5% Cash $185.1 $147.2 0.49% Lapeer, MI 3/25/2019 $89.0 100.0% Stock / 0.0% Cash $616.6 $363.9 1.13% Kent City, MI 4/25/2006 $29.0 99.9% Stock / 0.1% Cash $216.4 $150.7 0.99% M&A History COFS has completed three whole bank M&A deals, most recently, the merger of equals with County Bank Corp. in 2019 and an acquisition of Community Shores Bank Corporation in 2020 Numbers based on ChoiceOne internal data as of 12/31/2021 except where specifically identified. Note: All dollars in millions, unless otherwise noted; deals sorted by announcement date (1) Excludes $138.0 million and $33.1 million in PPP loans in 2020 and 2021, respectively COFS M&A HISTORY ORGANIC AND ACQUISITIVE ASSET GROWTH Organic Assets Acquired Assets (1) (1) $770 $1,596 $617 $185 $607 $647 $671 $1,386 $1,781 $2,334 2016 2017 2018 2019 2020 (1) 2021 (1)

our mission to provide SUPERIOR SERVICE, QUALITY ADVICE, and show UTMOST RESPECT to everyone we meet.
ChoiceOne BANK Repeat Performance 2021 2022 Newsweek America's BEST Banks

2021 Board of Directors of ChoiceOne Bank *Member, ChoiceOne Financial Services, Inc., Board of Directors BACK ROW (L-R) BRUCE JOHN ESSEX, JR. HAROLD J. BURNS* ROXANNE M. PAGE* KELLY J. POTES* MICHAEL J. BURKE, JR.* BRUCE J. CADY* DAVID H. BUSH, O.D.* DAVID J. CHURCHILL NELS W. NYBLAD* CURT E. COULTER, D.O. BRADLEY F. MCGINNIS* GREG L. ARMOCK* FRONT ROW (L-R) PAUL L. JOHNSON JACK G. HENDON* MICHELLE M. WENDLING ERIC E. BURROUGH* GREGORY A. MCCONNELL* KEITH D. BROPHY* NOT PICTURED: PATRICK A. CRONIN* JAMES A. BOSSERD

Senior Management KELLY J. POTES CEO MICHAEL J. BURKE, JR. PRESIDENT ADOM J. GREENLAND SVP, CHIEF FINANCIAL OFFICER PETER BATISTONI SVP, SENIOR LENDER EAST MICHIGAN AND MORTGAGE SALES EXEC. LEE A. BRAFORD SVP, CHIEF CREDIT OFFICER HEATHER D. BROLICK SVP, HR OFFICER SHELY M. CHILDERS SVP, CHIEF INFO. OFFICER BRADLEY A. HENION SVP, CHIEF LENDING OFFICER ROB JAMULA SVP, WEALTH MANAGEMENT

SPARTA SPORTS PARK CHOICEONE BANK CHOICEONE 1898 FOUR COUNTY COMMUNITY FOUNDATION $2,000 Two Thousand Dollars 2021 Donation LACADA $6,000 Six Thousand Dollars Taste of Lapeer Donation 2021 DONATIONS OVER $402,000 2021 VOLUNTEER HOURS 3,344 Metro Community Development $500 Five Hundred Dollars Donation

Financial Summary ChoiceOne FINANCIAL SERVICES, INC.

5 Years Adjusted Net Income *Tax-effected merger expenses refers to expenses related to the merger with County Bank Corp. effective on October 1, 2019, and the acquisition of Community Shores Bank Corporation effective on July 1, 2020. Adjusted amounts are not GAAP. Refer to Non-GAAP Reconciliation slide for further details. $6,200 $7,300 $7,100 $15,600 $22,000 $1,800 $2,700 $4,000 $6,000 $8,000 $10,000 $12,000 $14,000 $16,000 $18,000 $20,000 $22,000 $24,000 2017 2018 2019 2020 2021 $18,300 Net Income at year end (in thousands) Tax-effected Merger Expenses (in thousands)* $8,900
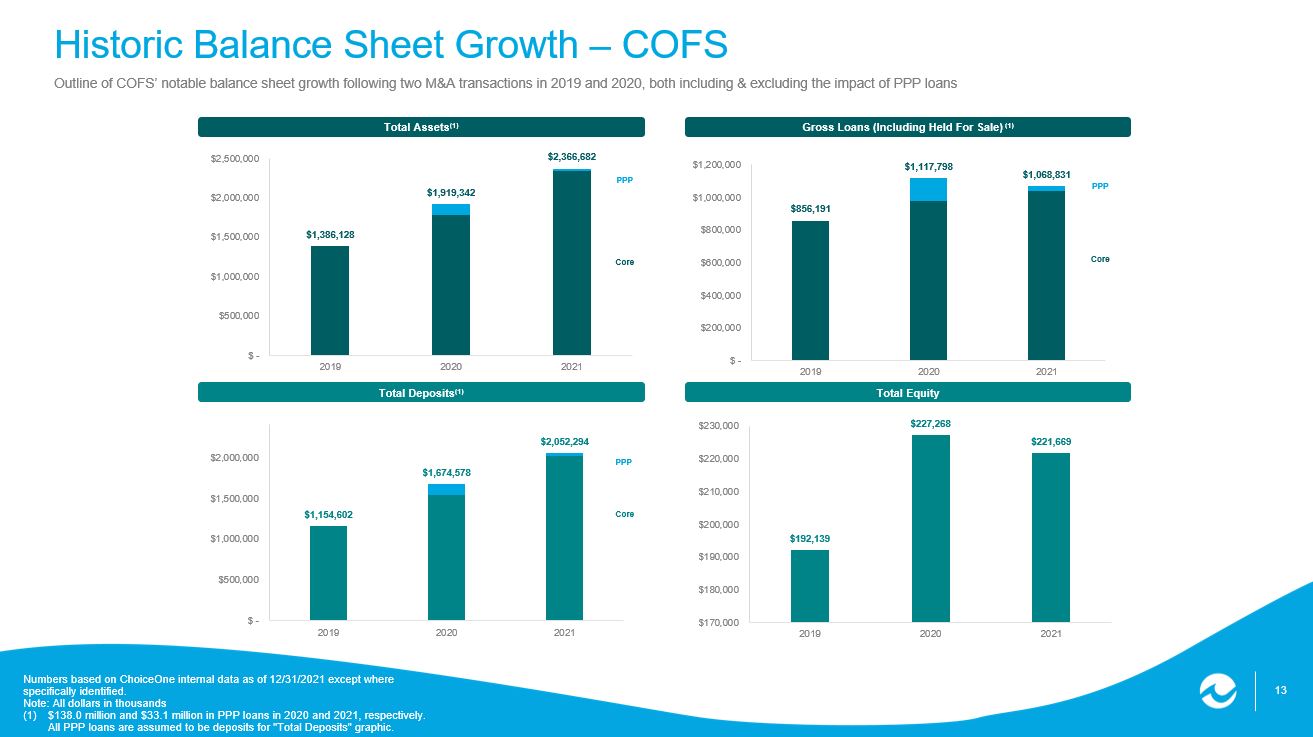
Historic Balance Sheet Growth – COFS Outline of COFS' notable balance sheet growth following two M&A transactions in 2019 and 2020, both including & excluding the impact of PPP loans Numbers based on ChoiceOne internal data as of 12/31/2021 except where specifically identified. Note: All dollars in thousands (1) $138.0 million and $33.1 million in PPP loans in 2020 and 2021, respectively. All PPP loans are assumed to be deposits for "Total Deposits" graphic. Total Equity Total Deposits (1) Gross Loans (Including Held For Sale) (1) Total Assets (1) PPP Core PPP Core PPP Core $856,191 $1,117,798 $1,068,831 $-$200,000 $400,000 $600,000 $800,000 $1,000,000 $1,200,000 2019 2020 2021 $1,386,128 $1,919,342 $2,366,682 $-$500,000 $1,000,000 $1,500,000 $2,000,000 $2,500,000 2019 2020 2021 $1,154,602 $1,674,578 $2,052,294 $-$500,000 $1,000,000 $1,500,000 $2,000,000 2019 2020 2021 $192,139 $227,268 $221,669 $170,000 $180,000 $190,000 $200,000 $210,000 $220,000 $230,000 2019 2020 2021

Loan Commentary : ▪ History of successful small business and agriculture lending ▪ Strong commercial and industrial portfolio ▪ 53% of CRE loans are owner occupied ▪ Active residential real estate lending with sold (primarily service retained) and portfolio mortgages Deposit Commentary: ▪ Continued success in growing diversified deposit mix ▪ Focus on locally sourced deposits ▪ Expansion into growing markets elevates deposit growth ▪ Significant non-maturity deposit base Balance % of Total Construction & Development $32,432 3.0% 1-4 Family 274,725 25.7% Multifamily 43,265 4.0% CRE – Owner Occupied 220,673 20.6% CRE – Non-Owner Occupied 194,274 18.2% Total CRE $414,947 38.8% C&I 204,677 19.1% Farm & Agricultural 61,793 5.8% Consumer, Leases & Other 36,992 3.6% Total Loans $1,068,831 100.0% Yield on Loans 4.68% December 31, 2021 Loan Mix and Detail December 31, 2021 Deposit Mix and Detail Attractive Loan and Deposit Mix – ChoiceOne Bank ChoiceOne Bank's loan to deposit ratio was 52% as of December 31, 2021 Note: All dollars in thousands; yields and costs are annualized on a quarterly basis Balance % of Total Transaction $1,226,413 59.8% MMDAs & Savings 643,837 31.4% Retail CDs (≤ $250K) 89,971 4.3% Jumbo CDs (> $250K) 92,073 4.5% Total Deposits $2,052,294 100.0% Cost of Interest-Bearing Deposits 0.23% Cost of Deposits 0.17% Commentary Transaction 60% MMDA & Sav. 31% Retail CDs (≤ $250k) 4% Jumbo CDs (> $250k) 5% Constr. & Development 3% 1-4 Family 26% Multifamily 4% Owner Occ. Comm. RE 21% Non Own. Occ. Comm. RE 18% Comm. & Industrial 19% Farm & Agriculture 6% Consumer, Leases & Other 3%

Capital Levels In September 2021, ChoiceOne completed a private placement of $32.5 million in aggregate principal amount of 3.25% fixed-to-floating rate subordinated notes due 2031. ChoiceOne used a portion of the net proceeds from the private placement to redeem senior debt, fund common stock repurchases and support bank-level capital ratios. Minimum Required for Capital (Dollars in thousands) Actual Adequacy Purposes December 31, 2021 Amount Ratio Amount Ratio ChoiceOne Financial Services Inc. Total capital (to risk weighted assets) $204,353 14.4% $113,604 8.0% Common equity Tier 1 capital (to risk weighted assets) 160,338 11.3 63,902 4.5 Tier 1 capital (to risk weighted assets) 164,838 11.6 85,203 6.0 Tier 1 capital (to average assets) 164,838 7.4 89,415 4.0 ChoiceOne Bank Total capital (to risk weighted assets) $182,275 12.9% $113,444 8.0 % Common equity Tier 1 capital (to risk weighted assets) 174,587 12.3 63,813 4.5 Tier 1 capital (to risk weighted assets) 174,587 12.3 85,083 6.0 Tier 1 capital (to average assets) 174,587 7.8 89,289 4.0

Financial Performance Trends – COFS Profitability metrics have improved following the M&A deals in 2019 and 2020; the efficiency ratio was 63.8% for 2021, partly offsetting the effects of Net Interest Margin (NIM) compression over the same period Efficiency Ratio (2) NIM (1) ROAE ROAA 0.85% 0.94% 1.02% 0.60% 0.70% 0.80% 0.90% 1.00% 1.10% 2019 2020 2021 6.48% 7.28% 9.79% 5.00% 6.00% 7.00% 8.00% 9.00% 10.00% 11.00% 2019 2020 2021 3.71% 3.51% 3.14% 2.50% 2.80% 3.10% 3.40% 3.70% 4.00% 2019 2020 2021 70.63% 62.99% 63.85% 55.00% 57.00% 59.00% 61.00% 63.00% 65.00% 67.00% 69.00% 71.00% 73.00% 2019 2020 2021 (1) Net interest margin is presented on a tax-equivalent basis. Amounts are not GAAP. Refer to Non-GAAP Reconciliation slide for furthe details. (2) Source: S&P Global Market Intelligence, as of 12/31/2022

Gain on Sale of Loans Interchange and Deposit Charges BOLI Revenue Trust Revenue Brokerage Fees Insurance Revenue Other Fees 45% 4% 4% 4% 8% 35% 53% 4% 3% 0% 2% 4% 34% Non-interest Income – COFS Diversified sources of non-interest income have been consistently growing fee-based revenue Note: Non-Interest Income amounts exclude gain on sale of securities. NON-INTEREST INCOME – ANNUAL $21.4 Million Year Ended 12/31/2021 $19.2 Million Year Ended 12/31/2020 Interchange and Deposit Charges Gain on Sale of Loans Brokerage Fees Trust Revenue BOLI Revenue Other Fees

Loan Loss Reserve and Credit Mark Build – COFS COFS has an ALLL balance of $7.6 million and a $6.8 million accounting mark against loans acquired from its two recent M&A deals. Combined with ALLL, COFS has $14.5 million to cover future loan losses, or 1.37% of gross loans (excl. loans HFS) Numbers based on ChoiceOne internal data as of 12/31/2021 except where specifically identified. Note: All dollars in thousands (1) Remaining Credit Mark related to the mark against loans acquired in the County Bank Corp. and Community Shores Bank Corporation transactions (2) Includes $37 million in PPP loans acquired in the merger with Community Shores Bank Corporation TOTAL FUNDS AVAILABLE TO COVER FUTURE LOSSES – SINCE 2016 Total Funds Avail. / Gross Loans (Excl. HFS) Loan Loss Reserve Remaining Credit Mark (1) Paycheck Protection Program PPP loan statistics as of 12/31/2021 Total Loans Originated (all years) (2) $253 million Total Fees Originated (all years) (2) $9.5 million Total Loans remaining $33.1 million Fees realized 2021 $5.2 million Total Fees Remaining at 12/31/2021 $1.2 million 1.16% 1.13% 1.09% 1.05% 1.55% 1.37% 0.00% 0.50% 1.00% 1.50% 2.00% $-$5,000 $10,000 $15,000 $20,000 2016 2017 2018 2019 2020 2021

Cash Dividends Per Share *Amounts have been adjusted for a 5% Stock Dividend on May 31, 2017 and May 31, 2018. Ordinary dividends Special dividend paid in connection with the merger with County Bank Corp. $0.25 $0.35 $0.45 $0.55 $0.65 $0.75 $0.85 $0.95 $1.05 2017* 2018* 2019 2020 2021 3.55% dividend yield as of 12/31/21

COFS TRADES ON THE NASDAQ ® Market Makers in ChoiceOne Stock D. A. Davidson & Co. Nick Bicking 800.394.9230 Raymond James & Associates Anthony LanFranca 312.655.2961 Stifel, Nicolaus & Company, Inc. Paul Drueke 616.224.1553 Stock Registrar & Transfer Agent Continental Stock Transfer & Trust Company 1 State Street Plaza, 30th Floor New York, NY 10004-1561 212.509.4000 Since February of 2020, ChoiceOne trades on the NASDAQ Stock Exchange under its symbol, “COFS.”

21 21 21 Appendix Non-GAAP Reconciliation (1) Adjusted to a fully tax-equivalent basis to facilitate comparison to the taxable interest-earning assets. The adjustment uses an incremental tax rate of 21%. The presentation of these measures on a tax equivalent basis is not in accordance with GAAP but is customary in the banking industry. These non-GAAP measures ensure comparability with respect to both taxable and tax-exempt loans and securities. Year Ended December 31, (In Thousands, Except Per Share Data) 2021 2020 2019 Income before income tax $26,498 $18,885 $8,465 Adjustment for pre-tax merger expenses - 3,219 2,001 Adjusted income before income tax 26,498 22,104 10,466 Income tax expense 4,456 3,272 1,294 Tax impact of adjustment for pre-tax merger expenses - 505 232 Adjusted income tax expense 4,456 3,777 1,526 Net income 22,042 15,613 7,171 Adjustment for pre-tax merger expenses, net of tax impact - 2,714 1,769 Adjusted net income $22,042 $18,327 $8,940 Year ended December 31, 2021 2020 2019 Interest Rate Interest Rate Interest Rate Net interest income (tax-equivalent basis) (Non-GAAP) (1) 62,137 51,808 28,181 Net interest margin (tax-equivalent basis) (Non-GAAP) (1) 3.14% 3.51% 3.71% Reconciliation to Reported Net Interest Income Net interest income (tax-equivalent basis) (Non-GAAP) (1) 62,137 51,808 28,181 Adjustment for taxable equivalent interest (1,513) (737) (408) Net interest income (GAAP) 60,624 51,071 27,773 Net interest margin (GAAP) 3.08% 3.38% 3.47%
Serious News for Serious Traders! Try StreetInsider.com Premium Free!
You May Also Be Interested In
- iManage to Present at ILTA EVOLVE Conference
- Silver Range Resources Ltd. to Present at Metals & Mining Virtual Investor Conference May 2nd
- Higround Unveils GRAFX Program: Elevating Self-Expression by Pushing the Boundaries of Peripheral Design
Create E-mail Alert Related Categories
SEC FilingsSign up for StreetInsider Free!
Receive full access to all new and archived articles, unlimited portfolio tracking, e-mail alerts, custom newswires and RSS feeds - and more!
