

Form 8-K CHESAPEAKE UTILITIES For: May 17
 Tweet
Tweet Share
Share
Exhibit 99.1 AGA Financial Forum Growth Ÿ ESG Ÿ Business Transformation MIAMI BEACH, FLORIDA MAY 17-19, 2022
Today’s Presenters Jeff Householder President, Chief Executive Officer Beth Cooper Executive Vice President, Chief Financial Officer, Treasurer and Assistant Corporate Secretary Jim Moriarty Executive Vice President, General Counsel, Corporate Secretary and Chief Policy and Risk Officer Alex Whitelam Head of Investor Relations 2

Forward Looking Statements and Other Statements Safe Harbor Statement Some of the Statements in this document concerning future Company performance will be forward-looking within the meanings of the securities laws. Actual results may materially differ from those discussed in these forward-looking statements. You should refer to the additional information contained in Chesapeake Utilities’ Annual Report on Form 10-K for the year ended December 31, 2021 filed with the SEC and other subsequent SEC filings concerning factors that could cause those results to be different than contemplated in today’s discussion. Non-GAAP Financial Information This presentation includes non-GAAP financial measures including Adjusted Gross Margin. A non-GAAP financial measure is generally defined as a numerical measure of a company's historical or future performance that includes or excludes amounts, or that is subject to adjustments, so as to be different from the most directly comparable measure calculated or presented in accordance with GAAP. Our management believes certain non-GAAP financial measures, when considered together with GAAP financial measures, provide information that is useful to investors in understanding period-over-period operating results separate and apart from items that may, or could, have a disproportionately positive or negative impact on results in any particular period. A reconciliation of GAAP to non-GAAP financial measures is included in the appendix of this presentation. The Company calculates Adjusted Gross Margin by deducting the purchased cost of natural gas, propane and electricity and the cost of labor spent on direct revenue-producing activities from operating revenues. The costs included in Adjusted Gross Margin exclude depreciation and amortization and certain costs presented in operations and maintenance expenses in accordance with regulatory requirements. Adjusted Gross Margin should not be considered an alternative to Gross Margin under US GAAP which is defined as the excess of sales over cost of goods sold. The Company believes that Adjusted Gross Margin, although a non-GAAP measure, is useful and meaningful to investors as a basis for making investment decisions. It provides investors with information that demonstrates the profitability achieved by the Company under the Company's allowed rates for regulated energy operations and under the Company's competitive pricing structures for unregulated energy operations. The Company's management uses Adjusted Gross Margin as one of the financial measures in assessing a business unit’s performance. Other companies may calculate Adjusted Gross Margin in a different manner. 3

Chesapeake Utilities Overview • 160+ – Years delivering energy • ~1,000 – Employees at Dec. 31, 2021 • ~300,000 – Distribution customers • $2.1 billion – Total Assets at March 31, 2022 th • 15 - Consecutive year of earnings growth* • 2x – Doubled Net Income over last 6 years st • 1 – RNG transportation project completed in 2021 • 61 – Consecutive years paying a dividend th • 19 – Consecutive year increasing annualized dividend per share * Excludes TCJA impact in 2017 4

Diversified Portfolio of Energy Solutions With an Expanding Footprint Business Line States Served Regulated Energy Segment Natural Gas Transmission DE, FL, MD, PA, OH Natural Gas Distribution DE, MD, FL Electric Distribution FL Unregulated Energy Segment Propane Distribution PA, DE, MD, VA, NC, SC, FL Natural Gas Pipeline System OH Multiple – Including New CNG CNG Services Both Regulated and Fueling Station in GA Unregulated CHP Generation FL Unregulated Multiple – Including recent RNG Opportunities RNG project in OH 5
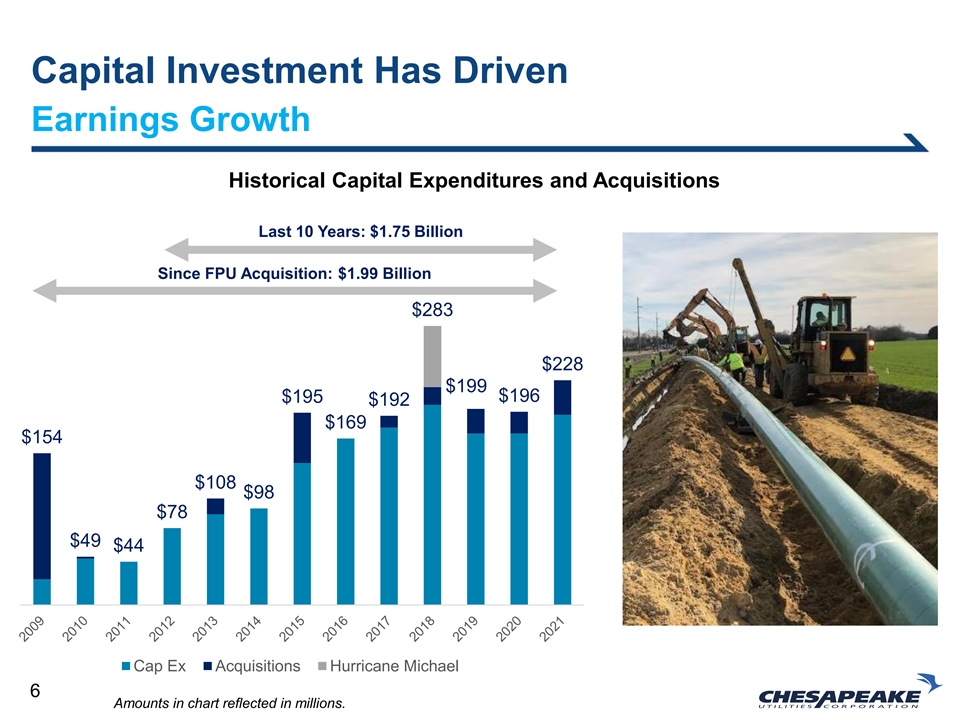
Capital Investment Has Driven Earnings Growth Historical Capital Expenditures and Acquisitions Last 10 Years: $1.75 Billion Since FPU Acquisition: $1.99 Billion $283 $228 $199 $195 $196 $192 $169 $154 $108 $98 $78 $49 $44 Cap Ex Acquisitions Hurricane Michael 6 Amounts in chart reflected in millions.
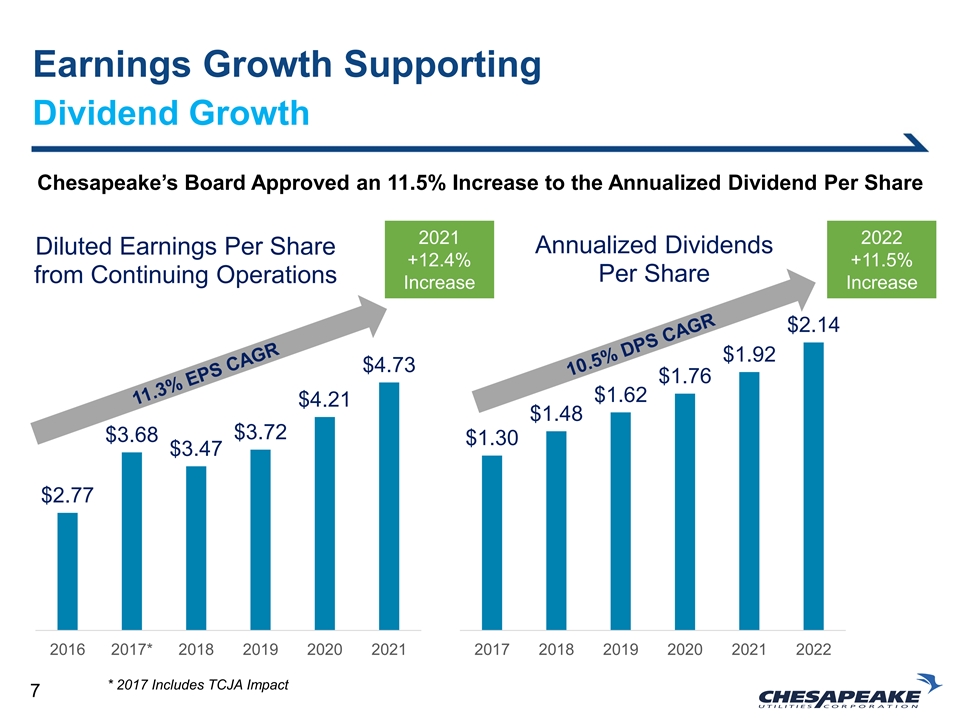
Earnings Growth Supporting Dividend Growth Chesapeake’s Board Approved an 11.5% Increase to the Annualized Dividend Per Share 2021 2022 Annualized Dividends Diluted Earnings Per Share +12.4% +11.5% Per Share from Continuing Operations Increase Increase $2.14 $1.92 $4.73 $1.76 $1.62 $4.21 $1.48 $3.72 $3.68 $1.30 $3.47 $2.77 2016 2017* 2018 2019 2020 2021 2017 2018 2019 2020 2021 2022 * 2017 Includes TCJA Impact 7
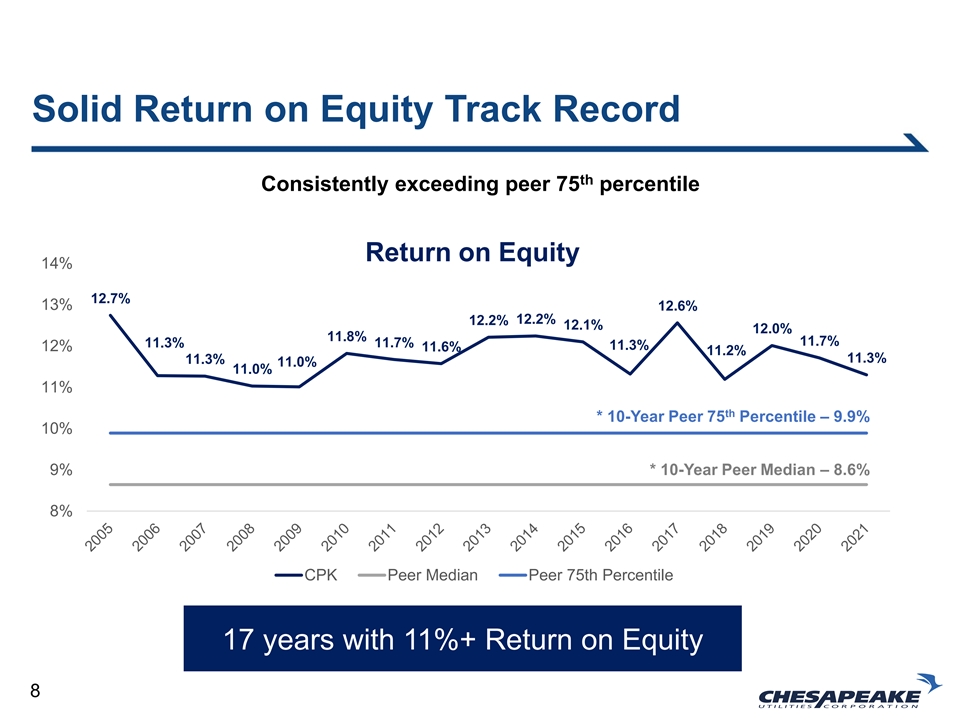
Solid Return on Equity Track Record th Consistently exceeding peer 75 percentile Return on Equity 14% 12.7% 13% 12.6% 12.2% 12.2% 12.1% 12.0% 11.8% 11.7% 11.3% 11.7% 11.3% 12% 11.6% 11.2% 11.3% 11.3% 11.0% 11.0% 11% th * 10-Year Peer 75 Percentile – 9.9% 10% 9% * 10-Year Peer Median – 8.6% 8% CPK Peer Median Peer 75th Percentile 17 years with 11%+ Return on Equity 8
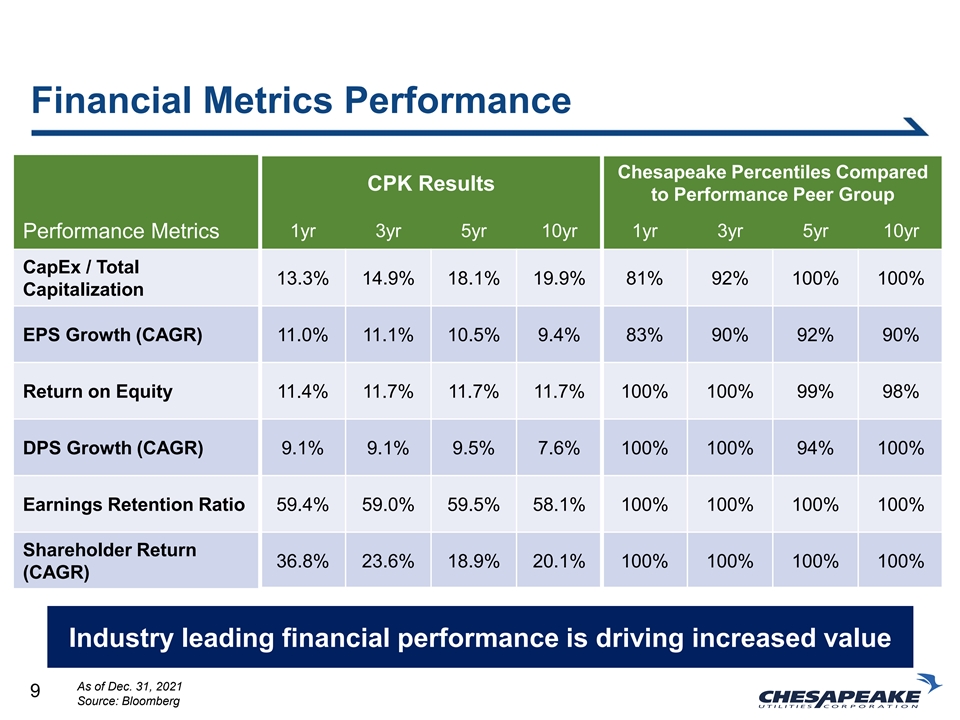
Financial Metrics Performance Chesapeake Percentiles Compared CPK Results to Performance Peer Group 1yr 3yr 5yr 10yr 1yr 3yr 5yr 10yr Performance Metrics CapEx / Total 13.3% 14.9% 18.1% 19.9% 81% 92% 100% 100% Capitalization EPS Growth (CAGR) 11.0% 11.1% 10.5% 9.4% 83% 90% 92% 90% Return on Equity 11.4% 11.7% 11.7% 11.7% 100% 100% 99% 98% DPS Growth (CAGR) 9.1% 9.1% 9.5% 7.6% 100% 100% 94% 100% Earnings Retention Ratio 59.4% 59.0% 59.5% 58.1% 100% 100% 100% 100% Shareholder Return 36.8% 23.6% 18.9% 20.1% 100% 100% 100% 100% (CAGR) Industry leading financial performance is driving increased value As of Dec. 31, 2021 9 Source: Bloomberg
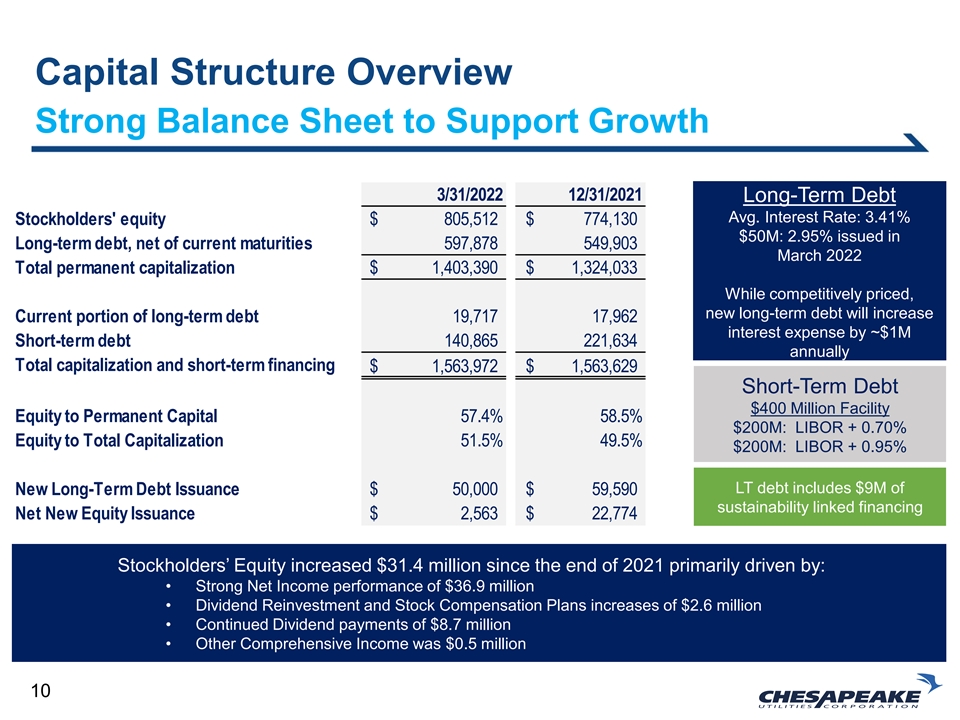
Capital Structure Overview Strong Balance Sheet to Support Growth 3/31/2022 12/31/2021 Long-Term Debt Avg. Interest Rate: 3.41% Stockholders' equity $ 8 05,512 $ 7 74,130 $50M: 2.95% issued in Long-term debt, net of current maturities 5 97,878 5 49,903 March 2022 Total permanent capitalization $ 1,403,390 $ 1 ,324,033 While competitively priced, new long-term debt will increase Current portion of long-term debt 1 9,717 17,962 interest expense by ~$1M Short-term debt 140,865 221,634 annually Total capitalization and short-term financing $ 1,563,972 $ 1 ,563,629 Short-Term Debt $400 Million Facility Equity to Permanent Capital 57.4% 58.5% $200M: LIBOR + 0.70% Equity to Total Capitalization 51.5% 49.5% $200M: LIBOR + 0.95% LT debt includes $9M of New Long-Term Debt Issuance $ 50,000 $ 5 9,590 sustainability linked financing Net New Equity Issuance $ 2,563 $ 2 2,774 Stockholders’ Equity increased $31.4 million since the end of 2021 primarily driven by: • Strong Net Income performance of $36.9 million • Dividend Reinvestment and Stock Compensation Plans increases of $2.6 million • Continued Dividend payments of $8.7 million • Other Comprehensive Income was $0.5 million 10
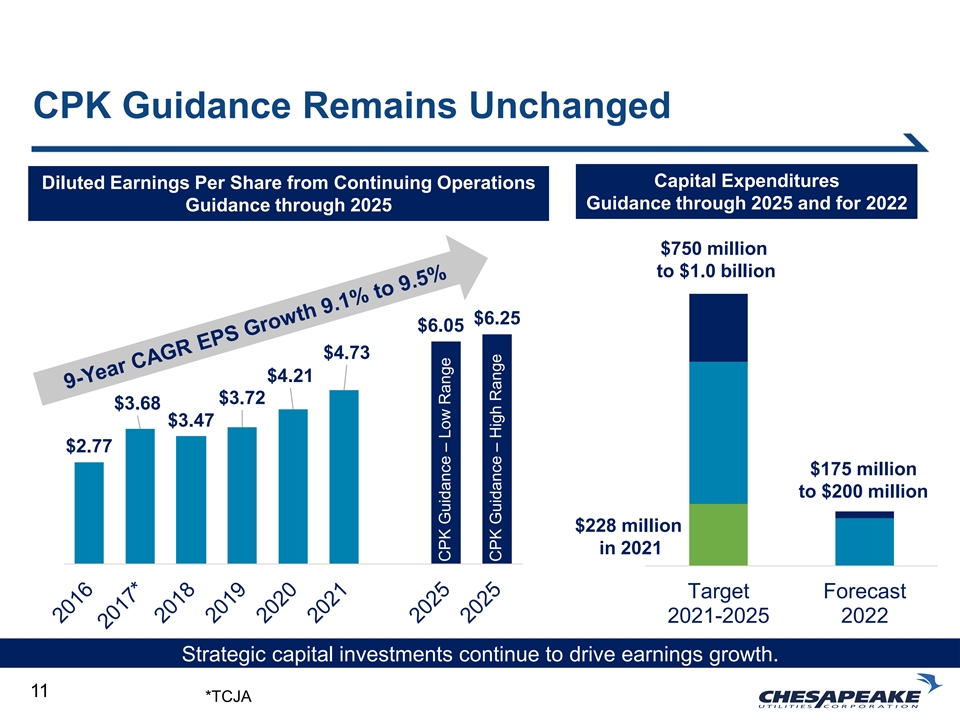
CPK Guidance Remains Unchanged Capital Expenditures Diluted Earnings Per Share from Continuing Operations Guidance through 2025 and for 2022 Guidance through 2025 $750 million to $1.0 billion $6.25 $6.05 $4.73 $4.21 $3.72 $3.68 $3.47 $2.77 $175 million to $200 million $228 million in 2021 Target Forecast 2021-2025 2022 Strategic capital investments continue to drive earnings growth. 11 *TCJA CPK Guidance – Low Range CPK Guidance – High Range
CHESAPEAKE UTILITIES Mission and Vision Mission: We deliver energy that makes life better for the people and communities we serve. Vision: We will be a leader in delivering energy that contributes to a sustainable future. 12
Looking Forward Key Focus Areas to Sustain Performance BUSINESS GROWTH ESG TRANSFORMATION 13

Growth
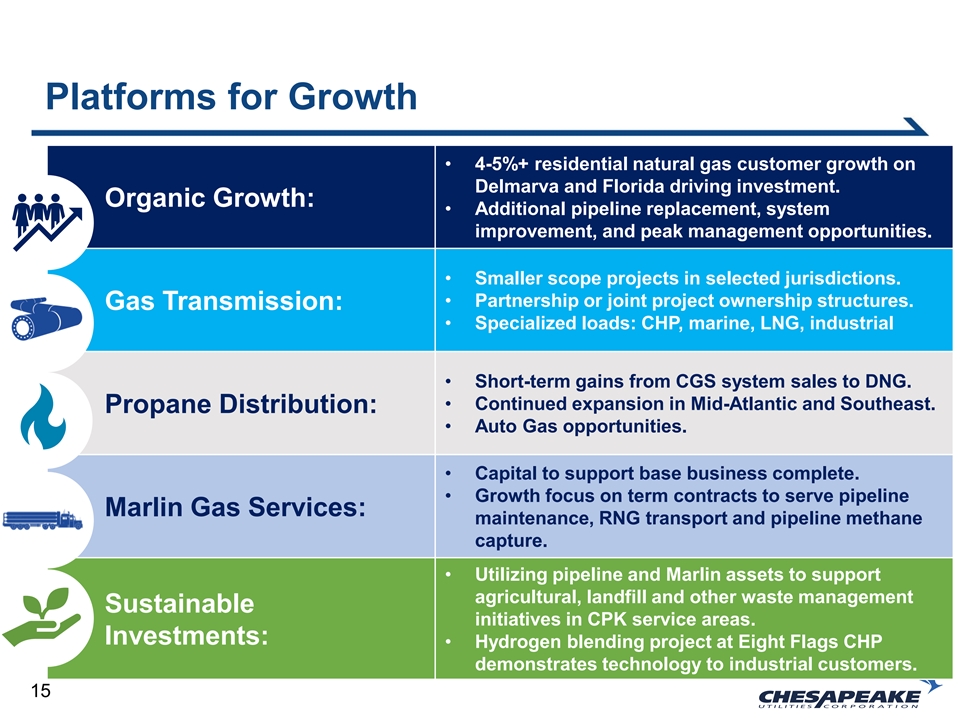
Platforms for Growth • 4-5%+ residential natural gas customer growth on Delmarva and Florida driving investment. Organic Growth: • Additional pipeline replacement, system improvement, and peak management opportunities. • Smaller scope projects in selected jurisdictions. • Partnership or joint project ownership structures. Gas Transmission: • Specialized loads: CHP, marine, LNG, industrial • Short-term gains from CGS system sales to DNG. • Continued expansion in Mid-Atlantic and Southeast. Propane Distribution: • Auto Gas opportunities. • Capital to support base business complete. • Growth focus on term contracts to serve pipeline Marlin Gas Services: maintenance, RNG transport and pipeline methane capture. • Utilizing pipeline and Marlin assets to support agricultural, landfill and other waste management Sustainable initiatives in CPK service areas. Investments: • Hydrogen blending project at Eight Flags CHP demonstrates technology to industrial customers. 15
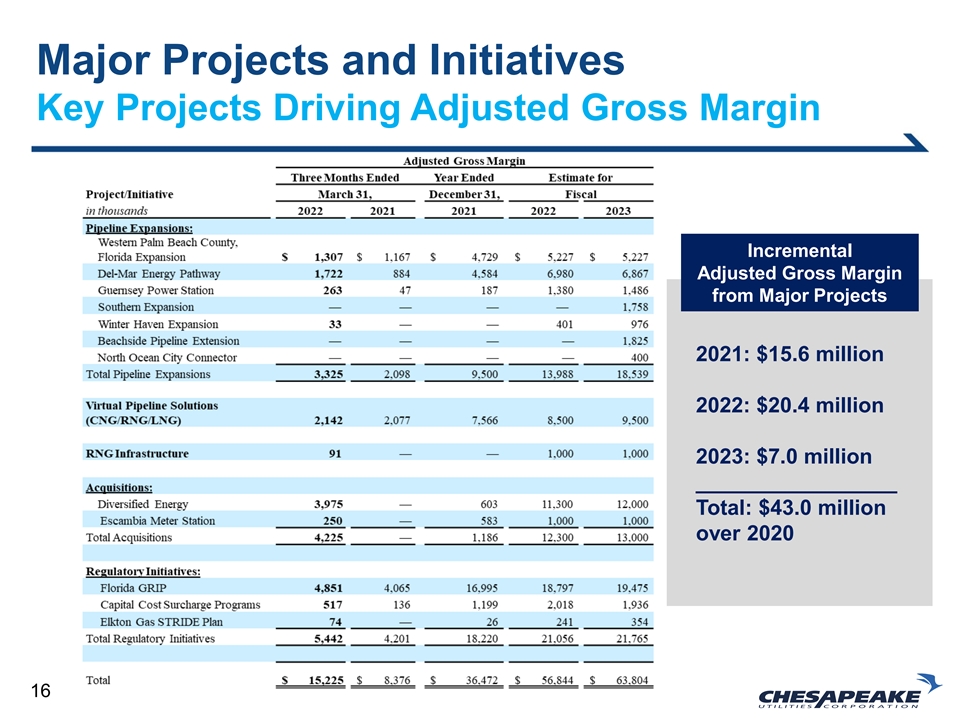
Major Projects and Initiatives Key Projects Driving Adjusted Gross Margin Incremental Adjusted Gross Margin from Major Projects 2021: $15.6 million 2022: $20.4 million 2023: $7.0 million _________________ Total: $43.0 million over 2020 16
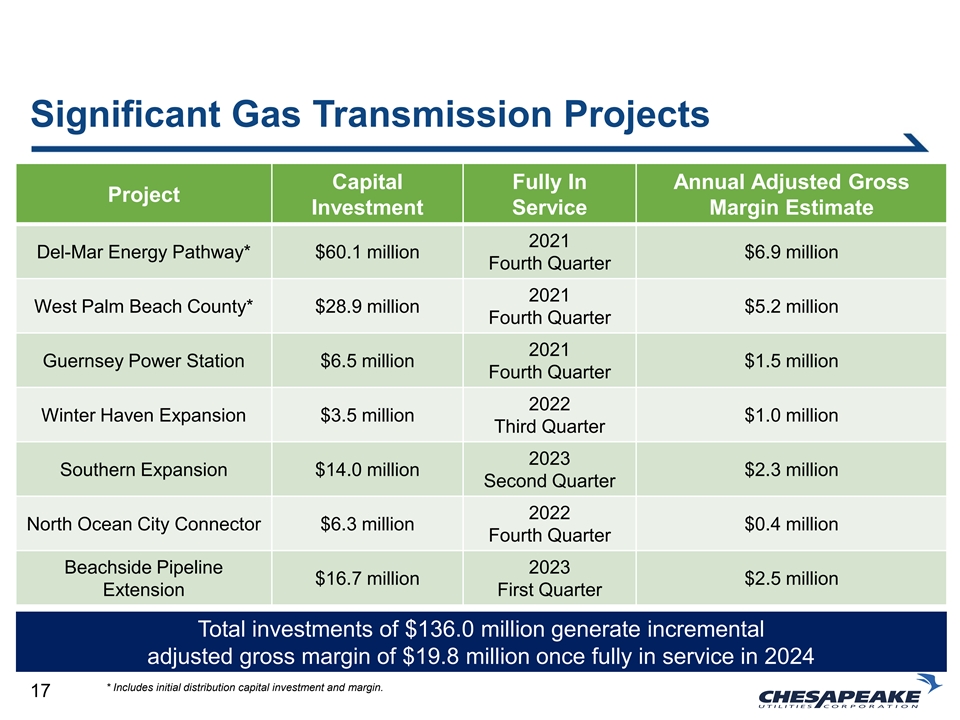
Significant Gas Transmission Projects Capital Fully In Annual Adjusted Gross Project Investment Service Margin Estimate 2021 Del-Mar Energy Pathway* $60.1 million $6.9 million Fourth Quarter 2021 West Palm Beach County* $28.9 million $5.2 million Fourth Quarter 2021 Guernsey Power Station $6.5 million $1.5 million Fourth Quarter 2022 Winter Haven Expansion $3.5 million $1.0 million Third Quarter 2023 Southern Expansion $14.0 million $2.3 million Second Quarter 2022 North Ocean City Connector $6.3 million $0.4 million Fourth Quarter Beachside Pipeline 2023 $16.7 million $2.5 million Extension First Quarter Total investments of $136.0 million generate incremental adjusted gross margin of $19.8 million once fully in service in 2024 * Includes initial distribution capital investment and margin. 17
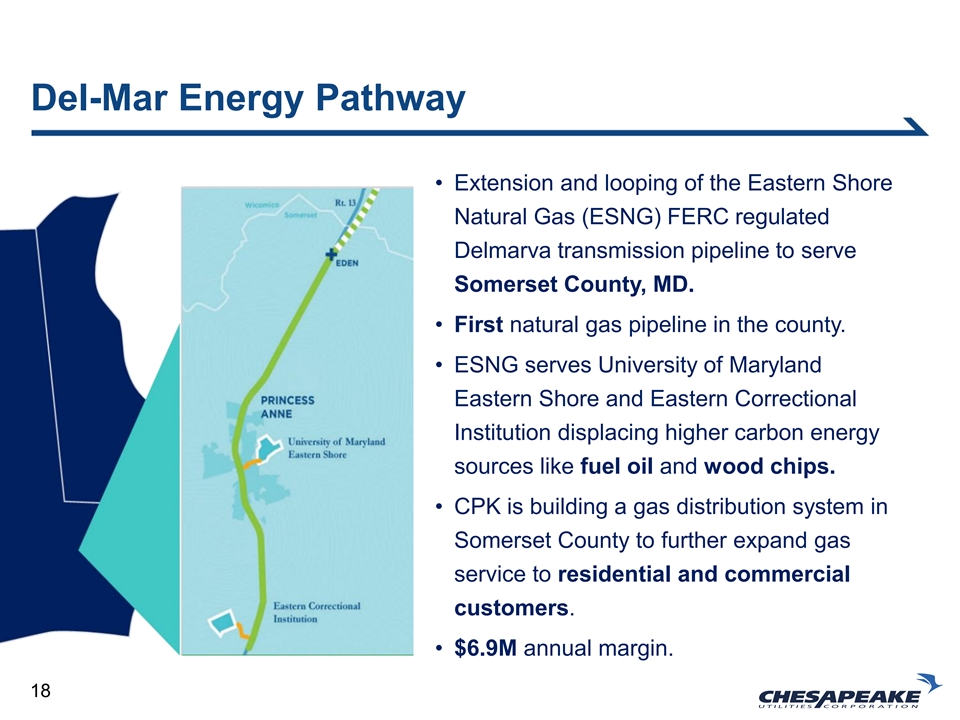
Del-Mar Energy Pathway • Extension and looping of the Eastern Shore Natural Gas (ESNG) FERC regulated Delmarva transmission pipeline to serve Somerset County, MD. • First natural gas pipeline in the county. • ESNG serves University of Maryland DE Eastern Shore and Eastern Correctional Institution displacing higher carbon energy sources like fuel oil and wood chips. • CPK is building a gas distribution system in Somerset County to further expand gas service to residential and commercial MD customers. • $6.9M annual margin. 18
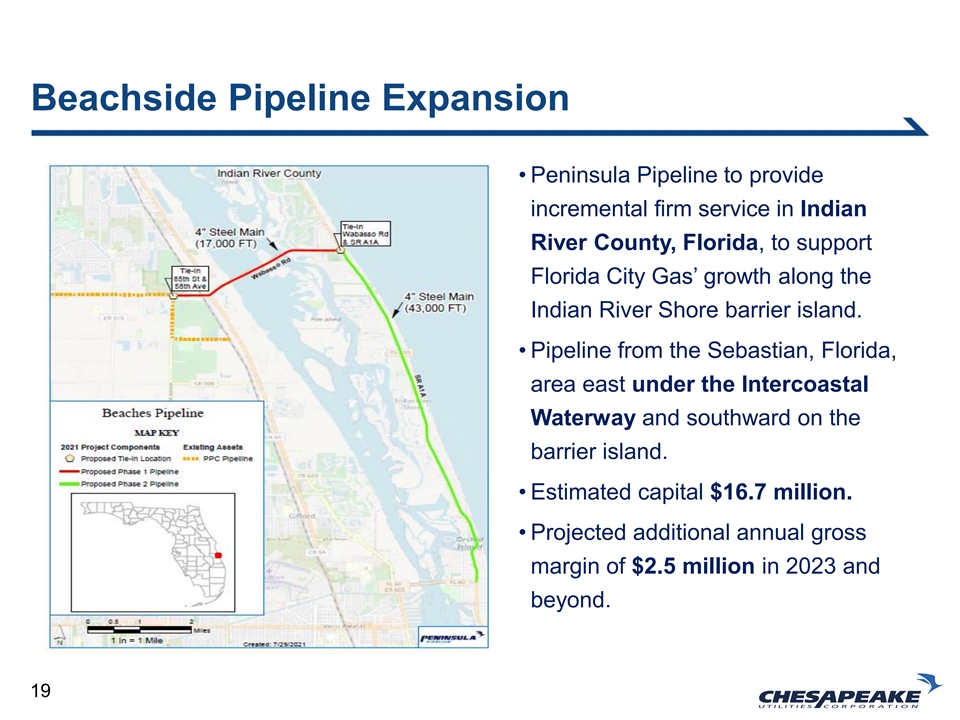
Beachside Pipeline Expansion • Peninsula Pipeline to provide incremental firm service in Indian River County, Florida, to support Florida City Gas’ growth along the Indian River Shore barrier island. • Pipeline from the Sebastian, Florida, area east under the Intercoastal Waterway and southward on the barrier island. • Estimated capital $16.7 million. • Projected additional annual gross margin of $2.5 million in 2023 and beyond. 19
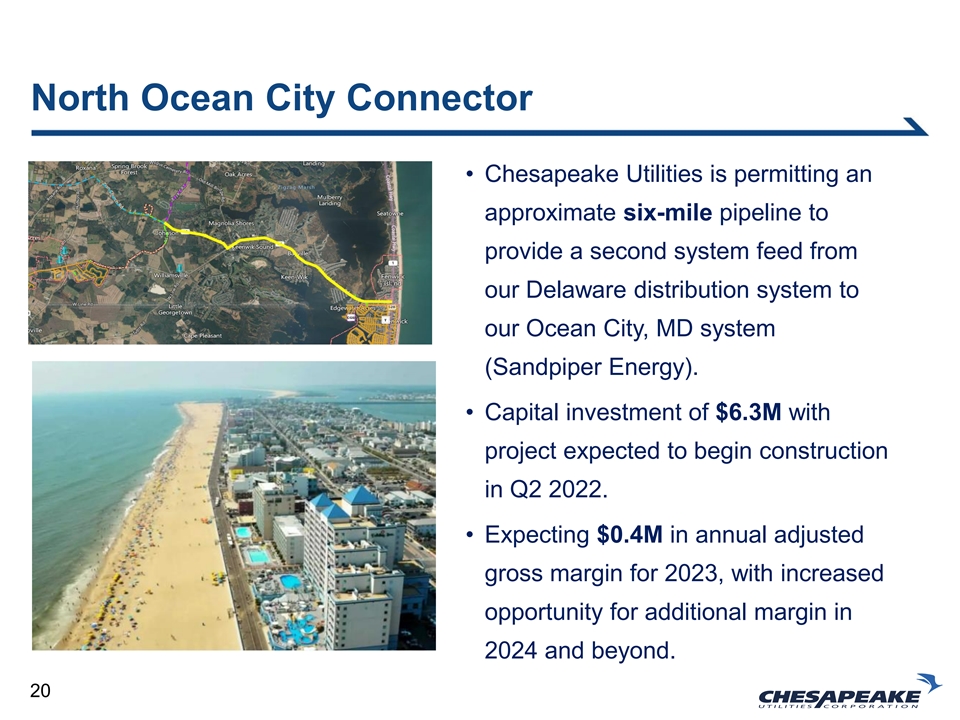
North Ocean City Connector • Chesapeake Utilities is permitting an approximate six-mile pipeline to provide a second system feed from our Delaware distribution system to our Ocean City, MD system (Sandpiper Energy). • Capital investment of $6.3M with project expected to begin construction in Q2 2022. • Expecting $0.4M in annual adjusted gross margin for 2023, with increased opportunity for additional margin in 2024 and beyond. 20
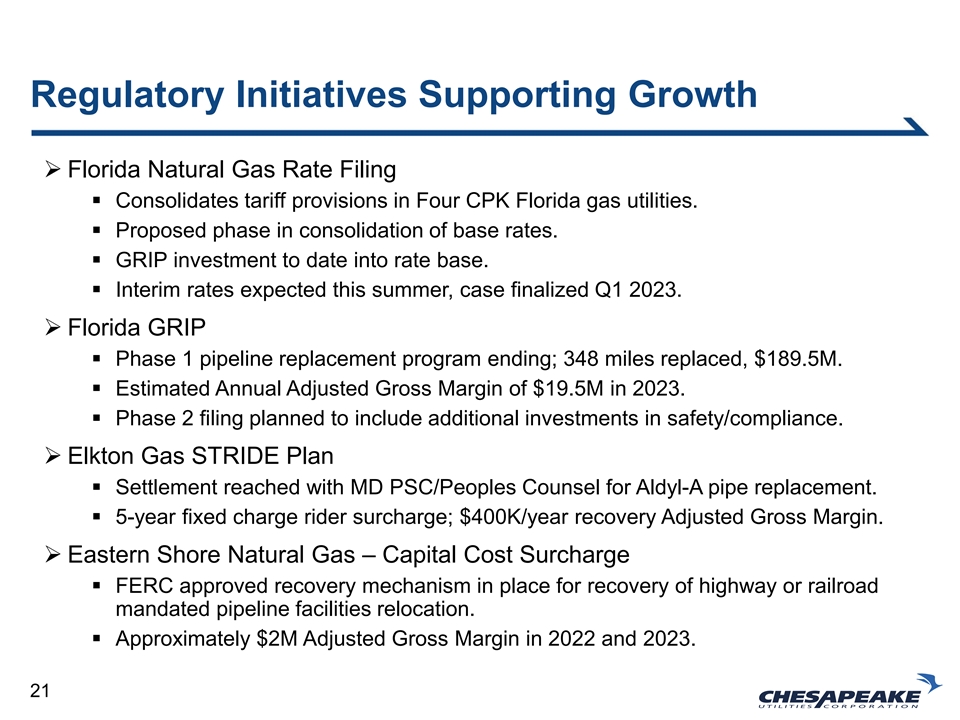
Regulatory Initiatives Supporting Growth ➢ Florida Natural Gas Rate Filing ▪ Consolidates tariff provisions in Four CPK Florida gas utilities. ▪ Proposed phase in consolidation of base rates. ▪ GRIP investment to date into rate base. ▪ Interim rates expected this summer, case finalized Q1 2023. ➢ Florida GRIP ▪ Phase 1 pipeline replacement program ending; 348 miles replaced, $189.5M. ▪ Estimated Annual Adjusted Gross Margin of $19.5M in 2023. ▪ Phase 2 filing planned to include additional investments in safety/compliance. ➢ Elkton Gas STRIDE Plan ▪ Settlement reached with MD PSC/Peoples Counsel for Aldyl-A pipe replacement. ▪ 5-year fixed charge rider surcharge; $400K/year recovery Adjusted Gross Margin. ➢ Eastern Shore Natural Gas – Capital Cost Surcharge ▪ FERC approved recovery mechanism in place for recovery of highway or railroad mandated pipeline facilities relocation. ▪ Approximately $2M Adjusted Gross Margin in 2022 and 2023. 21

ESG
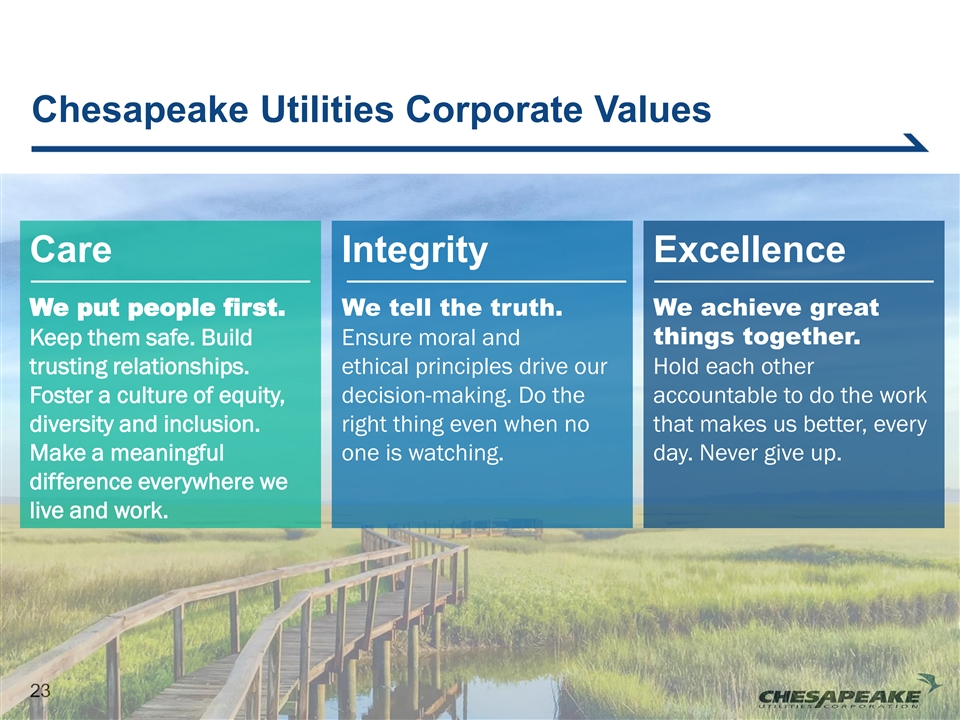
Chesapeake Utilities Corporate Values Care Integrity Excellence We put people first. We tell the truth. We achieve great things together. Keep them safe. Build Ensure moral and trusting relationships. ethical principles drive our Hold each other Foster a culture of equity, decision-making. Do the accountable to do the work diversity and inclusion. right thing even when no that makes us better, every Make a meaningful one is watching. day. Never give up. difference everywhere we live and work. 23
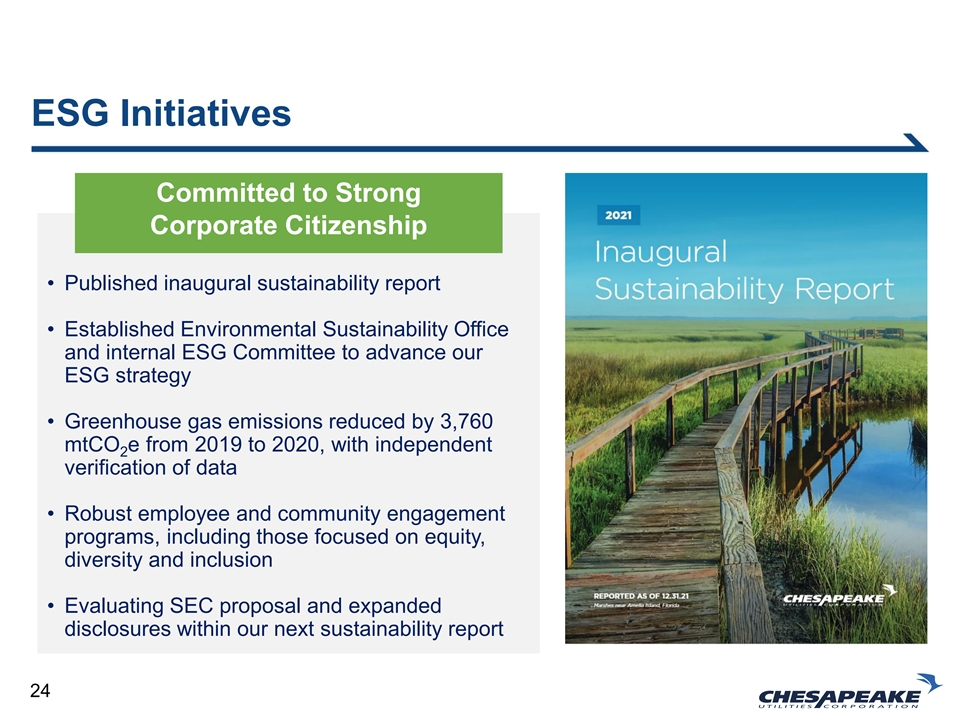
ESG Initiatives Committed to Strong Corporate Citizenship • Published inaugural sustainability report • Established Environmental Sustainability Office and internal ESG Committee to advance our ESG strategy • Greenhouse gas emissions reduced by 3,760 mtCO e from 2019 to 2020, with independent 2 verification of data • Robust employee and community engagement programs, including those focused on equity, diversity and inclusion • Evaluating SEC proposal and expanded disclosures within our next sustainability report 24
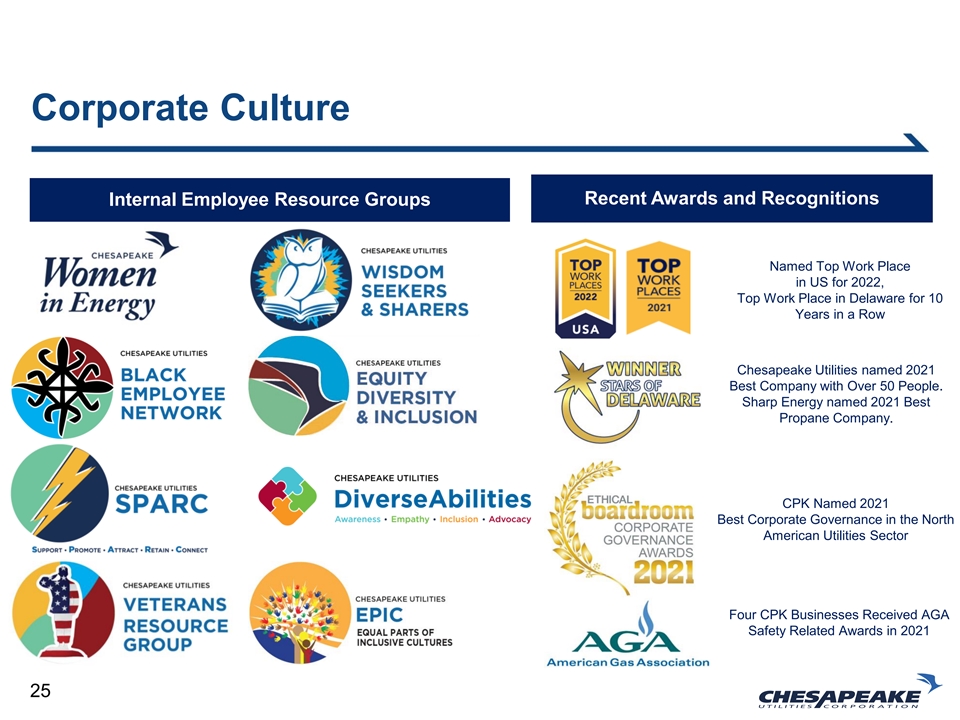
Corporate Culture Recent Awards and Recognitions Internal Employee Resource Groups Named Top Work Place in US for 2022, Top Work Place in Delaware for 10 Years in a Row Chesapeake Utilities named 2021 Best Company with Over 50 People. Sharp Energy named 2021 Best Propane Company. CPK Named 2021 Best Corporate Governance in the North American Utilities Sector Four CPK Businesses Received AGA Safety Related Awards in 2021 25
Business Transformation
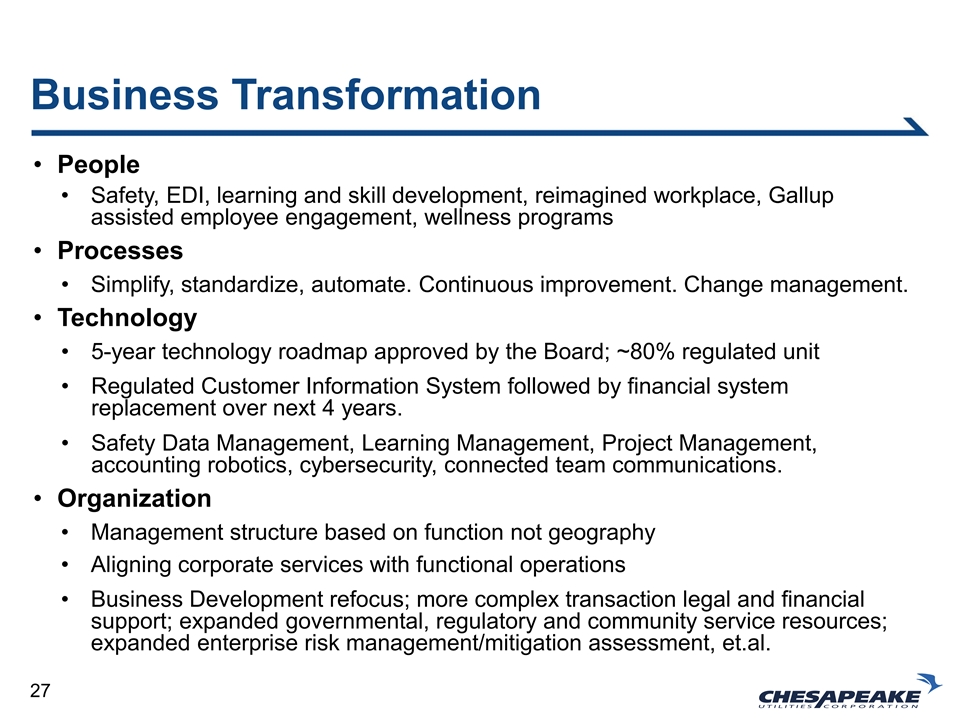
Business Transformation • People • Safety, EDI, learning and skill development, reimagined workplace, Gallup assisted employee engagement, wellness programs • Processes • Simplify, standardize, automate. Continuous improvement. Change management. • Technology • 5-year technology roadmap approved by the Board; ~80% regulated unit • Regulated Customer Information System followed by financial system replacement over next 4 years. • Safety Data Management, Learning Management, Project Management, accounting robotics, cybersecurity, connected team communications. • Organization • Management structure based on function not geography • Aligning corporate services with functional operations • Business Development refocus; more complex transaction legal and financial support; expanded governmental, regulatory and community service resources; expanded enterprise risk management/mitigation assessment, et.al. 27
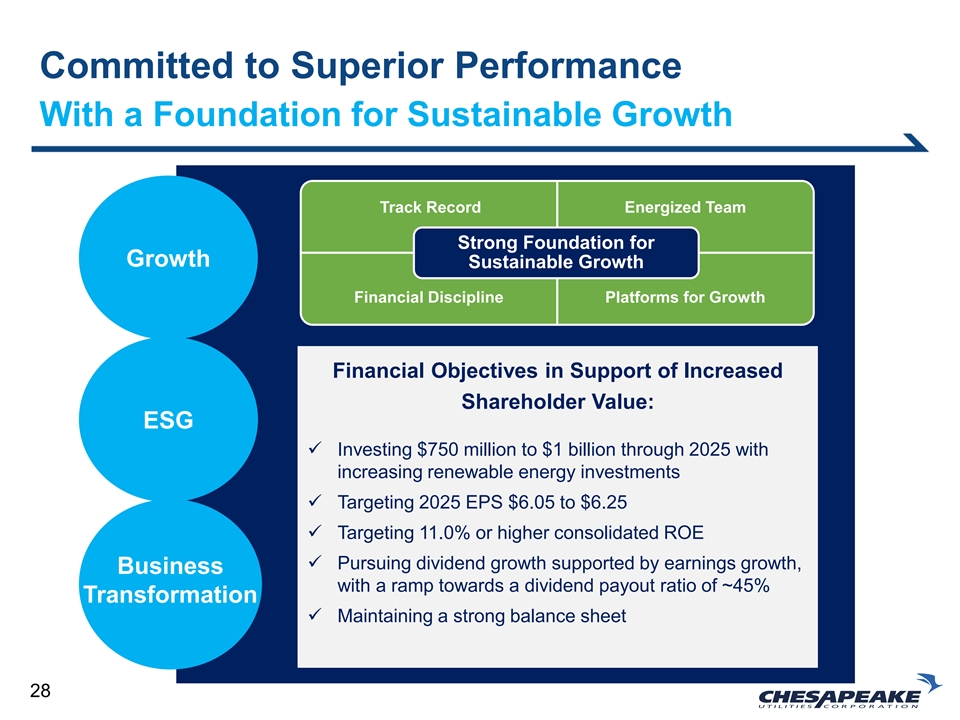
Committed to Superior Performance With a Foundation for Sustainable Growth Track Record Energized Team Strong Foundation for Growth Sustainable Growth Financial Discipline Platforms for Growth Financial Objectives in Support of Increased Shareholder Value: ESG ✓ Investing $750 million to $1 billion through 2025 with increasing renewable energy investments ✓ Targeting 2025 EPS $6.05 to $6.25 ✓ Targeting 11.0% or higher consolidated ROE ✓ Pursuing dividend growth supported by earnings growth, Business with a ramp towards a dividend payout ratio of ~45% Transformation ✓ Maintaining a strong balance sheet 28

Questions?

Thank You for Joining
Serious News for Serious Traders! Try StreetInsider.com Premium Free!
You May Also Be Interested In
- Chesapeake Utilities Corporation Gains Approval to Establish Energy Efficiency Programs in Delaware
- Flexible Display Market Expected to Reach USD 121 Billion by 2031 Driven by Growing Demand for Foldable Devices and Wearables
- Chesapeake Utilities Corporation Names Head of Investor Relations
Create E-mail Alert Related Categories
SEC FilingsSign up for StreetInsider Free!
Receive full access to all new and archived articles, unlimited portfolio tracking, e-mail alerts, custom newswires and RSS feeds - and more!
