

Form 8-K CENTERPOINT ENERGY INC For: Aug 05
 Tweet
Tweet Share
ShareExhibit 99.1
|
|
For more information contact
| |
| Media:
| ||
| Communications
| ||
|
| ||
| Investors:
| ||
| Philip Holder / Jackie Richert
| ||
| Phone 713.207.6500 |

CenterPoint Energy reports strong Q2 2021 earnings results
| • | Q2 2021 earnings of $0.37 per diluted share; $0.36 per diluted share on a non-GAAP basis, including results from utility operations of $0.28 per diluted share |
| • | Raising 2021 Utility EPS guidance (“Utility EPS”) range to $1.25 - $1.27 and reiterating 6% - 8% Utility EPS 5-year annual growth rate target |
| • | On path to deliver 10% compound annual rate base growth over 5 years through $16 billion 5-year capital plan, with additional investment opportunities from recent Texas legislative session |
| • | CenterPoint to host an Analyst Day on September 23rd in Houston, Texas |
Houston - August 5, 2021 - CenterPoint Energy, Inc. (NYSE: CNP) today reported income available to common shareholders of $221 million, or $0.37 per diluted share, for the second quarter of 2021, compared to income available to common shareholders of $59 million, or $0.11 per diluted share, for the second quarter of 2020.
On a non-GAAP basis, second quarter 2021 earnings were $0.36 per diluted share, with $0.28 per diluted share from utility operations, and $0.08 per diluted share from midstream investments. This compared to $0.18 per diluted share from utility operations and $0.03 per diluted share from midstream investments in second quarter 2020. Both quarters included some one-time drivers. The second quarter 2020 Utility EPS included an unfavorable COVID-related impact of $0.06, while the second quarter 2021 Utility EPS included a favorable income tax benefit of $0.03. Other notable variances in Utility EPS for the quarter included $0.04 of favorable variance from organic growth and rate recovery, which was partially offset by a $0.02 impact attributable to the May 2020 equity issuance.
“CenterPoint’s six-month financial performance in 2021 has been strong,” said Dave Lesar, President and Chief Executive Officer of CenterPoint Energy. “We are raising our 2021 Utility EPS guidance range to $1.25-$1.27 per diluted share. This projected 8% growth in 2021 Utility EPS would put us at the high-end of our 6 to 8% Utility EPS annual growth target.”
Lesar added, “Regarding our capital investments, we have invested approximately $1.5 billion for the first six months of this year and are on track to invest approximately $3.4 billion for the full year 2021. These projects will add to the safety and reliability of our system for the benefit of our customers and our investors. Additionally, we now have better line of sight to additional capital investment opportunities beyond the 5-year, $16 billion investment plan we previously announced, including opportunities from the recent Texas legislative session.”
“While we are keen to discuss CenterPoint’s great future, we are planning to discuss exciting longer-term strategy updates at our Analyst Day which will take place on September 23rd here in Houston. Through this forum, we plan to update investors on our longer-term business plan, earnings capacity, financial metrics, and net zero emissions targets,” said Dave Lesar.
--more--
Earnings Outlook
Given the recently announced merger between Enable and Energy Transfer, CenterPoint Energy will only be presenting a Utility EPS guidance range for 2021 as Enable did not provide 2021 guidance during its recent earnings call.
In addition to presenting its financial results in accordance with GAAP, including presentation of income (loss) available to common shareholders and diluted earnings (loss) per share, CenterPoint Energy provides guidance based on non-GAAP income and non-GAAP diluted earnings per share. Generally, a non-GAAP financial measure is a numerical measure of a company’s historical or future financial performance that excludes or includes amounts that are not normally excluded or included in the most directly comparable GAAP financial measure.
Management evaluates CenterPoint Energy’s financial performance in part based on non-GAAP income and non-GAAP earnings per share. Management believes that presenting these non-GAAP financial measures enhances an investor’s understanding of CenterPoint Energy’s overall financial performance by providing them with an additional meaningful and relevant comparison of current and anticipated future results across periods. The adjustments made in these non-GAAP financial measures exclude items that Management believes do not most accurately reflect the company’s fundamental business performance. These excluded items are reflected in the reconciliation tables of this news release, where applicable. CenterPoint Energy’s non-GAAP income and non-GAAP diluted earnings per share measures should be considered as a supplement to, and not as a substitute for, or superior to, income available to common shareholders and diluted earnings per share, which respectively are the most directly comparable GAAP financial measures. These non-GAAP financial measures also may be different than non-GAAP financial measures used by other companies.
(1) Utility EPS Guidance Range
| • | The Utility EPS guidance range includes net income from Electric and Natural Gas segments, as well as after tax Corporate and Other operating income and an allocation of corporate overhead based upon the Utility’s relative earnings contribution. Corporate overhead consists primarily of interest expense, preferred stock dividend requirements, and other items directly attributable to the parent along with the associated income taxes. |
| • | The Utility EPS guidance excludes: |
| • | Earnings or losses from the change in value of ZENS and related securities |
| • | Certain expenses associated with Vectren merger integration |
| • | Midstream Investments segment and associated income from the Enable preferred units and a corresponding amount of debt in addition to an allocation of associated corporate overhead and impact, including related expenses, associated with the merger between Enable and Energy Transfer |
| • | Cost associated with the early extinguishment of debt |
| • | Gain and impact, including related expenses, associated with gas LDC sales |
2
In providing this guidance, CenterPoint Energy does not consider the items noted above and other potential impacts such as changes in accounting standards, impairments or other unusual items, which could have a material impact on GAAP reported results for the applicable guidance period. The 2021 Utility EPS guidance range also considers assumptions for certain significant variables that may impact earnings, such as customer growth and usage including normal weather, throughput, recovery of capital invested, effective tax rates, financing activities and related interest rates, and regulatory and judicial proceedings. In addition, the 2021 Utility EPS guidance range assumes a continued re-opening of the economy in CenterPoint Energy’s service territories throughout 2021. To the extent actual results deviate from these assumptions, the 2021 Utility EPS guidance range may not be met or the projected annual Utility EPS growth rate may change. CenterPoint Energy is unable to present a quantitative reconciliation of forward-looking non-GAAP diluted earnings per share because changes in the value of ZENS and related securities, future impairments, and other unusual items are not estimable and are difficult to predict due to various factors outside of management’s control.
(2) Midstream Investments EPS Expected Range
Midstream guidance is not initiated at this time as a result of a pending merger between Enable and Energy Transfer. CenterPoint Energy will continue to record its share of Enable’s earnings as well as basis difference accretion, earnings from the Enable preferred distributions net of an associated amount of debt, interest on the intercompany note between CenterPoint Energy and CenterPoint Energy Midstream, and an allocation of corporate overhead based on Midstream Investment segment’s relative earnings contribution until the transaction closes.
Upon closing of the transaction, CenterPoint Energy’s investment in Energy Transfer will be accounted for as an equity method investment with a fair value option. Following the closing of the transaction, CenterPoint Energy will establish Midstream Investments EPS expected range based on the distributions from Energy Transfer and the debt and corporate allocations previously described as a component of our Midstream Investments, excluding market-to-market gains or losses recorded for the Energy Transfer investments.
3
Reconciliation of Consolidated income (loss) available to common shareholders and diluted earnings (loss) per share (GAAP) to non-GAAP income and non-GAAP diluted earnings per share
| Quarter Ended | ||||||||||||||||||||||||||||||||
| June 30, 2021 |
||||||||||||||||||||||||||||||||
| Utility Operations | Midstream Investments |
Corporate and Other (4) | Consolidated | |||||||||||||||||||||||||||||
| Dollars in millions |
Diluted EPS (1) |
Dollars in millions |
Diluted EPS (1) |
Dollars in millions |
Diluted EPS (1) |
Dollars in millions |
Diluted EPS (1) |
|||||||||||||||||||||||||
| Consolidated income (loss) available to common shareholders and diluted EPS(1) |
$ | 199 | $ | 0.33 | $ | 54 | $ | 0.09 | $ | (32 | ) | $ | (0.05 | ) | $ | 221 | $ | 0.37 | ||||||||||||||
| ZENS-related mark-to-market (gains) losses: |
||||||||||||||||||||||||||||||||
| Marketable securities (net of taxes of $15)(2)(3) |
— | — | — | — | (60 | ) | (0.10 | ) | (60 | ) | (0.10 | ) | ||||||||||||||||||||
| Indexed debt securities (net of taxes of $15)(3) |
— | — | — | — | 62 | 0.10 | 62 | 0.10 | ||||||||||||||||||||||||
| Impacts associated with the Vectren merger (net of taxes of $0)(2) |
2 | 0.01 | — | — | — | — | 2 | 0.01 | ||||||||||||||||||||||||
| Impacts associated with gas LDC sales(2) |
(11 | ) | (0.02 | ) | — | — | (6 | ) | (0.01 | ) | (17 | ) | (0.03 | ) | ||||||||||||||||||
| Cost associated with the early extinguishment of debt (net of taxes of $1)(2) |
— | — | — | — | 6 | 0.01 | 6 | 0.01 | ||||||||||||||||||||||||
| Corporate and Other Allocation |
(25 | ) | (0.04 | ) | (5 | ) | (0.01 | ) | 30 | 0.05 | — | — | ||||||||||||||||||||
|
|
|
|
|
|
|
|
|
|
|
|
|
|
|
|
|
|||||||||||||||||
| Consolidated on a non-GAAP basis |
$ | 165 | $ | 0.28 | $ | 49 | $ | 0.08 | $ | — | $ | — | $ | 214 | $ | 0.36 | ||||||||||||||||
|
|
|
|
|
|
|
|
|
|
|
|
|
|
|
|
|
|||||||||||||||||
| (1) | Quarterly diluted EPS on both a GAAP and non-GAAP basis are based on the weighted average number of shares of common stock outstanding during the quarter, and the sum of the quarters may not equal year-to-date diluted EPS. EPS figures for Utility Operations, Midstream Investments and Corporate and Other are non-GAAP financial measures. |
| (2) | Taxes are computed based on the impact removing such item would have on tax expense |
| (3) | Comprised of common stock of AT&T Inc. and Charter Communications, Inc. |
| (4) | Corporate and Other, plus income allocated to preferred shareholders |
4
| Year-to-Date June 30, 2021 |
||||||||||||||||||||||||||||||||
| Utility Operations | Midstream Investments | Corporate and Other (4) | Consolidated | |||||||||||||||||||||||||||||
| Dollars in millions |
Diluted EPS (1) |
Dollars in millions |
Diluted EPS (1) |
Dollars in millions |
Diluted EPS (1) |
Dollars in millions |
Diluted EPS (1) |
|||||||||||||||||||||||||
| Consolidated income (loss) available to common shareholders and diluted EPS(1) |
$ | 503 | $ | 0.84 | $ | 125 | $ | 0.21 | $ | (73 | ) | $ | (0.12 | ) | $ | 555 | $ | 0.93 | ||||||||||||||
| ZENS-related mark-to-market (gains) losses: |
||||||||||||||||||||||||||||||||
| Marketable securities (net of taxes of $11)(2)(3) |
— | — | — | — | (41 | ) | (0.07 | ) | (41 | ) | (0.07 | ) | ||||||||||||||||||||
| Indexed debt securities (net of taxes of $10)(3) |
— | — | — | — | 41 | 0.07 | 41 | 0.07 | ||||||||||||||||||||||||
| Impacts associated with the Vectren merger (net of taxes of $1)(2) |
4 | 0.01 | — | — | — | — | 4 | 0.01 | ||||||||||||||||||||||||
| Impacts associated with gas LDC sales(2) |
(11 | ) | (0.02 | ) | — | — | (6 | ) | (0.01 | ) | (17 | ) | (0.03 | ) | ||||||||||||||||||
| Cost associated with the early extinguishment of debt (net of taxes of $7)(2) |
— | — | — | — | 27 | 0.05 | 27 | 0.05 | ||||||||||||||||||||||||
| Corporate and Other Allocation |
(46 | ) | (0.07 | ) | (6 | ) | (0.01 | ) | 52 | 0.08 | — | — | ||||||||||||||||||||
|
|
|
|
|
|
|
|
|
|
|
|
|
|
|
|
|
|||||||||||||||||
| Consolidated on a non-GAAP basis |
$ | 450 | $ | 0.76 | $ | 119 | $ | 0.20 | $ | — | $ | — | $ | 569 | $ | 0.96 | ||||||||||||||||
|
|
|
|
|
|
|
|
|
|
|
|
|
|
|
|
|
|||||||||||||||||
| (1) | Quarterly diluted EPS on both a GAAP and non-GAAP basis are based on the weighted average number of shares of common stock outstanding during the quarter, and the sum of the quarters may not equal year-to-date diluted EPS. EPS figures for Utility Operations, Midstream Investments and Corporate and Other are non-GAAP financial measures. |
| (2) | Taxes are computed based on the impact removing such item would have on tax expense |
| (3) | Comprised of common stock of AT&T Inc. and Charter Communications, Inc. |
| (4) | Corporate and Other, plus income allocated to preferred shareholders |
5
| Quarter Ended June 30, 2020 |
||||||||||||||||||||||||||||||||||||||||
| Utility Operations | Midstream Investments |
Corporate and Other (6) |
CES(1) & CIS(2) (Disc. Operations) |
Consolidated | ||||||||||||||||||||||||||||||||||||
| Dollars in millions |
Diluted EPS (3) |
Dollars in millions |
Diluted EPS (3) |
Dollars in millions |
Diluted EPS (3) |
Dollars in millions |
Diluted EPS (3) |
Dollars in millions |
Diluted EPS (3) |
|||||||||||||||||||||||||||||||
| Consolidated income (loss) available to common shareholders and diluted EPS (3) |
$ | 136 | $ | 0.26 | $ | 24 | $ | 0.04 | $ | (71 | ) | $ | (0.13 | ) | $ | (30 | ) | $ | (0.06 | ) | $ | 59 | $ | 0.11 | ||||||||||||||||
| Timing effects impacting CES (1): |
||||||||||||||||||||||||||||||||||||||||
| Mark-to-market
(gains) losses (net of |
— | — | — | — | — | — | 25 | 0.05 | 25 | 0.05 | ||||||||||||||||||||||||||||||
| ZENS-related mark-to-market (gains) losses: |
||||||||||||||||||||||||||||||||||||||||
| Marketable securities (net of taxes of $15)(4)(5) |
— | — | — | — | (60 | ) | (0.12 | ) | — | — | (60 | ) | (0.12 | ) | ||||||||||||||||||||||||||
| Indexed debt securities (net of taxes of $15)(4) |
— | — | — | — | 61 | 0.12 | — | — | 61 | 0.12 | ||||||||||||||||||||||||||||||
| Impacts associated with the Vectren merger (net of taxes of $1,$1)(4) |
3 | — | — | — | 4 | 0.01 | — | — | 7 | 0.01 | ||||||||||||||||||||||||||||||
| Severance costs (net of taxes of $0, $0)(4) |
1 | — | — | — | 1 | — | — | — | 2 | — | ||||||||||||||||||||||||||||||
| Impacts associated with the sales of CES(1) and CIS(2) (net of taxes of $38)(4) |
— | — | — | — | — | — | 4 | 0.01 | 4 | 0.01 | ||||||||||||||||||||||||||||||
| Impacts associated with Series C preferred stock |
||||||||||||||||||||||||||||||||||||||||
| Preferred stock dividend requirement and amortization of beneficial conversion feature |
— | — | — | — | 16 | 0.03 | — | — | 16 | 0.03 | ||||||||||||||||||||||||||||||
| Impact of increased share count on EPS if issued as common stock |
— | (0.01 | ) | — | — | — | — | — | — | — | (0.01 | ) | ||||||||||||||||||||||||||||
|
|
|
|
|
|
|
|
|
|
|
|
|
|
|
|
|
|
|
|
|
|||||||||||||||||||||
| Total Series C impacts |
— | (0.01 | ) | — | — | 16 | 0.03 | — | — | 16 | 0.02 | |||||||||||||||||||||||||||||
| Corporate and Other Allocation |
(38 | ) | (0.07 | ) | (9 | ) | (0.01 | ) | 49 | 0.09 | (2 | ) | (0.01 | ) | — | — | ||||||||||||||||||||||||
| Exclusion of Discontinued Operations(7) |
— | — | — | — | — | — | 3 | 0.01 | 3 | 0.01 | ||||||||||||||||||||||||||||||
|
|
|
|
|
|
|
|
|
|
|
|
|
|
|
|
|
|
|
|
|
|||||||||||||||||||||
| Consolidated on a non-GAAP basis |
$ | 102 | $ | 0.18 | $ | 15 | $ | 0.03 | $ | — | $ | — | $ | — | $ | — | $ | 117 | $ | 0.21 | ||||||||||||||||||||
|
|
|
|
|
|
|
|
|
|
|
|
|
|
|
|
|
|
|
|
|
|||||||||||||||||||||
| (1) | Energy Services segment |
| (2) | Infrastructure Services segment |
| (3) | Quarterly diluted EPS on both a GAAP and non-GAAP basis are based on the weighted average number of shares of common stock outstanding during the quarter, and the sum of the quarters may not equal year-to-date diluted EPS. EPS figures for Utility Operations, Midstream Investments, Corporate and Other and Discontinued Operations are non-GAAP financial measures. |
| (4) | Taxes are computed based on the impact removing such item would have on tax expense |
| (5) | Comprised of common stock of AT&T Inc. and Charter Communications, Inc. |
| (6) | Corporate and Other, plus income allocated to preferred shareholders |
| (7) | Results related to discontinued operations are excluded from the company’s non-GAAP results |
6
| Year-to-Date June 30, 2020 |
||||||||||||||||||||||||||||||||||||||||
| Utility Operations | Midstream Investments |
Corporate and Other (6) |
CES(1) & CIS(2) (Disc. Operations) |
Consolidated | ||||||||||||||||||||||||||||||||||||
| Dollars in millions |
Diluted EPS (3) |
Dollars in millions |
Diluted EPS (3) |
Dollars in millions |
Diluted EPS (3) |
Dollars in millions |
Diluted EPS (3) |
Dollars in millions |
Diluted EPS (3) |
|||||||||||||||||||||||||||||||
| Consolidated income (loss) available to common shareholders and diluted EPS (3) |
$ | 203 | $ | 0.39 | $ | (1,103 | ) | $ | (2.14 | ) | $ | (93 | ) | $ | (0.18 | ) | $ | (176 | ) | $ | (0.34 | ) | $ | (1,169 | ) | $ | (2.27 | ) | ||||||||||||
| Timing effects impacting CES (1): |
||||||||||||||||||||||||||||||||||||||||
| Mark-to-market (gains) losses (net of taxes of $3)(4) |
— | — | — | — | — | — | (10 | ) | (0.02 | ) | (10 | ) | (0.02 | ) | ||||||||||||||||||||||||||
| ZENS-related mark-to-market (gains) losses: |
||||||||||||||||||||||||||||||||||||||||
| Marketable securities (net of taxes of $15)(4)(5) |
— | — | — | — | 54 | 0.11 | — | — | 54 | 0.11 | ||||||||||||||||||||||||||||||
| Indexed debt securities (net of taxes of $13)(4) |
— | — | — | — | (46 | ) | (0.09 | ) | — | — | (46 | ) | (0.09 | ) | ||||||||||||||||||||||||||
| Impacts associated with the Vectren merger (net of taxes of $1,$2)(4) |
3 | 0.01 | — | — | 10 | 0.02 | — | — | 13 | 0.03 | ||||||||||||||||||||||||||||||
| Severance costs (net of taxes of $2, $0)(4) |
7 | 0.01 | — | — | 2 | — | — | — | 9 | 0.01 | ||||||||||||||||||||||||||||||
| Impacts associated with the sales of CES(1) and CIS(2) (net of taxes of $10)(4) |
— | — | — | — | — | — | 210 | 0.41 | 210 | 0.41 | ||||||||||||||||||||||||||||||
| Impacts associated with Series C preferred stock |
||||||||||||||||||||||||||||||||||||||||
| Preferred stock dividend requirement and amortization of beneficial conversion feature |
— | — | — | — | 16 | 0.03 | — | — | 16 | 0.03 | ||||||||||||||||||||||||||||||
| Impact of increased share count on EPS if issued as common stock |
— | (0.01 | ) | — | 0.07 | — | — | — | — | — | 0.06 | |||||||||||||||||||||||||||||
|
|
|
|
|
|
|
|
|
|
|
|
|
|
|
|
|
|
|
|
|
|||||||||||||||||||||
| Total Series C impacts |
— | (0.01 | ) | — | 0.07 | 16 | 0.03 | — | — | 16 | 0.09 | |||||||||||||||||||||||||||||
| Losses on impairment (net of taxes of $0, $379)(4) |
185 | 0.35 | 1,177 | 2.21 | — | — | — | — | 1,362 | 2.56 | ||||||||||||||||||||||||||||||
| Corporate and Other Allocation |
(43 | ) | (0.08 | ) | (10 | ) | (0.02 | ) | 57 | 0.11 | (4 | ) | (0.01 | ) | — | — | ||||||||||||||||||||||||
| Exclusion of Discontinued Operations(7) |
— | — | — | — | — | — | (20 | ) | (0.04 | ) | (20 | ) | (0.04 | ) | ||||||||||||||||||||||||||
|
|
|
|
|
|
|
|
|
|
|
|
|
|
|
|
|
|
|
|
|
|||||||||||||||||||||
| Consolidated on a non-GAAP basis |
$ | 355 | $ | 0.67 | $ | 64 | $ | 0.12 | $ | — | $ | — | $ | — | $ | — | $ | 419 | $ | 0.79 | ||||||||||||||||||||
|
|
|
|
|
|
|
|
|
|
|
|
|
|
|
|
|
|
|
|
|
|||||||||||||||||||||
| (1) | Energy Services segment |
| (2) | Infrastructure Services segment |
| (3) | Quarterly diluted EPS on both a GAAP and non-GAAP basis are based on the weighted average number of shares of common stock outstanding during the quarter, and the sum of the quarters may not equal year-to-date diluted EPS. EPS figures for Utility Operations, Midstream Investments, Corporate and Other and Discontinued Operations are non-GAAP financial measures. |
| (4) | Taxes are computed based on the impact removing such item would have on tax expense |
| (5) | Comprised of common stock of AT&T Inc. and Charter Communications, Inc. |
| (6) | Corporate and Other, plus income allocated to preferred shareholders |
| (7) | Results related to discontinued operations are excluded from the company’s non-GAAP results |
7
Filing of Form 10-Q for CenterPoint Energy, Inc.
Today, CenterPoint Energy, Inc. filed with the Securities and Exchange Commission (SEC) its Quarterly Report on Form 10-Q for the quarter ended June 30, 2021. A copy of that report is available on the company’s website, under the Investors section. Investors and others should note that we may announce material information using SEC filings, press releases, public conference calls, webcasts, and the Investor Relations page of our website. In the future, we will continue to use these channels to distribute material information about the company and to communicate important information about the company, key personnel, corporate initiatives, regulatory updates and other matters. Information that we post on our website could be deemed material; therefore we encourage investors, the media, our customers, business partners and others interested in our company to review the information we post on our website.
Webcast of Earnings Conference Call
CenterPoint Energy’s management will host an earnings conference call on Thursday, August 5, 2021, at 7:00 a.m. Central time/8:00 a.m. Eastern time. Interested parties may listen to a live audio broadcast of the conference call on the company’s website under the Investors section. A replay of the call can be accessed approximately two hours after the completion of the call and will be archived on the website for at least one year.
About CenterPoint Energy, Inc.
As the only investor owned electric and gas utility based in Texas, CenterPoint Energy, Inc. (NYSE: CNP) is an energy delivery company with electric transmission and distribution, power generation and natural gas distribution operations that serve more than 7 million metered customers in Arkansas, Indiana, Louisiana, Minnesota, Mississippi, Ohio, Oklahoma and Texas. As of June 30, 2021, the company owned approximately $36 billion in assets and also owned 53.7 percent of the common units representing limited partner interests in Enable Midstream Partners, LP, a publicly traded master limited partnership that owns, operates and develops strategically located natural gas and crude oil infrastructure assets. With approximately 9,500 employees, CenterPoint Energy and its predecessor companies have been in business for more than 150 years. For more information, visit CenterPointEnergy.com.
Forward-looking Statements
This news release includes, and the earnings conference call will include, forward-looking statements within the meaning of the Private Securities Litigation Reform Act of 1995. When used in this news release, the words “anticipate,” “believe,” “continue,” “could,” “estimate,” “expect,” “forecast,” “goal,” “intend,” “may,” “objective,” “plan,” “potential,” “predict,” “projection,” “should,” “target,” “will” or other similar words are intended to identify forward-looking statements. These forward-looking statements are based upon assumptions of management which are believed to be reasonable at the time made and are subject to significant risks and uncertainties. Actual events and results may differ materially from those expressed or implied by these forward-looking statements. Any statements in this news release or on the earnings conference call regarding capital investments, the reopening of the economy, rate base growth and our ability to achieve it, our Analyst Day, future earnings and guidance, including long-term growth rate, and future financial performance and results of operations, including with respect to regulatory actions, the expected closing of, or proceeds from the merger between Enable and Energy Transfer or the sale of our Arkansas and Oklahoma gas LDC businesses, customer rate affordability, value creation, opportunities and expectations, ESG strategy, including transition to Net-Zero, or ESG plan rollout and any other statements that are not historical facts are forward-looking statements. Each forward-looking statement contained in this news release or discussed on the earnings conference call speaks only as of the date of this release or the earnings conference call.
Important factors that could cause actual results to differ materially from those indicated by the provided forward-looking information include, but are not limited to, risks and uncertainties relating to: (1) the performance of Enable, the amount of cash distributions CenterPoint Energy receives from Enable, and the value of CenterPoint Energy’s interest in Enable; (2) the integration of the businesses acquired in the merger with Vectren Corporation (Vectren), including the integration of technology systems, and the ability to realize additional benefits and commercial opportunities from the merger;
8
(3) financial market and general economic conditions, including access to debt and equity capital and the effect on sales, prices and costs; (4) industrial, commercial and residential growth in CenterPoint Energy’s service territories and changes in market demand; (5) actions by credit rating agencies, including any potential downgrades to credit ratings; (6) the timing and impact of regulatory proceedings and actions and legal proceedings, including those related to the February 2021 winter storm event; (7) legislative decisions, including tax and developments related to the environment such as global climate change, air emissions, carbon, waste water discharges and the handling of coal combustion residuals, among others, and CenterPoint Energy’s carbon reduction targets; (8) the impact of the COVID-19 pandemic; (9) the recording of impairment charges, including any impairments related to CenterPoint Energy’s investment in Enable; (10) weather variations and CenterPoint Energy’s ability to mitigate weather impacts, including impacts from the February 2021 winter storm event; (11) changes in business plans; (12) CenterPoint Energy’s ability to fund and invest planned capital, and timely and appropriate rate actions that allow recovery of costs and a reasonable return on investment, including costs associated with the February 2021 winter storm event; (13) CenterPoint Energy’s or Enable’s potential business strategies and strategic initiatives, restructurings, joint ventures and acquisitions or dispositions of assets or businesses, including the announced sale of our Natural Gas businesses in Arkansas and Oklahoma, which may not be completed or result in the benefits anticipated by CenterPoint Energy, and the proposed merger between Enable and Energy Transfer, which may not be completed or result in the benefits anticipated by CenterPoint Energy or Enable; (14) CenterPoint Energy’s ability to execute operations and maintenance management initiatives; and (15) other factors discussed in CenterPoint Energy’s Quarterly Reports on Form 10-Q for the quarters ended March 31, 2021 and June 30, 2021 and 2020 Form 10-K, including in the “Risk Factors” and “Cautionary Statement Regarding Forward-Looking Information” sections of such reports, and other reports CenterPoint Energy or its subsidiaries may file from time to time with the Securities and Exchange Commission.
9

SECOND QUARTER 2021 INVESTOR UPDATE
August 5,
2021
Exhibit 99.2
This presentation and the oral statements made in connection herewith contain “forward-looking statements” within the meaning
of Section 27A of the Securities Act of 1933 and Section 21E of the Securities Exchange Act of 1934. All statements other than statements of historical fact included in this presentation and the oral statements made in connection herewith
are forward-looking statements made in good faith by CenterPoint Energy, Inc. (“CenterPoint Energy” or the “Company”) and are intended to qualify for the safe harbor from liability established by the Private Securities Litigation
Reform Act of 1995, including statements concerning CenterPoint Energy’s expectations, beliefs, plans, objectives, goals, strategies, future operations, events, financial position, earnings and guidance, growth, impact of COVID-19, costs, prospects, capital investments or performance or underlying assumptions and other statements that are not historical facts. You should not place undue reliance on forward-looking statements. You can
generally identify our forward-looking statements by the words “anticipate,” “believe,” “continue,” “could,” “estimate,” “expect,” “forecast,” “goal,”
“intend,” “may,” “objective,” “plan,” “potential,” “predict,” “projection,” “should,” “target,” “will,” or other similar words. The absence of these
words, however, does not mean that the statements are not forward-looking.
Examples of forward-looking statements in this presentation include statements about our
growth and guidance (including earnings and customer growth, capital investment and related opportunities, utility and rate base growth expectations, taking into account assumptions and scenarios related to
COVID-19), the impacts of COVID-19 on our business, the impacts of the February 2021 winter storm event on our business and service territories, O&M expense
management initiatives and projected savings therefrom, the performance of Enable Midstream Partners, LP (“Enable”), including anticipated distributions received on its common units, the announced merger of Enable and Energy Transfer LP
(“Energy Transfer”) and minimizing our exposure to midstream, our regulatory filings and projections (including timing and amount of recovery of natural gas costs associated with the February 2021 winter storm event), the reopening of the
economy, our Analyst Day, our credit quality, financing plan and balance sheet expectations, the announced sale of our Natural Gas businesses in Arkansas and Oklahoma, anticipated benefits from recent legislation, and environmental, social and
governance related matters, including our carbon emissions reduction targets. We have based our forward-looking statements on our management’s beliefs and assumptions based on information currently available to our management at the time the
statements are made. We caution you that assumptions, beliefs, expectations, intentions, and projections about future events may and often do vary materially from actual results. Therefore, we cannot assure you that actual results will not differ
materially from those expressed or implied by our forward-looking statements.
Some of the factors that could cause actual results to differ from those expressed or
implied by our forward-looking statements include, but are not limited to, risks and uncertainties relating to: (1) the performance of Enable, the amount of cash distributions CenterPoint Energy receives from Enable, and the value of
CenterPoint Energy’s interest in Enable; (2) the integration of the businesses acquired in the merger with Vectren Corporation (Vectren), including the integration of technology systems, and the ability to realize additional benefits and
commercial opportunities from the merger; (3) financial market and general economic conditions, including access to debt and equity capital and the effect on sales, prices and costs; (4) industrial, commercial and residential growth in
CenterPoint Energy’s service territories and changes in market demand; (5) actions by credit rating agencies, including any potential downgrades to credit ratings; (6) the timing and impact of regulatory proceedings and actions and
legal proceedings, including those related to the February 2021 winter storm event; (7) legislative decisions, including tax and developments related to the environment such as global climate change, air emissions, carbon, waste water
discharges and the handling of coal combustion residuals, among others, and CenterPoint Energy’s carbon reduction targets; (8) the impact of the COVID-19 pandemic; (9) the recording of
impairment charges, including any impairments related to CenterPoint Energy’s investment in Enable; (10) weather variations and CenterPoint Energy’s ability to mitigate weather impacts, including impacts from the February 2021 winter
storm event; (11) changes in business plans; (12) CenterPoint Energy’s ability to fund and invest planned capital, and timely and appropriate rate actions that allow recovery of costs and a reasonable return on investment, including
timing and amount of costs associated with the February 2021 winter storm event recovered; (13) CenterPoint Energy’s or Enable’s potential business strategies and strategic initiatives, restructurings, joint ventures and acquisitions
or dispositions of assets or businesses, including the announced sale of our Natural Gas businesses in Arkansas and Oklahoma, which may not be completed or result in the benefits anticipated by CenterPoint Energy, and the proposed merger between
Enable and Energy Transfer, which may not be completed or result in the benefits anticipated by CenterPoint Energy or Enable; (14) CenterPoint Energy’s ability to execute operations and maintenance management initiatives; and
(15) other factors described in CenterPoint Energy’s Form 10-Q for the quarters ended March 31, 2021 and June 30, 2021 and Form 10-K for the year
ended December 31, 2020, including under “Risk Factors,” “Cautionary Statements Regarding Forward-Looking Information” and “Management’s Discussion and Analysis of Financial Condition and Results of
Operations—Certain Factors Affecting Future Earnings” in such reports and in other filings with the Securities and Exchange Commission’s (“SEC”) by the Company, which can be found at www.centerpointenergy.com on the Investor
Relations page or on the SEC website at www.sec.gov.
This presentation contains time sensitive information that is accurate as of the date hereof (unless otherwise
specified as accurate as of another date). Some of the information in this presentation is unaudited and may be subject to change. We undertake no obligation to update the information presented herein except as required by law. Investors and others
should note that we may announce material information using SEC filings, press releases, public conference calls, webcasts and the Investor Relations page of our website. In the future, we will continue to use these channels to distribute material
information about the Company and to communicate important information about the Company, key personnel, corporate initiatives, regulatory updates and other matters. Information that we post on our website could be deemed material; therefore, we
encourage investors, the media, our customers, business partners and others interested in our Company to review the information we post on our website.
Use of Non-GAAP Financial Measures
In addition to presenting its financial results in accordance with generally accepted accounting
principles (GAAP), including presentation of income (loss) available to common shareholders and diluted earnings (loss) per share, the Company also provides guidance based on non-GAAP income and non-GAAP diluted earnings per share. Generally, a non-GAAP financial measure is a numerical measure of a company’s historical or future financial performance that
excludes or includes amounts that are not normally excluded or included in the most directly comparable GAAP financial measure. Please refer to the Appendix for detailed discussion of the use of non-GAAP
financial measures presented herein. 2 Cautionary Statement and Other Disclaimers
\
Measurable Progress in 1 Year
Former CNP Current
CNP
(1) Increased guidance
5%—7% (1)
Utility EPS Growth / Comp vs. Peers 6%—8%
(In line with peer average) (2) (Top decile)
Capital Plan / Rate base growth $13B $16B+
(7.5% Rate Base CAGR) (3) (10%
Rate Base CAGR) (4)
Target 1%—2% YoY reduction Kept O&M flat YoY or Cost Control with opportunity for reactionary cost reduction reinvestments
Regulatory Relationships Needed to strengthen Established foundation for regulatory relationships constructive relationships
Enable Midstream Did not execute Supported a transaction to midstream exit allow for future midstream exit
Executing on generation plan of Renewables in our Portfolio Finalizing IRP process in 1GW of renewables; Natural Gas Indiana Innovation Act expected to provide additional
opportunities
Note: Refer to slide 2 for information on forward-looking statements and slide 18 for information on non-GAAP
Utility EPS assumptions and non-GAAP measures. (1) Represents projected non-GAAP Utility EPS annual growth rate from 2020 to 2025 (2) CNP long-term EPS growth
guidance as compared to long-term EPS growth consensus estimates for peers listed in CNP’s 2021 annual proxy statement
(3) Refers to capital expenditure plan
for 2020E to 2024E and rate base compound annual growth rate from 2019 to 2024E 3 (4) Refers to capital expenditure plan for 2021E to 2025E and rate base compound annual growth rate from 2020 to 2025E
Q2 2021 v Q2 2020 Non-GAAP EPS (1) Primary Drivers
Growth COVID One-time 2020 Midstream, Ongoing and Rate and Misc. Tax Equity incl. tax Cost Mgmt (2) Recovery Revenue Change Issuance
change
$0.36
$0.03 $0.02 $0.02 (2) Midstream (3) $0.03 $0.08
$0.08 $0.04 $0.03
$0.21
Midstream (3) Electric Electric Electric $0.03
$0.01 Customer ï±$0.01 O&M
$0.03 COVID growth Management impact from 2020
Utility
$0.03 Rate
ï±$0.01 Interest Natural Gas $0.28 recovery Expense $0.03 COVID
±$0.01 D&A Natural Gas impact from 2020 Utility Natural Gas±$0.02
O&M $0.02 Misc. $0.18 $0.01 Rate Management revenue recovery Corporate
$0.01 Interest Expense
Q2 2020 Non-GAAP Q2 2021 Non-GAAP
EPS Projected 6%—8% Non-GAAP Utility EPS Long-term Growth (4) EPS
Note: Refer to slide 2 for information on forward-looking statements and slide 18 for information on non-GAAP Utility EPS assumptions and non-GAAP measures (1) Refer to slide 12 and slide 14 for reconciliation to GAAP measures (2) Represents $15M of tax benefit from NOL rule change in Louisiana in Utility EPS and $13M of tax benefit from tax
rate change in Oklahoma in Midstream EPS
(3) Reference Enable’s Q2 2021 Form 10-Q and second quarter 2021 earnings
materials dated August 4, 2021. Includes the effect of share dilution and associated allocation of Corporate & Other based upon 4 relative earnings contribution.
(4) Refers to projected non-GAAP Utility EPS annual growth rate for 2021E – 2025E
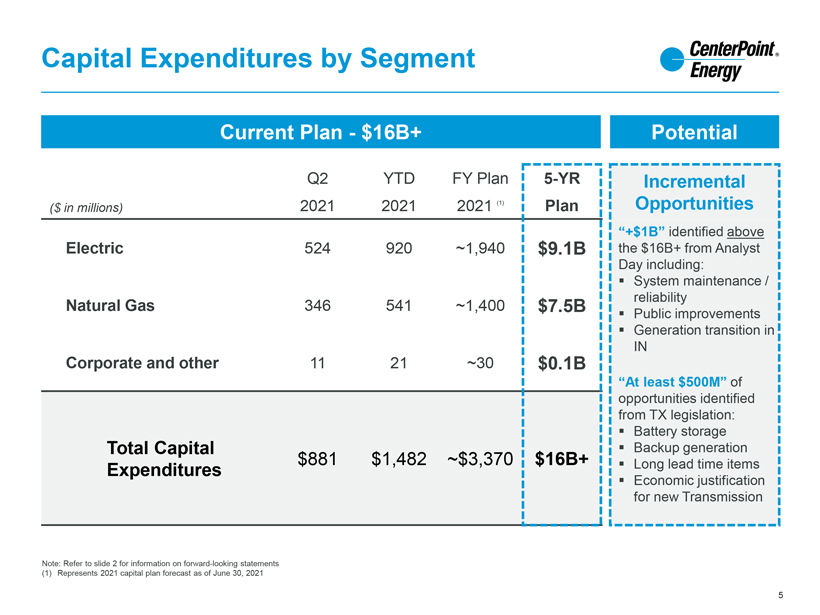
Capital Expenditures by Segment
Current
Plan—$16B+ Potential
Q2 YTD FY Plan 5-YR Incremental
($ in millions) 2021 2021 2021 (1) Plan Opportunities
“+$1B” identified above
Electric 524 920 ~1,940 $9.1B the $16B+ from Analyst Day including:,§ System maintenance /
Natural Gas 346 541 ~1,400 $7.5B reliability
,§ Public improvements,§ Generation transition in
Corporate and IN other 11 21 ~30
$0.1B
“At least $500M” of opportunities identified from TX legislation:,§ Battery storage Total Capital ,§ Backup generation $881 $1,482
~$3,370 $16B+,§ Long lead time items
Expenditures
,§ Economic
justification for new Transmission
Note: Refer to slide 2 for information on forward-looking statements (1) Represents 2021 capital plan forecast as of
June 30, 2021
5
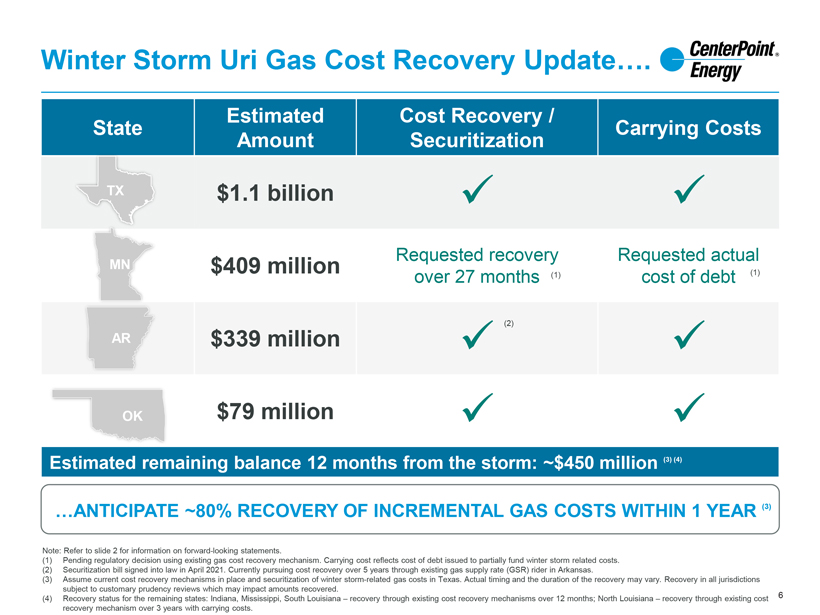
Winter Storm Uri Gas Cost Recovery Update.
Estimated Cost Recovery /
State Carrying Costs Amount Securitization
TX $1.1 billionƒ¼ƒ¼
Requested recovery Requested actual
MN $409 million
over 27 months (1) cost of debt (1)
(2)
AR $339 millionƒ¼ƒ¼ OK $79 millionƒ¼ƒ¼
Estimated remaining balance 12 months from the storm: ~$450 million (3) (4)
ANTICIPATE
~80% RECOVERY OF INCREMENTAL GAS COSTS WITHIN 1 YEAR (3)
Note: Refer to slide 2 for information on forward-looking statements.
(1) Pending regulatory decision using existing gas cost recovery mechanism. Carrying cost reflects cost of debt issued to partially fund winter storm related costs.
(2) Securitization bill signed into law in April 2021. Currently pursuing cost recovery over 5 years through existing gas supply rate (GSR) rider in Arkansas.
(3) Assume current cost recovery mechanisms in place and securitization of winter storm-related gas costs in Texas. Actual timing and the duration of the recovery
may vary. Recovery in all jurisdictions subject to customary prudency reviews which may impact amounts recovered.
(4) Recovery status for the remaining states:
Indiana, Mississippi, South Louisiana – recovery through existing cost recovery mechanisms over 12 months; North Louisiana – recovery through existing cost 6 recovery mechanism over 3 years with carrying costs.
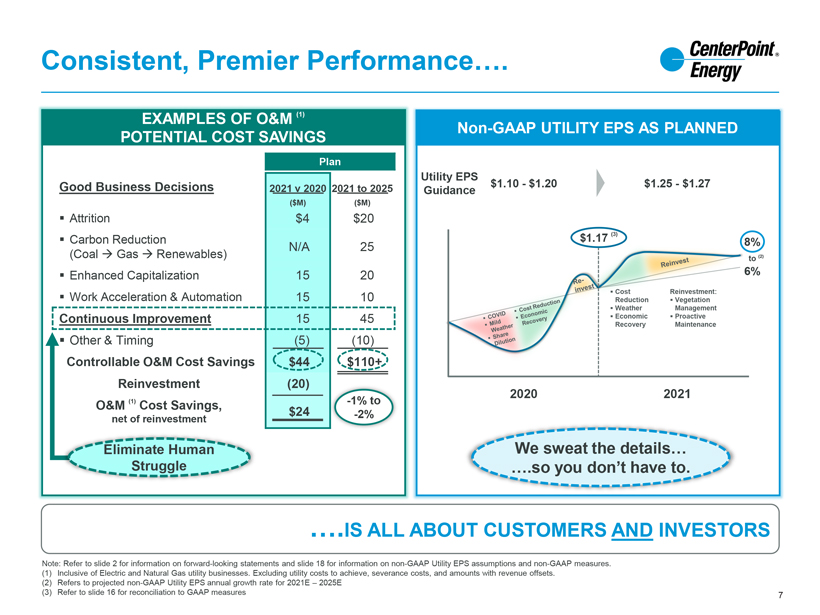
Consistent, Premier Performance….
EXAMPLES OF
O&M POTENTIAL COST SAVINGS
(1) Non-GAAP UTILITY EPS AS PLANNED
Plan
Utility EPS Guidance
Good Business Decisions 2021 v 2020 2021 to 2025 $1.10—$1.20 $1.25—$1.27
($M) ($M)
Attrition $4 $20
Carbon Reduction (Coal Gas Renewables) $1.17 (3)
N/A 25 8%
to (2)ï,§ Enhanced Capitalization 15 20 6% Work
Acceleration & Automation 15 10ï,§
Reduction Vegetation Weather Management
Continuous Improvement 15 45 Economic Proactive
Recovery Maintenance
Other & Timing (5) (10)
Controllable O&M Cost Savings $44 $110+ Reinvestment (20)
2020 2021 O&M (1) Cost Savings, -1% to
$24 -2%
net of reinvestment
Eliminate Human We sweat the details… Struggle ….so you don’t have to.
….IS ALL ABOUT CUSTOMERS AND INVESTORS
Note: Refer to slide 2 for
information on forward-looking statements and slide 18 for information on non-GAAP Utility EPS assumptions and non-GAAP measures. (1) Inclusive of Electric and
Natural Gas utility businesses. Excluding utility costs to achieve, severance costs, and amounts with revenue offsets.
(2) Refers to projected non-GAAP Utility EPS annual growth rate for 2021E – 2025E
(3) Refer to slide 16 for reconciliation to GAAP measures 7
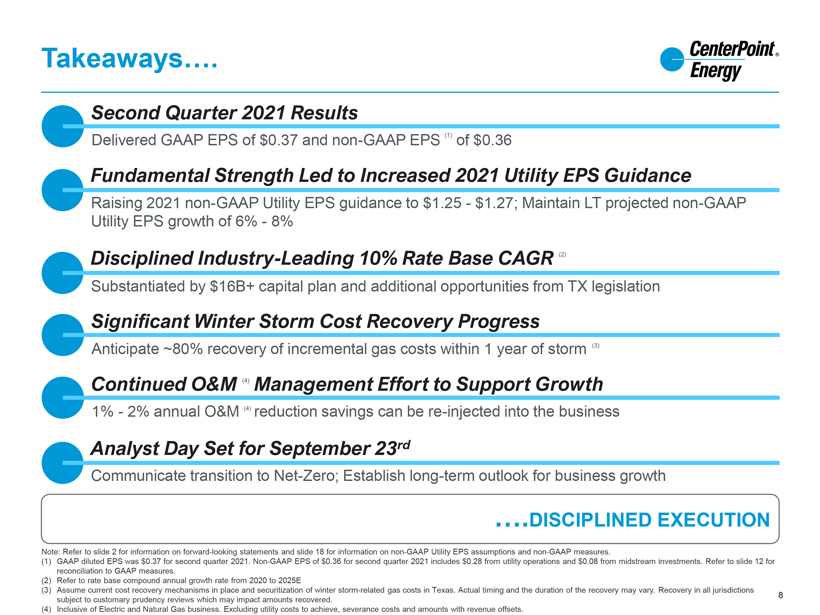
Takeaways….
Second Quarter 2021 Results
Delivered GAAP EPS of $0.37 and non-GAAP EPS (1) of $0.36
Fundamental Strength Led to Increased 2021 Utility EPS Guidance
Raising 2021 non-GAAP Utility EPS guidance to $1.25—$1.27; Maintain LT projected
non-GAAP Utility EPS growth of 6%—8%
Disciplined Industry-Leading 10% Rate Base CAGR (2)
Substantiated by $16B+ capital plan and
additional opportunities from TX legislation
Significant Winter Storm Cost Recovery Progress
Anticipate ~80% recovery of incremental gas costs within 1 year of storm (3)
Continued O&M
(4) Management Effort to Support Growth
1%—2% annual O&M (4) reduction savings can be re-injected into the
business
Analyst Day Set for September 23rd
Communicate transition to Net-Zero; Establish long-term outlook for business growth
….DISCIPLINED EXECUTION
Note: Refer to slide 2 for information on forward-looking statements and slide 18 for information on non-GAAP Utility EPS assumptions and non-GAAP measures.
(1) GAAP diluted EPS was $0.37 for second quarter 2021. Non-GAAP EPS
of $0.36 for second quarter 2021 includes $0.28 from utility operations and $0.08 from midstream investments. Refer to slide 12 for reconciliation to GAAP measures.
(2) Refer to rate base compound annual growth rate from 2020 to 2025E
(3)
Assume current cost recovery mechanisms in place and securitization of winter storm-related gas costs in Texas. Actual timing and the duration of the recovery may vary. Recovery in all jurisdictions subject to customary prudency reviews which may
impact amounts recovered. 8 (4) Inclusive of Electric and Natural Gas business. Excluding utility costs to achieve, severance costs and amounts with revenue offsets.

THANK YOU FOR YOUR SUPPORT
Contacts
Philip Holder Jackie Richert Panpim Lohachala
Senior Vice President Director Manager Strategic
Planning and Investor Relations Investor Relations Investor Relations Tel. (713) 207 – 7792 Tel. (713) 207 – 9380 Tel. (713) 207 – 7961 [email protected] [email protected]
[email protected]
9

Appendix
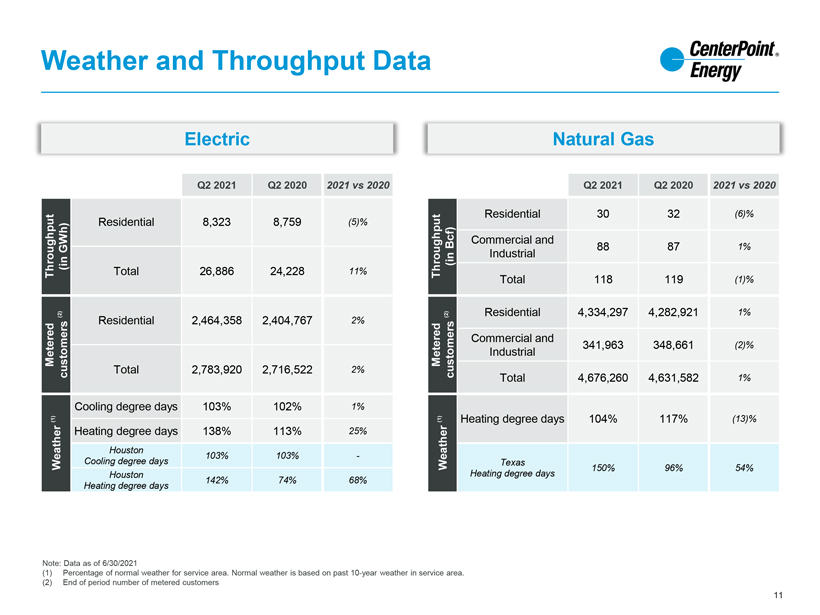
Weather and Throughput Data
Electric Natural Gas
Q2 2021 Q2 2020 2021 vs 2020 Q2 2021 Q2 2020 2021 vs 2020
Residential 30 32
(6)% Residential 8,323 8,759 (5)% Bcf) Commercial and
88 87 1%
GWh)
(in (in Industrial
Throughput Total 26,886 24,228 11% Throughput
Total 118 119 (1)%
(2) (2) Residential 4,334,297 4,282,921 1% Residential 2,464,358 2,404,767
2% Commercial and 341,963 348,661 (2)%
Metered Metered Industrial customers Total 2,783,920 2,716,522 2% customers
Total 4,676,260 4,631,582 1%
Cooling degree days 103% 102% 1%
(1)(1) Heating degree days 104% 117% (13)% Heating degree days 138% 113% 25% Houston 103% 103% -Weather Cooling degree days Weather Texas 150% 96% 54% Houston Heating degree days
142% 74% 68% Heating degree days
Note: Data as of 6/30/2021
(1) Percentage of
normal weather for service area. Normal weather is based on past 10-year weather in service area. (2) End of period number of metered customers
11
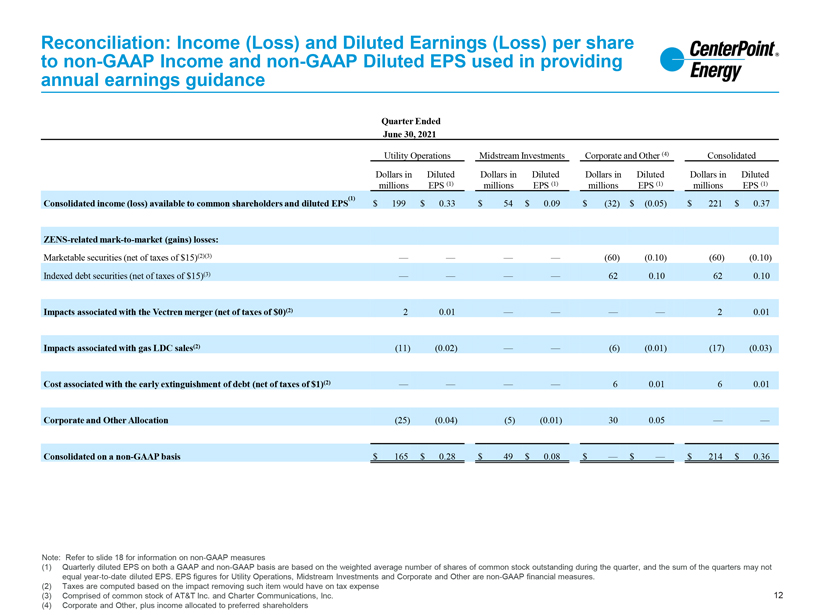
Reconciliation: Income (Loss) and Diluted Earnings (Loss) per share to non-GAAP Income and non-GAAP Diluted EPS used in providing annual earnings guidance Quarter Ended June 30, 2021 Utility Operations Midstream Investments Corporate and Other (4) Consolidated Dollars in Diluted Dollars in Diluted Dollars in Diluted Dollars in Diluted millions EPS (1) millions EPS (1) millions EPS (1) millions EPS (1) income (loss) available to common shareholders (1) Consolidated and diluted EPS $ 199 $ 0.33 $ 54 $ 0.09 $ (32) $ (0.05) $ 221 $ 0.37 ZENS-related mark-to-market (gains) losses: Marketable securities (net of taxes of $15)(2)(3) — — — — (60) (0.10) (60) (0.10) Indexed debt securities (net of taxes of $15)(3) — — — — 62 0.10 62 0.10 Impacts associated with the Vectren merger (net of taxes of $0)(2) 2 0.01 — — — — 2 0.01 Impacts associated with gas LDC sales(2) (11) (0.02) — — (6) (0.01) (17) (0.03) Cost associated with the early extinguishment of debt (net of taxes of $1)(2) — — — — 6 0.01 6 0.01 Corporate and Other Allocation (25) (0.04) (5) (0.01) 30 0.05 — —Consolidated on a non-GAAP basis $ 165 $ 0.28 $ 49 $ 0.08 $ — $ — $ 214 $ 0.36 Note: Refer to slide 18 for information on non-GAAP measures (1) Quarterly diluted EPS on both a GAAP and non-GAAP basis are based on the weighted average number of shares of common stock outstanding during the quarter, and the sum of the quarters may not equal year-to-date diluted EPS. EPS figures for Utility Operations, Midstream Investments and Corporate and Other are non-GAAP financial measures. (2) Taxes are computed based on the impact removing such item would have on tax expense 12 (3) Comprised of common stock of AT&T Inc. and Charter Communications, Inc. (4) Corporate and Other, plus income allocated to preferred shareholders
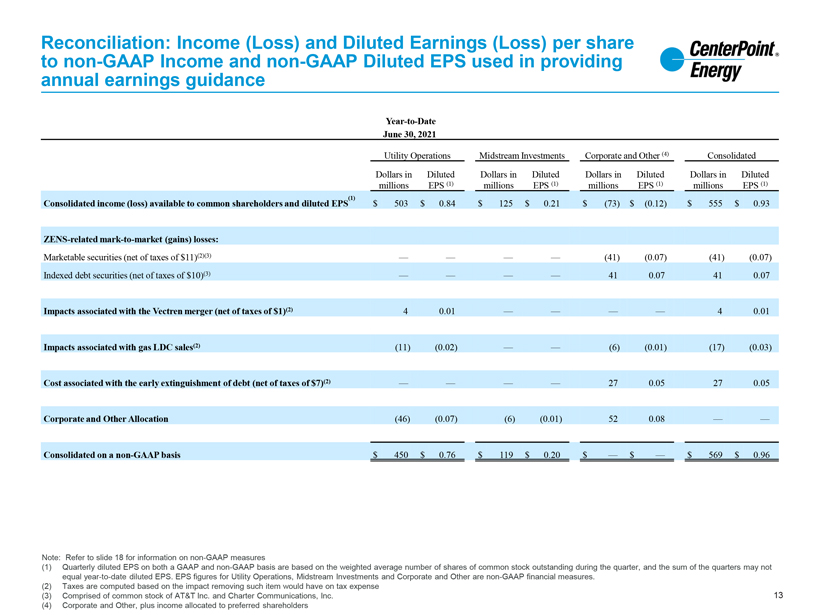
Reconciliation: Income (Loss) and Diluted Earnings (Loss) per share to non-GAAP Income and non-GAAP Diluted EPS used in providing annual earnings guidance Year-to-Date June 30, 2021 Utility Operations Midstream Investments Corporate and Other (4) Consolidated Dollars in Diluted Dollars in Diluted Dollars in Diluted Dollars in Diluted millions EPS (1) millions EPS (1) millions EPS (1) millions EPS (1) (1) Consolidated income (loss) available to common shareholders and diluted EPS $ 503 $ 0.84 $ 125 $ 0.21 $ (73) $ (0.12) $ 555 $ 0.93 ZENS-related mark-to-market (gains) losses: Marketable securities (net of taxes of $11)(2)(3) — — — — (41) (0.07) (41) (0.07) Indexed debt securities (net of taxes of $10)(3) — — — — 41 0.07 41 0.07 Impacts associated with the Vectren merger (net of taxes of $1)(2) 4 0.01 — — — — 4 0.01 Impacts associated with gas LDC sales(2) (11) (0.02) — — (6) (0.01) (17) (0.03) Cost associated with the early extinguishment of debt (net of taxes of $7)(2) — — — — 27 0.05 27 0.05 Corporate and Other Allocation (46) (0.07) (6) (0.01) 52 0.08 — —Consolidated on a non-GAAP basis $ 450 $ 0.76 $ 119 $ 0.20 $ — $ — $ 569 $ 0.96 Note: Refer to slide 18 for information on non-GAAP measures (1) Quarterly diluted EPS on both a GAAP and non-GAAP basis are based on the weighted average number of shares of common stock outstanding during the quarter, and the sum of the quarters may not equal year-to-date diluted EPS. EPS figures for Utility Operations, Midstream Investments and Corporate and Other are non-GAAP financial measures. (2) Taxes are computed based on the impact removing such item would have on tax expense 13 (3) Comprised of common stock of AT&T Inc. and Charter Communications, Inc. (4) Corporate and Other, plus income allocated to preferred shareholders
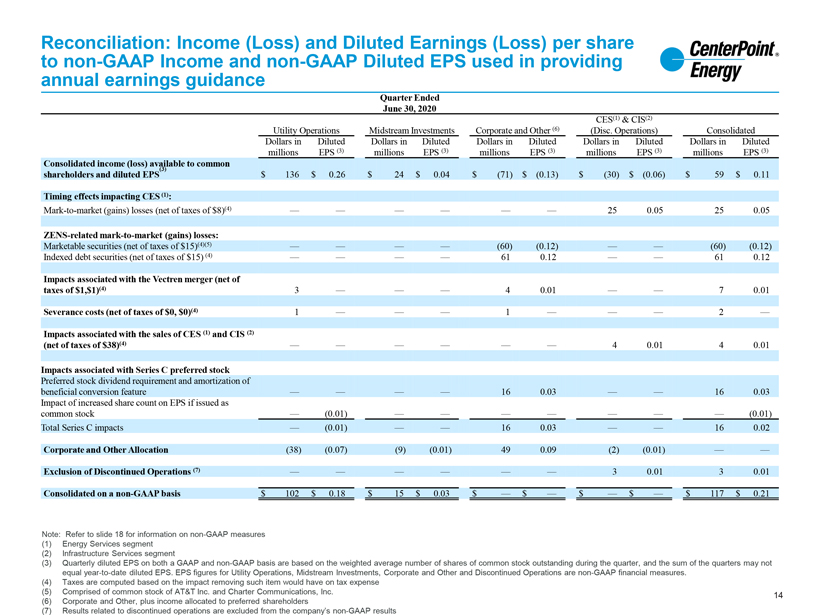
Reconciliation: Income (Loss) and Diluted Earnings (Loss) per share to non-GAAP Income and non-GAAP Diluted EPS used in providing annual earnings guidance Quarter Ended June 30, 2020 CES(1) & CIS(2) Utility Operations Midstream Investments Corporate and Other (6) (Disc. Operations) Consolidated Dollars in Diluted Dollars in Diluted Dollars in Diluted Dollars in Diluted Dollars in Diluted millions EPS (3) millions EPS (3) millions EPS (3) millions EPS (3) millions EPS (3) Consolidated income (loss) available to common shareholders and diluted EPS(3) $ 136 $ 0.26 $ 24 $ 0.04 $ (71) $ (0.13) $ (30) $ (0.06) $ 59 $ 0.11 Timing effects impacting CES (1): Mark-to-market (gains) losses (net of taxes of $8)(4) — — — — — — 25 0.05 25 0.05 ZENS-related mark-to-market (gains) losses: Marketable securities (net of taxes of $15)(4)(5) — — — — (60) (0.12) — — (60) (0.12) Indexed debt securities (net of taxes of $15) (4) — — — — 61 0.12 — — 61 0.12 Impacts associated with the Vectren merger (net of taxes of $1,$1)(4) 3 — — — 4 0.01 — — 7 0.01 Severance costs (net of taxes of $0, $0)(4) 1 — — — 1 — — — 2 — Impacts associated with the sales of CES (1) and CIS (2) (net of taxes of $38)(4) — — — — — — 4 0.01 4 0.01 Impacts associated with Series C preferred stock Preferred stock dividend requirement and amortization of beneficial conversion feature — — — — 16 0.03 — — 16 0.03 Impact of increased share count on EPS if issued as common stock — (0.01) — — — — — — — (0.01) Total Series C impacts — (0.01) — — 16 0.03 — — 16 0.02 Corporate and Other Allocation (38) (0.07) (9) (0.01) 49 0.09 (2) (0.01) — — Exclusion of Discontinued Operations (7) — — — — — — 3 0.01 3 0.01 Consolidated on a non-GAAP basis $ 102 $ 0.18 $ 15 $ 0.03 $ — $ — $ — $ — $ 117 $ 0.21 Note: Refer to slide 18 for information on non-GAAP measures (1) Energy Services segment (2) Infrastructure Services segment (3) Quarterly diluted EPS on both a GAAP and non-GAAP basis are based on the weighted average number of shares of common stock outstanding during the quarter, and the sum of the quarters may not equal year-to-date diluted EPS. EPS figures for Utility Operations, Midstream Investments, Corporate and Other and Discontinued Operations are non-GAAP financial measures. (4) Taxes are computed based on the impact removing such item would have on tax expense (5) Comprised of common stock of AT&T Inc. and Charter Communications, Inc. 14 (6) Corporate and Other, plus income allocated to preferred shareholders (7) Results related to discontinued operations are excluded from the company’s non-GAAP results
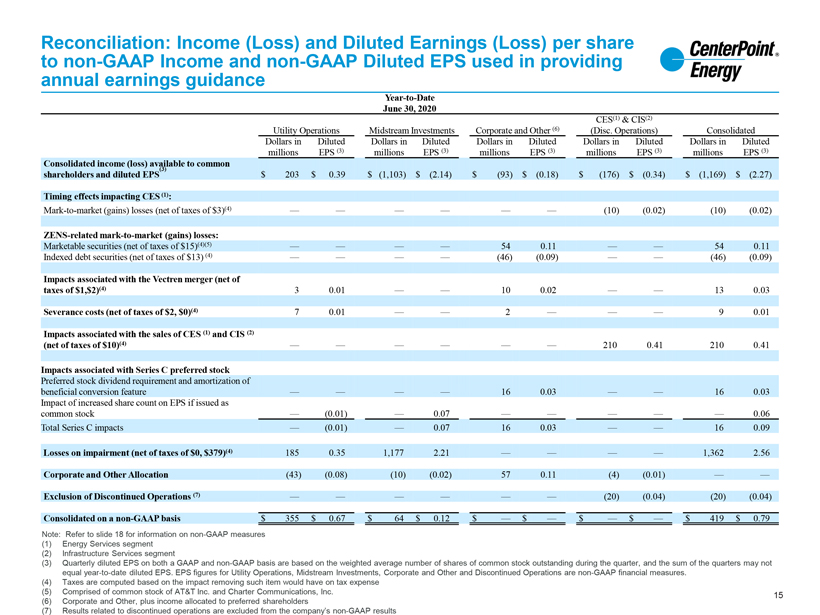
Reconciliation: Income (Loss) and Diluted Earnings (Loss) per share to non-GAAP Income and non-GAAP Diluted EPS used in providing annual earnings guidance Year-to-Date June 30, 2020 CES(1) & CIS(2) Utility Operations Midstream Investments Corporate and Other (6) (Disc. Operations) Consolidated Dollars in Diluted Dollars in Diluted Dollars in Diluted Dollars in Diluted Dollars in Diluted millions EPS (3) millions EPS (3) millions EPS (3) millions EPS (3) millions EPS (3) Consolidated income (loss) available to common shareholders and diluted EPS(3) $ 203 $ 0.39 $ (1,103) $ (2.14) $ (93) $ (0.18) $ (176) $ (0.34) $ (1,169) $ (2.27) Timing effects impacting CES (1): Mark-to-market (gains) losses (net of taxes of $3)(4) — — — — — — (10) (0.02) (10) (0.02) ZENS-related mark-to-market (gains) losses: Marketable securities (net of taxes of $15)(4)(5) — — — — 54 0.11 — — 54 0.11 Indexed debt securities (net of taxes of $13) (4) — — — — (46) (0.09) — — (46) (0.09) Impacts associated with the Vectren merger (net of taxes of $1,$2)(4) 3 0.01 — — 10 0.02 — — 13 0.03 Severance costs (net of taxes of $2, $0)(4) 7 0.01 — — 2 — — — 9 0.01 Impacts associated with the sales of CES (1) and CIS (2) (net of taxes of $10)(4) — — — — — — 210 0.41 210 0.41 Impacts associated with Series C preferred stock Preferred stock dividend requirement and amortization of beneficial conversion feature — — — — 16 0.03 — — 16 0.03 Impact of increased share count on EPS if issued as common stock — (0.01) — 0.07 — — — — — 0.06 Total Series C impacts — (0.01) — 0.07 16 0.03 — — 16 0.09 Losses on impairment (net of taxes of $0, $379)(4) 185 0.35 1,177 2.21 — — — — 1,362 2.56 Corporate and Other Allocation (43) (0.08) (10) (0.02) 57 0.11 (4) (0.01) — — Exclusion of Discontinued Operations (7) — — — — — — (20) (0.04) (20) (0.04) Consolidated on a non-GAAP basis $ 355 $ 0.67 $ 64 $ 0.12 $ — $ — $ — $ — $ 419 $ 0.79 Note: Refer to slide 18 for information on non-GAAP measures (1) Energy Services segment (2) Infrastructure Services segment (3) Quarterly diluted EPS on both a GAAP and non-GAAP basis are based on the weighted average number of shares of common stock outstanding during the quarter, and the sum of the quarters may not equal year-to-date diluted EPS. EPS figures for Utility Operations, Midstream Investments, Corporate and Other and Discontinued Operations are non-GAAP financial measures. (4) Taxes are computed based on the impact removing such item would have on tax expense (5) Comprised of common stock of AT&T Inc. and Charter Communications, Inc. 15 (6) Corporate and Other, plus income allocated to preferred shareholders (7) Results related to discontinued operations are excluded from the company’s non-GAAP results
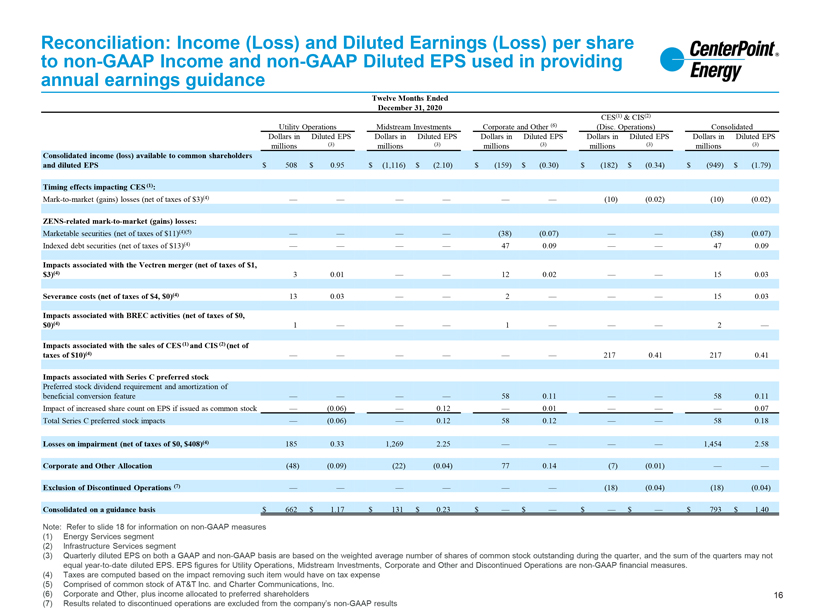
Reconciliation: Income (Loss) and Diluted Earnings (Loss) per share to non-GAAP Income and non-GAAP Diluted EPS used in providing annual earnings guidance Twelve Months Ended December 31, 2020 CES(1) & CIS(2) Utility Operations Midstream Investments Corporate and Other (6) (Disc. Operations) Consolidated Dollars in Diluted EPS Dollars in Diluted EPS Dollars in Diluted EPS Dollars in Diluted EPS Dollars in Diluted EPS millions (3) millions (3) millions (3) millions (3) millions (3) Consolidated income (loss) available to common shareholders and diluted EPS $ 508 $ 0.95 $ (1,116) $ (2.10) $ (159) $ (0.30) $ (182) $ (0.34) $ (949) $ (1.79) Timing effects impacting CES (1): Mark-to-market (gains) losses (net of taxes of $3)(4) — — — — — — (10) (0.02) (10) (0.02) ZENS-related mark-to-market (gains) losses: Marketable securities (net of taxes of $11)(4)(5) — — — — (38) (0.07) — — (38) (0.07) Indexed debt securities (net of taxes of $13)(4) — — — — 47 0.09 — — 47 0.09 Impacts associated with the Vectren merger (net of taxes of $1, $3)(4) 3 0.01 — — 12 0.02 — — 15 0.03 Severance costs (net of taxes of $4, $0)(4) 13 0.03 — — 2 — — — 15 0.03 Impacts associated with BREC activities (net of taxes of $0, $0)(4) 1 — — — 1 — — — 2 — Impacts associated with the sales of CES (1) and CIS (2) (net of taxes of $10)(4) — — — — — — 217 0.41 217 0.41 Impacts associated with Series C preferred stock Preferred stock dividend requirement and amortization of beneficial conversion feature — — — — 58 0.11 — — 58 0.11 Impact of increased share count on EPS if issued as common stock — (0.06) — 0.12 — 0.01 — — — 0.07 Total Series C preferred stock impacts — (0.06) — 0.12 58 0.12 — — 58 0.18 Losses on impairment (net of taxes of $0, $408)(4) 185 0.33 1,269 2.25 — — — — 1,454 2.58 Corporate and Other Allocation (48) (0.09) (22) (0.04) 77 0.14 (7) (0.01) — — Exclusion of Discontinued Operations (7) — — — — — — (18) (0.04) (18) (0.04) Consolidated on a guidance basis $ 662 $ 1.17 $ 131 $ 0.23 $ — $ — $ — $ — $ 793 $ 1.40 Note: Refer to slide 18 for information on non-GAAP measures (1) Energy Services segment (2) Infrastructure Services segment (3) Quarterly diluted EPS on both a GAAP and non-GAAP basis are based on the weighted average number of shares of common stock outstanding during the quarter, and the sum of the quarters may not equal year-to-date diluted EPS. EPS figures for Utility Operations, Midstream Investments, Corporate and Other and Discontinued Operations are non-GAAP financial measures. (4) Taxes are computed based on the impact removing such item would have on tax expense (5) Comprised of common stock of AT&T Inc. and Charter Communications, Inc. (6) Corporate and Other, plus income allocated to preferred shareholders 16 (7) Results related to discontinued operations are excluded from the company’s non-GAAP results
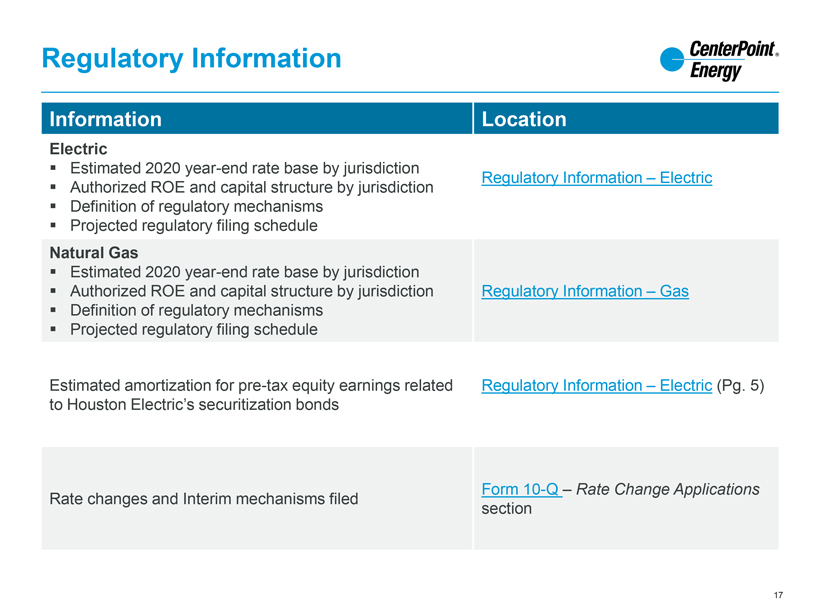
Regulatory Information Information Location Electric ï,§ Estimated 2020 year-end rate base by jurisdiction Regulatory Information – Electricï,§ Authorized ROE and capital structure by jurisdictionï,§ Definition of regulatory mechanismsï,§ Projected regulatory filing schedule Natural Gas ï,§ Estimated 2020 year-end rate base by jurisdiction ï,§ Authorized ROE and capital structure by jurisdiction Regulatory Information – Gasï,§ Definition of regulatory mechanismsï,§ Projected regulatory filing schedule Estimated amortization for pre-tax equity earnings related Regulatory Information – Electric (Pg. 5) to Houston Electric’s securitization bonds Form 10-Q – Rate Change Applications Rate changes and Interim mechanisms filed section 17
Additional information Use of Non-GAAP Financial Measures In this presentation and the oral statements made in connection herewith, CenterPoint Energy presents, based on diluted earnings per share, non-GAAP income and non-GAAP Utility earnings per share (“Utility EPS”), which are not generally accepted accounting principles (“GAAP”) financial measures. Generally, a non-GAAP financial measure is a numerical measure of a company’s historical or future financial performance that excludes or includes amounts that are not normally excluded or included in the most directly comparable GAAP financial measure. 2021 Utility EPS includes net income from Electric and Natural Gas segments, as well as after tax Corporate and Other operating income and an allocation of corporate overhead based upon the Utility’s relative earnings contribution. Corporate overhead consists primarily of interest expense, preferred stock dividend requirements, and other items directly attributable to the parent along with the associated income taxes. Utility EPS excludes (a) earnings or losses from the change in value of CenterPoint Energy’s 2.0% Zero-Premium Exchangeable Subordinated Notes due 2029 (“ZENS”) and related securities, (b) certain expenses associated with Vectren merger integration, (c) Midstream Investments segment and associated income from the Enable preferred units and a corresponding amount of debt in addition to an allocation of associated corporate overhead and impact, including related expenses, associated with the merger between Enable and Energy Transfer, (d) cost associated with the early extinguishment of debt and (e) gain and impact, including related expenses, associated with gas LDC sales. 2021 Utility EPS does not consider the items noted above and other potential impacts, such as changes in accounting standards, impairments or other unusual items, which could have a material impact on GAAP reported results for the applicable guidance period. 2021 Utility EPS also considers assumptions for certain significant variables that may impact earnings, such as customer growth and usage including normal weather, throughput, recovery of capital invested, effective tax rates, financing activities and related interest rates and regulatory and judicial proceedings. In addition, the 2021 Utility EPS guidance range assumes a continued re-opening of the economy in CenterPoint Energy’s service territories throughout 2021.To the extent actual results deviate from these assumptions, the 2021 Utility EPS guidance range may not be met or the projected annual Utility EPS growth rate may change. CenterPoint Energy is unable to present a quantitative reconciliation of forward-looking 2021 Utility EPS because changes in the value of ZENS and related securities, future impairments and other unusual items are not estimable and are difficult to predict due to various factors outside of management’s control. The appendix to this presentation contains a reconciliation of income (loss) available to common shareholders and diluted earnings (loss) per share to the basis used in providing guidance. Management evaluates the Company’s financial performance in part based on non-GAAP income and Utility EPS. Management believes that presenting these non-GAAP financial measures enhances an investor’s understanding of CenterPoint Energy’s overall financial performance by providing them with an additional meaningful and relevant comparison of current and anticipated future results across periods. The adjustments made in these non-GAAP financial measures exclude items that Management believes do not most accurately reflect the Company’s fundamental business performance. These excluded items are reflected in the reconciliation tables, where applicable. CenterPoint Energy’s non-GAAP income and Utility EPS non-GAAP financial measures should be considered as a supplement to, and not as a substitute for, or superior to, income available to common shareholders and diluted earnings per share, which, respectively, are the most directly comparable GAAP financial measures. These non-GAAP financial measures also may be different than non-GAAP financial measures used by other companies.
Serious News for Serious Traders! Try StreetInsider.com Premium Free!
You May Also Be Interested In
- Zayo Group Appoints New CEO of Zayo Europe
- Homeland Security Expert Dr. Peter W. Sherrill Eyes Congress, Vows To Secure The Border
- HSBC Continental Europe: Post Stabilisation Notice
Create E-mail Alert Related Categories
SEC FilingsSign up for StreetInsider Free!
Receive full access to all new and archived articles, unlimited portfolio tracking, e-mail alerts, custom newswires and RSS feeds - and more!
