

Form 8-K Bridgewater Bancshares For: Aug 08
 Tweet
Tweet Share
ShareUNITED STATES
SECURITIES AND EXCHANGE COMMISSION
Washington, D.C. 20549
FORM
CURRENT REPORT
PURSUANT TO SECTION 13 OR 15(d) OF
THE SECURITIES EXCHANGE ACT OF 1934
Date of Report
(Date of earliest event reported)
(Exact name of registrant as specified in its charter)
(State or other jurisdiction of incorporation) | (Commission File Number) | (I.R.S. Employer Identification No.) |
(Address of principal executive offices) | (Zip Code) |
Registrant’s telephone number, including area code: (
Not Applicable
(Former name or former address, if changed since last report.)
Check the appropriate box below if the Form 8-K filing is intended to simultaneously satisfy the filing obligation of the registrant under any of the following provisions:
Securities registered pursuant to Section 12(b) of the Act:
Title of each class: |
| Trading Symbol |
| Name of each exchange on which registered: |
|
|
Indicate by check mark whether the registrant is an emerging growth company as defined in Rule 405 of the Securities Act of 1933 (§230.405 of this chapter) or Rule 12b-2 of the Securities Exchange Act of 1934 (§240.12b-2 of this chapter).
Emerging growth company
If an emerging growth company, indicate by check mark if the registrant has elected not to use the extended transition period for complying with any new or revised financial accounting standards provided pursuant to Section 13(a) of the Exchange Act.
Item 7.01 Regulation FD Disclosure.
Bridgewater Bancshares, Inc. (the “Company”) is furnishing an Investor Presentation, which will be used, in whole or in part, from time to time by executives of the Company in meetings with investors and analysts. A copy of the Investor Presentation is attached as Exhibit 99.1 to this Current Report on Form 8-K and is incorporated herein by reference.
The information furnished in this item of this Form 8-K, and the related exhibits, shall not be deemed “filed” for purposes of Section 18 of the Exchange Act, or incorporated by reference in any filing under the Securities Act of 1933, as amended, or the Exchange Act, except as may be expressly set forth by specific reference in such filing.
Item 9.01 Financial Statements and Exhibits.
(d) Exhibits
Exhibit 99.1 |
Exhibit 104 | Cover Page Interactive Data File (embedded within the Inline XBRL document) |
2
SIGNATURES
Pursuant to the requirements of the Securities Exchange Act of 1934, the registrant has duly caused this report to be signed on its behalf by the undersigned thereunto duly authorized.
Bridgewater Bancshares, Inc. | |
Date: August 8, 2022 | |
By: /s/ Jerry Baack | |
Name: Jerry Baack | |
Title: Chairman, Chief Executive Officer and President |
3
|

| Disclaimer Forward - Looking Statements This presentation contains “forward - looking statements” within the meaning of the safe harbor provisions of the U.S. Private Sec urities Litigation Reform Act of 1995. Forward - looking statements include, without limitation, statements concerning plans, esti mates, calculations, forecasts and projections with respect to the anticipated future performance of the Company. These statements are often, but not always, identified by words such as “may”, “might”, “should”, “could”, “predict”, “potential”, “believe”, “expect”, “continue ”, “will”, “anticipate”, “seek”, “estimate”, “intend”, “plan”, “projection”, “would”, “annualized”, “target” and “outlook”, or the negative version of th ose words or other comparable words of a future or forward - looking nature. Forward - looking statements are neither historical fac ts nor assurances of future performance. Instead, they are based only on our current beliefs, expectations and assumptions regarding our business, fu ture plans and strategies, projections, anticipated events and trends, the economy and other future conditions. Because forwa rd - looking statements relate to the future, they are subject to inherent uncertainties, risks and changes in circumstances that are difficult to pr edi ct and many of which are outside of our control. Our actual results and financial condition may differ materially from those ind icated in the forward - looking statements. Therefore, you should not rely on any of these forward - looking statements. Important factors that could cause our ac tual results and financial condition to differ materially from those indicated in the forward - looking statements include, among others, the following: the negative effects of the ongoing COVID - 19 pandemic, including its effects on the economic environment, our clients and our operat ions, including due to supply chain disruptions, as well as any changes to federal, state or local government laws, regulatio ns or orders in connection with the pandemic; loan concentrations in our portfolio; the overall health of the local and national real estate market; our ab ility to successfully manage credit risk; business and economic conditions generally and in the financial services industry, nat ionally and within our market area, including rising rates of inflation; our ability to maintain an adequate level of allowance for loan losses; new or rev ise d accounting standards, including as a result of the future implementation of the Current Expected Credit Loss standard; the con centration of large loans to certain borrowers; the concentration of large deposits from certain clients; our ability to successfully manage liquidity ris k, especially in light of recent excess liquidity at Bridgewater Bank; our dependence on non - core funding sources and our cost of f unds; our ability to raise additional capital to implement our business plan; our ability to implement our growth strategy and manage costs effectively; de velopments and uncertainty related to the future use and availability of some reference rates, such as the London Interbank O ffe red Rate, as well as other alternative reference rates; the composition of our senior leadership team and our ability to attract and retain key pe rso nnel; talent and labor shortages and high rates of employee turnover; the occurrence of fraudulent activity, breaches or fail ure s of our information security controls or cybersecurity - related incidents; interruptions involving our information technology and telecommunications systems o r third - party servicers; competition in the financial services industry, including from nonbank competitors such as credit union s and “fintech” companies; the effectiveness of our risk management framework; the commencement and outcome of litigation and other legal pro cee dings and regulatory actions against us; the impact of recent and future legislative and regulatory changes, including change s t o federal and state corporate tax rates; interest rate risk, including the effects of recent and anticipated rate increases by the Federal Reserv e; fluctuations in the values of the securities held in our securities portfolio; the imposition of tariffs or other governmenta l p olicies impacting the value of products produced by our commercial borrowers; severe weather, natural disasters, wide spread disease or pandemics (including th e COVID - 19 pandemic), acts of war or terrorism or other adverse external events, including the Russian invasion of Ukraine; pote ntial impairment to the goodwill we recorded in connection with our past acquisition; changes to U.S. or state tax laws, regulations and guidance , i ncluding recent proposals to increase the federal corporate tax rate; and any other risks described in the “Risk Factors” sec tio ns of reports filed by the Company with the Securities and Exchange Commission. Any forward - looking statement made by us in this press release is based only on information currently available to us and speaks only as of the date on which it is made. We undertake no obligation to publicly update any forward - looking statement, whether w ritten or oral, that may be made from time to time, whether as a result of new information, future developments or otherwise. Certain of the informati on contained in this presentation is derived from information provided by industry sources. Although we believe that such inform ati on is accurate and that the sources from which it has been obtained are reliable, we cannot guarantee the accuracy of, and have not independentl y v erified, such information. Use of Non - GAAP financial measures In addition to the results presented in accordance with U.S. General Accepted Accounting Principles (“GAAP”), the Company rou tin ely supplements its evaluation with an analysis of certain non - GAAP financial measures. The Company believes these non - GAAP fin ancial measures, in addition to the related GAAP measures, provide meaningful information to investors to help them understand the Company’s oper ati ng performance and trends, and to facilitate comparisons with the performance of peers. These disclosures should not be view ed as a substitute for operating results determined in accordance with GAAP, nor are they necessarily comparable to non - GAAP performance measures that may be presented by other companies. Reconciliations of non - GAAP disclosures to the comparable GAAP measures are provided in thi s presentation. 2 |
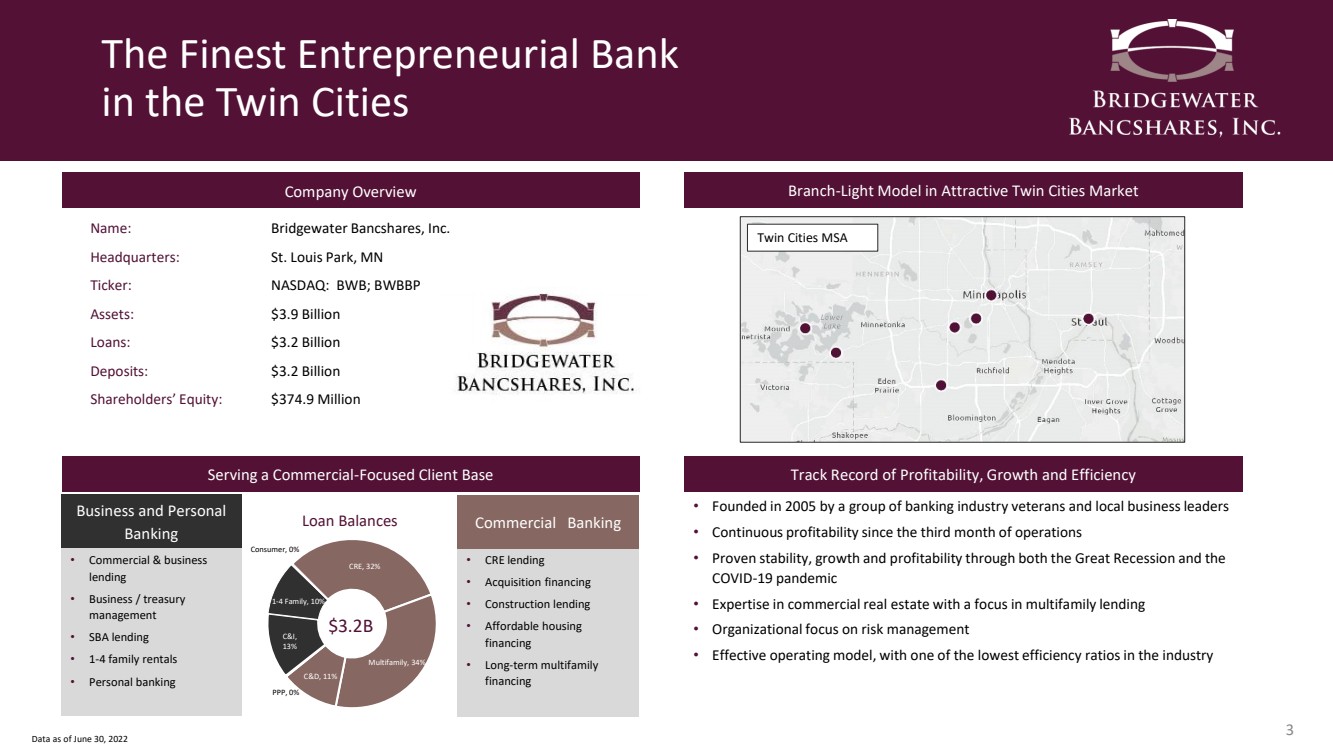
| The Finest Entrepreneurial Bank in the Twin Cities Company Overview Branch - Light Model in Attractive Twin Cities Market Twin Cities MSA Name: Bridgewater Bancshares, Inc. Headquarters: St. Louis Park, MN Ticker: NASDAQ: BWB; BWBBP Assets: $3.9 Billion Loans: $3.2 Billion Deposits: $3.2 Billion Shareholders’ Equity: $374.9 Million Serving a Commercial - Focused Client Base Track Record of Profitability, Growth and Efficiency • CRE lending • Acquisition financing • Construction lending • Affordable housing financing • Long - term multifamily financing • Commercial & business lending • Business / treasury management • SBA lending • 1 - 4 family rentals • Personal banking CRE , 32% Multifamily , 34% C&D , 11% PPP , 0% C&I , 13% 1 - 4 Family , 10% Consumer , 0% $3.2B Business and Personal Banking Commercial Banking Loan Balances • Founded in 2005 by a group of banking industry veterans and local business leaders • Continuous profitability since the third month of operations • Proven stability, growth and profitability through both the Great Recession and the COVID - 19 pandemic • Expertise in commercial real estate with a focus in multifamily lending • Organizational focus on risk management • Effective operating model, with one of the lowest efficiency ratios in the industry Data as of June 30, 2022 3 |
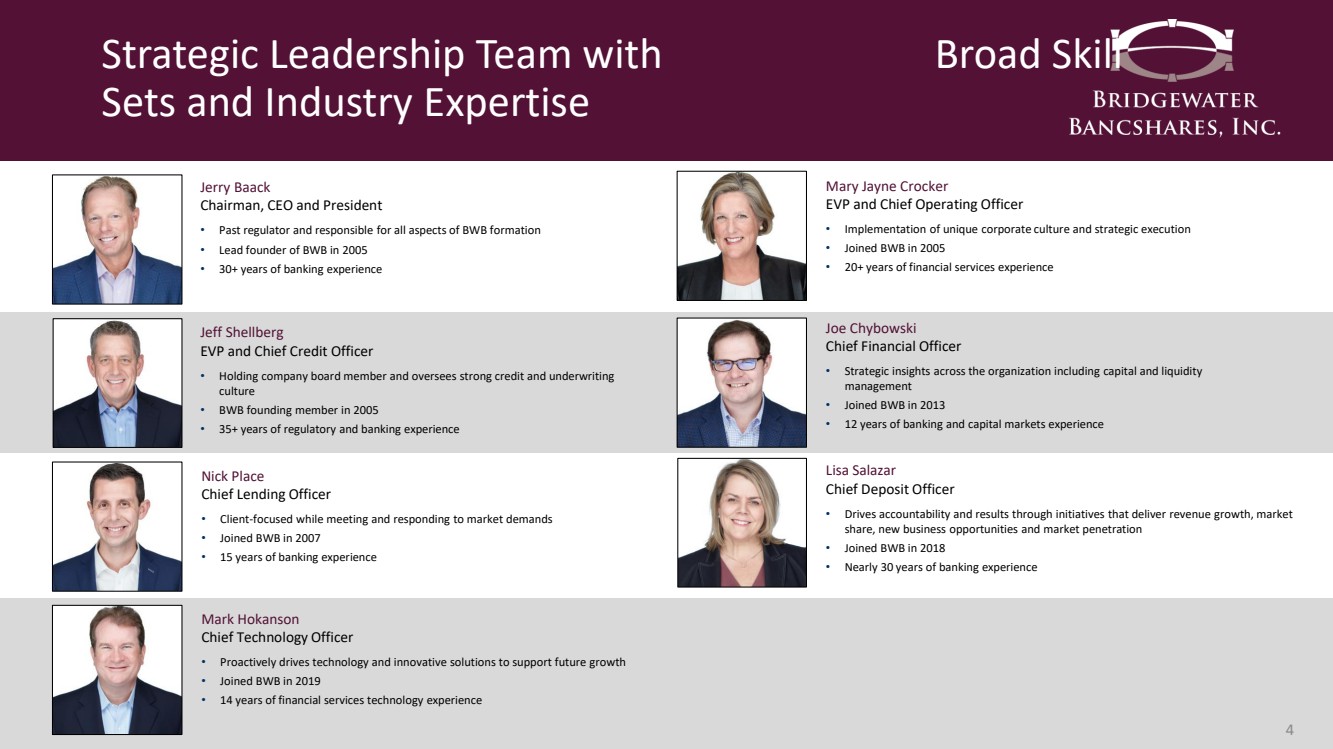
| Strategic Leadership Team with Broad Skill Sets and Industry Expertise 4 Jerry Baack Chairman, CEO and President • Past regulator and responsible for all aspects of BWB formation • Lead founder of BWB in 2005 • 30+ years of banking experience Jeff Shellberg EVP and Chief Credit Officer • Holding company board member and oversees strong credit and underwriting culture • BWB founding member in 2005 • 35+ years of regulatory and banking experience Nick Place Chief Lending Officer • Client - focused while meeting and responding to market demands • Joined BWB in 2007 • 15 years of banking experience Mark Hokanson Chief Technology Officer • Proactively drives technology and innovative solutions to support future growth • Joined BWB in 2019 • 14 years of financial services technology experience Mary Jayne Crocker EVP and Chief Operating Officer • Implementation of unique corporate culture and strategic execution • Joined BWB in 2005 • 20+ years of financial services experience Joe Chybowski Chief Financial Officer • Strategic insights across the organization including capital and liquidity management • Joined BWB in 2013 • 12 years of banking and capital markets experience Lisa Salazar Chief Deposit Officer • Drives accountability and results through initiatives that deliver revenue growth, market share, new business opportunities and market penetration • Joined BWB in 2018 • Nearly 30 years of banking experience |
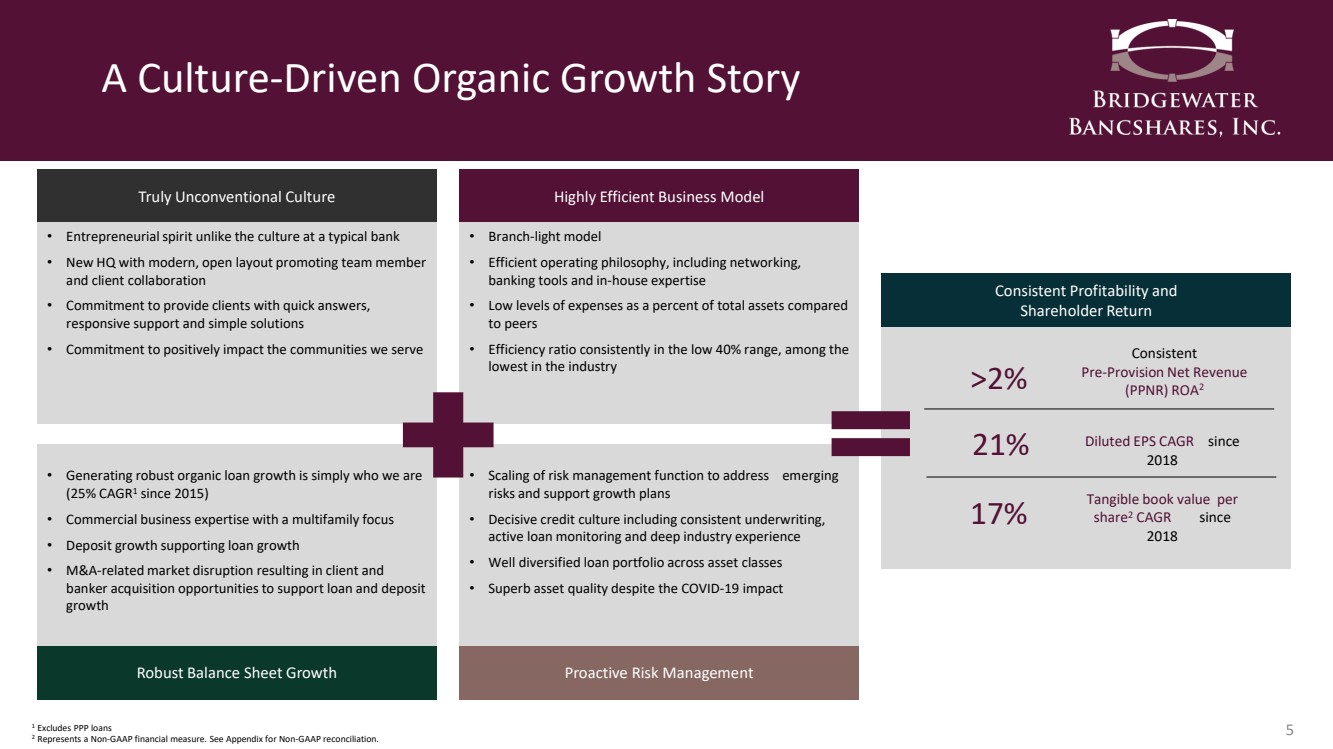
| A Culture - Driven Organic Growth Story 5 Consistent Profitability and Shareholder Return Truly Unconventional Culture Highly Efficient Business Model Robust Balance Sheet Growth Proactive Risk Management • Entrepreneurial spirit unlike the culture at a typical bank • New HQ with modern, open layout promoting team member and client collaboration • Commitment to provide clients with quick answers, responsive support and simple solutions • Commitment to positively impact the communities we serve • Generating robust organic loan growth is simply who we are (25% CAGR 1 since 2015) • Commercial business expertise with a multifamily focus • Deposit growth supporting loan growth • M&A - related market disruption resulting in client and banker acquisition opportunities to support loan and deposit growth • Branch - light model • Efficient operating philosophy, including networking, banking tools and in - house expertise • Low levels of expenses as a percent of total assets compared to peers • Efficiency ratio consistently in the low 40% range, among the lowest in the industry • Scaling of risk management function to address emerging risks and support growth plans • Decisive credit culture including consistent underwriting, active loan monitoring and deep industry experience • Well diversified loan portfolio across asset classes • Superb asset quality despite the COVID - 19 impact >2% Consistent Pre - Provision Net Revenue (PPNR) ROA 2 21% Diluted EPS CAGR since 2018 17% Tangible book value per share 2 CAGR since 2018 1 Excludes PPP loans 2 Represents a Non - GAAP financial measure. See Appendix for Non - GAAP reconciliation. |
| Our Core Values Unconventional .. Our clients notice a difference. Responsive. Under promise, over deliver. Dedicated. Don’t stop until you get it done. Growth. If you aren’t moving forward, where are you going? Accurate. It’s more than just an expectation. 6 |
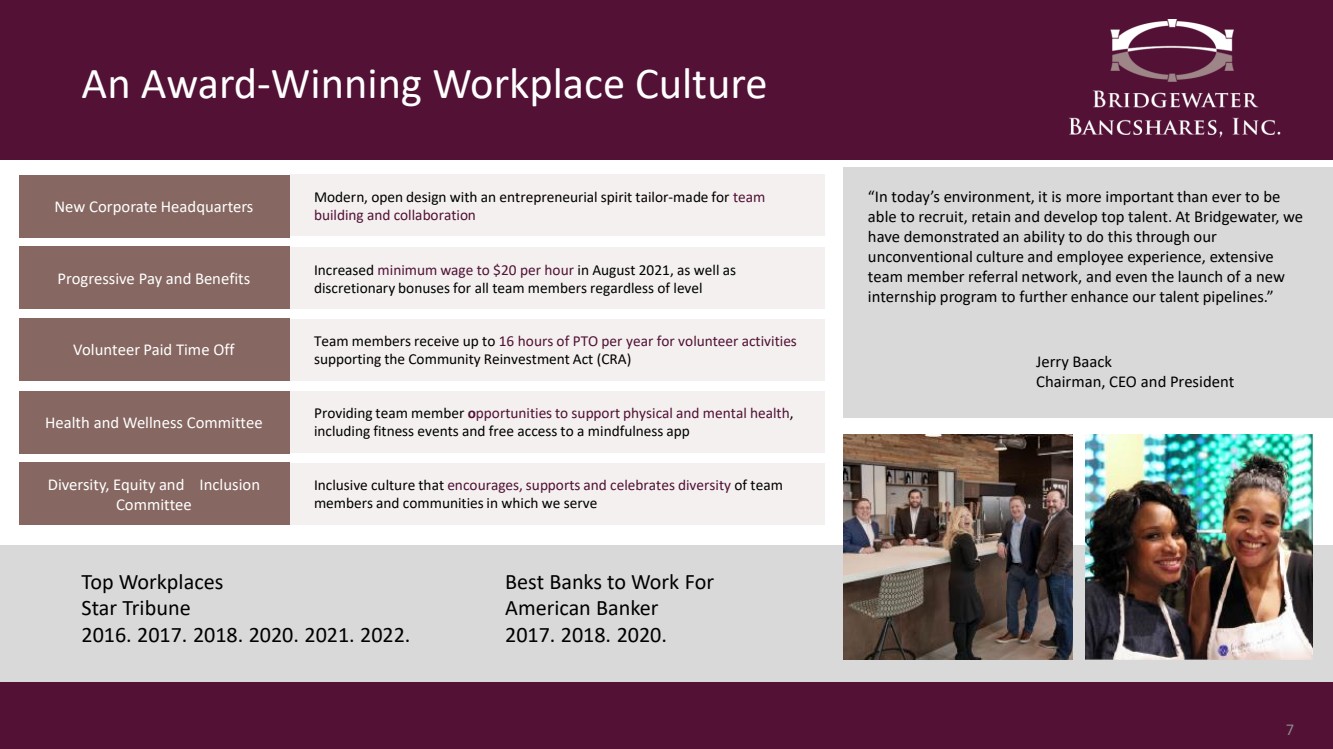
| An Award - Winning Workplace Culture “In today’s environment, it is more important than ever to be able to recruit, retain and develop top talent. At Bridgewater, we have demonstrated an ability to do this through our unconventional culture and employee experience, extensive team member referral network, and even the launch of a new internship program to further enhance our talent pipelines.” Jerry Baack Chairman, CEO and President Top Workplaces Star Tribune 2016. 2017. 2018. 2020. 2021. 2022. Best Banks to Work For American Banker 2017. 2018. 2020. 7 New Corporate Headquarters Progressive Pay and Benefits Health and Wellness Committee Diversity, Equity and Inclusion Committee Volunteer Paid Time Off Modern, open design with an entrepreneurial spirit tailor - made for team building and collaboration Increased minimum wage to $20 per hour in August 2021, as well as discretionary bonuses for all team members regardless of level Providing team member o pportunities to support physical and mental health , including fitness events and free access to a mindfulness app Inclusive culture that encourages, supports and celebrates diversity of team members and communities in which we serve Team members receive up to 16 hours of PTO per year for volunteer activities supporting the Community Reinvestment Act (CRA) |
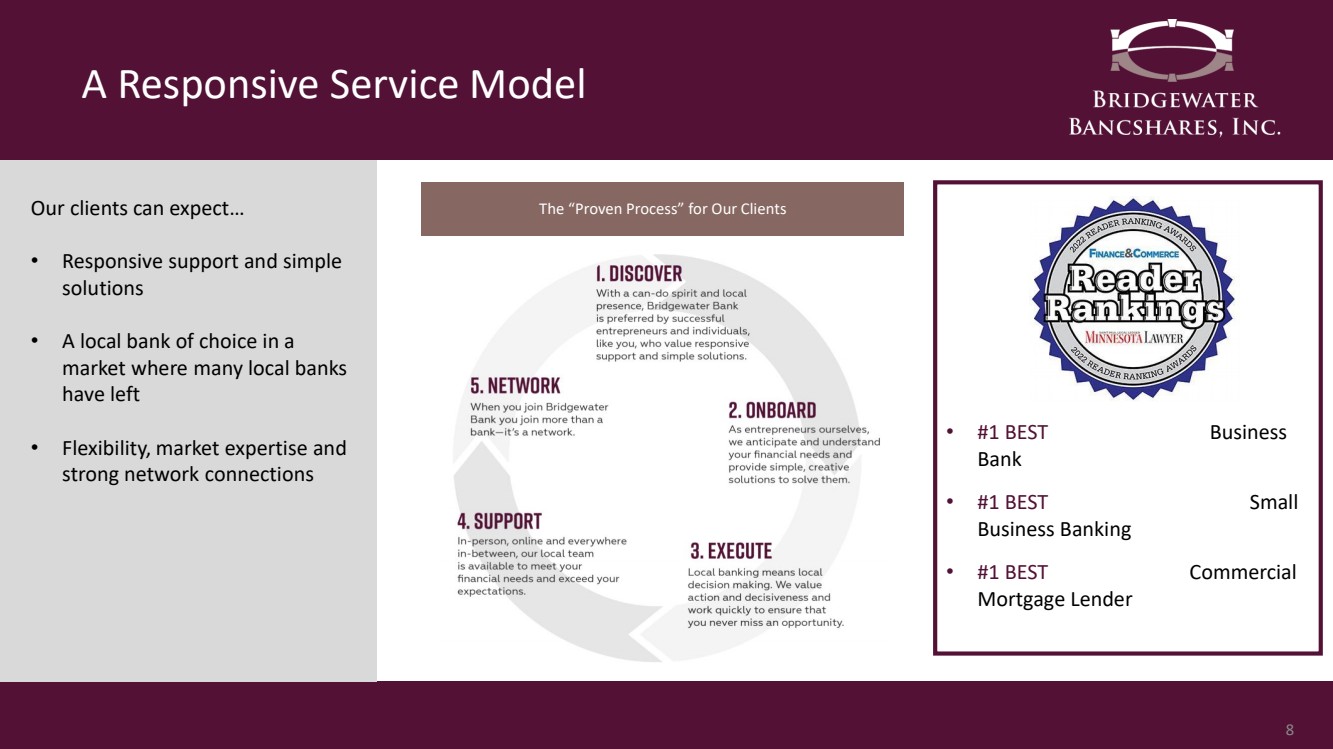
| A Responsive Service Model Our clients can expect… • Responsive support and simple solutions • A local bank of choice in a market where many local banks have left • Flexibility, market expertise and strong network connections 8 The “Proven Process” for Our Clients • #1 BEST Business Bank • #1 BEST Small Business Banking • #1 BEST Commercial Mortgage Lender |
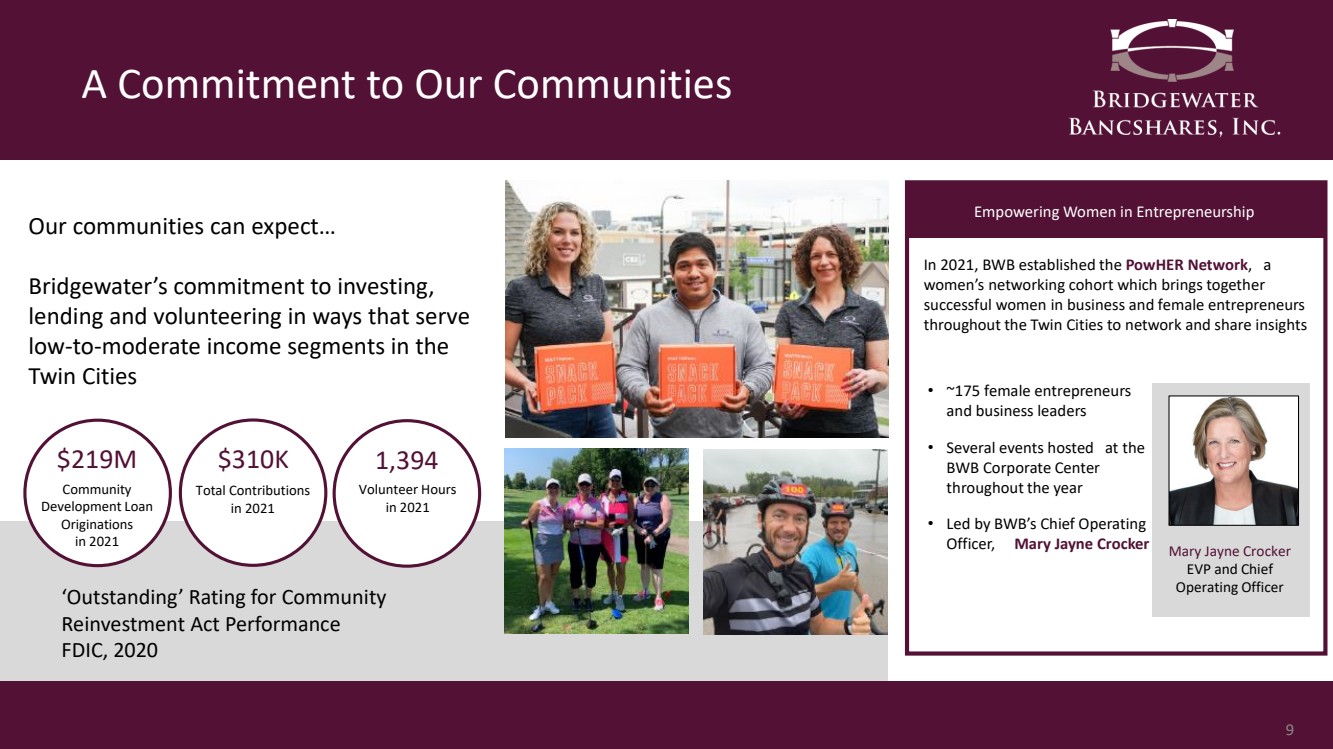
| A Commitment to Our Communities Our communities can expect… Bridgewater’s commitment to investing, lending and volunteering in ways that serve low - to - moderate income segments in the Twin Cities ‘Outstanding’ Rating for Community Reinvestment Act Performance FDIC, 2020 9 $219M Community Development Loan Originations in 2021 $310K Total Contributions in 2021 1,394 Volunteer Hours in 2021 Empowering Women in Entrepreneurship In 2021, BWB established the PowHER Network , a women’s networking cohort which brings together successful women in business and female entrepreneurs throughout the Twin Cities to network and share insights • ~175 female entrepreneurs and business leaders • Several events hosted at the BWB Corporate Center throughout the year • Led by BWB’s Chief Operating Officer, Mary Jayne Crocker Mary Jayne Crocker EVP and Chief Operating Officer |
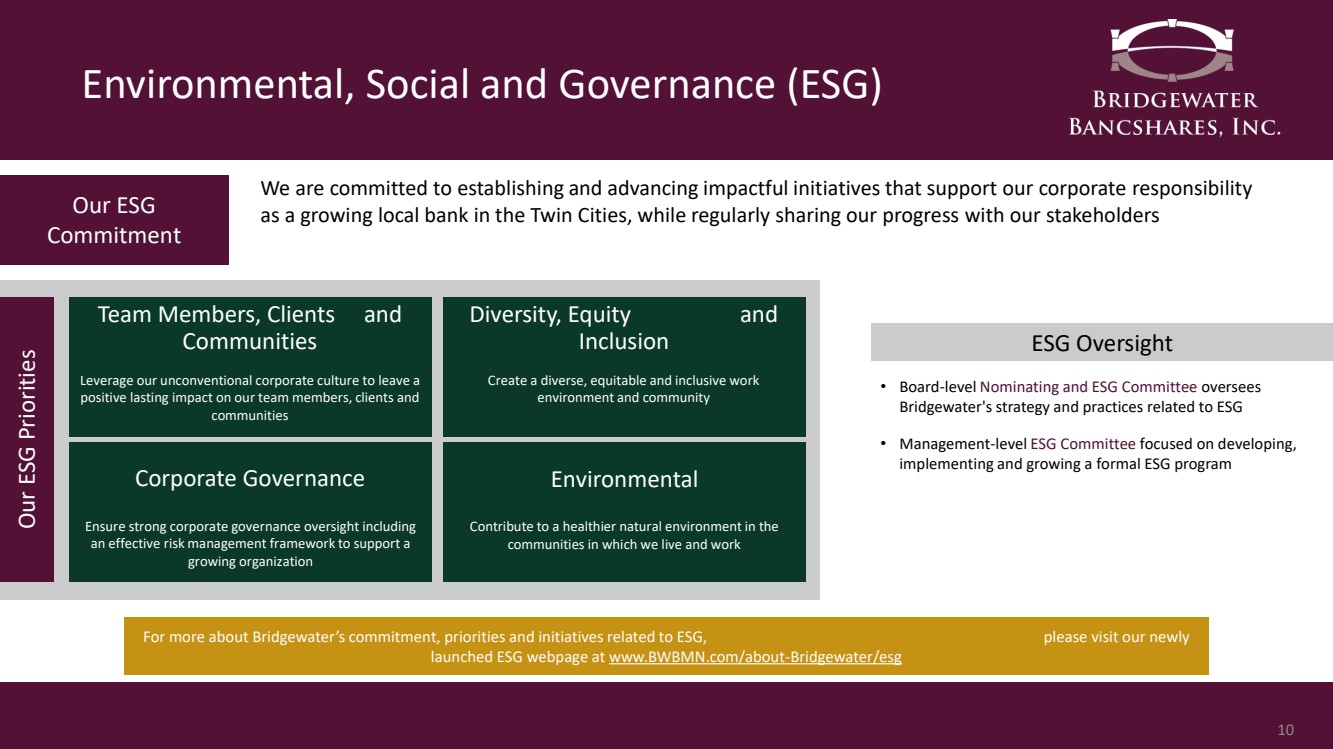
| Environmental, Social and Governance (ESG) 10 We are committed to establishing and advancing impactful initiatives that support our corporate responsibility as a growing local bank in the Twin Cities, while regularly sharing our progress with our stakeholders Our ESG Commitment Our ESG Priorities Team Members, Clients and Communities Diversity, Equity and Inclusion Leverage our unconventional corporate culture to leave a positive lasting impact on our team members, clients and communities Ensure strong corporate governance oversight including an effective risk management framework to support a growing organization Create a diverse, equitable and inclusive work environment and community Contribute to a healthier natural environment in the communities in which we live and work Corporate Governance Environmental ESG Oversight • Board - level Nominating and ESG Committee oversees Bridgewater's strategy and practices related to ESG • Management - level ESG Committee focused on developing, implementing and growing a formal ESG program For more about Bridgewater’s commitment, priorities and initiatives related to ESG, please visit our newly launched ESG webpage at www.BWBMN.com/about - Bridgewater/esg |
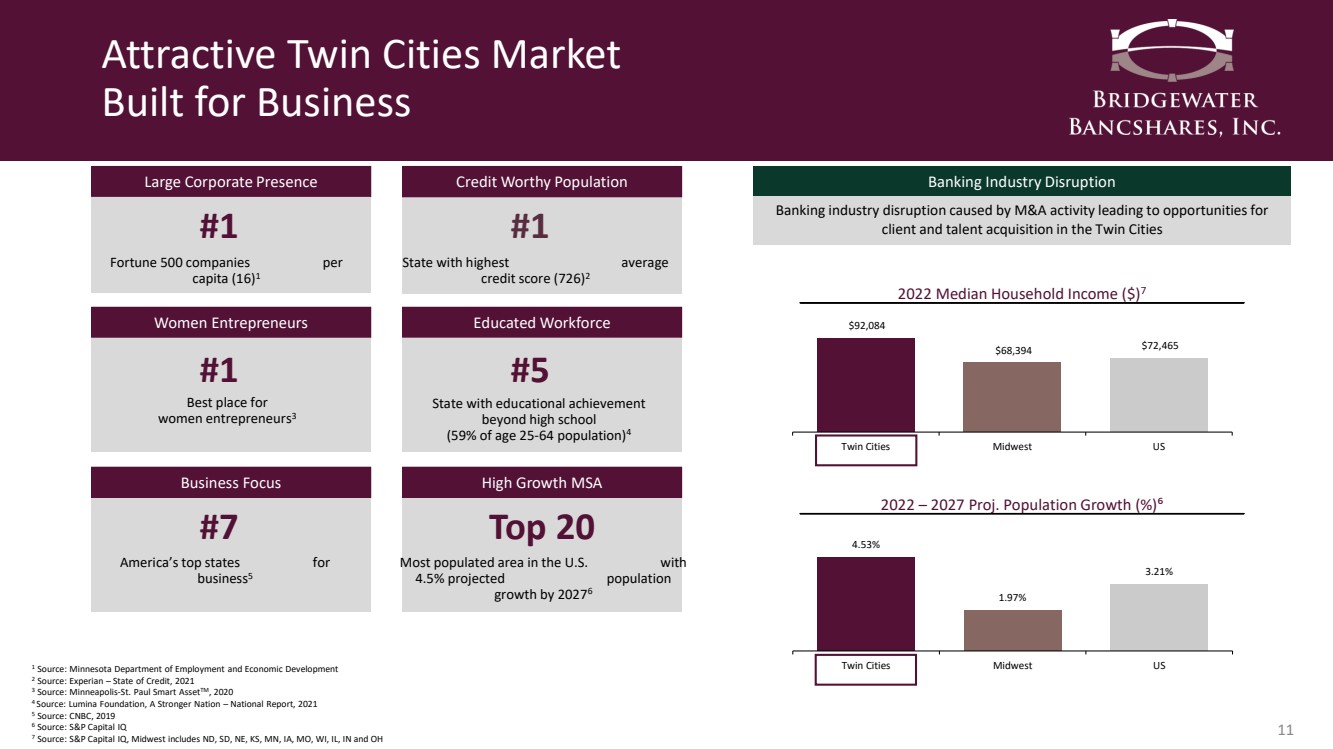
| Attractive Twin Cities Market Built for Business 11 #1 Fortune 500 companies per capita (16) 1 Large Corporate Presence #1 State with highest average credit score (726) 2 Credit Worthy Population #1 Best place for women entrepreneurs 3 Women Entrepreneurs #5 State with educational achievement beyond high school (59% of age 25 - 64 population) 4 Educated Workforce #7 America’s top states for business 5 Business Focus Top 20 Most populated area in the U.S. with 4.5% projected population growth by 2027 6 High Growth MSA 4.53% 1.97% 3.21% Twin Cities Midwest US $92,084 $68,394 $72,465 Twin Cities Midwest US Banking industry disruption caused by M&A activity leading to opportunities for client and talent acquisition in the Twin Cities Banking Industry Disruption 2022 Median Household Income ($) 7 2022 – 2027 Proj. Population Growth (%) ⁶ 1 Source: Minnesota Department of Employment and Economic Development 2 Source: Experian – State of Credit, 2021 3 Source: Minneapolis - St. Paul Smart Asset TM , 2020 4 Source: Lumina Foundation, A Stronger Nation – National Report, 2021 5 Source: CNBC, 2019 6 Source: S&P Capital IQ 7 Source: S&P Capital IQ, Midwest includes ND, SD, NE, KS, MN, IA, MO, WI, IL, IN and OH |
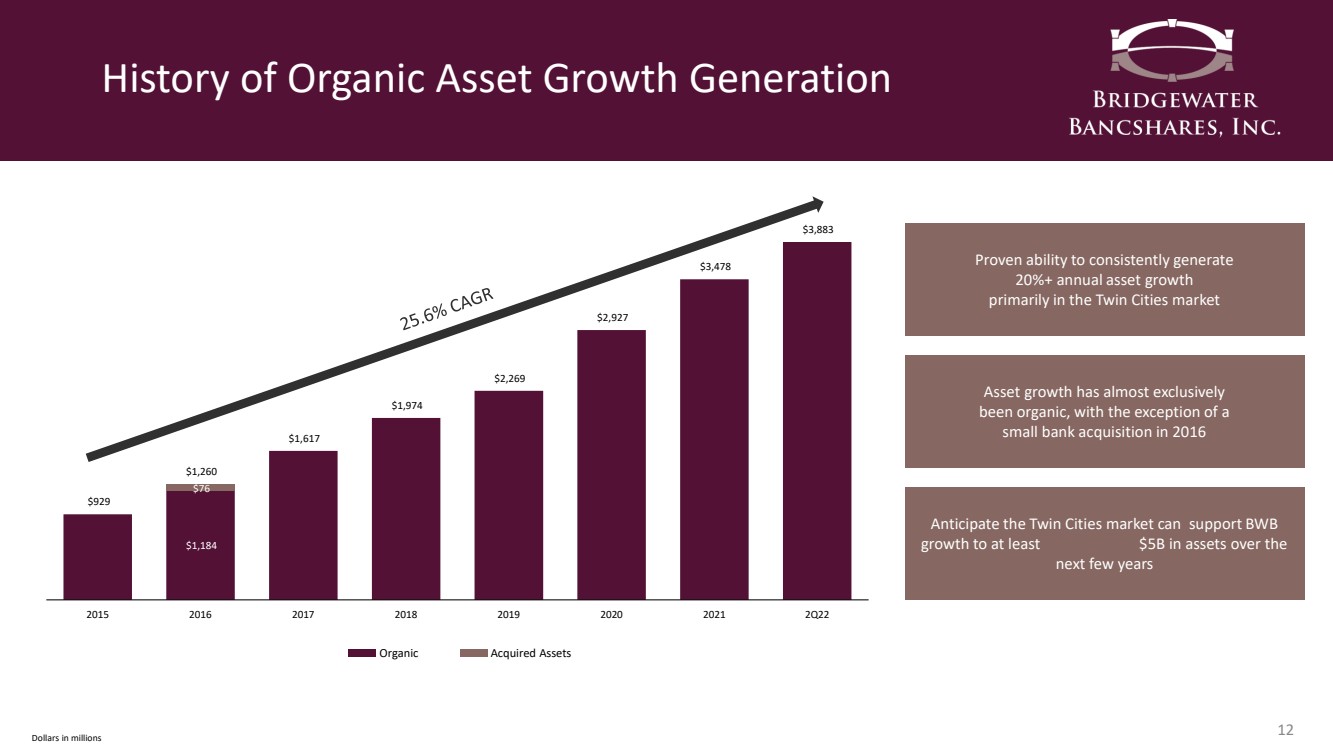
| History of Organic Asset Growth Generation 12 $1,184 $76 $929 $1,260 $1,617 $1,974 $2,269 $2,927 $3,478 $3,883 2015 2016 2017 2018 2019 2020 2021 2Q22 Acquired Assets Organic Proven ability to consistently generate 20%+ annual asset growth primarily in the Twin Cities market Asset growth has almost exclusively been organic, with the exception of a small bank acquisition in 2016 Dollars in millions Anticipate the Twin Cities market can support BWB growth to at least $5B in assets over the next few years |
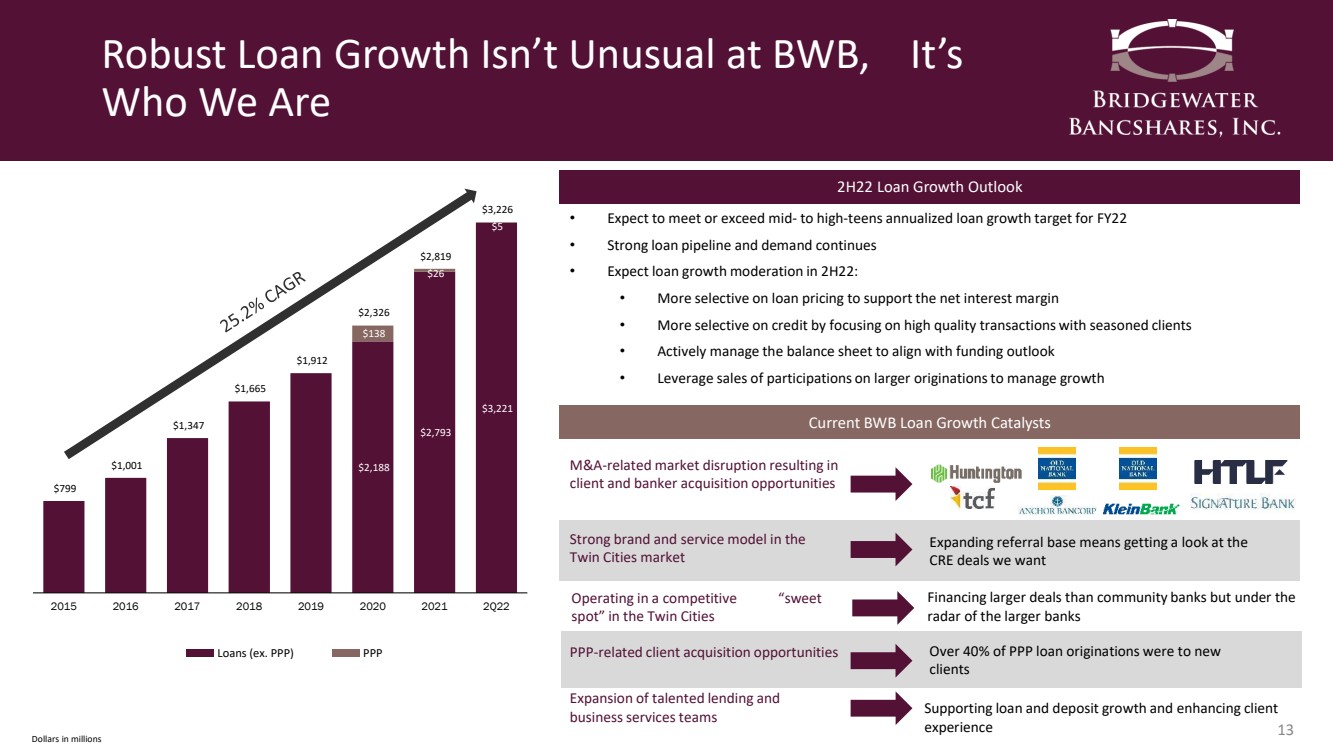
| Robust Loan Growth Isn’t Unusual at BWB, It’s Who We Are 13 $2,188 $2,793 $3,221 $138 $26 $5 $799 $1,001 $1,347 $1,665 $1,912 $2,326 $2,819 $3,226 2015 2016 2017 2018 2019 2020 2021 2Q22 PPP Loans (ex. PPP) Dollars in millions Current BWB Loan Growth Catalysts Strong brand and service model in the Twin Cities market Expanding referral base means getting a look at the CRE deals we want M&A - related market disruption resulting in client and banker acquisition opportunities PPP - related client acquisition opportunities Over 40% of PPP loan originations were to new clients Expansion of talented lending and business services teams Supporting loan and deposit growth and enhancing client experience Operating in a competitive “sweet spot” in the Twin Cities Financing larger deals than community banks but under the radar of the larger banks 2H22 Loan Growth Outlook • Expect to meet or exceed mid - to high - teens annualized loan growth target for FY22 • Strong loan pipeline and demand continues • Expect loan growth moderation in 2H22: • More selective on loan pricing to support the net interest margin • More selective on credit by focusing on high quality transactions with seasoned clients • Actively manage the balance sheet to align with funding outlook • Leverage sales of participations on larger originations to manage growth |
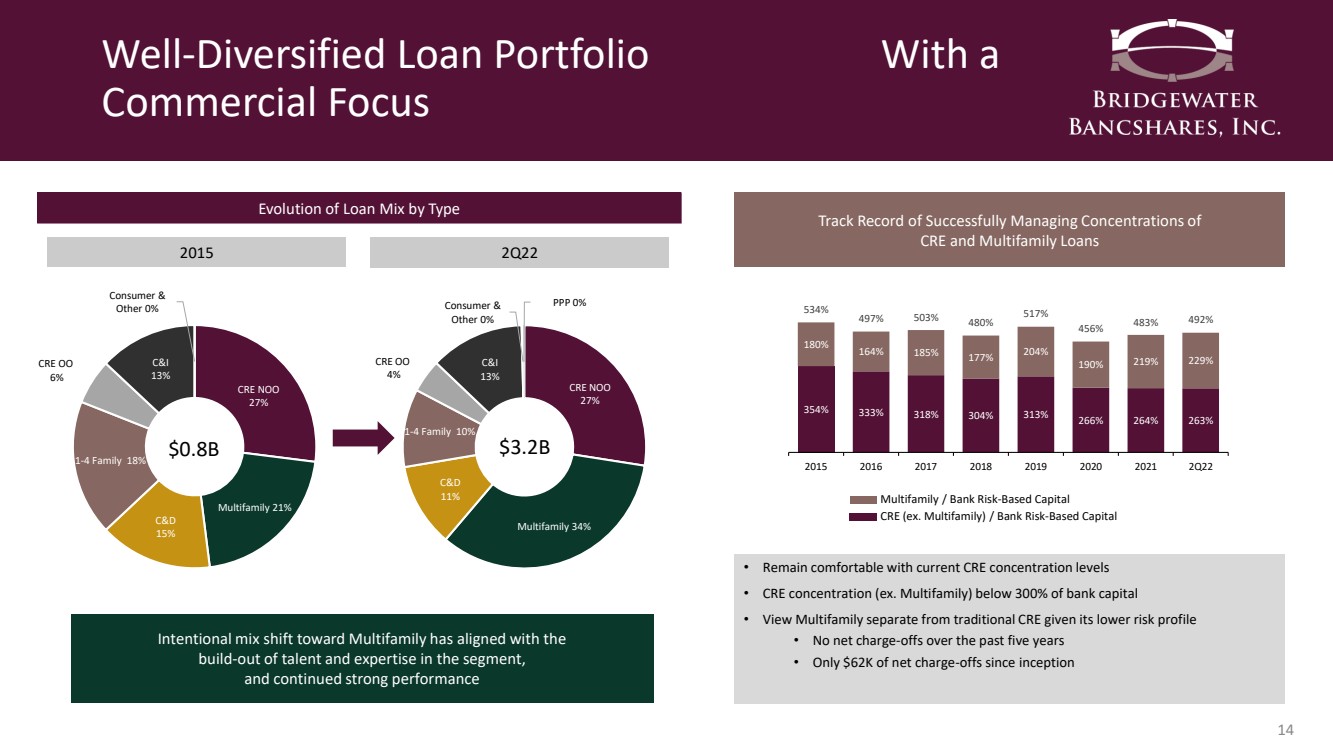
| Well - Diversified Loan Portfolio With a Commercial Focus 14 CRE NOO 27% Multifamily 21% C&D 15% 1 - 4 Family 18% CRE OO 6% C&I 13% Consumer & Other 0% $0.8B Evolution of Loan Mix by Type 2015 2Q22 Intentional mix shift toward Multifamily has aligned with the build - out of talent and expertise in the segment, and continued strong performance Track Record of Successfully Managing Concentrations of CRE and Multifamily Loans Multifamily / Bank Risk - Based Capital CRE (ex. Multifamily) / Bank Risk - Based Capital • Remain comfortable with current CRE concentration levels • CRE concentration (ex. Multifamily) below 300% of bank capital • View Multifamily separate from traditional CRE given its lower risk profile • No net charge - offs over the past five years • Only $62K of net charge - offs since inception CRE NOO 27% Multifamily 34% C&D 11% 1 - 4 Family 10% CRE OO 4% C&I 13% Consumer & Other 0% PPP 0% $3.2B 354% 333% 318% 304% 313% 266% 264% 263% 180% 164% 185% 177% 204% 190% 219% 229% 534% 497% 503% 480% 517% 456% 483% 492% 2015 2016 2017 2018 2019 2020 2021 2Q22 |
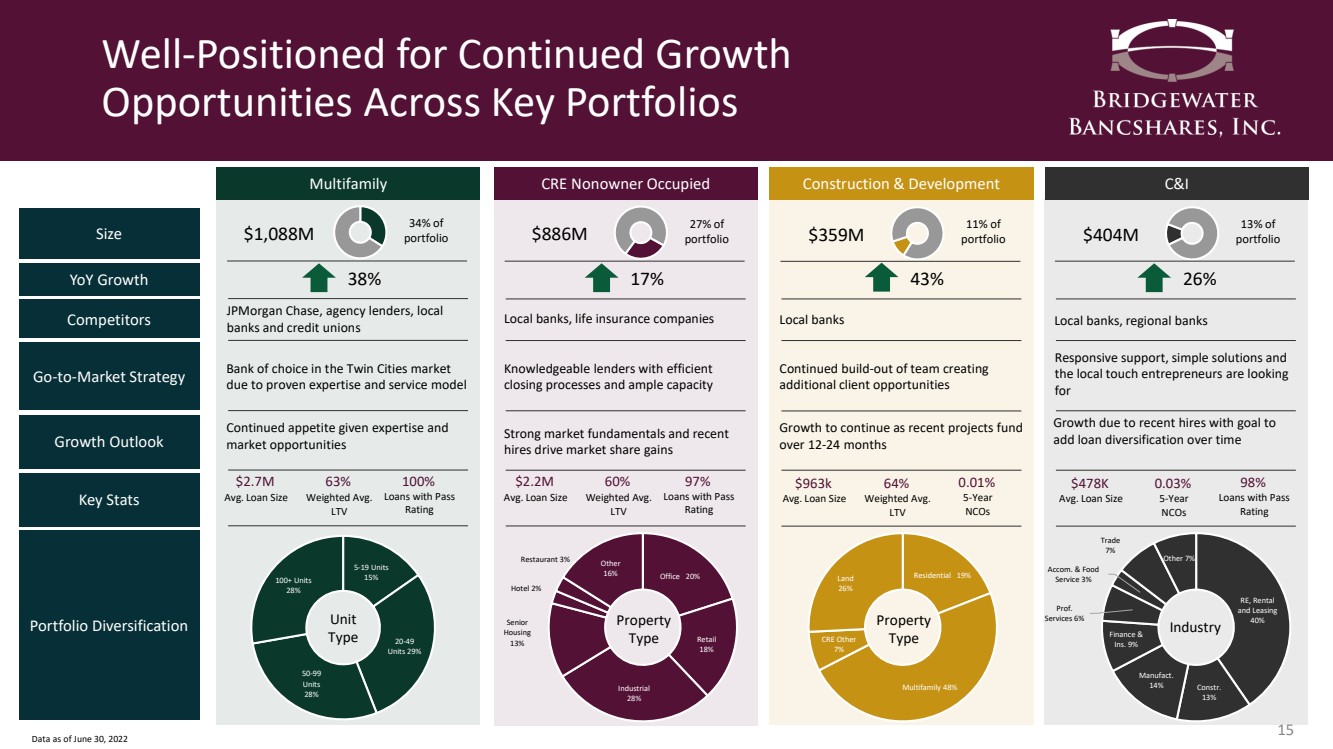
| Well - Positioned for Continued Growth Opportunities Across Key Portfolios 15 5 - 19 Units 15% 20 - 49 Units 29% 50 - 99 Units 28% 100+ Units 28% Size YoY Growth Go - to - Market Strategy Competitors Growth Outlook Key Stats Portfolio Diversification Multifamily CRE Nonowner Occupied C&I Construction & Development Bank of choice in the Twin Cities market due to proven expertise and service model Knowledgeable lenders with efficient closing processes and ample capacity Responsive support, simple solutions and the local touch entrepreneurs are looking for Continued build - out of team creating additional client opportunities JPMorgan Chase, agency lenders, local banks and credit unions Local banks, life insurance companies Local banks, regional banks Local banks Continued appetite given expertise and market opportunities Strong market fundamentals and recent hires drive market share gains Growth due to recent hires with goal to add loan diversification over time Growth to continue as recent projects fund over 12 - 24 months $2.7M Avg. Loan Size 63% Weighted Avg. LTV 100% Loans with Pass Rating $2.2M Avg. Loan Size 60% Weighted Avg. LTV 97% Loans with Pass Rating $478K Avg. Loan Size 0.03 % 5 - Year NCOs 98% Loans with Pass Rating $963k Avg. Loan Size 64% Weighted Avg. LTV 0.01 % 5 - Year NCOs Unit Type Office 20% Retail 18% Industrial 28% Senior Housing 13% Hotel 2% Restaurant 3% Other 16% Property Type RE, Rental and Leasing 40% Constr. 13% Manufact. 14% Finance & Ins. 9% Prof. Services 6% Accom. & Food Service 3% Trade 7% Other 7% Industry Residential 19% Multifamily 48% CRE Other 7% Land 26% Property Type Data as of June 30, 2022 $1,088M 34% of portfolio $886M 27% of portfolio $404M 13% of portfolio $359M 11% of portfolio 38% 17% 26% 43% |
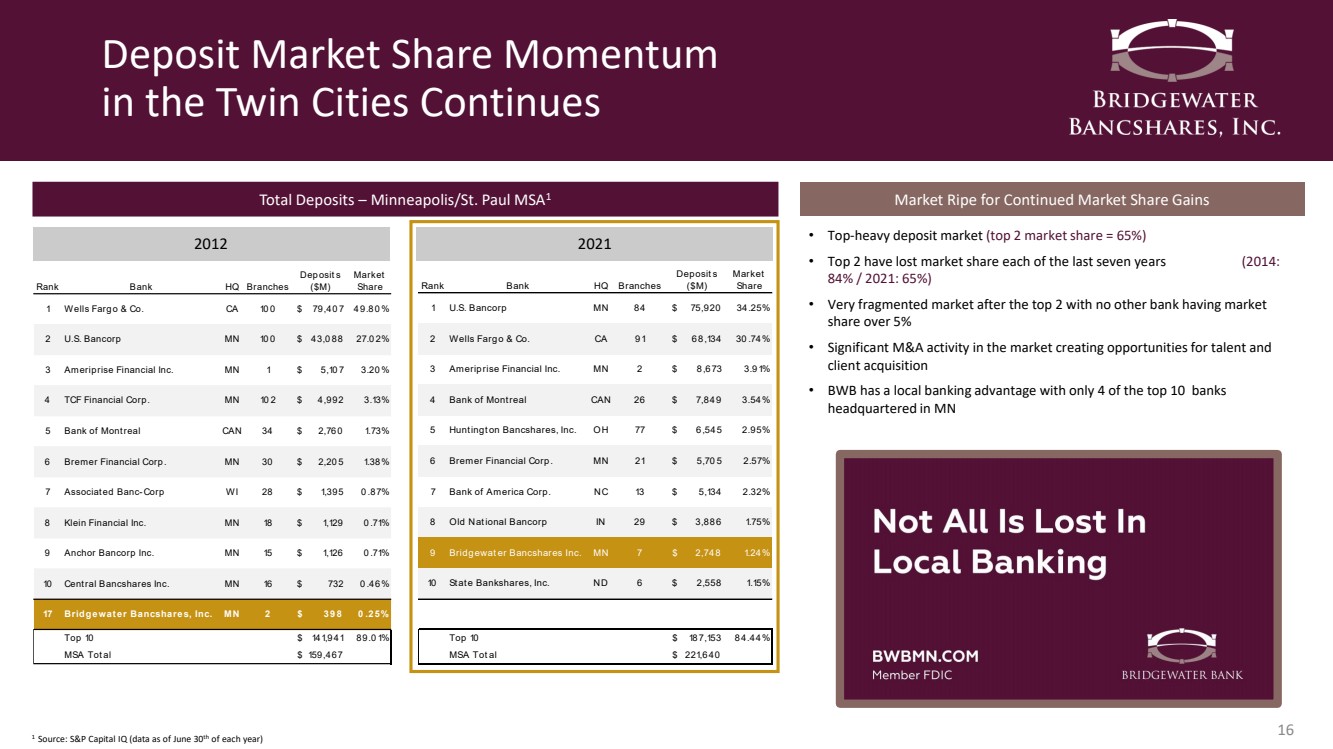
| Deposit Market Share Momentum in the Twin Cities Continues 16 Total Deposits – Minneapolis/St. Paul MSA 1 2012 2021 Market Ripe for Continued Market Share Gains • Top - heavy deposit market (top 2 market share = 65%) • Top 2 have lost market share each of the last seven years (2014: 84% / 2021: 65%) • Very fragmented market after the top 2 with no other bank having market share over 5% • Significant M&A activity in the market creating opportunities for talent and client acquisition • BWB has a local banking advantage with only 4 of the top 10 banks headquartered in MN 1 Source: S&P Capital IQ (data as of June 30 th of each year) Rank Bank HQ Branches Deposits ($M) Market Share 1 Wells Fargo & Co. CA 100 79,407 $ 49.80% 2 U.S. Bancorp MN 100 43,088 $ 27.02% 3 Ameriprise Financial Inc. MN 1 5,107 $ 3.20% 4 TCF Financial Corp. MN 102 4,992 $ 3.13% 5 Bank of Montreal CAN 34 2,760 $ 1.73% 6 Bremer Financial Corp. MN 30 2,205 $ 1.38% 7 Associated Banc-Corp WI 28 1,395 $ 0.87% 8 Klein Financial Inc. MN 18 1,129 $ 0.71% 9 Anchor Bancorp Inc. MN 15 1,126 $ 0.71% 10 Central Bancshares Inc. MN 16 732 $ 0.46% 17 Bridgewater Bancshares, Inc. MN 2 398 $ 0.25% Top 10 141,941 $ 89.01% MSA Total 159,467 $ Rank Bank HQ Branches Deposits ($M) Market Share 1 U.S. Bancorp MN 84 75,920 $ 34.25% 2 Wells Fargo & Co. CA 91 68,134 $ 30.74% 3 Ameriprise Financial Inc. MN 2 8,673 $ 3.91% 4 Bank of Montreal CAN 26 7,849 $ 3.54% 5 Huntington Bancshares, Inc. OH 77 6,545 $ 2.95% 6 Bremer Financial Corp. MN 21 5,705 $ 2.57% 7 Bank of America Corp. NC 13 5,134 $ 2.32% 8 Old National Bancorp IN 29 3,886 $ 1.75% 9 Bridgewater Bancshares Inc. MN 7 2,748 $ 1.24% 10 State Bankshares, Inc. ND 6 2,558 $ 1.15% Top 10 187,153 $ 84.44% MSA Total 221,640 $ |
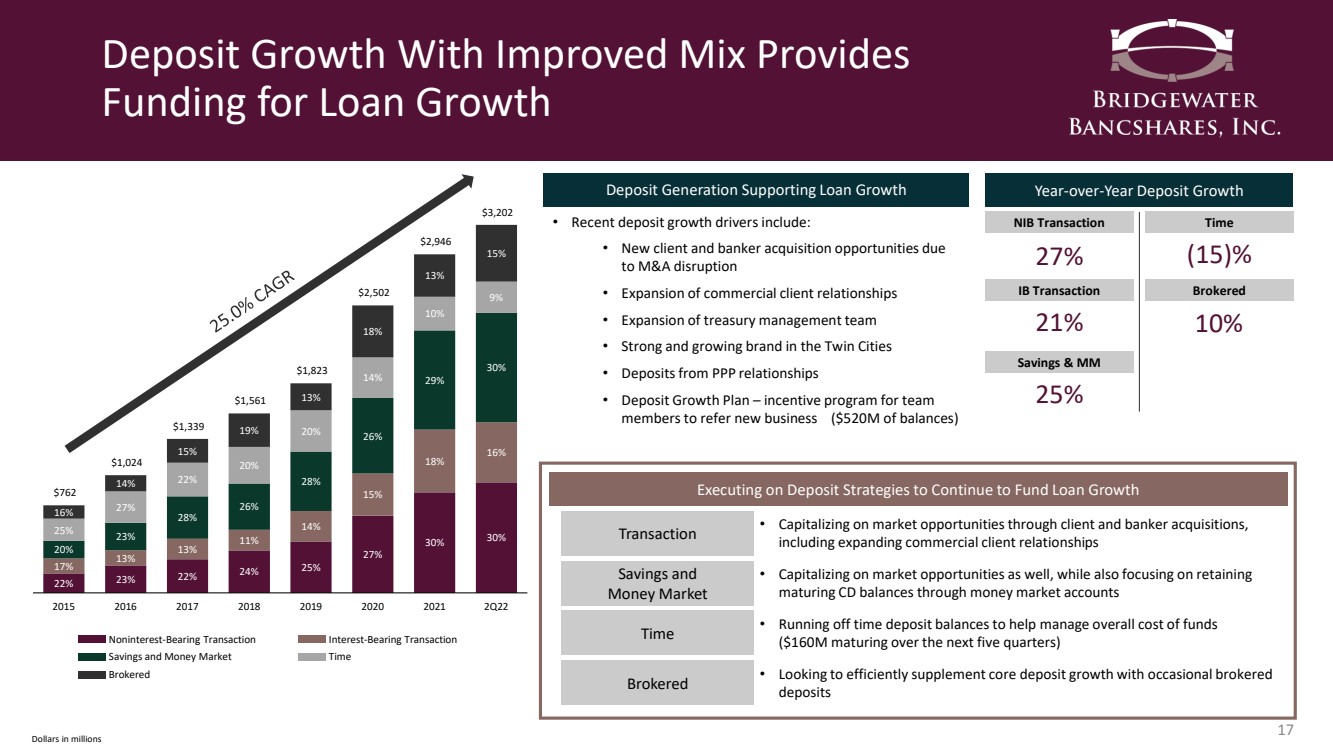
| Deposit Growth With Improved Mix Provides Funding for Loan Growth 17 22% 23% 22% 24% 25% 27% 30% 30% 17% 13% 13% 11% 14% 15% 18% 16% 20% 23% 28% 26% 28% 26% 29% 30% 25% 27% 22% 20% 20% 14% 10% 9% 16% 14% 15% 19% 13% 18% 13% 15% $762 $1,024 $1,339 $1,561 $1,823 $2,502 $2,946 $3,202 2015 2016 2017 2018 2019 2020 2021 2Q22 Interest - Bearing Transaction Noninterest - Bearing Transaction Time Savings and Money Market Brokered Year - over - Year Deposit Growth 27% NIB Transaction Dollars in millions Deposit Generation Supporting Loan Growth • Recent deposit growth drivers include: • New client and banker acquisition opportunities due to M&A disruption • Expansion of commercial client relationships • Expansion of treasury management team • Strong and growing brand in the Twin Cities • Deposits from PPP relationships • Deposit Growth Plan – incentive program for team members to refer new business ($520M of balances) Time IB Transaction Brokered Savings & MM 21% 25% (15)% 10% Executing on Deposit Strategies to Continue to Fund Loan Growth • Capitalizing on market opportunities through client and banker acquisitions, including expanding commercial client relationships Transaction • Capitalizing on market opportunities as well, while also focusing on retaining maturing CD balances through money market accounts Savings and Money Market • Running off time deposit balances to help manage overall cost of funds ($160M maturing over the next five quarters) Time • Looking to efficiently supplement core deposit growth with occasional brokered deposits Brokered |
| Scaling Enterprise Risk Management Across a Growing Organization 18 Manage and mitigate dynamic risks while enhancing shareholder value, being responsive to clients, and delivering simple solutions in unconventional ways BWB Risk Management Philosophy Enterprise Risk Management Attributes in Place Today at BWB • Proactively addressing emerging risks across all risk categories • Continuing to scale a risk framework aligned with superior asset growth • Enhancing our comprehensive Risk Appetite Statement to bring efficiencies to governance and oversight structures • Leveraging technology to enhance processes and controls while driving responsiveness • Reinforcing operational and financial resilience through all three lines of defense • Making investments to bolster vendor/third - party risk management program • Proactively making enhancements to ESG and DEI programs as well as committing to recruitment and retention strategies Making Investments to Proactively Identify and Mitigate Emerging Risks Credit Concentration Risk Information and Cybersecurity Risk Enterprise Risk and Compliance Financial Risk • Strong credit underwriting and administration program • Active credit oversight, analytics and portfolio monitoring • Expertise and specialization in key portfolios, including multifamily • Investment in enhanced infrastructure and security protocols • Proactively leverage technology to meet the evolving digital needs of clients while maintaining safety and security • Effective risk culture and awareness model with ongoing training initiatives • Focus on recruitment and retention of highly skilled risk professionals across the bank • Investments in technology to enable scalable and effective governance and oversight • Proactively monitoring internal and external trends to quantify changes in risk profile • Maintain compliance with evolving regulatory expectations • Monitoring and managing the balance sheet with an eye toward economic and interest rate volatility • Actively monitoring and deploying liquidity and developing long - term strategies for capital preservation • Continued investments in CECL prep, LIBOR transition and SOX implementation |

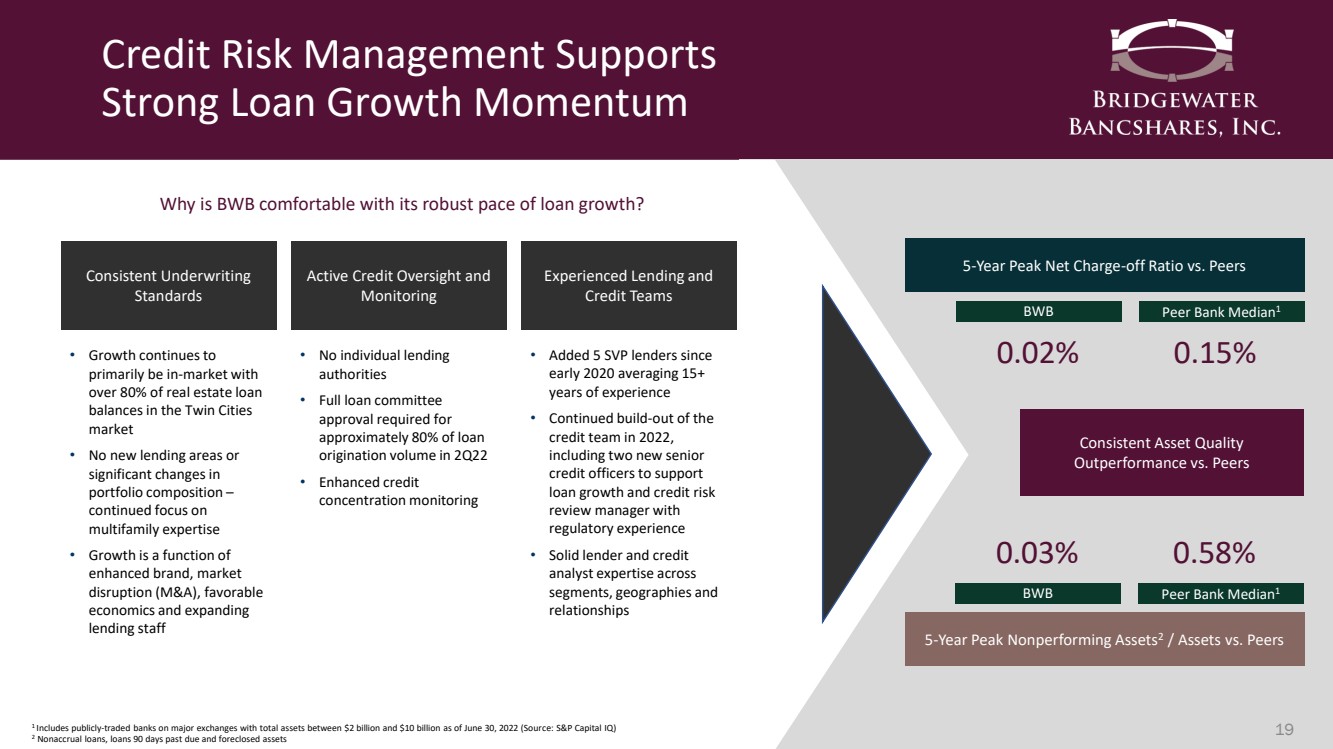
| Credit Risk Management Supports Strong Loan Growth Momentum 19 5 - Year Peak Net Charge - off Ratio vs. Peers 5 - Year Peak Nonperforming Assets 2 / Assets vs. Peers 0.02% BWB Peer Bank Median 1 0.15% 0.03% BWB Peer Bank Median 1 0.58% 1 Includes publicly - traded banks on major exchanges with total assets between $2 billion and $10 billion as of June 30, 2022 (Sour ce: S&P Capital IQ) 2 Nonaccrual loans, loans 90 days past due and foreclosed assets Consistent Asset Quality Outperformance vs. Peers Why is BWB comfortable with its robust pace of loan growth? Consistent Underwriting Standards Active Credit Oversight and Monitoring Experienced Lending and Credit Teams • Growth continues to primarily be in - market with over 80% of real estate loan balances in the Twin Cities market • No new lending areas or significant changes in portfolio composition – continued focus on multifamily expertise • Growth is a function of enhanced brand, market disruption (M&A), favorable economics and expanding lending staff • No individual lending authorities • Full loan committee approval required for approximately 80% of loan origination volume in 2Q22 • Enhanced credit concentration monitoring • Added 5 SVP lenders since early 2020 averaging 15+ years of experience • Continued build - out of the credit team in 2022, including two new senior credit officers to support loan growth and credit risk review manager with regulatory experience • Solid lender and credit analyst expertise across segments, geographies and relationships |
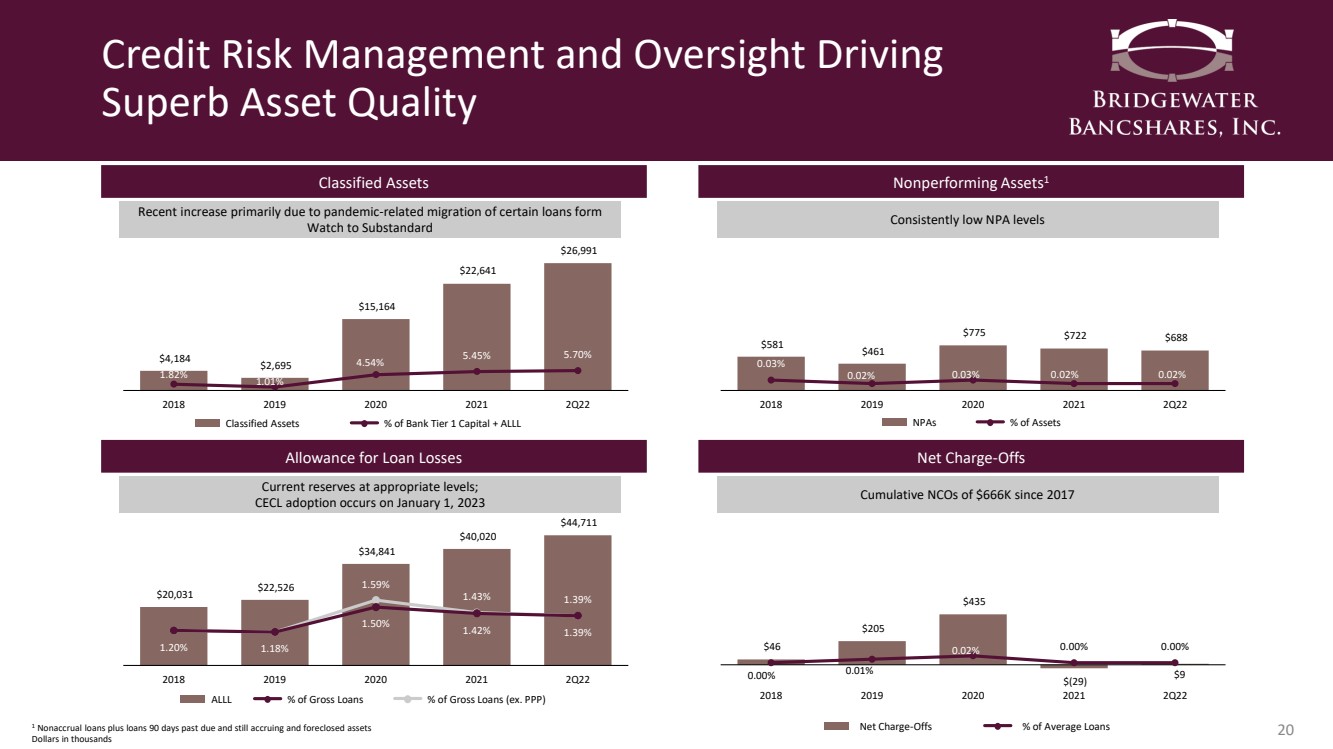
| 1 Nonaccrual loans plus loans 90 days past due and still accruing and foreclosed assets Dollars in thousands Credit Risk Management and Oversight Driving Superb Asset Quality 20 $581 $461 $775 $722 $688 0.03% 0.02% 0.03% 0.02% 0.02% 2018 2019 2020 2021 2Q22 Nonperforming Assets 1 Consistently low NPA levels NPAs % of Assets $20,031 $22,526 $34,841 $40,020 $44,711 1.59% 1.43% 1.39% 1.20% 1.18% 1.50% 1.42% 1.39% 2018 2019 2020 2021 2Q22 Allowance for Loan Losses Current reserves at appropriate levels; CECL adoption occurs on January 1, 2023 ALLL % of Gross Loans $46 $205 $435 $(29) $9 0.00% 0.01% 0.02% 0.00% 0.00% 2018 2019 2020 2021 2Q22 Net Charge - Offs Cumulative NCOs of $666K since 2017 Net Charge - Offs % of Average Loans % of Gross Loans (ex. PPP) $4,184 $2,695 $15,164 $22,641 $26,991 1.82% 1.01% 4.54% 5.45% 5.70% 2018 2019 2020 2021 2Q22 Classified Assets Recent increase primarily due to pandemic - related migration of certain loans form Watch to Substandard Classified Assets % of Bank Tier 1 Capital + ALLL |
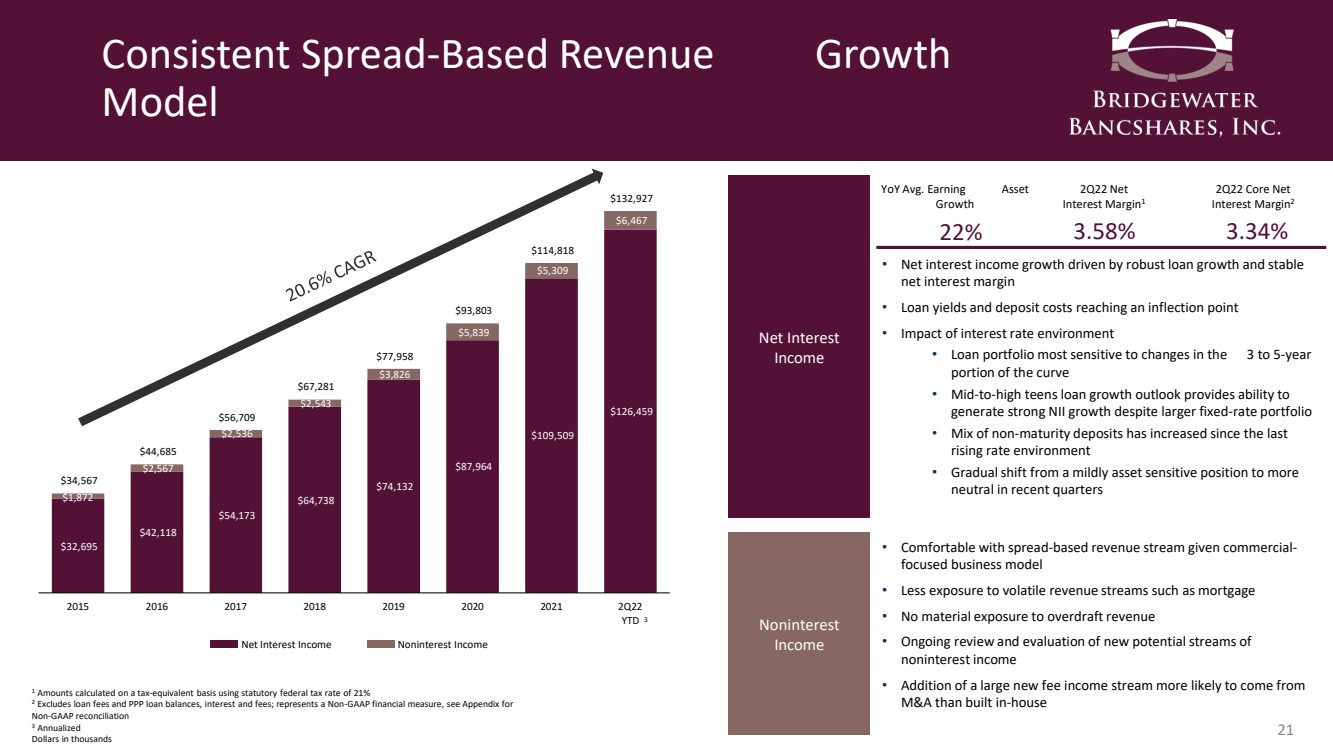
| Consistent Spread - Based Revenue Growth Model 21 Noninterest Income Net Interest Income 1 Amounts calculated on a tax - equivalent basis using statutory federal tax rate of 21% 2 Excludes loan fees and PPP loan balances, interest and fees; represents a Non - GAAP financial measure, see Appendix for Non - GAAP reconciliation 3 Annualized Dollars in thousands Net Interest Income Noninterest Income 22% YoY Avg. Earning Asset Growth 3.58% 3.34% 2Q22 Core Net Interest Margin 2 2Q22 Net Interest Margin 1 • Net interest income growth driven by robust loan growth and stable net interest margin • Loan yields and deposit costs reaching an inflection point • Impact of interest rate environment • Loan portfolio most sensitive to changes in the 3 to 5 - year portion of the curve • Mid - to - high teens loan growth outlook provides ability to generate strong NII growth despite larger fixed - rate portfolio • Mix of non - maturity deposits has increased since the last rising rate environment • Gradual shift from a mildly asset sensitive position to more neutral in recent quarters 3 • Comfortable with spread - based revenue stream given commercial - focused business model • Less exposure to volatile revenue streams such as mortgage • No material exposure to overdraft revenue • Ongoing review and evaluation of new potential streams of noninterest income • Addition of a large new fee income stream more likely to come from M&A than built in - house $32,695 $42,118 $54,173 $64,738 $74,132 $87,964 $109,509 $126,459 $1,872 $2,567 $2,536 $2,543 $3,826 $5,839 $5,309 $6,467 $34,567 $44,685 $56,709 $67,281 $77,958 $93,803 $114,818 $132,927 2015 2016 2017 2018 2019 2020 2021 2Q22 YTD |
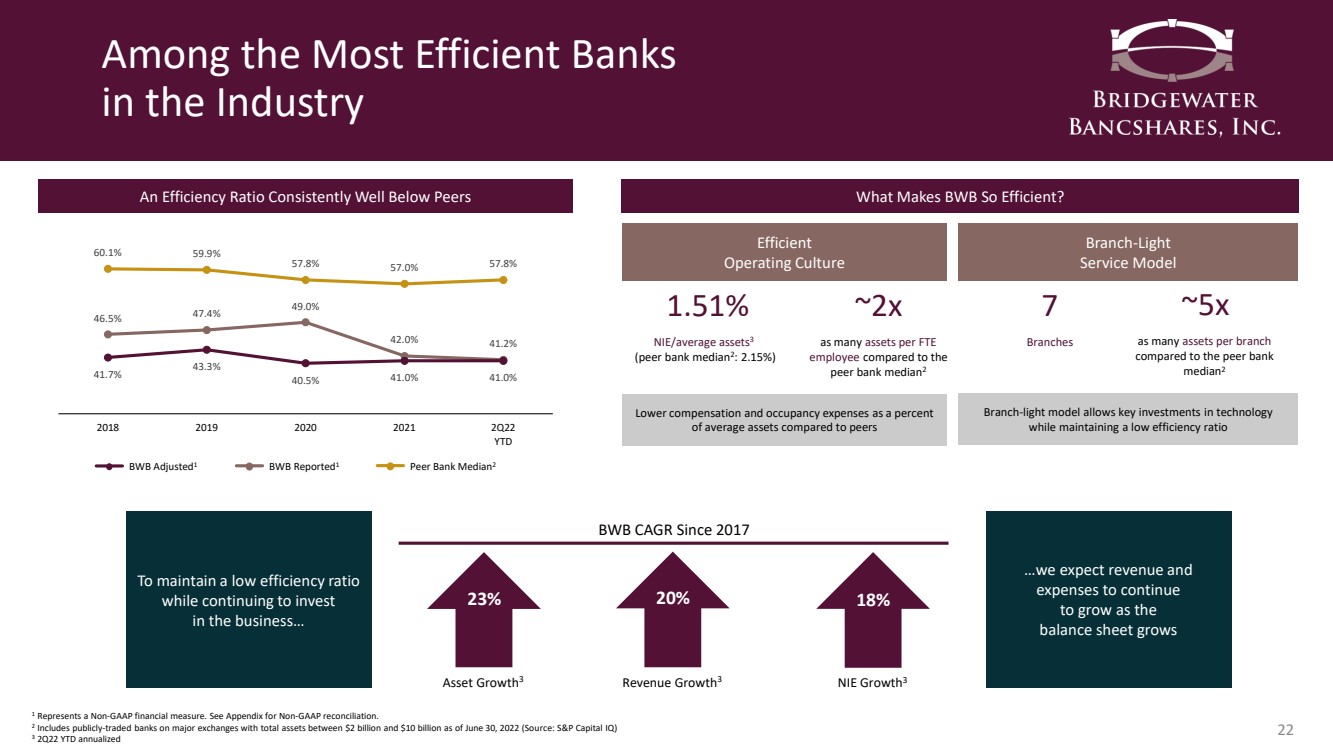
| 46.5% 47.4% 49.0% 42.0% 41.2% 41.7% 43.3% 40.5% 41.0% 41.0% 60.1% 59.9% 57.8% 57.0% 57.8% 2018 2019 2020 2021 2Q22 YTD Among the Most Efficient Banks in the Industry 22 BWB Adjusted 1 BWB Reported 1 An Efficiency Ratio Consistently Well Below Peers Peer Bank Median 2 1 Represents a Non - GAAP financial measure. See Appendix for Non - GAAP reconciliation. 2 Includes publicly - traded banks on major exchanges with total assets between $2 billion and $10 billion as of June 30, 2022 (Sou rce: S&P Capital IQ) 3 2Q22 YTD annualized What Makes BWB So Efficient? Efficient Operating Culture ~2x as many assets per FTE employee compared to the peer bank median 2 1.51% NIE/average assets 3 (peer bank median 2 : 2.15%) 7 Branches ~5x as many assets per branch compared to the peer bank median 2 Lower compensation and occupancy expenses as a percent of average assets compared to peers Branch - Light Service Model Branch - light model allows key investments in technology while maintaining a low efficiency ratio To maintain a low efficiency ratio while continuing to invest in the business… BWB CAGR Since 2017 Asset Growth 3 Revenue Growth 3 NIE Growth 3 23% 20% 18% …we expect revenue and expenses to continue to grow as the balance sheet grows |
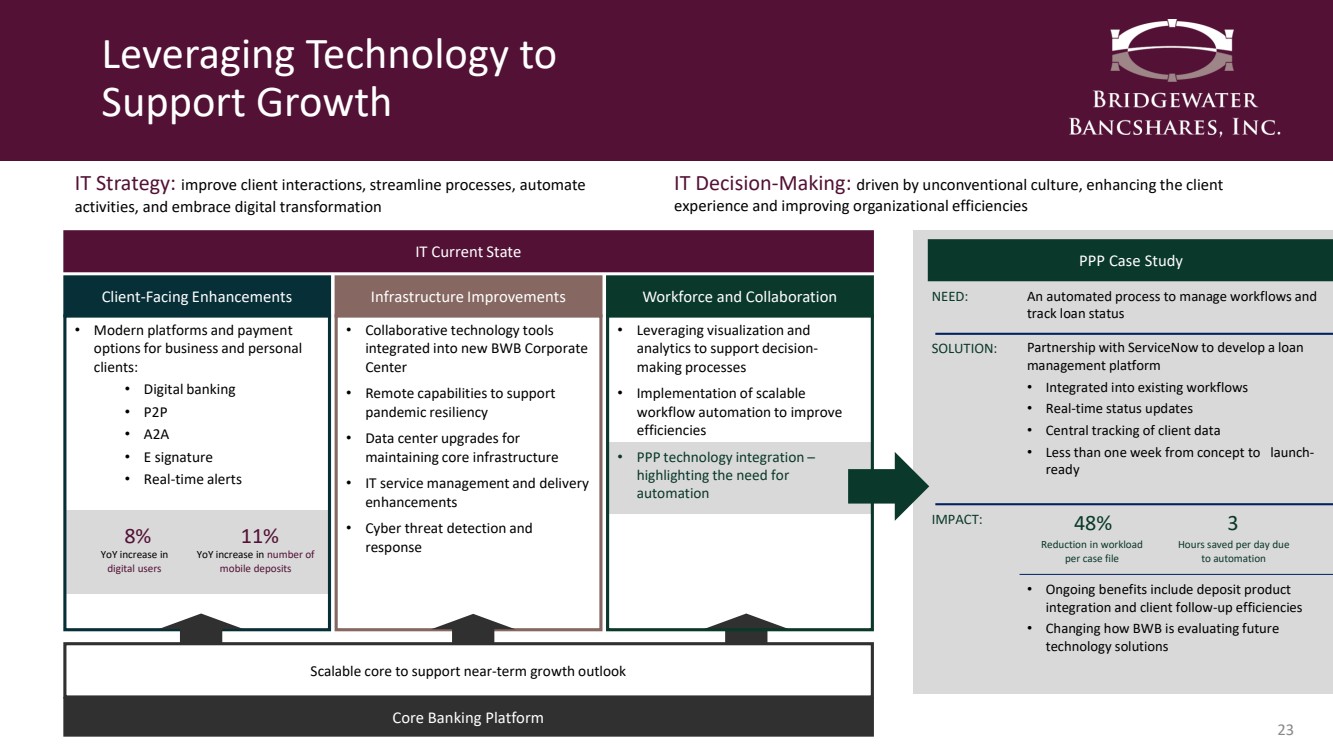
| Leveraging Technology to Support Growth 23 Client - Facing Enhancements • Modern platforms and payment options for business and personal clients: • Digital banking • P2P • A2A • E signature • Real - time alerts 8% YoY increase in digital users 11% YoY increase in number of mobile deposits Scalable core to support near - term growth outlook Core Banking Platform IT Strategy: improve client interactions, streamline processes, automate activities, and embrace digital transformation IT Decision - Making: driven by unconventional culture, enhancing the client experience and improving organizational efficiencies IT Current State Infrastructure Improvements • Collaborative technology tools integrated into new BWB Corporate Center • Remote capabilities to support pandemic resiliency • Data center upgrades for maintaining core infrastructure • IT service management and delivery enhancements • Cyber threat detection and response Workforce and Collaboration • Leveraging visualization and analytics to support decision - making processes • Implementation of scalable workflow automation to improve efficiencies • PPP technology integration – highlighting the need for automation NEED: PPP Case Study An automated process to manage workflows and track loan status SOLUTION: Partnership with ServiceNow to develop a loan management platform • Integrated into existing workflows • Real - time status updates • Central tracking of client data • Less than one week from concept to launch - ready IMPACT: • Ongoing benefits include deposit product integration and client follow - up efficiencies • Changing how BWB is evaluating future technology solutions 48% Reduction in workload per case file 3 Hours saved per day due to automation |
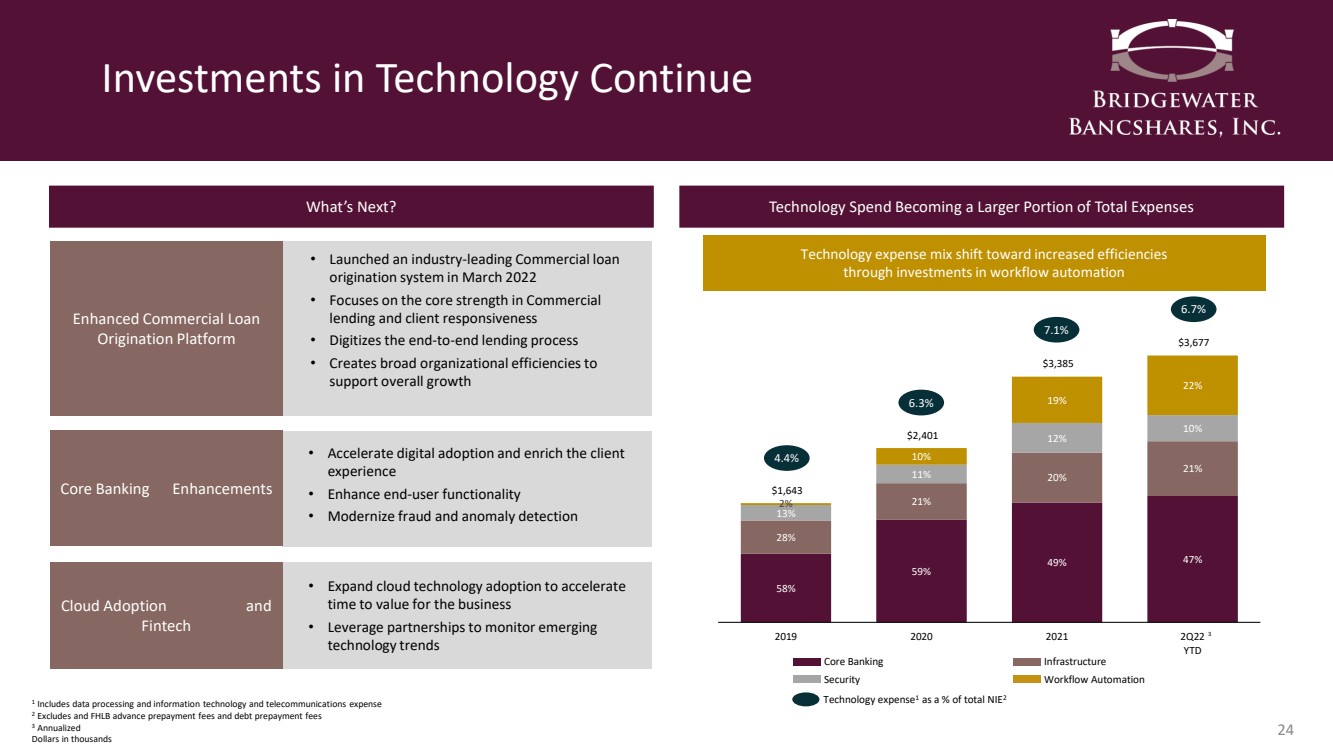
| Investments in Technology Continue 24 What’s Next? Core Banking Enhancements • Expand cloud technology adoption to accelerate time to value for the business • Leverage partnerships to monitor emerging technology trends Cloud Adoption and Fintech Technology Spend Becoming a Larger Portion of Total Expenses 58% 59% 49% 47% 28% 21% 20% 21% 13% 11% 12% 10% 2% 10% 19% 22% $1,643 $2,401 $3,385 $3,677 2019 2020 2021 2Q22 YTD 1 Includes data processing and information technology and telecommunications expense 2 Excludes and FHLB advance prepayment fees and debt prepayment fees 3 Annualized Dollars in thousands Technology expense mix shift toward increased efficiencies through investments in workflow automation Infrastructure Core Banking Workflow Automation Security 4.4% 6.3 % 7.1 % 6.7 % • Accelerate digital adoption and enrich the client experience • Enhance end - user functionality • Modernize fraud and anomaly detection Technology expense 1 as a % of total NIE 2 3 Enhanced Commercial Loan Origination Platform • Launched an industry - leading Commercial loan origination system in March 2022 • Focuses on the core strength in Commercial lending and client responsiveness • Digitizes the end - to - end lending process • Creates broad organizational efficiencies to support overall growth |
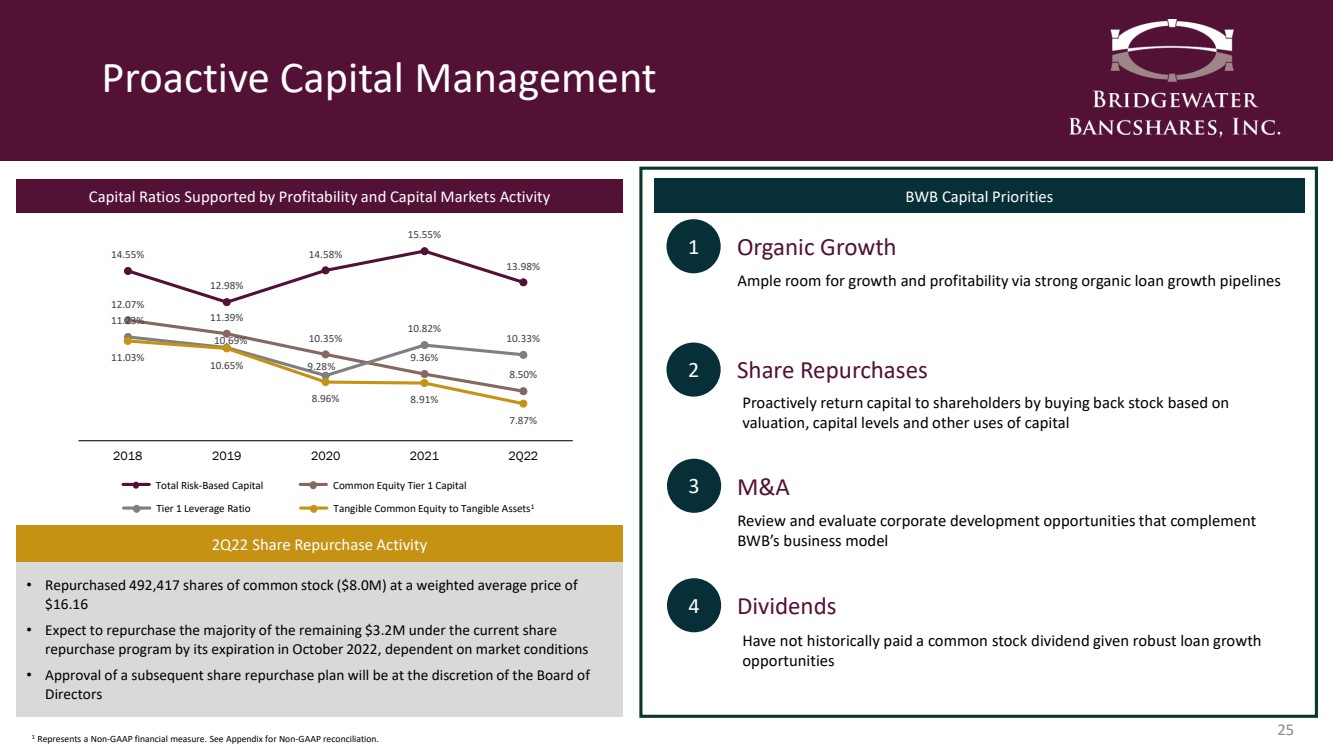
| Proactive Capital Management 25 14.55% 12.98% 14.58% 15.55% 13.98% 12.07% 11.39% 10.35% 9.36% 8.50% 11.23% 10.69% 9.28% 10.82% 10.33% 11.03% 10.65% 8.96% 8.91% 7.87% 2018 2019 2020 2021 2Q22 Total Risk - Based Capital Common Equity Tier 1 Capital Capital Ratios Supported by Profitability and Capital Markets Activity Tangible Common Equity to Tangible Assets 1 1 Represents a Non - GAAP financial measure. See Appendix for Non - GAAP reconciliation. BWB Capital Priorities 1 2 3 Organic Growth Share Repurchases M&A 4 Dividends Ample room for growth and profitability via strong organic loan growth pipelines Proactively return capital to shareholders by buying back stock based on valuation, capital levels and other uses of capital Review and evaluate corporate development opportunities that complement BWB’s business model Have not historically paid a common stock dividend given robust loan growth opportunities Tier 1 Leverage Ratio • Repurchased 492,417 shares of common stock ($8.0M) at a weighted average price of $16.16 • Expect to repurchase the majority of the remaining $3.2M under the current share repurchase program by its expiration in October 2022, dependent on market conditions • Approval of a subsequent share repurchase plan will be at the discretion of the Board of Directors 2Q22 Share Repurchase Activity |
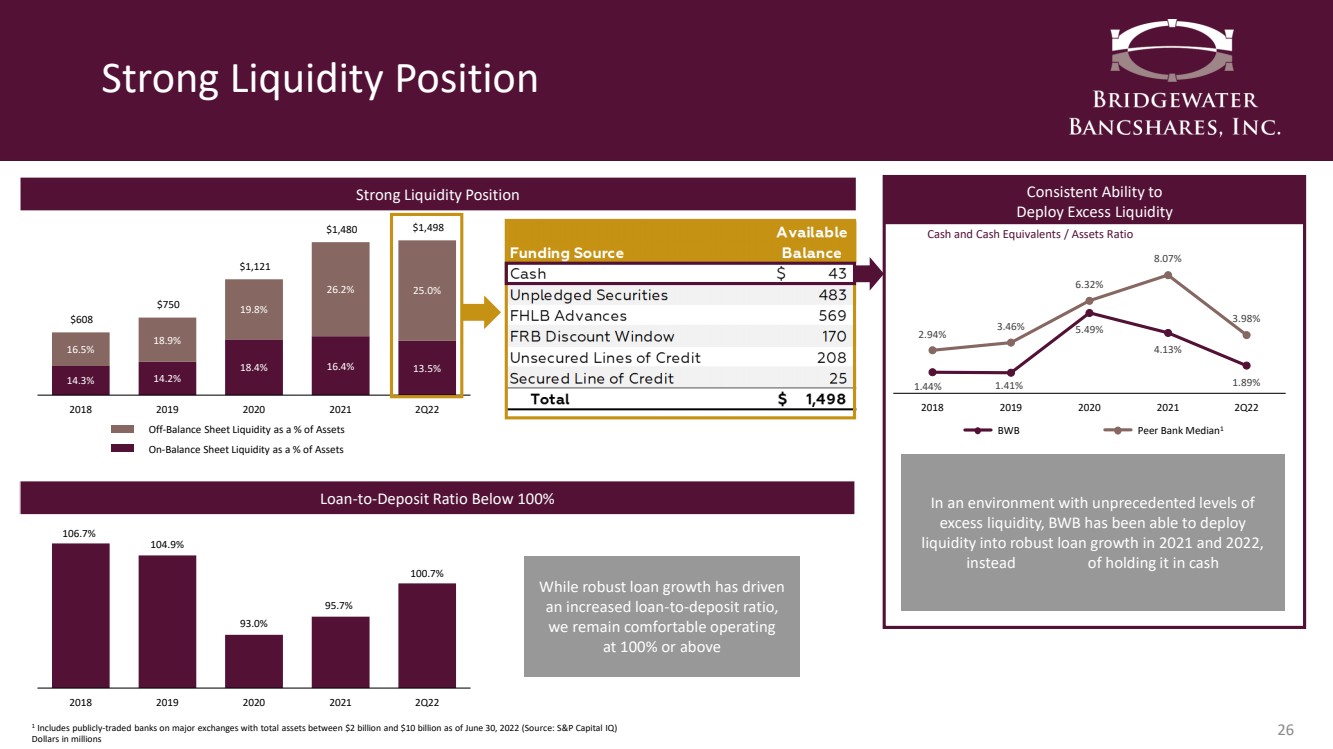
| Strong Liquidity Position 26 14.3% 14.2% 18.4% 16.4% 13.5% 16.5% 18.9% 19.8% 26.2% 25.0% $608 $750 $1,121 $1,480 $1,498 2018 2019 2020 2021 2Q22 Strong Liquidity Position Off - Balance Sheet Liquidity as a % of Assets On - Balance Sheet Liquidity as a % of Assets 106.7% 104.9% 93.0% 95.7% 100.7% 2018 2019 2020 2021 2Q22 While robust loan growth has driven an increased loan - to - deposit ratio, we remain comfortable operating at 100% or above Loan - to - Deposit Ratio Below 100% 1.44% 1.41% 5.49% 4.13% 1.89% 2.94% 3.46% 6.32% 8.07% 3.98% 2018 2019 2020 2021 2Q22 Consistent Ability to Deploy Excess Liquidity In an environment with unprecedented levels of excess liquidity, BWB has been able to deploy liquidity into robust loan growth in 2021 and 2022, instead of holding it in cash BWB Peer Bank Median 1 Cash and Cash Equivalents / Assets Ratio 1 Includes publicly - traded banks on major exchanges with total assets between $2 billion and $10 billion as of June 30, 2022 (Sou rce: S&P Capital IQ) Dollars in millions |
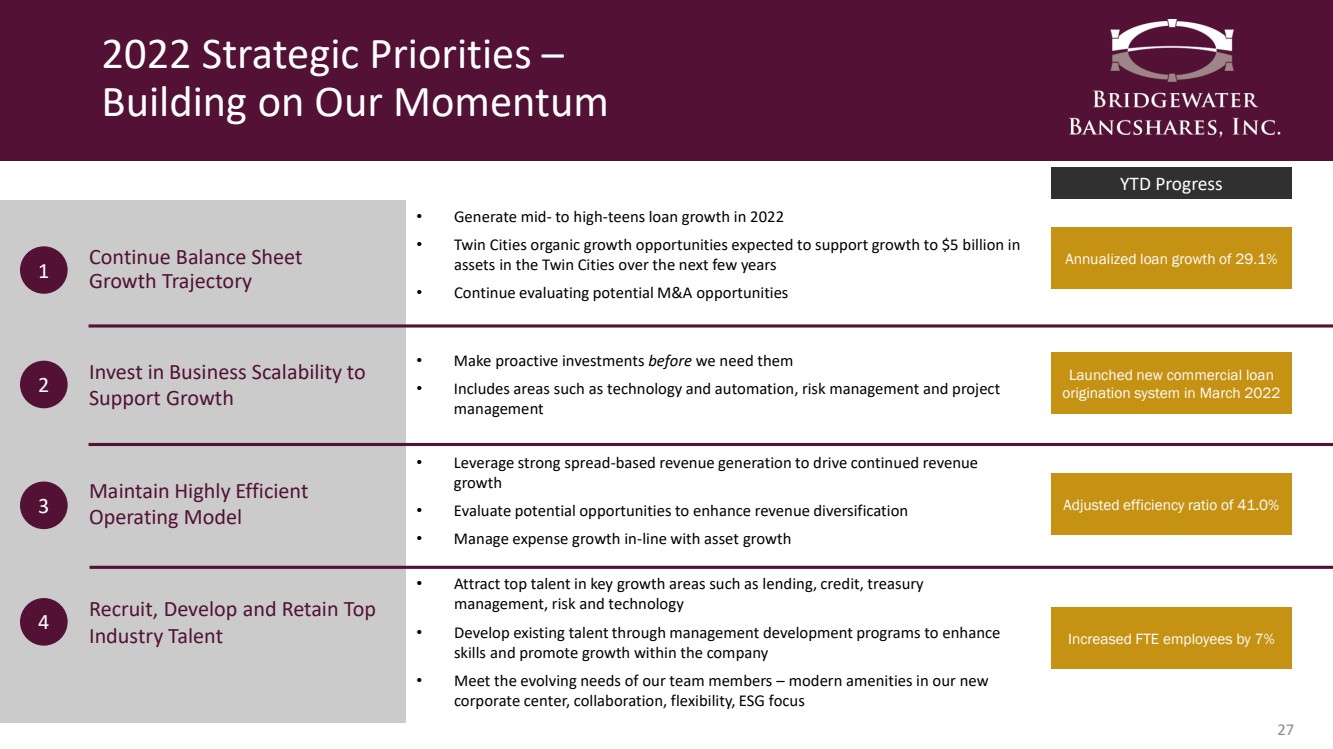
| 2022 Strategic Priorities – Building on Our Momentum 27 Continue Balance Sheet Growth Trajectory 1 2 3 4 Invest in Business Scalability to Support Growth Maintain Highly Efficient Operating Model Recruit, Develop and Retain Top Industry Talent • Generate mid - to high - teens loan growth in 2022 • Twin Cities organic growth opportunities expected to support growth to $5 billion in assets in the Twin Cities over the next few years • Continue evaluating potential M&A opportunities • Make proactive investments before we need them • Includes areas such as technology and automation, risk management and project management • Leverage strong spread - based revenue generation to drive continued revenue growth • Evaluate potential opportunities to enhance revenue diversification • Manage expense growth in - line with asset growth • Attract top talent in key growth areas such as lending, credit, treasury management, risk and technology • Develop existing talent through management development programs to enhance skills and promote growth within the company • Meet the evolving needs of our team members – modern amenities in our new corporate center, collaboration, flexibility, ESG focus YTD Progress Annualized loan growth of 29.1% Launched new commercial loan origination system in March 2022 Adjusted efficiency ratio of 41.0% Increased FTE employees by 7% |
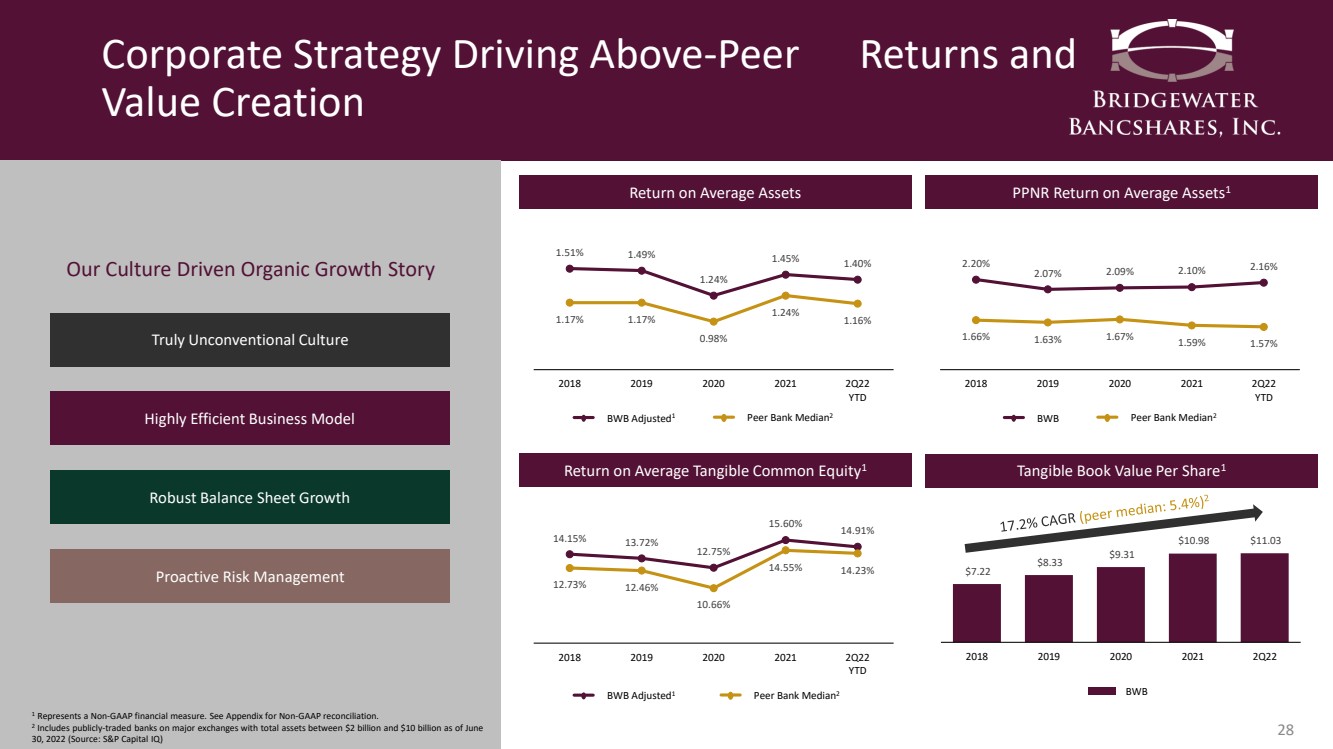
| Corporate Strategy Driving Above - Peer Returns and Value Creation 28 Truly Unconventional Culture Highly Efficient Business Model Robust Balance Sheet Growth Proactive Risk Management Our Culture Driven Organic Growth Story Return on Average Assets 1.51% 1.49% 1.24% 1.45% 1.40% 1.17% 1.17% 0.98% 1.24% 1.16% 2018 2019 2020 2021 2Q22 YTD BWB Adjusted 1 Peer Bank Median 2 PPNR Return on Average Assets 1 2.20% 2.07% 2.09% 2.10% 2.16% 1.66% 1.63% 1.67% 1.59% 1.57% 2018 2019 2020 2021 2Q22 YTD BWB Peer Bank Median 2 Return on Average Tangible Common Equity 1 14.15% 13.72% 12.75% 15.60% 14.91% 12.73% 12.46% 10.66% 14.55% 14.23% 2018 2019 2020 2021 2Q22 YTD BWB Adjusted 1 Peer Bank Median 2 Tangible Book Value Per Share 1 $7.22 $8.33 $9.31 $10.98 $11.03 2018 2019 2020 2021 2Q22 BWB 1 Represents a Non - GAAP financial measure. See Appendix for Non - GAAP reconciliation. 2 Includes publicly - traded banks on major exchanges with total assets between $2 billion and $10 billion as of June 30, 2022 (Source: S&P Capital IQ) |
|

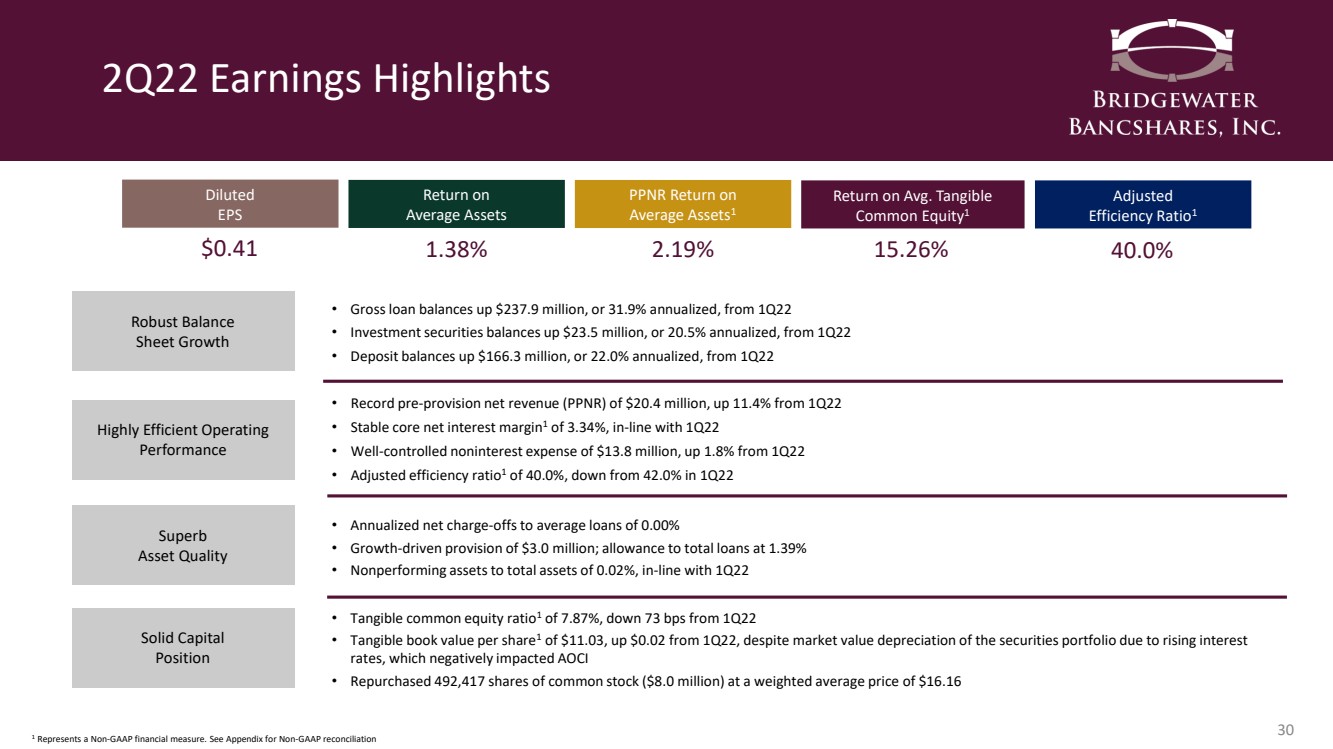
| 2Q22 Earnings Highlights 30 • Gross loan balances up $237.9 million, or 31.9% annualized, from 1Q22 • Investment securities balances up $23.5 million, or 20.5% annualized, from 1Q22 • Deposit balances up $166.3 million, or 22.0% annualized, from 1Q22 • Record pre - provision net revenue (PPNR) of $20.4 million, up 11.4% from 1Q22 • Stable core net interest margin 1 of 3.34%, in - line with 1Q22 • Well - controlled noninterest expense of $13.8 million, up 1.8% from 1Q22 • Adjusted efficiency ratio 1 of 40.0%, down from 42.0% in 1Q22 • Annualized net charge - offs to average loans of 0.00% • Growth - driven provision of $3.0 million; allowance to total loans at 1.39% • Nonperforming assets to total assets of 0.02%, in - line with 1Q22 • Tangible common equity ratio 1 of 7.87%, down 73 bps from 1Q22 • Tangible book value per share 1 of $11.03, up $0.02 from 1Q22, despite market value depreciation of the securities portfolio due to rising interest rates, which negatively impacted AOCI • Repurchased 492,417 shares of common stock ($8.0 million) at a weighted average price of $16.16 Robust Balance Sheet Growth Highly Efficient Operating Performance Superb Asset Quality Solid Capital Position $0.41 Diluted EPS Adjusted Efficiency Ratio 1 Return on Avg. Tangible Common Equity 1 Return on Average Assets PPNR Return on Average Assets 1 1.38% 2.19% 15.26% 40.0% 1 Represents a Non - GAAP financial measure. See Appendix for Non - GAAP reconciliation |
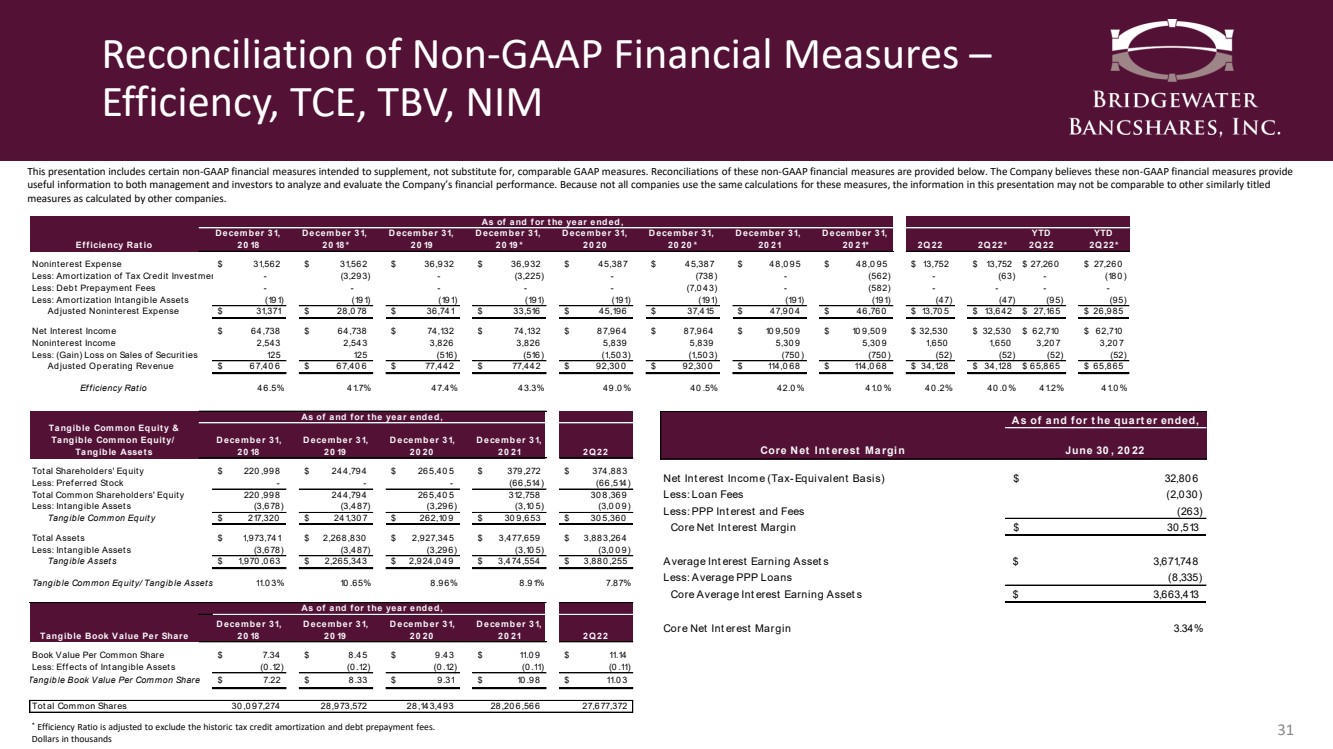
| Reconciliation of Non - GAAP Financial Measures – Efficiency, TCE, TBV, NIM 31 This presentation includes certain non - GAAP financial measures intended to supplement, not substitute for, comparable GAAP measu res. Reconciliations of these non - GAAP financial measures are provided below. The Company believes these non - GAAP financial meas ures provide useful information to both management and investors to analyze and evaluate the Company’s financial performance. Because not all companies use the same calculations for these measures, the information in this presentation may not be comparable to other s im ilarly titled measures as calculated by other companies. * Efficiency Ratio is adjusted to exclude the historic tax credit amortization and debt prepayment fees. Dollars in thousands Core Net Interest Margin June 30, 2022 Net Interest Income (Tax-Equivalent Basis) 32,806 $ Less: Loan Fees (2,030) Less: PPP Interest and Fees (263) Core Net Interest Margin 30,513 $ Average Interest Earning Assets 3,671,748 $ Less: Average PPP Loans (8,335) Core Average Interest Earning Assets 3,663,413 $ Core Net Interest Margin 3.34% As of and for the quarter ended, December 31, December 31, December 31, December 31, December 31, December 31, December 31, December 31, YTD YTD Efficiency Ratio 2018 2018* 2019 2019* 2020 2020* 2021 2021* 2Q22 2Q22* 2Q22 2Q22* Noninterest Expense 31,562 $ 31,562 $ 36,932 $ 36,932 $ 45,387 $ 45,387 $ 48,095 $ 48,095 $ 13,752 $ 13,752 $ 27,260 $ 27,260 $ Less: Amortization of Tax Credit Investments - (3,293) - (3,225) - (738) - (562) - (63) - (180) Less: Debt Prepayment Fees - - - - - (7,043) - (582) - - - - Less: Amortization Intangible Assets (191) (191) (191) (191) (191) (191) (191) (191) (47) (47) (95) (95) Adjusted Noninterest Expense 31,371 $ 28,078 $ 36,741 $ 33,516 $ 45,196 $ 37,415 $ 47,904 $ 46,760 $ 13,705 $ 13,642 $ 27,165 $ 26,985 $ Net Interest Income 64,738 $ 64,738 $ 74,132 $ 74,132 $ 87,964 $ 87,964 $ 109,509 $ 109,509 $ 32,530 $ 32,530 $ 62,710 $ 62,710 $ Noninterest Income 2,543 2,543 3,826 3,826 5,839 5,839 5,309 5,309 1,650 1,650 3,207 3,207 Less: (Gain) Loss on Sales of Securities 125 125 (516) (516) (1,503) (1,503) (750) (750) (52) (52) (52) (52) Adjusted Operating Revenue 67,406 $ 67,406 $ 77,442 $ 77,442 $ 92,300 $ 92,300 $ 114,068 $ 114,068 $ 34,128 $ 34,128 $ 65,865 $ 65,865 $ Efficiency Ratio 46.5% 41.7% 47.4% 43.3% 49.0% 40.5% 42.0% 41.0% 40.2% 40.0% 41.2% 41.0% Tangible Common Equity & Tangible Common Equity/ Tangible Assets December 31, 2018 December 31, 2019 December 31, 2020 December 31, 2021 2Q22 Total Shareholders' Equity 220,998 $ 244,794 $ 265,405 $ 379,272 $ 374,883 $ Less: Preferred Stock - - - (66,514) (66,514) Total Common Shareholders' Equity 220,998 244,794 265,405 312,758 308,369 Less: Intangible Assets (3,678) (3,487) (3,296) (3,105) (3,009) Tangible Common Equity 217,320 $ 241,307 $ 262,109 $ 309,653 $ 305,360 $ Total Assets 1,973,741 $ 2,268,830 $ 2,927,345 $ 3,477,659 $ 3,883,264 $ Less: Intangible Assets (3,678) (3,487) (3,296) (3,105) (3,009) Tangible Assets 1,970,063 $ 2,265,343 $ 2,924,049 $ 3,474,554 $ 3,880,255 $ Tangible Common Equity/Tangible Assets 11.03% 10.65% 8.96% 8.91% 7.87% Tangible Book Value Per Share December 31, 2018 December 31, 2019 December 31, 2020 December 31, 2021 2Q22 Book Value Per Common Share 7.34 $ 8.45 $ 9.43 $ 11.09 $ 11.14 $ Less: Effects of Intangible Assets (0.12) (0.12) (0.12) (0.11) (0.11) Tangible Book Value Per Common Share 7.22 $ 8.33 $ 9.31 $ 10.98 $ 11.03 $ Total Common Shares 30,097,274 28,973,572 28,143,493 28,206,566 27,677,372 As of and for the year ended, As of and for the year ended, As of and for the year ended, |
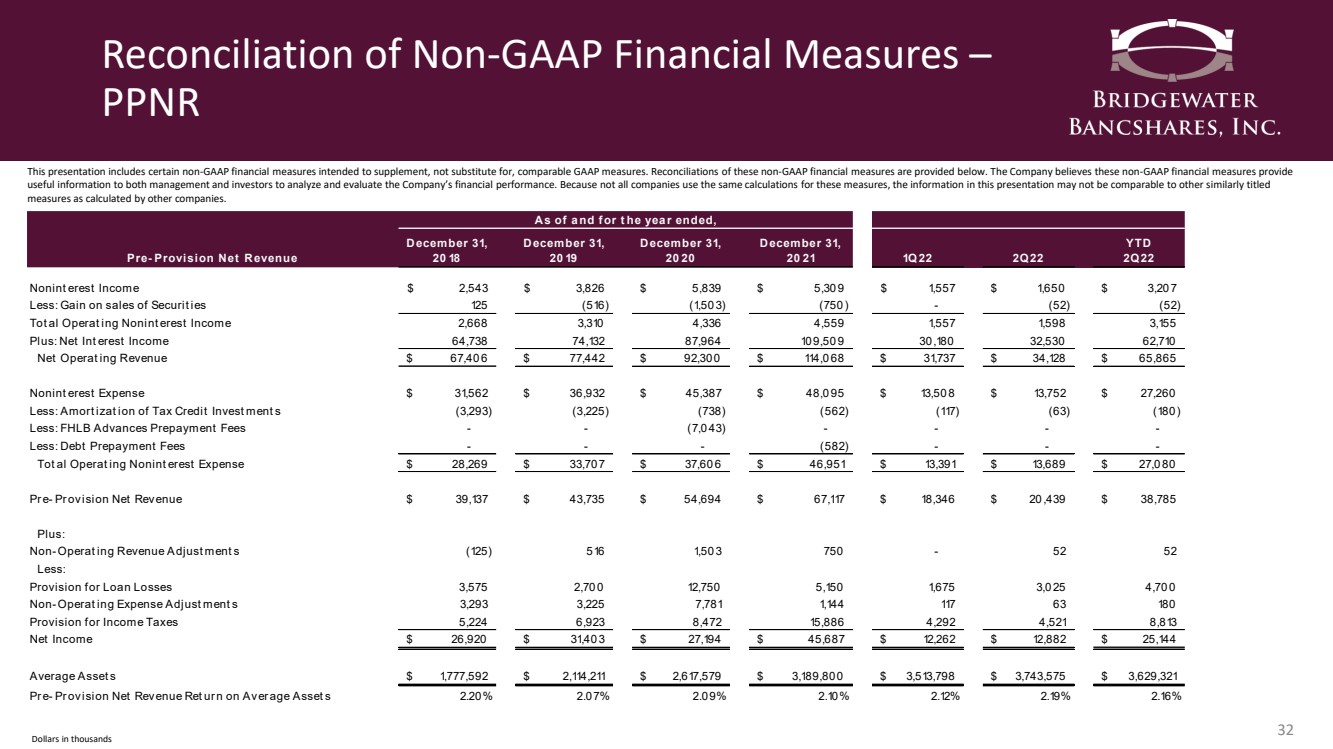
| Reconciliation of Non - GAAP Financial Measures – PPNR 32 This presentation includes certain non - GAAP financial measures intended to supplement, not substitute for, comparable GAAP measu res. Reconciliations of these non - GAAP financial measures are provided below. The Company believes these non - GAAP financial meas ures provide useful information to both management and investors to analyze and evaluate the Company’s financial performance. Because not all companies use the same calculations for these measures, the information in this presentation may not be comparable to other s im ilarly titled measures as calculated by other companies. Dollars in thousands Pre-Provision Net Revenue December 31, 2018 December 31, 2019 December 31, 2020 December 31, 2021 1Q22 2Q22 YTD 2Q22 Noninterest Income 2,543 $ 3,826 $ 5,839 $ 5,309 $ 1,557 $ 1,650 $ 3,207 $ Less: Gain on sales of Securities 125 (516) (1,503) (750) - (52) (52) Total Operating Noninterest Income 2,668 3,310 4,336 4,559 1,557 1,598 3,155 Plus: Net Interest Income 64,738 74,132 87,964 109,509 30,180 32,530 62,710 Net Operating Revenue 67,406 $ 77,442 $ 92,300 $ 114,068 $ 31,737 $ 34,128 $ 65,865 $ Noninterest Expense 31,562 $ 36,932 $ 45,387 $ 48,095 $ 13,508 $ 13,752 $ 27,260 $ Less: Amortization of Tax Credit Investments (3,293) (3,225) (738) (562) (117) (63) (180) Less: FHLB Advances Prepayment Fees - - (7,043) - - - - Less: Debt Prepayment Fees - - - (582) - - - Total Operating Noninterest Expense 28,269 $ 33,707 $ 37,606 $ 46,951 $ 13,391 $ 13,689 $ 27,080 $ Pre-Provision Net Revenue 39,137 $ 43,735 $ 54,694 $ 67,117 $ 18,346 $ 20,439 $ 38,785 $ Plus: Non-Operating Revenue Adjustments (125) 516 1,503 750 - 52 52 Less: Provision for Loan Losses 3,575 2,700 12,750 5,150 1,675 3,025 4,700 Non-Operating Expense Adjustments 3,293 3,225 7,781 1,144 117 63 180 Provision for Income Taxes 5,224 6,923 8,472 15,886 4,292 4,521 8,813 Net Income 26,920 $ 31,403 $ 27,194 $ 45,687 $ 12,262 $ 12,882 $ 25,144 $ Average Assets 1,777,592 $ 2,114,211 $ 2,617,579 $ 3,189,800 $ 3,513,798 $ 3,743,575 $ 3,629,321 $ Pre-Provision Net Revenue Return on Average Assets 2.20% 2.07% 2.09% 2.10% 2.12% 2.19% 2.16% As of and for the year ended, |
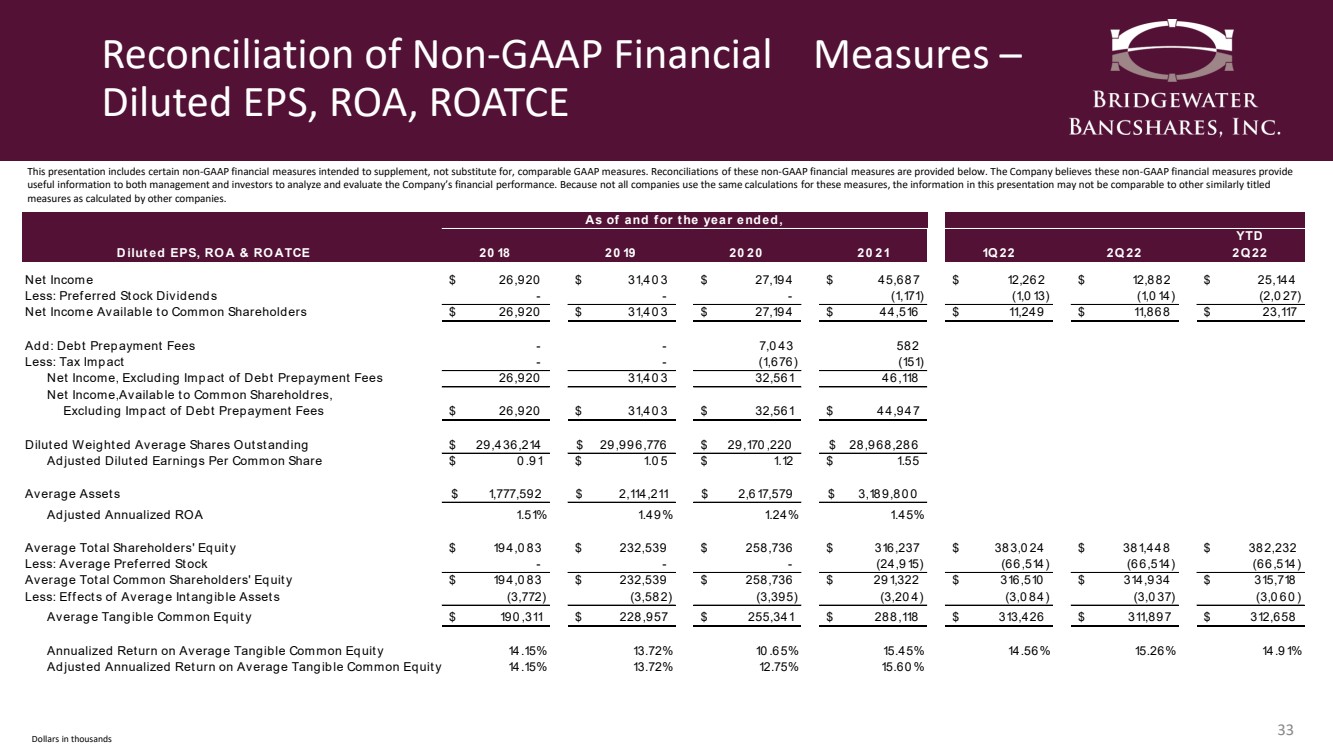
| Reconciliation of Non - GAAP Financial Measures – Diluted EPS, ROA, ROATCE 33 This presentation includes certain non - GAAP financial measures intended to supplement, not substitute for, comparable GAAP measu res. Reconciliations of these non - GAAP financial measures are provided below. The Company believes these non - GAAP financial meas ures provide useful information to both management and investors to analyze and evaluate the Company’s financial performance. Because not all companies use the same calculations for these measures, the information in this presentation may not be comparable to other s im ilarly titled measures as calculated by other companies. Dollars in thousands 2018 2019 2020 2021 1Q22 2Q22 YTD 2Q22 Net Income 26,920 $ 31,403 $ 27,194 $ 45,687 $ 12,262 $ 12,882 $ 25,144 $ Less: Preferred Stock Dividends - - - (1,171) (1,013) (1,014) (2,027) Net Income Available to Common Shareholders 26,920 $ 31,403 $ 27,194 $ 44,516 $ 11,249 $ 11,868 $ 23,117 $ Add: Debt Prepayment Fees - - 7,043 582 Less: Tax Impact - - (1,676) (151) Net Income, Excluding Impact of Debt Prepayment Fees 26,920 31,403 32,561 46,118 Net Income,Available to Common Shareholdres, Excluding Impact of Debt Prepayment Fees 26,920 $ 31,403 $ 32,561 $ 44,947 $ Diluted Weighted Average Shares Outstanding 29,436,214 $ 29,996,776 $ 29,170,220 $ 28,968,286 $ Adjusted Diluted Earnings Per Common Share 0.91 $ 1.05 $ 1.12 $ 1.55 $ Average Assets 1,777,592 $ 2,114,211 $ 2,617,579 $ 3,189,800 $ Adjusted Annualized ROA 1.51% 1.49% 1.24% 1.45% Average Total Shareholders' Equity 194,083 $ 232,539 $ 258,736 $ 316,237 $ 383,024 $ 381,448 $ 382,232 $ Less: Average Preferred Stock - - - (24,915) (66,514) (66,514) (66,514) Average Total Common Shareholders' Equity 194,083 $ 232,539 $ 258,736 $ 291,322 $ 316,510 $ 314,934 $ 315,718 $ Less: Effects of Average Intangible Assets (3,772) (3,582) (3,395) (3,204) (3,084) (3,037) (3,060) Average Tangible Common Equity 190,311 $ 228,957 $ 255,341 $ 288,118 $ 313,426 $ 311,897 $ 312,658 $ Annualized Return on Average Tangible Common Equity 14.15% 13.72% 10.65% 15.45% 14.56% 15.26% 14.91% Adjusted Annualized Return on Average Tangible Common Equity 14.15% 13.72% 12.75% 15.60% Diluted EPS, ROA & ROATCE As of and for the year ended, |
Serious News for Serious Traders! Try StreetInsider.com Premium Free!
You May Also Be Interested In
- KFSH&RC Announced as Strategic Partner for the Saudi American Healthcare Forum 2024
- Appia Announces Appointment of Mr. Andre Costa as New VP Exploration for Brazil Operations
- Alpha Omega announces Joanne Gladden Promoted to Senior Vice President of Climate Science
Create E-mail Alert Related Categories
SEC FilingsSign up for StreetInsider Free!
Receive full access to all new and archived articles, unlimited portfolio tracking, e-mail alerts, custom newswires and RSS feeds - and more!
