

Form 8-K Black Knight, Inc. For: Aug 05
 Tweet
Tweet Share
ShareExhibit 99.1

Press Release
Information for Investors: | | Information for Media: |
| | |
Steve Eagerton | | Michelle Kersch |
Black Knight | | Black Knight |
904.854.3683 | | 904.854.5043 |
|
Black Knight Reports Second Quarter 2021 Financial Results
JACKSONVILLE, Fla. – August 5, 2021 - Black Knight, Inc. (NYSE: BKI), a leading provider of software, data and analytics solutions to the mortgage and consumer loan, real estate and capital markets verticals, today announced unaudited financial results for the second quarter of 2021, as compared to the prior year quarter.
Second Quarter 2021 Highlights:
| ● | Revenues of $361.3 million, an increase of 23%; Organic revenue growth of 11% |
| ● | Net earnings attributable to Black Knight of $39.7 million, an increase of 2%; Diluted EPS of $0.25 compared to $0.26; Net earnings margin of 8.9% compared to 13.3% |
| ● | Adjusted EBITDA of $177.5 million, an increase of 21%; Adjusted EBITDA margin was 49.1% compared to 50.2% |
| ● | Adjusted net earnings of $88.6 million, an increase of 13%; Adjusted EPS of $0.57, an increase of 10% |
Second Quarter 2021 Segment Highlights:
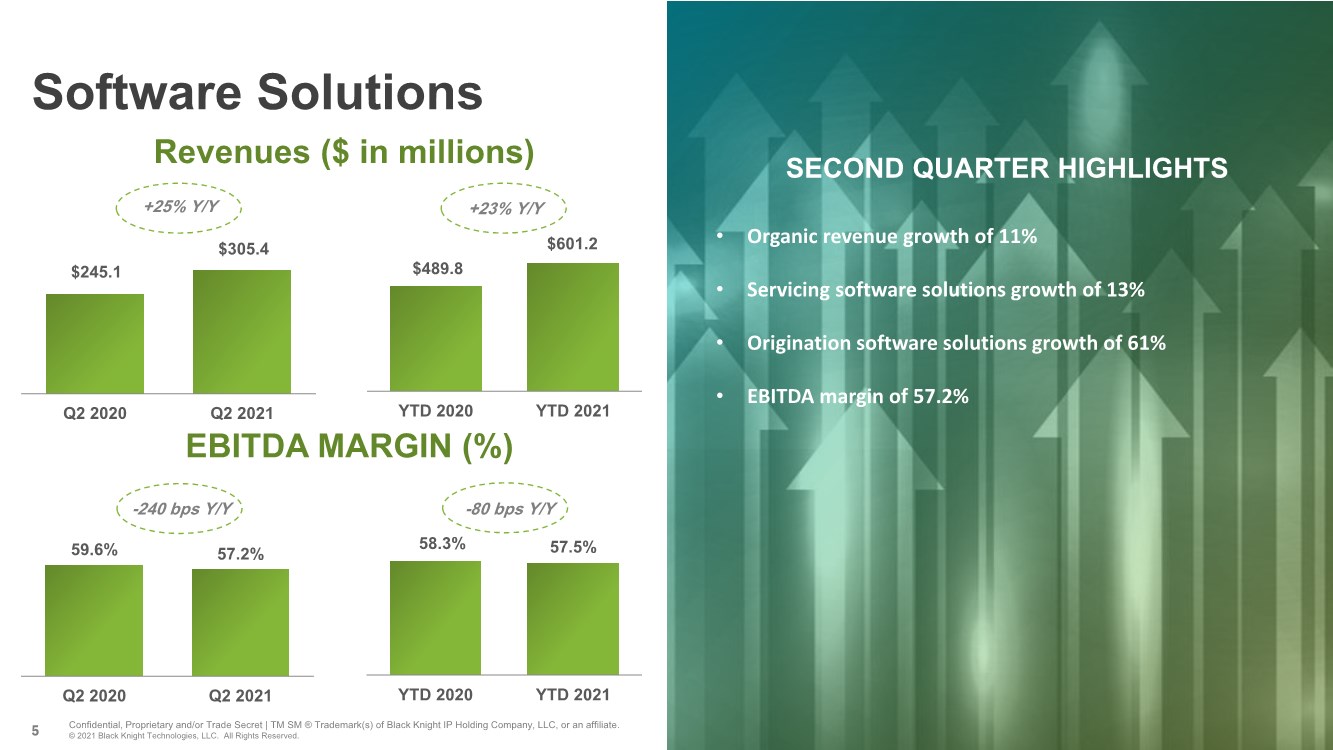
Software Solutions
| ● | Revenues of $305.4 million, an increase of 25%; Organic revenue growth of 11% |
| ● | EBITDA of $174.8 million, an increase of 20%; EBITDA margin of 57.2% compared to 59.6% |
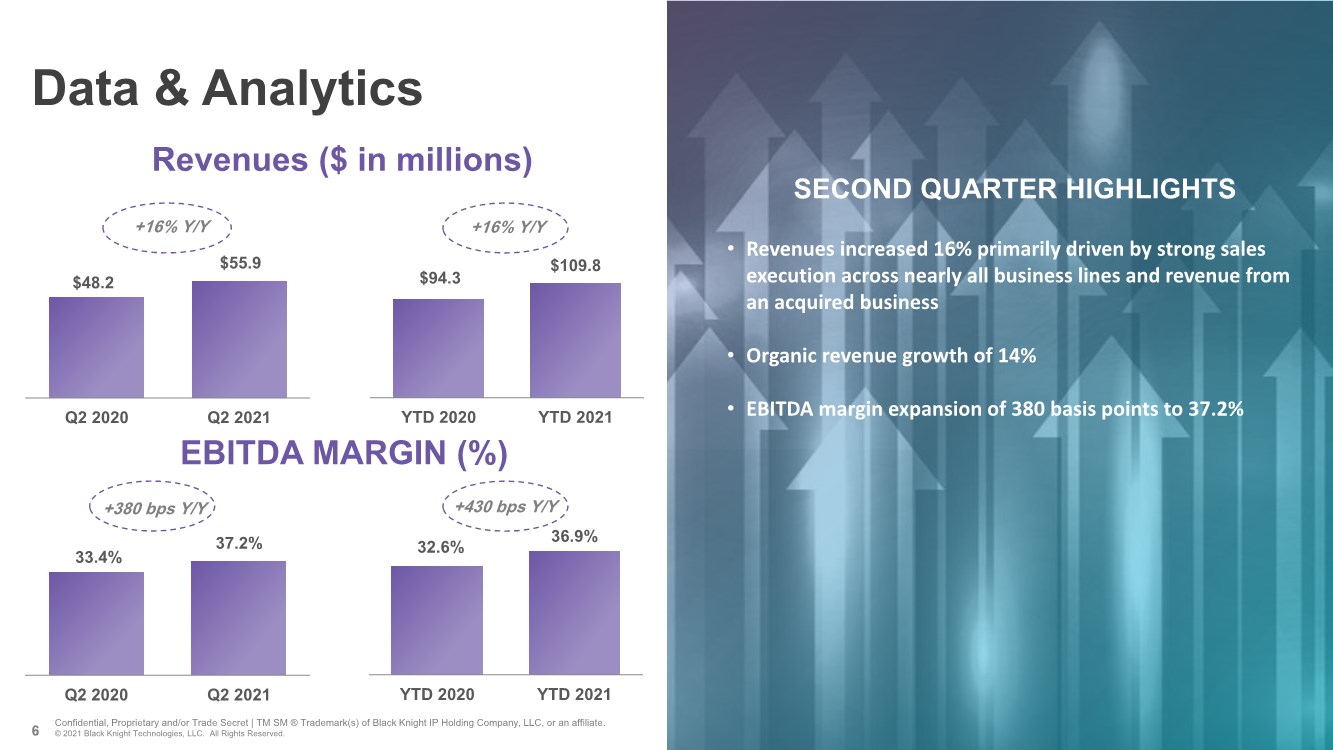
Data and Analytics
| ● | Revenues of $55.9 million, an increase of 16%; Organic revenue growth of 14% |
| ● | EBITDA of $20.8 million, an increase of 29%; EBITDA margin of 37.2% compared to 33.4% |
Commentary:
Black Knight Chairman and Chief Executive Officer Anthony Jabbour said, "We are pleased with our very strong results in the second quarter, where we delivered Organic revenue growth of 11% and Adjusted EBITDA growth of 21%. These results reflect the consistent execution of our strategy to drive organic growth through the addition of new clients, the expansion of relationships with existing clients and the delivery of new innovative solutions."
1
Other Highlights:
| ● | On May 17, 2021, we completed the acquisition of eMBS, Inc. (“eMBS”), a leading data and analytics aggregator for residential mortgage-backed securities. eMBS is reported within our Data and Analytics segment. |
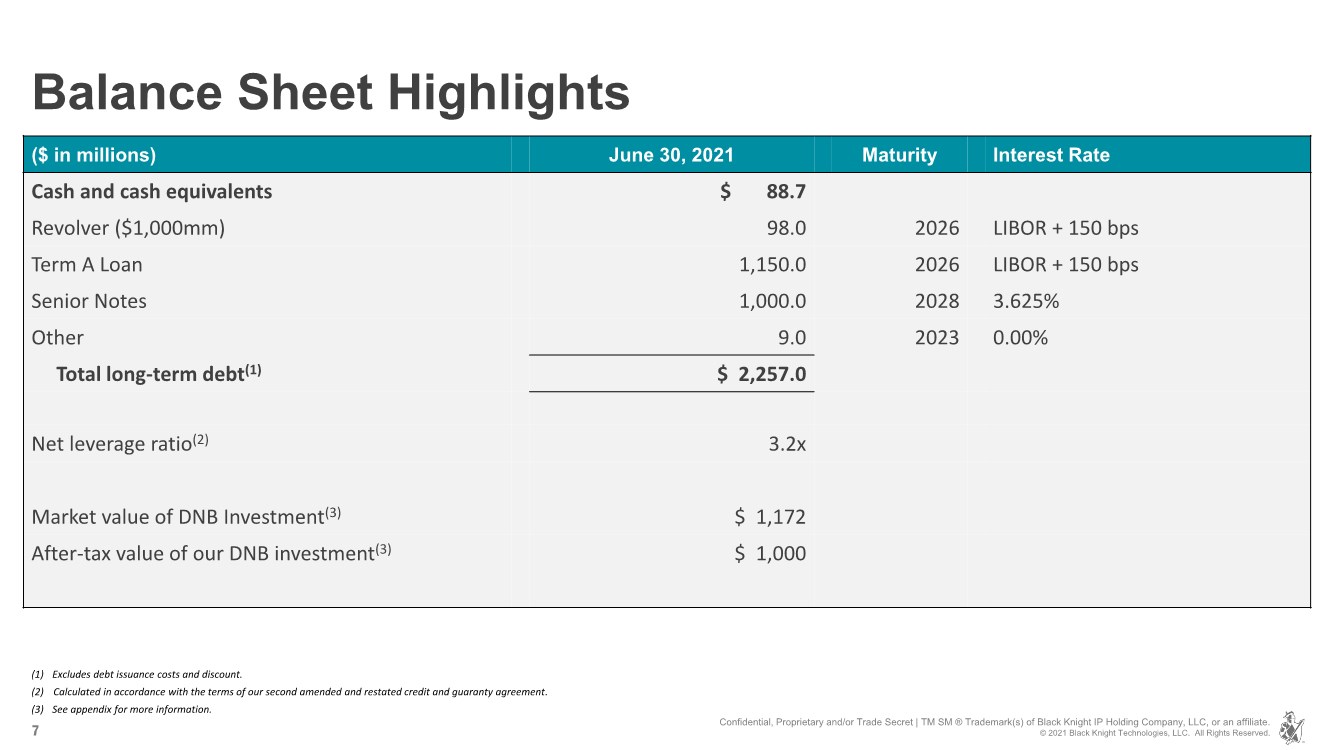
| ● | Dun & Bradstreet Holdings, Inc. (“DNB”) investment: We own approximately 54.8 million shares of DNB common stock, which had a fair value of approximately $1.2 billion before income taxes (approximately $1.0 billion after income taxes) based on DNB’s closing share price as of June 30, 2021. |
| ● | As of June 30, 2021, we had cash and cash equivalents of $88.7 million, debt of $2,235.3 million and available capacity of $902.0 million on our revolving credit facility. |
| ● | On July 7, 2021, we completed the acquisition of TOMN Holdings, Inc. (“Top of Mind”), developer of SurefireSM, a leading customer relationship management and marketing automation system for the mortgage industry. Top of Mind will be a part of Origination Software within our Software Solutions segment. |
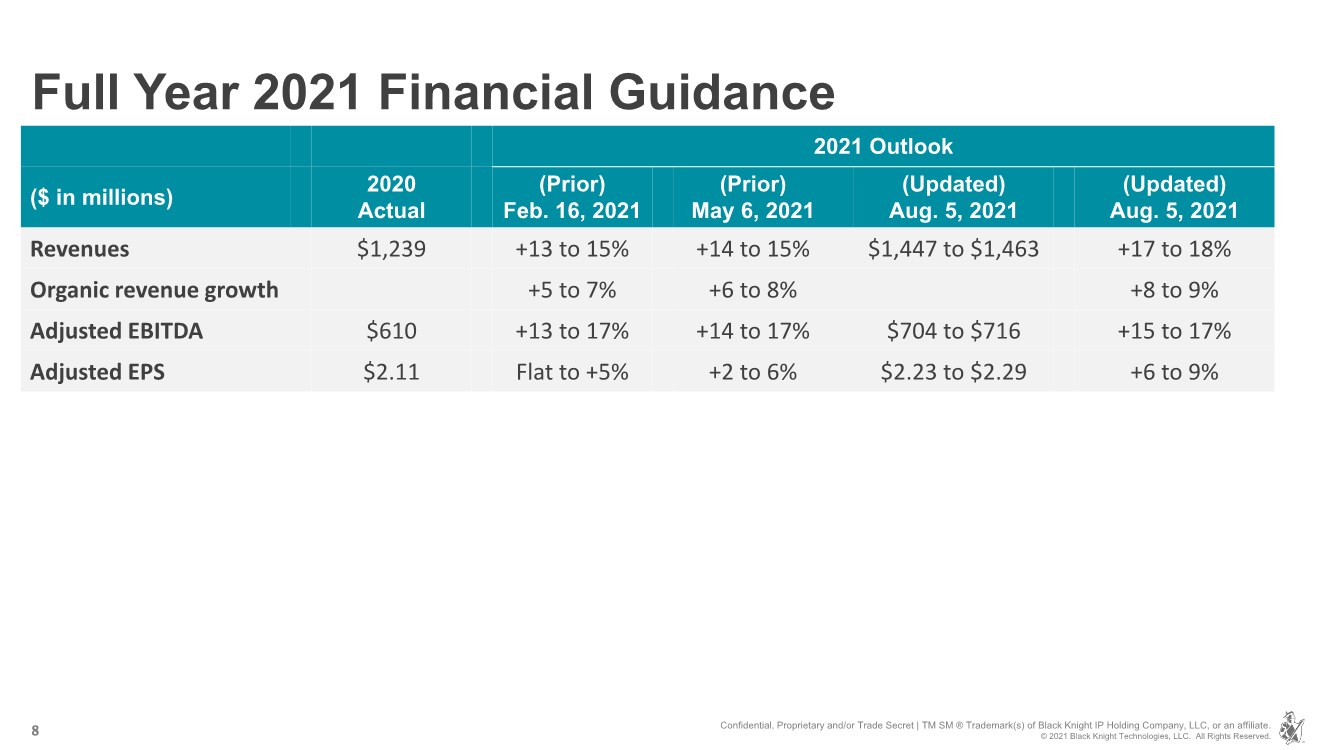
Jabbour continued, “With our strong second quarter performance, our confidence in the outlook for the remainder of the year and the effect of the Top of Mind and eMBS acquisitions, we are raising our full year guidance again. We now expect full year revenue in the range of $1,447 million to $1,463 million, Adjusted EBITDA in the range of $704 million to $716 million and Adjusted EPS in the range of $2.23 to $2.29.”
Business Outlook
The following forward-looking statements reflect Black Knight’s expectations as of today’s date. Given the number of risk factors, uncertainties and assumptions discussed below, actual results may differ materially. Black Knight does not intend to update its forward-looking statements until its next quarterly results announcement, other than in publicly available statements.
Black Knight’s updated full year 2021 outlook is as follows:
| | 2020 |
| 2021 | | Growth | ||||||||
| | Actual |
| Low |
| High | | Low |
| High | ||||
August 5, 2021 outlook (Updated) | | | | |
|
| |
| | |
|
| |
|
Revenues | $ | 1,239 | | $ | 1,447 | | $ | 1,463 | | 17 | % | | 18 | % |
Organic revenue growth | | | | | | | | | | 8 | % | | 9 | % |
Adjusted EBITDA | $ | 610 | | $ | 704 | | $ | 716 | | 15 | % | | 17 | % |
Adjusted EPS | $ | 2.11 | | $ | 2.23 | | $ | 2.29 | | 6 | % | | 9 | % |
| | | | | | | | | | | | | | |
May 6, 2021 outlook (Prior) | | | | |
|
| |
| | |
|
| |
|
Revenues | $ | 1,239 | | $ | 1,407 | | $ | 1,428 | | 14 | % | | 15 | % |
Organic revenue growth | | | | | | | | | | 6 | % | | 8 | % |
Adjusted EBITDA | $ | 610 | | $ | 695 | | $ | 711 | | 14 | % | | 17 | % |
Adjusted EPS | $ | 2.11 | | $ | 2.16 | | $ | 2.24 | | 2 | % | | 6 | % |
Definitions of non-GAAP financial measures and the reconciliations to the most directly comparable GAAP measures are provided in subsequent sections of the press release narrative and supplemental schedules. Black Knight has not provided a reconciliation of forward-looking Adjusted EBITDA and Adjusted EPS, including certain components of the forward-looking reconciliation, to the most directly comparable GAAP financial measures, due primarily to variability and difficulty in making accurate forecasts and projections of non-operating matters that may arise, as not all of the information necessary for a quantitative reconciliation is available to Black Knight without unreasonable effort. For the same reasons, Black Knight is unable to address the probable significance of the information.
2
Earnings Conference Call and Audio Webcast
Black Knight will host a conference call to discuss the second quarter 2021 financial results on August 5, 2021, at 8:30 a.m. ET. The conference call can be accessed live over the phone by dialing (855) 327-6838, or for international callers (604) 235-2082. A replay will be available from 11:30 a.m. ET on August 5, 2021, through August 12, 2021, by dialing (844) 512-2921, or for international callers (412) 317-6671. The replay passcode will be 10015610.
The call will also be webcast live from Black Knight’s investor relations website at https://investor.blackknightinc.com. Following completion of the call, a recorded replay of the webcast will be available on the website.
About Black Knight
Black Knight, Inc. (NYSE: BKI) is an award-winning software, data and analytics company that delivers innovation in the mortgage lending and servicing and real estate industries, as well as the capital and secondary markets. Businesses leverage our robust, integrated solutions across the entire homeownership life cycle to help retain existing customers, gain new customers, mitigate risk and operate more effectively.
Our clients rely on our proven, comprehensive, scalable products and our unwavering commitment to delivering superior client support to achieve their strategic goals and better serve their customers. For more information on Black Knight, please visit www.blackknightinc.com.
Non-GAAP Financial Measures
This earnings release contains non-GAAP financial measures, including Adjusted revenues, Organic revenue growth, Adjusted EBITDA, Adjusted EBITDA margin, Adjusted net earnings and Adjusted EPS. These are important financial measures for us but are not financial measures as defined by generally accepted accounting principles ("GAAP"). The presentation of this financial information is not intended to be considered in isolation of or as a substitute for, or superior to, the financial information prepared and presented in accordance with GAAP.
We use these non-GAAP financial measures for financial and operational decision making and as a means to evaluate period-to-period comparisons. We believe these measures provide useful information about operating results, enhance the overall understanding of past financial performance and future prospects and allow for greater transparency with respect to key metrics used by management in its financial and operational decision making, including determining a portion of executive compensation. We also present these non-GAAP financial measures because we believe investors, analysts and rating agencies consider them useful in measuring our ability to meet our debt service obligations. By disclosing these non-GAAP financial measures, we believe we offer investors a greater understanding of, and an enhanced level of transparency into, the means by which our management operates the company.
These non-GAAP financial measures are not measures presented in accordance with GAAP, and our use of these terms may vary from that of others in our industry. These non-GAAP financial measures should not be considered as an alternative to revenues, net earnings, net earnings per share, net earnings margin or any other measures derived in accordance with GAAP as measures of operating performance or liquidity. Reconciliations of these non-GAAP financial measures to the most directly comparable GAAP financial measures are presented in the attached schedules.
Revenues, EBITDA and EBITDA margin for the Software Solutions and Data and Analytics segments are presented in conformity with Accounting Standards Codification Topic 280, Segment Reporting. These measures are reported to the chief operating decision maker for purposes of making decisions about allocating resources to the segments and assessing their performance. For these reasons, these measures are excluded from the definition of non-GAAP financial measures under the Securities and Exchange Commission’s ("SEC") Regulation G and Item 10(e) of Regulation S-K.
3
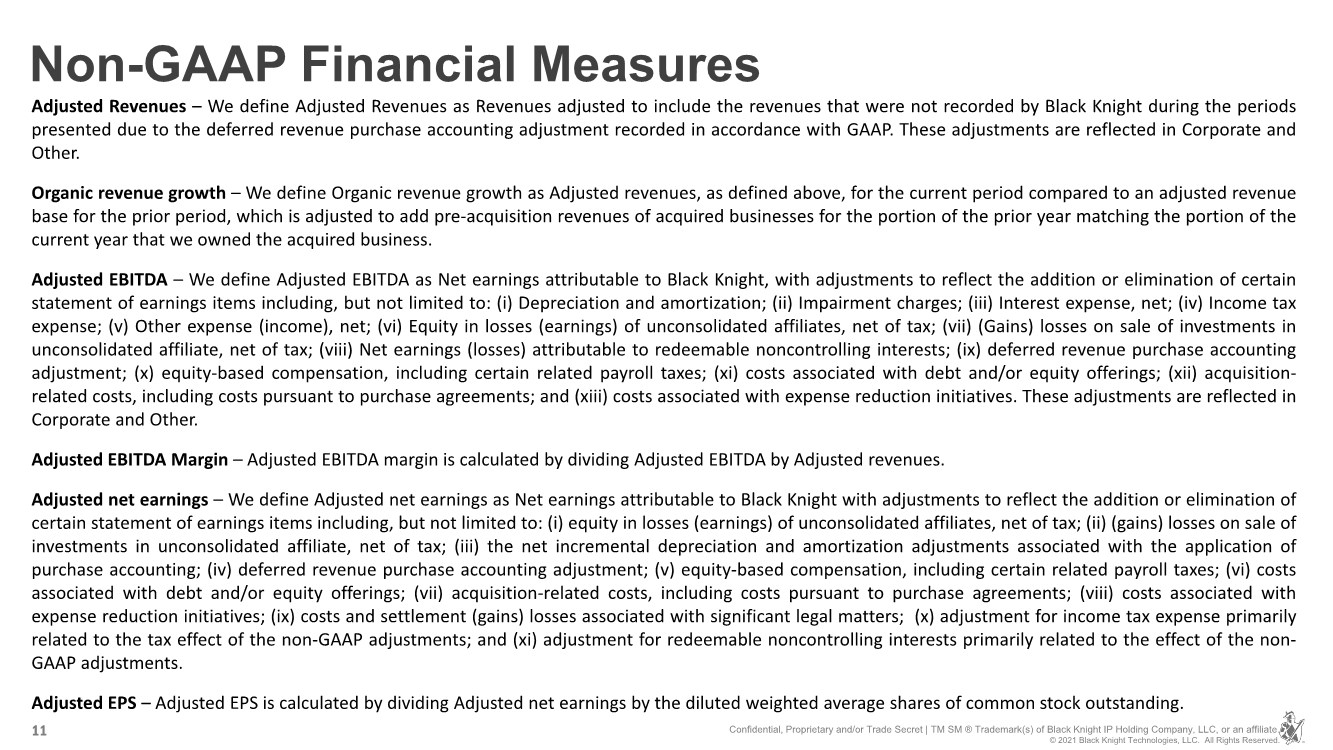
Adjusted revenues - We define Adjusted revenues as Revenues adjusted to include the revenues that were not recorded by Black Knight during the periods presented due to the deferred revenue purchase accounting adjustment recorded in accordance with GAAP. These adjustments are reflected in Corporate and Other.
Organic revenue growth - We define Organic revenue growth as Adjusted revenues, as defined above, for the current period compared to an adjusted revenue base for the prior period, which is adjusted to add pre-acquisition revenues of acquired businesses for the portion of the prior year matching the portion of the current year that we owned the acquired businesses.
Adjusted EBITDA - We define Adjusted EBITDA as Net earnings attributable to Black Knight, with adjustments to reflect the addition or elimination of certain statement of earnings items including, but not limited to:
| ● | Depreciation and amortization; |
| ● | Impairment charges; |
| ● | Interest expense, net; |
| ● | Income tax expense; |
| ● | Other expense (income), net; |
| ● | Equity in losses (earnings) of unconsolidated affiliates, net of tax; |
| ● | (Gains) losses on sale of investments in unconsolidated affiliate, net of tax; |
| ● | Net earnings (losses) attributable to redeemable noncontrolling interests; |
| ● | deferred revenue purchase accounting adjustment; |
| ● | equity-based compensation, including certain related payroll taxes; |
| ● | costs associated with debt and/or equity offerings; |
| ● | acquisition-related costs, including costs pursuant to purchase agreements; and |
| ● | costs associated with expense reduction initiatives. |
These adjustments are reflected in Corporate and Other.
Adjusted EBITDA margin - Adjusted EBITDA margin is calculated by dividing Adjusted EBITDA by Adjusted revenues.
Adjusted net earnings - We define Adjusted net earnings as Net earnings attributable to Black Knight with adjustments to reflect the addition or elimination of certain statement of earnings items including, but not limited to:
| ● | equity in losses (earnings) of unconsolidated affiliates, net of tax; |
| ● | (gains) losses on sale of investments in unconsolidated affiliate, net of tax; |
| ● | the net incremental depreciation and amortization adjustments associated with the application of purchase accounting; |
| ● | deferred revenue purchase accounting adjustment; |
| ● | equity-based compensation, including certain related payroll taxes; |
| ● | costs associated with debt and/or equity offerings; |
| ● | acquisition-related costs, including costs pursuant to purchase agreements; |
| ● | costs associated with expense reduction initiatives; |
| ● | costs and settlement (gains) losses associated with significant legal matters; |
| ● | adjustment for income tax expense primarily related to the tax effect of the non-GAAP adjustments; and |
| ● | adjustment for redeemable noncontrolling interests primarily related to the effect of the non-GAAP adjustments. |
Adjusted EPS - Adjusted EPS is calculated by dividing Adjusted net earnings by the diluted weighted average shares of common stock outstanding.
4
Forward-Looking Statements
This press release contains forward-looking statements that involve a number of risks and uncertainties. Statements that are not historical facts, including statements regarding expectations, hopes, intentions or strategies regarding the future are forward-looking statements. Forward-looking statements are based on Black Knight management’s beliefs, as well as assumptions made by, and information currently available to, them. Because such statements are based on expectations as to future financial and operating results and are not statements of fact, actual results may differ materially from those projected. Black Knight undertakes no obligation to update any forward-looking statements, whether as a result of new information, future events or otherwise.
The risks and uncertainties that forward-looking statements are subject to include, but are not limited to:
| ● | changes in general economic, business, regulatory and political conditions, including those resulting from pandemics such as COVID-19, particularly as they affect foreclosures and the mortgage industry; |
| ● | the outbreak of COVID-19 and measures to reduce its spread, including the effect of governmental or voluntary actions such as business shutdowns and stay-at-home orders; |
| ● | security breaches against our information systems or breaches involving our third-party vendors; |
| ● | our ability to maintain and grow our relationships with our clients; |
| ● | our ability to comply with or changes to the laws, rules and regulations that affect our and our clients’ businesses; |
| ● | our ability to adapt our solutions to technological changes or evolving industry standards or to achieve our growth strategies; |
| ● | our ability to protect our proprietary software and information rights; |
| ● | the effect of any potential defects, development delays, installation difficulties or system failures on our business and reputation; |
| ● | risks associated with the availability of data; |
| ● | the effects of our existing leverage on our ability to make acquisitions and invest in our business; |
| ● | our ability to successfully consummate, integrate and achieve the intended benefits of acquisitions; |
| ● | risks associated with our investment in DNB and integrating and achieving the intended benefits of the acquisition of Optimal Blue, LLC (“Optimal Blue”); and |
| ● | other risks and uncertainties detailed in the “Statement Regarding Forward-Looking Information,” “Risk Factors” and other sections of our Annual Report on Form 10-K for the year ended December 31, 2020 and other filings with the SEC. |
5
BLACK KNIGHT, INC.
Consolidated Balance Sheets
(In millions)
(Unaudited)
|
| | | | ||
|
| June 30, 2021 |
| December 31, 2020 | ||
ASSETS | | |
|
| |
|
Current assets: | | |
|
| |
|
Cash and cash equivalents | | $ | 88.7 | | $ | 34.7 |
Trade receivables, net | |
| 183.6 | |
| 182.2 |
Prepaid expenses and other current assets | |
| 86.3 | |
| 70.4 |
Receivables from related parties | |
| 10.5 | |
| — |
Total current assets | |
| 369.1 | |
| 287.3 |
Property and equipment, net | |
| 157.5 | |
| 163.1 |
Computer software, net | |
| 496.5 | |
| 498.3 |
Other intangible assets, net | |
| 624.6 | |
| 692.3 |
Goodwill | |
| 3,649.6 | |
| 3,613.4 |
Investments in unconsolidated affiliates | |
| 475.8 | |
| 470.5 |
Deferred contract costs, net | |
| 179.6 | |
| 172.3 |
Other non-current assets | |
| 213.2 | |
| 193.3 |
Total assets | | $ | 6,165.9 | | $ | 6,090.5 |
LIABILITIES AND EQUITY | |
|
| |
|
|
Current liabilities: | |
|
| |
|
|
Trade accounts payable and other accrued liabilities | | $ | 73.8 | | $ | 88.1 |
Accrued compensation and benefits | |
| 91.0 | |
| 79.3 |
Current portion of debt | |
| 19.0 | |
| 73.0 |
Deferred revenues | |
| 68.7 | |
| 50.9 |
Total current liabilities | |
| 252.5 | |
| 291.3 |
Deferred revenues | |
| 82.7 | |
| 92.7 |
Deferred income taxes | |
| 282.1 | |
| 284.0 |
Long-term debt, net of current portion | |
| 2,216.3 | |
| 2,121.9 |
Other non-current liabilities | |
| 90.1 | |
| 94.9 |
Total liabilities | |
| 2,923.7 | |
| 2,884.8 |
| | | | | | |
Redeemable noncontrolling interests | |
| 578.0 | |
| 578.0 |
| | | | | | |
Equity: | |
|
| |
|
|
Additional paid-in capital | |
| 2,021.0 | |
| 2,053.7 |
Retained earnings | |
| 852.4 | |
| 757.4 |
Accumulated other comprehensive loss | |
| (32.6) | |
| (38.8) |
Treasury stock, at cost | |
| (176.6) | |
| (144.6) |
Total shareholders' equity | |
| 2,664.2 | |
| 2,627.7 |
Total liabilities, redeemable noncontrolling interests and shareholders' equity | | $ | 6,165.9 | | $ | 6,090.5 |
6
BLACK KNIGHT, INC.
Consolidated Statements of Earnings
(In millions, except per share data)
(Unaudited)
|
| Three months ended June 30, | | Six months ended June 30, | ||||||||
|
| 2021 |
| 2020 |
| 2021 |
| 2020 | ||||
Revenues | | $ | 361.3 | | $ | 293.1 | | $ | 711.0 | | $ | 583.8 |
Expenses: | |
|
| |
|
| |
|
| |
|
|
Operating expenses | |
| 197.0 | |
| 155.5 | |
| 383.2 | |
| 317.9 |
Depreciation and amortization | |
| 90.4 | |
| 58.6 | |
| 178.2 | |
| 116.3 |
Transition and integration costs | |
| 4.3 | |
| 2.5 | |
| 12.2 | |
| 4.9 |
Total expenses | |
| 291.7 | |
| 216.6 | |
| 573.6 | |
| 439.1 |
Operating income | |
| 69.6 | |
| 76.5 | |
| 137.4 | |
| 144.7 |
Other income and expense: | |
|
| |
|
| |
|
| |
|
|
Interest expense, net | |
| (20.9) | |
| (13.0) | |
| (41.2) | |
| (27.7) |
Other (expense) income, net | |
| (1.0) | |
| 18.8 | |
| (4.2) | |
| 18.0 |
Total other (expense) income, net | |
| (21.9) | |
| 5.8 | |
| (45.4) | |
| (9.7) |
Earnings before income taxes and equity in (losses) earnings of unconsolidated affiliates | |
| 47.7 | |
| 82.3 | |
| 92.0 | |
| 135.0 |
Income tax expense | |
| 10.5 | |
| 17.2 | |
| 15.7 | |
| 25.4 |
Earnings before equity in (losses) earnings of unconsolidated affiliates | |
| 37.2 | |
| 65.1 | |
| 76.3 | |
| 109.6 |
Equity in (losses) earnings of unconsolidated affiliates, net of tax | |
| (5.0) | |
| (26.0) | |
| 1.4 | |
| (20.4) |
Net earnings | |
| 32.2 | |
| 39.1 | |
| 77.7 | |
| 89.2 |
Net losses attributable to redeemable noncontrolling interests | |
| 7.5 | |
| — | |
| 16.1 | |
| — |
Net earnings attributable to Black Knight | | $ | 39.7 | | $ | 39.1 | | $ | 93.8 | | $ | 89.2 |
| | | | | | | | | | | | |
Net earnings per share attributable to Black Knight shareholders: | |
|
| |
|
| |
|
| |
|
|
Basic | | $ | 0.26 | | $ | 0.26 | | $ | 0.60 | | $ | 0.60 |
Diluted (1) | | $ | 0.25 | | $ | 0.26 | | $ | 0.60 | | $ | 0.60 |
Weighted average shares of common stock outstanding: | |
|
| |
|
| |
|
| |
|
|
Basic | |
| 155.4 | |
| 149.2 | |
| 155.5 | |
| 148.6 |
Diluted (1) | |
| 155.7 | |
| 150.0 | |
| 155.8 | |
| 149.3 |
| (1) | For the periods presented, dilutive securities include time-based and performance-based unvested restricted stock awards for which performance metrics have been achieved. |
7
BLACK KNIGHT, INC.
Consolidated Statements of Cash Flows
(In millions)
(Unaudited)
|
| Six months ended June 30, | ||||
|
| 2021 |
| 2020 | ||
Cash flows from operating activities: | | |
|
| |
|
Net earnings | | $ | 77.7 | | $ | 89.2 |
Adjustments to reconcile net earnings to net cash provided by operating activities: | |
|
| |
|
|
Depreciation and amortization | |
| 178.2 | |
| 116.3 |
Amortization of debt issuance costs and original issue discount | |
| 2.0 | |
| 1.4 |
Loss on extinguishment of debt | | | 2.5 | | | — |
Deferred income taxes, net | |
| (3.9) | |
| 0.9 |
Equity in (earnings) losses of unconsolidated affiliates, net of tax | |
| (1.4) | |
| 20.4 |
Equity-based compensation | |
| 22.5 | |
| 20.2 |
Changes in assets and liabilities, net of acquired assets and liabilities: | |
| | |
| |
Trade receivables, including receivables from related parties | |
| (10.7) | |
| 4.9 |
Prepaid expenses and other assets | |
| (36.8) | |
| (13.9) |
Deferred contract costs | |
| (24.1) | |
| (26.0) |
Deferred revenues | |
| 6.4 | |
| (10.2) |
Trade accounts payable and other liabilities | |
| (13.2) | |
| (7.9) |
Net cash provided by operating activities | |
| 199.2 | |
| 195.3 |
Cash flows from investing activities: | |
|
| |
|
|
Additions to property and equipment | |
| (11.5) | |
| (12.6) |
Additions to computer software | |
| (45.4) | |
| (38.2) |
Business acquisitions, net of cash acquired | |
| (48.3) | |
| (50.4) |
Asset acquisitions | |
| (10.0) | |
| (15.0) |
Other investing activities | |
| (1.2) | |
| 8.4 |
Net cash used in investing activities | |
| (116.4) | |
| (107.8) |
Cash flows from financing activities: | |
|
| |
|
|
Net proceeds from issuance of common stock, before offering expenses | |
| — | |
| 484.6 |
Costs directly associated with issuance of common stock | |
| — | |
| (0.4) |
Revolver borrowings | |
| 260.3 | |
| 266.6 |
Revolver payments | |
| (210.0) | |
| (576.6) |
Term loan borrowings | | | 1.6 | | | — |
Term loan payments | |
| — | |
| (23.4) |
Purchases of treasury stock | |
| (46.7) | |
| — |
Tax withholding payments for restricted share vesting | |
| (24.4) | |
| (19.7) |
Finance lease payments | |
| (2.0) | |
| (5.8) |
Debt issuance costs paid | |
| (7.6) | |
| — |
Net cash (used in) provided by financing activities | |
| (28.8) | |
| 125.3 |
Net increase in cash and cash equivalents | |
| 54.0 | |
| 212.8 |
Cash and cash equivalents, beginning of period | |
| 34.7 | |
| 15.4 |
Cash and cash equivalents, end of period | | $ | 88.7 | | $ | 228.2 |
Supplemental cash flow information: | |
|
| |
|
|
Interest paid, net | | $ | (40.0) | | $ | (26.1) |
Income taxes paid, net | | $ | (42.7) | | $ | (5.4) |
8
BLACK KNIGHT, INC.
Segment Information
(In millions)
(Unaudited)
|
| Three months ended June 30, 2021 | ||||||||||
|
| Software |
| Data and |
| Corporate |
| | | |||
|
| Solutions |
| Analytics |
| and Other |
| Total | ||||
Revenues | | $ | 305.4 | | $ | 55.9 | | $ | — | (1) | $ | 361.3 |
Expenses: | |
|
| |
|
| |
|
|
|
|
|
Operating expenses | |
| 130.6 | |
| 35.1 | |
| 31.3 | (2) |
| 197.0 |
Transition and integration costs | |
| — | |
| — | |
| 4.3 | (3) |
| 4.3 |
EBITDA | |
| 174.8 | |
| 20.8 | |
| (35.6) | |
| 160.0 |
Depreciation and amortization | |
| 33.2 | |
| 3.7 | |
| 53.5 | (4) |
| 90.4 |
Operating income (loss) | |
| 141.6 | |
| 17.1 | |
| (89.1) | |
| 69.6 |
Interest expense, net | | | | |
|
| |
|
|
|
| (20.9) |
Other expense, net | | | | |
|
| |
|
|
|
| (1.0) |
Earnings before income taxes and equity in losses of unconsolidated affiliates | | | | |
|
| |
|
|
|
| 47.7 |
Income tax expense | | | | |
|
| |
|
|
|
| 10.5 |
Earnings before equity in losses of unconsolidated affiliates | | | | |
|
| |
|
|
|
| 37.2 |
Equity in losses of unconsolidated affiliates, net of tax | | | | |
|
| |
|
|
|
| (5.0) |
Net earnings | | | | |
|
| |
|
|
|
| 32.2 |
Net losses attributable to redeemable noncontrolling interests | | | | |
|
| |
|
|
|
| 7.5 |
Net earnings attributable to Black Knight | | | | |
|
| |
|
|
| $ | 39.7 |
|
| Three months ended June 30, 2020 | ||||||||||
|
| Software |
| Data and |
| Corporate |
| | | |||
|
| Solutions |
| Analytics |
| and Other |
| Total | ||||
Revenues | | $ | 245.1 | | $ | 48.2 | | $ | (0.2) | (1) | $ | 293.1 |
Expenses: | |
|
| |
|
| |
|
|
|
|
|
Operating expenses | |
| 98.9 | |
| 32.1 | |
| 24.5 | (2) |
| 155.5 |
Transition and integration costs | |
| — | |
| — | |
| 2.5 | (3) |
| 2.5 |
EBITDA | |
| 146.2 | |
| 16.1 | |
| (27.2) | |
| 135.1 |
Depreciation and amortization | |
| 30.2 | |
| 3.8 | |
| 24.6 | (4) |
| 58.6 |
Operating income (loss) | |
| 116.0 | |
| 12.3 | |
| (51.8) | |
| 76.5 |
Interest expense, net | | | | |
|
| |
|
|
|
| (13.0) |
Other income, net | | | | |
|
| |
|
|
|
| 18.8 |
Earnings before income taxes and equity in losses of unconsolidated affiliates | | | | |
|
| |
|
|
|
| 82.3 |
Income tax expense | | | | |
|
| |
|
|
|
| 17.2 |
Earnings before equity in losses of unconsolidated affiliates | | | | |
|
| |
|
|
|
| 65.1 |
Equity in losses of unconsolidated affiliates, net of tax | | | | |
|
| |
|
|
|
| (26.0) |
Net earnings | | | | |
|
| |
|
|
| $ | 39.1 |
9
BLACK KNIGHT, INC.
Segment Information (Continued)
(In millions)
(Unaudited)
| | Six months ended June 30, 2021 | ||||||||||
| | Software |
| Data and | | Corporate and | | | | |||
|
| Solutions | | Analytics |
| Other |
| Total | ||||
Revenues | | $ | 601.2 |
| $ | 109.8 | | $ | — | (1) | $ | 711.0 |
Expenses: | |
|
|
|
|
| |
|
|
|
|
|
Operating expenses | |
| 255.5 |
|
| 69.3 | |
| 58.4 | (2) |
| 383.2 |
Transition and integration costs | |
| — |
|
| — | |
| 12.2 | (3) |
| 12.2 |
EBITDA | |
| 345.7 | |
| 40.5 | |
| (70.6) |
|
| 315.6 |
Depreciation and amortization | |
| 64.4 |
|
| 7.5 | |
| 106.3 | (4) |
| 178.2 |
Operating income (loss) | |
| 281.3 | |
| 33.0 | |
| (176.9) |
|
| 137.4 |
Interest expense, net | |
|
|
|
|
| |
|
|
|
| (41.2) |
Other expense, net | |
|
|
|
|
| |
|
|
|
| (4.2) |
Earnings before income taxes and equity in earnings of unconsolidated affiliates | |
|
|
|
|
| |
|
|
|
| 92.0 |
Income tax expense | |
|
|
|
|
| |
|
|
|
| 15.7 |
Earnings before equity in earnings of unconsolidated affiliates | |
|
|
|
|
| |
|
|
|
| 76.3 |
Equity in earnings of unconsolidated affiliates, net of tax | |
|
|
|
|
| |
|
|
|
| 1.4 |
Net earnings | |
|
|
|
|
| |
|
|
|
| 77.7 |
Net losses attributable to redeemable noncontrolling interests | |
|
|
|
|
| |
|
|
|
| 16.1 |
Net earnings attributable to Black Knight | |
|
|
|
|
| |
|
|
| $ | 93.8 |
| | Six months ended June 30, 2020 | ||||||||||
| | Software | | Data and | | Corporate and |
| | | |||
|
| Solutions |
| Analytics |
| Other |
| Total | ||||
Revenues | | $ | 489.8 | | $ | 94.3 | | $ | (0.3) | (1) | $ | 583.8 |
Expenses: | |
|
| |
|
| |
|
|
|
|
|
Operating expenses | |
| 204.2 | |
| 63.6 | |
| 50.1 | (2) |
| 317.9 |
Transition and integration costs | |
| — | |
| — | |
| 4.9 | (3) |
| 4.9 |
EBITDA | |
| 285.6 | |
| 30.7 | |
| (55.3) |
|
| 261.0 |
Depreciation and amortization | |
| 60.5 | |
| 7.8 | |
| 48.0 | (4) |
| 116.3 |
Operating income (loss) | |
| 225.1 | |
| 22.9 | |
| (103.3) |
|
| 144.7 |
Interest expense, net | |
|
| |
|
| |
|
|
|
| (27.7) |
Other income, net | |
|
| |
|
| |
|
|
|
| 18.0 |
Earnings before income taxes and equity in losses of unconsolidated affiliates | |
|
| |
|
| |
|
|
|
| 135.0 |
Income tax expense | |
|
| |
|
| |
|
|
|
| 25.4 |
Earnings before equity in losses of unconsolidated affiliates | |
|
| |
|
| |
|
|
|
| 109.6 |
Equity in losses of unconsolidated affiliates, net of tax | |
|
| |
|
| |
|
|
|
| (20.4) |
Net earnings | |
|
| |
|
| |
|
|
| $ | 89.2 |
| (1) | Revenues for Corporate and Other represent deferred revenue purchase accounting adjustments recorded in accordance with GAAP. |
| (2) | Operating expenses for Corporate and Other includes equity-based compensation, including certain related payroll taxes, of $13.2 million and $9.5 million for the three months ended June 30, 2021 and 2020, respectively, and $23.7 million and $21.2 million for the six months ended June 30, 2021 and 2020, respectively. |
| (3) | Transition and integration costs primarily consists of costs associated with acquisitions. |
| (4) | Depreciation and amortization for Corporate and Other primarily represents net incremental depreciation and amortization adjustments associated with the application of purchase accounting recorded in accordance with GAAP. |
10
BLACK KNIGHT, INC.
Reconciliation of GAAP to Non-GAAP Financial Measures
(In millions)
(Unaudited)
Reconciliation of Revenues to Adjusted Revenues and Organic Revenue Growth
| | Three months ended June 30, | | |
| ||||||||||
| | 2021 | | 2020 | | Organic |
| ||||||||
| | | | | | | | Pre-acquisition | | Adjusted | | revenue |
| ||
|
| As reported |
| As reported |
| revenues(1) |
| base |
| growth |
| ||||
Servicing Software | | $ | 207.8 | | $ | 184.3 | | $ | — | | $ | 184.3 | | 13 | % |
Origination Software | | | 97.6 | | | 60.8 | | | 30.6 | | | 91.4 | | 7 | % |
Software Solutions | | | 305.4 | | | 245.1 | | | 30.6 | | | 275.7 | | 11 | % |
Data and Analytics | | | 55.9 | | | 48.2 | | | 0.7 | | | 48.9 | | 14 | % |
Corporate and Other | | | — | | | (0.2) | | | | | | | | | |
Revenues | | | 361.3 | | | 293.1 |
| |
|
| |
|
|
| |
Deferred revenue purchase accounting adjustment | |
| — | |
| 0.2 |
| |
|
| |
|
|
| |
Adjusted revenues | | $ | 361.3 | | $ | 293.3 | | $ | 31.3 | | $ | 324.6 |
| 11 | % |
| (1) | Includes pre-acquisition revenues of Optimal Blue, DocVerify, eMBS and NexSpring Financial, LLC (“NexSpring”) for the three months ended June 30, 2020. |
| | Six months ended June 30, | | |
| ||||||||||
|
| 2021 |
| 2020 | | Organic |
| ||||||||
| | | | | | | | Pre-acquisition | | Adjusted | | revenue |
| ||
|
| As reported |
| As reported |
| revenues(1) |
| base |
| growth |
| ||||
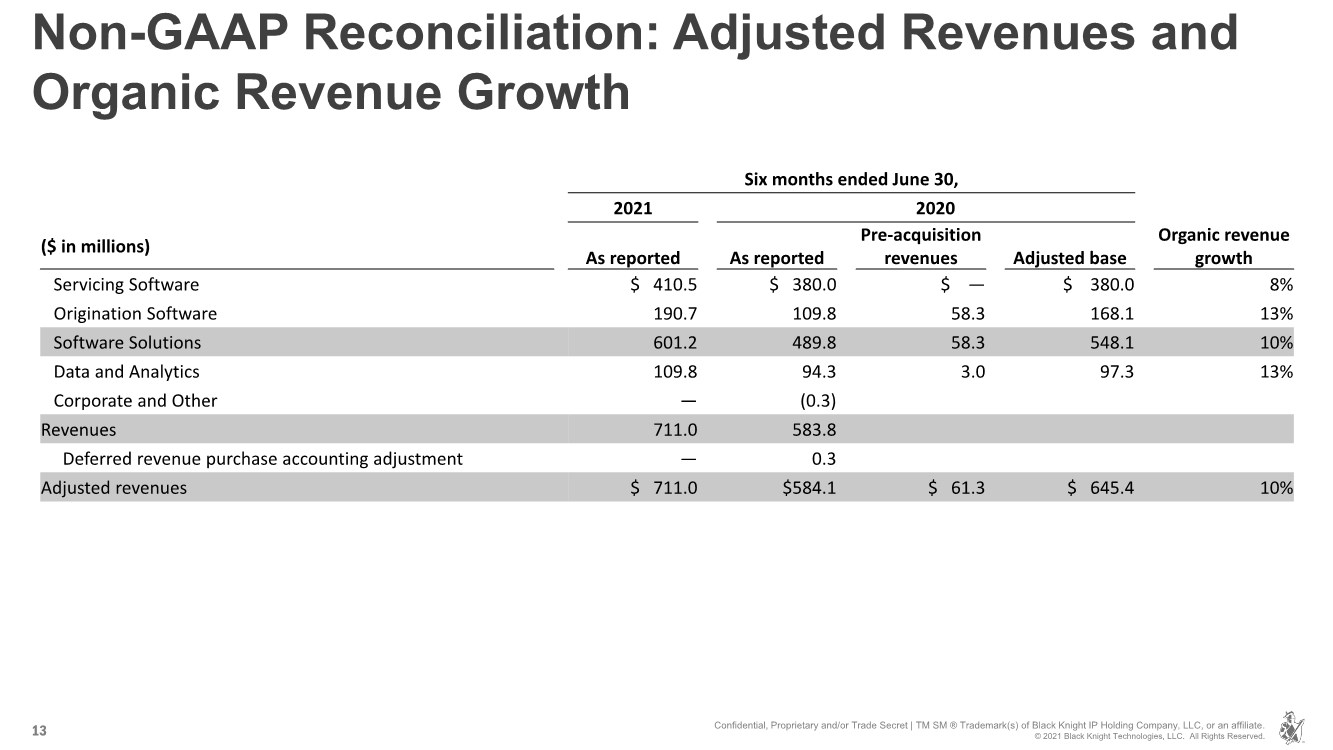
Servicing Software | | $ | 410.5 | | $ | 380.0 | | $ | — | | $ | 380.0 | | 8 | % |
Origination Software | | | 190.7 | | | 109.8 | | | 58.3 | | | 168.1 | | 13 | % |
Software Solutions | | | 601.2 | | | 489.8 | | | 58.3 | | | 548.1 | | 10 | % |
Data and Analytics | | | 109.8 | | | 94.3 | | | 3.0 | | | 97.3 | | 13 | % |
Corporate and Other | | | — | | | (0.3) | | | | | | | | | |
Revenues | | | 711.0 | | | 583.8 |
| |
|
| |
|
|
| |
Deferred revenue purchase accounting adjustment | |
| — | |
| 0.3 |
| |
|
| |
|
|
| |
Adjusted revenues | | $ | 711.0 | | $ | 584.1 | | $ | 61.3 | | $ | 645.4 |
| 10 | % |
| (1) | Includes pre-acquisition revenues of Optimal Blue, Collateral Analytics, LLC (“Collateral Analytics”), DocVerify, eMBS and NexSpring for the six months ended June 30, 2020. |
11
BLACK KNIGHT, INC.
Reconciliation of GAAP to Non-GAAP Financial Measures (Continued)
(In millions, except per share data)
(Unaudited)
Reconciliation of Net Earnings to Adjusted EBITDA
| | Three months ended June 30, | | Six months ended June 30, |
| ||||||||
|
| 2021 |
| 2020 |
| 2021 |
| 2020 |
| ||||
Net earnings attributable to Black Knight | | $ | 39.7 | | $ | 39.1 | | $ | 93.8 | | $ | 89.2 | |
Depreciation and amortization | |
| 90.4 | |
| 58.6 | |
| 178.2 | |
| 116.3 | |
Interest expense, net | |
| 20.9 | |
| 13.0 | |
| 41.2 | |
| 27.7 | |
Income tax expense | |
| 10.5 | |
| 17.2 | |
| 15.7 | |
| 25.4 | |
Other expense (income), net | |
| 1.0 | |
| (18.8) | |
| 4.2 | |
| (18.0) | |
Equity in losses (earnings) of unconsolidated affiliates, net of tax | |
| 5.0 | |
| 31.0 | |
| (1.4) | |
| 25.4 | |
Gain on sale of investment in unconsolidated affiliate, net of tax | |
| — | |
| (5.0) | |
| — | |
| (5.0) | |
Net losses attributable to redeemable noncontrolling interests | |
| (7.5) | |
| — | |
| (16.1) | |
| — | |
EBITDA | |
| 160.0 | |
| 135.1 | |
| 315.6 | |
| 261.0 | |
Deferred revenue purchase accounting adjustment | |
| — | |
| 0.2 | |
| — | |
| 0.3 | |
Equity-based compensation(1) | |
| 13.2 | |
| 9.5 | |
| 23.7 | |
| 21.2 | |
Debt and/or equity offering expenses | |
| — | |
| — | |
| — | |
| 0.2 | |
Acquisition-related costs | |
| 4.0 | |
| 2.5 | |
| 11.3 | |
| 3.9 | |
Expense reduction initiatives | |
| 0.3 | |
| — | |
| 0.9 | |
| 0.8 | |
Adjusted EBITDA | | $ | 177.5 | | $ | 147.3 | | $ | 351.5 | | $ | 287.4 | |
Net earnings margin | |
| 8.9 | % |
| 13.3 | % |
| 10.9 | % |
| 15.3 | % |
Adjusted EBITDA margin | |
| 49.1 | % |
| 50.2 | % |
| 49.4 | % |
| 49.2 | % |
| (1) | Includes accelerated recognition of equity-based compensation expense of $2.9 million for the three and six months ended June 30, 2021 and $0.2 million for the six months ended June 30, 2020. |
12
BLACK KNIGHT, INC.
Reconciliation of GAAP to Non-GAAP Financial Measures (Continued)
(In millions, except per share data)
(Unaudited)
Reconciliation of Net Earnings to Adjusted Net Earnings
|
| Three months ended June 30, | | Six months ended June 30, | ||||||||
|
| 2021 |
| 2020 |
| 2021 |
| 2020 | ||||
Net earnings attributable to Black Knight | | $ | 39.7 | | $ | 39.1 | | $ | 93.8 | | $ | 89.2 |
Equity in losses (earnings) of unconsolidated affiliates, net of tax | |
| 5.0 | |
| 31.0 | |
| (1.4) | |
| 25.4 |
Gain on sale of investment in unconsolidated affiliate, net of tax | |
| — | |
| (5.0) | |
| — | |
| (5.0) |
Depreciation and amortization purchase accounting adjustment (1) | |
| 53.7 | | | 24.7 | | | 106.6 | | | 48.3 |
Deferred revenue purchase accounting adjustment | |
| — | | | 0.2 | | | — | | | 0.3 |
Equity-based compensation (2) | |
| 13.2 | | | 9.5 | | | 23.7 | | | 21.2 |
Debt and/or equity offering expenses | |
| 0.1 | | | — | | | 2.3 | | | 0.2 |
Acquisition-related costs | |
| 4.0 | | | 2.5 | | | 11.3 | | | 3.9 |
Expense reduction initiatives | |
| 0.3 | | | — | | | 0.9 | | | 0.8 |
Legal matters | |
| 1.0 | | | (18.7) | | | 1.9 | | | (17.9) |
Income tax expense adjustment | |
| (15.9) | | | (5.0) | | | (38.0) | | | (18.7) |
Redeemable noncontrolling interests adjustment (3) | |
| (12.5) | | | — | | | (25.0) | | | — |
Adjusted net earnings | | $ | 88.6 | | $ | 78.3 | | $ | 176.1 | | $ | 147.7 |
| | | | | | | | | | | | |
Adjusted EPS | | $ | 0.57 | | $ | 0.52 | | $ | 1.13 | | $ | 0.99 |
Weighted average shares outstanding, diluted | |
| 155.7 | |
| 150.0 | |
| 155.8 | |
| 149.3 |
| (1) | Components of the depreciation and amortization purchase accounting adjustment are as follows: |
|
| Three months ended June 30, |
| Six months ended June 30, | ||||||||
|
| 2021 |
| 2020 |
| 2021 |
| 2020 | ||||
Other intangible assets | | $ | 39.1 | | $ | 13.4 | | $ | 77.9 | | $ | 26.4 |
Computer software | |
| 14.5 | | | 11.3 | | | 28.4 | | | 22.0 |
Property and equipment | |
| 0.2 | | | 0.2 | | | 0.4 | | | 0.4 |
Deferred contract costs | |
| (0.1) | | | (0.2) | | | (0.1) | | | (0.5) |
Depreciation and amortization purchase accounting adjustment | | $ | 53.7 | | $ | 24.7 | | $ | 106.6 | | $ | 48.3 |
| (2) | Includes accelerated recognition of equity-based compensation expense of $2.9 million for the three and six months ended June 30, 2021 and $0.2 million for the six months ended June 30, 2020. |
| (3) | For the three and six months ended June 30, 2021, the redeemable noncontrolling interests adjustment primarily includes the effect of the net incremental depreciation and amortization adjustments associated with the application of purchase accounting. |
13
BLACK KNIGHT, INC.
Reconciliation of GAAP to Non-GAAP Financial Measures (Continued)
(In millions)
(Unaudited)
Reconciliation of Revenue Growth to Adjusted Revenue Growth and Organic Revenue Growth
|
| Full Year 2021 Guidance | | Full Year 2020 | |||||||||||
| | | | | | | | | | | Pre-acquisition | | Adjusted | ||
|
| Low |
| High |
| As reported |
| revenues(1) |
| base | |||||
Revenues | | $ | 1,447 | | $ | 1,463 | | $ | 1,239 | | $ | 101 | | $ | 1,340 |
Revenue growth | |
| 17 | % |
| 18 | % |
|
| |
|
| |
|
|
Organic revenue growth | |
| 8 | % |
| 9 | % |
|
| |
|
| |
|
|
| (1) | Includes pre-acquisition revenues of Optimal Blue, Top of Mind, eMBS, DocVerify, Collateral Analytics and NexSpring for the year ended December 31, 2020. |
14
Exhibit 99.2
| BLACK KNIGHT, INC. Second Quarter 2021 Financial Results August 5, 2021 |

| Forward-Looking Statements This presentation contains forward-looking statements that involve a number of risks and uncertainties. Statements that are not historical facts, including statements regarding expectations, hopes, intentions or strategies regarding the future are forward-looking statements. Forward-looking statements are based on Black Knight management's beliefs, as well as assumptions made by, and information currently available to, them. Because such statements are based on expectations as to future financial and operating results and are not statements of fact, actual results may differ materially from those projected. Black Knight undertakes no obligation to update any forward-looking statements, whether as a result of new information, future events or otherwise. The risks and uncertainties that forward-looking statements are subject to include, but are not limited to: changes in general economic, business, regulatory and political conditions, including those resulting from pandemics such as COVID-19, particularly as they affect foreclosures and the mortgage industry; the outbreak of COVID-19 and measures to reduce its spread, including the effect of governmental or voluntary actions such as business shutdowns and stay-at-home orders; security breaches against our information systems or breaches involving our third-party vendors; our ability to maintain and grow our relationships with our clients; our ability to comply with changes to the laws, rules and regulations that affect our and our clients’ businesses; our ability to adapt our solutions to technological changes or evolving industry standards to achieve our growth strategies; our ability to protect our proprietary software and information rights; the effect of any potential defects, development delays, installation difficulties or system failures on our business and reputation; risks associated with the availability of data; the effects of our existing leverage on our ability to make acquisitions and invest in our business; our ability to successfully consummate, integrate and achieve the intended benefits of acquisitions; risks associated with our investment in DNB and integrating and achieving the intended benefits of the acquisition of Optimal Blue, LLC (“Optimal Blue”); and other risks and uncertainties detailed in the “Statement Regarding Forward-Looking Information,” “Risk Factors” and other sections of our Annual Report on Form 10-K for the year ended December 31, 2020 and other filings with the Securities and Exchange Commission (“SEC”). Non-GAAP Financial Measures This presentation contains non-GAAP financial measures, including Adjusted revenues, Organic revenue growth, Adjusted EBITDA, Adjusted EBITDA margin, Adjusted net earnings and Adjusted EPS. These are important financial measures for us but are not financial measures as defined by generally accepted accounting principles ("GAAP"). The presentation of this financial information is not intended to be considered in isolation of or as a substitute for, or superior to, the financial information prepared and presented in accordance with GAAP. We use these non-GAAP financial measures for financial and operational decision making and as a means to evaluate period-to-period comparisons. We believe these measures provide useful information about operating results, enhance the overall understanding of past financial performance and future prospects and allow for greater transparency with respect to key metrics used by management in its financial and operational decision making, including determining a portion of executive compensation. We also present these non-GAAP financial measures because we believe investors, analysts and rating agencies consider them useful in measuring our ability to meet our debt service obligations. By disclosing these non-GAAP financial measures, we believe we offer investors a greater understanding of, and an enhanced level of transparency into, the means by which our management operates the company. These non- GAAP financial measures are not measures presented in accordance with GAAP, and our use of these terms may vary from that of others in our industry. These non-GAAP financial measures should not be considered as an alternative to revenues, net earnings, net earnings per share, net earnings margin or any other measures derived in accordance with GAAP as measures of operating performance or liquidity. Reconciliations of these non-GAAP financial measures to the most directly comparable GAAP financial measures are presented in the attached schedules. We have not provided a reconciliation of forward-looking Adjusted EBITDA and Adjusted EPS, including certain components of the forward-looking reconciliation, to the most directly comparable GAAP financial measures, due primarily to variability and difficulty in making accurate forecasts and projections of non-operating matters that may arise, as not all of the information necessary for a quantitative reconciliation is available to us without unreasonable effort. For the same reasons, we are unable to address the probable significance of the information. See the Appendix for further information. Revenues, EBITDA and EBITDA margin for the Software Solutions and Data and Analytics segments are presented in conformity with Accounting Standards Codification Topic 280, Segment Reporting. These measures are reported to the chief operating decision maker for purposes of making decisions about allocating resources to the segments and assessing their performance. For these reasons, these measures are excluded from the definition of non-GAAP financial measures under the SEC's Regulation G and Item 10(e) of Regulation S-K. 2 Disclaimer Confidential, Proprietary and/or Trade Secret | TM SM ® Trademark(s) of Black Knight IP Holding Company, LLC, or an affiliate. © 2021 Black Knight Technologies, LLC. All Rights Reserved. |
| 3 Financial Highlights (GAAP) Metrics Second Quarter 2021 First Half 2021 Revenues $361.3 million, +23% $711.0 million, +22% Net earnings attributable to Black Knight $39.7 million, +2% $93.8 million, +5% Net earnings margin 8.9% 10.9% Diluted EPS $0.25, -4% $0.60, flat Confidential, Proprietary and/or Trade Secret | TM SM ® Trademark(s) of Black Knight IP Holding Company, LLC, or an affiliate. © 2021 Black Knight Technologies, LLC. All Rights Reserved. |

| 4 Financial Highlights (Non-GAAP) Metrics(1) Second Quarter 2021 First Half 2021 Organic revenue growth +11% +10% Adjusted EBITDA $177.5 million, +20.5% $351.5 million, +22% Adjusted EBITDA margin 49.1% 49.4% Adjusted net earnings $88.6 million, +13% $176.1 million, +19% Adjusted EPS $0.57, +10% $1.13, +14% (1) See appendix for non-GAAP reconciliations. Confidential, Proprietary and/or Trade Secret | TM SM ® Trademark(s) of Black Knight IP Holding Company, LLC, or an affiliate. © 2021 Black Knight Technologies, LLC. All Rights Reserved. |

| 5 Confidential, Proprietary and/or Trade Secret | TM SM ® Trademark(s) of Black Knight IP Holding Company, LLC, or an affiliate. © 2020 Black Knight Technologies, LLC. All Rights Reserved. Software Solutions Revenues ($ in millions) $245.1 $305.4 Q2 2020 Q2 2021 $489.8 $601.2 YTD 2020 YTD 2021 +25% Y/Y +23% Y/Y EBITDA MARGIN (%) 59.6% 57.2% Q2 2020 Q2 2021 58.3% 57.5% YTD 2020 YTD 2021 -240 bps Y/Y -80 bps Y/Y SECOND QUARTER HIGHLIGHTS • Organic revenue growth of 11% • Servicing software solutions growth of 13% • Origination software solutions growth of 61% • EBITDA margin of 57.2% Confidential, Proprietary and/or Trade Secret | TM SM ® Trademark(s) of Black Knight IP Holding Company, LLC, or an affiliate. © 2021 Black Knight Technologies, LLC. All Rights Reserved. |
| 6 Confidential, Proprietary and/or Trade Secret | TM SM ® Trademark(s) of Black Knight IP Holding Company, LLC, or an affiliate. © 2020 Black Knight Technologies, LLC. All Rights Reserved. Data & Analytics SECOND QUARTER HIGHLIGHTS • Revenues increased 16% primarily driven by strong sales execution across nearly all business lines and revenue from an acquired business • Organic revenue growth of 14% • EBITDA margin expansion of 380 basis points to 37.2% $48.2 $55.9 Q2 2020 Q2 2021 $94.3 $109.8 YTD 2020 YTD 2021 Revenues ($ in millions) +16% Y/Y +16% Y/Y EBITDA MARGIN (%) 33.4% 37.2% Q2 2020 Q2 2021 32.6% 36.9% YTD 2020 YTD 2021 +380 bps Y/Y +430 bps Y/Y Confidential, Proprietary and/or Trade Secret | TM SM ® Trademark(s) of Black Knight IP Holding Company, LLC, or an affiliate. © 2021 Black Knight Technologies, LLC. All Rights Reserved. |
| 7 Balance Sheet Highlights ($ in millions) June 30, 2021 Maturity Interest Rate Cash and cash equivalents $ 88.7 Revolver ($1,000mm) 98.0 2026 LIBOR + 150 bps Term A Loan 1,150.0 2026 LIBOR + 150 bps Senior Notes 1,000.0 2028 3.625% Other 9.0 2023 0.00% Total long-term debt(1) $ 2,257.0 Net leverage ratio(2) 3.2x Market value of DNB Investment(3) $ 1,172 After-tax value of our DNB investment(3) $ 1,000 (1) Excludes debt issuance costs and discount. (2) Calculated in accordance with the terms of our second amended and restated credit and guaranty agreement. (3) See appendix for more information. Confidential, Proprietary and/or Trade Secret | TM SM ® Trademark(s) of Black Knight IP Holding Company, LLC, or an affiliate. © 2021 Black Knight Technologies, LLC. All Rights Reserved. |
| 8 Full Year 2021 Financial Guidance 2021 Outlook ($ in millions) 2020 Actual (Prior) Feb. 16, 2021 (Prior) May 6, 2021 (Updated) Aug. 5, 2021 (Updated) Aug. 5, 2021 Revenues $1,239 +13 to 15% +14 to 15% $1,447 to $1,463 +17 to 18% Organic revenue growth +5 to 7% +6 to 8% +8 to 9% Adjusted EBITDA $610 +13 to 17% +14 to 17% $704 to $716 +15 to 17% Adjusted EPS $2.11 Flat to +5% +2 to 6% $2.23 to $2.29 +6 to 9% Confidential, Proprietary and/or Trade Secret | TM SM ® Trademark(s) of Black Knight IP Holding Company, LLC, or an affiliate. © 2021 Black Knight Technologies, LLC. All Rights Reserved. |
| 9 Full Year 2021 Financial Guidance (Continued) Full year 2021 guidance is based upon the following estimates and assumptions: ▪ Incremental foreclosure revenues to be delayed until at least the first quarter of 2022 ▪ Full year headwind of ~$5 million related to market origination volume (Second half headwind of ~$12 million) ▪ Interest expense of ~$83 million to $84 million ▪ Adjusted depreciation and amortization expense of ~$144 million to $147 million (excluding incremental depreciation and amortization expense resulting from purchase accounting)(1) ▪ Adjusted earnings attributable to non-controlling interest of $20 million to $21 million(1) ▪ Adjusted effective tax rate of ~22% to 23%(1) ▪ Diluted weighted average shares outstanding of ~156 million for the full year 2021 Confidential, Proprietary and/or Trade Secret | TM SM ® Trademark(s) of Black Knight IP Holding Company, LLC, or an affiliate. © 2021 Black Knight Technologies, LLC. All Rights Reserved. (1) Represents a component of the full year Adjusted EPS guidance range. Refer to Slide 2 for the disclaimer related to certain forward-looking non-GAAP financial measures, including certain components of the forward-looking non-GAAP financial measures. |

| Confidential, Proprietary and/or Trade Secret | TM SM ® Trademark(s) of Black Knight IP Holding Company, LLC, or an affiliate. © 2020 Black Knight Technologies, LLC. All Rights Reserved. APPENDIX |

| 11 Non-GAAP Financial Measures Adjusted Revenues – We define Adjusted Revenues as Revenues adjusted to include the revenues that were not recorded by Black Knight during the periods presented due to the deferred revenue purchase accounting adjustment recorded in accordance with GAAP. These adjustments are reflected in Corporate and Other. Organic revenue growth – We define Organic revenue growth as Adjusted revenues, as defined above, for the current period compared to an adjusted revenue base for the prior period, which is adjusted to add pre-acquisition revenues of acquired businesses for the portion of the prior year matching the portion of the current year that we owned the acquired business. Adjusted EBITDA – We define Adjusted EBITDA as Net earnings attributable to Black Knight, with adjustments to reflect the addition or elimination of certain statement of earnings items including, but not limited to:(i) Depreciation and amortization;(ii) Impairment charges;(iii) Interest expense, net;(iv) Income tax expense;(v) Other expense (income), net;(vi) Equity in losses (earnings) of unconsolidated affiliates, net of tax;(vii)(Gains) losses on sale of investments in unconsolidated affiliate, net of tax;(viii) Net earnings (losses) attributable to redeemable noncontrolling interests;(ix) deferred revenue purchase accounting adjustment;(x) equity-based compensation, including certain related payroll taxes;(xi) costs associated with debt and/or equity offerings;(xii) acquisition- related costs, including costs pursuant to purchase agreements; and (xiii) costs associated with expense reduction initiatives. These adjustments are reflected in Corporate and Other. Adjusted EBITDA Margin – Adjusted EBITDA margin is calculated by dividing Adjusted EBITDA by Adjusted revenues. Adjusted net earnings – We define Adjusted net earnings as Net earnings attributable to Black Knight with adjustments to reflect the addition or elimination of certain statement of earnings items including, but not limited to:(i) equity in losses (earnings) of unconsolidated affiliates, net of tax;(ii)(gains) losses on sale of investments in unconsolidated affiliate, net of tax;(iii) the net incremental depreciation and amortization adjustments associated with the application of purchase accounting;(iv) deferred revenue purchase accounting adjustment;(v) equity-based compensation, including certain related payroll taxes;(vi) costs associated with debt and/or equity offerings;(vii) acquisition-related costs, including costs pursuant to purchase agreements;(viii) costs associated with expense reduction initiatives;(ix) costs and settlement (gains) losses associated with significant legal matters;(x) adjustment for income tax expense primarily related to the tax effect of the non-GAAP adjustments; and (xi) adjustment for redeemable noncontrolling interests primarily related to the effect of the non- GAAP adjustments. Adjusted EPS – Adjusted EPS is calculated by dividing Adjusted net earnings by the diluted weighted average shares of common stock outstanding. Confidential, Proprietary and/or Trade Secret | TM SM ® Trademark(s) of Black Knight IP Holding Company, LLC, or an affiliate. © 2021 Black Knight Technologies, LLC. All Rights Reserved. |
| 12 Non-GAAP Reconciliation: Adjusted Revenues and Organic Revenue Growth Three months ended June 30, 2021 2020 Organic revenue growth ($ in millions) As reported As reported Pre-acquisition revenues Adjusted base Servicing Software $ 207.8 $ 184.3 $ — $ 184.3 13% Origination Software 97.6 60.8 30.6 91.4 7% Software Solutions 305.4 245.1 30.6 275.7 11% Data and Analytics 55.9 48.2 0.7 48.9 14% Corporate and Other —(0.2) Revenues 361.3 293.1 Deferred revenue purchase accounting adjustment — 0.2 Adjusted revenues $ 361.3 $293.3 $ 31.3 $ 324.6 11% Confidential, Proprietary and/or Trade Secret | TM SM ® Trademark(s) of Black Knight IP Holding Company, LLC, or an affiliate. © 2021 Black Knight Technologies, LLC. All Rights Reserved. |

| 13 Non-GAAP Reconciliation: Adjusted Revenues and Organic Revenue Growth Confidential, Proprietary and/or Trade Secret | TM SM ® Trademark(s) of Black Knight IP Holding Company, LLC, or an affiliate. © 2021 Black Knight Technologies, LLC. All Rights Reserved. Six months ended June 30, 2021 2020 Organic revenue growth ($ in millions) As reported As reported Pre-acquisition revenues Adjusted base Servicing Software $ 410.5 $ 380.0 $ — $ 380.0 8% Origination Software 190.7 109.8 58.3 168.1 13% Software Solutions 601.2 489.8 58.3 548.1 10% Data and Analytics 109.8 94.3 3.0 97.3 13% Corporate and Other —(0.3) Revenues 711.0 583.8 Deferred revenue purchase accounting adjustment — 0.3 Adjusted revenues $ 711.0 $584.1 $ 61.3 $ 645.4 10% |
| 14 Non-GAAP Reconciliation: Adjusted EBITDA Three months ended June 30, Six months ended June 30, ($ in millions) 2021 2020 2021 2020 Net earnings attributable to Black Knight $ 39.7 $ 39.1 $ 93.8 $ 89.2 Depreciation and amortization 90.4 58.6 178.2 116.3 Interest expense, net 20.9 13.0 41.2 27.7 Income tax expense 10.5 17.2 15.7 25.4 Other expense (income), net 1.0 (18.8) 4.2 (18.0) Equity in losses (earnings) of unconsolidated affiliates, net of tax 5.0 31.0 (1.4) 25.4 (Gains) losses on sale of investments in unconsolidated affiliate, net of tax —(5.0) —(5.0) Net losses attributable to redeemable noncontrolling interests (7.5) —(16.1) — EBITDA 160.0 135.1 315.6 261.0 Deferred revenue purchase accounting adjustment — 0.2 — 0.3 Equity-based compensation 13.2 9.5 23.7 21.2 Debt and/or equity offering expenses ——— 0.2 Acquisition-related costs 4.0 2.5 11.3 3.9 Expense reduction initiatives 0.3 — 0.9 0.8 Adjusted EBITDA $ 177.5 $ 147.3 $ 351.5 $ 287.4 Net earnings margin (%) 8.9% 13.3% 10.9% 15.3% Adjusted EBITDA margin (%) 49.1% 50.2% 49.4% 49.2% Confidential, Proprietary and/or Trade Secret | TM SM ® Trademark(s) of Black Knight IP Holding Company, LLC, or an affiliate. © 2021 Black Knight Technologies, LLC. All Rights Reserved. |

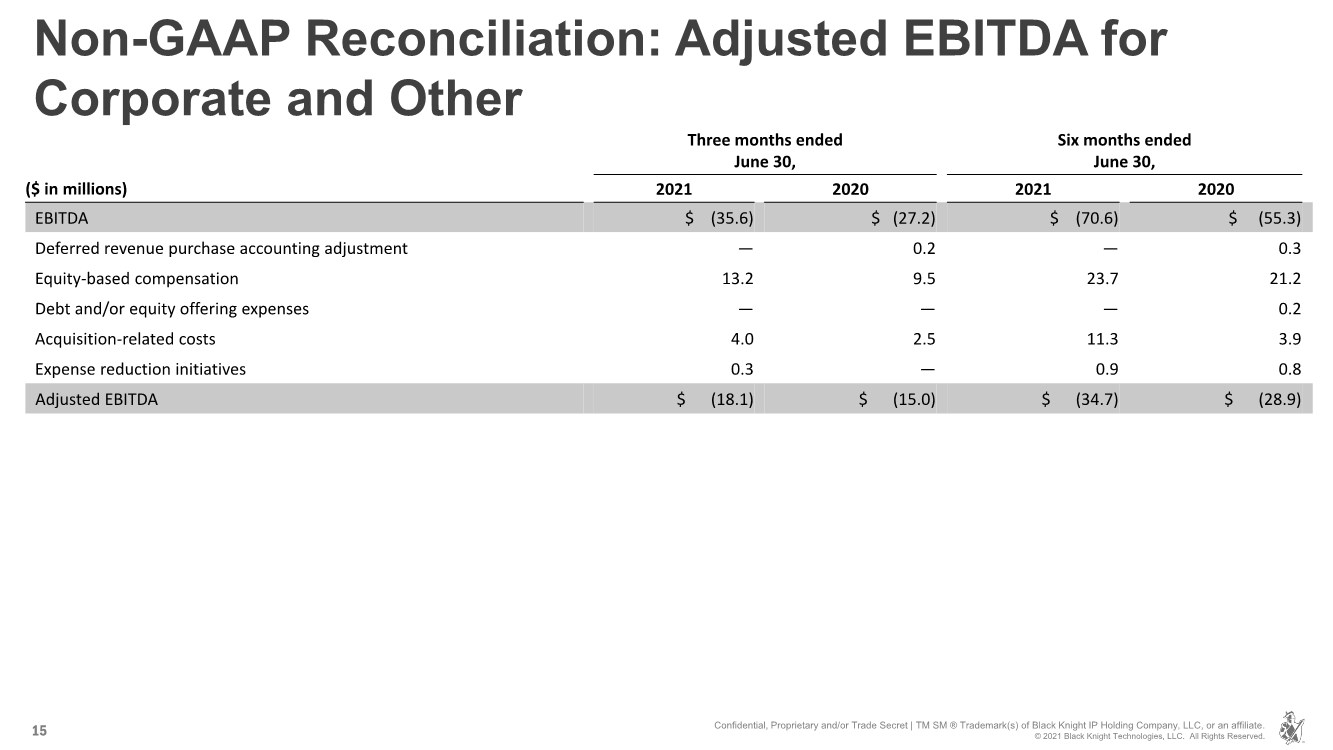
| 15 Non-GAAP Reconciliation: Adjusted EBITDA for Corporate and Other Three months ended June 30, Six months ended June 30, ($ in millions) 2021 2020 2021 2020 EBITDA $ (35.6) $ (27.2) $ (70.6) $ (55.3) Deferred revenue purchase accounting adjustment — 0.2 — 0.3 Equity-based compensation 13.2 9.5 23.7 21.2 Debt and/or equity offering expenses ——— 0.2 Acquisition-related costs 4.0 2.5 11.3 3.9 Expense reduction initiatives 0.3 — 0.9 0.8 Adjusted EBITDA $ (18.1) $ (15.0) $ (34.7) $ (28.9) Confidential, Proprietary and/or Trade Secret | TM SM ® Trademark(s) of Black Knight IP Holding Company, LLC, or an affiliate. © 2021 Black Knight Technologies, LLC. All Rights Reserved. |
| 16 Non-GAAP Reconciliation: Adjusted Net Earnings Three months ended June 30, Six months ended June 30, ($ in millions, except per share data) 2021 2020 2021 2020 Net earnings attributable to Black Knight $ 39.7 $ 39.1 $ 93.8 $ 89.2 Equity in losses (earnings) of unconsolidated affiliates, net of tax 5.0 31.0 (1.4) 25.4 (Gains) losses on sale of investments in unconsolidated affiliate, net of tax —(5.0) —(5.0) Depreciation and amortization purchase accounting adjustment(1) 53.7 24.7 106.6 48.3 Deferred revenue purchase accounting adjustment — 0.2 — 0.3 Equity-based compensation 13.2 9.5 23.7 21.2 Debt and/or equity offering expenses 0.1 — 2.3 0.2 Acquisition-related costs 4.0 2.5 11.3 3.9 Expense reduction initiatives 0.3 — 0.9 0.8 Legal matters 1.0 (18.7) 1.9 (17.9) Income tax expense adjustment(2) (15.9) (5.0) (38.0) (18.7) Redeemable noncontrolling interests adjustment(3) (12.5) —(25.0) — Adjusted net earnings $ 88.6 $ 78.3 $ 176.1 $ 147.7 Adjusted EPS $ 0.57 $ 0.52 $ 1.13 $ 0.99 Weighted average shares outstanding, diluted 155.7 150.0 155.8 149.3 Confidential, Proprietary and/or Trade Secret | TM SM ® Trademark(s) of Black Knight IP Holding Company, LLC, or an affiliate. © 2021 Black Knight Technologies, LLC. All Rights Reserved. |
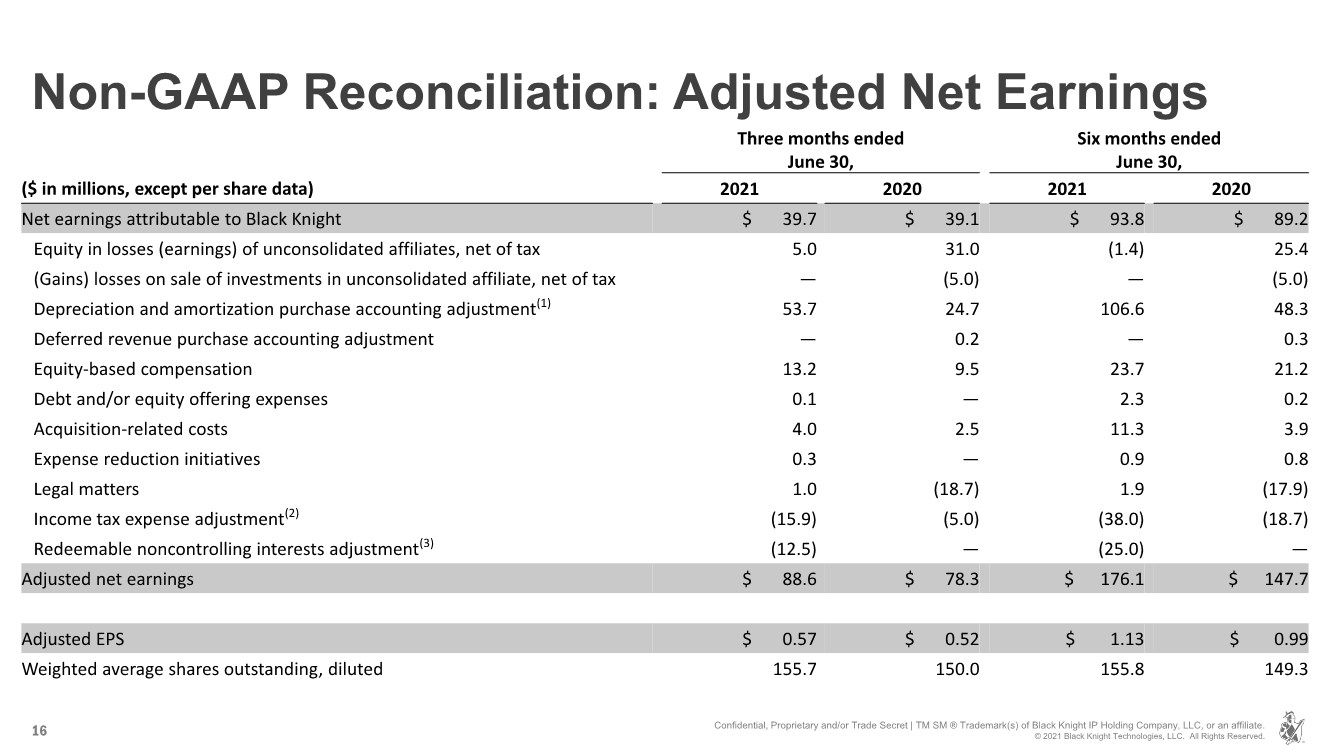
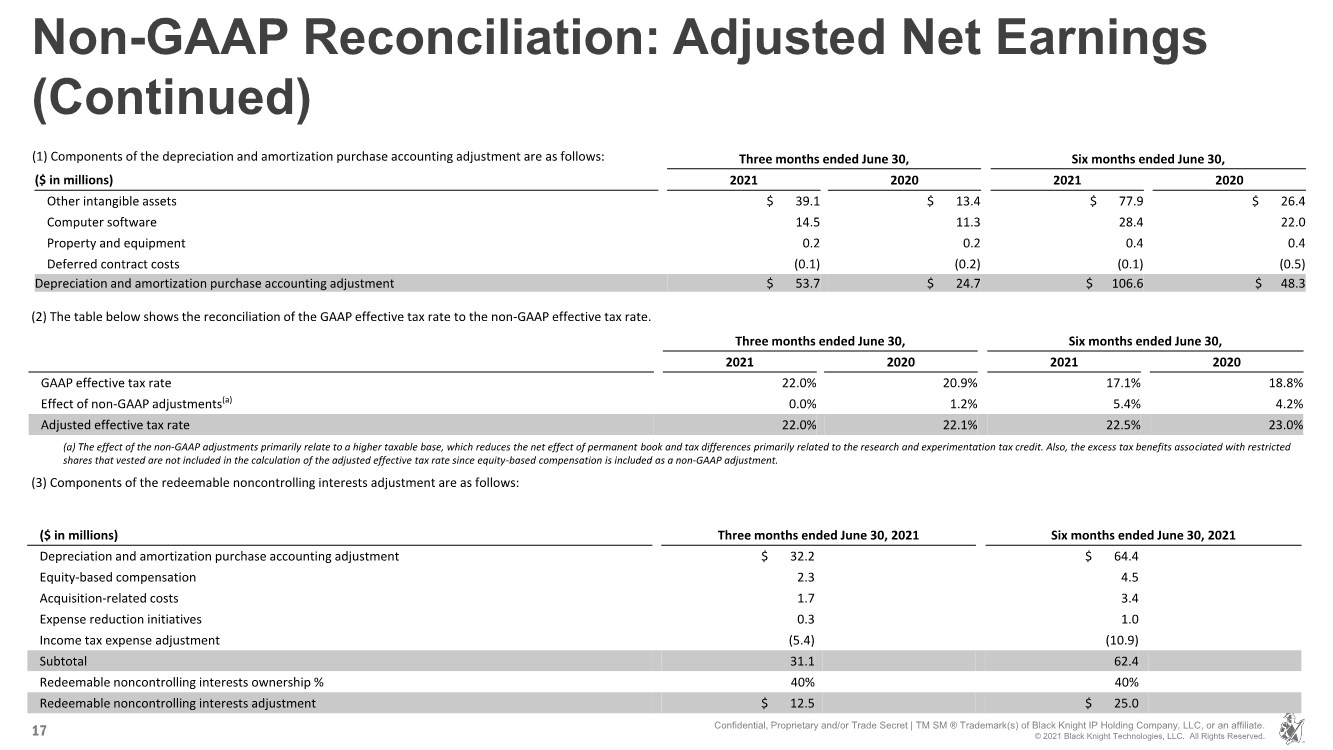
| 17 Non-GAAP Reconciliation: Adjusted Net Earnings (Continued) Three months ended June 30, Six months ended June 30, ($ in millions) 2021 2020 2021 2020 Other intangible assets $ 39.1 $ 13.4 $ 77.9 $ 26.4 Computer software 14.5 11.3 28.4 22.0 Property and equipment 0.2 0.2 0.4 0.4 Deferred contract costs (0.1) (0.2) (0.1) (0.5) Depreciation and amortization purchase accounting adjustment $ 53.7 $ 24.7 $ 106.6 $ 48.3 Confidential, Proprietary and/or Trade Secret | TM SM ® Trademark(s) of Black Knight IP Holding Company, LLC, or an affiliate. © 2021 Black Knight Technologies, LLC. All Rights Reserved. (2) The table below shows the reconciliation of the GAAP effective tax rate to the non-GAAP effective tax rate. (1) Components of the depreciation and amortization purchase accounting adjustment are as follows: Three months ended June 30, Six months ended June 30, 2021 2020 2021 2020 GAAP effective tax rate 22.0% 20.9% 17.1% 18.8% Effect of non-GAAP adjustments(a) 0.0% 1.2% 5.4% 4.2% Adjusted effective tax rate 22.0% 22.1% 22.5% 23.0% (a) The effect of the non-GAAP adjustments primarily relate to a higher taxable base, which reduces the net effect of permanent book and tax differences primarily related to the research and experimentation tax credit. Also, the excess tax benefits associated with restricted shares that vested are not included in the calculation of the adjusted effective tax rate since equity-based compensation is included as a non-GAAP adjustment. (3) Components of the redeemable noncontrolling interests adjustment are as follows: ($ in millions) Three months ended June 30, 2021 Six months ended June 30, 2021 Depreciation and amortization purchase accounting adjustment $ 32.2 $ 64.4 Equity-based compensation 2.3 4.5 Acquisition-related costs 1.7 3.4 Expense reduction initiatives 0.3 1.0 Income tax expense adjustment (5.4) (10.9) Subtotal 31.1 62.4 Redeemable noncontrolling interests ownership % 40% 40% Redeemable noncontrolling interests adjustment $ 12.5 $ 25.0 |
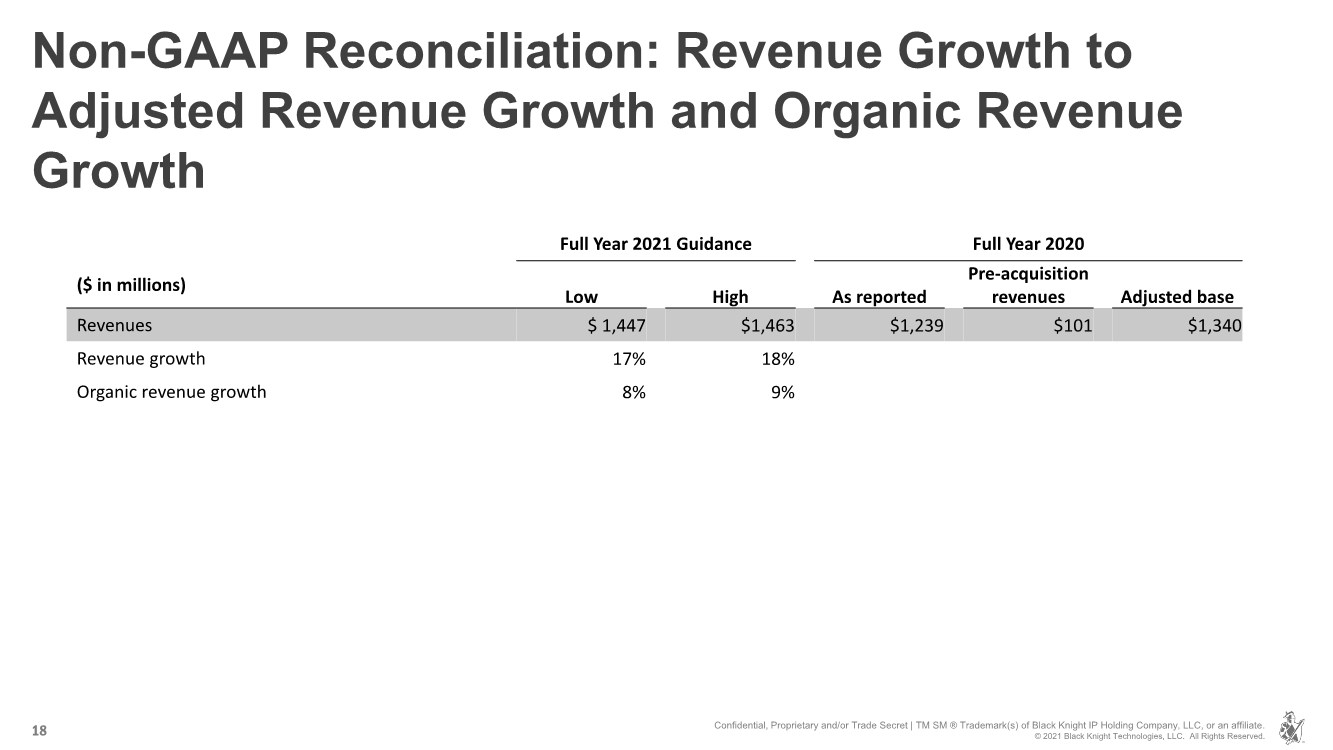
| 18 Non-GAAP Reconciliation: Revenue Growth to Adjusted Revenue Growth and Organic Revenue Growth Full Year 2021 Guidance Full Year 2020 ($ in millions) Low High As reported Pre-acquisition revenues Adjusted base Revenues $ 1,447 $1,463 $1,239 $101 $1,340 Revenue growth 17% 18% Organic revenue growth 8% 9% Confidential, Proprietary and/or Trade Secret | TM SM ® Trademark(s) of Black Knight IP Holding Company, LLC, or an affiliate. © 2021 Black Knight Technologies, LLC. All Rights Reserved. |
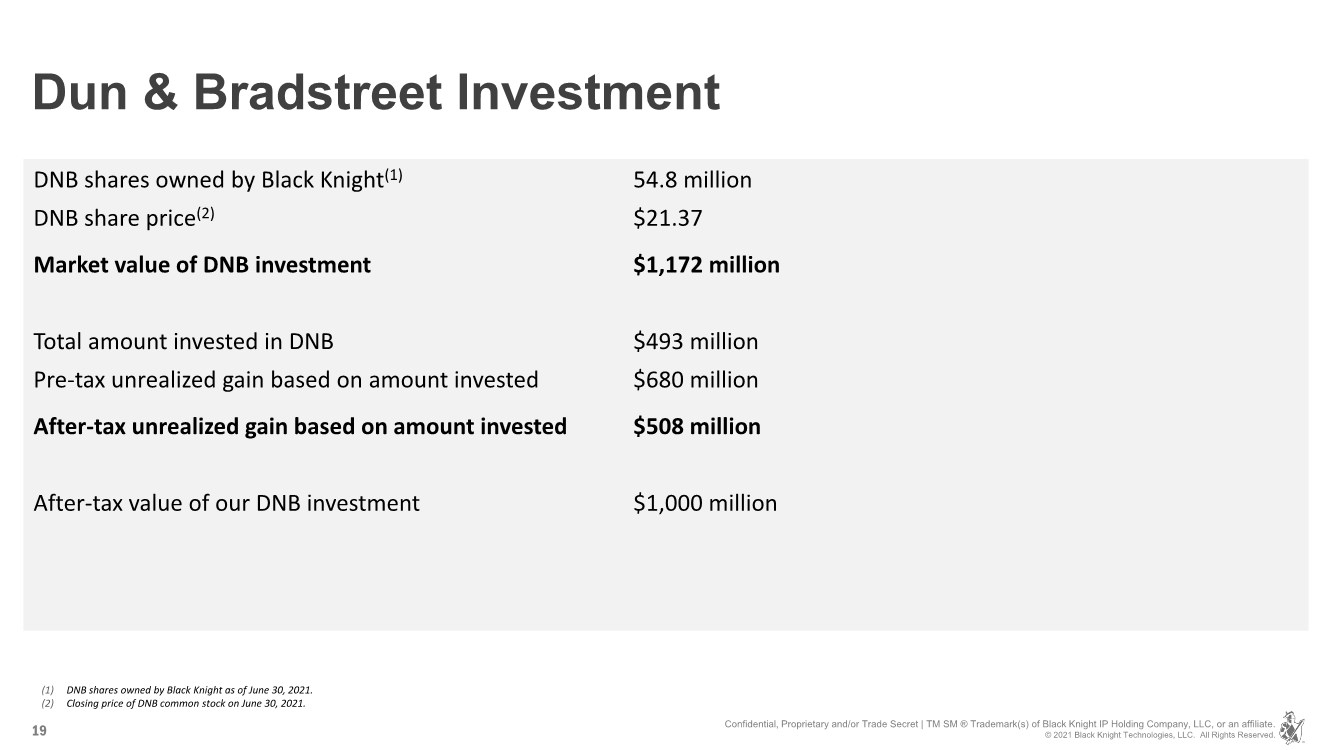
| Dun & Bradstreet Investment 19 DNB shares owned by Black Knight(1) 54.8 million DNB share price(2) $21.37 Market value of DNB investment $1,172 million Total amount invested in DNB $493 million Pre-tax unrealized gain based on amount invested $680 million After-tax unrealized gain based on amount invested $508 million After-tax value of our DNB investment $1,000 million (1) DNB shares owned by Black Knight as of June 30, 2021. (2) Closing price of DNB common stock on June 30, 2021. Confidential, Proprietary and/or Trade Secret | TM SM ® Trademark(s) of Black Knight IP Holding Company, LLC, or an affiliate. © 2021 Black Knight Technologies, LLC. All Rights Reserved. |
Serious News for Serious Traders! Try StreetInsider.com Premium Free!
You May Also Be Interested In
- Suzano Ventures invests up to US$5 million into Bioform Technologies to further develop bio-based plastic alternatives
- Demand for AI Marketing and Personalisation Accelerates in the UK: Attentive Sees 128% Growth in the Last Year
- WOO X Lists $CKB on its Spot Market
Create E-mail Alert Related Categories
SEC FilingsSign up for StreetInsider Free!
Receive full access to all new and archived articles, unlimited portfolio tracking, e-mail alerts, custom newswires and RSS feeds - and more!
