

Form 8-K Avery Dennison Corp For: Jul 27
 Tweet
Tweet Share
ShareExhibit 99.1

For Immediate Release
AVERY DENNISON ANNOUNCES
SECOND QUARTER 2021 RESULTS
Highlights:
| ● | 2Q21 Reported EPS of $2.19, up 131% |
| ¡ | Adjusted EPS (non-GAAP) of $2.25, up 77% |
| ● | 2Q21 Net sales increased 37.5% to $2.10 billion |
| ¡ | Sales growth ex. currency (non-GAAP) of 29.2% |
| ¡ | Organic sales growth (non-GAAP) of 28.1% |
| ● | Raised FY 2021 EPS guidance ranges |
| ¡ | Reported EPS range now $8.50 to $8.80 (previously $8.25 to $8.65) |
| ¡ | Adjusted EPS range now $8.65 to $8.95 (previously $8.40 to $8.80) |
| ● | Announced agreement to acquire Vestcom for $1.45 billion |
GLENDALE, Calif., July 28, 2021 – Avery Dennison Corporation (NYSE: AVY) today announced preliminary, unaudited results for its second quarter ended July 3, 2021. Non-GAAP financial measures referenced in this document are reconciled to GAAP in the attached tables. Unless otherwise indicated, comparisons are to the same period in the prior year.
“We delivered another strong quarter, ahead of expectations, raised our outlook for the second half, and announced an agreement to acquire Vestcom that will build upon and expand RBIS’ strengths,” said Mitch Butier, Avery Dennison president and CEO. “Revenue was up 28 percent organically compared to prior year and up 11 percent compared to 2019, as RBIS and IHM rebounded significantly from prior year lows and strength in LGM continued.
“Our strong performance comes at a time when supply chains remain tight, inflation persists and the global health crisis continues. The current environment reinforces our determination to remain vigilant in ensuring the health and well-being of our employees, delivering for our customers, supporting our communities, and creating value for our shareholders.
“Vestcom, a high growth, high margin business, provides retail shelf-edge pricing and branding labeling solutions. The acquisition will further expand our position in high value categories while adding channel access and data management capabilities to RBIS that have the potential to further advance our Intelligent Labels strategy,” added Butier.
“Once again, I want to thank our entire team for their ongoing efforts to keep one another safe while continuing to deliver for all our stakeholders during this challenging period.”
Operational/Market Update
Uncertainty surrounding the global health crisis remains elevated as many parts of the world are experiencing a surge in COVID-19 cases, with the greatest impact to the company being in South Asia, particularly RBIS. The safety and well-being of employees has been and will continue to be the company’s top priority. The company has taken steps to ensure employee safety, quickly implementing world-class safety protocols and continuing to adapt them as the pandemic evolves.
The company continues to actively manage through a dynamic supply and demand environment. Demand across the majority of businesses and regions remains very strong, while raw materials, freight and labor availability continue to be constrained. The company is leveraging its global scale and working closely with customers and suppliers to minimize disruptions. Inflation remains persistent and pricing and material re-engineering actions are being implemented to offset higher costs.
Second Quarter 2021 Results by Segment
Label and Graphic Materials
| ● | Reported sales increased 25% to $1.4 billion. Compared to prior year, sales were up 17% ex. currency (up 11% vs. 2019) and up 16% on an organic basis (up 11% vs. 2019). |
| ¡ | Label and Packaging Materials sales were up approximately 12% from prior year on an organic basis, with strong growth in both the high value product categories and the base business. |
| ¡ | Sales increased by approximately 49% organically in the combined Graphics and Reflective Solutions businesses. |
| ¡ | On an organic basis, sales were up high-single digits in North America, up mid-teens in Western Europe, and up approximately 20% in emerging markets. |
| ● | Reported operating margin increased 410 basis points to 16.6%. Adjusted operating margin decreased 30 basis points to 14.5% driven by the net impact of pricing and raw material costs and higher employee-related costs, partially offset by higher volume/mix. |
Retail Branding and Information Solutions
| ● | Reported sales increased 80% to $529 million. Compared to prior year, sales were up 73% ex. currency (up 25% vs. 2019) and up 72% on an organic basis (up 14% vs. 2019), reflecting strong growth in both the high value categories and the base business. |
| ¡ | Intelligent Labels was up approximately 65% organically. |
| ● | Reported operating margin increased 1160 basis points to 8.0%. Adjusted operating margin increased 1240 basis points to 13.1% as the benefits from higher volume and productivity more than offset the headwind from prior year temporary cost reduction actions, higher employee-related costs and growth investments. |
Industrial and Healthcare Materials
| ● | Reported sales increased 49% to $197 million. Compared to prior year, sales were up 39% ex. currency (up 11% vs. 2019) and up 33% on an organic basis (up 6% vs. 2019), reflecting an approximately 60% increase in industrial categories and a high-single digit decline in healthcare categories. |
| ● | Reported operating margin increased 580 basis points to 11.5%. Adjusted operating margin increased 490 basis points to 11.7% as the benefit from higher volume/mix more than offset the headwind from prior year temporary cost reduction actions and higher employee-related costs. |
Other
Balance Sheet, Liquidity, and Capital Deployment
The company’s balance sheet remains strong, with ample capacity. Net debt to adjusted EBITDA (non-GAAP) was 1.3 at the end of the second quarter, below its long-term target.
In the first half, the company returned $203 million in cash to shareholders through a combination of share repurchases and dividends, up from $142 million for the same period last year.
The company repurchased 0.2 million shares in the second quarter at an aggregate cost of $39 million. Net of dilution from long-term incentive awards, the company’s share count at the end of the quarter was down by 0.1 million compared to the same time last year.
In May 2021, the Brazilian Federal Supreme Court ruled on the recovery of certain indirect taxes that the company had paid in previous years. As a result of the ruling, the company recorded a gain of $29.1 million that it now expects to use to offset its future taxes in Brazil.
The company recorded a contingent liability during the quarter in the amount of $26.6 million based on a jury verdict issued in May 2021 in the matter of ADASA Inc. vs. Avery Dennison Corporation. The company will appeal the decision and believes it has meritorious defenses to present during the appeal process with an anticipated favorable final outcome.
The company announced today that it has signed an agreement to acquire Vestcom for $1.45 billion, subject to certain closing and post-closing adjustments. Vestcom is a privately held company that provides shelf-edge pricing, productivity and consumer engagement solutions for retailers and consumer packaged goods companies. The acquisition is expected to close in Q3 2021, subject to regulatory approvals and other customary closing conditions. The company plans to fund the acquisition with cash and debt. For more information on Vestcom and the transaction, see full press release here and the slides accompanying today’s release.
Income Taxes
The company’s second quarter effective tax rate was 27.6%. The adjusted (non-GAAP) tax rate for the quarter was 25.6%, while the company’s current expectation for its full year adjusted tax rate is 25.3%.
Cost Reduction Actions
In the second quarter, the company realized approximately $17 million in pre-tax savings from restructuring, net of transition costs, and incurred pre-tax restructuring charges of approximately $2 million, the vast majority of which represents cash charges.
Outlook
In its supplemental presentation materials, “Second Quarter 2021 Financial Review and Analysis,” the company provides a list of factors that it believes will contribute to its 2021 financial results. Based on the factors listed and other assumptions, the company has raised its guidance range for 2021 reported earnings per share from $8.25 to $8.65 to $8.50 to $8.80. Excluding an estimated $0.15 per share related to restructuring charges and other items, the company’s guidance range for adjusted earnings per share has been raised from $8.40 to $8.80 to $8.65 to $8.95.
Note: 2021 estimates do not include the impact of Vestcom; transaction is expected to close in Q3 subject to regulatory approvals and other customary closing conditions
For more details on the company’s results, see the summary tables accompanying this news release, as well as the supplemental presentation materials, “Second Quarter 2021 Financial Review and Analysis,” posted on the company’s website at www.investors.averydennison.com, and furnished to the SEC on Form 8-K.
Throughout this release and the supplemental presentation materials, amounts on a per share basis reflect fully diluted shares outstanding.
About Avery Dennison
Avery Dennison Corporation (NYSE: AVY) is a global materials science company specializing in the design and manufacture of a wide variety of labeling and functional materials. The company’s products, which are used in nearly every major industry, include pressure-sensitive materials for labels and graphic applications; tapes and other bonding solutions for industrial, medical, and retail applications; tags, labels and embellishments for apparel; and radio frequency identification (RFID) solutions serving retail apparel and other markets. Headquartered in Glendale, California, the company employs more than 32,000 employees in more than 50 countries. Reported sales in 2020 were $7.0 billion. Learn more at www.averydennison.com.
# # #
“Safe Harbor” Statement under the Private Securities Litigation Reform Act of 1995
Certain statements contained in this document are “forward-looking statements” intended to qualify for the safe harbor from liability established by the Private Securities Litigation Reform Act of 1995. These forward-looking statements, and financial or other business targets, are subject to certain risks and uncertainties. Forward-looking statements also include those related to the acquisition of Vestcom, including its anticipated closing, benefits, financing and effect on our long-term targets and future financial results.
We believe that the most significant risk factors that could affect our financial performance in the near-term include: (i) the impacts to underlying demand for our products and/or foreign currency fluctuations from global economic conditions, political uncertainty, changes in environmental standards and governmental regulations, including as a result of the coronavirus/COVID-19 pandemic; (ii) competitors’ actions, including pricing, expansion in key markets, and product offerings; (iii) the degree to which higher costs can be offset with productivity measures and/or passed on to customers through price increases, without a significant loss of volume; and (iv) the execution and integration of acquisitions, including the pending acquisition of Vestcom.
Actual results and trends may differ materially from historical or anticipated results depending on a variety of factors, including but are not limited to, risks and uncertainties relating to the following:
| ● | COVID-19 |
| ● | The Vestcom acquisition – our ability to complete the acquisition on the proposed terms or anticipated timeline, including risks and uncertainties related to securing the necessary regulatory approvals, financing and satisfaction of other closing conditions to complete the acquisition; the occurrence of any event, change or other circumstance that could give rise to the termination of the agreement related to the acquisition; significant transaction costs or unknown or inestimable liabilities; the risk of stockholder litigation in connection with the pending acquisition; risks related to future opportunities and plans for the combined company, including the uncertainty of expected future financial performance and results of the combined company after the acquisition closes; effects related to the announcement or completion of the acquisition on the market price of our common stock; and the possibility that, if we do not achieve the perceived benefits of the acquisition as rapidly or to the extent anticipated by financial analysts or investors, the market price of our common stock could decline |
| ● | International Operations – worldwide and local economic and market conditions; changes in political conditions; and fluctuations in foreign currency exchange rates and other risks associated with foreign operations, including in emerging markets |
| ● | Our Business – changes in our markets due to competitive conditions, technological developments, environmental standards, laws and regulations, and customer preferences; fluctuations in demand affecting sales to customers; execution and integration of acquisitions, including the pending acquisition of Vestcom; selling prices; fluctuations in the cost and availability of raw materials and energy; the impact of competitive products and pricing; customer and supplier concentrations or consolidations; financial condition of distributors; outsourced manufacturers; product and service quality; timely development and market acceptance of new products, including sustainable or sustainably-sourced products; investment in development activities and new production facilities; successful implementation of new manufacturing technologies and installation of manufacturing equipment; our ability to generate sustained productivity improvement; our ability to achieve and sustain targeted cost reductions; and collection of receivables from customers |
| ● | Income Taxes – fluctuations in tax rates; changes in tax laws and regulations, and uncertainties associated with interpretations of such laws and regulations; retention of tax incentives; outcome of tax audits; and the realization of deferred tax assets |
| ● | Information Technology – disruptions in information technology systems, including cyber-attacks or other intrusions to network security; successful installation of new or upgraded information technology systems; and data security breaches |
| ● | Human Capital – recruitment and retention of employees; fluctuations in employee benefit costs; and collective labor arrangements |
| ● | Our Indebtedness – credit risks; our ability to obtain adequate financing arrangements and maintain access to capital; volatility of financial markets; fluctuations in interest rates; and compliance with our debt covenants |
| ● | Ownership of Our Stock – potential significant variability of our stock price and amounts of future dividends and share repurchases |
| ● | Legal and Regulatory Matters – protection and infringement of intellectual property and impact of legal and regulatory proceedings, including with respect to environmental, health and safety, anti-corruption and trade compliance |
| ● | Other Financial Matters – fluctuations in pension costs and goodwill impairment |
For a more detailed discussion of these factors, see “Risk Factors” and “Management’s Discussion and Analysis of Financial Condition and Results of Operations” in our 2020 Form 10-K, filed with the Securities and Exchange Commission on February 25, 2021, and subsequent quarterly reports on Form 10-Q.
The forward-looking statements included in this document are made only as of the date of this document, and we undertake no obligation to update these statements to reflect subsequent events or circumstances, other than as may be required by law.
For more information and to listen to a live broadcast or an audio replay of the quarterly conference call with analysts, visit the Avery Dennison website at www.investors.averydennison.com
Contacts:
Media Relations:
Rob Six (626) 304-2361
Investor Relations:
John Eble (440) 534-6290
|
Second Quarter Financial Summary - Preliminary, unaudited |
|
|||||||||||||||||||||||||||||||||||||||||||||||
| (In millions, except % and per share amounts) |
|
|||||||||||||||||||||||||||||||||||||||||||||||
| 2Q | 2Q | % Sales Change vs. P/Y | ||||||||||||||||||||||||||||||||||||||||||||||
| 2021 | 2020 | Reported | Ex. Currency | Organic | ||||||||||||||||||||||||||||||||||||||||||||
| (a) | (b) | |||||||||||||||||||||||||||||||||||||||||||||||
| Net sales, by segment: |
||||||||||||||||||||||||||||||||||||||||||||||||
| Label and Graphic Materials |
$1,376.2 | $1,101.5 | 24.9% | 16.8% | 16.1% | |||||||||||||||||||||||||||||||||||||||||||
| Retail Branding and Information Solutions |
529.3 | 294.9 | 79.5% | 72.5% | 72.2% | |||||||||||||||||||||||||||||||||||||||||||
| Industrial and Healthcare Materials |
196.5 | 132.1 | 48.8% | 39.3% | 32.9% | |||||||||||||||||||||||||||||||||||||||||||
|
|
|
|||||||||||||||||||||||||||||||||||||||||||||||
| Total net sales |
$2,102.0 | $1,528.5 | 37.5% | 29.2% | 28.1% | |||||||||||||||||||||||||||||||||||||||||||
| As Reported (GAAP) | Adjusted Non-GAAP (c) | |||||||||||||||||||||||||||||||||||||||||||||||
| 2Q | 2Q | % | % of Sales | 2Q | 2Q | % | % of Sales | |||||||||||||||||||||||||||||||||||||||||
| 2021 | 2020 | Change | 2021 | 2020 | 2021 | 2020 | Change | 2021 | 2020 | |||||||||||||||||||||||||||||||||||||||
| Operating income (loss) / operating margins before interest, other non-operating expense (income), and taxes, by segment: |
||||||||||||||||||||||||||||||||||||||||||||||||
| Label and Graphic Materials |
$228.1 | $137.5 | 16.6% | 12.5% | $199.6 | $163.3 | 14.5% | 14.8% | ||||||||||||||||||||||||||||||||||||||||
| Retail Branding and Information Solutions |
42.1 | (10.7) | 8.0% | (3.6%) | 69.6 | 2.2 | 13.1% | 0.7% | ||||||||||||||||||||||||||||||||||||||||
| Industrial and Healthcare Materials |
22.5 | 7.5 | 11.5% | 5.7% | 23.0 | 9.0 | 11.7% | 6.8% | ||||||||||||||||||||||||||||||||||||||||
| Corporate expense |
(22.8) | (10.8) | (22.9) | (11.0) | ||||||||||||||||||||||||||||||||||||||||||||
|
|
|
|
|
|||||||||||||||||||||||||||||||||||||||||||||
| Total operating income / operating margins before interest, other non-operating expense (income), and taxes |
$269.9 | $123.5 | 119% | 12.8% | 8.1% | $269.3 | $163.5 | 65% | 12.8% | 10.7% | ||||||||||||||||||||||||||||||||||||||
| Interest expense |
$16.0 | $20.0 | $16.0 | $20.0 | ||||||||||||||||||||||||||||||||||||||||||||
| Other non-operating expense (income), net |
($1.4) | $0.2 | ($1.4) | $0.2 | ||||||||||||||||||||||||||||||||||||||||||||
| Income before taxes |
$255.3 | $103.3 | 147% | 12.1% | 6.8% | $254.7 | $143.3 | 78% | 12.1% | 9.4% | ||||||||||||||||||||||||||||||||||||||
| Provision for (benefit from) income taxes |
$70.4 | $22.2 | $65.2 | $35.4 | ||||||||||||||||||||||||||||||||||||||||||||
| Equity method investment (losses) gains |
($1.1) | ($1.4) | ($1.1) | ($1.4) | ||||||||||||||||||||||||||||||||||||||||||||
| Net income |
$183.8 | $79.7 | 131% | 8.7% | 5.2% | $188.4 | $106.5 | 77% | 9.0% | 7.0% | ||||||||||||||||||||||||||||||||||||||
| Net income per common share, assuming dilution |
$2.19 | $0.95 | 131% | $2.25 | $1.27 | 77% | ||||||||||||||||||||||||||||||||||||||||||
| 2Q Free Cash Flow (d) |
$206.0 | $144.1 | ||||||||||||||||||||||||||||||||||||||||||||||
| YTD Free Cash Flow (d) |
$388.0 | $108.8 | ||||||||||||||||||||||||||||||||||||||||||||||
See accompanying schedules A-4 to A-10 for reconciliations from GAAP to non-GAAP financial measures.
| (a) | Sales change ex. currency refers to the increase or decrease in net sales, excluding the estimated impact of foreign currency translation, and, where applicable, the calendar shift resulting from the extra week in the prior fiscal year and currency adjustment for transitional reporting of highly inflationary economies. The estimated impact of foreign currency translation is calculated on a constant currency basis, with prior period results translated at current period average exchange rates to exclude the effect of currency fluctuations. |
| (b) | Organic sales change refers to sales change ex. currency, excluding the estimated impact of product line exits, acquisitions and divestitures. |
| (c) | Excludes impact of restructuring charges and other items. Corporate expense excludes impact of severance and related costs of ($.1) and ($.2) in the second quarter of 2021 and 2020, respectively. |
| (d) | Free cash flow refers to cash flow provided by operating activities, less payments for property, plant and equipment, software and other deferred charges, plus proceeds from sales of property, plant and equipment, plus (minus) net proceeds from insurance and sales (purchases) of investments. |
A-1
AVERY DENNISON CORPORATION
PRELIMINARY CONDENSED CONSOLIDATED STATEMENTS OF INCOME
(In millions, except per share amounts)
| (UNAUDITED) | ||||||||||||||||||||
| Three Months Ended | Six Months Ended | |||||||||||||||||||
| Jul. 3, 2021 | Jun. 27, 2020 | Jul. 3, 2021 | Jun. 27, 2020 | |||||||||||||||||
| Net sales |
$ 2,102.0 | $ 1,528.5 | $ 4,153.3 | $ 3,251.5 | ||||||||||||||||
| Cost of products sold |
1,525.7 | 1,145.6 | 2,980.0 | 2,383.5 | ||||||||||||||||
| Gross profit |
576.3 | 382.9 | 1,173.3 | 868.0 | ||||||||||||||||
| Marketing, general and administrative expense |
307.0 | 219.4 | 619.3 | 500.4 | ||||||||||||||||
| Other expense (income), net(1) |
(0.6 | ) | 40.0 | 0.3 | 44.9 | |||||||||||||||
| Interest expense |
16.0 | 20.0 | 32.2 | 38.8 | ||||||||||||||||
| Other non-operating expense (income), net(2) |
(1.4 | ) | 0.2 | (2.7 | ) | (0.3 | ) | |||||||||||||
| Income before taxes |
255.3 | 103.3 | 524.2 | 284.2 | ||||||||||||||||
| Provision for (benefit from) income taxes |
70.4 | 22.2 | 128.5 | 68.5 | ||||||||||||||||
| Equity method investment (losses) gains |
(1.1 | ) | (1.4 | ) | (2.4 | ) | (1.8 | ) | ||||||||||||
| Net income |
$ 183.8 | $ 79.7 | $ 393.3 | $ 213.9 | ||||||||||||||||
| Per share amounts: |
||||||||||||||||||||
| Net income per common share, assuming dilution |
$ 2.19 | $ 0.95 | $ 4.69 | $ 2.55 | ||||||||||||||||
| Weighted average number of common shares outstanding, assuming dilution |
83.8 | 83.8 | 83.9 | 83.9 | ||||||||||||||||
| (1) | “Other expense (income), net” for the second quarter of 2021 includes outcomes of legal proceedings, net, of $2.5, partially offset by severance and related costs of $1.6, asset impairment charges of $.1, and loss on sale of asset of $.2. |
“Other expense (income), net” for the second quarter of 2020 includes severance and related costs of $37.5, asset impairment charges of $1.8, and transaction and related costs of $.7.
“Other expense (income), net” for the first half of 2021 includes severance and related costs of $4, asset impairment and lease cancellation charges of $.6, transaction and related costs of $.7, and loss on sale of assets, net, of $.2, partially offset by gain on sale of product line of $4.8 and outcomes of legal proceedings, net, of $.4.
“Other expense (income), net” for the first half of 2020 includes severance and related costs of $39.9, asset impairment charges of $1.8, and transaction and related costs of $3.2.
| (2) | “Other non-operating expense (income), net” for the first half of 2021 includes pension plan settlement loss of $.4. |
-more-
A-2
AVERY DENNISON CORPORATION
PRELIMINARY CONDENSED CONSOLIDATED BALANCE SHEETS
(In millions)
| (UNAUDITED) | ||||||||
| ASSETS | Jul. 3, 2021 | Jun. 27, 2020 | ||||||
| Current assets: |
||||||||
| Cash and cash equivalents |
$ | 344.8 | $ | 262.6 | ||||
| Trade accounts receivable, net |
1,338.9 | 1,114.6 | ||||||
| Inventories, net |
824.8 | 726.6 | ||||||
| Other current assets |
233.1 | 220.8 | ||||||
| Total current assets |
2,741.6 | 2,324.6 | ||||||
| Property, plant and equipment, net |
1,344.8 | 1,228.8 | ||||||
| Goodwill and other intangibles resulting from business acquisitions, net |
1,361.7 | 1,235.3 | ||||||
| Deferred tax assets |
188.5 | 211.1 | ||||||
| Other assets |
785.9 | 651.9 | ||||||
| $ | 6,422.5 | $ | 5,651.7 | |||||
| LIABILITIES AND SHAREHOLDERS’ EQUITY |
||||||||
| Current liabilities: |
||||||||
| Short-term borrowings and current portion of long-term debt and finance leases |
$ | 33.6 | $ | 268.6 | ||||
| Accounts payable |
1,226.5 | 956.5 | ||||||
| Other current liabilities |
822.4 | 684.4 | ||||||
| Total current liabilities |
2,082.5 | 1,909.5 | ||||||
| Long-term debt and finance leases |
2,020.2 | 1,997.6 | ||||||
| Other long-term liabilities |
616.2 | 530.7 | ||||||
| Shareholders’ equity: |
||||||||
| Common stock |
124.1 | 124.1 | ||||||
| Capital in excess of par value |
846.5 | 840.0 | ||||||
| Retained earnings |
3,637.3 | 3,100.2 | ||||||
| Treasury stock at cost |
(2,576.7 | ) | (2,447.2 | ) | ||||
| Accumulated other comprehensive loss |
(327.6 | ) | (403.2 | ) | ||||
| Total shareholders’ equity |
1,703.6 | 1,213.9 | ||||||
| $ | 6,422.5 | $ | 5,651.7 | |||||
-more-
A-3
AVERY DENNISON CORPORATION
PRELIMINARY CONDENSED CONSOLIDATED STATEMENTS OF CASH FLOWS
(In millions)
| (UNAUDITED) | ||||||||||||
| Six Months Ended | ||||||||||||
| Jul. 3, 2021 | Jun. 27, 2020 | |||||||||||
| Operating Activities: |
|
|||||||||||
| Net income |
$ | 393.3 | $ | 213.9 | ||||||||
| Adjustments to reconcile net income to net cash provided by operating activities: |
||||||||||||
| Depreciation |
80.8 | 74.6 | ||||||||||
| Amortization |
28.8 | 23.2 | ||||||||||
| Provision for credit losses and sales returns |
17.5 | 38.8 | ||||||||||
| Stock-based compensation |
18.5 | 1.4 | ||||||||||
| Pension plan settlement loss |
0.4 | --- | ||||||||||
| Deferred taxes and other non-cash taxes |
10.6 | 16.4 | ||||||||||
| Other non-cash expense and loss (income and gain), net |
13.8 | 16.7 | ||||||||||
| Changes in assets and liabilities and other adjustments |
(86.9 | ) | (201.0 | ) | ||||||||
| Net cash provided by operating activities |
476.8 | 184.0 | ||||||||||
| Investing Activities: |
||||||||||||
| Purchases of property, plant and equipment |
(83.8 | ) | (63.9 | ) | ||||||||
| Purchases of software and other deferred charges |
(6.4 | ) | (11.0 | ) | ||||||||
| Proceeds from sales of property, plant and equipment |
1.0 | 0.1 | ||||||||||
| Proceeds from insurance and sales (purchases) of investments, net |
0.4 | (0.4 | ) | |||||||||
| Proceeds from sale of product line |
6.7 | --- | ||||||||||
| Payments for acquisitions, net of cash acquired, and investments in businesses |
(33.8 | ) | (252.8 | ) | ||||||||
| Net cash used in investing activities |
(115.9 | ) | (328.0 | ) | ||||||||
| Financing Activities: |
||||||||||||
| Net increase (decrease) in borrowings with maturities of three months or less |
(36.2 | ) | 92.5 | |||||||||
| Additional borrowings under revolving credit facility |
--- | 500.0 | ||||||||||
| Repayments of revolving credit facility |
--- | (500.0 | ) | |||||||||
| Additional long-term borrowings |
--- | 493.7 | ||||||||||
| Repayments of long-term debt and finance leases |
(3.1 | ) | (267.6 | ) | ||||||||
| Dividends paid |
(108.0 | ) | (96.8 | ) | ||||||||
| Share repurchases |
(95.0 | ) | (45.2 | ) | ||||||||
| Net (tax withholding) proceeds related to stock-based compensation |
(25.3 | ) | (20.5 | ) | ||||||||
| Net cash (used in) provided by financing activities |
(267.6 | ) | 156.1 | |||||||||
| Effect of foreign currency translation on cash balances |
(0.8 | ) | (3.2 | ) | ||||||||
| Increase (decrease) in cash and cash equivalents |
92.5 | 8.9 | ||||||||||
| Cash and cash equivalents, beginning of year |
252.3 | 253.7 | ||||||||||
| Cash and cash equivalents, end of period |
$ | 344.8 | $ | 262.6 | ||||||||
-more-
A-4
Reconciliation of Non-GAAP Financial Measures to GAAP
We report our financial results in conformity with accounting principles generally accepted in the United States of America, or GAAP, and also communicate with investors using certain non-GAAP financial measures. These non-GAAP financial measures are not in accordance with, nor are they a substitute for or superior to, the comparable GAAP financial measures. These non-GAAP financial measures are intended to supplement the presentation of our financial results that are prepared in accordance with GAAP. Based upon feedback from investors and financial analysts, we believe that the supplemental non-GAAP financial measures we provide are useful to their assessments of our performance and operating trends, as well as liquidity.
Our non-GAAP financial measures exclude the impact of certain events, activities or strategic decisions. The accounting effects of these events, activities or decisions, which are included in the GAAP financial measures, may make it difficult to assess our underlying performance in a single period. By excluding the accounting effects, positive or negative, of certain items (e.g., restructuring charges, outcomes of certain legal proceedings, certain effects of strategic transactions and related costs, losses from debt extinguishments, gains or losses from curtailment or settlement of pension obligations, gains or losses on sales of certain assets, gains or losses on investments, and other items), we believe that we are providing meaningful supplemental information that facilitates an understanding of our core operating results and liquidity measures. While some of the items we exclude from GAAP financial measures recur, they tend to be disparate in amount, frequency, or timing.
We use these non-GAAP financial measures internally to evaluate trends in our underlying performance, as well as to facilitate comparison to the results of competitors for a single period and full year, as applicable.
We use the non-GAAP financial measures described below in the accompanying news release and presentation.
Sales change ex. currency refers to the increase or decrease in net sales, excluding the estimated impact of foreign currency translation, and, where applicable, the calendar shift resulting from the extra week in the prior fiscal year and currency adjustment for transitional reporting of highly inflationary economies. The estimated impact of foreign currency translation is calculated on a constant currency basis, with prior period results translated at current period average exchange rates to exclude the effect of currency fluctuations.
Organic sales change refers to sales change ex. currency, excluding the estimated impact of product line exits, acquisitions and divestitures.
We believe that sales change ex. currency and organic sales change assist investors in evaluating the sales change from the ongoing activities of our businesses and enhance their ability to evaluate our results from period to period.
Adjusted operating income refers to income before taxes; interest expense; other non-operating expense (income), net; and other expense (income), net.
Adjusted EBITDA refers to adjusted operating income before depreciation and amortization.
Adjusted operating margin refers to adjusted operating income as a percentage of net sales.
Adjusted EBITDA margin refers to adjusted EBITDA as a percentage of net sales.
Adjusted tax rate refers to the projected full-year GAAP tax rate, adjusted to exclude certain unusual or infrequent events that are expected to significantly impact that rate, such as effects of certain discrete tax planning actions, impacts related to the enactment of the U.S. Tax Cuts and Jobs Act (“TCJA”), where applicable, and other items.
Adjusted net income refers to income before taxes, tax-effected at the adjusted tax rate, and adjusted for tax-effected restructuring charges and other items.
Adjusted net income per common share, assuming dilution (adjusted EPS) refers to adjusted net income divided by weighted average number of common shares outstanding, assuming dilution.
We believe that adjusted operating margin, adjusted EBITDA margin, adjusted net income, and adjusted EPS assist investors in understanding our core operating trends and comparing our results with those of our competitors.
Net debt to adjusted EBITDA ratio refers to total debt (including finance leases) less cash and cash equivalents, divided by adjusted EBITDA for the last twelve months. We believe that the net debt to adjusted EBITDA ratio assists investors in assessing our leverage position.
Free cash flow refers to cash flow provided by operating activities, less payments for property, plant and equipment, software and other deferred charges, plus proceeds from sales of property, plant and equipment, plus (minus) net proceeds from insurance and sales (purchases) of investments. We believe that free cash flow assists investors by showing the amount of cash we have available for debt reductions, dividends, share repurchases, and acquisitions.
Reconciliations are provided in accordance with Regulations G and S-K and reconcile our non-GAAP financial measures with the most directly comparable GAAP financial measures.
-more-
A-5
AVERY DENNISON CORPORATION
PRELIMINARY RECONCILIATION FROM GAAP TO NON-GAAP FINANCIAL MEASURES
(In millions, except % and per share amounts)
| (UNAUDITED) | ||||||||||||||||
| Three Months Ended | Six Months Ended | |||||||||||||||
| Jul. 3, 2021 | Jun. 27, 2020 | Jul. 3, 2021 | Jun. 27, 2020 | |||||||||||||
| Reconciliation from GAAP to Non-GAAP operating margins: |
||||||||||||||||
| Net sales |
$ | 2,102.0 | $ | 1,528.5 | $ | 4,153.3 | $ | 3,251.5 | ||||||||
| Income before taxes |
$ | 255.3 | $ | 103.3 | $ | 524.2 | $ | 284.2 | ||||||||
| Income before taxes as a percentage of net sales |
12.1% | 6.8% | 12.6% | 8.7% | ||||||||||||
| Adjustments: |
||||||||||||||||
| Interest expense |
$ | 16.0 | $ | 20.0 | $ | 32.2 | $ | 38.8 | ||||||||
| Other non-operating expense (income), net |
(1.4 | ) | 0.2 | (2.7 | ) | (0.3 | ) | |||||||||
| Operating income before interest expense, other non-operating expense (income), and taxes |
$ | 269.9 | $ | 123.5 | $ | 553.7 | $ | 322.7 | ||||||||
| Operating margins |
12.8% | 8.1% | 13.3% | 9.9% | ||||||||||||
| Income before taxes |
$ | 255.3 | $ | 103.3 | $ | 524.2 | $ | 284.2 | ||||||||
| Adjustments: |
||||||||||||||||
| Restructuring charges: |
||||||||||||||||
| Severance and related costs |
1.6 | 37.5 | 4.0 | 39.9 | ||||||||||||
| Asset impairment and lease cancellation charges |
0.1 | 1.8 | 0.6 | 1.8 | ||||||||||||
| Loss on sale of assets, net |
0.2 | --- | 0.2 | --- | ||||||||||||
| Transaction and related costs |
--- | 0.7 | 0.7 | 3.2 | ||||||||||||
| Gain on sale of product line |
--- | --- | (4.8 | ) | --- | |||||||||||
| Outcomes of legal proceedings, net(1) |
(2.5 | ) | --- | (0.4 | ) | --- | ||||||||||
| Interest expense |
16.0 | 20.0 | 32.2 | 38.8 | ||||||||||||
| Other non-operating expense (income), net |
(1.4 | ) | 0.2 | (2.7 | ) | (0.3 | ) | |||||||||
| Adjusted operating income (non-GAAP) |
$ | 269.3 | $ | 163.5 | $ | 554.0 | $ | 367.6 | ||||||||
| Adjusted operating margins (non-GAAP) |
12.8% | 10.7% | 13.3% | 11.3% | ||||||||||||
| Reconciliation from GAAP to Non-GAAP net income: |
||||||||||||||||
| As reported net income |
$ | 183.8 | $ | 79.7 | $ | 393.3 | $ | 213.9 | ||||||||
| Adjustments: |
||||||||||||||||
| Restructuring charges and other items(2) |
(0.6 | ) | 40.0 | 0.3 | 44.9 | |||||||||||
| Pension plan settlement loss |
--- | --- | 0.4 | --- | ||||||||||||
| Tax effect on restructuring charges and other items and impact of adjusted tax rate |
5.2 | (13.2 | ) | (4.3 | ) | (12.8 | ) | |||||||||
| Adjusted net income (non-GAAP) |
$ | 188.4 | $ | 106.5 | $ | 389.7 | $ | 246.0 | ||||||||
| (1) | Second quarter of 2021 includes Brazil indirect tax credit based on the Brazilian Federal Supreme Court ruling of $29.1, partially offset by contingent liability related to patent infringement jury verdict of $26.6. The first half of 2021 includes Brazil indirect tax credit based on the Brazilian Federal Supreme Court ruling of $29.1, partially offset by contingent liability related to patent infringement jury verdict of $26.6 and legal settlement of $2.1. |
| (2) | Includes pretax restructuring and related charges, loss on sale of assets, transaction and related costs, outcomes of legal proceedings, and gain on sale of product line. |
-more-
A-5
(continued)
AVERY DENNISON CORPORATION
PRELIMINARY RECONCILIATION FROM GAAP TO NON-GAAP FINANCIAL MEASURES
(In millions, except % and per share amounts)
| (UNAUDITED) | ||||||||||||||||
| Three Months Ended | Six Months Ended | |||||||||||||||
| Jul. 3, 2021 | Jun. 27, 2020 | Jul. 3, 2021 | Jun. 27, 2020 | |||||||||||||
| Reconciliation from GAAP to Non-GAAP net income per common share: |
||||||||||||||||
| As reported net income per common share, assuming dilution |
$ 2.19 | $ 0.95 | $ 4.69 | $ 2.55 | ||||||||||||
| Adjustments per common share, net of tax: |
||||||||||||||||
| Restructuring charges and other items(1) |
(0.01 | ) | 0.48 | --- | 0.53 | |||||||||||
| Tax effect on restructuring charges and other items and impact of adjusted tax rate |
0.07 | (0.16 | ) | (0.05 | ) | (0.15 | ) | |||||||||
| Adjusted net income per common share, assuming dilution (non-GAAP) |
$ 2.25 | $ 1.27 | $ 4.64 | $ 2.93 | ||||||||||||
| Weighted average number of common shares outstanding, assuming dilution |
83.8 | 83.8 | 83.9 | 83.9 | ||||||||||||
Our adjusted tax rate was 25.6% and 25.3% for the three and six months ended July 3, 2021, respectively, and 24.7% for the three and six months ended June 27, 2020.
| (1) | Includes pretax restructuring and related charges, loss on sale of assets, transaction and related costs, outcomes of legal proceedings, and gain on sale of product line. |
| (UNAUDITED) | ||||||||||||||||
| Three Months Ended | Six Months Ended | |||||||||||||||
| Jul. 3, 2021 | Jun. 27, 2020 | Jul. 3, 2021 | Jun. 27, 2020 | |||||||||||||
| Reconciliation of free cash flow: |
|
|||||||||||||||
| Net cash provided by operating activities |
$ 267.5 | $ 179.6 | $ 476.8 | $ 184.0 | ||||||||||||
| Purchases of property, plant and equipment |
(58.6 | ) | (30.7 | ) | (83.8 | ) | (63.9 | ) | ||||||||
| Purchases of software and other deferred charges |
(4.1 | ) | (4.8 | ) | (6.4 | ) | (11.0 | ) | ||||||||
| Proceeds from sales of property, plant and equipment |
0.3 | 0.1 | 1.0 | 0.1 | ||||||||||||
| Proceeds from insurance and sales (purchases) of investments, net |
0.9 | (0.1 | ) | 0.4 | (0.4 | ) | ||||||||||
| Free cash flow (non-GAAP) |
$ 206.0 | $ 144.1 | $ 388.0 | $ 108.8 | ||||||||||||
-more-
A-6
AVERY DENNISON CORPORATION
PRELIMINARY SUPPLEMENTARY INFORMATION
(In millions, except %)
(UNAUDITED)
| Second Quarter Ended | ||||||||||||||||||||||||||||||||
| NET SALES | OPERATING INCOME (LOSS) | OPERATING MARGINS | ||||||||||||||||||||||||||||||
| 2021 | 2020 | 2021 | 2020 | 2021 | 2020 | |||||||||||||||||||||||||||
| Label and Graphic Materials |
$ | 1,376.2 | $ | 1,101.5 | $ | 228.1 | $ | 137.5 | 16.6% | 12.5% | ||||||||||||||||||||||
| Retail Branding and Information Solutions |
529.3 | 294.9 | 42.1 | (10.7 | ) | 8.0% | (3.6% | ) | ||||||||||||||||||||||||
| Industrial and Healthcare Materials |
196.5 | 132.1 | 22.5 | 7.5 | 11.5% | 5.7% | ||||||||||||||||||||||||||
| Corporate Expense |
N/A | N/A | (22.8 | ) | (10.8 | ) | N/A | N/A | ||||||||||||||||||||||||
| TOTAL FROM OPERATIONS |
$ | 2,102.0 | $ | 1,528.5 | $ | 269.9 | $ | 123.5 | 12.8% | 8.1% | ||||||||||||||||||||||
RECONCILIATION FROM GAAP TO NON-GAAP SUPPLEMENTARY INFORMATION
| Second Quarter Ended | ||||||||||||||||||||
| OPERATING INCOME (LOSS) | OPERATING MARGINS | |||||||||||||||||||
| 2021 | 2020 | 2021 | 2020 | |||||||||||||||||
| Label and Graphic Materials |
||||||||||||||||||||
| Operating income and margins, as reported |
$ | 228.1 | $ | 137.5 | 16.6% | 12.5% | ||||||||||||||
| Adjustments: |
||||||||||||||||||||
| Restructuring charges: |
||||||||||||||||||||
| Severance and related costs |
(0.1 | ) | 24.9 | --- | 2.2% | |||||||||||||||
| Asset impairment charges |
--- | 0.9 | --- | 0.1% | ||||||||||||||||
| Outcome of legal proceeding(1) |
(28.4 | ) | --- | (2.1% | ) | --- | ||||||||||||||
| Adjusted operating income and margins (non-GAAP) |
$ | 199.6 | $ | 163.3 | 14.5% | 14.8% | ||||||||||||||
| Depreciation and amortization |
28.7 | 26.3 | 2.1% | 2.4% | ||||||||||||||||
| Adjusted EBITDA and margins (non-GAAP) |
$ | 228.3 | $ | 189.6 | 16.6% | 17.2% | ||||||||||||||
| Retail Branding and Information Solutions |
||||||||||||||||||||
| Operating income (loss) and margins, as reported |
$ | 42.1 | $ | (10.7 | ) | 8.0% | (3.6% | ) | ||||||||||||
| Adjustments: |
||||||||||||||||||||
| Restructuring charges: |
||||||||||||||||||||
| Severance and related costs |
1.3 | 11.3 | 0.2% | 3.8% | ||||||||||||||||
| Asset impairment charges |
0.1 | 0.9 | --- | 0.3% | ||||||||||||||||
| Loss on sale of asset |
0.2 | --- | --- | --- | ||||||||||||||||
| Transaction and related costs |
--- | 0.7 | --- | 0.2% | ||||||||||||||||
| Outcomes of legal proceedings, net(2) |
25.9 | --- | 4.9% | --- | ||||||||||||||||
| Adjusted operating income and margins (non-GAAP) |
$ | 69.6 | $ | 2.2 | 13.1% | 0.7% | ||||||||||||||
| Depreciation and amortization |
19.4 | 17.7 | 3.7% | 6.0% | ||||||||||||||||
| Adjusted EBITDA and margins (non-GAAP) |
$ | 89.0 | $ | 19.9 | 16.8% | 6.7% | ||||||||||||||
| Industrial and Healthcare Materials |
||||||||||||||||||||
| Operating income and margins, as reported |
$ | 22.5 | $ | 7.5 | 11.5% | 5.7% | ||||||||||||||
| Adjustments: |
||||||||||||||||||||
| Restructuring charges: |
||||||||||||||||||||
| Severance and related costs |
0.5 | 1.5 | 0.2% | 1.1% | ||||||||||||||||
| Adjusted operating income and margins (non-GAAP) |
$ | 23.0 | $ | 9.0 | 11.7% | 6.8% | ||||||||||||||
| Depreciation and amortization |
7.1 | 6.3 | 3.6% | 4.8% | ||||||||||||||||
| Adjusted EBITDA and margins (non-GAAP) |
$ | 30.1 | $ | 15.3 | 15.3% | 11.6% | ||||||||||||||
| (1) | Second quarter of 2021 includes Brazil indirect tax credit based on the Brazilian Federal Supreme Court ruling. |
| (2) | Second quarter of 2021 includes contingent liability related to patent infringement jury verdict of $26.6, partially offset by Brazil indirect tax credit based on the Brazilian Federal Supreme Court ruling of $.7. |
-more-
A-7
AVERY DENNISON CORPORATION
PRELIMINARY SUPPLEMENTARY INFORMATION
(In millions, except %)
(UNAUDITED)
| Six Months Ended | ||||||||||||||||||||||||
| NET SALES | OPERATING INCOME (LOSS) | OPERATING MARGINS | ||||||||||||||||||||||
| 2021 | 2020 | 2021 | 2020 | 2021 | 2020 | |||||||||||||||||||
|
|
|
|
|
|
|
|||||||||||||||||||
| Label and Graphic Materials |
$ | 2,753.2 | $ | 2,275.0 | $ | 454.3 | $ | 310.0 | 16.5% | 13.6% | ||||||||||||||
| Retail Branding and Information Solutions |
1,012.0 | 696.8 | 102.1 | 20.2 | 10.1% | 2.9% | ||||||||||||||||||
| Industrial and Healthcare Materials |
388.1 | 279.7 | 46.0 | 22.4 | 11.9% | 8.0% | ||||||||||||||||||
| Corporate Expense |
N/A | N/A | (48.7 | ) | (29.9 | ) | N/A | N/A | ||||||||||||||||
|
|
|
|
|
|
|
|||||||||||||||||||
| TOTAL FROM OPERATIONS |
$ | 4,153.3 | $ | 3,251.5 | $ | 553.7 | $ | 322.7 | 13.3% | 9.9% | ||||||||||||||
|
|
|
|
|
|
|
|||||||||||||||||||
RECONCILIATION FROM GAAP TO NON-GAAP SUPPLEMENTARY INFORMATION
| Six Months Ended | ||||||||||||||||
| OPERATING INCOME | OPERATING MARGINS | |||||||||||||||
| 2021 | 2020 | 2021 | 2020 | |||||||||||||
|
|
|
|
|
|||||||||||||
| Label and Graphic Materials |
||||||||||||||||
| Operating income and margins, as reported |
$ | 454.3 | $ | 310.0 | 16.5% | 13.6% | ||||||||||
| Adjustments: |
||||||||||||||||
| Restructuring charges: |
||||||||||||||||
| Severance and related costs |
0.5 | 25.3 | --- | 1.1% | ||||||||||||
| Asset impairment charges |
0.1 | 0.9 | --- | 0.1% | ||||||||||||
| Transaction and related costs |
0.1 | 0.7 | --- | --- | ||||||||||||
| Outcomes of legal proceedings, net(1) |
(26.3 | ) | --- | (0.9% | ) | --- | ||||||||||
| Gain on sale of product line |
(4.8 | ) | --- | (0.2% | ) | --- | ||||||||||
|
|
|
|
|
|||||||||||||
| Adjusted operating income and margins (non-GAAP) |
$ | 423.9 | $ | 336.9 | 15.4% | 14.8% | ||||||||||
| Depreciation and amortization |
57.7 | 52.4 | 2.1% | 2.3% | ||||||||||||
|
|
|
|
|
|||||||||||||
| Adjusted EBITDA and margins (non-GAAP) |
$ | 481.6 | $ | 389.3 | 17.5% | 17.1% | ||||||||||
|
|
|
|
|
|||||||||||||
| Retail Branding and Information Solutions |
||||||||||||||||
| Operating income and margins, as reported |
$ | 102.1 | $ | 20.2 | 10.1% | 2.9% | ||||||||||
| Adjustments: |
||||||||||||||||
| Restructuring charges: |
||||||||||||||||
| Severance and related costs |
2.5 | 12.8 | 0.2% | 1.8% | ||||||||||||
| Asset impairment and lease cancellation charges |
0.5 | 0.9 | 0.1% | 0.1% | ||||||||||||
| Transaction and related costs |
0.2 | 2.5 | --- | 0.4% | ||||||||||||
| Loss on sale of asset |
0.5 | --- | --- | --- | ||||||||||||
| Outcomes of legal proceedings, net(2) |
25.9 | --- | 2.6% | --- | ||||||||||||
|
|
|
|
|
|||||||||||||
| Adjusted operating income and margins (non-GAAP) |
$ | 131.7 | $ | 36.4 | 13.0% | 5.2% | ||||||||||
| Depreciation and amortization |
38.0 | 32.6 | 3.8% | 4.7% | ||||||||||||
|
|
|
|
|
|||||||||||||
| Adjusted EBITDA and margins (non-GAAP) |
$ | 169.7 | $ | 69.0 | 16.8% | 9.9% | ||||||||||
|
|
|
|
|
|||||||||||||
| Industrial and Healthcare Materials |
||||||||||||||||
| Operating income and margins, as reported |
$ | 46.0 | $ | 22.4 | 11.9% | 8.0% | ||||||||||
| Adjustments: |
||||||||||||||||
| Restructuring charges: |
||||||||||||||||
| Severance and related costs |
0.5 | 2.0 | 0.1% | 0.7% | ||||||||||||
| Transaction and related costs |
0.4 | --- | 0.1% | --- | ||||||||||||
| Gain on sale of assets |
(0.3 | ) | --- | (0.1% | ) | --- | ||||||||||
|
|
|
|
|
|||||||||||||
| Adjusted operating income and margins (non-GAAP) |
$ | 46.6 | $ | 24.4 | 12.0% | 8.7% | ||||||||||
| Depreciation and amortization |
13.9 | 12.8 | 3.6% | 4.6% | ||||||||||||
|
|
|
|
|
|||||||||||||
| Adjusted EBITDA and margins (non-GAAP) |
$ | 60.5 | $ | 37.2 | 15.6% | 13.3% | ||||||||||
|
|
|
|
|
|||||||||||||
| (1) | The first half of 2021 includes Brazil indirect tax credit based on the Brazilian Federal Supreme Court ruling of $28.4, partially offset by legal settlement of $2.1. |
| (2) | The first half of 2021 includes contingent liability related to patent infringement jury verdict of $26.6, partially offset by Brazil indirect tax credit based on the Brazilian Federal Supreme Court ruling of $.7. |
-more-
A-8
AVERY DENNISON CORPORATION
PRELIMINARY SUPPLEMENTARY INFORMATION
Reconciliation of Adjusted EBITDA Margins
(In millions, except %)
(UNAUDITED)
| (13 weeks) | (13 weeks) | (13 weeks) | ||||||||||
| Label and Graphic Materials | 2Q21 | 2Q20 | 2Q19 | |||||||||
| Net sales |
$ | 1,376.2 | $ | 1,101.5 | $ | 1,206.3 | ||||||
| Operating income before interest expense, other non-operating expense (income) and taxes, as reported |
$ | 228.1 | $ | 137.5 | $ | 162.1 | ||||||
| Operating margins, as reported |
16.6% | 12.5% | 13.4% | |||||||||
| Non-GAAP adjustments: |
||||||||||||
| Restructuring charges: |
||||||||||||
| Severance and related costs |
$ | (0.1 | ) | $ | 24.9 | $ | 3.4 | |||||
| Asset impairment charges |
- | 0.9 | 1.0 | |||||||||
| Other items |
(28.4 | ) | - | - | ||||||||
| Adjusted operating income (non-GAAP) |
$ | 199.6 | $ | 163.3 | $ | 166.5 | ||||||
| Adjusted operating margins (non-GAAP) |
14.5% | 14.8% | 13.8% | |||||||||
| Depreciation and amortization |
$ | 28.7 | $ | 26.3 | $ | 25.0 | ||||||
| Adjusted EBITDA (non-GAAP) |
$ | 228.3 | $ | 189.6 | $ | 191.5 | ||||||
| Adjusted EBITDA margins (non-GAAP) |
16.6% | 17.2% | 15.9% | |||||||||
| Retail Branding and Information Solutions | 2Q21 | 2Q20 | 2Q19 | |||||||||
| Net sales |
$ | 529.3 | $ | 294.9 | $ | 418.3 | ||||||
| Operating income (loss) before interest expense, other non-operating expense (income) and taxes, as reported |
$ | 42.1 | $ | (10.7 | ) | $ | 50.4 | |||||
| Operating margins, as reported |
8.0% | (3.6% | ) | 12.0% | ||||||||
| Non-GAAP adjustments: |
||||||||||||
| Restructuring charges: |
||||||||||||
| Severance and related costs |
$ | 1.3 | $ | 11.3 | $ | 1.3 | ||||||
| Asset impairment charges |
0.1 | 0.9 | 0.4 | |||||||||
| Other items |
26.1 | 0.7 | - | |||||||||
| Adjusted operating income (non-GAAP) |
$ | 69.6 | $ | 2.2 | $ | 52.1 | ||||||
| Adjusted operating margins (non-GAAP) |
13.1% | 0.7% | 12.5% | |||||||||
| Depreciation and amortization |
$ | 19.4 | $ | 17.7 | $ | 13.2 | ||||||
| Adjusted EBITDA (non-GAAP) |
$ | 89.0 | $ | 19.9 | $ | 65.3 | ||||||
| Adjusted EBITDA margins (non-GAAP) |
16.8% | 6.7% | 15.6% | |||||||||
| Industrial and Healthcare Materials | 2Q21 | 2Q20 | 2Q19 | |||||||||
| Net sales |
$ | 196.5 | $ | 132.1 | $ | 171.1 | ||||||
| Operating income before interest expense, other non-operating expense (income) and taxes, as reported |
$ | 22.5 | $ | 7.5 | $ | 16.5 | ||||||
| Operating margins, as reported |
11.5% | 5.7% | 9.6% | |||||||||
| Non-GAAP adjustments: |
||||||||||||
| Restructuring charges: |
||||||||||||
| Severance and related costs |
$ | 0.5 | $ | 1.5 | $ | 1.4 | ||||||
| Adjusted operating income (non-GAAP) |
$ | 23.0 | $ | 9.0 | $ | 17.9 | ||||||
| Adjusted operating margins (non-GAAP) |
11.7% | 6.8% | 10.5% | |||||||||
| Depreciation and amortization |
$ | 7.1 | $ | 6.3 | $ | 6.7 | ||||||
| Adjusted EBITDA (non-GAAP) |
$ | 30.1 | $ | 15.3 | $ | 24.6 | ||||||
| Adjusted EBITDA margins (non-GAAP) |
15.3% | 11.6% | 14.4% | |||||||||
| Corporate expense | 2Q21 | 2Q20 | 2Q19 | |||||||||
| Corporate expense, as reported |
$ | (22.8 | ) | $ | (10.8 | ) | $ | (19.9 | ) | |||
| Non-GAAP adjustments: |
||||||||||||
| Restructuring charges: |
||||||||||||
| Severance and related costs |
(0.1 | ) | (0.2 | ) | - | |||||||
| Corporate expense (non-GAAP) |
$ | (22.9 | ) | $ | (11.0 | ) | $ | (19.9 | ) | |||
| Total Company | 2Q21 | 2Q20 | 2Q19 | |||||||||
| Net sales |
$ | 2,102.0 | $ | 1,528.5 | $ | 1,795.7 | ||||||
| Operating income before interest expense, other non-operating expense (income) and taxes, as reported |
$ | 269.9 | $ | 123.5 | $ | 209.1 | ||||||
| Operating margins, as reported |
12.8% | 8.1% | 11.6% | |||||||||
| Non-GAAP adjustments: |
||||||||||||
| Restructuring charges: |
||||||||||||
| Severance and related costs |
$ | 1.6 | $ | 37.5 | $ | 6.1 | ||||||
| Asset impairment and lease cancellation charges |
0.1 | 1.8 | 1.4 | |||||||||
| Other items |
(2.3 | ) | 0.7 | - | ||||||||
| Adjusted operating income (non-GAAP) |
$ | 269.3 | $ | 163.5 | $ | 216.6 | ||||||
| Adjusted operating margins (non-GAAP) |
12.8% | 10.7% | 12.1% | |||||||||
| Depreciation and amortization |
$ | 55.2 | $ | 50.3 | $ | 44.9 | ||||||
| Adjusted EBITDA (non-GAAP) |
$ | 324.5 | $ | 213.8 | $ | 261.5 | ||||||
| Adjusted EBITDA margins (non-GAAP) |
15.4% | 14.0% | 14.6% | |||||||||
-more-
A-9
AVERY DENNISON CORPORATION
PRELIMINARY SUPPLEMENTARY INFORMATION
Reconciliation of Adjusted EBITDA Margins and Net Debt to Adjusted EBITDA
(In millions, except %)
(UNAUDITED)
| (13 weeks) | (14 weeks) | (13 weeks) | (13 weeks) | |||||||||||||
| QTD | ||||||||||||||||
| Total Company | 3Q20 | 4Q20 | 1Q21 | 2Q21 | ||||||||||||
| Net sales |
$ | 1,729.1 | $ | 1,990.9 | $ | 2,051.3 | $ | 2,102.0 | ||||||||
| Operating income before interest expense, other non-operating expense (income) and taxes, as reported |
$ | 213.5 | $ | 273.0 | $ | 283.8 | $ | 269.9 | ||||||||
| Operating margins, as reported |
12.3% | 13.7% | 13.8% | 12.8% | ||||||||||||
| Non-GAAP adjustments: |
||||||||||||||||
| Restructuring charges: |
||||||||||||||||
| Severance and related costs |
$ | 6.5 | $ | 2.7 | $ | 2.4 | $ | 1.6 | ||||||||
| Asset impairment and lease cancellation charges |
4.4 | - | 0.5 | 0.1 | ||||||||||||
| Other items |
1.5 | (6.4 | ) | (2.0 | ) | (2.3 | ) | |||||||||
| Adjusted operating income (non-GAAP) |
$ | 225.9 | $ | 269.3 | $ | 284.7 | $ | 269.3 | ||||||||
| Adjusted operating margins (non-GAAP) |
13.1% | 13.5% | 13.9% | 12.8% | ||||||||||||
| Depreciation and amortization |
$ | 52.0 | $ | 55.5 | $ | 54.4 | $ | 55.2 | ||||||||
| Adjusted EBITDA (non-GAAP) |
$ | 277.9 | $ | 324.8 | $ | 339.1 | $ | 324.5 | ||||||||
| Adjusted EBITDA margins (non-GAAP) |
16.1% | 16.3% | 16.5% | 15.4% | ||||||||||||
|
|
||||||||||||||||
| Total Debt |
$ | 2,053.8 | ||||||||||||||
| Less: Cash and cash equivalents |
344.8 | |||||||||||||||
| Net Debt |
$ | 1,709.0 | ||||||||||||||
| Net Debt to Adjusted EBITDA LTM* |
1.3 | |||||||||||||||
*LTM = Last twelve months (3Q20 to 2Q21)
-more-
A-10
AVERY DENNISON CORPORATION
PRELIMINARY SUPPLEMENTARY INFORMATION
(UNAUDITED)
| Second Quarter 2021 (vs. 2020) | ||||||||||||||||
| Total Company |
Label and Graphic |
Retail Branding and |
Industrial and Healthcare Materials |
|||||||||||||
| Reconciliation from GAAP to Non-GAAP sales change |
||||||||||||||||
| Reported net sales change |
37.5% | 24.9% | 79.5% | 48.8% | ||||||||||||
| Foreign currency translation |
(8.3%) | (8.2%) | (6.9%) | (9.4%) | ||||||||||||
| Extra week impact |
--- | --- | --- | --- | ||||||||||||
| Sales change ex. currency (non-GAAP)(1) |
29.2% | 16.8% | 72.5% | 39.3% | ||||||||||||
| Acquisitions and product line exit |
(1.1%) | (0.7%) | (0.3%) | (6.4%) | ||||||||||||
| Organic sales change (non-GAAP)(1) |
28.1% | 16.1% | 72.2% | 32.9% | ||||||||||||
| Second Quarter 2021 (vs. 2019)(2) | ||||||||||||||||
| Total Company |
Label and Graphic |
Retail Branding and Information Solutions |
Industrial and Healthcare Materials |
|||||||||||||
| Reconciliation from GAAP to Non-GAAP sales change |
||||||||||||||||
| Reported net sales change |
17.1% | 14.1% | 26.5% | 14.8% | ||||||||||||
| Foreign currency translation |
(2.8%) | (3.1%) | (1.3%) | (4.1%) | ||||||||||||
| Extra week impact |
--- | --- | --- | --- | ||||||||||||
| Sales change ex. currency (non-GAAP)(1) |
14.3% | 11.0% | 25.2% | 10.7% | ||||||||||||
| Acquisitions and product line exit |
(3.3%) | (0.3%) | (11.1%) | (5.1%) | ||||||||||||
| Organic sales change (non-GAAP)(1) |
11.0% | 10.7% | 14.1% | 5.6% | ||||||||||||
| Six Months Ended 2021 (vs. 2020) | ||||||||||||||||
| Total Company |
Label and Graphic |
Retail Branding and |
Industrial and Healthcare Materials |
|||||||||||||
| Reconciliation from GAAP to Non-GAAP sales change |
||||||||||||||||
| Reported net sales change |
27.7% | 21.0% | 45.2% | 38.8% | ||||||||||||
| Foreign currency translation |
(6.1%) | (6.5%) | (3.7%) | (7.8%) | ||||||||||||
| Extra week impact |
(2.2%) | (2.1%) | (2.4%) | (2.5%) | ||||||||||||
| Sales change ex. currency (non-GAAP)(1) |
19.4% | 12.4% | 39.2% | 28.4% | ||||||||||||
| Acquisitions and product line exit |
(1.6%) | (0.8%) | (3.4%) | (4.4%) | ||||||||||||
| Organic sales change (non-GAAP)(1) |
17.8% | 11.7% | 35.8% | 24.1% | ||||||||||||
(1) Totals may not sum due to rounding.
(2) Second quarter 2021 vs. 2019 results are presented to facilitate comparison with pre-pandemic performance.
Exhibit 99.2 Second Quarter 2021 Financial Review and Analysis (preliminary, unaudited) July 28, 2021 Supplemental Presentation Materials Unless otherwise indicated, comparisons are to the same period in the prior year. July 28, 2021 Second Quarter 2021 Financial Review and Analysis 1Exhibit 99.2 Second Quarter 2021 Financial Review and Analysis (preliminary, unaudited) July 28, 2021 Supplemental Presentation Materials Unless otherwise indicated, comparisons are to the same period in the prior year. July 28, 2021 Second Quarter 2021 Financial Review and Analysis 1
Safe Harbor Statement Certain statements contained in this document are forward-looking statements intended to qualify for the safe harbor from liability established by the Private Securities Litigation Reform Act of 1995. These forward-looking statements, and financial or other business targets, are subject to certain risks and uncertainties. Forward-looking statements also include those related to the acquisition of Vestcom, including its anticipated closing, benefits, financing and effect on our long- term targets and future financial results. We believe that the most significant risk factors that could affect our financial performance in the near-term include: (i) the impacts to underlying demand for our products and/or foreign currency fluctuations from global economic conditions, political uncertainty, changes in environmental standards and governmental regulations, including as a result of the coronavirus/COVID-19 pandemic; (ii) competitors’ actions, including pricing, expansion in key markets, and product offerings; (iii) the degree to which higher costs can be offset with productivity measures and/or passed on to customers through price increases, without a significant loss of volume; and (iv) the execution and integration of acquisitions, including the pending acquisition of Vestcom. Actual results and trends may differ materially from historical or anticipated results depending on a variety of factors, including but are not limited to, risks and uncertainties relating to the following: ● COVID-19 ● The Vestcom acquisition – our ability to complete the acquisition on the proposed terms or anticipated timeline, including risks and uncertainties related to securing the necessary regulatory approvals, financing and satisfaction of other closing conditions to complete the acquisition; the occurrence of any event, change or other circumstance that could give rise to the termination of the agreement related to the acquisition; significant transaction costs or unknown or inestimable liabilities; the risk of stockholder litigation in connection with the pending acquisition; risks related to future opportunities and plans for the combined company, including the uncertainty of expected future financial performance and results of the combined company after the acquisition closes; effects related to the announcement or completion of the acquisition on the market price of our common stock; and the possibility that, if we do not achieve the perceived benefits of the acquisition as rapidly or to the extent anticipated by financial analysts or investors, the market price of our common stock could decline ● International Operations – worldwide and local economic and market conditions; changes in political conditions; and fluctuations in foreign currency exchange rates and other risks associated with foreign operations, including in emerging markets ● Our Business – changes in our markets due to competitive conditions, technological developments, environmental standards, laws and regulations, and customer preferences; fluctuations in demand affecting sales to customers; execution and integration of acquisitions, including the pending acquisition of Vestcom; selling prices; fluctuations in the cost and availability of raw materials and energy; the impact of competitive products and pricing; customer and supplier concentrations or consolidations; financial condition of distributors; outsourced manufacturers; product and service quality; timely development and market acceptance of new products, including sustainable or sustainably-sourced products; investment in development activities and new production facilities; successful implementation of new manufacturing technologies and installation of manufacturing equipment; our ability to generate sustained productivity improvement; our ability to achieve and sustain targeted cost reductions; and collection of receivables from customers ● Income Taxes – fluctuations in tax rates; changes in tax laws and regulations, and uncertainties associated with interpretations of such laws and regulations; retention of tax incentives; outcome of tax audits; and the realization of deferred tax assets ● Information Technology – disruptions in information technology systems, including cyber-attacks or other intrusions to network security; successful installation of new or upgraded information technology systems; and data security breaches ● Human Capital – recruitment and retention of employees; fluctuations in employee benefit costs; and collective labor arrangements ● Our Indebtedness – credit risks; our ability to obtain adequate financing arrangements and maintain access to capital; volatility of financial markets; fluctuations in interest rates; and compliance with our debt covenants ● Ownership of Our Stock – potential significant variability of our stock price and amounts of future dividends and share repurchases ● Legal and Regulatory Matters – protection and infringement of intellectual property and impact of legal and regulatory proceedings, including with respect to environmental, health and safety, anti-corruption and trade compliance ● Other Financial Matters – fluctuations in pension costs and goodwill impairment For a more detailed discussion of these factors, see “Risk Factors” and “Management’s Discussion and Analysis of Financial Condition and Results of Operations” in our 2020 Form 10-K, filed with the Securities and Exchange Commission on February 25, 2021, and subsequent quarterly reports on Form 10-Q. The forward-looking statements included in this document are made only as of the date of this document, and we undertake no obligation to update these statements to reflect subsequent events or circumstances, other than as may be required by law. July 28, 2021 Second Quarter 2021 Financial Review and Analysis 2Safe Harbor Statement Certain statements contained in this document are forward-looking statements intended to qualify for the safe harbor from liability established by the Private Securities Litigation Reform Act of 1995. These forward-looking statements, and financial or other business targets, are subject to certain risks and uncertainties. Forward-looking statements also include those related to the acquisition of Vestcom, including its anticipated closing, benefits, financing and effect on our long- term targets and future financial results. We believe that the most significant risk factors that could affect our financial performance in the near-term include: (i) the impacts to underlying demand for our products and/or foreign currency fluctuations from global economic conditions, political uncertainty, changes in environmental standards and governmental regulations, including as a result of the coronavirus/COVID-19 pandemic; (ii) competitors’ actions, including pricing, expansion in key markets, and product offerings; (iii) the degree to which higher costs can be offset with productivity measures and/or passed on to customers through price increases, without a significant loss of volume; and (iv) the execution and integration of acquisitions, including the pending acquisition of Vestcom. Actual results and trends may differ materially from historical or anticipated results depending on a variety of factors, including but are not limited to, risks and uncertainties relating to the following: ● COVID-19 ● The Vestcom acquisition – our ability to complete the acquisition on the proposed terms or anticipated timeline, including risks and uncertainties related to securing the necessary regulatory approvals, financing and satisfaction of other closing conditions to complete the acquisition; the occurrence of any event, change or other circumstance that could give rise to the termination of the agreement related to the acquisition; significant transaction costs or unknown or inestimable liabilities; the risk of stockholder litigation in connection with the pending acquisition; risks related to future opportunities and plans for the combined company, including the uncertainty of expected future financial performance and results of the combined company after the acquisition closes; effects related to the announcement or completion of the acquisition on the market price of our common stock; and the possibility that, if we do not achieve the perceived benefits of the acquisition as rapidly or to the extent anticipated by financial analysts or investors, the market price of our common stock could decline ● International Operations – worldwide and local economic and market conditions; changes in political conditions; and fluctuations in foreign currency exchange rates and other risks associated with foreign operations, including in emerging markets ● Our Business – changes in our markets due to competitive conditions, technological developments, environmental standards, laws and regulations, and customer preferences; fluctuations in demand affecting sales to customers; execution and integration of acquisitions, including the pending acquisition of Vestcom; selling prices; fluctuations in the cost and availability of raw materials and energy; the impact of competitive products and pricing; customer and supplier concentrations or consolidations; financial condition of distributors; outsourced manufacturers; product and service quality; timely development and market acceptance of new products, including sustainable or sustainably-sourced products; investment in development activities and new production facilities; successful implementation of new manufacturing technologies and installation of manufacturing equipment; our ability to generate sustained productivity improvement; our ability to achieve and sustain targeted cost reductions; and collection of receivables from customers ● Income Taxes – fluctuations in tax rates; changes in tax laws and regulations, and uncertainties associated with interpretations of such laws and regulations; retention of tax incentives; outcome of tax audits; and the realization of deferred tax assets ● Information Technology – disruptions in information technology systems, including cyber-attacks or other intrusions to network security; successful installation of new or upgraded information technology systems; and data security breaches ● Human Capital – recruitment and retention of employees; fluctuations in employee benefit costs; and collective labor arrangements ● Our Indebtedness – credit risks; our ability to obtain adequate financing arrangements and maintain access to capital; volatility of financial markets; fluctuations in interest rates; and compliance with our debt covenants ● Ownership of Our Stock – potential significant variability of our stock price and amounts of future dividends and share repurchases ● Legal and Regulatory Matters – protection and infringement of intellectual property and impact of legal and regulatory proceedings, including with respect to environmental, health and safety, anti-corruption and trade compliance ● Other Financial Matters – fluctuations in pension costs and goodwill impairment For a more detailed discussion of these factors, see “Risk Factors” and “Management’s Discussion and Analysis of Financial Condition and Results of Operations” in our 2020 Form 10-K, filed with the Securities and Exchange Commission on February 25, 2021, and subsequent quarterly reports on Form 10-Q. The forward-looking statements included in this document are made only as of the date of this document, and we undertake no obligation to update these statements to reflect subsequent events or circumstances, other than as may be required by law. July 28, 2021 Second Quarter 2021 Financial Review and Analysis 2

Use of Non-GAAP Financial Measures This presentation contains certain non-GAAP financial measures as defined by SEC rules. We report our financial results in conformity with accounting principles generally accepted in the United States of America, or GAAP, and also communicate with investors using certain non-GAAP financial measures. These non-GAAP financial measures are not in accordance with, nor are they a substitute for or superior to, the comparable GAAP financial measures. These non-GAAP financial measures are intended to supplement the presentation of our financial results that are prepared in accordance with GAAP. Based upon feedback from investors and financial analysts, we believe that the supplemental non-GAAP financial measures we provide are useful to their assessments of our performance and operating trends, as well as liquidity. In accordance with Regulations G and S-K, reconciliations of non-GAAP financial measures to the most directly comparable GAAP financial measures, including limitations associated with these non-GAAP financial measures, are provided in the financial schedules accompanying the earnings news release for the quarter (see Attachments A-4 through A-10 to news release dated July 28, 2021). Our non-GAAP financial measures exclude the impact of certain events, activities or strategic decisions. The accounting effects of these events, activities or decisions, which are included in the GAAP financial measures, may make it difficult to assess our underlying performance in a single period. By excluding the accounting effects, positive or negative, of certain items (e.g., restructuring charges, outcomes of certain legal proceedings, certain effects of strategic transactions and related costs, losses from debt extinguishments, gains or losses from curtailment or settlement of pension obligations, gains or losses on sales of certain assets, gains or losses on investments, and other items), we believe that we are providing meaningful supplemental information that facilitates an understanding of our core operating results and liquidity measures. While some of the items we exclude from GAAP financial measures recur, they tend to be disparate in amount, frequency, or timing. We use these non-GAAP financial measures internally to evaluate trends in our underlying performance, as well as to facilitate comparison to the results of competitors for a single period and full year, as applicable. We use the non-GAAP financial measures described below in the accompanying news release and presentation. • Sales change ex. currency refers to the increase or decrease in net sales, excluding the estimated impact of foreign currency translation, and, where applicable, the calendar shift resulting from the extra week in the prior fiscal year and currency adjustment for transitional reporting of highly inflationary economies. The estimated impact of foreign currency translation is calculated on a constant currency basis, with prior period results translated at current period average exchange rates to exclude the effect of currency fluctuations. • Organic sales change refers to sales change ex. currency, excluding the estimated impact of product line exits, acquisitions and divestitures. We believe that sales change ex. currency and organic sales change assist investors in evaluating the sales change from the ongoing activities of our businesses and enhance their ability to evaluate our results from period to period. • Adjusted operating income refers to income before taxes; interest expense; other non-operating expense (income), net; and other expense (income), net. • Adjusted EBITDA refers to adjusted operating income before depreciation and amortization. • Adjusted operating margin refers to adjusted operating income as a percentage of net sales. • Adjusted EBITDA margin refers to adjusted EBITDA as a percentage of net sales. • Adjusted tax rate refers to the projected full-year GAAP tax rate, adjusted to exclude certain unusual or infrequent events that are expected to significantly impact that rate, such as effects of certain discrete tax planning actions, impacts related to the enactment of the U.S. Tax Cuts and Jobs Act ( TCJA ), where applicable, and other items. • Adjusted net income refers to income before taxes, tax-effected at the adjusted tax rate, and adjusted for tax-effected restructuring charges and other items. • Adjusted net income per common share, assuming dilution (adjusted EPS) refers to adjusted net income divided by weighted average number of common shares outstanding, assuming dilution. We believe that adjusted operating margin, adjusted EBITDA margin, adjusted net income, and adjusted EPS assist investors in understanding our core operating trends and comparing our results with those of our competitors. • Net debt to adjusted EBITDA ratio refers to total debt (including finance leases) less cash and cash equivalents, divided by adjusted EBITDA for the last twelve months. We believe that the net debt to adjusted EBITDA ratio assists investors in assessing our leverage position. • Free cash flow refers to cash flow provided by operating activities, less payments for property, plant and equipment, software and other deferred charges, plus proceeds from sales of property, plant and equipment, plus (minus) net proceeds from insurance and sales (purchases) of investments. We believe that free cash flow assists investors by showing the amount of cash we have available for debt reductions, dividends, share repurchases, and acquisitions. This document has been furnished (not filed) on Form 8-K with the SEC and may be found on our website at www.investors.averydennison.com July 28, 2021 Second Quarter 2021 Financial Review and Analysis 3
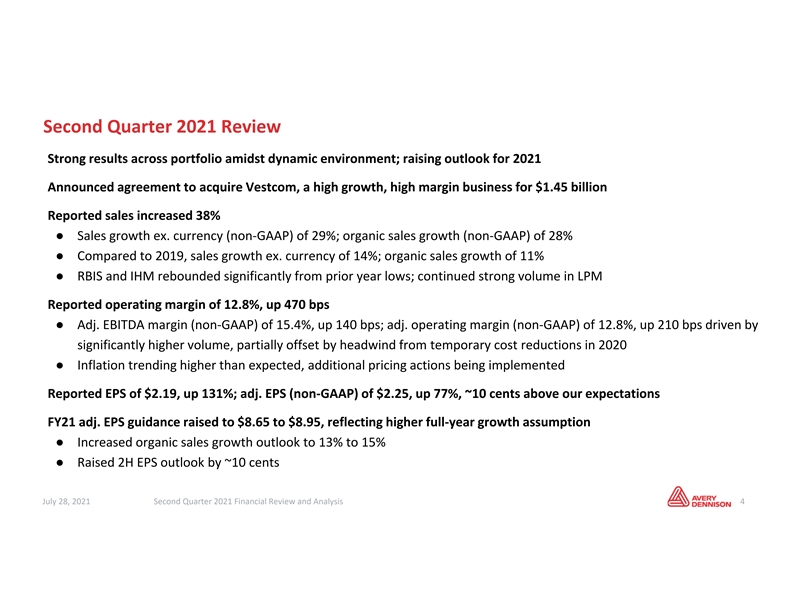
Second Quarter 2021 Review Strong results across portfolio amidst dynamic environment; raising outlook for 2021 Announced agreement to acquire Vestcom, a high growth, high margin business for $1.45 billion Reported sales increased 38% ● Sales growth ex. currency (non-GAAP) of 29%; organic sales growth (non-GAAP) of 28% ● Compared to 2019, sales growth ex. currency of 14%; organic sales growth of 11% ● RBIS and IHM rebounded significantly from prior year lows; continued strong volume in LPM Reported operating margin of 12.8%, up 470 bps ● Adj. EBITDA margin (non-GAAP) of 15.4%, up 140 bps; adj. operating margin (non-GAAP) of 12.8%, up 210 bps driven by significantly higher volume, partially offset by headwind from temporary cost reductions in 2020 ● Inflation trending higher than expected, additional pricing actions being implemented Reported EPS of $2.19, up 131%; adj. EPS (non-GAAP) of $2.25, up 77%, ~10 cents above our expectations FY21 adj. EPS guidance raised to $8.65 to $8.95, reflecting higher full-year growth assumption ● Increased organic sales growth outlook to 13% to 15% ● Raised 2H EPS outlook by ~10 cents July 28, 2021 Second Quarter 2021 Financial Review and Analysis 4

Operational/Market Update Parts of the world are experiencing a resurgence in COVID-19 cases ● Greatest near-term challenge in certain RBIS locations in Asia Safety and well-being of employees remains our top priority ● World-class safety protocols implemented; continue to adapt as pandemic evolves Actively managing dynamic supply and demand environment ● Demand across majority of businesses/regions remains very strong ● Raw materials, freight and labor availability (particularly in the U.S.) continue to be constrained ● Lead times remain elevated given demand and supply imbalance ● Leveraging our global scale and working closely with customers/suppliers to minimize disruptions Inflation remains persistent across all businesses ● Anticipate high-single digit rate of inflation for FY21 ● Q3 sequential inflation expected to be mid-to-high single digit rate ● Pricing and material re-engineering actions being implemented; targeting to offset inflation by Q4 Team continues to demonstrate agility, leveraging robust scenario planning July 28, 2021 Second Quarter 2021 Financial Review and Analysis 5Operational/Market Update Parts of the world are experiencing a resurgence in COVID-19 cases ● Greatest near-term challenge in certain RBIS locations in Asia Safety and well-being of employees remains our top priority ● World-class safety protocols implemented; continue to adapt as pandemic evolves Actively managing dynamic supply and demand environment ● Demand across majority of businesses/regions remains very strong ● Raw materials, freight and labor availability (particularly in the U.S.) continue to be constrained ● Lead times remain elevated given demand and supply imbalance ● Leveraging our global scale and working closely with customers/suppliers to minimize disruptions Inflation remains persistent across all businesses ● Anticipate high-single digit rate of inflation for FY21 ● Q3 sequential inflation expected to be mid-to-high single digit rate ● Pricing and material re-engineering actions being implemented; targeting to offset inflation by Q4 Team continues to demonstrate agility, leveraging robust scenario planning July 28, 2021 Second Quarter 2021 Financial Review and Analysis 5
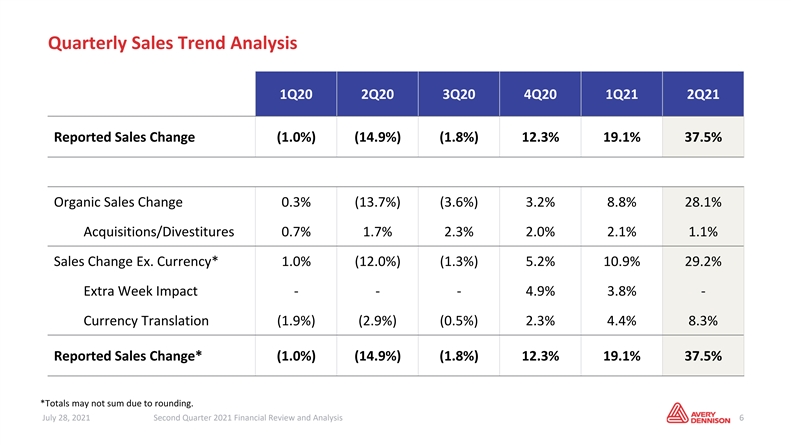
Quarterly Sales Trend Analysis 1Q20 2Q20 3Q20 4Q20 1Q21 2Q21 Reported Sales Change (1.0%) (14.9%) (1.8%) 12.3% 19.1% 37.5% Organic Sales Change 0.3% (13.7%) (3.6%) 3.2% 8.8% 28.1% Acquisitions/Divestitures 0.7% 1.7% 2.3% 2.0% 2.1% 1.1% Sales Change Ex. Currency* 1.0% (12.0%) (1.3%) 5.2% 10.9% 29.2% Extra Week Impact - - - 4.9% 3.8% - Currency Translation (1.9%) (2.9%) (0.5%) 2.3% 4.4% 8.3% Reported Sales Change* (1.0%) (14.9%) (1.8%) 12.3% 19.1% 37.5% *Totals may not sum due to rounding. July 28, 2021 Second Quarter 2021 Financial Review and Analysis 6Quarterly Sales Trend Analysis 1Q20 2Q20 3Q20 4Q20 1Q21 2Q21 Reported Sales Change (1.0%) (14.9%) (1.8%) 12.3% 19.1% 37.5% Organic Sales Change 0.3% (13.7%) (3.6%) 3.2% 8.8% 28.1% Acquisitions/Divestitures 0.7% 1.7% 2.3% 2.0% 2.1% 1.1% Sales Change Ex. Currency* 1.0% (12.0%) (1.3%) 5.2% 10.9% 29.2% Extra Week Impact - - - 4.9% 3.8% - Currency Translation (1.9%) (2.9%) (0.5%) 2.3% 4.4% 8.3% Reported Sales Change* (1.0%) (14.9%) (1.8%) 12.3% 19.1% 37.5% *Totals may not sum due to rounding. July 28, 2021 Second Quarter 2021 Financial Review and Analysis 6

Quarterly Sales Trend Analysis (cont.) Organic Sales Change 1Q20 2Q20 3Q20 4Q20 1Q21 2Q21 LGM 2% (5%) (3%) 4% 8% 16% LPM 3% 0% (2%) 5% 7% 12% Graphics & Reflective (5%) (31%) (8%) (5%) 9% 49% RBIS* (1%) (36%) (5%) 3% 9% 72% IHM (8%) (21%) (8%) 1% 16% 33% Total Company 0% (14%) (4%) 3% 9% 28% Total Company 1% (12%) (1%) 5% 11% 29% Sales Change Ex. Currency * Q2 2021 Intelligent Labels sales up ~65% on organic basis compared to prior year (up ~40% vs. 2019) July 28, 2021 Second Quarter 2021 Financial Review and Analysis 7Quarterly Sales Trend Analysis (cont.) Organic Sales Change 1Q20 2Q20 3Q20 4Q20 1Q21 2Q21 LGM 2% (5%) (3%) 4% 8% 16% LPM 3% 0% (2%) 5% 7% 12% Graphics & Reflective (5%) (31%) (8%) (5%) 9% 49% RBIS* (1%) (36%) (5%) 3% 9% 72% IHM (8%) (21%) (8%) 1% 16% 33% Total Company 0% (14%) (4%) 3% 9% 28% Total Company 1% (12%) (1%) 5% 11% 29% Sales Change Ex. Currency * Q2 2021 Intelligent Labels sales up ~65% on organic basis compared to prior year (up ~40% vs. 2019) July 28, 2021 Second Quarter 2021 Financial Review and Analysis 7

Second Quarter Sales Growth and Operating Margin Comparison Second Quarter Sales Growth Ex. Currency Ex. Currency Organic Organic Reported (‘21 vs. ‘20) (‘21 vs. ‘19) (‘21 vs. ‘20) (‘21 vs. ‘19) Label and Graphic Materials 24.9%16.8%11.0%16.1%10.7% Retail Branding and Information Solutions 79.5%72.5%25.2%72.2%14.1% Industrial and Healthcare Materials 48.8%39.3%10.7%32.9%5.6% Total Company37.5%29.2%14.3%28.1%11.0% Operating Margin Operating Margin EBITDA Margin Reported Adj. (Non-GAAP) Adj. (Non-GAAP) 2Q21 2Q20 2Q19 2Q21 2Q20 2Q19 2Q21 2Q20 2Q19 Label and Graphic Materials16.6%12.5%13.4%14.5%14.8%13.8%16.6%17.2%15.9% Retail Branding and Information Solutions 8.0%(3.6%)12.0%13.1%0.7%12.5%16.8%6.7%15.6% Industrial and Healthcare Materials 11.5%5.7%9.6%11.7%6.8%10.5%15.3%11.6%14.4% Total Company12.8%8.1%11.6%12.8%10.7%12.1%15.4%14.0%14.6% July 28, 2021 Second Quarter 2021 Financial Review and Analysis 8

Second Quarter 2021 Results Label and Graphic Materials 2020 Sales by Product Reported sales increased 25% to $1.4 bil. Base (Label & Graphics) High Value Sales were up 17% ex. currency and 16% organically Specialty/Durables Labels Categories ● Label and Packaging Materials up 12% organically, with strong growth Specialty Graphics in both the high value product categories and the base business ~32% ● Combined Graphics and Reflective Solutions up 49% organically Reflectives ● Organically, North America up high-single digits, Western Europe up mid-teens, and emerging markets up ~20% Reported operating margin increased 410 bps to 16.6% ● Adjusted operating margin decreased 30 bps to 14.5%, driven by net impact of pricing and raw material costs and higher employee-related 2020 Sales by Geography costs, partially offset by higher volume/mix U.S. & Canada Emerging Western Europe Markets E. Europe & MENA ~40% Asia Pacific Latin America July 28, 2021 Second Quarter 2021 Financial Review and Analysis 9 9 End Market Product CategorySecond Quarter 2021 Results Label and Graphic Materials 2020 Sales by Product Reported sales increased 25% to $1.4 bil. Base (Label & Graphics) High Value Sales were up 17% ex. currency and 16% organically Specialty/Durables Labels Categories ● Label and Packaging Materials up 12% organically, with strong growth Specialty Graphics in both the high value product categories and the base business ~32% ● Combined Graphics and Reflective Solutions up 49% organically Reflectives ● Organically, North America up high-single digits, Western Europe up mid-teens, and emerging markets up ~20% Reported operating margin increased 410 bps to 16.6% ● Adjusted operating margin decreased 30 bps to 14.5%, driven by net impact of pricing and raw material costs and higher employee-related 2020 Sales by Geography costs, partially offset by higher volume/mix U.S. & Canada Emerging Western Europe Markets E. Europe & MENA ~40% Asia Pacific Latin America July 28, 2021 Second Quarter 2021 Financial Review and Analysis 9 9 End Market Product Category
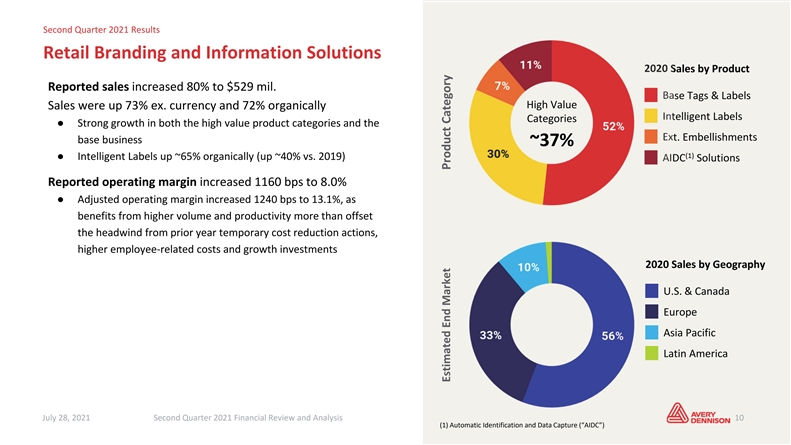
Second Quarter 2021 Results Retail Branding and Information Solutions 2020 Sales by Product Reported sales increased 80% to $529 mil. Base Tags & Labels High Value Sales were up 73% ex. currency and 72% organically Intelligent Labels Categories ● Strong growth in both the high value product categories and the Ext. Embellishments base business ~37% (1) ● Intelligent Labels up ~65% organically (up ~40% vs. 2019) AIDC Solutions Reported operating margin increased 1160 bps to 8.0% ● Adjusted operating margin increased 1240 bps to 13.1%, as benefits from higher volume and productivity more than offset the headwind from prior year temporary cost reduction actions, higher employee-related costs and growth investments 2020 Sales by Geography U.S. & Canada Europe Asia Pacific Latin America July 28, 2021 Second Quarter 2021 Financial Review and Analysis 10 10 (1) Automatic Identification and Data Capture (“AIDC”) Estimated End Market Product CategorySecond Quarter 2021 Results Retail Branding and Information Solutions 2020 Sales by Product Reported sales increased 80% to $529 mil. Base Tags & Labels High Value Sales were up 73% ex. currency and 72% organically Intelligent Labels Categories ● Strong growth in both the high value product categories and the Ext. Embellishments base business ~37% (1) ● Intelligent Labels up ~65% organically (up ~40% vs. 2019) AIDC Solutions Reported operating margin increased 1160 bps to 8.0% ● Adjusted operating margin increased 1240 bps to 13.1%, as benefits from higher volume and productivity more than offset the headwind from prior year temporary cost reduction actions, higher employee-related costs and growth investments 2020 Sales by Geography U.S. & Canada Europe Asia Pacific Latin America July 28, 2021 Second Quarter 2021 Financial Review and Analysis 10 10 (1) Automatic Identification and Data Capture (“AIDC”) Estimated End Market Product Category

Second Quarter 2021 Results Industrial and Healthcare Materials 2020 Sales by Product Reported sales increased 49% to $197 mil. Automotive Sales were up 39% ex. currency and 33% organically High Value Other Industrial Categories ● Industrial categories up ~60%, driven largely by strength in Healthcare automotive ~74% ● Healthcare down high-single digits, driven by a tougher Retail comparison in personal care tapes Reported operating margin increased 580 bps to 11.5% ● Adjusted operating margin increased 490 bps to 11.7%, as benefit from higher volume/mix more than offset the headwind from prior year temporary cost reduction actions and higher employee- related costs 2020 Sales by Geography U.S. & Canada Europe Asia Pacific Latin America July 28, 2021 Second Quarter 2021 Financial Review and Analysis 11 11 Estimated End Market Product CategorySecond Quarter 2021 Results Industrial and Healthcare Materials 2020 Sales by Product Reported sales increased 49% to $197 mil. Automotive Sales were up 39% ex. currency and 33% organically High Value Other Industrial Categories ● Industrial categories up ~60%, driven largely by strength in Healthcare automotive ~74% ● Healthcare down high-single digits, driven by a tougher Retail comparison in personal care tapes Reported operating margin increased 580 bps to 11.5% ● Adjusted operating margin increased 490 bps to 11.7%, as benefit from higher volume/mix more than offset the headwind from prior year temporary cost reduction actions and higher employee- related costs 2020 Sales by Geography U.S. & Canada Europe Asia Pacific Latin America July 28, 2021 Second Quarter 2021 Financial Review and Analysis 11 11 Estimated End Market Product Category

2021 EPS Guidance Previous Updated Reported EPS $8.25 – $8.65 $8.50 – $8.80 Add Back: Est. restructuring costs and other items ~$0.15 ~$0.15 Adjusted EPS (non-GAAP) $8.40 – $8.80 $8.65 – $8.95 Contributing Factors to 2021 Results ● Reported sales growth of 16% to 18%; ~3.5% currency tailwind; ~1.5% extra week impact headwind ○ Ex. currency growth of 14% to 16%; ~1% benefit from M&A ○ Organic sales growth of 13% to 15% (previously 8% to 10%) ● Closed acquisitions expected to provide inorganic benefit of $0.10 to $0.15 ● FY headwind of ~$0.15 from calendar shift (Q1 tailwind of ~$0.15, Q4 headwind of ~$0.30) ● Currency translation benefit to operating income of ~$35 mil., (previously ~$25 mil.) ● Incremental savings of $60+ mil. from restructuring actions, net of transition costs (previously ~$70 mil.) ○ In light of strong demand, delaying certain projects ● Pace of investment expected to accelerate throughout the year ● Tax rate in mid-twenty percent range; avg. shares outstanding (assuming dilution) of ~83.5 mil. ● Free cash flow of $700+ mil. (previously $675+ mil.) July 28, 2021 Second Quarter 2021 Financial Review and Analysis 12 Note: 2021 estimates do not include the impact of Vestcom; deal is expected to close in Q3 subject to regulatory approvals and other customary closing conditions

Vestcom Acquisition Overview July 28, 2021 Second Quarter 2021 Financial Review and Analysis 13
Vestcom builds on RBIS pricing and data management capabilities and expands presence in high value categories ● Highly synergistic adjacency to RBIS ○ Expands RBIS’ role in processing/managing variable data in adjacent markets ● Accelerates AVY portfolio shift to high value categories ● Strong track record across cycles ○ Above company average organic growth ○ Above company average margin, including synergies ● Opportunity to accelerate our Intelligent Labels strategy, particularly in Food ○ Provides strong channel access to targeted market segments ○ Enables further evolution of our data solutions and digital journey, building on our acquisition of ZippyYum and recent launch of atma.io July 28, 2021 Second Quarter 2021 Financial Review and Analysis 14Vestcom builds on RBIS pricing and data management capabilities and expands presence in high value categories ● Highly synergistic adjacency to RBIS ○ Expands RBIS’ role in processing/managing variable data in adjacent markets ● Accelerates AVY portfolio shift to high value categories ● Strong track record across cycles ○ Above company average organic growth ○ Above company average margin, including synergies ● Opportunity to accelerate our Intelligent Labels strategy, particularly in Food ○ Provides strong channel access to targeted market segments ○ Enables further evolution of our data solutions and digital journey, building on our acquisition of ZippyYum and recent launch of atma.io July 28, 2021 Second Quarter 2021 Financial Review and Analysis 14

Shelf-Edge Vestcom Overview Intro video Solutions ● Price Communication ● Planogram Compliance Market-leading provider of pricing and branded labeling ● Branded Content solutions for the retail shelf-edge, powered by advanced ● Promotional Campaigns data management capabilities ● Proven, consistent, strong growth and margin business with significant growth opportunity/white space ahead Data Management Capabilities Data Data Media / Label ● Track record of delivering strong ROI for customers through Shipping & Logistics Integration Processing Production productivity and increased revenue Billions of 1+ million client files Thousands of <24 hour updates/month processed/month labels/store/week turnaround ● Leading provider of productivity solutions for executing pricing and planogram changes at shelf edge Other End Market ● Consumer engagement solutions enable sales lift through high Revenue Mix Dollar Stores impact pricing promotions and branding ~15% Grocery ● Long-term exclusive relationships with market-leading ~$400M Stores retailers ~55% Annual Revenue ● Strong data management capabilities that streamline the Drug Stores ~25% processing of billions of pricing updates monthly July 28, 2021 Second Quarter 2021 Financial Review and Analysis 15Shelf-Edge Vestcom Overview Intro video Solutions ● Price Communication ● Planogram Compliance Market-leading provider of pricing and branded labeling ● Branded Content solutions for the retail shelf-edge, powered by advanced ● Promotional Campaigns data management capabilities ● Proven, consistent, strong growth and margin business with significant growth opportunity/white space ahead Data Management Capabilities Data Data Media / Label ● Track record of delivering strong ROI for customers through Shipping & Logistics Integration Processing Production productivity and increased revenue Billions of 1+ million client files Thousands of <24 hour updates/month processed/month labels/store/week turnaround ● Leading provider of productivity solutions for executing pricing and planogram changes at shelf edge Other End Market ● Consumer engagement solutions enable sales lift through high Revenue Mix Dollar Stores impact pricing promotions and branding ~15% Grocery ● Long-term exclusive relationships with market-leading ~$400M Stores retailers ~55% Annual Revenue ● Strong data management capabilities that streamline the Drug Stores ~25% processing of billions of pricing updates monthly July 28, 2021 Second Quarter 2021 Financial Review and Analysis 15

Vestcom enables optimized execution & consumer engagement at the shelf-edge SOLUTIONS FOR RETAILERS AND SOLUTIONS FOR RETAILERS BRANDS stackz® shelfStrips® adSigns® shelfAdz® Overview Overview Joint marketing vehicle for Self-adhering labels come pre-cut Signage across the store delivered in Display planograms retailers and CPGs to highlight brand and stacked in walk sequence a single kit with price integration and store- at the shelf edge, reducing time and campaigns, promotions, digital offers level specifications increasing compliance of resets Enables employees to execute price and new product introductions and promotion changes efficiently Clear visuals guide stockers to Amplifies existing shelf communications and accurately quickly and accurately fill shelves with smarter, data-driven signage print & labor REDUCTION REDUCTION SALES LIFT in shelf set time in tag turnover time SAVINGS July 28, 2021 Second Quarter 2021 Financial Review and Analysis 16Vestcom enables optimized execution & consumer engagement at the shelf-edge SOLUTIONS FOR RETAILERS AND SOLUTIONS FOR RETAILERS BRANDS stackz® shelfStrips® adSigns® shelfAdz® Overview Overview Joint marketing vehicle for Self-adhering labels come pre-cut Signage across the store delivered in Display planograms retailers and CPGs to highlight brand and stacked in walk sequence a single kit with price integration and store- at the shelf edge, reducing time and campaigns, promotions, digital offers level specifications increasing compliance of resets Enables employees to execute price and new product introductions and promotion changes efficiently Clear visuals guide stockers to Amplifies existing shelf communications and accurately quickly and accurately fill shelves with smarter, data-driven signage print & labor REDUCTION REDUCTION SALES LIFT in shelf set time in tag turnover time SAVINGS July 28, 2021 Second Quarter 2021 Financial Review and Analysis 16

Transaction Summary ● AVY to acquire Vestcom, the industry-leading provider of shelf-edge solutions ● Based in Little Rock, Arkansas with ~1200 employees Business ● ~$400 million 2021E revenue business within RBIS segment (vast majority in U.S.) ● Purchase price $1.45 billion; cash transaction, subject to customary adjustments Terms ● Expected to close in Q3 2021, subject to regulatory approvals and other customary closing conditions ● Anticipate funding with cash and debt Financing ● Net Debt to EBITDA at year-end 2021 projected at the low-end of targeted range ● Capital allocation strategy remains unchanged with continued ample capacity ● Consistent high single-digit long-term organic revenue CAGR Financial Impact ● Accretive to AVY EBITDA margin, incl. synergies; purchase multiple below AVY multiple ● Accretive to 2022 EPS, net of purchase accounting/amortization and financing costs July 28, 2021 Second Quarter 2021 Financial Review and Analysis 17Transaction Summary ● AVY to acquire Vestcom, the industry-leading provider of shelf-edge solutions ● Based in Little Rock, Arkansas with ~1200 employees Business ● ~$400 million 2021E revenue business within RBIS segment (vast majority in U.S.) ● Purchase price $1.45 billion; cash transaction, subject to customary adjustments Terms ● Expected to close in Q3 2021, subject to regulatory approvals and other customary closing conditions ● Anticipate funding with cash and debt Financing ● Net Debt to EBITDA at year-end 2021 projected at the low-end of targeted range ● Capital allocation strategy remains unchanged with continued ample capacity ● Consistent high single-digit long-term organic revenue CAGR Financial Impact ● Accretive to AVY EBITDA margin, incl. synergies; purchase multiple below AVY multiple ● Accretive to 2022 EPS, net of purchase accounting/amortization and financing costs July 28, 2021 Second Quarter 2021 Financial Review and Analysis 17

Thank you July 28, 2021 Second Quarter 2021 Financial Review and Analysis 13 © 2020 Avery Dennison Corporation. All rights reserved. Avery Dennison and all other Avery Dennison brands, product names and codes are trademarks of Avery Dennison Corporation. All other brands or product names are trademarks of their respective owners. Fortune 500® is a trademark of Time, Inc. Branding and other information on any samples depicted is fictitious. Any resemblance to actual names is purely coincidental.Thank you July 28, 2021 Second Quarter 2021 Financial Review and Analysis 13 © 2020 Avery Dennison Corporation. All rights reserved. Avery Dennison and all other Avery Dennison brands, product names and codes are trademarks of Avery Dennison Corporation. All other brands or product names are trademarks of their respective owners. Fortune 500® is a trademark of Time, Inc. Branding and other information on any samples depicted is fictitious. Any resemblance to actual names is purely coincidental.
Exhibit 99.3

Avery Dennison to acquire Vestcom
The acquisition of Vestcom, a high-performing provider of pricing and branded labeling solutions at the retail shelf-edge, advances the company’s strategies, including the opportunity to accelerate Intelligent Labels adoption.
GLENDALE, Calif. July 28, 2021—Avery Dennison (NYSE: AVY) announced today that it has signed an agreement to acquire Vestcom, a privately held market-leading provider of pricing and branded labeling solutions at the shelf-edge for retailers and consumer packaged goods companies, for $1.45 billion in a cash transaction, subject to certain closing and post-closing adjustments. Vestcom uses data management capabilities to synthesize and streamline store-level data and deliver item-specific, price-integrated messaging at the shopper’s point of decision. The acquisition is expected to close in the third quarter of 2021, subject to regulatory approvals and other customary closing conditions.
Vestcom is headquartered in Little Rock, Arkansas, with roughly $400 million in annual revenue. The company has 11 U.S. production facilities and approximately 1,200 employees, with sales across multiple U.S. retail channels, including grocery, drug, and dollar. Vestcom’s solutions include stackz® pre-cut, pre-sorted self-adhering shelf labels; shelfStrips® shelf-edge planogram displays; adSigns® signage kits; and shelfAdz® branded marketing displays.
Vestcom is a high-growth, high-margin business, with a strong track record across cycles that will accelerate the AVY portfolio shift to high-value categories. The acquisition is expected to be accretive to the company’s 2022 EPS, net of purchase accounting amortization and financing costs.
“Vestcom is a high-performing business that is a near adjacency to RBIS,” said Mitch Butier, Avery Dennison’s chairman, president, and CEO. “With this acquisition, we are expanding our position in high-value categories and adding complementary channel access and data management capabilities that have the potential to further accelerate our Intelligent Labels strategy. We look forward to welcoming them into the Avery Dennison team.”
“Vestcom is a strong strategic fit for RBIS with a well-established base of long-term, market-leading customers,” said Deon Stander, vice president and general manager, RBIS. “It has a long history of continuous innovation and delivering products and services with strong value propositions and clear, measurable return on investment for its customers. It has consistently adhered to a proven growth strategy executed by an excellent management team. Vestcom’s relationships and solutions, in combination with our own, will complement our strategy to accelerate Intelligent Label adoption beyond apparel. We look forward to learning from the Vestcom team, and working together to drive significant value for all our stakeholders.”
“Today’s announcement marks a significant milestone in the history of Vestcom,” said John Lawlor, chairman and CEO of Vestcom. “The capabilities of Avery Dennison will enable Vestcom to further accelerate innovation and continue delivering high-value solutions that drive sales and productivity for retailers and CPGs. And we look forward to bringing our expertise and data integration capabilities to new channels and markets with Avery Dennison. I am extremely proud of what we have accomplished and I look forward to this next chapter in our growth trajectory.”
“We are pleased to agree to the sale of Vestcom, the culmination of our successful partnership with John Lawlor and his talented management team,” said Andrew Janower, managing director at Charlesbank Capital Partners, the private investment firm that has owned Vestcom since late 2016. “Together we have worked to grow the business and strengthen its market position, executing on many elements of our investment thesis and generating a strong return for our investors.” Added fellow managing director Brandon White, “We are confident Vestcom will continue to thrive with Avery Dennison and wish them continued success as they move forward.”
Goldman Sachs & Co. LLC and Latham and Watkins advised Avery Dennison on the transaction. Robert W. Baird & Co, Jefferies, RBC Capital Markets and Goodwin Procter LLP advised Charlesbank on the transaction.
###
About Avery Dennison
Avery Dennison Corporation (NYSE: AVY) is a global materials science company specializing in the design and manufacture of a wide variety of labeling and functional materials. The company’s products, which are used in nearly every major industry, include pressure-sensitive materials for labels and graphic applications; tapes and other bonding solutions for industrial, medical, and retail applications; tags, labels and embellishments for apparel; and radio frequency identification (RFID) solutions serving retail apparel and other markets. Headquartered in Glendale, California, the company employs more than 32,000 employees in more than 50 countries. Reported sales in 2020 were $7.0 billion. Learn more at www.averydennison.com.
About Charlesbank
Based in Boston and New York, Charlesbank Capital Partners is a middle-market private investment firm with more than $15 billion of capital raised since inception. Charlesbank focuses on management-led buyouts and growth capital financings, as well as opportunistic credit and technology investments. The firm seeks to build companies with sustainable competitive advantage and excellent prospects for growth. For more information, please visit www.charlesbank.com.
About Vestcom
Vestcom is the industry leader in technology-driven shelf-edge media solutions for Retailers and CPGs. Its data-integrated media solutions engage shoppers where it matters most – the point of decision – increasing sales and loyalty. Vestcom’s patented shelf-edge innovation has been trusted by top retailers for more than 30 years to drive productivity and profitable growth. Learn more at www.vestcom.com
Serious News for Serious Traders! Try StreetInsider.com Premium Free!
You May Also Be Interested In
- Sequana Medical announces the Annual and Extraordinary General Meetings of Shareholders on 23 May 2024
- Sequana Medical announces the Annual and Extraordinary General Meetings of Shareholders on 23 May 2024
- Orosur Mining Inc Announces Results for Third Quarter Ended February 29, 2024
Create E-mail Alert Related Categories
SEC FilingsSign up for StreetInsider Free!
Receive full access to all new and archived articles, unlimited portfolio tracking, e-mail alerts, custom newswires and RSS feeds - and more!
