

Form 8-K AUGUSTA GOLD CORP. For: Jun 29
 Tweet
Tweet Share
ShareExhibit 99.1
MINERAL RESOURCE ESTIMATE FOR THE
REWARD PROJECT, NYE COUNTY, NEVADA, USA
| Prepared For: | CR Reward LLC & Augusta Gold Corp. Suite 555 – 999, Canada Place Vancouver, BC V6C 3E1 Canada |
 |
| Prepared by: | APEX Geoscience Ltd. #100, 11450-160th Street NW Edmonton AB T5M 3Y7 Canada |
 |
| Kappes, Cassiday & Associates 7950 Security Circle Reno, NV USA 89506 |
 |
Michael Dufresne, M.Sc., P. Geol., P.Geo.
Timothy D. Scott, BA.Sc., RM SME
Effective Date: May 31st, 2022
Signing Date: June 29th, 2022
Technical Report - Mineral Resource Estimate Reward Project, Nye County, Nevada, USA
Contents
| 1 | Summary | 1 | ||
| 1.1 | Issuer and Purpose | 1 | ||
| 1.2 | Authors, Contributors and Site Inspection | 1 | ||
| 1.3 | Project Setting | 2 | ||
| 1.4 | Mineral Tenure, Surface Rights, Water Rights, Royalties and Agreements | 2 | ||
| 1.5 | Geology and Mineralization | 4 | ||
| 1.6 | History | 5 | ||
| 1.7 | Drilling and Sampling | 5 | ||
| 1.8 | Data Verification | 6 | ||
| 1.9 | Metallurgical Testing | 7 | ||
| 1.10 | Current Mineral Resource | 7 | ||
| 1.11 | Conclusions | 10 | ||
| 1.12 | Recommendations | 10 | ||
| 2 | Introduction | 11 | ||
| 2.1 | Issuer and Purpose | 11 | ||
| 2.2 | Authors, Contributors and Site Inspection | 12 | ||
| 2.3 | Sources of Information | 14 | ||
| 2.4 | Units of Measure | 14 | ||
| 3 | Reliance on Other Experts | 15 | ||
| 4 | Property Description and Location | 15 | ||
| 4.1 | Description and Location | 15 | ||
| 4.2 | Property and Title in Nevada | 15 | ||
| 4.2.1 | Mineral Title | 15 | ||
| 4.2.2 | Surface Rights | 16 | ||
| 4.2.3 | Environmental Regulations | 18 | ||
| 4.2.4 | Water Rights | 18 | ||
| 4.3 | Ownership | 18 | ||
| 4.4 | Mineral Properties | 19 | ||
| 4.4.1 | Claim Status | 19 | ||
| 4.4.2 | Claim Retention Obligations | 19 | ||
| 4.4.3 | Encumbrances | 25 | ||
| 4.5 | Mineral Lease Agreements | 25 | ||
| 4.5.1 | Connolly Lease | 25 | ||
| 4.5.2 | Webster Lease | 25 | ||
| 4.5.3 | Orser–McFall Lease | 26 | ||
| 4.5.4 | Van Meeteren et al Lease | 26 | ||
| 4.6 | Encumbrances | 26 | ||
| 4.7 | Surface Ownership | 26 | ||
| 4.8 | Water Rights | 27 | ||
| 4.9 | Permitting Considerations | 27 | ||
| 4.10 | Environmental Considerations | 27 | ||
| 4.11 | Comments on Property Description and Location | 28 | ||
| 5 | Accessibility, Climate, Local Resources, Infrastructure and Physiography | 28 | ||
| 5.1 | Accessibility | 28 | ||
| Effective Date: May 31st, 2022 |  | i |
Technical Report - Mineral Resource Estimate Reward Project, Nye County, Nevada, USA
| 5.2 | Site Topography, Elevation and Vegetation | 28 | ||
| 5.3 | Climate | 29 | ||
| 5.4 | Local Resources and Infrastructure | 29 | ||
| 6 | History | 30 | ||
| 6.1 | Exploration History | 30 | ||
| 6.2 | Production History | 30 | ||
| 7 | Geological Setting and Mineralization | 33 | ||
| 7.1 | Regional Geology | 33 | ||
| 7.2 | Local Geology | 34 | ||
| 7.3 | Stratigraphy | 37 | ||
| 7.3.1 | Late Proterozoic | 38 | ||
| 7.3.2 | Proterozoic-Cambrian | 40 | ||
| 7.3.3 | Cambrian | 40 | ||
| 7.4 | Structure | 41 | ||
| 7.4.1 | Good Hope Fault Zone | 41 | ||
| 7.5 | Alteration | 44 | ||
| 7.6 | Oxidation (Redox) | 44 | ||
| 7.7 | Mineralization | 45 | ||
| 7.7.1 | Description of Mineralization: Good Hope Deposit | 45 | ||
| 7.7.2 | Description of Mineralization: Gold Ace Mineralized Zone | 47 | ||
| 7.7.3 | Description of Mineralization: Exploration Update | 49 | ||
| 8 | Deposit Types | 50 | ||
| 9 | Exploration | 51 | ||
| 9.1 | Introduction | 51 | ||
| 9.2 | CR Reward Exploration (2015-Present) | 51 | ||
| 10 | Drilling | 52 | ||
| 10.1 | Drill Methods, Logging and Surveys | 55 | ||
| 10.1.1 | Gexa (1987) | 55 | ||
| 10.1.2 | Pathfinder (1991) | 55 | ||
| 10.1.3 | Barrick (1995-1996) and Glamis (1998-2000) | 55 | ||
| 10.1.4 | Canyon (2006-2007) | 56 | ||
| 10.1.5 | Atna (2011-2013) | 56 | ||
| 10.2 | CR Reward Core Drilling Program (2017-2018) | 56 | ||
| 10.3 | Twin Holes | 59 | ||
| 10.4 | Comments on Drilling | 60 | ||
| 11 | Sample Preparation, Analyses and Security | 60 | ||
| 11.1 | Pre-CR Reward Drill Sampling, Analysis and Security | 60 | ||
| 11.1.1 | Gexa (1987) | 60 | ||
| 11.1.2 | Barrick (1995-1996) | 61 | ||
| 11.1.3 | Glamis (1998-2000) | 61 | ||
| 11.1.4 | Canyon (2006-2007) | 61 | ||
| 11.1.5 | Atna (2011-2013) | 62 | ||
| 11.2 | CR Reward Sampling, Analysis and Security (2017-2018) | 63 | ||
| 11.2.1 | Diamond Drill Core Sample Preparation and Analysis | 64 | ||
| 11.3 | CR Reward QAQC Results (2017-2018) | 66 | ||
| 11.3.1 | Blanks | 66 | ||
| Effective Date: May 31st, 2022 | | ii |
Technical Report - Mineral Resource Estimate Reward Project, Nye County, Nevada, USA
| 11.3.2 | Standard Reference Materials | 67 | |||
| 11.3.3 | Duplicates | 69 | |||
| 11.4 | Comments on Sample Preparation, Analyses and Security | 69 | |||
| 12 | Data Verification | 70 | |||
| 12.1 | Verification Program | 70 | |||
| 12.1.1 | Protocols and Error Tracking of Pre-CR Reward Drill Holes | 70 | |||
| 12.2 | Collar Data Verification | 71 | |||
| 12.3 | Down-Hole Survey Data Verification | 72 | |||
| 12.4 | Assay Verification | 72 | |||
| 12.5 | Author and QP Site Visits | 73 | |||
| 13 | Mineral Processing and Metallurgical Testing | 78 | |||
| 13.1 | 1998 Rayrock Column Tests – Drill Core | 78 | |||
| 13.2 | 1998 Rayrock Column Tests – Trench Samples | 79 | |||
| 13.3 | 2007 McClelland Bottle Roll Tests | 79 | |||
| 13.4 | McClelland 2008 Column Test Campaign | 80 | |||
| 13.4.1 | 2008 Column Test Results | 82 | |||
| 13.4.2 | 2008 Bottle Roll Test Results at Crush Size and at 200 Mesh | 82 | |||
| 13.4.3 | 2008 Bottle Roll Size versus Recovery on Composite 5 | 84 | |||
| 13.4.4 | Drain-Down Data | 84 | |||
| 13.4.5 | Conclusions from 2008 McClelland Program | 84 | |||
| 13.5 | 2018 Kappes Cassidy Associates Test Program | 84 | |||
| 13.5.1 | 2018 KCA Composite Generation | 86 | |||
| 13.5.2 | 2018 Physical Characterization | 86 | |||
| 13.5.3 | 2018 KCA Pulverized Bottle Roll Tests | 88 | |||
| 13.5.4 | KCA 2018 Column Leach Tests | 97 | |||
| 13.5.5 | 2018 KCA Program Conclusions | 99 | |||
| 13.6 | Analysis and Discussion | 99 | |||
| 13.6.1 | Crush Size and Grade versus Recovery | 99 | |||
| 13.6.2 | Leach Cycle | 101 | |||
| 13.6.3 | Reagent Consumptions | 101 | |||
| 13.6.3.1 | Cyanide | 101 | |||
| 13.6.3.2 | Lime | 101 | |||
| 13.6.4 | Conclusions and Key Design Parameters | 101 | |||
| 14 | Mineral Resource Estimates | 103 | |||
| 14.1 | Introduction | 103 | |||
| 14.2 | Data | 105 | |||
| 14.2.1 | Drill Hole Data | 105 | |||
| 14.2.2 | APEX Micromine Database Validation | 107 | |||
| 14.3 | Geological Model and Domains | 108 | |||
| 14.3.1 | Good Hope Deposit | 108 | |||
| 14.3.1.1 | Low-Grade Alteration Domain (LG) | 109 | |||
| 14.3.1.2 | High Grade Gold Shell (HG) | 109 | |||
| 14.3.2 | Gold Ace Zone | 110 | |||
| 14.4 | Drill Hole Flagging and Compositing | 110 | |||
| 14.4.1 | Sample Width Analysis | 110 | |||
| 14.4.2 | Remnant Analysis | 111 | |||
| Effective Date: May 31st, 2022 | | iii |
Technical Report - Mineral Resource Estimate Reward Project, Nye County, Nevada, USA
| 14.5 | Capping | 113 | ||
| 14.6 | Variography and Grade Continuity | 116 | ||
| 14.7 | Bulk Density | 118 | ||
| 14.8 | Block Model | 122 | ||
| 14.8.1 | Block Model Parameters | 122 | ||
| 14.8.2 | Volumetric Checks | 124 | ||
| 14.9 | Grade Estimation | 124 | ||
| 14.9.1 | Estimation Methodology | 124 | ||
| 14.10 | Model Validation | 128 | ||
| 14.10.1 | Visual Validation | 128 | ||
| 14.10.2 | Statistical Validation | 130 | ||
| 14.11 | Mineral Resource Classification | 136 | ||
| 14.11.1 | 2019 CIM and SK 1300 Definitions | 136 | ||
| 14.11.2 | Classification Criteria | 138 | ||
| 14.12 | Evaluation of Reasonable Prospects for Eventual Economic Extraction | 138 | ||
| 14.13 | Mineral Resource Statement | 140 | ||
| 14.14 | Discussion of Mineral Resources Modelling, Risks and Uncertainties | 144 | ||
| 23 | Adjacent Properties | 145 | ||
| 23.1 | Bullfrog | 145 | ||
| 23.2 | Sterling and Crown | 146 | ||
| 24 | Other Relevant Data and Information | 147 | ||
| 25 | Interpretation and Conclusions | 147 | ||
| 25.1 | Introduction | 147 | ||
| 25.2 | Mineral Tenure, Surface Rights, Water Rights, Royalties/Agreements | 147 | ||
| 25.3 | Geology | 148 | ||
| 25.4 | Exploration, Drilling and Analytical Data Collection in Support of Mineral Resource Estimation | 149 | ||
| 25.5 | Metallurgical Test work | 149 | ||
| 25.6 | Mineral Resource Estimate | 150 | ||
| 25.7 | Risks and Uncertainties | 150 | ||
| 25.8 | Conclusions | 151 | ||
| 26 | Recommendations | 152 | ||
| 27 | References | 154 | ||
| 28 | Date and Signature | 160 | ||
| 29 | Certificate of Author | 161 | ||
Tables
| Table 1.1. Reward Conceptual Open Pit Parameters | 9 |
| Table 1.2. Reward Project Mineral Resource Estimate at May 31, 2022 | 9 |
| Table 1.3. Estimated budget for the recommended PFS | 10 |
| Table 4.1. Summary of the Reward Project Claims | 20 |
| Table 6.1. Project Exploration History | 30 |
| Table 7.1. Stratigraphy and Unit Thickness of the Bare Mountains Complex | 37 |
| Table 10.1. Reward Drilling Summary | 53 |
| Table 10.2. CR Reward Drill Hole Collars (2017-2018) | 57 |
| Effective Date: May 31st, 2022 | | iv |
Technical Report - Mineral Resource Estimate Reward Project, Nye County, Nevada, USA
| Table 10.3. Results of CR Reward Drill Holes (2017-2018) | 58 |
| Table 10.4. Results of Reward Twin Holes | 60 |
| Table 11.1. Summary Results of Blank Material from the 2017-2018 Drill Program | 67 |
| Table 11.2. Summary Results of Standards from the 2017-2018 Drill Program | 67 |
| Table 12.1. Drill Hole Coordinate Comparison | 74 |
| Table 12.2. Significant Intercepts of Drill Holes Reviewed During Mr. Dufresne’s Inspection of the CR Reward Core Facility | 75 |
| Table 13.1. 1998 Rayrock Drill Core Column Tests Results | 79 |
| Table 13.2. 1998 Rayrock Surface Trench Column Test Gold Recovery | 80 |
| Table 13.3. 1998 10 Mesh Reverse Circulation Drill Holes Bottle Roll Results | 80 |
| Table 13.4. 2008 McClelland Sample/Drill Hole Composite Information | 81 |
| Table 13.5. 2008 McClelland Summary Column Test Results | 83 |
| Table 13.6. 2008 McClelland Bottle Roll Tests – Gold Recovery % | 84 |
| Table 13.7. 2008 McClelland Bottle Roll Size versus Gold Recovery – Composite 5 | 85 |
| Table 13.8. 2008 McClelland Drain-Down Data from Column Tests | 85 |
| Table 13.9. 2018 KCA Composite Head Screen Analyses – Gold and Silver | 88 |
| Table 13.10. 2018 KCA Composite Head Screen Analyses – Mercury and Copper | 88 |
| Table 13.11. 2018 Hazen Bond Impact Work and Abrasion Index | 88 |
| Table 13.12. 2018 High-Grade Sample Intervals | 89 |
| Table 13.13. 2018 KCA Bottle Roll Test Results | 90 |
| Table 13.14. KCA 2018 Preliminary Agglomeration Test Work | 92 |
| Table 13.15. KCA 2018 Compacted Permeability Tests | 93 |
| Table 13.16. KCA 2018 Column Leach Tests | 98 |
| Table 14.1. Summary Statistics of Raw Gold Assays of Sample Intervals Flagged within the Good Hope and Gold Ace Estimation Domains | 107 |
| Table 14.2. Remnant Analysis comparing the Gold Statistics of Raw Assays and Uncapped Composite Samples with and without Orphans | 112 |
| Table 14.3. Summary Statistics of Gold Grade of Capped Composite Intervals Flagged within the Good Hope and Gold Ace Estimation Domains | 116 |
| Table 14.4. Gold Variogram Model Parameters | 117 |
| Table 14.5. Bulk Density Measurements, Good Hope Deposit and Gold Ace Zone | 119 |
| Table 14.6. Percentage of Blocks Flagged within each Formation for the Good Hope and Gold Ace Zones | 121 |
| Table 14.7. Project Block Model Size and Extents | 123 |
| Table 14.8. Wireframe versus Block Model Volume Comparison | 124 |
| Table 14.9. Estimation Search and Kriging Parameters | 125 |
| Table 14.10. Interpolation Search Restrictions | 138 |
| Table 14.11. Parameters for Pit Optimization for Mineral Resource Estimate | 139 |
| Table 14.12. Measured and Indicated Mineral Resource Statement | 140 |
| Table 14.13. Inferred Mineral Resource Statement | 141 |
| Table 14.14. Sensitivity Table, Measured and Indicated Mineral Resources, Good Hope | 141 |
| Table 14.15. Sensitivity Table, Inferred Mineral Resources, Good Hope | 142 |
| Table 14.16. Sensitivity Table, Indicated Mineral Resources, Gold Ace | 142 |
| Table 14.17. Sensitivity Table, Inferred Mineral Resources, Gold Ace | 143 |
| Effective Date: May 31st, 2022 | | v |
Technical Report - Mineral Resource Estimate Reward Project, Nye County, Nevada, USA
| Table 14.18. Sensitivity Table, Measured and Indicated Mineral Resources, Good Hope and Gold Ace | 143 |
| Table 14.19. Sensitivity Table, Inferred Mineral Resources, Good Hope and Gold Ace | 144 |
| Table 25.1. Reward Project Mineral Resource Estimate at May 31, 2022 | 152 |
| Table 26.1. Estimated budget for the recommended PFS | 153 |
Figures
| Figure 2.1. Project Location Map | 12 |
| Figure 4.1. Project Location Plan | 17 |
| Figure 4.2. CR Reward LLC Controller Mineral Claims at Reward Project | 23 |
| Figure 4.3. Detail of Reward Claims and Proposed Infrastructure for the Core Area | 24 |
| Figure 7.1. Simplified Geology of the Bare Mountain Area | 34 |
| Figure 7.2. Simplified Geologic Map of Project Area | 35 |
| Figure 7.3. Local Geology Map | 36 |
| Figure 7.4. 3D Geological Schematic of the Main Rock Units and Faults | 37 |
| Figure 7.5. Lower Portion of the Bare Mountains Complex Stratigraphic Column Observed at the Project | 39 |
| Figure 7.6. 3500N Geology Cross-Section | 42 |
| Figure 7.7. Photo Highlighting Vein Orientation in Outcrop | 43 |
| Figure 7.8. Gold Mineralization at Reward Intersected by Drilling | 46 |
| Figure 7.9. Mineralization along Section 5600 N Looking North | 47 |
| Figure 7.10. Mineralization along Section 4200 N Looking North | 48 |
| Figure 7.11. Mineralization along Section 4800 N, Looking North | 48 |
| Figure 7.12. Mineralization along Section 2900 N Looking North | 49 |
| Figure 9.1. Plan View of the Project Area Showing the Locations of the IP/Resistivity Survey Lines | 52 |
| Figure 10.1. Reward Drill Hole Locations | 54 |
| Figure 11.1. CR Reward Sample Flow Chart | 65 |
| Figure 11.2. Blank Results from 2017-2018 Drilling Sorted by Date Analyzed | 66 |
| Figure 11.3. CDN-GS-P6B Results from 2017-2018 Program Sorted by Date Analyzed | 68 |
| Figure 11.4. CDN-GS-2L Results from 2017-2018 Program Sorted by Date Analyzed | 68 |
| Figure 11.5. Duplicate Results from the 2017-2018 Program | 69 |
| Figure 12.1. Drill hole CRR17-009, Wood Canyon Formation Mineralized Interval of Phyllite and Oxidized Quartzite | 75 |
| Figure 12.2. Drill hole CRR18-014, Wood Canyon Formation Mineralized Interval of Brecciated/Re-healed Quartzite and Sheared and Foliated Phyllite | 76 |
| Figure 12.3. Drill Hole CRR18-024, Wood Canyon Formation Mineralized Interval of Quartzite | 77 |
| Figure 13.1. 1998 10 Mesh Bottle Roll Recovery Curves | 81 |
| Figure 13.2. 2008 McClelland Drill Hole Location Map | 82 |
| Figure 13.3. 2008 McClelland 10 Gold Recovery Curves – Column Tests | 83 |
| Figure 13.4. 2008 McClelland Bottle Roll Tests Recovery Curves – Splits from Column Tests | 83 |
| Effective Date: May 31st, 2022 | | vi |
Technical Report - Mineral Resource Estimate Reward Project, Nye County, Nevada, USA
| Figure 13.5. 2008 McClelland Bottle Roll Size versus Gold Recovery – Composite 5 | 85 |
| Figure 13.6. 2018 KCA Metallurgical Sample Drill Hole Location Map | 87 |
| Figure 13.7. 2018 KCA Bottle Roll Test Results | 91 |
| Figure 13.8. KCA 2018 Column Leach Curves – Carbon Assays | 97 |
| Figure 13.9. KCA 2018 Column Leach Curves – Tonnes Solution per Tonne Ore | 99 |
| Figure 13.10. Size versus Recovery – 2018 KCA and 2008 McClelland Test Data | 100 |
| Figure 14.1. Mineral Resource Estimate Mineralized Domain Outlines | 104 |
| Figure 14.2. Histogram of the Raw Gold Assay Values of Sample Intervals Flagged within the Good Hope and Gold Ace Estimation Domains | 106 |
| Figure 14.3. Cumulative Frequency Plot of Raw Gold Assay Values of Sample Intervals Flagged within the Good Hope Zone Estimation Domains | 106 |
| Figure 14.4. Cumulative Frequency Plot of Raw Gold Assay Values of Sample Intervals Flagged within the Gold Ace Estimation Domain | 107 |
| Figure 14.5. Orthogonal View of LGand HG Estimation Domains, Good Hope Deposit | 109 |
| Figure 14.6. Orthogonal View of the LG Estimation Domain, Gold Ace Zone | 110 |
| Figure 14.7. Histogram of Sample Lengths within Estimation Domains for both the Good Hope and Gold Ace Zones | 111 |
| Figure 14.8. Remnant Analysis Illustrating the Gold Distribution of Calculated Composite within the Good Hope Deposit | 112 |
| Figure 14.9. Orphan Analysis Illustrating the Gold Distribution of Calculated Composite within the Gold Ace Zone | 113 |
| Figure 14.10. Probability Plot of the Composited Gold Grade at the Good Hope Zone before Capping | 114 |
| Figure 14.11. Cumulative Frequency Plots of the Composited and Capped Gold Grade within the Good Hope Zone Estimation Domains | 114 |
| Figure 14.12. Probability Plot of the Composited Gold Grade at the Gold Ace Zone before Capping | 115 |
| Figure 14.13. Cumulative Frequency Plot of the Composited and Capped Gold Grade within Gold Ace Zone Estimation Domain | 115 |
| Figure 14.14. Calculated and Modelled Semi-Variogram of Gold within the Good Hope Zone. Dip Direction and Dip for each Principle Direction is in each Subplot Title | 117 |
| Figure 14.15. Calculated and Modelled Semi-Variogram of Gold within the Gold Ace Zone. Dip Direction and Dip for each Principle Direction is in each Subplot Title | 118 |
| Figure 14.16. Bulk Density Box Plots, Good Hope Deposit | 119 |
| Figure 14.17. Bulk Density Scatter Plots Showing 3D Solids vs. Gold Grade, Good Hope Deposit | 120 |
| Figure 14.18. Bulk Density Box Plots, Gold Ace Zone | 121 |
| Figure 14.19. Bulk Density Scatter Plots Showing 3D Solids vs. Gold Grade, Gold Ace Zone | 121 |
| Figure 14.20. Cumulative Frequency Plot Illustrating the Distance from each Block Centroid to the nearest Composite Sample within the Good Hope Zone | 122 |
| Figure 14.21. Cumulative Frequency Plot Illustrating the Distance from each Block Centroid to the nearest Composite Sample within the Gold Ace Zone | 123 |
| Effective Date: May 31st, 2022 | | vii |
Technical Report - Mineral Resource Estimate Reward Project, Nye County, Nevada, USA
| Figure 14.22. Gold Grade Contact Plot Analysis, Good Hope LG and HG Grade Domain Contacts | 126 |
| Figure 14.23. Contact Plot Analysis, Good Hope Grade and Waste Domain Contacts | 127 |
| Figure 14.24. Contact Analysis, Gold Ace Grade and Waste Domain Contacts | 127 |
| Figure 14.25. Cross-Section 6000N, Showing Block Gold Estimates at the Good Hope Deposit | 128 |
| Figure 14.26. Cross-Section 4800N, Showing Block Gold Estimates at the Good Hope Deposit | 129 |
| Figure 14.27. Cross-Section 4100N, Showing Block Gold Estimates at the Good Hope Deposit | 129 |
| Figure 14.28. Cross-Section 2700N, Showing Block Gold Estimates at the Gold Ace Deposit | 130 |
| Figure 14.29. Swath Plots Showing Composite versus Estimated Gold Grade, Good Hope | 131 |
| Figure 14.30. Swath Plots Showing Composite versus Estimated, Gold Grade Gold Ace | 132 |
| Figure 14.31. Volume Variance Check, Good Hope | 133 |
| Figure 14.32. Volume Variance Check, Gold Ace | 134 |
| Figure 14.33. Contact Analysis, Good Hope Grade and Waste Domain Boundary | 135 |
| Figure 14.34. Contact Analysis, Gold Ace Grade and Waste Domain Boundary | 135 |
| Figure 23.1. Adjacent Properties | 146 |
| Effective Date: May 31st, 2022 | | viii |
Technical Report - Mineral Resource Estimate Reward Project, Nye County, Nevada, USA
| 1 | Summary |
| 1.1 | Issuer and Purpose |
This Technical Report (the Technical Report) was prepared by APEX Geoscience Ltd. (APEX) and Kappes, Cassiday & Associates (KCA) for CR Reward LLC (CR Reward) and Augusta Gold Corp. (Augusta or the Company). Augusta is a publicly traded company listed on the Toronto Stock Exchange (TSX:G) in Canada and the OTCQB Venture Market (OTCQB:AUGG) in the United States of America (USA) focused on the exploration, advancement and development of gold properties in Nevada. CR Reward is a private Nevada limited liability company that is a wholly owned subsidiary of Augusta.
The Company engaged APEX in May, 2022 to complete an updated Mineral Resource Estimate (MRE) for the Reward Project under National Instrument 43-101 Standards of Disclosure for Mineral Projects (NI 43-101) and an Initial Assessment of Mineral Resources in accordance with Item 1300 of Regulation S-K under the United States Securities Exchange Act of 1934, as amended (SK 1300). The focus of this Technical Report is an updated MRE for the Reward Project (Reward or the Project), a gold exploration project situated in Nye County, Nevada (NV), USA. The Project is located 11.3 km (7 miles) to the southeast of the Company’s Bullfrog project within the Walker Lane Trend, a prolifically mineralized belt that is host to numerous gold deposits and current and past producing mines in south-central Nevada.
This Technical Report summarizes a NI 43-101 and SK 1300 updated MRE for the Project and provides a technical summary of the relevant location, tenure, historical and geological information, a summary of the recent exploration work conducted by CR Reward and recommendations for future exploration programs. This Technical Report summarizes the technical information available up to the effective date of May 31, 2022.
This Technical Report has been prepared in accordance with the Canadian Securities Administration’s (CSA’s) NI 43-101 and guidelines for technical reporting Canadian Institute of Mining, Metallurgy and Petroleum (CIM) “Best Practices and Reporting Guidelines” for disclosing mineral exploration and in accordance with the requirements of SK 1300. The mineral resource has been estimated using the CIM “Estimation of Mineral Resources and Mineral Reserves Best Practice Guidelines”, dated November 29, 2019, and the CIM “Definition Standards for Mineral Resources and Mineral Reserves”, amended and adopted May 10th, 2014 and in accordance with the requirements of SK 1300.
| 1.2 | Authors, Contributors and Site Inspection |
This Technical Report has been prepared by Mr. Michael B. Dufresne, M.Sc., P. Geol., P. Geo., of APEX and Mr. Timothy D. Scott, BA.Sc., RM SME, of KCA. Both authors are independent and not employed by either Augusta or CR Reward and are Qualified Persons (QPs) as defined in NI 43-101 and as defined under SK 1300. Contributors to this Technical Report include Mr. Warren Black, M.Sc., P.Geo. and Mr. Steven Nicholls, BA.Sc., MAIG, all of APEX and who are independent and not employed by either Augusta or CR Reward. Neither APEX or KCA are affiliated with Augusta or CR Reward. Under the direct supervision of Mr. Dufresne, Mr. Black prepared the resource estimation statistical analysis, three-dimensional modelling, block modelling and resource estimations presented in Section 14. Mr. Steven Nicholls, BA.Sc., MAIG, a QP, and APEX’s senior resource geologist performed an internal audit of the MRE presented in Section 14. Mr. Dufresne takes responsibility for the MRE reported herein.
| Effective Date: May 31st, 2022 | | 1 |
Technical Report - Mineral Resource Estimate Reward Project, Nye County, Nevada, USA
Mr. Dufresne has visited the Project on two separate occasions in 2017 and 2019. During the site inspections, Mr. Dufresne reviewed drill core and verified the location of a number of drill collars. As a result of the site inspections, Mr. Dufresne can verify the land position, the geological setting and the mineralization that is the subject of this Technical Report. Mr. Scott visited the Project on September 22, 2018 and on May 16, 2022.
| 1.3 | Project Setting |
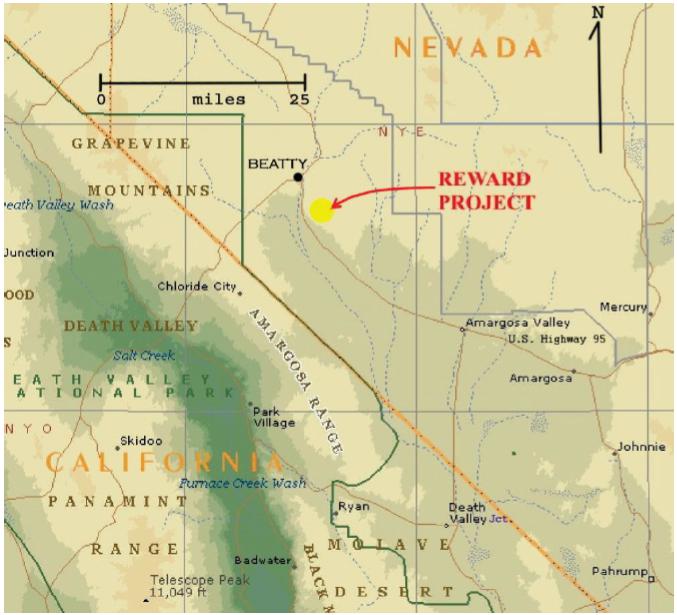
The Project is situated about 11.3 km (7 miles) south-southeast of the town of Beatty, NV about 3.2 km (2 miles) east of US Highway 95 in Nye County. The Project can be accessed from Beatty by paved road on Highway 95 followed by traveling two miles east on a gravel road. Several dirt roads diverge into various canyons of the Bare Mountains.
The Project is situated in the Amargosa Desert in southwestern Nevada on the southwestern flank of the Bare Mountains in the northern Amargosa Valley. The western flank of the Bare Mountains drains into the Amargosa Desert which is drained by the ephemeral Amargosa River. Beatty, on the Amargosa River, lies at 1,006 m (3,300 ft) elevation. Elevations in the Project area range from about 1,160 to 1,310 m (3,800 ft to 4,300 ft). Vegetation is sparse. The climate is typical of middle-elevation desert. Operations are planned to be conducted year-round.
The Project is currently serviced by an existing 14.4/24.9 kV power line owned and operated by Valley Electric. A water well provides water for exploration activities. Project employees will be recruited from the local area, including the communities of Beatty, Amargosa, and Pahrump, located within Nye County, and the regional urban centre of Las Vegas, located within Clark County.
The Project has sufficient land area, with adjacent public-domain lands also potentially available, to allow mine development, including space for the mining operations, waste rock disposal facilities (WRDs) and heap leach pads as envisaged in prior historical economic studies.
| 1.4 | Mineral Tenure, Surface Rights, Water Rights, Royalties and Agreements |
The Project area lies within Sections 1, 2, 3, 4, 9, 10, 11 and 16 of Township 13 South, Range 47 East and Sections 33, 34, and 35 of Township 12 South, Range 47 East, all referred to the Mount Diablo Baseline and Meridian.
| Effective Date: May 31st, 2022 | | 2 |
Technical Report - Mineral Resource Estimate Reward Project, Nye County, Nevada, USA
Canyon Resources Corporation (Canyon Resources) holds a 100% interest in the mineral claims that form the Project. In 2008, Canyon Resources assigned all of the patented and unpatented claims comprising the Project to an entity which was subsequently converted into CR Reward.
The Project encompasses 121 unpatented Bureau of Land Management (BLM) placer and lode mining claims and six patented placer mining claims, totalling approximately 2,333 net acres (944 hectares). Only the patented claims have been legally surveyed. Under United States mining law, claims may be renewed annually for an unlimited number of years upon a small payment per claim (currently $155 per claim due to the BLM and an aggregate $1,502 due to Nye County) and the same claim status—whether lode or placer—may be used for exploration or exploitation of the lodes or placers.
Several blocks of unpatented claims are leased by CR Reward from underlying owners, and are referred to as Connolly, Webster, Orser–McFall and Van Meeteren leases. These have the following royalties payable:
| • | A 3% Net Smelter Return (NSR) royalty is payable on any minerals mined from the Connolly Claims, but is reduced to 2% as CR Reward only owns a two-third interest in the Connolly Claims. Annual advance minimum royalty payments are payable under the Connolly Lease in an amount equal to $10,000/year. |
| • | A 3% NSR royalty is payable on any minerals mined from the Webster Claims but is (i) reduced to 1% on the Sunshine and Reward claims as the lessee only owns a one-third interest, and (ii) reduced to 1.5% on the Good Hope claim as CR Reward only owns a half interest in this claim. Annual advance minimum royalty payments are payable under the Webster Lease in an amount equal to $7,500/ year. |
| • | A 3% NSR royalty is payable on minerals mined from the Orser–McFall Claims but is reduced to 1.5% on the Good Hope claim as the lessee only owns a half interest in that claim. Annual advance minimum royalty payments are payable under the Orser–McFall Lease in an amount equal to $20,000/year. |
| • | A 3% NSR royalty is payable on minerals mined from the Van Meeteren Claims. Annual advance minimum royalty payments are payable under the Van Meeteren Lease in an amount equal to $15/acre from 2011 through 2020, for a total of $1,800/year, and $20/acre from and after 2021, for a total of $2,400/year. |
The Project area mainly consists of Federal public domain lands administered by the BLM. There are no State or private tracts within the Project area, except the six patented claims owned by CR Reward, all of which carry surface and mineral rights ownership.
The Project is not subject to any other back-in rights payments, agreements or encumbrances.
| Effective Date: May 31st, 2022 | | 3 |
Technical Report - Mineral Resource Estimate Reward Project, Nye County, Nevada, USA
Water rights have been obtained through a Water Lease agreement with Barrick Gold Corp’s (Barrick) Bullfrog mining operations. Under the Water Lease, CR Reward has the right to use 317.39 acre-ft of water annually under Application No. 61412, Certificate No. 16384 and Permit No. 76390 in exchange for paying Barrick USD$150.00/acre-ft of water per year for water actually pumped.
To the extent known to the QPs, there are no other significant factors and risks that may affect access, title, or the right or ability to perform work on the Project that have not been discussed in this Report.
| 1.5 | Geology and Mineralization |
Mineralization in the Good Hope Deposit and Golden Ace Zone can be classified as examples of a structurally controlled, locally disseminated, sediment hosted, mesothermal quartz vein gold deposit.
The Project is hosted within the Bare Mountain Complex which lies within an intricate tectonic setting of the Nevada Basin and Range Province.
The Bare Mountain Complex consist of up to 6,096 m (20,000 ft) of Upper Proterozoic to Paleozoic marine sedimentary rocks in the lower plate that have been juxtaposed against Miocene silicic volcanic sequences in the upper plate. The lower plate units were deformed through folding, thrust faulting, low and high angle normal faulting during a Mesozoic compression event, and have been metamorphosed from lower amphibolite to sub-greenschist grade. Two dominant normal fault sets have been mapped in the lower plate, including the moderately east-dipping Bare Mountain and Gold Ace faults, and shallowly southeast-dipping faults that cut or curve into east-dipping faults.
The Project is located on the southwestern flank of the Bare Mountain Complex and is underlain by moderately-deformed marine clastic and carbonate rocks of Late Proterozoic and Late Cambrian age that have been metamorphosed to greenschist grade. Tertiary and younger alluvium cover the lower slopes and the adjacent Armagosa Valley to the south and west. The east-dipping Gold Ace fault, locally termed the Good Hope fault zone, separates northeast dipping Late Proterozoic to Early Cambrian units in the footwall block from Middle to Late Cambrian units in the hanging wall block.
The gold mineralization in the Good Hope Deposit is spatially associated with, and along, the Good Hope fault zone, and is primarily hosted in altered and veined Wood Canyon Formation, and to a lesser extent, in the Juhl and Sutton Members of the Stirling Formation. Mineralization hosted along the contact between the Sutton and Morris Marble Members of the Stirling Formation is referred to as the Gold Ace Zone. Although there are small historic prospects along the Good Hope fault zone, most of the historic production came from the Gold Ace Zone.
| Effective Date: May 31st, 2022 | | 4 |
Technical Report - Mineral Resource Estimate Reward Project, Nye County, Nevada, USA
| 1.6 | History |
Historical exploration of the Project was completed by several other companies from 1976 to 2004, including Galli Exploration Associates (Galli Exploration), Teco Inc. (Teco), St. Joe Minerals Corporation (St Joe), Gexa Gold Corp (Gexa), Cloverleaf Gold Inc. (Cloverleaf), Homestake Mining Company (Homestake), Pathfinder Gold Corporation (Pathfinder), Bond Gold Exploration Inc. (Bond Gold), Barrick, US Nevada Gold Search (USNGS), Rayrock Mines, Inc (Rayrock), Glamis Gold, Ltd. (Glamis Gold), and Marigold Mining Company (Marigold Mining). Historical exploration included airborne geophysics, reverse circulation (RC) and core drilling, initial metallurgical testwork, mineral resource estimates and technical studies.
Canyon Resources acquired the Project in 2004, and together with Atna Resources Ltd. (Atna) and CR Reward, have completed data compilation and validation, ground induced polarization/resistivity geophysical surveys, RC and core drilling, mineral resource and mineral reserve estimates, metallurgical testwork, permitting studies, environmental baseline studies, and technical studies. The following permits and authorizations were granted to CR Reward in 2007:
| • | Plan of Operations authorized under N-82840. |
| • | Water Pollution Control Permit (WPCP); WPCP NEV2007101. |
| • | General construction permit; NVR100000 CSW-17415. |
| • | Water rights permitted by Nevada Division of Water Resources (NDWR) under Mining, Milling, & Domestic permit 76390. |
| • | Mining reclamation permit granted by the Bureau of Mining Regulation and Reclamation (BMRR) under mine site permit #0300. |
| • | Nevada Bureau of Air Pollution Control (BAPC) authorized Class II Air Quality permit AP1041-2492. |
| 1.7 | Drilling and Sampling |
A total of 376 drill holes, totalling 43,729.7 m (143,470 ft) have been completed at the Project between 1987 and 2018. Of this total, 35 are core holes totalling 4,094.4 m (13,433 ft) and 341 are RC holes totalling 39,635.3 m (130,037 ft).
For CR Reward’s 2017–2018 drill program, drill hole locations were established using hand-held global positioning system (GPS) instruments and upon completion of the program, the collar locations were re-surveyed by a licensed surveyor. Down-hole surveys were completed at regular intervals, usually 7.6 m (25 ft), using an EZ-Shot system that records the magnetic heading, dip of the hole and magnetic field in the hole. A total of 398 measurements were collected for the 28 holes drilled in 2017–2018. Core recovery during the core drilling was very good, exceeding 95% on average, with losses mainly in highly shattered zones.
| Effective Date: May 31st, 2022 | | 5 |
Technical Report - Mineral Resource Estimate Reward Project, Nye County, Nevada, USA
There is limited documentation available detailing the sample preparation, analyses and security of historical drill sampling programs conducted from 1987 to 2000 by Homestake, Gexa, Pathfinder, Cloverleaf, USNGS and Barrick. RC drill holes completed in 2006–2007 were sampled on 1.5 m (5 ft) intervals, and cores on 0.9 m (3 ft) intervals. The 2011–2013 RC holes were also sampled at 1.5 m (5 ft) intervals.
Independent assay laboratories were used in the 2006-2007 Canyon Resources, the 2011-2013 Atna and 2017-2018 CR Reward programs, including ALS Chemex Laboratory in Sparks, Nevada (certified to ISO 9001:2000 for selected techniques), Inspectorate America Corporation (Inspectorate) in Sparks, Nevada (certified to ISO 9001:2000 for selected techniques), Florin Analytical Services (FAS) in Reno, Nevada (not certified).
The 2006–2007, 2011-2013 and the CR Reward 2017-2018 drilling programs included the submission of standard and blank materials as part of the Quality Assurance and Quality Control (QA/QC) program. Assay control protocols during these modern periods of drilling included the insertion of certified standards, blanks and duplicates at acceptable insertion rates for all of the data.
The sample collection, security, transportation, preparation, insertion of geochemical standards and blanks, and analytical procedures are within industry norms and best practices. The procedures used by CR Reward personnel are considered adequate to ensure that the results disclosed are accurate within scientific limitations and are not misleading. The procedures and assay control protocols employed by CR Reward in the 2017–2018 drill program are considered reasonable and acceptable for use in Mineral Resource estimation.
| 1.8 | Data Verification |
Keith Fowlow of CR Reward performed a comprehensive data verification program in 2017 consisting of collar and down-hole survey checks, and evaluation of assay values versus laboratory certificates or geologic logs where certificates were not available. Errors identified were corrected where applicable. For non-analytical drill hole information, CR Reward employed a protocol of continuous data checking to ensure accurate data transcription, including collar and down hole surveys, and geological and geotechnical information. The procedures employed are considered reasonable and are adequate with respect to ensuring data integrity.
Mr. Dufresne reviewed all aspects of the Reward drill hole database and available non-analytical procedures for historical and the CR Reward 2017–2018 drilling programs including the verification program by Mr. Fowlow. The drill hole database was validated using Micromine 2018 and was inspected visually in Excel files and on drill section. Mr. Dufresne has reviewed the adequacy of the exploration information and the visual, physical and geological characteristics of the Project and has found no significant issues or inconsistencies that would cause one to question the validity of the data. Mr. Dufresne, the QP, considers the CR Reward drill hole database, including the historical pre-2017 data and the 2017 to 2018 data, well validated and suitable for the preparation of the MRE presented in Section 14 of this Technical Report.
| Effective Date: May 31st, 2022 | | 6 |
| Technical Report - Mineral Resource Estimate Reward Project, Nye County, Nevada, USA |
| 1.9 | Metallurgical Testing |
Metallurgical test work on the Project includes historical work completed by Rayrock Mines Inc. during 1998 and McClellend in 2007 and 2008 with confirmatory test work being performed by KCA in 2018. Metallurgical test work completed to date includes 34 bottle roll tests and 21 column tests along together with preliminary agglomeration and compacted permeability testing. Results from these tests show that the mineralization is amenable to cyanide leaching with reasonable reagent consumptions.
Metallurgical samples from historical and recent KCA test programs appear to be spatially representative for the Good Hope Deposit. Results from KCA’s 2018 test program confirmed the results from the 2007–2008 McClelland campaign with an average laboratory gold recovery of 81% for the Good Hope Deposit. The program also included bottle roll and duplicate column leach tests on the Gold Ace Zone. Results for Gold Ace show significantly lower column recoveries compared to the Good Hope Deposit.
Key design parameters from the metallurgical test work for the Good Hope Deposit include:
| • | Crush size P80 of ¼ inch. |
| • | Estimated field gold recovery of 79% including a 2% field deduction. Based on column tests, it is possible additional ounces may be realized during secondary leaching of ore from leaching upper lifts and during heap rinsing as it appears most columns were still slowly leaching at the termination of the columns. |
| • | Design leach cycle of 125 days. |
| • | Average field sodium cyanide consumption of 0.73 lb/st ore. |
| • | Average field lime consumption of 1.53 lb/st of material based on 100% CaO purity. |
| • | Cement agglomeration is not required up to heap heights of 262 ft. |
No deleterious elements are known from the processing perspective.
| 1.10 | Current Mineral Resource |
This Technical Report details an updated mineral resource estimate (MRE) for the Reward Project. The 2022 MRE for Reward was completed by Mr. Warren Black, M.Sc., P.Geo., of APEX under the direct supervision of Mr. Dufresne, M.Sc., P.Geol., P.Geo. and the QP who takes responsibility for the MRE contained herein. Mr. Steven Nicholls, BA.Sc., MAIG, a QP and APEX’s senior resource geologist performed an internal audit of the MRE in Section 14.
| Effective Date: May 31st, 2022 | | 7 |
| Technical Report - Mineral Resource Estimate Reward Project, Nye County, Nevada, USA |
CR Reward and Augusta provided APEX with a drill hole database that consisted of analytical, geological, density, and collar survey information, initial estimation domains for the Good Hope Deposit and Gold Ace Zone, and a geological model that contained a stratigraphic and structural 3D interpretation. A block model size of 20 ft (X) by 20 ft (Y) by 20 ft (Z) was used for the gold estimation.
The assay data was examined using a combination of histograms, cumulative frequency plots, and summary statistics; this indicated gold samples generally exhibited a single assay population. Samples were composited to 10 ft lengths. Probability plots were used to evaluate grade statistics and determine whether capping was warranted. A capping level of 0.292 oz/st (10.01 grams per tonne [g/t]) Au was applied to samples in the Good Hope Deposit, and a cap level of 0.146 oz/st (5.01 g/t) Au to samples in the Gold Ace Zone. Semi-variograms for gold were modelled using the 10 ft composites flagged within the estimation domains. A bulk density of 2.59 g/cm3 was applied to all blocks in the Good Hope Deposit. As there is evidence for the need for a higher bulk density value for blocks flagged within the Morris Member in the Good Ace Zone, they were assigned a value of 2.70 g/cm3. However, as there is an insufficient number of bulk density measurements of the Sutton Member within the Gold Ace estimation domain, all other blocks at the Gold Ace Zone were assigned a bulk density of 2.59 g/cm3.
Ordinary kriging (OK) was used to estimate gold grades for those blocks that contained more than 1.56% mineralized material by volume. A block discretization of 2 (X) by 2 (Y) by 2 (Z) was applied to all blocks during estimation. A two-pass method was used. The first pass required a minimum of two drill holes, a maximum of 15 composites and no more than three composites from any one drill hole. Soft boundaries were used between the high and low-grade domains in the Good Hope Deposit, and mineralization and waste in the Good Hope Deposit and the Gold Ace Zone.
Estimation validation included visual inspection in plan view and in cross-section, examination of swath plots, review of mineralization/waste contact profiles and volume-variance effects. The estimate was found to be reasonable.
Mineral Resources were classified using a combination of assessment of geological confidence, data quality and grade continuity. Resource classification was determined using a three-pass strategy, where Measured was classified in the first run, Indicated in the second, and Inferred in the third run. A small portion of blocks at the northern (>6500 N) and southern (<2750 N) extents of the Good Hope Deposit were manually adjusted to Inferred as there is insufficient drilling density in the QP’s opinion to justify higher confidence classifications.
| Effective Date: May 31st, 2022 | | 8 |
| Technical Report - Mineral Resource Estimate Reward Project, Nye County, Nevada, USA |
Reasonable prospects of eventual economic extraction were considered by constraining the estimate within a conceptual pit shell that used the assumptions in Table 1.1.
Table 1.1. Reward Conceptual Open Pit Parameters.
| Parameter | Unit (Imperial) | Cost (Imperial) | Unit (Metric) | Cost (Metric) |
| Gold Price | US$/oz | 1,700 | US$/g | 54.656 |
| Gold Metallurgical Recovery | % | 80 | % | 80 |
| Pit Wall Angles | ° | 48-58 | ° | 48-58 |
| Mining Cost | US$/st | 2.00 | US$/tonne | 2.20 |
| Processing Rate | Mst/a | 3 | Mtonne/a | 2.7 |
| Processing Cost | US$/st | $5.50 | US$/tonne | $6.06 |
| G & A Cost | US$/st | 0.75 | US$/tonne | 0.80 |
| Cut-off Grade (break even) | oz/st | 0.0047 | g/tonne | 0.158 |
| Royalty | % | 3 | % | 3 |
The MRE for the Reward Project is presented in Table 1.2 below.
Table 1.2. Reward Project Mineral Resource Estimate at May 31, 2022 Based on USD$1,700/oz. Au
| Classification | Tonnage (Mt) | Average Grade (g/t) | Contained Au (koz) |
| Good Hope | |||
|
Measured Indicated M&I Total |
6.19 10.76 16.94 |
0.86 0.69 0.75 |
169.9 240.0 409.9 |
| Inferred | 0.29 | 0.56 | 5.3 |
| Gold Ace | |||
|
Indicated Inferred |
0.83 1.03 |
0.63 0.73 |
16.8 21.8 |
| Reward (Combined Good Hope and Gold Ace) | |||
|
Measured Indicated M&I Total |
6.19 11.58 17.77 |
0.86 0.69 0.75 |
169.9 256.8 426.7 |
| Inferred | 1.23 | 0.68 | 27.1 |
Notes:
| 1. | Oxide estimated Mineral Resources are reported within a pit shell using the Lerch Grossman algorithm, a gold price of US$1,700/oz and a recovery of 80% for Au were utilized. |
| 2. | Mining costs for mineralized material and waste are US$2.20/tonne. |
| 3. | Processing and general and administration are US$6.06/tonne and US$0.83/tonne per tonne processed, respectively. |
| 4. | Due to rounding, some columns or rows may not compute as shown. |
| 5. | Estimated Mineral Resources are stated as in situ dry metric tonnes and are partially diluted. |
| 6. | The estimate of Mineral Resources may be materially affected by legal, title, taxation, socio-political, marketing, or other relevant issues. |
| 7. | The effective date of the Reward mineral resource estimate is May 31, 2022. |
| Effective Date: May 31st, 2022 | | 9 |
| Technical Report - Mineral Resource Estimate Reward Project, Nye County, Nevada, USA |
| 1.11 | Conclusions |
Based upon a review of available information, historical and recent exploration data, the authors site visits and the current MRE for the Good Hope Deposit and Gold Ace Zone of the Reward Project, the authors view the Project as a property of merit prospective for the additional discovery, and future development, of potentially economic structurally-controlled, locally-disseminated, sediment-hosted, mesothermal quartz vein gold mineralization. This contention is supported by the following:
| • | The favourable geological setting of the Reward Project and its position within the Walker Land Trend, a prolifically mineralized belt that is host to numerous gold deposits and current and past producing mines in south-central Nevada. |
| • | Historical exploration and recent work by CR Reward has delineated a large zone of gold mineralization at Good Hope and Gold Ace and led to the calculation of the current MRE. |
| • | Recent metallurgical testwork indicates projected gold recoveries of 81% for the Good Hope Deposit. |
| 1.12 | Recommendations |
Based on the outcomes of this report and prior work conducted by CR Reward, it is recommended that CR Reward and Augusta proceed to a Preliminary Feasibility Study (PFS) for the Reward Project in order to examine opportunities to develop the Project. The PFS will be an update to a historical internal Feasibility Study (FS) prepared in 2019 on behalf of CR Reward and Waterton. The recommended PFS will incorporate current pricing for major equipment, contract mining costs, construction costs, major consumables, and labor costs.
The budget for completing a PFS for the Project is USD$1,100,000, including contingency, as summarized in Table 1.3 below.
Table 1.3. Estimated budget for the recommended PFS.
| Item | Cost USD$ |
| Primary Engineer, includes Process and Infrastructure | 420,000 |
| Mineral Resource Estimate | 20,000 |
| Mining and Mineral Reserve | 40,000 |
| Geotechnical and Earthworks | 110,000 |
| Power and Other Consulting | 400,000 |
| Contingency | 110,000 |
| Total | 1,100,000 |
| Effective Date: May 31st, 2022 | | 10 |
| Technical Report - Mineral Resource Estimate Reward Project, Nye County, Nevada, USA |
| 2 | Introduction |
| 2.1 | Issuer and Purpose |
This Technical Report (the Technical Report) was prepared by APEX Geoscience Ltd. (APEX) and Kappes, Cassiday & Associates (KCA) for CR Reward LLC (CR Reward) and Augusta Gold Corp. (Augusta or the Company). Augusta is a publicly traded company listed on the Toronto Stock Exchange (TSX:G) in Canada and the OTCQB Venture Market (OTCQB:AUGG) in the United States of America (USA) focused on the exploration, advancement and development of gold properties in Nevada. CR Reward is a private Nevada limited liability company that is a wholly owned subsidiary of Augusta.
On June 13, 2022, Augusta acquired the Reward Project (Reward or the Project), from Waterton Nevada Splitter LLC (Waterton) by the purchase of CR Reward.
The Reward Project is considered to be an intermediate stage exploration project within a favourable geological setting, situated within the Walker Lane Trend, a prolifically mineralized belt this is host to numerous gold deposits and current and past producing mines in south-central Nevada. The Project is situated approximately 11.3 km (7 miles) south-southeast of the town of Beatty, NV, approximately 3.2 km (2 miles) east of US Highway 95 in Nye County (Figure 2.1). The Project encompasses 121 unpatented Bureau of Land Management (BLM) placer and lode mining claims and six patented placer mining claims, totalling approximately 2,333 net acres (944 hectares).
This Technical Report summarizes a National Instrument 43-101 Standards of Disclosure for Mineral Projects (NI 43-101) and Item 1300 of Regulation S-K of the United States Securities Exchange Act of 1934, as amended (SK 1300) mineral resource estimation for the Reward Project and provides a technical summary of the relevant location, tenure, historical and geological information, a summary of the recent exploration work and recommendations for future exploration programs. This Technical Report summarizes the technical information available up to the effective date of May 31st, 2022.
This Technical Report has been prepared in accordance with the Canadian Securities Administration’s (CSA) NI 43-101 and guidelines for technical reporting Canadian Institute of Mining, Metallurgy and Petroleum (CIM) “Best Practices and Reporting Guidelines” for disclosing mineral exploration and in accordance with the requirements of SK 1300. The mineral resource has been estimated using the CIM “Estimation of Mineral Resources and Mineral Reserves Best Practice Guidelines” dated November 29, 2019, and the CIM “Definition Standards for Mineral Resources and Mineral Reserves” amended and adopted May 10th, 2014 and in accordance with the requirements of SK 1300.
| Effective Date: May 31st, 2022 | | 11 |
| Technical Report - Mineral Resource Estimate Reward Project, Nye County, Nevada, USA |
Figure 2.1. Project Location Map (Lycopodium, 2019).
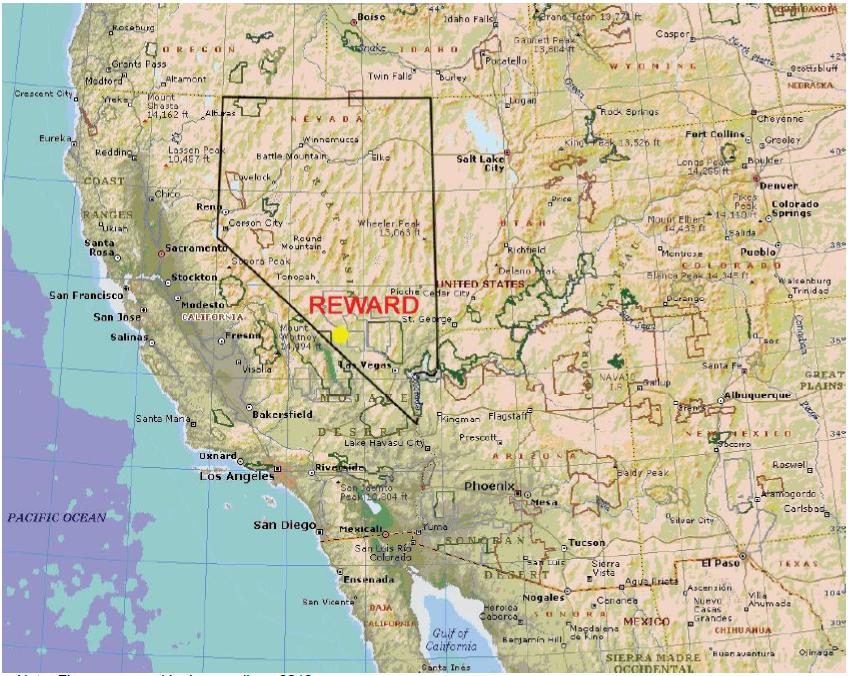
Note: Figure prepared by Lycopodium, 2019.
| 2.2 | Authors, Contributors and Site Inspection |
This Technical Report has been prepared by Mr. Michael B. Dufresne, M.Sc., P. Geol., P. Geo., of APEX and Mr. Timothy D. Scott, RM SME, of KCA. Both authors are independent and not employed by either Augusta or CR Reward and are Qualified Persons (QPs) as defined in NI 43-101 and SK 1300. The CIM and NI 43-101 defines a QP as “an individual who is a geoscientist with at least five years of experience in mineral exploration, mine development or operation or mineral project assessment, or any combination of these; has experience relevant to the subject matter of the mineral project and the technical report; and is a member or licensee in good standing of a professional association.” SK 1300 defines a QP as “an individual who is (1) a mineral industry professional with at least five years of relevant experience in the type of mineralization and type of deposit under consideration and in the specific type of activity that person is undertaking on behalf of the registrant; and (2) an eligible member or licensee in good standing of a recognized professional organization at the time the technical report is prepared.”
| Effective Date: May 31st, 2022 | | 12 |
| Technical Report - Mineral Resource Estimate Reward Project, Nye County, Nevada, USA |
Mr. Dufresne, M.Sc., P.Geol., P.Geo. takes responsibility for the preparation and publication of Sections 1.1 to 1.8, 1.10 to 12, 14 to 25.4, 25.6 and 25.8 to 27 and is co-responsible for section 25.7 of this Technical Report. Mr. Dufresne is a Professional Geologist with the Association of Professional Engineers and Geoscientists of Alberta (APEGA; membership number 48439), a Professional Geoscientist with the Association of Professional Engineers and Geoscientists of British Columbia (EGBC; membership number 37074) and has worked as a mineral exploration geologist for more than 35 years since his graduation from university. Mr. Dufresne has been involved in all aspects of mineral exploration and mineral resource estimations for precious and base metal mineral projects and deposits in Canada and internationally, including structurally-controlled, locally-disseminated, sediment-hosted, quartz vein gold mineralization in Nevada.
Mr. Timothy Scott, BA.Sc. Geological Engineering, takes responsibility for Sections 1.9, 13, 25.5 and is co-responsible for section 25.7 of this Technical Report. Mr. Scott visited the Project on September 22nd, 2018 and on May 16th, 2022. He inspected the access and associated infrastructure. Mr. Scott has worked for 35 years in all aspects of mineral processing and gold extraction; heap leaching; and design and construction of mineral processing and metals extraction facilities. He has held management positions at major mining companies as well as led the design, construction, and commissioning teams for the construction of five operating mines.
Contributors to this Technical Report include Mr. Warren Black, M.Sc., P.Geo. and Mr. Steven Nicholls, BA.Sc., MAIG, of APEX. Under the direct supervision of Mr. Dufresne, Mr. Black prepared the resource estimation statistical analysis, three-dimensional modelling, block modelling and resource estimations presented in Section 14. Mr. Black has a research background in the use of multivariate simulation for probabilistic mineral prospectivity modelling and has experience with exploration for precious and base metal deposits of various deposit types in North America. Mr. Steven Nicholls, BA.Sc., MAIG, QP, conducted a thorough audit of the Mineral Resource Estimate (MRE) and Section 14. Mr. Nicholls is a QP, as defined in NI 43-101 and SK 1300, and has worked as a geologist for more than 20 years since his graduation from university. Mr. Nicholls is APEX’s senior resource geologist and has extensive experience with exploration/resource estimation for, and the evaluation of, gold deposits of various types, including sediment-hosted mineralization.
Mr. Dufresne has visited the Project for data verification purposes on two separate occasions in 2017 and 2019. On August 2, 2017, Mr. Dufresne visited the Property and reviewed drill core at CR Reward’s office in Reno, NV. On August 12, 2019, Mr. Dufresne visited the Property and verified the location of a number of drill collars. On August 15, 2019, Mr. Dufresne performed an inspection of the Lovelock, NV, core facility and reviewed Reward Project drill core from the 2017-2018 drill program. No material field based exploration work has occurred at the Reward Project since the 2017-2018 drill program. Therefore, Mr. Dufresne considers the most recent site visit as current. As a result of the site visits, Mr. Dufresne can verify the land position, the geological setting and the mineralization that is the subject of this Technical Report.
| Effective Date: May 31st, 2022 | | 13 |
| Technical Report - Mineral Resource Estimate Reward Project, Nye County, Nevada, USA |
| 2.3 | Sources of Information |
This Technical Report is largely based on sections derived from the 2019 Feasibility Study titled, “Reward Project Feasibility Study Report, Nevada, USA”, prepared for CR Reward by Lycopodium Minerals Canada Ltd. (Lycopodium; Lycopodium, 2019) and the 2019 Feasibility Study Technical Report titled, “Reward Project Feasibility Study, NI 43-101 Technical Report Nevada, USA,” prepared by Lycopodium and co-authored by Mr. Dufresne and Mr. Scott (Evans et al., 2019).
Additional sources of information are listed in Section 27, References. The sources of information and data used in this Technical Report are based on the compilation of proprietary and publicly available geological and geochemical data. The authors have deemed these reports, data, and information as valid contributions to the best of their knowledge.
Based on the site visits and review of the available literature and data, the authors take responsibility for the information herein.
| 2.4 | Units of Measure |
With respect to units of measure, unless otherwise stated, this Technical Report uses:
| • | Abbreviated shorthand consistent with the International System of Units (International Bureau of Weights and Measures, 2006). |
| • | ‘Bulk’ weight is presented in both United States short tons (“tons”; 2,000 lbs or 907.2 kg) and metric tonnes (“tonnes”; 1,000 kg or 2,204.6 lbs.). |
| • | Assay and analytical results for precious metals are quoted in parts per million (“ppm”), parts per billion (“ppb”), ounces per short ton (“opt” or ozt/st), where “ounces” refers to “troy ounces” and “ton” means “short ton”. Where ppm (also commonly referred to as grams per metric tonne [g/t]) have been converted to opt (or ozt/st), a conversion factor of 0.029166 (or 34.2857) was used. |
| • | Geographic coordinates are projected in the Universal Transverse Mercator (“UTM”) system relative to Zone 11 of the North American Datum (“NAD”) 1983. and, |
| • | Currency in United States dollars (USD$), unless otherwise specified (e.g., Canadian, CAD$. |
| Effective Date: May 31st, 2022 | | 14 |
| Technical Report - Mineral Resource Estimate Reward Project, Nye County, Nevada, USA |
| 3 | Reliance on Other Experts |
The authors are not qualified to provide an opinion or comment on issues related to legal agreements, royalties, permitting and environmental matters. Accordingly, the authors of this Technical Report disclaim portions of the Technical Report particularly in Section 4, Property Description and Location.
The authors relied entirely on background information and details regarding CR Reward’s legal ownership (in Section 4.1) as provided in title reports prepared by CR Rewards legal counsel dated April 9-12, 2022 (Jensen, 2022a,b,c,d). Permitting as well as the legal and survey validation of the claims is not in the authors’ expertise and the QPs have relied on the Company’s representatives with respect to such information.
The authors have confirmed the claims are active and in good standing as of the Effective Date of this Report using the BLM’s MLRS register. The authors have no reason to question the validity or status of the mineral claims.
| 4 | Property Description and Location |
| 4.1 | Description and Location |
The Project is located in Nye County, Nevada, about seven miles south–southeast of the town of Beatty as shown in Figure 4.1. The Project area lies within Sections 1, 2, 3, 4, 9, 10, 11 and 16 of Township 13 South, Range 47 East, and Sections 33, 34, and 35 of Township 12 South, Range 47 East, all referred to the Mount Diablo Baseline and Meridian (CAM, 2012).
The Project is situated at an approximate latitude and longitude corresponding to 36° 50 minutes and 116° 42 minutes, respectively (CAM, 2012). The centre of the proposed open pit is located at 1,729,330 E, 13,375,050 N (UTM coordinates, NAD27, Zone 11, US feet).
The Project area falls within the USGS Carrara Canyon 1:24,000 scale topographic quadrangle map.
| 4.2 | Property and Title in Nevada |
| 4.2.1 | Mineral Title |
Information in this section is sourced from Papke and Davis (2019).
Federal (30 USC and 43 CFR) and Nevada (NRS 517) laws concerning mining claims on Federal land are based on an 1872 Federal law titled “An Act to Promote the Development of Mineral Resources of the United States.” Mining claim procedures still are based on this law, but the original scope of the law has been reduced by several legislative changes.
| Effective Date: May 31st, 2022 | | 15 |
| Technical Report - Mineral Resource Estimate Reward Project, Nye County, Nevada, USA |
The Mineral Leasing Act of 1920 (30 USC Chapter 3A) provided for leasing of some non-metallic materials; and the Multiple Mineral Development Act of 1954 (30 USC Chapter 12) allowed simultaneous use of public land for mining under the mining laws and for lease operation under the mineral leasing laws. Additionally, the Multiple Surface Use Act of 1955 (30 USC 611-615) made “common variety” materials non-locatable; the Geothermal Steam Act of 1970 (30 USC Chapter 23) provided for leasing of geothermal resources; and the Federal Land Policy and Management Act of 1976 (the BLM Organic Act, 43 USC Chapter 35) granted the Secretary of the Interior broad authority to manage public lands. Most details regarding procedures for locating claims on Federal lands have been left to individual states, providing that state laws do not conflict with Federal laws (30 USC 28; 43 CFR 3831.1).
Mineral deposits are located either by lode or placer claims (43 CFR 3840). The locator must decide whether a lode or placer claim should be used for a given material; the decision is not always easy but is critical. A lode claim is void if used to acquire a placer deposit, and a placer claim is void if used for a lode deposit. The 1872 Federal law requires a lode claim for “veins or lodes of quartz or other rock in place” (30 USC 26; 43 CFR 3841.1), and a placer claim for all “forms of deposit, excepting veins of quartz or other rock in place” (30 USC 35). The maximum size of a lode claim is 457 m (1,500 ft) in length and 183 m (600 ft) in width, whereas an individual or company can locate a placer claim as much as 8 hectares (20 acres) in area.
Claims may be patented or unpatented. A patented claim is a lode or placer claim or mill site for which a patent has been issued by the Federal Government, whereas an unpatented claim means a lode or placer claim, tunnel right or mill site located under the Federal (30 USC) act, for which a patent has not been issued.
| 4.2.2 | Surface Rights |
Information in this section is sourced from Papke and Davis (2019).
About 85% of the land in Nevada is controlled by the Federal Government; most of this land is administered by the BLM, the US Forest Service (USFS), the US Department of Energy (DOE), or the US Department of Defence (DOD). Much of the land controlled by the BLM and the USFS is open to prospecting and claim location.
| Effective Date: May 31st, 2022 | | 16 |
| Technical Report - Mineral Resource Estimate Reward Project, Nye County, Nevada, USA |
Figure 4.1. Project Location Plan.
Note: Figure prepared by Lycopodium, 2019.
Bureau of Land Management regulations regarding surface disturbance and reclamation require that a notice be submitted to the appropriate BLM Field Office for exploration activities in which five acres or fewer are proposed for disturbance (43 CFR 3809.1-1 through 3809.1-4). A Federal Plan of Operations is needed for all mining and processing activities, plus all activities exceeding five acres of proposed disturbance. A Plan of Operations is also needed for any bulk sampling in which 1,000 or more tons of presumed mineralized material are proposed for removal (43 CFR 3802.1 through 3802.6, 3809.1-4, 3809.1-5). The BLM also requires the posting of bonds for reclamation for any surface disturbance caused by more than casual use (43 CFR 3809.500 through 3809.560). The USFS has regulations regarding land disturbance in forest lands (36 CFR Subpart A). Both agencies also have regulations pertaining to land disturbance in proposed wilderness areas.
| Effective Date: May 31st, 2022 | | 17 |
| Technical Report - Mineral Resource Estimate Reward Project, Nye County, Nevada, USA |
| 4.2.3 | Environmental Regulations |
Information in this section is sourced from Papke and Davis (2019).
All surface management activities, including reclamation, must comply with all pertinent Federal laws and regulations, and all applicable State environmental laws and regulations. The fundamental requirement, implemented in 43 CFR 3809, is that all hard-rock mining under a Plan of Operations or Notice on the public lands must prevent unnecessary or undue degradation. The Plan of Operations and any modifications to the approved Plan of Operations must meet the requirement to prevent unnecessary or undue degradation.
Authorization to allow the release of effluents into the environment must be in compliance with the Clean Water Act, Safe Drinking Water Act, Endangered Species Act, and other applicable Federal and State environmental laws, consistent with BLM’s multiple-use responsibilities under the Federal Land Policy and Management Act and fully reviewed in the appropriate National Environmental Policy Act (NEPA) document.
| 4.2.4 | Water Rights |
Information in this section is sourced from the State of Nevada Water Resources and the US Department of the Interior Bureau of Reclamation websites.
Allocation of water rights in Nevada uses two principles, prior appropriation, and beneficial use. Prior appropriation (also known as the "first in time, first in right") allows for the orderly use of the state's water resources by granting priority to senior water rights. This concept ensures that senior users are protected, even as new uses for water are allocated. Under the Revised Nevada Statutes (Chapters 533 and 534), all water can be appropriated for beneficial use. Irrigation, mining, recreation, commercial/industrial and municipal uses are examples of beneficial uses.
Water supplied by the Colorado River is managed and operated under numerous compacts, federal laws, court decisions and decrees, contracts, and regulatory guidelines collectively known as the "Law of the River." This collection of documents apportions the water and regulates the use and management of the Colorado River among the seven basin states (Wyoming, Colorado, Utah, New Mexico, California, Nevada and Arizona) and Mexico. The primary document is the 1922 Colorado River Compact.
| 4.3 | Ownership |
Canyon Resources Corporation (Canyon Resources), CR Reward’s predecessor, concluded lease agreements to four unpatented lode claims blocks from private owners in 2004 and 2005.
| Effective Date: May 31st, 2022 | | 18 |
| Technical Report - Mineral Resource Estimate Reward Project, Nye County, Nevada, USA |
In 2006, Canyon Resources completed the acquisition of six patented placer claims from Barrick Gold Corporation (Barrick). Canyon Resources also staked 99 new unpatented lode claims during 2005 and 2006.
In 2008, Canyon Resources assigned all of the patented and unpatented claims comprising the Project to CR Reward, which was subsequently converted into a Nevada limited liability company. CR Reward holds a 100% interest in the mineral claims that form the Project, including 99 unpatented lode mineral claims and 6 patented placer claims (Table 4.1). The remaining 22 unpatented lode and placer claims are held through a number of lease agreements (Table 4.1).
On June 13th, 2022, Augusta acquired the Reward Project (Reward or the Project), from Waterton Nevada Splitter LLC (Waterton) by the purchase of CR Reward. Upon closing of the transaction, Waterton received USD$12.5 million cash and USD$15 million comprised of 7,800,000 Augusta shares, with the remaining payable at the time of Augusta’s next equity financing, in cash or shares, providing the additional amount of shares does not result in Waterton owning more than 9.99% of Augusta’s issued and outstanding shares. In addition, USD$17.5 million cash is to be paid within 90 days of closing of the transaction (Augusta Gold Corp., 2022).
| 4.4 | Mineral Properties |
| 4.4.1 | Claim Status |
The Project consists of 121 unpatented Bureau of Land Management (BLM) placer and lode mining claims and six patented placer mining claims (Jensen, 2022a,b,c,d), totalling approximately 2,333 net acres (Table 4.1). Figure 4.2 is an overview plan showing the entire package of claim locations. Figures 4.3 show details of the mineral claims in relation to the main mineralized zones at the Reward Project.
BLM and tax payments are up to date as of the effective date of this report.
Only patented claims have been legally surveyed.
| 4.4.2 | Claim Retention Obligations |
Under U.S. mining law, claims may be renewed annually for an unlimited number of years upon a small payment per claim (currently $165 per claim due to the BLM and an aggregate $1,502 due to Nye County) and the same claim status—whether lode or placer—may be used for exploration or exploitation of the lodes or placers.
State, Federal and local regulations involving environmental, mining and business activities must also be followed.
| Effective Date: May 31st, 2022 | | 19 |
| Technical Report - Mineral Resource Estimate Reward Project, Nye County, Nevada, USA |
Table 4.1. Summary of the Reward Project Claims.
| Claim Name | BLM
NMC#/ Parcel # |
Claim Type | Location/ Section Number |
Area, Acres (nominal Number Unless patented) |
Control (% owned, or name of lessor) |
Year Staked or Patented |
Taxes or BLM Rentals Paid Until |
| American | 000-000-97 | Patented placer | 1 & 2 | 40 | 100% CR Reward LLC | 1916 | 31 Aug 2022 |
| Pentellic | 000-000-97 | Patented placer | 2 | 20 | 100% CR Reward LLC | 1916 | 31 Aug 2022 |
| Regius | 000-000-97 | Patented placer | 1 & 2 | 60 | 100% CR Reward LLC | 1916 | 31 Aug 2022 |
| Marion | 000-000-97 | Patented placer | 2 | 40 | 100% CR Reward LLC | 1916 | 31 Aug 2022 |
| Valencia | 000-000-97 | Patented placer | 2 | 20 | 100% CR Reward LLC | 1923 | 31 Aug 2022 |
| Trinity | 000-000-97 | Patented placer | 1 & 2 | 40 | 100% CR Reward LLC | 1925 | 31 Aug 2022 |
| Sunshine | NMC27580 | Unpatented lode | 2 | 20.66 | Connolly/Webster leases | 1957 | 31 Aug 2022 |
| Reward | NMC27581 | Unpatented lode | 2 & 3 | 20.66 | Connolly/Webster leases | 1957 | 31 Aug 2022 |
| Hardway | NMC853089 | Unpatented lode | 2 | 20.66 | Orser-McFall lease | 2003 | 31 Aug 2022 |
| Bull Moose #1 | NMC855150 | Unpatented lode | 2 & 3 | 12.39 | Orser-McFall lease | 2003 | 31 Aug 2022 |
| Bull Moose #2 | NMC855151 | Unpatented lode | 2 & 3 | 12.39 | Orser-McFall lease | 2003 | 31 Aug 2022 |
| Bull Moose #3 | NMC855152 | Unpatented lode | 2 | 11.02 | Orser-McFall lease | 2003 | 31 Aug 2022 |
| Bull Moose #4 | NMC862531 | Unpatented lode | 2 | 11.02 | Orser-McFall lease | 2004 | 31 Aug 2022 |
| Bull Moose #5 | NMC855153 | Unpatented lode | 2 | 4.13 | Orser-McFall lease | 2003 | 31 Aug 2022 |
| Bull Moose #6 | NMC855154 | Unpatented lode | 2 | 13.77 | Orser-McFall lease | 2003 | 31 Aug 2022 |
| Reward South #1 | NMC868938 | Unpatented lode | 2 & 3 | 20.66 | Orser-McFall lease | 2004 | 31 Aug 2022 |
| Reward South #2 | NMC868939 | Unpatented lode | 2 & 3 | 20.66 | Orser-McFall lease | 2004 | 31 Aug 2022 |
| McOrser | NMC870349 | Unpatented lode | 2 | 20.66 | Orser-McFall lease | 2004 | 31 Aug 2022 |
| April Gold Ace | NMC871261 | Unpatented lode | 3 | 20.66 | Orser-McFall lease | 2004 | 31 Aug 2022 |
| Bull Moose #9 | NMC871255 | Unpatented placer | 2 | 11.47 | Orser-McFall lease | 2004 | 31 Aug 2022 |
| Bull Moose #10 | NMC871256 | Unpatented placer | 2 | 11.47 | Orser-McFall lease | 2004 | 31 Aug 2022 |
| Bull Moose #11 | NMC871257 | Unpatented placer | 2 | 11.47 | Orser-McFall lease | 2004 | 31 Aug 2022 |
| Bull Moose #12 | NMC871258 | Unpatented placer | 2 & 3 | 11.47 | Orser-McFall lease | 2004 | 31 Aug 2022 |
| Bull Moose #13 | NMC871259 | Unpatented placer | 2, 3 & 10 | 11.47 | Orser-McFall lease | 2004 | 31 Aug 2022 |
| Bull Moose #14 | NMC871260 | Unpatented placer | 2, 3, 34, 35 | 19.97 | Orser-McFall lease | 2004 | 31 Aug 2022 |
| Good Hope | NMC853090 | Unpatented lode | 2 | 20.66 | Orser/McFall/Webster Lease | 2003 | 31 Aug 2022 |
| Double RS | NMC125600 | Unpatented placer | 3 & 10 | 80 | VanMeeteren et al lease | 1966 | 31 Aug 2022 |
| Durlers Hope | NMC124956 | Unpatented placer | 3 | 40 | VanMeeteren et al lease | 1966 | 31 Aug 2022 |
| RP 1 | NMC915581 | Unpatented lode | 33 | 20.66 | 100% CR Reward LLC | 2005 | 31 Aug 2022 |
| RP 2 | NMC915582 | Unpatented lode | 33 & 34 | 20.66 | 100% CR Reward LLC | 2005 | 31 Aug 2022 |
| RP 3 | NMC915583 | Unpatented lode | 34 | 20.66 | 100% CR Reward LLC | 2005 | 31 Aug 2022 |
| RP 4 | NMC915584 | Unpatented lode | 34 | 20.66 | 100% CR Reward LLC | 2005 | 31 Aug 2022 |
| RP 5 | NMC915585 | Unpatented lode | 34 | 20.66 | 100% CR Reward LLC | 2005 | 31 Aug 2022 |
| RP 6 | NMC915586 | Unpatented lode | 34 | 20.66 | 100% CR Reward LLC | 2005 | 31 Aug 2022 |
| RP 7 | NMC915587 | Unpatented lode | 34 | 20.66 | 100% CR Reward LLC | 2005 | 31 Aug 2022 |
| RP 8 | NMC915588 | Unpatented lode | 34 | 20.66 | 100% CR Reward LLC | 2005 | 31 Aug 2022 |
| RP 9 | NMC915589 | Unpatented lode | 34 | 20.66 | 100% CR Reward LLC | 2005 | 31 Aug 2022 |
| RP 10 | NMC915590 | Unpatented lode | 34 | 20.66 | 100% CR Reward LLC | 2005 | 31 Aug 2022 |
| RP 11 | NMC915591 | Unpatented lode | 34 | 20.66 | 100% CR Reward LLC | 2005 | 31 Aug 2022 |
| RP 12 | NMC915592 | Unpatented lode | 34 | 20.66 | 100% CR Reward LLC | 2005 | 31 Aug 2022 |
| RP 13 | NMC915593 | Unpatented lode | 34 | 20.66 | 100% CR Reward LLC | 2005 | 31 Aug 2022 |
| RP 14 | NMC915594 | Unpatented lode | 34 | 20.66 | 100% CR Reward LLC | 2005 | 31 Aug 2022 |
| Effective Date: May 31st, 2022 | | 20 |
| Technical Report - Mineral Resource Estimate Reward Project, Nye County, Nevada, USA |
| Claim Name | BLM
NMC#/ Parcel # |
Claim Type | Location/ Section Number |
Area, Acres (nominal Number Unless patented) |
Control (% owned, or name of lessor) |
Year Staked or Patented |
Taxes or BLM Rentals Paid Until |
| RP 15 | NMC915595 | Unpatented lode | 34 | 20.66 | 100% CR Reward LLC | 2005 | 31 Aug 2022 |
| RP 16 | NMC915596 | Unpatented lode | 34 | 20.66 | 100% CR Reward LLC | 2005 | 31 Aug 2022 |
| RP 17 | NMC915597 | Unpatented lode | 34 & 35 | 20.66 | 100% CR Reward LLC | 2005 | 31 Aug 2022 |
| RP 18 | NMC915598 | Unpatented lode | 34 & 35 | 20.66 | 100% CR Reward LLC | 2005 | 31 Aug 2022 |
| RP 19 | NMC915599 | Unpatented lode | 35 | 20.66 | 100% CR Reward LLC | 2005 | 31 Aug 2022 |
| RP 20 | NMC915600 | Unpatented lode | 35 | 20.66 | 100% CR Reward LLC | 2005 | 31 Aug 2022 |
| RP 21 | NMC915601 | Unpatented lode | 3, 4 & 33 | 20.66 | 100% CR Reward LLC | 2005 | 31 Aug 2022 |
| RP 22 | NMC915602 | Unpatented lode | 3 & 4 | 20.66 | 100% CR Reward LLC | 2005 | 31 Aug 2022 |
| RP 23 | NMC915603 | Unpatented lode | 3, 33,34 | 20.66 | 100% CR Reward LLC | 2005 | 31 Aug 2022 |
| RP 24 | NMC915604 | Unpatented lode | 3 | 20.66 | 100% CR Reward LLC | 2005 | 31 Aug 2022 |
| RP 25 | NMC915605 | Unpatented lode | 3 & 34 | 20.66 | 100% CR Reward LLC | 2005 | 31 Aug 2022 |
| RP 26 | NMC915606 | Unpatented lode | 3 | 20.66 | 100% CR Reward LLC | 2005 | 31 Aug 2022 |
| RP 27 | NMC915607 | Unpatented lode | 3 & 34 | 20.66 | 100% CR Reward LLC | 2005 | 31 Aug 2022 |
| RP 28 | NMC915608 | Unpatented lode | 3 | 20.66 | 100% CR Reward LLC | 2005 | 31 Aug 2022 |
| RP 29 | NMC915609 | Unpatented lode | 3 & 34 | 20.66 | 100% CR Reward LLC | 2005 | 31 Aug 2022 |
| RP 30 | NMC915610 | Unpatented lode | 3 | 20.66 | 100% CR Reward LLC | 2005 | 31 Aug 2022 |
| RP 31 | NMC915611 | Unpatented lode | 3 & 34 | 20.66 | 100% CR Reward LLC | 2005 | 31 Aug 2022 |
| RP 32 | NMC915612 | Unpatented lode | 3 | 20.66 | 100% CR Reward LLC | 2005 | 31 Aug 2022 |
| RP 33 | NMC915613 | Unpatented lode | 3 & 34 | 20.66 | 100% CR Reward LLC | 2005 | 31 Aug 2022 |
| RP 34 | NMC915614 | Unpatented lode | 3 | 20.66 | 100% CR Reward LLC | 2005 | 31 Aug 2022 |
| RP 35 | NMC915615 | Unpatented lode | 3 & 34 | 20.66 | 100% CR Reward LLC | 2005 | 31 Aug 2022 |
| RP 36 | NMC915616 | Unpatented lode | 3 | 20.66 | 100% CR Reward LLC | 2005 | 31 Aug 2022 |
| RP 37 | NMC915617 | Unpatented lode | 3 & 34 | 20.66 | 100% CR Reward LLC | 2005 | 31 Aug 2022 |
| RP 38 | NMC915618 | Unpatented lode | 3 | 20.66 | 100% CR Reward LLC | 2005 | 31 Aug 2022 |
| RP 39 | NMC915619 | Unpatented lode | 2, 3 & 34 | 20.66 | 100% CR Reward LLC | 2005 | 31 Aug 2022 |
| RP 40 | NMC915620 | Unpatented lode | 2 & 3 | 20.66 | 100% CR Reward LLC | 2005 | 31 Aug 2022 |
| RP 41 | NMC915621 | Unpatented lode | 2, 34,35 | 20.66 | 100% CR Reward LLC | 2005 | 31 Aug 2022 |
| RP 42 | NMC915622 | Unpatented lode | 2 & 35 | 20.66 | 100% CR Reward LLC | 2005 | 31 Aug 2022 |
| RP 43 | NMC915623 | Unpatented lode | 3 & 4 | 20.66 | 100% CR Reward LLC | 2005 | 31 Aug 2022 |
| RP 44 | NMC915624 | Unpatented lode | 3 | 20.66 | 100% CR Reward LLC | 2005 | 31 Aug 2022 |
| RP 45 | NMC915625 | Unpatented lode | 3 | 20.66 | 100% CR Reward LLC | 2005 | 31 Aug 2022 |
| RP 46 | NMC915626 | Unpatented lode | 3 & 10 | 20.66 | 100% CR Reward LLC | 2005 | 31 Aug 2022 |
| RP 47 | NMC915627 | Unpatented lode | 3 | 20.66 | 100% CR Reward LLC | 2005 | 31 Aug 2022 |
| RP 48 | NMC915628 | Unpatented lode | 3 & 10 | 20.66 | 100% CR Reward LLC | 2005 | 31 Aug 2022 |
| RP 49 | NMC915629 | Unpatented lode | 3 | 20.66 | 100% CR Reward LLC | 2005 | 31 Aug 2022 |
| RP 50 | NMC915630 | Unpatented lode | 3 & 10 | 20.66 | 100% CR Reward LLC | 2005 | 31 Aug 2022 |
| RP 51 | NMC915631 | Unpatented lode | 3 | 20.66 | 100% CR Reward LLC | 2005 | 31 Aug 2022 |
| RP 52 | NMC915632 | Unpatented lode | 3 & 10 | 20.66 | 100% CR Reward LLC | 2005 | 31 Aug 2022 |
| RP 53 | NMC915633 | Unpatented lode | 3 | 20.66 | 100% CR Reward LLC | 2005 | 31 Aug 2022 |
| RP 54 | NMC915634 | Unpatented lode | 3 | 20.66 | 100% CR Reward LLC | 2005 | 31 Aug 2022 |
| RP 55 | NMC915635 | Unpatented lode | 2 & 3 | 20.66 | 100% CR Reward LLC | 2005 | 31 Aug 2022 |
| RP 56 | NMC915636 | Unpatented lode | 10 | 20.66 | 100% CR Reward LLC | 2005 | 31 Aug 2022 |
| RP 57 | NMC915637 | Unpatented lode | 3 & 10 | 20.66 | 100% CR Reward LLC | 2005 | 31 Aug 2022 |
| RP 58 | NMC915638 | Unpatented lode | 10 | 20.66 | 100% CR Reward LLC | 2005 | 31 Aug 2022 |
| Effective Date: May 31st, 2022 | | 21 |
| Technical Report - Mineral Resource Estimate Reward Project, Nye County, Nevada, USA |
| Claim Name | BLM NMC#/ Parcel # |
Claim Type | Location/
Section Number |
Area,
Acres (nominal Number Unless patented) |
Control (% owned, or name of lessor) |
Year Staked or Patented |
Taxes
or BLM Rentals Paid Until |
| RP 59 | NMC915639 | Unpatented lode | 3 & 10 | 20.66 | 100% CR Reward LLC | 2005 | 31 Aug 2022 |
| RP 60 | NMC915640 | Unpatented lode | 10 | 20.66 | 100% CR Reward LLC | 2005 | 31 Aug 2022 |
| RP 61 | NMC915641 | Unpatented lode | 2, 3, 10, 11 | 20.66 | 100% CR Reward LLC | 2005 | 31 Aug 2022 |
| RP 62 | NMC915642 | Unpatented lode | 10 & 11 | 20.66 | 100% CR Reward LLC | 2005 | 31 Aug 2022 |
| RP 63 | NMC915643 | Unpatented lode | 2 & 11 | 20.66 | 100% CR Reward LLC | 2005 | 31 Aug 2022 |
| RP 64 | NMC915644 | Unpatented lode | 11 | 20.66 | 100% CR Reward LLC | 2005 | 31 Aug 2022 |
| RP 65 | NMC915645 | Unpatented lode | 2 & 11 | 20.66 | 100% CR Reward LLC | 2005 | 31 Aug 2022 |
| RP 66 | NMC915646 | Unpatented lode | 11 | 20.66 | 100% CR Reward LLC | 2005 | 31 Aug 2022 |
| RP 67 | NMC915647 | Unpatented lode | 2 & 11 | 20.66 | 100% CR Reward LLC | 2005 | 31 Aug 2022 |
| RP 68 | NMC915648 | Unpatented lode | 11 | 20.66 | 100% CR Reward LLC | 2005 | 31 Aug 2022 |
| RP 69 | NMC915649 | Unpatented lode | 2 & 11 | 20.66 | 100% CR Reward LLC | 2005 | 31 Aug 2022 |
| RP 70 | NMC915650 | Unpatented lode | 11 | 20.66 | 100% CR Reward LLC | 2005 | 31 Aug 2022 |
| RP 71 | NMC915651 | Unpatented lode | 2 & 11 | 20.66 | 100% CR Reward LLC | 2005 | 31 Aug 2022 |
| RP 72 | NMC915652 | Unpatented lode | 11 | 20.66 | 100% CR Reward LLC | 2005 | 31 Aug 2022 |
| RP 73 | NMC915653 | Unpatented lode | 2 | 20.66 | 100% CR Reward LLC | 2005 | 31 Aug 2022 |
| RP 74 | NMC915654 | Unpatented lode | 2 | 20.66 | 100% CR Reward LLC | 2005 | 31 Aug 2022 |
| RP 75 | NMC915655 | Unpatented lode | 2 | 20.66 | 100% CR Reward LLC | 2005 | 31 Aug 2022 |
| RP 76 | NMC915656 | Unpatented lode | 3 | 5.17 | 100% CR Reward LLC | 2005 | 31 Aug 2022 |
| RP 77 | NMC915657 | Unpatented lode | 10 | 20.66 | 100% CR Reward LLC | 2005 | 31 Aug 2022 |
| RP 78 | NMC915658 | Unpatented lode | 10 | 20.66 | 100% CR Reward LLC | 2005 | 31 Aug 2022 |
| RP 79 | NMC915659 | Unpatented lode | 9 & 10 | 20.66 | 100% CR Reward LLC | 2005 | 31 Aug 2022 |
| RP 80 | NMC915660 | Unpatented lode | 10 | 20.66 | 100% CR Reward LLC | 2005 | 31 Aug 2022 |
| RP 81 | NMC915661 | Unpatented lode | 9 & 16 | 20.66 | 100% CR Reward LLC | 2005 | 31 Aug 2022 |
| RP 82 | NMC915662 | Unpatented lode | 9 | 20.66 | 100% CR Reward LLC | 2005 | 31 Aug 2022 |
| RP 83 | NMC915663 | Unpatented lode | 2 | 20.66 | 100% CR Reward LLC | 2005 | 31 Aug 2022 |
| RP 84 | NMC915664 | Unpatented lode | 2 | 20.66 | 100% CR Reward LLC | 2005 | 31 Aug 2022 |
| RP 85 | NMC938644 | Unpatented lode | 10 | 20.66 | 100% CR Reward LLC | 2006 | 31 Aug 2022 |
| RP 86 | NMC938645 | Unpatented lode | 10 | 20.66 | 100% CR Reward LLC | 2006 | 31 Aug 2022 |
| RP 87 | NMC938646 | Unpatented lode | 10 | 20.66 | 100% CR Reward LLC | 2006 | 31 Aug 2022 |
| RP 88 | NMC938647 | Unpatented lode | 10 & 11 | 20.66 | 100% CR Reward LLC | 2006 | 31 Aug 2022 |
| RP 89 | NMC938648 | Unpatented lode | 11 | 20.66 | 100% CR Reward LLC | 2006 | 31 Aug 2022 |
| RP 90 | NMC938649 | Unpatented lode | 11 | 20.66 | 100% CR Reward LLC | 2006 | 31 Aug 2022 |
| RP 91 | NMC938650 | Unpatented lode | 11 | 20.66 | 100% CR Reward LLC | 2006 | 31 Aug 2022 |
| RP 92 | NMC938651 | Unpatented lode | 11 | 20.66 | 100% CR Reward LLC | 2006 | 31 Aug 2022 |
| RP 93 | NMC938652 | Unpatented lode | 11 | 20.66 | 100% CR Reward LLC | 2006 | 31 Aug 2022 |
| RP 94 | NMC938653 | Unpatented lode | 35 | 20.66 | 100% CR Reward LLC | 2006 | 31 Aug 2022 |
| RP 95 | NMC938654 | Unpatented lode | 35 | 20.66 | 100% CR Reward LLC | 2006 | 31 Aug 2022 |
| RP 96 | NMC938655 | Unpatented lode | 2 & 35 | 20.66 | 100% CR Reward LLC | 2006 | 31 Aug 2022 |
| RP 97 | NMC938656 | Unpatented lode | 2 | 10.33 | 100% CR Reward LLC | 2006 | 31 Aug 2022 |
| RP 98 | NMC938657 | Unpatented lode | 2 | 2.58 | 100% CR Reward LLC | 2006 | 31 Aug 2022 |
| RP 99 | NMC938658 | Unpatented lode | 2 | 6.89 | 100% CR Reward LLC | 2006 | 31 Aug 2022 |
| Effective Date: May 31st, 2022 | | 22 |
| Technical Report - Mineral Resource Estimate Reward Project, Nye County, Nevada, USA |
Figure 4.2. CR Reward, LLC Controlled Mineral Claims at Reward Project.

Note: Figure prepared by Lycopodium, 2019.
| Effective Date: May 31st, 2022 | | 23 |
| Technical Report - Mineral Resource Estimate Reward Project, Nye County, Nevada, USA |
Figure 4.3. Detail of Reward Claims and Mineralized Zones for the Core Area.
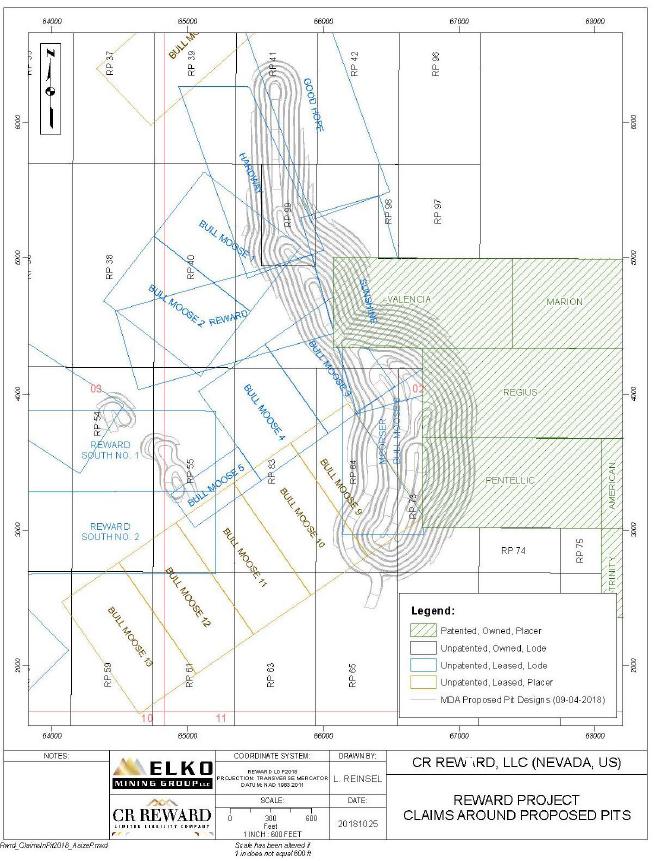
Note: Figure prepared by Lycopodium, 2019.
| Effective Date: May 31st, 2022 | | 24 |
| Technical Report - Mineral Resource Estimate Reward Project, Nye County, Nevada, USA |
| 4.4.3 | Encumbrances |
No companies or entities are known that have back in or option rights on the mineral claims.
The claims listed in Table 4.1 have not been legally surveyed, except that the patented claims were legally surveyed prior to the date of patenting. The unpatented lode claims are readily identifiable and locatable in the field, due to distinctive topographic features and the near absence of vegetation (CAM, 2012).
| 4.5 | Mineral Lease Agreements |
Several blocks of unpatented claims (22 in total) are leased by CR Reward from underlying owners (refer to Table 4.1).
| 4.5.1 | Connolly Lease |
This lease agreement (the Connolly Lease), effective as of September 28th, 2004, covers a two-third interest in each of the Sunshine and Reward unpatented lode claims (collectively, the Connolly Claims). The Connolly Lease is for an initial term of 20 years and continues so long thereafter as the Project remains in commercial production. A 3% NSR royalty is payable on any minerals mined from the Connolly Claims, but is reduced to 2% due to the fact that CR Reward only owns a two-third interest in the Connolly Claims. Annual advance minimum royalty payments are payable under the Connolly Lease in an amount equal to $10,000 per year. These annual advance minimum royalty payments shall be applied toward, credited against and fully deductible from earned mineral production royalty payments due from the Connolly Claims.
| 4.5.2 | Webster Lease |
This lease agreement (the Webster lease), effective as of November 9, 2004 (as amended on November 9th, 2004 and November 8th, 2006), covers a one-third interest in each of the Sunshine and Reward unpatented lode claims and a half interest in the Good Hope unpatented lode claim (collectively, the Webster Claims). The Webster Lease is for an initial term of 20 years and continues so long thereafter as the Project remains in commercial production. A 3% NSR royalty is payable on any minerals mined from the Webster Claims, but is (i) reduced to 1% on the Sunshine and Reward claims due to the fact that the lessee only owns a one-third interest, and (ii) reduced to 1.5% on the Good Hope claim due to the fact that CR Reward only owns a half interest in this claim. Annual advance minimum royalty payments are payable under the Webster Lease in an amount equal to $7,500 per year. The annual advance minimum royalty payments paid in any given year may be applied toward, credited against and fully deductible from any earned mineral production royalty payments due on the Webster Claims during the calendar year in which such annual advance minimum royalty payments are due.
| Effective Date: May 31st, 2022 | | 25 |
| Technical Report - Mineral Resource Estimate Reward Project, Nye County, Nevada, USA |
| 4.5.3 | Orser–McFall Lease |
This lease agreement (the Orser–McFall Lease), effective as of February 5, 2005 (as amended on August 18th, 2005 and November 14th, 2006), applies to 12 unpatented lode and six unpatented placer mining claims (collectively, the Orser–McFall Claims). The Orser–McFall Lease is for an initial term of 20 years and continues so long thereafter as the Project remains in commercial production. The lessors under the Orser–McFall Lease own 100% of the Orser–McFall Claims, except for the Good Hope claim, in which they own a half interest (the other half being owned by the Daniel D. Webster Living Trust and leased to CR Reward pursuant to the Webster Lease). A 3% NSR royalty is payable on minerals mined from the Orser–McFall Claims, but is reduced to 1.5% on the Good Hope claim due to the fact that the lessee only owns a half interest in that claim. Annual advance minimum royalty payments are payable under the Orser–McFall Lease in an amount equal to $20,000 per year. These annual advance minimum royalty payments shall be applied toward, credited against and fully deductible from earned mineral production royalty payments due from the Orser-McFall Claims.
| 4.5.4 | Van Meeteren et al Lease |
This lease agreement (the Van Meeteren Lease), effect as of December 1st, 2011 (applies to the Double RS and the Durlers Hope unpatented placer claims (the Van Meeteren Claims). The Van Meeteren Lease is for an initial term of 20 years and continues so long thereafter as the Project remains in commercial production or CR Reward is actively conducting exploration, development, reclamation or remediation operations. A 3% NSR royalty is payable on minerals mined from the Van Meeteren Claims. Annual advance minimum royalty payments are payable under the Van Meeteren Lease in an amount equal to $15/acre from 2011 through 2020, for a total of $1,800 per year, and $20/acre from and after 2021, for a total of $2,400 per year. These annual advance minimum royal payments are recoupable from earned mineral production royalties. All payments described above have been timely paid by CR Reward and its predecessor and the agreements are all in good standing.
| 4.6 | Encumbrances |
The Project is not subject to any other back-in rights payments, agreements or encumbrances.
| 4.7 | Surface Ownership |
The Project area mainly consists of Federal public domain lands administered by the BLM. There are no State or private tracts within the Project area, except the six patented claims owned by CR Reward, all of which carry surface and mineral rights ownership.
| Effective Date: May 31st, 2022 | | 26 |
| Technical Report - Mineral Resource Estimate Reward Project, Nye County, Nevada, USA |
| 4.8 | Water Rights |
CR Reward has the right to use 391,494 m3 (317.39 acre-ft) of water annually under Application No. 61412, Certificate No. 16384 and Permit No. 76390.
The Amargosa River basin is an enclosed basin, and the water rights are thus not affected by the Colorado River Compact or other agreements.
| 4.9 | Permitting Considerations |
The current Project area includes public and private lands within Nye County, Nevada. The Project, therefore, falls under the jurisdiction and permitting requirements of Nye County, the State of Nevada (primarily the BMRR) and the BLM.
The following permits and authorizations were granted to CR Reward:
| · | Plan of Operations authorized under N-82840. |
| · | Water Pollution Control Permit (WPCP); WPCP NEV2007101. |
| · | Water rights permitted by Nevada Division of Water Resources (NDWR) under Mining, Milling, & Domestic permit 76390 and permit 89658. |
| · | Mining reclamation permit granted by the Bureau of Mining Regulation and Reclamation (BMRR) under mine site permit #0300. |
| · | Nevada Bureau of Air Pollution Control (BAPC) authorized Class II Air Quality permit AP1041-2492. |
The reader is referred to Evans et al. (2019) for additional information regarding permitting considerations for mining activities at the Project. Regarding exploration activities, during early phases of exploration, when surface disturbance is generally limited, authorization from the BLM is conditionally granted under a notice (40 CFR § 3890.21). There are currently no exploration notices associated with the Project and none are likely to be granted given the Project has a mine plan of operations (MPO) that was granted in 2020.
| 4.10 | Environmental Considerations |
Environmental, social and cultural studies were conducted by CR Reward as part of its permitting efforts.
Much of this information was provided to the BLM as part of the Reward Project Updated Plan of Operations and Reclamation Plan (BLM Case File Serial Number N-82840) and the accompanying Environmental Assessment (EA; DOI-BLM-NV-S030-2020-0006-EA).
| Effective Date: May 31st, 2022 | | 27 |
| Technical Report - Mineral Resource Estimate Reward Project, Nye County, Nevada, USA |
Additional information, especially with respect to hydrogeology and geochemistry, was developed and submitted to the BMRR as part of the Nevada Water Pollution Control Permit (WPCP) application. Both the EA and WPCP application include discussion of the potential impacts associated with project development, none of which were found to be significant.
Studies completed have included desktop reviews, and Project-specific data collection on the following: land status, soil surveys, air quality, cultural resources, Native American religious concerns, water resources, vegetation, wildlife and special-status species.
Additional information regarding environmental considerations at the Project is available in Evans et al. (2019).
| 4.11 | Comments on Property Description and Location |
CR Reward advised the QP that the company is not aware of any existing environmental liabilities connected with the Project, except those relating to CR Reward’s exploration and development activities, for which bonds have been posted.
There are currently no known environmental issues that could materially impact CR Reward’s ability to extract the Mineral Resources or that would impact the Mineral Resource estimates.
To the extent known, there are no other significant factors and risks that may affect access, title, or the right or ability to perform work on the Project that have not been discussed in this Report.
| 5 | Accessibility, Climate, Local Resources, Infrastructure and Physiography |
| 5.1 | Accessibility |
The Project lies 7 miles southeast of Beatty, Nevada, about two miles east of US Highway 95 in Nye County. The Project can be accessed from Beatty by paved road on Highway 95 followed by traveling two miles east on a gravel road. Several dirt roads diverge into various canyons of the Bare Mountains.
| 5.2 | Site Topography, Elevation and Vegetation |
The Project is situated in the Amargosa Desert in southwestern Nevada on the southwestern flank of the Bare Mountains in the northern Amargosa Valley. It is located on the western flank of the rugged north–south-trending Bare Mountains. The western flank drains into the Amargosa Desert, which is drained by the ephemeral Amargosa River.
| Effective Date: May 31st, 2022 | | 28 |
| Technical Report - Mineral Resource Estimate Reward Project, Nye County, Nevada, USA |
Beatty, on the Amargosa River, lies at 1,006 m (3,300 ft) elevation. Elevations in the Project area range from about 1,158 m (3,800 ft) to 1,311 m (4,300 ft).
Vegetation is sparse, consisting mainly of creosote bush, (Larrea sp.), Mormon tea, (Ephedra sp.), and low shrubs, with occasional small barrel cacti (Ferocactus sp.). A few mesquite trees (Prosopis sp.) occur within the overall Project boundary.
| 5.3 | Climate |
The climate is typical of middle-elevation desert.
The area is highly arid, with average annual precipitation of 10.4 cm (4.1 inches). During May to October, occasional thunderstorms may generate flash flooding in the region. Trace snow falls in the winter months.
Temperatures range from winter absolute lows of -12.2°C (10°F) to summer absolute highs of 43.3°C (110°F).
Operations are planned to be conducted year-round.
| 5.4 | Local Resources and Infrastructure |
The Project is located seven miles by road southeast of Beatty, a town of approximately 1,000 people that serves as a transit hub and service centre for travellers between Las Vegas and Reno, and those going to Death Valley. Several motels and restaurants, gas stations, a post office, and several small stores provide basic services.
The Project is currently serviced by an existing 14.4/24.9 kV power line owned and operated by Valley Electric. A water well currently provides water for exploration activities.
Project employees would likely be recruited from the local area, including the communities of Beatty, Amargosa, and Pahrump, located within Nye County, and the regional urban centre of Las Vegas, located within Clark County. There is available nearby accommodation to the Project site in Beatty and other smaller communities
The Project has sufficient land area, with adjacent public-domain lands also potentially available, to allow mine development, including space for the mining operations, waste rock disposal facilities (WRDs), heap leach pads and processing plants.
| Effective Date: May 31st, 2022 | | 29 |
| Technical Report - Mineral Resource Estimate Reward Project, Nye County, Nevada, USA |
| 6 | History |
| 6.1 | Exploration History |
Table 6.1 summarizes the Project history. A preliminary assessment was completed in 2005 (exact date is unknown), a prefeasibility study on January 26, 2006, and a feasibility study on May 25, 2007. Subsequent to the 2007 feasibility study completion, CR Reward obtained the majority of the required permits to support construction and operations. An updated feasibility study (the 2019 feasibility study; Lycopodium, 2019) and a 2019 feasibility study technical report (Evans et al., 2019) were commissioned by CR Reward and are partly the basis for this Technical Report. The authors are referring to these studies as historical; to be considered current, the studies completed in 2019 would need to incorporate current pricing for major equipment, contract mining costs, construction costs, major consumables and labor costs.
| 6.2 | Production History |
The most extensive showing within the Project is the 150 ft long Good Hope adit located near north end of the Hardway claim. A description of the Arista mine, credited with shipping 1.25 st of ore grading over 1 oz/st Au just before World War II (Kral, 1951), appears to match the Good Hope adit where a small glory hole and underlying raise were worked.
There are no formal production records from the Project area, and there has been no modern production.
Table 6.1. Project Exploration History.
| Period | Owner | Operator | Work Performed |
| 1913 | Gold discovered at Gold Ace property. | ||
| pre-1942 | Arista Mine (a.k.a. Good Hope?) Shipped 1.25 st of ore grading over 1 oz/st Au just before World War II. | ||
| 1942–1957 | District idle | ||
| 1957–1962 | Reward, Sunshine, Good Hope claims staked in 1957; Hardway claim staked 1962. | ||
| c. 1970s | Webster, Burt | Acquired Reward claims | |
| 1976 | Webster, Burt | Galli Exploration Associates (Galli) |
Galli acquired an option on the Webster-Burt land.
Minor road construction and improvements. |
| 1980 | Teco Inc. (Teco) | Teco acquired the Gold Ace property. | |
| mid-1980s | Webster, Burt | Optioned to St. Joe Minerals Corp. (St Joe) | Carried out an extensive sampling program on the Gold Ace property in tandem with their exploration program in the Bullfrog mining district. |
| 1985 | Gexa Gold Corp. (Gexa) | Gexa | Gexa, successor company to Galli Exploration Associates, staked 10 claims next to Webster, Burt claim holdings. |
| Effective Date: May 31st, 2022 | | 30 |
| Technical Report - Mineral Resource Estimate Reward Project, Nye County, Nevada, USA |
| Period | Owner | Operator | Work Performed |
| 1987 | Teco | Homestake Mining Company (Homestake) | Homestake leased the Teco land and drilled two vertical reverse circulation (RC) holes near the northwest and southwest edges of the Webster-Burt ground as part of a 4 RC hole, 1,210 ft rotary drill program (HMC 1 to 4), which probed pediment gravels for a large-tonnage conceptual target. No anomalous results were encountered in the from the four wide-spaced drill holes. |
| 1987–1989 |
Teco (1987–1991) Webster, Burt |
Gexa | Drilling by Gexa included 16 RC holes for a total of 3,037 ft were completed along the north-south trending Good Hope vein/fault system, much of which is within the limits of the current Good Hope resource area. |
| 1988–1990 |
Teco (1987–1991) Webster, Burt |
Pathfinder Gold Corp. (Pathfinder) |
Pathfinder optioned the Teco ground, portions of which overlay the southerly gravel-covered projection of the Reward fault, south of the Webster leased ground.
Pathfinder drill-tested these fault projections and added several holes along drill fences between south Good Hope and south Gold Ace. A total of 33 RC and one partial core hole were drilled totaling 13,798 ft (excludes 43 ft due to an abandoned hole). |
| 1990 | Pathfinder | Cloverleaf Gold Inc. (Cloverleaf) |
Pathfinder joint-ventured their interest in the TECO lease to Cloverleaf in 1990.
Cloverleaf completed 49 shallow RC holes for 9,075 ft. All but five Cloverleaf holes were targeted on historic mine workings at Gold Ace.
Cloverleaf surrendered their interest to Pathfinder in 1990. |
| 1990 | Pathfinder | Bond Gold Exploration Inc. (Bond Gold) |
Airborne geophysics data collected over Gold Ace.
Bond Gold acquired by Lac Minerals Ltd. (Lac Minerals).
Property returned to Pathfinder. |
| 1991 | Teco | Pathfinder |
In 1991, the availability of an option on the Reward property from Gexa influenced Pathfinder's decision to re-evaluate Gold Ace in conjunction with a program at Good Hope. Pathfinder proceeded to acquire the Reward property, stepped off south of the 1987-1989 Gexa drill pattern, and drilled into the present Reward gold resource south of the saddle, on the Hardway, Reward, Bullmoose #3A and #4 claims.
Completed 17 holes (GA 91-1 to 91-17) for a total of 8,300 ft. Following the 1991 drill program, Pathfinder surrendered all leases and withdrew from the district. |
| 1992 | Teco | US Nevada Gold Search (USNGS) |
In 1992 a joint venture consisting of Siskon Corp., N.A. Degerstrom Inc. and US Precious Metals (successor to GEXA), assumed GEXA's position at Reward.
USNGS drilled 7 RC holes (R-16 to R-22) for 2,119 ft, all of which intersected mineralization along the Good Hope fault.
USNGS conducted no further work on the property. |
| 1995 |
Teco Webster, Burt |
USNGS | USNGS sold the GEXA lode claims and assigned the Webster lease to Barrick. |
| Effective Date: May 31st, 2022 | | 31 |
| Technical Report - Mineral Resource Estimate Reward Project, Nye County, Nevada, USA |
| Period | Owner | Operator | Work Performed |
| 1995-1996 | Barrick | Barrick |
Negotiated a mining lease with Teco on the Gold Ace ground.
Staked 94 lode claims along extensions of the Reward and Gold Ace zones.
Completed a total of 88 RC holes and 3 core holes for 39,028 ft of drilling across the property. |
| 1998 | Barrick | Rayrock Mines Inc. (Rayrock) | Rayrock acquired Barrick’s land package and began permitting of the Reward Mining property. |
| 1999 | Rayrock | Glamis Gold Ltd. (Glamis Gold) | Glamis Gold acquired Rayrock. |
| 1998–2000 | Glamis Gold | Glamis Gold (Marigold Mining Company) | Between 1998 and 2000, 79 RC holes (RE-001 to RE-79, including RE-026A) totalling 30,535 ft were completed by Marigold Mining, an affiliate of Rayrock and Glamis Gold. |
| 2000 | Glamis Gold | Glamis | Initiated the permitting process for eventual production but falling gold prices led to project suspension. |
| 2004–2006 | Canyon Resources Corp. (Canyon) | Canyon |
Acquired the core of the current Project in 2004 through three mineral leases with private owners for patented and unpatented mining claims.
Acquired six patented placer claims from Barrick in 2006.
Staked new unpatented lode and mill site claims between 2005 and 2007.
Completed a Pre-Feasibility study in January 2006.
Completed 21 RC drill holes for a total of 6,150 ft in 2006. |
| 2007 | Canyon | Canyon |
Four core holes for 1,430 ft were completed.
Mineral resource and mineral reserve estimate were updated.
Plan of Operations authorized under N-82840.
Obtained Water Pollution Control Permit (WPCP); WPCP NEV2007101.
Obtained general construction permit; NVR100000 CSW-17415.
Water rights permitted by Nevada Division of Water Resources (NDWR) under Mining, Milling, & Domestic permit 76390.
Mining reclamation permit granted by the Bureau of Mining Regulation and Reclamation (BMRR) under mine site permit #0300.
Nevada Bureau of Air Pollution Control (BAPC) authorized Class II Air Quality permit AP1041-2492 |
| 2008–2010 | Canyon | Atna Resources Ltd. (Atna) |
Completed a Feasibility study in February 2008.
Assigned all properties to CR Reward Corporation after Canyon was acquired by Atna in March 2008.
Mineral resource and mineral reserve updates were completed in 2009 and 2010.
Completed Environmental Assessment (EA) in 2009; prepared “Reward Project Updated Plan of Operations and Reclamation Plan” (BLM Case File Serial Number N-82840). |
| Effective Date: May 31st, 2022 | | 32 |
| Technical Report - Mineral Resource Estimate Reward Project, Nye County, Nevada, USA |
| Period | Owner | Operator | Work Performed |
| 2011-2012 | Atna | Atna |
Completed 15 RC drill holes for a total of 15,880 ft.
Completed an updated study on the Reward project that included an economic analysis. Report was published in June 2012. |
| 2013 | Atna | Atna |
14 RC drill holes for 9,003 ft of drilling were completed.
Mineral resource and mineral reserve updates were completed. |
| 2016 | CR Reward | CR Reward | Two geophysical induced polarization (IP)/resistivity lines; acquired on both lines using a dipole-dipole array with a dipole length of 100 m for a total of 3.9 line-km of data coverage. |
| 2017 | CR Reward | CR Reward |
Property-wide data compilation and validation program.
14 core holes for 4,989 ft were completed. |
| 2018 | CR Reward | CR Reward |
14 core holes for 6,307 ft were completed.
Mineral Resource and Mineral Reserve updates. |
| 2019 | CR Reward | CR Reward | Completed updated Feasibility study. |
| 7 | Geological Setting and Mineralization |
The Project is hosted within the Bare Mountain Complex, which lies within the Nevada Basin and Range Province. Information in this section is summarized from Rasmussen and Keith (2015), Hoisch (1997), CAM (2006, 2012), Cornwall and Kleinhampl (1961, 1964), Eliopulos (1996), Golder (2007), Sawyer et al. (1994), Monsen et al. (1992) and Noble et al. (1991).
| 7.1 | Regional Geology |
The Bare Mountains consist of up to 6,096 m (20,000 ft) of Late Proterozoic to Paleozoic marine sedimentary rocks in the lower plate that have been juxtaposed against Miocene silicic volcanic sequences in the upper plate to the north (Figure 7.1 and Figure 7.2). The lower plate units have been deformed through folding, thrust faulting, low- and high-angle normal faulting during Mesozoic compression (Monsen et al., 1992) and have been metamorphosed from lower amphibolite to sub-greenschist grade (Hoisch, 1997). Two dominant normal fault sets have been mapped in the lower plate. These include moderately east-dipping (Bare Mountain Fault and Gold Ace fault) and shallowly southeast-dipping faults that cut or curve into east-dipping faults. A metamorphic grade discordance across the Gold Ace fault suggests displacement of >1,981 m (6,500 ft) (Hoisch, 1997).
To the north, the shallowly north-dipping Fluorspar Canyon Fault separates the lower plate from the Miocene volcanic sequences that were deposited between 14.0 and 11.5 Ma (Sawyer et al., 1994).
| Effective Date: May 31st, 2022 | | 33 |
| Technical Report - Mineral Resource Estimate Reward Project, Nye County, Nevada, USA |
| 7.2 | Local Geology |
The Project is located on the southwestern flank of the Bare Mountain Complex and is underlain by moderately deformed marine clastic and carbonate rocks of Late Proterozoic and Late Cambrian age that have been metamorphosed to greenschist grade (refer to Figure 7.2). Tertiary and younger alluvium cover the lower slopes and the adjacent Armagosa Valley to the south and west. The east dipping Gold Ace fault, that is locally termed the Good Hope fault zone, separates northeast-dipping Late Proterozoic to Early Cambrian units in the footwall block from Middle to Late Cambrian units in the hanging wall block (Figure 7.3 and Figure 7.4).
The gold mineralization in the Good Hope Deposit is spatially associated with and along the Good Hope fault zone. Mineralization associated with the Morris Marble lower contact in the footwall block is referred to as the Gold Ace mineralized zone. Although there are small historic prospects along the Good Hope fault zone, most of the historic production came from the Gold Ace Zone.
Figure 7.1. Simplified Geology of the Bare Mountain Area.
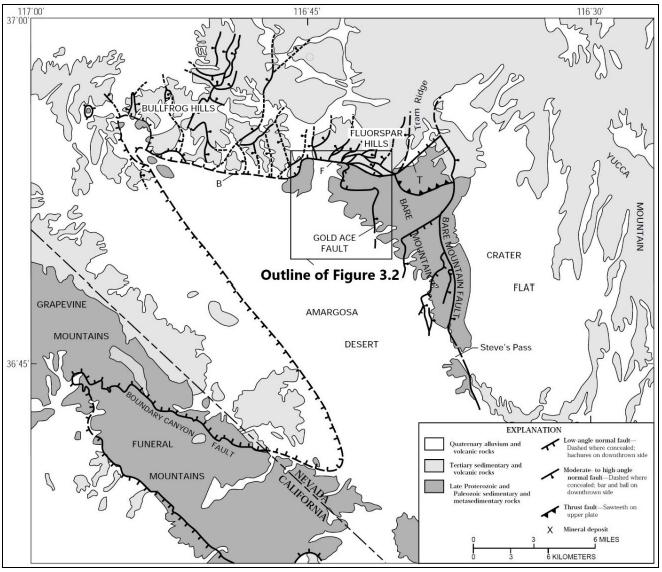
Note: B, Bullfrog detachment fault; F, Fluorspar Canyon fault; T, Tates Wash fault. From Hoisch, 1997.
| Effective Date: May 31st, 2022 | | 34 |
| Technical Report - Mineral Resource Estimate Reward Project, Nye County, Nevada, USA |
Figure 7.2. Simplified Geologic Map of Project Area.

Note: Gold Ace area modified after Monsen et al., 1992.
| Effective Date: May 31st, 2022 | | 35 |
| Technical Report - Mineral Resource Estimate Reward Project, Nye County, Nevada, USA |
Figure 7.3. Local Geology Map.
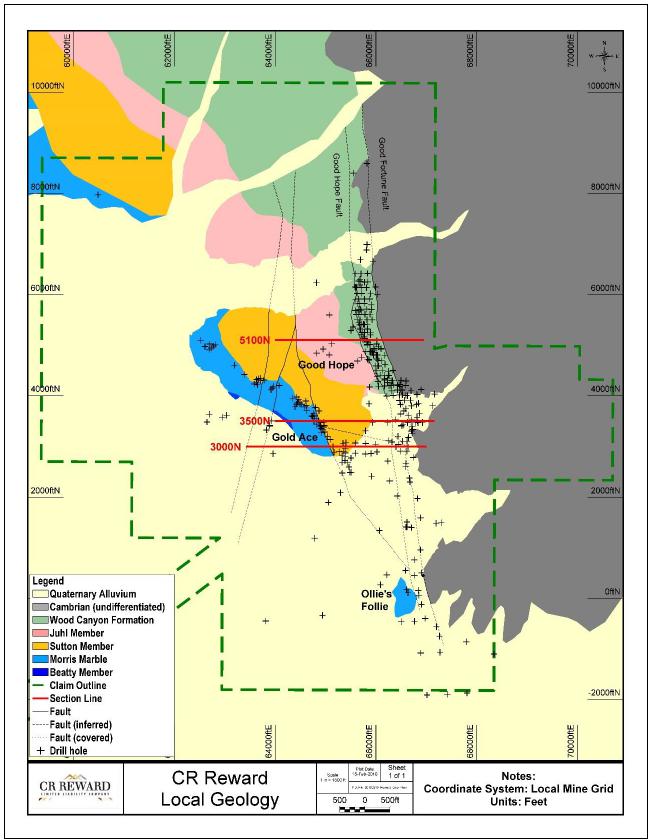
Note: Figure prepared by Lycopodium, 2019
| Effective Date: May 31st, 2022 | | 36 |
| Technical Report - Mineral Resource Estimate Reward Project, Nye County, Nevada, USA |
Figure 7.4. 3D Geological Schematic of the Main Rock Units and Faults.

Note: Modified from Carisey, 1989.
| 7.3 | Stratigraphy |
The sedimentary sequence of the lower portion of the Bare Mountain Complex consists of 2,911 m (9,555 ft) of moderately deformed, clastic and carbonate rocks of Late Proterozoic and Middle Cambrian age (Table 7.1, Figure 7.5). Approximately 762 m (2,500 ft) of section is exposed in the Project area. Beds dip to the northeast at moderate to high angles.
| ● | The following stratigraphic descriptions at the Project are largely based on: | |
| ● | Geologic map of Bare Mountain, Nye County, Nevada (Monsen et al., 1992). | |
| ● | Stratigraphic descriptions from the 1989 Project Summary Report (Carisey, 1989). | |
| ● | Drill hole data. | |
| ● | Observations from the 2017–2018 drill program (Saunders, 2018). |
Table 7.1. Stratigraphy and Unit Thickness of the Bare Mountains Complex.
| Age | Formation | Member | Map Code | Thickness ft |
| Cambrian | Bonanza King | Papoose Lake | -Cbp | 1,900 |
| Carrara | Upper part | -Ccu | 500 | |
| Middle part | -Ccm | 325 | ||
| Lower part | -Ccl | 375 | ||
| Zabriskie Quartzite | -Cz | 1,125 | ||
| Proterozoic-Cambrian | Wood Canyon | Upper upper | zwuu | 840 |
| Upper lower | zwul | 1,185 | ||
| Middle | Zwm | 625 | ||
| Lower | Zwl | 1,050 | ||
| Late Proterozoic | Stirling | Juhl | Zsj | 310 |
| Sutton | Zss | 500 | ||
| Morris Marble | Zsm | 325 | ||
| Beatty Schist | Zbs | 470 |
| Effective Date: May 31st, 2022 | | 37 |
| Technical Report - Mineral Resource Estimate Reward Project, Nye County, Nevada, USA |
| 7.3.1 | Late Proterozoic |
Stirling Formation
Beatty Schist Member (Zbs)
The Beatty Schist Member consists of greenish, moderately foliated phyllites with minor interbedded thin shale and quartzite beds. The transition zone with the overlying Morris Marble characterized by a few feet of alternating schists, limestone, and dolomite beds. Limestone lenses occur in grey siliciclastic rocks, which occasionally display schistose textures. The unit is about 152 m (500 ft) thick.
Morris Marble Member (Zsm)
The Morris Marble Member consists of massive, white to light tan-grey, weathered limestone and dolomite with dissolution textures and occasional grainy quartzite lenses. This member conformably overlies the Beatty Schist Member, and may be correlated to the lower “D” member of the Stirling Formation (Monsen et al., 1992). The Morris Marble Members hosts the gold mineralization at the Gold Ace deposit. The unit is approximately 76 m (250 ft) thick.
Sutton Member (Zss)
The Sutton Member consists of medium to thick, light brownish-grey, interbedded, fine-grained quartzite, micaceous quartzite, pale-green phyllite, and yellowish-brown dolomite. Laminations and cross-laminations are common. The Sutton Member may be correlated to the upper “D” member of the Stirling Formation (Monsen et al., 1992). The Sutton Member conformably overlies the Morris Marble Member. The Sutton Member hosts gold mineralization at the Gold Ace deposit near the lower contact with the Morris Marble Member and adjacent to vertical faults. The unit is about 152 m (500 ft) thick.
Juhl Member (Zsj)
The Juhl Member consists of white to pale yellowish-brown, medium to thickly bedded, fine-grained orthoquartzite. The orthoquartzite is silicified, brittle and highly fractured adjacent to and within the footwall of the Good Hope fault. The basal contact is gradational with the underlying Sutton Member. The Juhl Member conformably overlies the Sutton Member. Minor gold mineralization is found in the Juhl Member along the Good Hope fault, and occasionally below the Wood Canyon Formation within the Good Hope fault zone. The unit is approximately 76 m (250 ft) thick.
| Effective Date: May 31st, 2022 | | 38 |
| Technical Report - Mineral Resource Estimate Reward Project, Nye County, Nevada, USA |
Figure 7.5. Lower Portion of the Bare Mountains Complex Stratigraphic Column Observed at the Project.
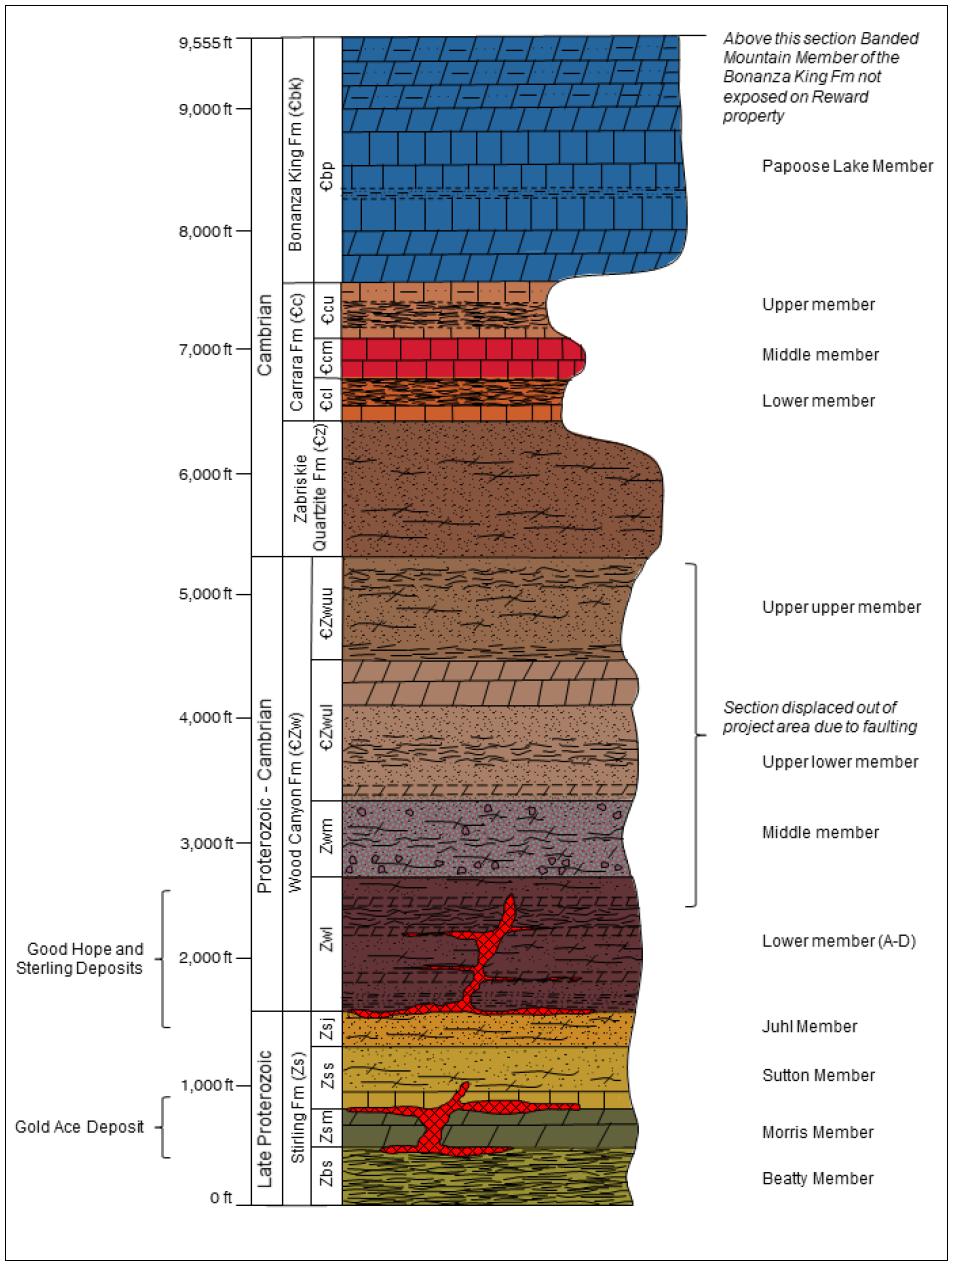
Note: Modified after Monsen et al., 1992.
| Effective Date: May 31st, 2022 | | 39 |
| Technical Report - Mineral Resource Estimate Reward Project, Nye County, Nevada, USA |
| 7.3.2 | Proterozoic-Cambrian |
Wood Canyon Formation (Zwc)
Only 750 ft of the basal section of the Wood Canyon Formation is preserved in the Project area. The Wood Canyon Formation conformably overlies the Juhl Member of the Stirling Formation. The upper member of the Wood Canyon Formation is Cambrian in age and the middle and lower members are Late Proterozoic in age. The thicknesses of the upper, middle and lower members are around 610 m (2,000 ft), 110 m (360 ft), and 305 m (1,000 ft), respectively.
The Wood Canyon Formation is the main host for gold mineralization within the Project area. Gold is hosted in quartz veins and silicic alteration, in association with the Good Hope fault and, to a lesser extent, along the Good Fortune fault.
Three conspicuous orange to grey dolomite beds with dissolution textures define the basal section. The lower members of the basal section of the Wood Canyon Formation (Zwl) are listed below from oldest to youngest.
| 7.3.3 | Cambrian |
Zabriskie Quartzite (Cz)
The Zabriskie Quartzite is a massive, thickly bedded, commonly laminated and cross-bedded, cliff-forming orthoquartzite. Trace fossils, primarily Scolithus, are common in the lower beds of the unit (Monsen et al., 1992). The quartzite is conformable with the underlying Wood Canyon Formation. The Zabriskie Quartzite is juxtaposed against the Wood Canyon Formation along the southern portion of the Good Fortune fault. The unit is about 1, 343 m (1,125 ft) thick.
Carrara Formation (Cc)
The Carrara Formation is a heterogeneous unit of quartzite and phyllite with prominent intervals of limestone and silty limestone. The unit conformably overlies the Zabriskie Quartzite and can be divided into three parts, lower, middle and upper, that have a combined thickness of 366 m (1,200 ft.) The formation is exposed to the east of the Good Hope fault zone.
| Effective Date: May 31st, 2022 | | 40 |
| Technical Report - Mineral Resource Estimate Reward Project, Nye County, Nevada, USA |
Bonanza King Formation (Cbp)
The Bonanza King Formation consists of cliff-forming, thin to thick, dark grey and white alternating limestone and dolomite beds intercalated with minor, distinct, yellowish-orange silty and sandy intervals.
The upper 20 m (65 ft) of the sequence consists of silty and sandy dolomite and limestone. The uppermost portion grades downward into medium- to thickly bedded dolomite and limestone with silty and sandy beds. The basal part typically consists of white dolomite and limestone with yellowish-orange, silty layers. The basal contact is gradational and is defined as where white, silty limestone and dolomite grade into a dark grey limestone.
The unit is exposed to the east of the Good Hope fault zone and is juxtaposed against the Wood Canyon Formation along the central to north portion of the Good Fortune fault and the main area of gold mineralization. The average unit thickness is about 640 m (2,100 ft).
| 7.4 | Structure |
The oldest deformational features include minor folds within sedimentary units that developed during the Mesozoic compressional event (Monsen et al., 1992). The known major faults are shown on Figure 7.3. A series of north-trending faults cut and offset the folded units including the east-dipping Good Hope fault zone. The Good Hope fault zone has been mapped and logged from the southern property boundary to three miles north of the northern boundary. Several faults with similar trends are also observed in the footwall and hanging wall blocks. Figure 7.6 outlines the structures visible at section 3500 N.
| 7.4.1 | Good Hope Fault Zone |
Within the Project area, the east-dipping Good Hope fault zone ranges from 15 m (50 ft) to 192 m (630 ft) in width and has a 1,585 m (5,200 ft) strike extent. The fault zone has an overall northerly trend but between 5100 N to 3000 N rotates to a north-northwest trend. The fault zone juxtaposes Bonanza King Formation in the hanging wall block, Wood Canyon Formation in the central fault zone and Late Proterozoic units in the footwall.
The fault zone comprises the Good Fortune fault that is located on the eastern or hanging-wall side (Figure 7.) and has a moderate dip, while the Good Hope fault defines the western (or footwall) extent and has a steep dip. The Good Hope fault controls the majority of the known alteration and gold mineralization.
Textures observed within the fault zone include breccias, quartz veins, elevated silicic alteration and localized clay-rich zones. Exposed quartz veins display a dominant northerly trend and secondary sigmodal veins display an east-northeast trend (Figure 7.7). Veins measurements from oriented drill core highlight two dominant vein sets with orientations that include a moderate dip to the southeast (45°→140°) and a steep dip to the northeast (70°→050°; Brown, 2018). The line of intersection for these two vein sets is moderate dip to the southeast (43°→120°).
| Effective Date: May 31st, 2022 | | 41 |
| Technical Report - Mineral Resource Estimate Reward Project, Nye County, Nevada, USA |
The Good Hope fault zone is interpreted to have undergone right lateral, strike-slip/dip-slip movement based on regional observations, historical mapping combined with structural field observations and slickensides along fault planes. Previous work has estimated at least 1,676 m (5,500 ft) of vertical displacement (west side up) and 610 m (2,000 ft) of lateral movement (Turner, 1990).
Figure 7.6. 3500N Geology Cross-Section.
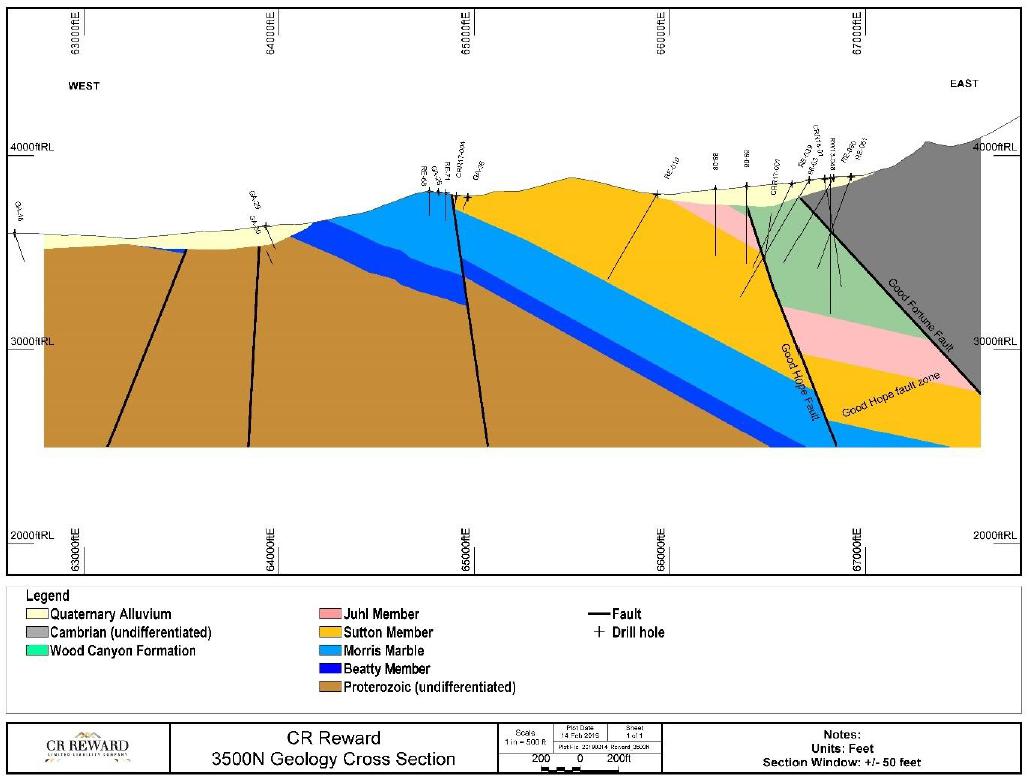
Note: Figure prepared by Lycopodium, 2019
| Effective Date: May 31st, 2022 | | 42 |
| Technical Report - Mineral Resource Estimate Reward Project, Nye County, Nevada, USA |
Figure 7.7. Photo Highlighting Vein Orientation in Outcrop.
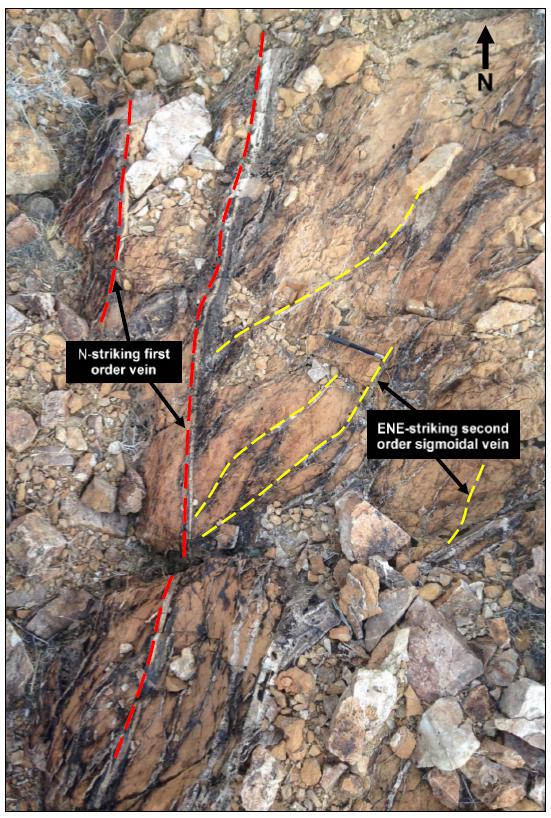
Note: From Barcia, 2017.
| Effective Date: May 31st, 2022 | | 43 |
| Technical Report - Mineral Resource Estimate Reward Project, Nye County, Nevada, USA |
| 7.5 | Alteration |
Four main alteration assemblages are observed across the Project: silicic, sericite, argillic, and propylitic, and these are spatially associated with the Good Hope fault zone.
Silicic alteration along the Good Hope fault laterally extends 15 m (50 ft) to 30 m (100 ft) toward the Good Fortune fault. Alteration within the central fault zone appears to have preferentially developed along moderately dipping bedding planes within the Wood Canyon Formation. Alteration intensity ranges from intense to weak and is typically associated with quartz ± adularia-calcite veins, goethite after pyrite, and local coarse adularia. Quartz veining varies in thicknesses from millimetres to meters.
Exposed quartz veins are commonly coated by manganese oxides and hematite. Massive white quartz veins are more abundant than banded veins. Prominent massive veins are exposed in the footwall block at the northern extent of the Good Hope Deposit. Colloform vein textures are observed at Ollie’s Follie target (Barcia, 2017).
The sericite assemblage is preferentially developed within mica-bearing units and is locally overprinted by silicic alteration.
Argillic alteration is locally restricted along portions of fault planes and characterized by the presence of kaolinite that was identified using quantitative evaluation of materials by scanning electron microscopy (QEMSCAN) analysis.
Propylitic alteration consists of calcite, chlorite, and ankerite. Calcite veinlets and stringers are observed throughout most units. Chlorite is preferentially developed in finer-grained units and biotite has been partially to pervasively replaced by chlorite.
| 7.6 | Oxidation (Redox) |
The redox zones within the Project area include an upper oxide and a lower transition zone. The upper oxide zone is characterized by hematite, goethite, pyrolusite and minor jarosite. Oxidation is strong within and adjacent to the Good Hope fault and decreases in intensity outward from the fault. The depth of the oxide zone ranges from 30 m (100 ft) to 152 m (500 ft) below surface (between 1,183 m (3,880 ft) to 1,027 m (3,370 ft) elevation ASL). Iron oxides comprise up to 5% of the rock mass.
The transition zone is located below the base of the oxide horizon and consists of both goethite and pyrite. In the transition zone, sulphides comprise <1% of the rock mass. The transition zone reaches the maximum depth of drilling on the Project at an elevation of 3,099 ft.
Drilling to date has not intersected a primary sulphide zone.
| Effective Date: May 31st, 2022 | | 44 |
| Technical Report - Mineral Resource Estimate Reward Project, Nye County, Nevada, USA |
| 7.7 | Mineralization |
Mineralization that supports Mineral Resource estimation is hosted in the Good Hope Deposit and the Gold Ace mineralized zone. Anomalous gold values are associated with quartz veining and/or iron-oxide-bearing, silicic-altered rocks in both areas. Pyrite and iron oxides are the dominant minerals associated with gold mineralization. Visible gold was identified on fractures in sericite-altered rocks, on quartz-adularia-coated fractures, and in hematite-filled cavities, pervasively silicic-altered rocks, goethite pseudomorphs, thin quartz veinlets, and goethite-rich fractures and cavities. Visible gold has been observed along the Gold Ace trend in surface samples and drill core, whilst it was observed only in drill core from Good Hope. Figure 7.8 shows the tenor of the gold anomalism encountered in drilling along the two mineralized trends.
| 7.7.1 | Description of Mineralization: Good Hope Deposit |
Gold mineralization at the Good Hope Deposit is primarily hosted in altered and veined Wood Canyon Formation, and to a lesser extent, in the Juhl and Sutton Members of the Stirling Formation. Gold mineralization is associated with:
| ● | Silicic and/or sericite-altered rocks. | |
| ● | Zones of increased quartz vein density. | |
| ● | Faults, breccias, and/or highly fractured zones with abundant iron oxides. | |
| ● | Units with high concentrations of goethite pseudomorphs after pyrite. | |
| ● | Quartz-adularia veinlets. |
Mineralization at the Good Hope Deposit varies in width from 15 m (50 ft) to 192 m (630 ft), has a strike length of 1,585 m (5,200 ft) and has been intersected to a vertical depth of 213 m (700 ft) below surface.
North of 5100 N, mineralization is spatially associated with the sub-vertical, north-trending Good Hope fault and is up to 149 m (190 ft) wide. Section 5600 N outlines mineralization north of 5100 N (Figure 7.9).
In the central portion of the deposit between 5100 N and 3000 N, mineralization is also associated with the Good Hope fault. Mineralization extends to the east with a shallow to moderate dip towards the hanging wall of the Good Fortune fault. Mineralization has been intersected along the Good Fortune fault and appears to be sub-parallel to the dip of the fault. In this central portion, mineralization is up to 192 m (630 ft) thick and coincides with a change in fault zone strike from north to north-northwest. Sections 4200 N (Figure 7.10), and Section 4800 N (Figure 7.11) outline mineralization in the central part of the deposit.
South of 3000 N, the gold mineralization continues to be spatially associated with the sub-vertical, north-trending Good Hope fault, and is up to 55 m (180 ft) thick (Figure 7.12). However, limited drilling has occurred south of this section and therefore mineralization controls are less well constrained.
| Effective Date: May 31st, 2022 | | 45 |
| Technical Report - Mineral Resource Estimate Reward Project, Nye County, Nevada, USA |
Figure 7.8. Gold Mineralization at Reward Intersected by Drilling.
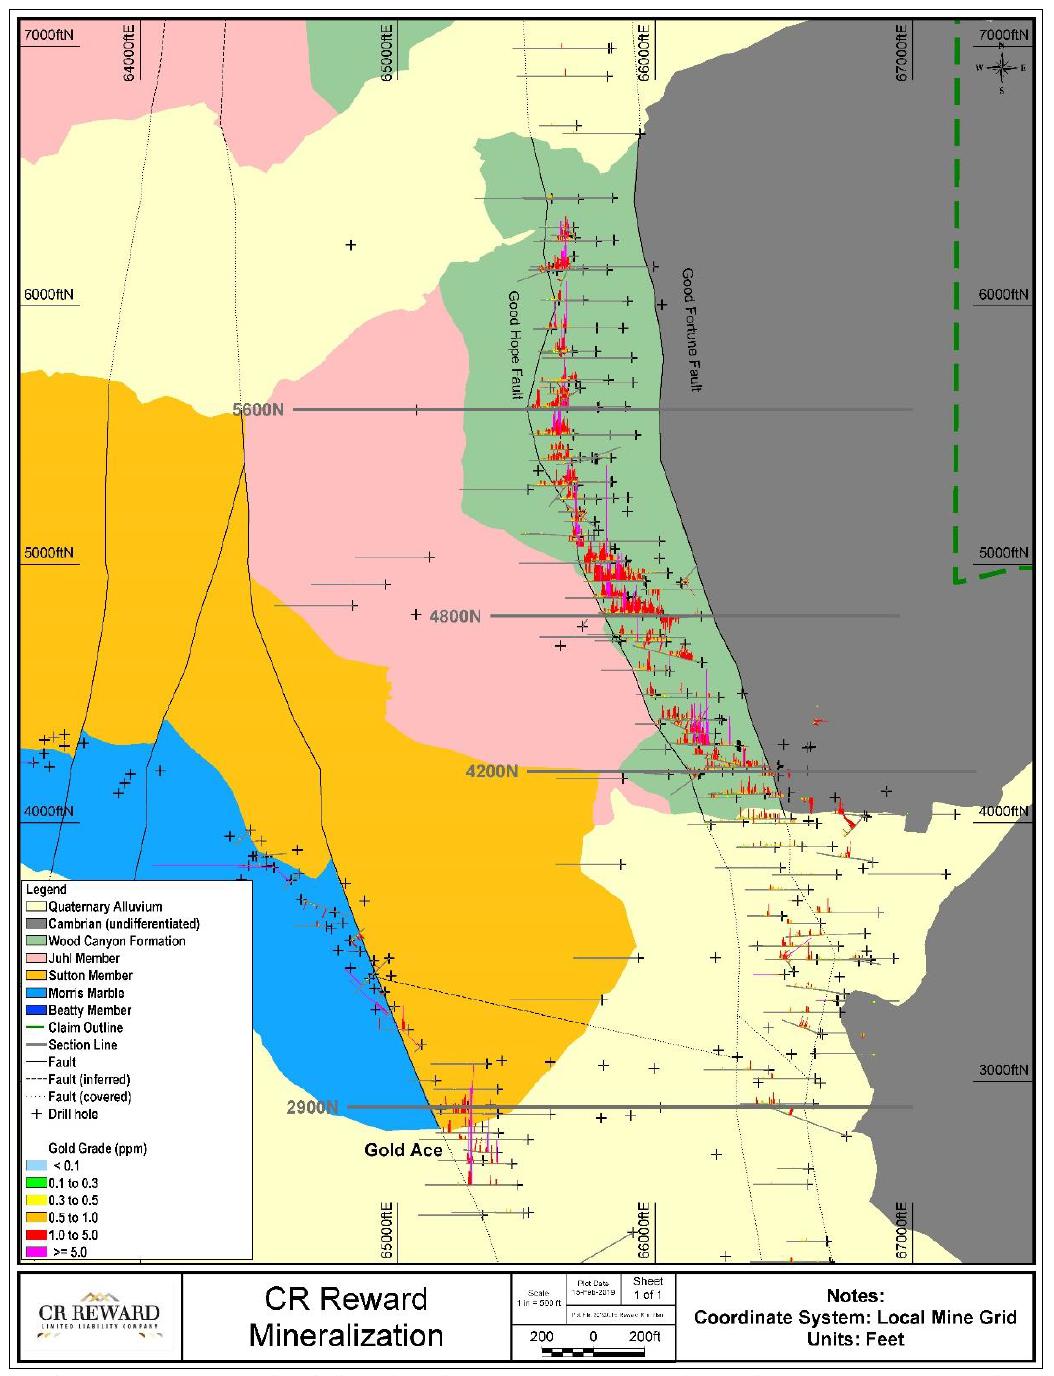
Note: The Good Hope Deposit is situated between the Good Hope and Good Fortune faults. The Gold Ace Zone is located near 3000 ft N and 65000 ft E. Figure prepared by Lycopodium, 2019.
| Effective Date: May 31st, 2022 | | 46 |
| Technical Report - Mineral Resource Estimate Reward Project, Nye County, Nevada, USA |
| 7.7.2 | Description of Mineralization: Gold Ace Mineralized Zone |
Mineralization at Gold Ace is dominantly located along the contact between the Sutton and Morris Marble Members (Figure 7.12). At the mineralized contact, the Morris Marble Member is characterized by silicic alteration and hematite. Evidence for mineralization parallel to the contact between the Sutton and Morris Marble Members is provided by low-angle, east-dipping stopes from historical underground mining. The northwest-trending Gold Ace Zone consists of several discrete structures. The overall continuity of mineralization at Gold Ace is less well developed than at the Good Hope Deposit.
Mineralization at the Gold Ace varies in width from 1.5 m (5 ft) to 21 m (70 ft), has a strike length of 640 m (2,100 ft) and has been intersected to a vertical depth of 91 m (300 ft) below surface.
Figure 7.9. Mineralization along Section 5600 N Looking North.
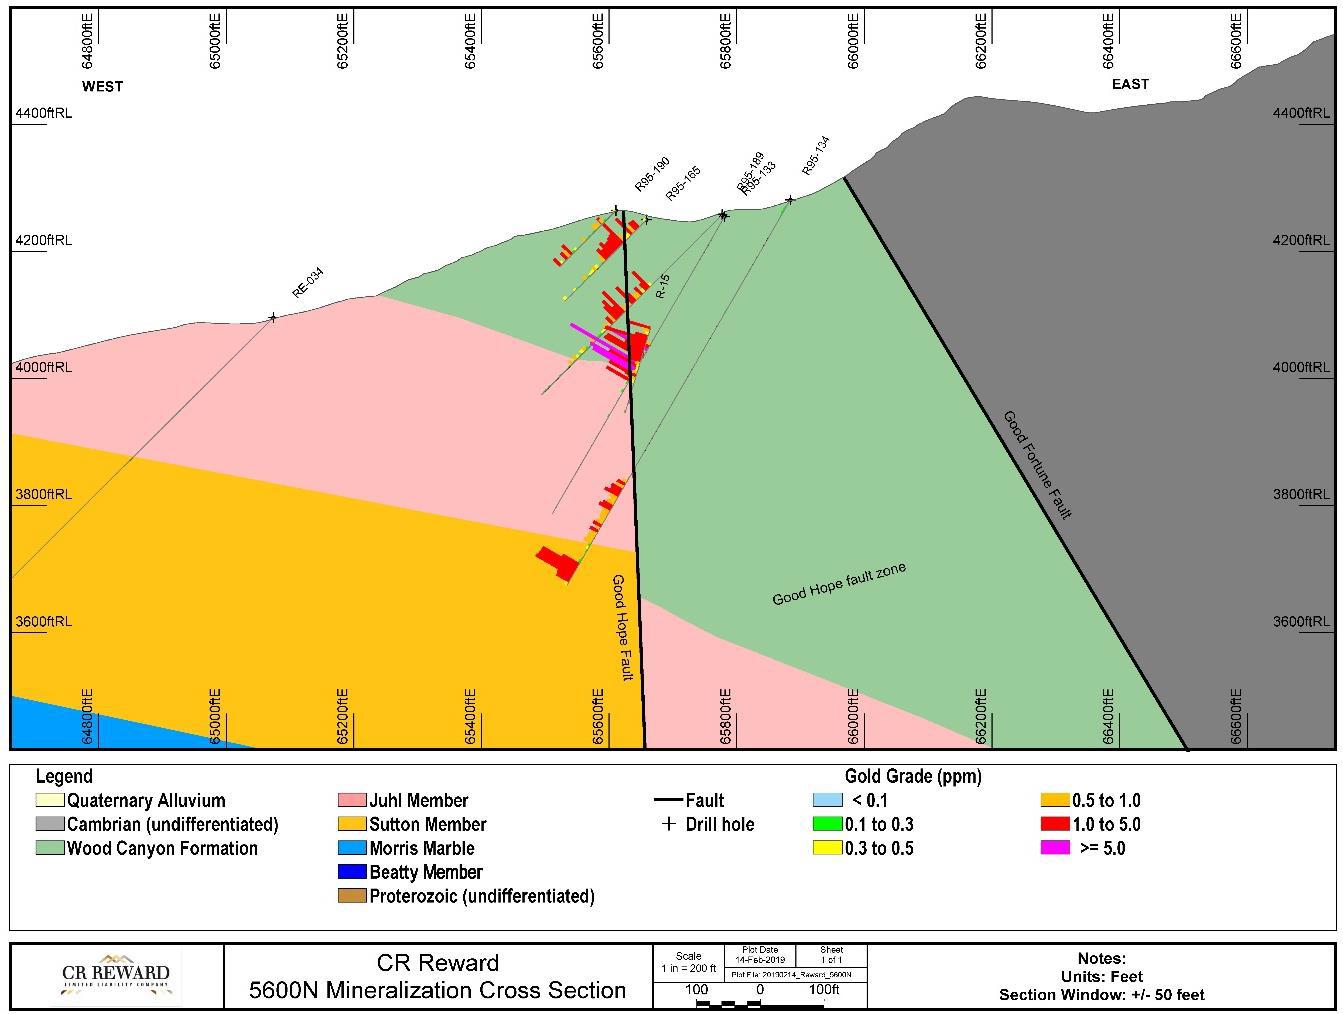
Note: Mineralization along the Good Hope fault on the west side of the Good Hope fault zone. Figure prepared by Lycopodium, 2019.
| Effective Date: May 31st, 2022 | | 47 |
| Technical Report - Mineral Resource Estimate Reward Project, Nye County, Nevada, USA |
Figure 7.10. Mineralization along Section 4200 N Looking North.

Figure 7.11. Mineralization along Section 4800 N, Looking North.
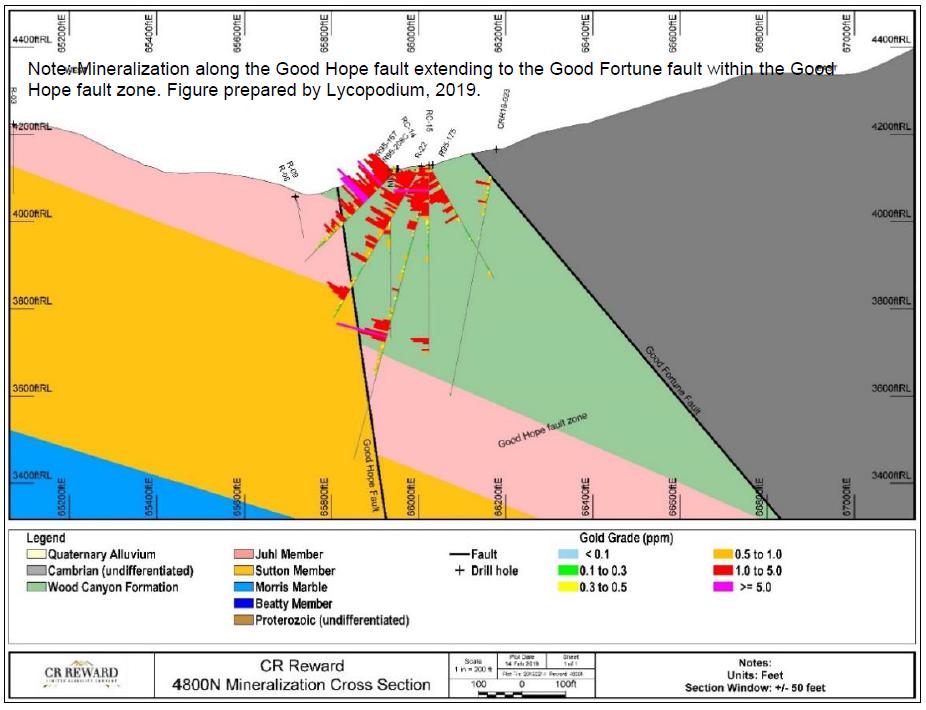
| Effective Date: May 31st, 2022 | | 48 |
| Technical Report - Mineral Resource Estimate Reward Project, Nye County, Nevada, USA |
Figure 7.12. Mineralization along Section 2900 N Looking North.
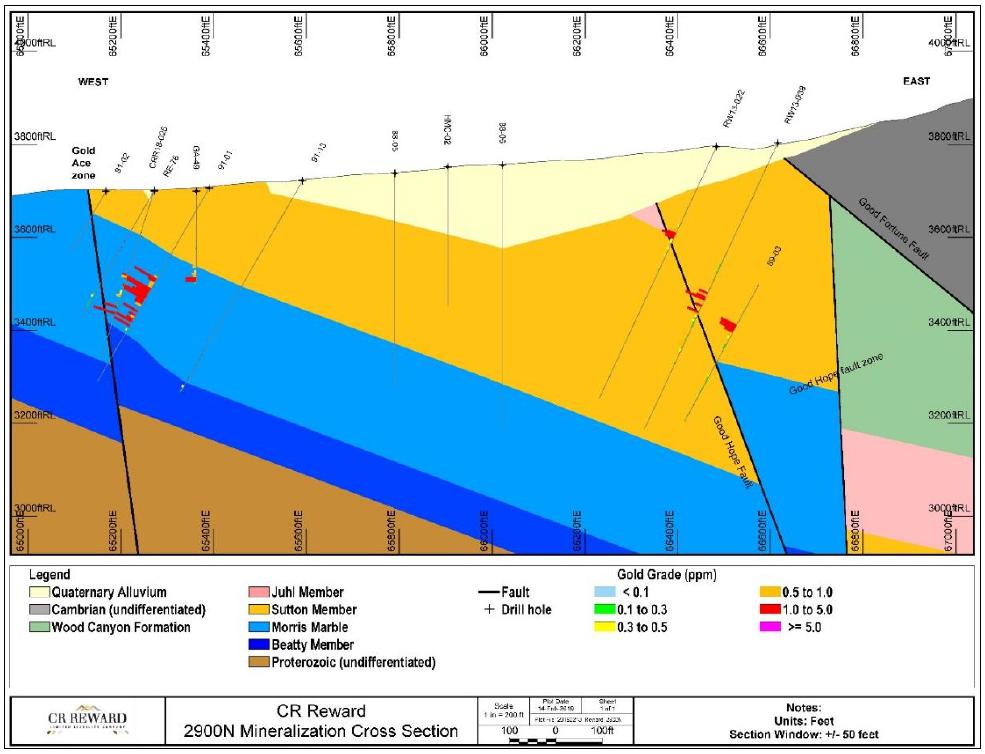
Note - Mineralization is narrow along the Good Hope fault at the Gold Ace zone, mineralization is located along the contact of the Sutton and Morris Marble members to an unnamed fault. Figure prepared by Lycopodium, 2019.
| 7.7.3 | Description of Mineralization: Exploration Update |
At the Good Hope Deposit, gold mineralization remains open to the east towards and along the Good Fortune fault and south of 3000 N. The eastern area of the deposit, most notably along the Good Fortune fault, has had limited exploration drilling. To the south of Good Hope, wide-spaced exploration drilling along the 914 m (3,000 ft) extension of the fault zone has returned several intercepts with narrow (<9.1 m (30 ft)) or low-grade (<0.017 opt) gold mineralization. The projected intersection of the Good Hope fault zone and the Gold Ace trend is another area that has had limited exploration drilling.
| Effective Date: May 31st, 2022 | | 49 |
| Technical Report - Mineral Resource Estimate Reward Project, Nye County, Nevada, USA |
| 8 | Deposit Types |
The structural setting, alteration mineralogy and mineralization characteristics of the Good Hope Deposit and Gold Ace Zone are consistent with orogenic gold deposits as defined in Moritz (2000), Goldfarb et al., (2005), Groves et al. (1998; 2003), and Johnston et al. (2015).
Orogenic gold deposits occur in variably deformed metamorphic terranes formed during Middle Archean to younger Precambrian, and continuously throughout the Phanerozoic. The host geological environments are typically volcano–plutonic or clastic sedimentary terranes, but gold deposits can be hosted by any rock type. There is a consistent spatial and temporal association with granitoids of a variety of compositions. Host rocks are metamorphosed to greenschist facies, but locally can achieve amphibolite or granulite facies conditions.
Gold deposition occurs adjacent to first-order, deep-crustal fault zones with interpreted long-lived structural controls. These first-order faults, which can be hundreds of kilometres long and kilometres wide, show complex structural histories. Economic mineralization typically formed as vein fill of second- and third-order shears and faults, particularly at jogs or changes in strike along the crustal fault zones. Mineralization styles vary from stockworks and breccias in shallow, brittle regimes, through laminated crack-seal veins and sigmoidal vein arrays in brittle-ductile crustal regions, to replacement- and disseminated-type orebodies in deeper, ductile environments. The specific style of mineralization at the Good Hope and Gold Ace deposits can be classified as both structurally controlled and locally disseminated.
Orogenic gold deposits in Nevada are situated along the Argentoro belt (Luning-Fencemaker Fold-and Thrust Belt of Wyld et al., 2000, 2001; DeCelles, 2004), a 700-km long, north-south trending belt extending from south-eastern California to the Nevada-Oregon border. The belt formed between ~100 Ma and 70 Ma synchronous with low-grade metamorphism and brittle-ductile deformation. District-scale controls consist of high-angle, N-striking strike-slip faults, while deposit-scale controls consist of NW-, EW-, and NE-striking dip-slip fracture arrays.
Johnston et at. (2015) outline that Nevada orogenic gold deposits are defined by: 1) widespread low to moderate-grade metamorphism in Mesozoic rocks, 2) low-sulphide bearing, mesothermal “bull-quartz” veins emplaced in shear zones, 3) ubiquitous quartz-sericite-pyrite alteration of wall rocks, 4) dilute CO2-rich ore fluids, 5) coarse gold in veins, 6) elevated concentrations of Ag, Sb, As, and Hg, and 7) abundant placer gold deposits. Except for placer deposits, the Good Hope and Gold Ace deposits match the criteria listed above.
| Effective Date: May 31st, 2022 | | 50 |
| Technical Report - Mineral Resource Estimate Reward Project, Nye County, Nevada, USA |
| 9 | Exploration |
| 9.1 | Introduction |
Exploration on and around the Project area has primarily consisted of surface geological mapping, rock-chip sampling, and drilling.
Exploration conducted by parties other than CR Reward is discussed in Section 6.
| 9.2 | CR Reward Exploration (2015-Present) |
In 2016, seventeen rock chip samples were collected consisting of veins and fault zones from Gold Ace (five samples), Good Hope (nine samples) and Ollie’s Follie (three samples). Samples were submitted to ALS Global for fire assay gold (lab code Au-ICP22 and Au-GRA22) and multi-element geochemistry analyses (lab code ME-MS61). Gold values from Gold Ace ranged from 0.008 to 17.85 ppm, Good Hope ranged from below detection up to 2.10 ppm Au, and Ollie’s Follie ranged from 0.001 up to 4.90 ppm Au. Gold Ace returned elevated Ag (up to 33 ppm), Cu (up to 476 ppm), Hg (up to 5.7 ppm), Pb (up to 1,435 ppm), Sb (up to 185 ppm), and Zn (up to 3,490 ppm), whereas Good Hope and Ollie’s Follie returned weakly anomalous values.
Two geophysical IP/resistivity lines were completed by Zonge International, Inc. in August 2016. Data were acquired along two lines:
| • | Line 1, oriented 045° northeast. |
| • | Line 2, oriented 051° northeast. |
IP/resistivity data were acquired on both lines using a dipole-dipole array with a dipole length of 100 m (328 ft) for a total of 3.9 line-km (3.9 line-mi) of data coverage. Data were acquired in a non-reference, complex resistivity mode. Line locations are shown in Figure 9.1. The IP/survey shows the strongest anomaly along the Gold Ace trend, with a weaker response along the Good Hope trend. Along the Gold Ace trend, line 1 indicates lithology controls mineralization while Line 2 indicates structure controls mineralization (resistivity high). These results correlate well with the modelled location of the Gold Ace fault.
In 2017, an extensive, property-wide data compilation and validation program was completed. Subsequent east-west, hand-interpreted, paper cross-sections were created and used to generate a 3D geologic model highlighting major faults and formational contacts. The geologic model was used to support Mineral Resource estimation.
In 2018, a 28-hole core drilling program was completed and results included in an updated geological model. Cross-sectional interpretations were completed infill the 2017 cross-sections.
| Effective Date: May 31st, 2022 | | 51 |
| Technical Report - Mineral Resource Estimate Reward Project, Nye County, Nevada, USA |
Figure 9.1. Plan View of the Project Area Showing the Locations of the IP/Resistivity Survey Lines.
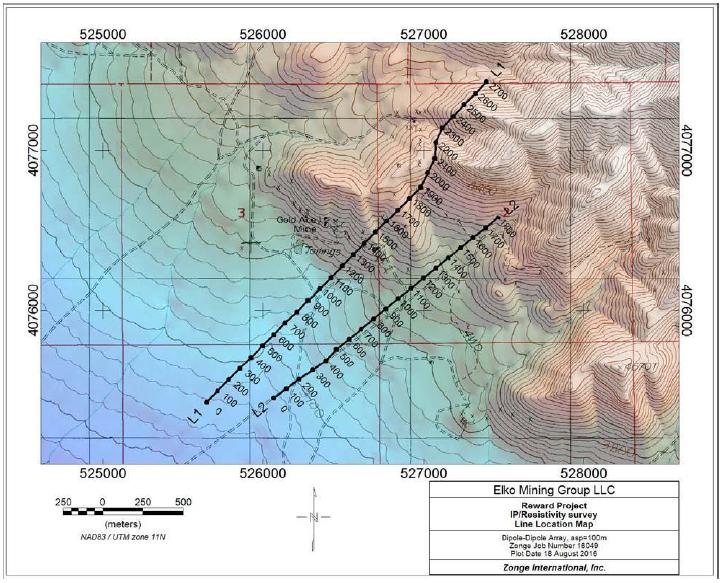
| 10 | Drilling |
The Project exploration drill hole database as of April 19th, 2018, contains 376 drill holes (totalling 43,687 m (143,330 ft)), seven road cuts (totalling 319 m (1,045 ft)) and three trenches (totalling 82 m (270 ft)). The road cuts and trenches were removed from the database for resource estimation purposes. No records for two drill holes (GA-33 and GA-35) of the 49 holes completed by Cloverleaf were located and therefore missing from the database. All drilling in the database is summarized in Table 10.1
Drill hole collar locations for the entire property are shown on Figure 10.1.
| Effective Date: May 31st, 2022 | | 52 |
| Technical Report - Mineral Resource Estimate Reward Project, Nye County, Nevada, USA |
Table 10.1. Reward Drilling Summary.
| Operating Company | Year | Core Holes | Reverse Circulation | Total | |||
| Number | Footage | Number | Footage | Number | Footage | ||
| Homestake | 1987 | 4 | 1,210 | 4 | 1,210 | ||
| Gexa | 1987 | 16 | 3,037 | 16 | 3,037 | ||
| Pathfinder | 1988 | 22 | 9,273 | 22 | 9,273 | ||
| Pathfinder | 1989 | 11 | 4,525 | 11 | 4,525 | ||
| Cloverleaf | 1990 | 47 | 8,625 | 47 | 8,625 | ||
| Pathfinder | 1991 | 17 | 8,300 | 17 | 8,300 | ||
| USNGS | 1992 | 7 | 2,119 | 7 | 2,119 | ||
| Barrick | 1995 | 3 | 773 | 83 | 35,295 | 86 | 36,068 |
| Barrick | 1996 | 5 | 2,960 | 5 | 2,960 | ||
| Glamis Gold | 1998 | 42 | 16,590 | 42 | 16,590 | ||
| Glamis Gold | 1999 | 19 | 10,295 | 19 | 10,295 | ||
| Glamis Gold | 2000 | 18 | 3,640 | 18 | 3,640 | ||
| Canyon | 2006 | 21 | 6,145 | 21 | 6,145 | ||
| Canyon | 2007 | 4 | 1,364 | 4 | 1,364 | ||
| Atna | 2011 | 15 | 8,880 | 15 | 8,880 | ||
| Atna | 2013 | 14 | 9,003 | 14 | 9,003 | ||
| CR Reward | 2017 | 14 | 4,989 | 14 | 4,989 | ||
| CR Reward | 2018 | 14 | 6,307 | 14 | 6,307 | ||
| Total | 35 | 13,433 | 341 | 129,897 | 376 | 143,330 | |
| Effective Date: May 31st, 2022 | | 53 |
| Technical Report - Mineral Resource Estimate Reward Project, Nye County, Nevada, USA |
Figure 10.1. Reward Drill Hole Locations.

| Effective Date: May 31st, 2022 | | 54 |
| Technical Report - Mineral Resource Estimate Reward Project, Nye County, Nevada, USA |
| 10.1 | Drill Methods, Logging and Surveys |
Summaries of drill campaigns by Gexa, Barrick, Glamis, Canyon, Atna and CR Reward are provided below. No drilling information exists for Homestake (4 holes), 1988-1989 Pathfinder (33 holes), Cloverleaf (47 holes) and USNGS (7 holes).
Reverse circulation drilling across all campaigns was conducted using both dry (from 1987 to 2006) and wet (from 2006 onwards) drilling techniques. All drilling was completed above the water table and no material down-hole contamination was noted in the RC drilling. RC drill holes were compared to neighbouring core holes and other RC holes using an Excel Spreadsheets. A visual assessment of the length and magnitude of gold grades indicated expected similarities for a structurally controlled, epithermal gold deposit. Statistical methods reviewed decay and cyclicity of grades for the RC holes and found no significant indication for contamination.
Limited down hole surveys exist for the pre-CR Reward holes. However, most mineralised intercepts from historical drill holes were within the first 500 ft and only minor down hole deviation is expected over these short depths combined with observed minimal deviation (<2°) from the CR Reward program.
| 10.1.1 | Gexa (1987) |
Gexa RC drilling was mostly carried out by Pollocks Drilling using an CP-650WS RC rig, hole diameters were 13.3 cm (5 ¼ inches) and logging captured drill recovery, lithology, colour, vein/silica alteration, oxide intensity, sulphide percentage. Drill hole inclinations were vertical or -60° towards the west (270°).
| 10.1.2 | Pathfinder (1991) |
Pathfinder RC drilling was carried out by Hawkworth Drilling using a Schramm truck mounted RC rig, hole diameters are unknown and logging captured drill recovery, lithology, vein/silica alteration, oxide intensity, fragment shape and sulphide percentage. Drill hole inclinations were -60° towards the west (270°).
| 10.1.3 | Barrick (1995-1996) and Glamis (1998-2000) |
Both Barrick and Glamis RC drilling were carried out by Eklund Drilling using an MPD-1500 RC rig, hole diameters were 13.0 cm (5 ⅛ inches) and logging captured lithology, vein abundance, oxide intensity, sulphide percentage. The three Barrick core holes were drilled with a DMW-65 core rig (operator unknown) and logging captured core recovery, lithology, vein abundance, oxide and sulphide intensity plus percentage. Core recovery for the three HQ (7.75 cm (3.05 inches) diameter) holes ranged from 85% to 96%. Majority of the holes from both companies were drilled towards the west (270°) at inclinations ranging from -40° to -75°. In 1995, Barrick surveyed collar coordinates in the local grid, as well as completed a review of all pre-Barrick holes and updated coordinates where necessary.
| Effective Date: May 31st, 2022 | | 55 |
| Technical Report - Mineral Resource Estimate Reward Project, Nye County, Nevada, USA |
| 10.1.4 | Canyon (2006-2007) |
Canyon RC drilling was carried out by Boart-Longyear, hole diameters were 14.0 cm (5½ inches) and logging captured lithology, vein abundance, oxide intensity, sulphide percentage. The four core holes were drilled with a CS1000PL and Hagby 1000 rigs (operator was Hansen Drilling) and logging captured core recovery, lithology, vein abundance, oxide and sulphide intensity plus percentage. Core was photographed and average core recovery for the holes was >95%. Majority of the holes from both companies were drilled vertically or towards the west (270°) at inclinations ranging from -60° to -80°. Down-hole surveys for core holes were collected every 30 m (100 ft) using an Easy Shot tool. Collar coordinates were surveyed by a licensed surveyor from Triangle Surveying.
| 10.1.5 | Atna (2011-2013) |
Atna RC drilling was carried out by National Drilling using a Schramm T65WS rig, hole diameters were 14.0 cm (5 ½ inches) and logging captured lithology, vein abundance, oxide intensity, sulphide percentage. Majority of the holes from both companies were drilled vertically or towards the west (270°) at inclinations ranging from -65° to -75°. Collar coordinates were surveyed by a licensed surveyor from Great West Surveying using a differential GPS instrument.
| 10.2 | CR Reward Core Drilling Program (2017-2018) |
CR Reward’s drilling in 2017 and 2018 was designed for the main purposes of collecting metallurgical samples (5 holes), obtaining geotechnical data and samples (7 holes), increasing the number of core holes and specific gravity determinations on the project as well as resource delineation (16 holes).
The program was conducted under the supervision of CR Reward geologists and by Major Drilling as the drilling contractor. All drilling was conducted using an LF 90D Surface Core rig with HQ diameter core. A total of 27 holes were planned but 28 holes were drilled due to the abandonment of hole CRR17-002 at 148 ft due to ground conditions and was re-drilled as CRR17-002A. Drill hole collar co-ordinates are provided in Table 10.2 and shown on Figure 10.1
The CR Reward geologists completed the following activities:
| ● | Geotechnical data was collected by CR Reward geologists included rock quality designation (RQD), core recovery, rock hardness, and fracture density. |
| ● | A detailed geological log was completed on the whole core by CR Reward geologists that included lithologic data, mineralization, hydrothermal alteration and structural features with respect to the core axis. |
| ● | The whole core was digitally photographed and high-resolution digital jpeg images were archived for future reference. |
| Effective Date: May 31st, 2022 | | 56 |
| Technical Report - Mineral Resource Estimate Reward Project, Nye County, Nevada, USA |
Down-hole surveys were completed at regular intervals, usually 7.6 m (25 ft), using an Ezi-Shot system that records the magnetic heading, dip of the hole and magnetic field in the hole. A total of 398 measurements were collected for the 28 holes drilled.
Core recovery during the core drilling was very good, exceeding 95% on average, with losses mainly in highly shattered zones.
Table 10.2. CR Reward Drill Hole Collars (2017-2018).
| Hole ID | Easting (ft) |
Northing (ft) |
Elevation (ft) |
Azimuth (º) |
Dip (º) |
Drilled Length (ft) |
| CRR17-001 | 66538.0 | 3424.6 | 3844.4 | 325 | -78 | 385 |
| CRR17-002 | 66175.4 | 4329.6 | 3990.8 | 300 | -60 | 148 |
| CRR17-002A | 66171.8 | 4331.5 | 3990.7 | 300 | -60 | 274 |
| CRR17-003 | 65779.0 | 5131.8 | 4180.4 | 310 | -57 | 375 |
| CRR17-004 | 64907.6 | 3467.2 | 3792.1 | 225 | -80 | 90 |
| CRR17-005 | 64429.3 | 3972.0 | 3920.4 | 225 | -60 | 175 |
| CRR17-006 | 64616.7 | 3804.4 | 3884.6 | 225 | -60 | 175 |
| CRR17-007 | 65755.2 | 5414.2 | 4288.0 | 74 | -70 | 380 |
| CRR17-008 | 64950.3 | 3345.5 | 3770.1 | 225 | -75 | 125 |
| CRR17-009 | 66819.8 | 4022.9 | 3953.9 | 275 | -75 | 523 |
| CRR17-010 | 66169.4 | 4186.8 | 3946.3 | 240 | -70 | 420 |
| CRR17-011 | 66592.0 | 4291.3 | 4008.4 | 16 | -70 | 663 |
| CRR17-012 | 66845.4 | 3847.7 | 3908.8 | 289 | -75 | 820 |
| CRR17-013 | 65699.2 | 4291.3 | 4191.9 | 275 | -60 | 436 |
| CRR18-014 | 66647.7 | 3847.7 | 3831.6 | 290 | -78 | 730 |
| CRR18-015 | 66099.0 | 5104.8 | 4207.5 | 55 | -75 | 643 |
| CRR18-016 | 66733.1 | 3180.3 | 3858.3 | 280 | -66 | 525 |
| CRR18-017 | 66897.5 | 4930.6 | 3984.5 | 30 | -60 | 400 |
| CRR18-018 | 64987.6 | 3338.1 | 3758.6 | 225 | -48 | 100 |
| CRR18-019 | 66790.2 | 4122.9 | 3879.8 | 104 | -80 | 564 |
| CRR18-020 | 65093.8 | 3288.3 | 3736.0 | 225 | -75 | 150 |
| CRR18-021 | 65328.5 | 3464.8 | 3695.9 | 270 | -75 | 350 |
| CRR18-022 | 66814.7 | 3140.7 | 3892.6 | 270 | -60 | 650 |
| CRR18-023 | 66178.2 | 4799.5 | 4165.7 | 270 | -80 | 575 |
| CRR18-024 | 66181.1 | 4619.5 | 4088.1 | 284 | -57 | 520 |
| CRR18-025 | 65270.8 | 2899.3 | 3700.3 | 270 | -72 | 375 |
| CRR18-026 | 66354.7 | 4217.5 | 3961.8 | 285 | -60 | 350 |
| CRR18-027 | 65386.9 | 2725.5 | 3694.3 | 270 | -70 | 375 |
| Effective Date: May 31st, 2022 | | 57 |
| Technical Report - Mineral Resource Estimate Reward Project, Nye County, Nevada, USA |
The relationship between intercept thickness and true thickness varies by hole dip and style of mineralization intercepted. Intercepts thicknesses typically represent 60% to 90% of the true mineralized thickness. The northern area of Good Hope (5200 N) has near vertical swath of mineralization approximately 18 m (60 feet) wide and 183 m (600 feet) tall. The central portion of Good Hope (4800 N) is 76 m (250 feet) thick and 131 m (430 feet) wide.
Data was compiled in Maxwell Geo Services’ Data Shed database software and exported as text files for import into a Vulcan database for resource estimation purposes. Program results are summarized in Table 10.3.
Table 10.3. Results of CR Reward Drill Holes (2017-2018).
| Hole ID | From
(ft) |
To
(ft) |
Drilled
Length (ft) |
Au
(oz/st) |
| CRR17-001 | 255 | 263 | 8 | 0.040 |
| CRR17-001 | 273 | 288 | 15 | 0.111 |
| CRR17-001 | 338 | 355 | 17 | 0.043 |
| CRR17-002 | 55.5 | 72.8 | 17.3 | 0.155 |
| CRR17-002 | 80 | 106.1 | 26.1 | 0.049 |
| CRR17-002 | 135.5 | 148 | 12.5 | 0.053 |
| CRR17-002A | 53 | 103 | 50 | 0.071 |
| CRR17-002A | 131 | 140 | 9 | 0.055 |
| CRR17-002A | 176 | 237 | 61 | 0.033 |
| CRR17-003 | 144 | 185.5 | 41.5 | 0.031 |
| CRR17-004 | No significant assays | |||
| CRR17-005 | No significant assays | |||
| CRR17-006 | No significant assays | |||
| CRR17-007 | No significant assays | |||
| CRR17-008 | 53 | 63 | 10 | 0.075 |
| CRR17-009 | 338 | 440 | 102 | 0.050 |
| CRR17-009 | 455 | 467 | 12 | 0.028 |
| CRR17-010 | 3 | 15 | 12 | 0.019 |
| CRR17-010 | 40 | 60 | 20 | 0.071 |
| CRR17-010 | 69 | 93 | 24 | 0.015 |
| CRR17-011 | 297 | 315 | 18 | 0.034 |
| CRR17-011 | 328 | 376 | 48 | 0.046 |
| CRR17-011 | 537 | 546 | 9 | 0.027 |
| CRR17-012 | 350 | 418 | 68 | 0.048 |
| CRR17-012 | 464 | 474.5 | 10.5 | 0.023 |
| CRR17-013 | No significant assays | |||
| CRR18-014 | 255 | 264 | 9 | 0.035 |
| CRR18-014 | 314 | 358 | 44 | 0.034 |
| Effective Date: May 31st, 2022 | | 58 |
| Technical Report - Mineral Resource Estimate Reward Project, Nye County, Nevada, USA |
| Hole ID | From (ft) |
To (ft) |
Drilled Length (ft) |
Au (oz/st) |
| CRR18-014 | 379 | 433 | 54 | 0.034 |
| CRR18-015 | 16 | 45 | 29 | 0.044 |
| CRR18-015 | 84 | 98 | 14 | 0.030 |
| CRR18-015 | 106 | 121.5 | 15.5 | 0.020 |
| CRR18-016 | 301 | 346.5 | 45.5 | 0.022 |
| CRR18-016 | 441 | 452 | 11 | 0.028 |
| CRR18-017 | No significant assays | |||
| CRR18-018 | 46.1 | 59 | 12.9 | 0.106 |
| CRR18-019 | No significant assays | |||
| CRR18-020 | No significant assays | |||
| CRR18-021 | 180 | 210 | 30 | 0.099 |
| Includes | 185 | 190 | 5 | 0.468 |
| CRR18-022 | 352 | 368.5 | 16.5 | 0.037 |
| CRR18-022 | 434 | 453 | 19 | 0.032 |
| CRR18-022 | 526 | 537 | 11 | 0.038 |
| CRR18-022 | 547 | 567 | 20 | 0.019 |
| CRR18-023 | 70 | 89 | 19 | 0.030 |
| CRR18-023 | 108 | 131 | 23 | 0.023 |
| CRR18-024 | 67.5 | 250 | 182.5 | 0.042 |
| CRR18-024 | 312 | 327 | 15 | 0.072 |
| CRR18-024 | 421 | 485 | 64 | 0.023 |
| CRR18-025 | No significant assays | |||
| CRR18-026 | 64 | 117.6 | 53.6 | 0.029 |
| CRR18-026 | 173.1 | 184.5 | 11.4 | 0.025 |
| CRR18-026 | 225.2 | 305.4 | 80.2 | 0.044 |
| CRR18-027 | 100 | 113 | 13 | 0.135 |
| CRR18-027 | 132 | 150 | 18 | 0.067 |
| CRR18-027 | 244 | 264 | 20 | 0.052 |
| CRR18-027 | 274 | 284 | 10 | 0.017 |
| 10.3 | Twin Holes |
Core twin holes of RC holes were drilled by Barrick to collect metallurgical samples. The mineralised interval thickness between the original and twin hole are considered excellent (Table 10.4) and correlation of Au grades are considered good for the style of deposit. The re-drill of core hole CRR17-002 with core hole CRR17-002A also shows an excellent correlation for grade and interval thickness.
Assessment of the core and RC twin holes was conducted with Excel spreadsheets where the grade versus depth was plotted for the core hole and the RC twin on the same plot. Differences, based on thickness of the mineralized zone and magnitude of the grade, were displayed allowing for visual detection of variances in the grades. As the distance between sample pairs increased, variances in the grades were give less consideration.
| Effective Date: May 31st, 2022 | | 59 |
| Technical Report - Mineral Resource Estimate Reward Project, Nye County, Nevada, USA |
Table 10.4. Results of Reward Twin Holes.
| Original Hole ID | From
(ft) |
To
(ft) |
Interval
(ft) |
Au
(oz/st) |
Twin Hole ID | From
(ft) |
To
(ft) |
Interval
(ft) |
Au
(oz/st) |
| R95-127 | 80.0 | 195.0 | 115.0 | 0.046 | R95-206C | 80.0 | 190.0 | 110.0 | 0.067 |
| R95-130 | 55.0 | 175.0 | 120.0 | 0.049 | RC95-207C | 55.0 | 175.0 | 120.0 | 0.068 |
| R95-130 | 215.0 | 260.0 | 45.0 | 0.013 | RC95-207C | 205.0 | 272.2 | 67.2 | 0.007 |
| R95-167 | 5.0 | 245.0 | 240.0 | 0.049 | RC95-208C | 9.0 | 249.2 | 240.2 | 0.054 |
| CRR17-002 | 7.4 | 148.0 | 140.6 | 0.032 | CRR17-002A | 7.0 | 144.0 | 137.0 | 0.031 |
| 10.4 | Comments on Drilling |
In the opinion of the QP, the quantity and quality of the lithological, alteration, mineralisation, collar and down hole survey data collected across all campaigns are sufficient to support Mineral Resource estimation as follows:
| ● | RC drilling was completed above the water table and no evidence of down-hole contamination has been identified. |
| ● | RC and core logging meets industry standards for this type of deposit. |
| ● | Collar surveys have been performed using industry-standard instrumentation. |
| ● | Down hole surveys were performed using industry-standard instrumentation and minimal down hole deviations are observed. |
| ● | Recovery data from core drill programs are acceptable. |
| 11 | Sample Preparation, Analyses and Security |
| 11.1 | Pre-CR Reward Drill Sampling, Analysis and Security |
All RC drill campaigns sampled cuttings on 1.5 m (5 ft intervals). For the core holes, Barrick sampled half core on 1.5 m (5 ft) intervals, Canyon sampled half core on 3 m (10 ft) intervals and CR Reward sampled half core predominantly on 1.5 m (5 ft) intervals or shorter based on geological breaks.
No sampling and analytical information is available for the campaigns completed by Homestake, Pathfinder, Cloverleaf or USNGS.
| 11.1.1 | Gexa (1987) |
Gexa submitted Au and Ag samples to an internal lab for analysis that included a cyanide digest with atomic absorption (AA) finish. Fire assay (FA) Au samples were submitted to Bondar-Clegg and Company Ltd for analysis. No information is available for how the samples were prepared, size of the analytical samples or QAQC protocols.
| Effective Date: May 31st, 2022 | | 60 |
| Technical Report - Mineral Resource Estimate Reward Project, Nye County, Nevada, USA |
| 11.1.2 | Barrick (1995-1996) |
Barrick samples from 1995 were prepared and analyzed by Chemex Labs, Inc., Nevada. Sample preparation included 4-7 kg (8.8-15 lb) of material was crushed (Chemex code 294), followed by 200-250 g (7.1-8.8 oz) subsample was split and pulverized in a ring mill to approximately 150 mesh (Chemex code 205). Gold analytical methods included 30 g FA digest with atomic absorption finish (AA; Chemex code 99), 1 assay ton (29 g) FA with gravimetric finish for all results >0.3 oz/st Au and most results >0.18 oz/st Au (Chemex code 997). Barrick ran 30 g (1.1 oz) cold cyanide leach with AA finish (Chemex code 830) for select samples from five holes. Silver was analysed using an aqua-regia digest with AA finish (Chemex code 6). Chemex reported internal standard, duplicate and blank results but no information is available for Barrick’s internal QAQC protocols.
Barrick samples in 1996 were analyzed by Barringer Laboratories Inc., Colorado. No information is available for how the samples were prepared. Analytical methods included Au reported from a FA digest with AA and Ag reported from an aqua-regia digest with AA finish.
| 11.1.3 | Glamis (1998-2000) |
Glamis submitted samples for fire assay Au and aqua-regia Ag analyses to Rocky Mountain Geochemical of Nevada (RMGN), and for cyanide Au analysis to Marigold Mine (MMC). No information is available for how the samples were prepared, size of the analytical samples or QAQC protocols.
| 11.1.4 | Canyon (2006-2007) |
Canyon reverse circulation sampling procedure included two samples collected (one for laboratory analysis and the second retained as a duplicate) over every 1.5 m (5 ft) interval using a wet rotary splitter. Samples were collected using two 19 L (five-gallon) plastic buckets. Drill core was saw cut down the long axis of the core, sampling collected at regular 1.5 m (5 ft) intervals in a labelled sample bag. The remaining half of the core was retained for reference. All RC and core samples were stored in a locked steel transport container on site until transportation to the assay laboratory.
Sample preparation and analyses for all RC and drill core samples were submitted to the ALS Global (ALS) in Reno Nevada. ALS is an independent, accredited laboratory with ISO 9001:2000 certification. Upon receipt at the laboratory samples were dried, crushed to P70 <2 mm (0.08 inch) and 200 g (7.1 oz) sample was riffle split then pulverized to P85 <75 μm. Gold analysis was completed on a 30 g (1.1 oz) split using a FA digest with an atomic absorption spectroscopy (AA) finish (ALS code Au-AA23). Select intervals for metallurgical purposes from core holes MC-1, MC-3 and MC-5 were also analyzed for Au using ore grade 30 g (1.1 oz) FA with AA finish (ALS code Au-AA25) for an original and duplicate sample, a 30g (1.1 oz) cyanide leach with AA finish for Au, and a 0.4 g (.01 oz) four acid with ICP-AES or AA finish for Ag. Received sample weights were also reported on the certificate of analysis.
| Effective Date: May 31st, 2022 | | 61 |
| Technical Report - Mineral Resource Estimate Reward Project, Nye County, Nevada, USA |
Canyon QAQC protocols included one certified standard inserted approximately every tenth sample. Two Rock Labs certified standards during the campaign included SK21 (0.118 oz/st Au) and SG14 (0.029 oz/st Au), and blank material used was silica sand. A total of 37 certified standards were inserted along with 1,224 RC samples and 183 core samples during the 2006 and 2007 drilling campaigns. It is unknown if any blanks or duplicates were inserted as part of the QAQC. Results from the Canyon campaigns included:
| ● | Majority of the standards returned low relative standard deviations of less than 6% and a low bias range of -2.7% to 0.0%. Five of the 21 SK21 standards were below the minus three standard deviations and therefore potentially represent a low bias for those intervals. All 11 results from standard SG14 were within three standard deviations. |
| 11.1.5 | Atna (2011-2013) |
Atna’s reverse circulation sampling procedure included one sample collected over every 1.5 m (5 ft) interval using a wet rotary splitter and a field duplicate sample was collected every 20th sample (or 30 m (100 ft) intervals) from a secondary rotary splitter. Samples were collected using pre-numbered cloth sample bags (labelled without reference to the drill hole interval). Standard reference material and blanks were inserted in the sample sequence by Atna prior to laboratory despatch.
The sample preparation and analytical analyses for all RC chip samples from the 2011 program were completed at Inspectorate in Sparks, Nevada. Inspectorate is an independent, accredited laboratory with ISO 9001:2000 certification. Samples submitted were dried and crushed to P80 <1.7 mm then split and pulverized to P85 <75 μm. Gold analysis was completed on a 1-assay ton (29 g (1 oz)) split with a FA digest and AA finish. If samples assayed >0.3 oz/st Au. (Inspectorate code Au-1AT-AA). Inspectorate completed a second 1-assay ton analysis with a fire assay digest and gravimetric finish (Inspectorate code Au-1AT-GV).
For the 2013 program, Atna submitted samples to American Assay Laboratories (AAL) in Sparks, Nevada. AAL is an independent, accredited laboratory with ISO 17025:2005 accreditation. Samples submitted were dried and crushed to P70 <2mm (0.08 inch) then split and pulverized to P85 <75μm. Gold analysis was completed on a 1-assay ton (29g (1 oz)) split with a fire assay digest and AA finish. If samples assayed >0.3 oz/st Au. (AAL code Au-FA30). Inspectorate completed a second 1-assay ton analysis with a FA digest and gravimetric finish (AAL code Au-GRAV). Received sample weights were also reported on the certificate of analysis.
| Effective Date: May 31st, 2022 | | 62 |
| Technical Report - Mineral Resource Estimate Reward Project, Nye County, Nevada, USA |
Atna’s QAQC protocols for both campaigns included a certified standard and blank that were inserted alternatingly every approximate tenth sample. Thirteen Rock Labs standards (OxA71, OxA89, OxC102, OxE86, OxF65, OxF100, OxG99, OxH66, OxJ68, SF45, SI54, SJ53) were used with recommended values ranging from 0.0025 oz/st Au to 0.0769 oz/st Au. Blank material used was red basaltic cinder.
Atna submitted a total of 198 standards, 216 blanks and 165 field duplicate samples along with a total of 3,570 RC samples during the 2011 and 2013 drilling campaigns. QAQC results from the Atna campaigns included:
| ● | Five hundred and seventy-nine (579) QAQC samples were inserted, representing one QA/QC samples for every 7.2 core samples, or 14.0% of the total samples submitted. |
| ● | A 99% pass rate for the blank material, with only two of the 101 blanks from the 2011 program above the threshold. |
| ● | Majority of the standards returned low relative standard deviations of less than 5% and a low bias range of -3.7% to 0.3%. A total of 13 of the 198 standards were outside of three standard deviations with the nine of the failures associated with recommended standard values of <0.006 oz/st Au. |
| ● | Sixty-two of the 165 field duplicate samples yielded mean values >0.003 oz/st and the overall variability was low (<30% coefficient of variation). |
| 11.2 | CR Reward Sampling, Analysis and Security (2017-2018) |
CR Reward drilling and sampling was carried out under the supervision of CR Reward geologists. The chain custody involved from the field to the sample preparation facility was continually monitored. Drill core was collected from the drill rig by CR Reward personnel and transported to a secure logging facility in Beatty, Nevada for the first half of the drill program. For the second half of the program the drill core was shipped to the ALS laboratory facility in Reno for logging.
Subsequent to completion of core logging and photography, the sampling protocol involved:
| ● | The core and core box were marked for by CR Reward personnel for sample collection and sample tags were stapled to the core box at the beginning of the interval. The dominant sample interval length was 5ft with lengths adjusted based on lithological and alteration changes. The maximum sample length of 4.6 m (15 ft) and minimum of 0.2 m (0.7 ft). |
| ● | Whole HQ-size core was cut in half (rock sawed) by ALS staff at their Reno facility. Sawed core sample intervals were recorded on daily cut core sheets for review each day. |
| ● | Samples for geochemical analysis were collected by laboratory personnel and placed into bags. The samples comprised one half of the HQ-size core, with the remaining core for each retained in their original core boxes. Core split by ALS staff were retained in core boxes stored in secured ALS warehouses. |
| Effective Date: May 31st, 2022 | | 63 |
| Technical Report - Mineral Resource Estimate Reward Project, Nye County, Nevada, USA |
Standard reference material blanks and field duplicates were inserted into the sample sequence at the rate of approximately one in every 10 samples.
| 11.2.1 | Diamond Drill Core Sample Preparation and Analysis |
The 2017–2018 drill program totalled 3,443 m (11,296 ft), which included 28 core-holes, 2,330 samples, and 22 unsampled intervals due to poor or no core recovery. A total of 2,760 samples, inclusive of QA/QC samples, were submitted to ALS and Florin Analytical (FLOR) for preparation and analyses. All geochemical analyses were completed by ALS, with the exception of CRR17-004 that was analysed at FLOR. ALS is an independent, accredited laboratory with ISO 9001:2000 certification. Figure 11.1 is a flowsheet summarizing the sample preparation and analysis protocols used for the 2017–2018 drill program.
CR Reward personnel arranged shipping to the ALS facility in Reno, Nevada, for sample preparation and geochemical analysis. Samples were logged into a computer-based tracking system, weighed and dried. Samples were removed for bulk density measurements conducted using paraffin wax coated samples and a water displacement method (ALS code OA-GRA09a). Bulk density determinations were carried out at ALS’ Vancouver laboratory and these samples were not re-inserted for assaying. The entire assay sample was crushed so that +70% passes a 2 mm screen, then a 250 g (8.8 oz) split was selected and pulverized to better than P85 <75 µm (ALS code PREP-31Y). Two 30 g (1.1 oz) aliquots were extracted from the pulp and one 30 g (1.1 oz) sample was analysed for gold using a fire assay fusion, digestion and with atomic absorption spectroscopy followed up with an inductively-coupled plasma atomic emission spectroscopy (ICP-AES) finish (ALS code Au-AA23). The second 30 g (1.1 oz) sample was analysed using a cyanide leach digest followed by a AA finish (ALS code Au-AA13). Any fire assay samples that returned >0.292 oz/st Au were re-assayed using a second fire assay fusion with a gravimetric finish (ALS code Au-GRAV21). A 0.25 g (0.0089 oz) aliquot was split off for multi-element analysis using four acid digestion (ALS code ME-MS61m) with an inductively coupled plasma mass spectrometry (ICP-MS) finish. All assay analyses were completed at the ALS’ Reno laboratory.
In the case of FLOR, CR Reward arranged sample shipping to the FLOR laboratory in Reno, Nevada for sample preparation and geochemical analysis. Core submitted to FLOR were intended for metallurgical test work. Upon arrival at the laboratory, the core was laid out and the marked sample intervals were removed for physical testing (comminution test work) and bulk density test work. The remaining intervals (1.5 m (5 ft) intervals or as marked by CR Reward personnel) were bagged, weighed and stage crushed to minus 25 mm (0.98 inch). From each interval a 1,000 g (35.3 oz) portion was riffle split out, weighed and dried to a constant weight at 106°C. The dried material was then crushed to -1.7 mm (0.067 inch) and a 500 g (17.6 oz) portion was split out and ring and puck pulverized to -0.15 mm (0.0059 inch). The 500 g (17.6 oz) portions were used for interval assays. Several sample intervals weighed <5 kg; for these samples only a 500 g (17.6 oz) portion was split out from the 25 mm (0.98 inch) crushed material. The 500 g (17.6 oz) portion was dried and crushed to -1.7 mm (0.067 inch) and then ring and puck pulverized to -0.15 mm (0.0059 inch). A 50 g aliquot was extracted from the pulp and was analyzed for gold using a FA fusion, digestion and with AAS finish (FLOR code 4018). Silver was analyzed using four-acid digestion with an AAS finish (FLOR code 7048). Additionally, select samples were assayed for gold, silver and copper by gold cyanidation with a 24-hour cyanide shake and AAS finish (FLOR code 6007).
| Effective Date: May 31st, 2022 | | 64 |
| Technical Report - Mineral Resource Estimate Reward Project, Nye County, Nevada, USA |
Figure 11.1. CR Reward Sample Flow Chart.
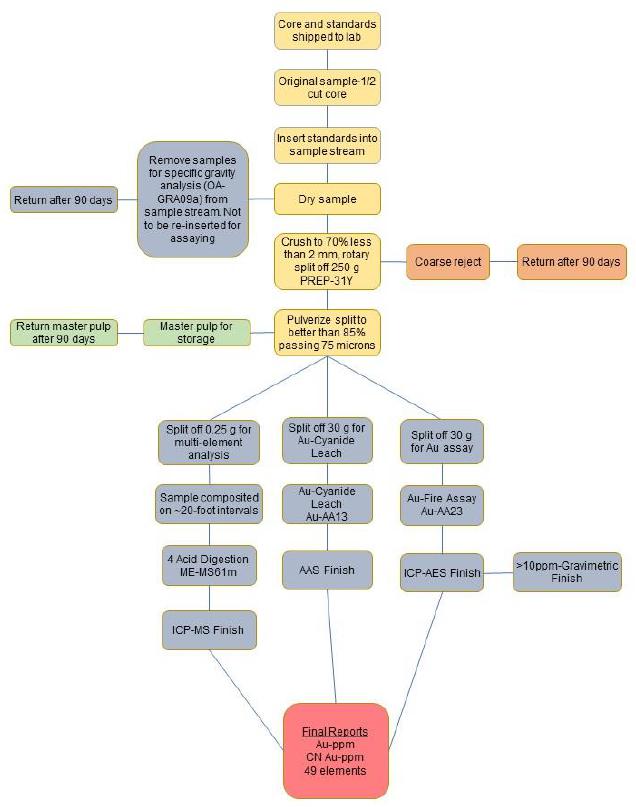
Source: Fowlow (2018a,b)
| Effective Date: May 31st, 2022 | | 65 |
| Technical Report - Mineral Resource Estimate Reward Project, Nye County, Nevada, USA |
The sample collection, security, transportation, preparation, insertion of geochemical standards and blanks and analytical procedures are within industry norms and best practices. The procedures used by CR Reward personnel are considered adequate to ensure that the results disclosed are accurate within scientific limitations and are not misleading. The procedures and assay control protocols employed by CR Reward in the 2017 and 2018 drill program are considered reasonable and acceptable for use in Mineral Resource Estimation.
| 11.3 | CR Reward QAQC Results (2017-2018) |
Of the 2,760 samples submitted for analysis, 430 were QA/QC samples inserted by CR Reward personnel, representing one QA/QC samples for every 6.4 core samples, or 15.6% of the total samples submitted. The QC samples consisted of a total of 111 CDN standards, 92 blanks, 68 core duplicates, 79 crush duplicates and 80 pulp duplicates. APEX considers this adequate to ensure that each batch of assays included at least CR Reward-inserted blank and standard sample.
| 11.3.1 | Blanks |
A total of 92 blank samples were inserted in the sample stream by CR Reward personnel during the 2017–2018 drill program (Table 11.1). Garden marble was sourced from local hardware stores for blank material. A total of 14 of the samples returned values above the detection limit for gold (Figure 11.2); however, only one sample assayed greater than 0.0004 oz/st Au (maximum value of 0.0005 oz/st Au). The results for the blanks are considered acceptable based on a 1% fail rate.
Figure 11.2. Blank Results from 2017-2018 Drilling Sorted by Date Analyzed.

| Effective Date: May 31st, 2022 | | 66 |
| Technical Report - Mineral Resource Estimate Reward Project, Nye County, Nevada, USA |
Table 11.1. Summary Results of Blank Material from the 2017-2018 Drill Program.
| Blanks | ALS Global | Total |
| Count | 92 | 92 |
| Count >0.0004 oz/st | 1 | 1 |
| Percent Fail | 1.1% | 1.1% |
| 11.3.2 | Standard Reference Materials |
A total of 111 standard reference materials (SRM) were inserted in the sample stream by CR Reward during the 2017–2018 drill program. Two standard types were sourced from CDN Resource Laboratories Ltd and had recommended values of 0.018 oz/st Au (CDN-GS-P6B) and 0.068 oz/st Au (CDN-GS-2L).
The inserted CDN-GS-P6B standard (0.018 oz/st Au) reported 14 out of 57 analyzes outside of two standard deviation, and 7 samples outside of three-standard deviation (Figure 11.3). Most of the CDN-GS-P6B SRM failures are considered marginal failures, that is, just outside the two-standard deviations boundaries and within three-standard deviations. The failures have likely resulted from a poorly homogenized standard and/or perhaps due to minor laboratory preparation or analytical errors. Results outside of three standard deviations was accepted if the standard was within a low-grade (<0.003 oz/st Au) interval. The relative standard deviation of the samples was low at 6.8% and the bias was extremely low at 0.3% (Table 11.2).
The results for the CDN-GS-2L standard returned only two of 56 samples outside of the two-standard deviation (Figure 11.4). Both failures were within the three-standard deviation threshold and are considered marginal failures. The relative standard deviation of the samples was low at 4.0% and the bias was low at 2.1% (Table 11.2).
In general, the standard reference material results are considered acceptable based on high precision (or low relative standard deviation) and low bias.
Table 11.2. Summary Results of Standards from the 2017-2018 Drill Program.
| SRM | SRM Value (oz/st Au) |
SRM 1 SD (oz/st Au) |
Count | RSD% | Bias | Within 2SD | Within 3SD |
| CDN-GS-P6B | 0.018 | 0.0007 | 57 | 6.8% | 0.3% | 75% | 88% |
| CDN-GS-2L | 0.068 | 0.0035 | 54 | 4.0% | 2.1% | 98% | 100% |
| Effective Date: May 31st, 2022 | | 67 |
| Technical Report - Mineral Resource Estimate Reward Project, Nye County, Nevada, USA |
Figure 11.3. CDN-GS-P6B Results from 2017-2018 Program Sorted by Date Analyzed.

Figure 11.4. CDN-GS-2L Results from 2017-2018 Program Sorted by Date Analyzed.

| Effective Date: May 31st, 2022 | | 68 |
| Technical Report - Mineral Resource Estimate Reward Project, Nye County, Nevada, USA |
| 11.3.3 | Duplicates |
A total of 68 core field duplicates, 79 crush duplicates and 80 pulp duplicates were inserted in the sample stream by CR Reward personnel during the 2017–2018 drill program and analyzed by ALS (Figure 11.5). The core duplicates were assayed using FA with a 1 AT aliquot with an AA finish and an 1 AT aliquot cyanide leach with an AA finish. Nineteen of the field duplicates (or 28%) yielded values greater than 30% half relative difference versus the mean in samples (or 22%), whereas 12 crush duplicates (or 15%) and 11 pulp duplicates (or 11%) generated values greater than 30% half relative difference versus the mean. A similar reduction in variability from field to crush to pulp and lab duplicates was calculated with the coefficient of variation. Minor differences are observed in the results from the cyanide leach analysis near the lower detection limit, however, this is not uncharacteristic. Overall, the results from all duplicates are considered acceptable based on low variability (<30% coefficient of variation) and progressively lower variability from field to crush to pulp to lab pulp duplicate.
Figure 11.5. Duplicate Results from the 2017-2018 Program.

| 11.4 | Comments on Sample Preparation, Analyses and Security |
In the opinion of the QP, the quantity and quality of the sample procedures and analytical results follow acceptable industry standards. The data are acceptable to support Mineral Resource and Mineral Reserve estimation.
| Effective Date: May 31st, 2022 | | 69 |
| Technical Report - Mineral Resource Estimate Reward Project, Nye County, Nevada, USA |
| 12 | Data Verification |
The drill hole database was exported and provided to APEX from CR Reward on April 19, 2018 and consisted of 386 collar entries. Upon review by APEX personnel, it was determined that there are 376 drill hole collars and 10 road cut or trench locations/entries. The 10-road cut and trench entries were removed from the database for resource estimation purposes. APEX thoroughly reviewed the drill hole database and the validation conducted by CR Reward in 2015 to 2017.
The drill hole database used by APEX personnel for resource estimation, including the recently-completed 2017–2018 drill holes, consists of 143,330 ft in 376 drill holes. The database includes 129,897 ft in 341 pre-CR Reward reverse circulation (RC) holes, 2,137 ft in seven pre-CR Reward core holes and 11,296 ft in 28 core holes completed during late 2017 to early 2018 CR Reward. The pre-CR Reward drill holes were completed between 1987 and 2013, with 276 holes completed between 1987 and 1999, and 72 holes between 2000 and 2013. The 2017–2018 core holes combined with the pre- CR Reward core holes represent about 9.4% of the total drilling. The QP considers the proportion of core holes to RC holes to be acceptable for Mineral Resource estimation.
The assay database consists of 26,092 sample intervals, with 23,762 intervals for the historic drill holes and 2,330 intervals for the 2017–2018 core holes. The sample database contains 336 entries of -9 and 80 blank entries, (less than 1.6% of the database). Most of these entries are attributed to non-sampled intervals, especially the greater than 5 ft intervals (70 samples) and collar/overburden top of hole intervals. The remaining dominantly 5 ft intervals without samples are attributed to poor recovery or lost samples.
| 12.1 | Verification Program |
The 2017 verification program completed by CR Reward (2017), and reviewed by the QP, included the following:
| · | Verifying collar data versus geologic logs or certificates from surveyors. |
| · | Verifying collar elevations versus recent or available topography. |
| · | Verifying down-hole survey data versus geologic logs and certificates. |
| · | Verifying assay values versus laboratory certificates or geologic logs where certificates were not available. |
All collar, survey and assay data for the 28 holes drilled by CR Reward in 2017 and 2018 were verified as part of the database management process and are excluded from the following summary.
| 12.1.1 | Protocols and Error Tracking of Pre-CR Reward Drill Holes |
The database provided to APEX consisted of 348 drill holes completed by previous operators. CR Reward (2017) reported that 100% of collar and down-hole survey data were selected for verification against available geologic logs or certified surveyor reports, whereas 10% of assays were verified against certified laboratory reports. All verified data and results were provided to APEX and are captured in the Excel spreadsheet 20170215_REW_DH_Verification.xlsx. The QP reviewed the verification data and the available collar, assay, and survey data.
| Effective Date: May 31st, 2022 | | 70 |
| Technical Report - Mineral Resource Estimate Reward Project, Nye County, Nevada, USA |
| 12.2 | Collar Data Verification |
The Project has been explored by multiple companies since 1987, including Homestake Mining Company, Galli Exploration Associates (GEXA), TECO, Cloverleaf Gold, Pathfinder Gold, US Nevada Gold Search, Barrick Gold, Glamis Gold, Canyon Resources and Atna Resources. As with multiple companies and many years of drilling, many original geologic logs could not be found, and in some instances, only copies of geologic logs were available.
Collar location and total depth data was initially verified against 178 (or 51%) geologic logs by CR Reward (2017). One hundred and seventy holes (or 49%) lacked logs and could not be verified. Eleven typographic errors were observed, investigated and corrected. CR Reward (2017) observed from the geologic logs that at least two local grids were created. At least three local coordinate systems were used by previous operators, e.g. Galli Exploration in 1987, Pathfinder in 1991 and Barrick in 1995. In 2018, CR Reward generated a low distortion local grid. An Excel spreadsheet containing control points for the local coordinate grids and UTM NAD27 Z11 coordinates was generated by CR Reward. Collar locations were plotted on satellite imagery and visually checked against existing pad locations, drill roads and disturbed areas. No major errors were observed. All collar easting and northing locations were considered acceptable following the review.
CR Reward (2017) also observed a consistent elevation difference on the R95/96 and RE series drill holes in the drill logs compared to the database values. The elevation values in the logs were consistently 50 ft to 60 ft higher than the elevations in the database. This elevation discrepancy resulted in 125 quarantined collar elevation values. CR Reward (2017) completed further investigations of the quarantined values against a topographic surface with 5 ft contour intervals that was generated from an aerial topographic survey performed by Kenney Aerial on December 20, 2006 for Canyon Resources. The database values correlate well against the 2006 aerial topographic survey and with nine holes returning differences of greater than ±10 ft. The elevation value of these nine holes was corrected to the 2006 survey data. Holes with differences of less than ±10 ft were considered acceptable. It is interpreted that collar elevations in the logs were registered to a historical topographic surface. The database values superseded the log values and represent the most accurate data.
CR Reward in 2018 also completed a field check and identified six collars exposed within the main deposit areas. The collar locations were within 5 ft for northing and easting values, and within 2 ft of the elevation values.
A total of 20 errors (11 typographic and 9 elevation differences) were identified, investigated and corrected. Upon completion of these changes and the verification review, the collar database was considered acceptable by the QP for use in the resource estimation process.
| Effective Date: May 31st, 2022 | | 71 |
| Technical Report - Mineral Resource Estimate Reward Project, Nye County, Nevada, USA |
| 12.3 | Down-Hole Survey Data Verification |
The pre-CR Reward database contains 740 down-hole survey records that were verified using the geologic logs or survey sheets (CR Reward, 2017). Only five of the drill holes (one RC and four core holes) had a contractor perform the down-hole survey and only two of those holes have survey records in the geologic logs. The contractor for the four core holes was either the drillers or WellNav with an unknown gyro tool. The contractor for the RC drill hole is unknown.
All azimuths and dips in the database were compared to either the geologic logs or contractor field sheets. No certified surveyor reports were available.
A total of 416 down-hole survey records (or 56%) passed verification, 290 down-hole survey records (or 39%) were not verified due to lack of geologic log or contractor information, and 34 (or 5%) were quarantined for further investigation. Records that were quarantined were due to the following:
| · | A total of 23 (or 5%) of 450 records with corresponding logs had typographic errors and were corrected. |
| · | The azimuth on two records (or <1%) could not be determined from the geologic log but the hole (R95-206C) is a twin of hole R95-127. Geology and assay results from both holes correlate well and data was accepted. |
| · | A total of nine surveys (or 2%) from two drill holes (MC-3 and MC-4) were collected by a contractor but field sheets or certificates were not available. Both holes had vertical dips at the collar, are less than 400 ft in depth and therefore the data was accepted. |
A total of 23 errors, were investigated and corrected. Upon completion of these changes and the verification review, the survey data was considered acceptable by the QP for use in the resource estimation process.
| 12.4 | Assay Verification |
The combined historic drill hole database consists of 23,922 intervals in 348 drill holes. A total of 40 historic drill holes were verified by CR Reward (2017) for a total of 2,715 intervals (or 11.3%) of the database. Drill holes were selected using a random number generator in Excel. Mine Development Associates (MDA) were engaged in 2018 to complete independent verification work that included an additional 16 historic holes containing 1,180 intervals (or 4.9%).
| Effective Date: May 31st, 2022 | | 72 |
| Technical Report - Mineral Resource Estimate Reward Project, Nye County, Nevada, USA |
Laboratories involved in RC and core assay programs included ALS Chemex, American Assay, Barringer, Inspectorate, Bondar Clegg and Rocky Mountain Laboratories. Certificates were only available for analyses completed at ALS Chemex, American Assay, Barringer and Inspectorate. Two mine laboratories were used when Glamis Gold was the operator in 1998; these were the mine laboratory at the Daisy Mine, near Beatty and the mine laboratory at the Marigold Mine, near Valmy. No assay certificates are available from these laboratories.
Results from the CR Reward assay verification include:
| · | From a total of 2,715 assay intervals, 514 (19%) of the intervals could not be verified due to either the lack of an assay certificate, geologic log or the interval was illegible on the log. |
| · | 2,201 (81%) assay intervals contained corresponding certificates or geologic logs. |
| · | 2,183 assay intervals (or 99%) had no errors and were flagged as pass. |
| · | 18 assay intervals (or 1%) were quarantined for further investigation due to data entry errors. Five intervals were corrected and the 13 intervals could not be fully investigated and were considered immaterial differences. |
Results from the MDA assay verification include:
| · | A total of 1,180 assay intervals were verified against both assay certificates and geologic log. Four of the 1,180 intervals (or <0.5%) contained typographic errors that were subsequently corrected. |
| · | A total of 179 sample depth intervals (depth_from and depth_to) were verified and no errors were identified. |
A total of 9 (or 0.3%) out of the 3,381 assay intervals verified during the CR Reward and MDA reviews contained errors that were subsequently corrected and 13 intervals (or 0.4%) remained unresolved but had immaterial (low grade) values. Upon completion of these changes and the verification reviews, the assay data was considered acceptable by the QP for use in the resource estimation process based on the low amount of errors.
| 12.5 | Author and QP Site Visits |
Mr. Michael Dufresne, M.Sc., P.Geol., P.Geo. and QP of this Technical Report, conducted a site inspection of the Project on two separate occasions in 2017 and 2019. On August 2nd, 2017, Mr. Dufresne visited the Property and reviewed drill core at CR Reward’s office in Reno, NV. On August 12th, 2019, Mr. Dufresne visited the Property and verified the location of a number of drill collars and on August 15th, 2019, Mr. Dufresne performed an inspection of the Lovelock, NV, core facility and reviewed Reward Project drill core from the 2017-2018 drill program.
A total of 24 drill holes, including 18 CR Reward holes and 6 historical holes, were located by Mr. Dufresne and handheld GPS coordinates were recorded and compared to the original coordinates. Table 12.1 summarizes the verification survey results.
| Effective Date: May 31st, 2022 | | 73 |
| Technical Report - Mineral Resource Estimate Reward Project, Nye County, Nevada, USA |
Table 12.1. Drill Hole Coordinate Comparison. Coordinates are in UTM NAD 1983 Zone 11.
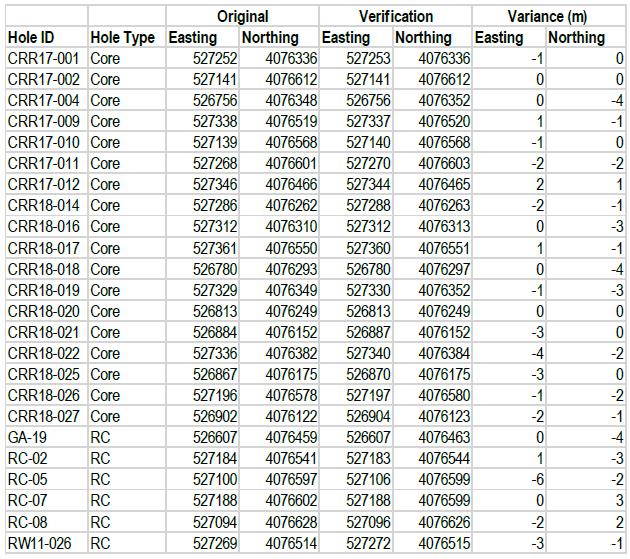
Appreciating the limited precision of the handheld GPS, the check GPS coordinates were consistent with the original coordinates with an average variance of 1 m and a maximum variance of 6 m. In the opinion of the QP Mr. Dufresne, the differences are not viewed as material.
During the inspection of the core facility in Lovelock, NV, Mr. Dufresne reviewed mineralized intervals in CR Reward drill holes CRR17-09, CRR18-014 and CRR-024. Significant intercepts of drill holes CRR17-09, CRR18-014 and CRR-024 are listed in Table 12.2. Photographs taken by Mr. Dufresne of the drill core are presented in Figures 12.1 to 12.3.
| Effective Date: May 31st, 2022 | | 74 |
| Technical Report - Mineral Resource Estimate Reward Project, Nye County, Nevada, USA |
Table 12.2. Significant Intercepts of Drill Holes Reviewed During Mr. Dufresne’s Inspection of the CR Reward Core Facility.

Figure 12.1. Drill hole CRR17-009, Wood Canyon Formation Mineralized Interval of Phyllite and Oxidized Quartzite (approximately 389 to 401 ft depth).

| Effective Date: May 31st, 2022 | | 75 |
| Technical Report - Mineral Resource Estimate Reward Project, Nye County, Nevada, USA |
Figure 12.2. Drill hole CRR18-014, Wood Canyon Formation Mineralized Interval of Brecciated/Re-healed Quartzite and Sheared and Foliated Phyllite (approximately 399 to 414 ft depth).
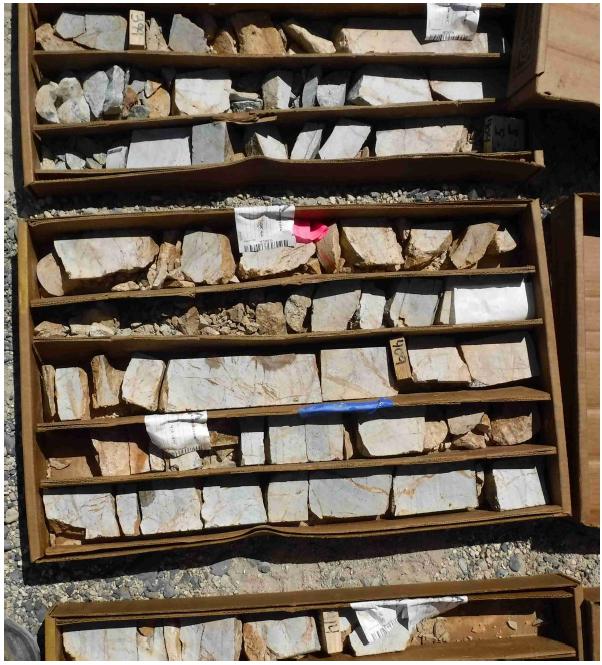
| Effective Date: May 31st, 2022 | | 76 |
| Technical Report - Mineral Resource Estimate Reward Project, Nye County, Nevada, USA |
Figure 12.3. Drill Hole CRR18-024, Wood Canyon Formation Mineralized Interval of Quartzite (approximately 148 to 153 ft depth).

No material field based exploration work has occurred at the Reward Project since the 2017-2018 drill program. Therefore, Mr. Dufresne considers the most recent site visit as current. As a result of the site visits, Mr. Dufresne can verify the land position, the geological setting and the mineralization that is the subject of this Technical Report.
In addition, Mr. Timothy Scott, BA.Sc. Geological Engineering and QP of this Technical Report, visited the Project on September 22nd, 2018 and on May 16th, 2022. He inspected the access and associated infrastructure for the Property. He found no evidence of any changes or work since the CR Reward 2017-2018 drill program.
| Effective Date: May 31st, 2022 | | 77 |
| Technical Report - Mineral Resource Estimate Reward Project, Nye County, Nevada, USA |
| 13 | Mineral Processing and Metallurgical Testing |
Metallurgical test work includes historical work completed by Rayrock Mines Inc. during 1998 and McClelland Laboratories (McClelland) in 2007 and 2008. Confirmatory test work was performed by KCA in 2018. Metallurgical test work programs include 34 bottle roll tests and 27 column tests together with preliminary agglomeration and compacted permeability testing. Results from these tests show that the Good Hope mineralization is amenable to cyanide leaching with acceptable reagent consumptions.
| 13.1 | 1998 Rayrock Column Tests – Drill Core |
Core used in the 1998 test program came from the three drill hole locations represents material from the north (drill hole R95-206C), centre (R95-207C) and south (R95-208C) of the deposit.
Six column tests were leached for 20 days on original broken core. After the initial 20 days of leaching, the columns were allowed to rest for three days. Following the resting period, two of the columns were crushed to 1½ inch and all six columns were flood leached four times over a 60-day period, allowed to drip irrigate for eight days, and then rest for 30 days. During the 30-day rest period, all of the columns were drained and re-crushed to ¾ inch and restarted and allowed to leach for a further 60 days. Including rest periods, the elapsed test time was 181 days. All work was conducted at the in-house Rayrock metallurgical laboratory. The extant documentation is a short inter-office memorandum that does not provide detailed information on the tests. Available results are summarized in Table 13.1. The data suggested that some higher-grade materials may not leach as well as lower-grade material, which indicated that coarse gold was present in some of the high-grade core.
The QP notes that given the somewhat erratic program of leach and rest periods, as well as the different crush sizes introduced mid-stream, the results can only be considered as indicative. Observations from the program included (Laney, 1998a):
“That the northern most core would show the lowest recovery was expected due to the more siliceous nature of the ore as it heads to the north…the material does not produce many fines and is very competent and hard…the material was slow leaching before crushing and the leach kinetics increased after crushing.”
| Effective Date: May 31st, 2022 | | 78 |
| Technical Report - Mineral Resource Estimate Reward Project, Nye County, Nevada, USA |
Table 13.1. 1998 Rayrock Drill Core Column Tests Results.
| Drill Hole | Column No. (Test No.) |
Calculated Head Grade oz/st Au |
Recovery % Au |
| R95-206-C-North | 1 (1333) | 0.067 | 50 |
| R95-206-C-North | 2(1334)** | 0.110 | 54 |
| R95-207-C-Central | 3(1335) | 0.030 | 83 |
| R95-207-C-Central | 4(1336) | 0.080 | 80 |
| R95-208-C-South | 5(1337) | 0.079 | 59 |
| R95-208-C-South | 6(1338)** | 0.069 | 69 |
| Note: | Columns initially crushed to minus 1½inch. All columns were later crushed to minus ¾ inch. |
| 13.2 | 1998 Rayrock Column Tests – Trench Samples |
A second Rayrock internal memorandum reports results of column tests conducted on surface samples taken from backhoe trenches (Laney, 1998b). Trench locations and the sample compositing methodology were not recorded.
Two sample composites and four column tests were conducted, with two subsets of each composite conducted with different cyanide solution strengths (1/3 lb/st and 1 lb/st), and two material sizes (“as-is” and crushed to minus ¾ inch). Average head grades were reported to be 0.030 oz/st Au to 0.033 oz/st Au. The leach cycle had an elapsed time of 56 days which included two rest periods that totalled 21 days. Campaign results are shown in Table 13.2.
| 13.3 | 2007 McClelland Bottle Roll Tests |
During 2007, 96 hr bottle roll tests were conducted on RC drill cuttings (nominally 10 mesh) from nine different drill holes. Efforts were made to spatially select the sample intervals across the deposit with respect to elevation (shallow, deep, etc.) as well as area (east, west, etc.). However, the northern deposit area was not represented in the selected samples.
Results of this program are shown in Table 13.3. The respective recovery curves are shown in Figure 13.1.
In the samples tested, the average gold recovery was 70.3%, reagent consumptions were quite low, and it did not appear that there were any significant differences in recovery by location or depth, or in terms of grade versus recovery.
A composite was generated for physical characterization tests. Results showed that the crusher work index (CWi) is a very low at 3.7 kWh/st. The abrasion index (Ai) of 0.4338 g is moderately high.
| Effective Date: May 31st, 2022 | | 79 |
| Technical Report - Mineral Resource Estimate Reward Project, Nye County, Nevada, USA |
| 13.4 | McClelland 2008 Column Test Campaign |
The 2008 program samples were sourced from three drill holes. Four column tests were conducted at a crush size of P80 of ½ inch and one column test (composite 5) was conducted at a crush size of P80 of ¼ inch. In addition, bottle rolls were run on column splits and a separate bottle roll study of size versus recovery was conducted on composite 5. Drain-down data were also measured on the finished column tests.
Sample composite data are presented in Table 13.4 and the drill holes selected are shown in Figure 13.2.
Table 13.2. 1998 Rayrock Surface Trench Column Test Gold Recovery.
| Head Grade | #1348 1/3 lb/st CN “as-is” % |
#1349 1/3 lb/st CN Crushed to ¾ inch % |
#1350 1 lb/st CN “as-is” % |
#1351 1 lb/st CN Crushed to ¾ inch % |
| 0.033 oz/st Au | 45.80 | 57.83 | 65.50 | 79.31 |
| 0.030 oz/st Au | 49.51 | 62.52 | 70.80 | 85.74 |
Table 13.3. 1998 10 Mesh Reverse Circulation Drill Holes Bottle Roll Results.

| Effective Date: May 31st, 2022 | | 80 |
| Technical Report - Mineral Resource Estimate Reward Project, Nye County, Nevada, USA |
Figure 13.1. 1998 10 Mesh Bottle Roll Recovery Curves.

| Note: | Figure from Laney, (1998b). |
Table 13.4. 2008 McClelland Sample/Drill Hole Composite Information.
| Composite Sample | Drill hole | Interval (ft) |
| 1 | MC 1 | 90-120 |
| 2 | MC 1 | 150-210 |
| 3 | MC 3 | 20-190 |
| 4 | MC 5 | 140-190 |
| 5 |
MC 3 MC 5 MC 5 MC 5 |
20-190 200-210 220-230 340-360 |
| Effective Date: May 31st, 2022 | | 81 |
Technical Report - Mineral Resource Estimate Reward Project, Nye County, Nevada, USA
Figure 13.2. 2008 McClelland Drill Hole Location Map.
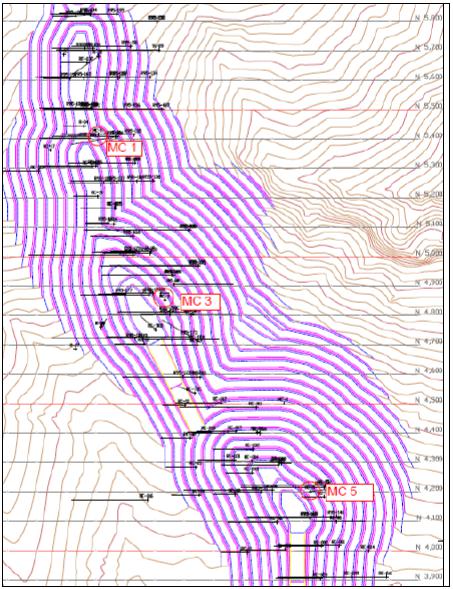
Note: Figure from McClelland (2008).
| 13.4.1 | 2008 Column Test Results |
A summary of five column test results is provided in Table 13.5. The corresponding gold recovery curves are shown in Figure 13.3.
| 13.4.2 | 2008 Bottle Roll Test Results at Crush Size and at 200 Mesh |
Figure 13.4 presents the bottle roll results of sample splits from each of the column test materials.
Table 13.6 presents bottle rolls results of column test sample splits ground to P80 of 200 mesh.
| Effective Date: May 31st, 2022 | | 82 |
Technical Report - Mineral Resource Estimate Reward Project, Nye County, Nevada, USA
Table 13.5. 2008 McClelland Summary Column Test Results.
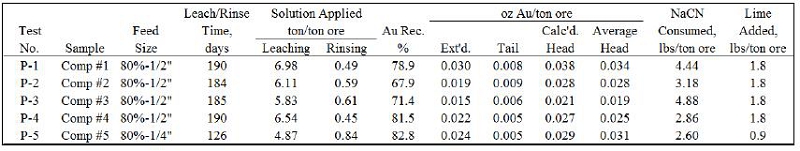
Figure 13.3. 2008 McClelland 10 Gold Recovery Curves – Column Tests.
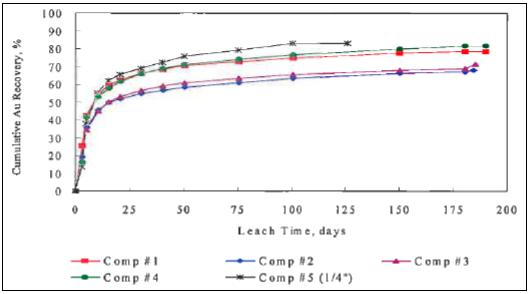
Note: Figure from McClelland (2008).
Figure 13.4. 2008 McClelland Bottle Roll Tests Recovery Curves – Splits from Column Tests.

Note: Figure from McClelland (2008).
| Effective Date: May 31st, 2022 | | 83 |
Technical Report - Mineral Resource Estimate Reward Project, Nye County, Nevada, USA
Table 13.6. 2008 McClelland Bottle Roll Tests – Gold Recovery %.
| Sample | P80 ½ inch 72 hr |
P80 200 mesh 24 hr |
| Comp 1 | 51.6 | 87.5 |
| Comp 2 | 35.9 | 85.7 |
| Comp 3 | 45.0 | 88.9 |
| Comp 4 | 58.3 | 91.3 |
| 13.4.3 | 2008 Bottle Roll Size versus Recovery on Composite 5 |
A separate exercise was conducted to establish a size versus gold recovery relation with respect to bottle rolls. This was conducted only on sample composite 5. Results of the different sizes are shown in Table 13.7. Results are plotted in Figure 13.5.
| 13.4.4 | Drain-Down Data |
Drain-down data for each of the five column tests are presented in Table 13.8.
| 13.4.5 | Conclusions from 2008 McClelland Program |
The average gold recovery for the four ½ inch crush columns is 74.9%. With an applied laboratory to field deduction of 2%, a field recovery of 72.9% could be expected at that crush size.
Only one column test was conducted at P80 of ¼ inch crush size, and that test has the highest laboratory recovery of 82.8%.
The McClelland program concluded that the NaCN consumption would not exceed 1.6 lb/st and the hydrated lime consumption would not exceed 1.8 lb/st. The laboratory tests used hydrated lime.
There does not appear to be any obvious explanation for column test recovery differences with respect to spatial representation, grade, reagents or size distribution of each sample.
| 13.5 | 2018 Kappes Cassidy Associates Test Program |
The 2018 KCA program consisted of eight column leach tests on four composite samples in duplicate. The program also included pulverized bottle roll tests on each sample, agglomeration and permeability test work on each composite sample, and physical characterization test work. The primary purpose of this program was to confirm the results from the 2008 McClelland test work for gold recovery and reagent requirements at a P80 of ¼ inch crush size.
| Effective Date: May 31st, 2022 | | 84 |
Technical Report - Mineral Resource Estimate Reward Project, Nye County, Nevada, USA
Table 13.7. 2008 McClelland Bottle Roll Size versus Gold Recovery – Composite 5.

Figure 13.5. 2008 McClelland Bottle Roll Size versus Gold Recovery – Composite 5.

Note: Figure from McClelland (2008).
Table 13.8. 2008 McClelland Drain-Down Data from Column Tests.

| Effective Date: May 31st, 2022 | | 85 |
Technical Report - Mineral Resource Estimate Reward Project, Nye County, Nevada, USA
| 13.5.1 | 2018 KCA Composite Generation |
Composites were generated from core taken from four drill holes including one drill hole at the Gold Ace Zone. Each drill hole was used to make one composite sample and samples were selected to be spatially and grade representative of the mineralization. Drill hole locations for the metallurgical test work are shown in Figure 13.6.
A summary of the head analyses for gold and silver for the composites is shown in Table 13.9. Head analyses for mercury and copper are presented in Table 13.10.
The head analyses for the composites show grades within the expected range for the mineralization and negligible amounts of copper and mercury. Multi-element and whole rock analyses were also completed, and do not show any deleterious elements in significant quantities.
| 13.5.2 | 2018 Physical Characterization |
Comminution tests, including abrasion and Bond work index tests, were performed by Hazen Research Inc. (Hazen). Results of these tests are presented in Table 13.11.
Bond and abrasion index results show average abrasiveness and hardness.
Bulk density tests were completed on selected samples from each composite (approximately 30 ft intervals and through different rock types). Bulk densities ranged from 144 lb/ft3 to 173 lb/ft3 with an average bulk density of 160 lb/ft3.
| Effective Date: May 31st, 2022 | | 86 |
Technical Report - Mineral Resource Estimate Reward Project, Nye County, Nevada, USA
Figure 13.6. 2018 KCA Metallurgical Sample Drill Hole Location Map.
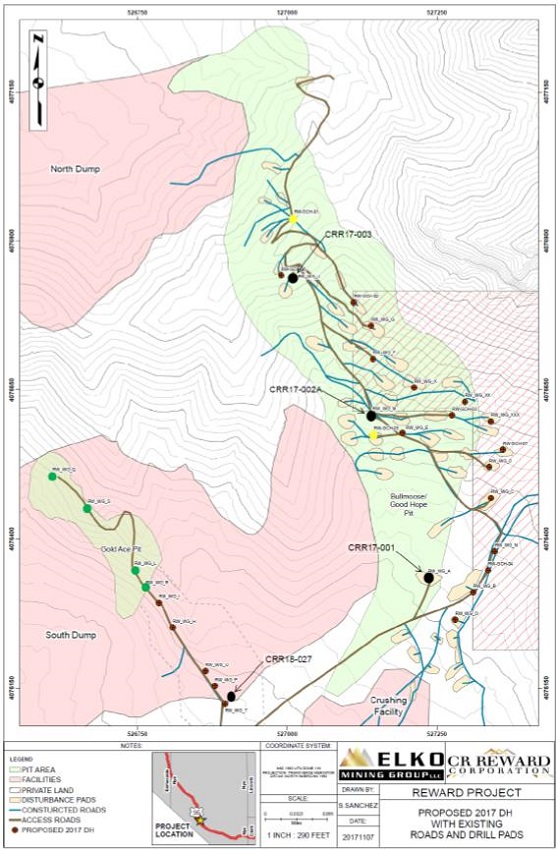
Figure prepared by Lycopodium, 2019.
| Effective Date: May 31st, 2022 | | 87 |
Technical Report - Mineral Resource Estimate Reward Project, Nye County, Nevada, USA
Table 13.9. 2018 KCA Composite Head Screen Analyses – Gold and Silver.
| KCA Sample No. |
Description | Assay
1 (g/mt Au) |
Assay
2 (g/mt Au) |
Average
Assay (g/mt Au) |
| 80607 A | CRR17-001 | 0.639 | 0.648 | 0.644 |
| 80608 A | CRR17-002A | 1.083 | 1.066 | 1.075 |
| 80609 A | CRR17-003 | 0.682 | 0.669 | 0.675 |
| 80648 B | CRR18-027 | 1.755 | 1.783 | 1.769 |
| 80607 A | CRR17-001 | 0.62 | 0.62 | 0.62 |
| 80608 A | CRR17-002A | 0.62 | 0.62 | 0.62 |
| 80609 A | CRR17-003 | 0.62 | 0.62 | 0.62 |
| 80648 B | CRR18-027 | 1.61 | 1.61 | 1.61 |
Table 13.10. 2018 KCA Composite Head Screen Analyses – Mercury and Copper.
| KCA Sample No. |
Description | Total
Mercury (mg/kg) |
Total
Copper (mg/kg) |
Cyanide Soluble Copper1 |
Cyanide Soluble Copper |
| 80607 A | CRR17-001 | <0.02 | 37 | 3.92 | 11 |
| 80608 A | CRR17-002A | 0.04 | 26 | 3.27 | 13 |
| 80609 A | CRR17-003 | 0.02 | 21 | 2.50 | 12 |
| 80648 B | CRR18-027 | 0.19 | <2 | 1.22 | <100 |
Table 13.11. 2018 Hazen Bond Impact Work and Abrasion Index.
| KCA Sample No. |
Description | Abrasion Index (g) |
Bond
Impact Work Index (kWh/mt) |
| 80601 | CRR17-001 & CRR17-002A | 0.2307 | 9.5 |
| 80602 | CRR17-003 | 0.2825 | 9.2 |
| 13.5.3 | 2018 KCA Pulverized Bottle Roll Tests |
Pulverized bottle roll leach tests were conducted on portions from each composite at a crush size P100 of 100 mesh (0.150 mm). Bottle roll tests were conducted on four additional high-grade samples at crush sizes P100 of ⅜ inches and P100 of 100 mesh to evaluate the effect of grade and overall recovery. The high-grade sample intervals are presented in Table 13.12. A summary of the bottle roll test results is shown in Table 13.13 and shown graphically in Figure 13.7.
Gold recoveries ranged from 91% to 97% with an average recovery of 94% for pulverized bottle roll tests (P100 of 100 mesh) and 55% to 70% with an average recovery of 60% for coarse bottle roll tests (P100 of ⅜ inch). The bottle roll test results show that higher recoveries can be achieved at finer crush sizes; however, gold grade does not have an appreciable effect on overall recovery.
| Effective Date: May 31st, 2022 | | 88 |
Technical Report - Mineral Resource Estimate Reward Project, Nye County, Nevada, USA
Agglomeration and compacted permeability tests were conducted on crushed samples from each composite. For the agglomeration test work, 2 kg portions of each composite were agglomerated with 0, 8, 16 and 20 lb of cement per dry ton of material and placed into a 75 mm diameter column with no compressive load to evaluate the permeability of the material. Compacted permeability tests were conducted on each composite sample with no cement addition with static loads applied to simulate different heap heights. Results for the agglomeration and compacted permeability tests are shown in Table 13.14 and Table 13.15, respectively.
The results show that cement agglomeration is not required for heap heights up to 262 ft.
Table 13.12. 2018 High-Grade Sample Intervals.
| Drill Hole | Description | Interval (ft) |
|
| CRR17-001 | W083565 | 283-288 | |
| CRR17-002A | V663939 | 58-63 | |
| CR17-002A | V663945 | 83-86 | |
| CR17-002A | V663221 | 179-183 |
| Effective Date: May 31st, 2022 | | 89 |
Technical Report - Mineral Resource Estimate Reward Project, Nye County, Nevada, USA
Table 13.13. 2018 KCA Bottle Roll Test Results.
KCA Sample No. |
Description | Target Crush Size (mm) |
Calculated Head (g/mt Au) |
Avg. Tails (g/mt Au) |
Au Extracted (%) |
Leach Time (hr) |
Consumption NaCN (kg/mt) |
Additional Ca(OH)2 |
| 80607 A | CRR17-001 | 0.150 | 0.572 | 0.043 | 93 | 96 | 0.24 | 1.50 |
| 80608 A | CRR17-002A | 0.150 | 0.862 | 0.062 | 93 | 96 | 0.30 | 1.25 |
| 80609 A | CRR17-003 | 0.150 | 0.655 | 0.053 | 92 | 96 | 0.19 | 1.00 |
| 80648 B | CRR18-027 | 0.150 | 0.936 | 0.027 | 97 | 96 | 0.07 | 1.75 |
| 80614 A | W083565 | 9.5 | 4.905 | 2.152 | 56 | 240 | 0.21 | 1.25 |
| 80614 A | W083565 | 0.150 | 5.712 | 0.423 | 93 | 96 | 0.15 | 1.25 |
| 80615 A | V663939 | 9.5 | 8.203 | 2.441 | 70 | 240 | 0.20 | 0.75 |
| 80615 A | V663939 | 0.150 | 8.205 | 0.399 | 95 | 96 | 0.17 | 1.00 |
| 80616 A | V663945 | 9.5 | 3.836 | 1.527 | 60 | 240 | 0.24 | 0.75 |
| 80616 A | V663945 | 0.150 | 4.131 | 0.221 | 95 | 96 | 0.15 | 1.00 |
| 80617 A | V663221 | 9.5 | 2.420 | 1.092 | 55 | 240 | 0.33 | 0.75 |
| 80617 A | V663221 | 0.150 | 2.131 | 0.192 | 91 | 96 | 0.17 | 1.00 |
| 80607 A | CRR17-001 | 0.150 | 0.63 | 0.41 | 34 | 96 | 0.24 | 1.50 |
| 80608 A | CRR17-002A | 0.150 | 0.63 | 0.41 | 35 | 96 | 0.30 | 1.25 |
| 80609 A | CRR17-003 | 0.150 | 0.58 | 0.41 | 29 | 96 | 0.19 | 1.00 |
| 80648 B | CRR18-027 | 0.150 | 1.54 | 0.99 | 36 | 96 | 0.07 | 1.75 |
| 80614 A | W083565 | 9.5 | 2.57 | 2.09 | 19 | 240 | 0.21 | 1.25 |
| 80614 A | W083565 | 0.150 | 2.59 | 1.71 | 34 | 96 | 0.15 | 1.25 |
| 80615 A | V663939 | 9.5 | 2.66 | 1.99 | 25 | 240 | 0.20 | 0.75 |
| 80615 A | V663939 | 0.150 | 2.50 | 1.30 | 48 | 96 | 0.17 | 1.00 |
| 80616 A | V663945 | 9.5 | 1.65 | 1.30 | 21 | 240 | 0.24 | 0.75 |
| 80616 A | V663945 | 0.150 | 1.56 | 0.99 | 36 | 96 | 0.15 | 1.00 |
| 80617 A | V663221 | 9.5 | 1.15 | 0.99 | 13 | 240 | 0.33 | 0.75 |
| 80617 A | V663221 | 0.150 | 1.16 | 0.79 | 32 | 96 | 0.17 | 1.00 |
| Effective Date: May 31st, 2022 | | 90 |
Technical Report - Mineral Resource Estimate Reward Project, Nye County, Nevada, USA
Figure 13.7. 2018 KCA Bottle Roll Test Results.

Note: Figure prepared by KCA, 2018.
| Effective Date: May 31st, 2022 | | 91 |
Technical Report - Mineral Resource Estimate Reward Project, Nye County, Nevada, USA
Table 13.14. KCA 2018 Preliminary Agglomeration Test Work.
KCA Sample No. |
Description | Cement (kg/mt) dry ore |
Water Added (ml) |
Initial Height (cm) |
Final Height (cm) |
pH on Day 3 | pH Comment |
% Slump |
Apparent Bulk Density (mtdry/m3) |
Flow Out (l/h/m2) |
Visual Estimate of % Pellet breakdown |
Pellet Result |
Out Flow Solution Color and Clarity |
Overall Test Result |
| 80607 A | CRR17-001 | 0 | 0.0 | 30.80 | 30.16 | 8.1 | Low | 2% | 1.42 | 26,937 | N/A | N/A | Brown & Cloudy | Pass |
| 80607 A | CRR17-001 | 4 | 191.0 | 28.89 | 28.89 | 11.2 | Good | 0% | 1.52 | 33,515 | <3 | Pass | Light Brown & Cloudy | Pass |
| 80607 A | CRR17-001 | 8 | 197.0 | 28.89 | 28.89 | 11.7 | High | 0% | 1.52 | 25,588 | <3 | Pass | Light Brown & Cloudy | Pass |
| 80607 A | CRR17-001 | 10 | 202.0 | 28.89 | 28.89 | 11.8 | High | 0% | 1.52 | 31,781 | <3 | Pass | Milky & Cloudy | Pass |
| 80608 A | CRR17-002A | 0 | 0.0 | 31.75 | 31.12 | 8.3 | Low | 2% | 1.38 | 23,625 | N/A | N/A | Brown & Cloudy | Pass |
| 80608 A | CRR17-002A | 4 | 159.0 | 27.94 | 27.94 | 11.5 | High | 0% | 1.57 | 23,883 | 3 | Pass | Light Brown & Cloudy | Pass |
| 80608 A | CRR17-002A | 8 | 163.0 | 28.89 | 28.89 | 11.9 | High | 0% | 1.52 | 26,627 | 3 | Pass | Light Brown & Cloudy | Pass |
| 80608 A | CRR17-002A | 10 | 160.5 | 29.21 | 29.21 | 12.0 | High | 0% | 1.50 | 26,376 | 3 | Pass | Milky & Cloudy | Pass |
| 80609 A | CRR17-003 | 0 | 0.0 | 30.48 | 29.85 | 8.3 | Low | 2% | 1.44 | 14,203 | N/A | N/A | Brown & Cloudy | Pass |
| 80609 A | CRR17-003 | 4 | 151.0 | 31.12 | 31.12 | 11.6 | High | 0% | 1.41 | 25,976 | 3 | Pass | Milky & Cloudy | Pass |
| 80609 A | CRR17-003 | 8 | 154.5 | 30.16 | 30.16 | 11.9 | High | 0% | 1.45 | 25,538 | <3 | Pass | Milky & Cloudy | Pass |
| 80609 A | CRR17-003 | 10 | 161.5 | 31.43 | 31.43 | 12.0 | High | 0% | 1.40 | 29,229 | <3 | Pass | Colorless & Clear | Pass |
| 80648 B | CRR17-027 | 0 | 0 | 23.18 | 23.18 | 8.9 | Low | 0% | 1.89 | 19,454 | N/A | N/A | Light Brown & Cloudy | Pass |
| 80648 B | CRR17-027 | 4 | 83.0 | 25.40 | 25.08 | 12.3 | High | 1% | 1.73 | 28,279 | <3 | Pass | Colorless & Clear | Pass |
| 80648 B | CRR17-027 | 8 | 87.5 | 25.40 | 25.40 | 12.5 | High | 0% | 1.73 | 27,172 | <3 | Pass | Colorless & Clear | Pass |
| 80648 B | CRR17-027 | 10 | 91.0 | 25.72 | 25.72 | 12.6 | High | 0% | 1.71 | 32,876 | <3 | Pass | Colorless & Clear | Pass |
| Effective Date: May 31st, 2022 | | 92 |
Technical Report - Mineral Resource Estimate Reward Project, Nye County, Nevada, USA
Table 13.15. KCA 2018 Compacted Permeability Tests.
|
KCA Sample No. |
KCA No. |
Sample Description |
Crush Size (mm) |
Material Type |
Test Phase |
Cement Added, |
Effective Height (m) |
Flow Rate, |
Flow Result Pass/Fail |
Saturated Permeability (cm/sec) |
Incremental Slump (%) |
Cum. Slump % Slump |
Slump Result Pass/Fail |
Overall Pass/Fail |
| 80607 A | 80623 A | CRR17-001 | 9.5 | Feed | Primary | 0 | 20 | 2,126 | Pass | 5.9E-02 | 3 | 3 | Pass | Pass |
| Stage Load | 40 | 1,528 | Pass | 4.2E-02 | 3 | 6 | Pass | Pass | ||||||
| Stage Load | 80 | 875 | Pass | 2.4E-02 | 4 | 10 | Pass | Pass | ||||||
| 80624 | 80672 A | CRR17-001 | 9.5 | Column Tail | Primary | 0 | 20 | 3,008 | Pass | 8.4E-02 | 1 | 1 | Pass | Pass |
| Stage Load | 40 | 776 | Pass | 2.2E-02 | 3 | 4 | Pass | Pass | ||||||
| Stage Load | 60 | 480 | Pass | 1.3E-02 | 3 | 7 | Pass | Pass | ||||||
| Stage Load | 80 | 328 | Pass | 9.1E-03 | 2 | 9 | Pass | Pass | ||||||
| Stage Load | 100 | 208 | Pass | 5.8E-03 | 2 | 11 | Fail | Fail | ||||||
| Stage Load | 120 | 125 | Pass | 3.5E-03 | 1 | 12 | Fail | Fail | ||||||
| Stage Load | 140 | 80 | Fail | 2.2E-03 | 1 | 13 | Fail | Fail | ||||||
| 80627 | 80680 A | CRR17-001 | 9.5 | Column Tail | Primary | 0 | 20 | 6,779 | Pass | 1.9E-01 | 0 | 0 | Pass | Pass |
| Stage Load | 40 | 4,244 | Pass | 1.2E-01 | 2 | 2 | Pass | Pass | ||||||
| Stage Load | 60 | 2,447 | Pass | 6.9E-02 | 3 | 5 | Pass | Pass | ||||||
| Stage Load | 80 | 2,063 | Pass | 5.7E-02 | 1 | 6 | Pass | Pass | ||||||
| Stage Load | 100 | 1,290 | Pass | 3.6E-02 | 2 | 8 | Pass | Pass | ||||||
| Stage Load | 120 | 1,136 | Pass | 3.2E-02 | 2 | 10 | Pass | Pass | ||||||
| Stage Load | 140 | 958 | Pass | 2.7E-02 | 1 | 11 | Fail | Fail | ||||||
| Stage Load | 160 | 714 | Pass | 2.0E-02 | 1 | 12 | Fail | Fail | ||||||
| Stage Load | 180 | 535 | Pass | 1.5E-02 | 1 | 13 | Fail | Fail | ||||||
| Stage Load | 200 | 367 | Pass | 1.0E-02 | 0 | 13 | Fail | Fail | ||||||
| Stage Load | 220 | 263 | Pass | 7.3E-02 | 2 | 15 | Fail | Fail | ||||||
| Stage Load | 240 | 186 | Pass | 5.2E-02 | 0 | 15 | Fail | Fail | ||||||
| 80608 A | 80623 B | CRR17-002 A | 9.5 | Feed | Primary | 0 | 20 | 2,763 | Pass | 7.7E-02 | 2 | 2 | Pass | Pass |
| Stage Load | 40 | 2,128 | Pass | 5.9E-02 | 3 | 5 | Pass | Pass | ||||||
| Stage Load | 80 | 1,288 | Pass | 3.6E-02 | 3 | 8 | Pass | Pass | ||||||
| 80630 | 80673 A | CRR17-002 A | 9.5 | Column Tail | Primary | 0 | 20 | 7,515 | Pass | 2.1E-01 | 0 | 0 | Pass | Pass |
| Stage Load | 40 | 6,748 | Pass | 1.9E-01 | 2 | 2 | Pass | Pass | ||||||
| Stage Load | 60 | 6,028 | Pass | 1.7E-01 | 3 | 5 | Pass | Pass |
| Effective Date: May 31st, 2022 | | 93 |
Technical Report - Mineral Resource Estimate Reward Project, Nye County, Nevada, USA
|
KCA Sample No. |
KCA No. |
Sample Description |
Crush Size (mm) |
Material Type |
Test Phase |
Cement Added, |
Effective Height (m) |
Flow Rate, |
Flow Result Pass/Fail |
Saturated Permeability (cm/sec) |
Incremental Slump (%) |
Cum. Slump % Slump |
Slump Result Pass/Fail |
Overall Pass/Fail |
| Stage Load | 100 | 4,207 | Pass | 1.2E-01 | 1 | 7 | Pass | Pass | ||||||
| Stage Load | 120 | 3,325 | Pass | 9.2E-02 | 2 | 9 | Pass | Pass | ||||||
| Stage Load | 140 | 2,548 | Pass | 7.1E-02 | 1 | 10 | Pass | Pass | ||||||
| Stage Load | 160 | 1,904 | Pass | 5.3E-02 | 1 | 11 | Fail | Fail | ||||||
| Stage Load | 180 | 1,389 | Pass | 3.9E-02 | 1 | 12 | Fail | Fail | ||||||
| Stage Load | 200 | 977 | Pass | 2.7E-02 | 2 | 14 | Fail | Fail | ||||||
| Stage Load | 220 | 705 | Pass | 2.0E-02 | 0 | 14 | Fail | Fail | ||||||
| Stage Load | 240 | 503 | Pass | 1.4E-02 | 1 | 15 | Fail | Fail | ||||||
| 80633 | 80681A | CRR17-002 A | 9.5 | Column Tail | Primary | 20 | 6,868 | Pass | 1.9E-01 | 1 | 1 | Pass | Pass | |
| Stage Load | 40 | 6,291 | Pass | 1.7E-01 | 3 | 4 | Pass | Pass | ||||||
| Stage Load | 60 | 5,269 | Pass | 1.5E-01 | 1 | 5 | Pass | Pass | ||||||
| Stage Load | 80 | 4,111 | Pass | 1.1E-01 | 2 | 7 | Pass | Pass | ||||||
| Stage Load | 100 | 3,158 | Pass | 8.8E-02 | 1 | 8 | Pass | Pass | ||||||
| Stage Load | 120 | 2,331 | Pass | 6.5E-02 | 2 | 10 | Pass | Pass | ||||||
| Stage Load | 140 | 1,732 | Pass | 4.8E-02 | 1 | 11 | Fail | Fail | ||||||
| Stage Load | 160 | 1,299 | Pass | 3.6E-02 | 0 | 11 | Fail | Fail | ||||||
| Stage Load | 180 | 906 | Pass | 2.5E-02 | 2 | 13 | Fail | Fail | ||||||
| Stage Load | 200 | 675 | Pass | 1.9E-02 | 1 | 14 | Fail | Fail | ||||||
| Stage Load | 220 | 509 | Pass | 1.4E-02 | 0 | 14 | Fail | Fail | ||||||
| Stage Load | 240 | 359 | Pass | 1.0E-02 | 1 | 15 | Fail | Fail | ||||||
| 80636 | CRR17-003 | 9.5 | Column Tail | Primary | 0 | 20 | 4,540 | Pass | 1.3E-01 | 0 | 0 | Pass | Pass | |
| Stage Load | 40 | 2,207 | Pass | 6.1E-02 | 3 | 3 | Pass | Pass | ||||||
| Stage Load | 60 | 1,996 | Pass | 5.5E-02 | 1 | 4 | Pass | Pass | ||||||
| Stage Load | 80 | 2,137 | Pass | 5.9E-02 | 2 | 6 | Pass | Pass | ||||||
| Stage Load | 100 | 1,802 | Pass | 5.0E-02 | 1 | 7 | Pass | Pass | ||||||
| Stage Load | 120 | 1,519 | Pass | 4.2E-02 | 2 | 9 | Pass | Pass | ||||||
| Stage Load | 140 | 1,162 | Pass | 3.2E-02 | 1 | 10 | Pass | Pass | ||||||
| Stage Load | 160 | 938 | Pass | 2.6E-02 | 1 | 11 | Fail | Fail | ||||||
| Stage Load | 180 | 754 | Pass | 2.1E-02 | 1 | 12 | Fail | Fail |
| Effective Date: May 31st, 2022 | | 94 |
Technical Report - Mineral Resource Estimate Reward Project, Nye County, Nevada, USA
|
KCA Sample No. |
KCA No. |
Sample Description |
Crush Size (mm) |
Material Type |
Test Phase |
Cement Added, |
Effective Height (m) |
Flow Rate, |
Flow Result Pass/Fail |
Saturated Permeability (cm/sec) |
Incremental Slump (%) |
Cum. Slump % Slump |
Slump Result Pass/Fail |
Overall Pass/Fail |
| Stage Load | 200 | 630 | Pass | 1.8E-02 | 1 | 13 | Fail | Fail | ||||||
| Stage Load | 220 | 476 | Pass | 1.3E-02 | 0 | 13 | Fail | Fail | ||||||
| Stage Load | 240 | 379 | Pass | 1.1E-02 | 1 | 14 | Fail | Fail | ||||||
| 80674 A | 80682 A | CRR17-003 | 9.5 | Column Tail | Primary | 0 | 20 | 5,885 | Pass | 1.6E-01 | 0 | 0 | Pass | Pass |
| Stage Load | 40 | 3,393 | Pass | 9.4E-02 | 2 | 2 | Pass | Pass | ||||||
| Stage Load | 60 | 3,132 | Pass | 8.7E-02 | 2 | 4 | Pass | Pass | ||||||
| Stage Load | 80 | 3,275 | Pass | 9.1E-02 | 1 | 5 | Pass | Pass | ||||||
| Stage Load | 100 | 3,105 | Pass | 8.6E-02 | 1 | 6 | Pass | Pass | ||||||
| Stage Load | 120 | 2,614 | Pass | 7.3E-02 | 2 | 8 | Pass | Pass | ||||||
| Stage Load | 140 | 2,235 | Pass | 6.2E-02 | 1 | 9 | Pass | Pass | ||||||
| Stage Load | 160 | 1,787 | Pass | 5.0E-02 | 1 | 10 | Pass | Pass | ||||||
| Stage Load | 180 | 1,550 | Pass | 4.3E-02 | 1 | 11 | Fail | Fail | ||||||
| Stage Load | 200 | 1,293 | Pass | 3.6E-02 | 0 | 11 | Fail | Fail | ||||||
| Stage Load | 220 | 1,051 | Pass | 2.9E-02 | 1 | 12 | Fail | Fail | ||||||
| Stage Load | 240 | 856 | Pass | 2.4E-02 | 1 | 13 | Fail | Fail | ||||||
| 80653 | 80683 A | CRR18-027 | 9.5 | Column Tail | Primary | 0 | 20 | 6,742 | Pass | 1.9E-01 | 0 | 0 | Pass | Pass |
| Stage Load | 40 | 6,006 | Pass | 1.7E-01 | 2 | 2 | Pass | Pass | ||||||
| Stage Load | 60 | 5,042 | Pass | 1.4E-01 | 2 | 4 | Pass | Pass | ||||||
| Stage Load | 80 | 4,337 | Pass | 1.2E-01 | 1 | 5 | Pass | Pass | ||||||
| Stage Load | 100 | 3,547 | Pass | 9.9E-02 | 2 | 7 | Pass | Pass | ||||||
| Stage Load | 120 | 3,056 | Pass | 8.5E-02 | 1 | 8 | Pass | Pass | ||||||
| Stage Load | 140 | 2,525 | Pass | 7.0E-02 | 1 | 9 | Pass | Pass | ||||||
| Stage Load | 160 | 2,126 | Pass | 5.9E-02 | 1 | 10 | Pass | Pass | ||||||
| Stage Load | 180 | 1,730 | Pass | 4.8E-02 | 1 | 11 | Fail | Fail | ||||||
| Stage Load | 200 | 1,421 | Pass | 3.9E-02 | 1 | 12 | Fail | Fail | ||||||
| Stage Load | 220 | 1,173 | Pass | 3.3E-02 | 0 | 12 | Fail | Fail | ||||||
| Stage Load | 240 | 985 | Pass | 2.7E-02 | 1 | 13 | Fail | Fail | ||||||
| 80656 | 80684 A | CRR18-027 | 9.5 | Column Tail | Primary | 0 | 20 | 7,608 | Pass | 2.1E-01 | 0 | 0 | Pass | Pass |
| Stage Load | 40 | 7,312 | Pass | 2.0E-01 | 2 | 2 | Pass | Pass | ||||||
| Stage Load | 60 | 7,030 | Pass | 2.0E-01 | 2 | 4 | Pass | Pass |
| Effective Date: May 31st, 2022 | | 95 |
Technical Report - Mineral Resource Estimate Reward Project, Nye County, Nevada, USA
|
KCA Sample No. |
KCA No. |
Sample Description |
Crush Size (mm) |
Material Type |
Test Phase |
Cement Added, |
Effective Height (m) |
Flow Rate, |
Flow Result Pass/Fail |
Saturated Permeability (cm/sec) |
Incremental Slump (%) |
Cum. Slump % Slump |
Slump Result Pass/Fail |
Overall Pass/Fail |
| Stage Load | 80 | 6,711 | Pass | 1.9E-01 | 1 | 5 | Pass | Pass | ||||||
| Stage Load | 100 | 6,181 | Pass | 1.7E-01 | 1 | 6 | Pass | Pass | ||||||
| Stage Load | 120 | 5,847 | Pass | 1.6E-01 | 1 | 7 | Pass | Pass | ||||||
| Stage Load | 140 | 5,415 | Pass | 1.5E-01 | 1 | 8 | Pass | Pass | ||||||
| Stage Load | 160 | 4,920 | Pass | 1.4E-01 | 2 | 10 | Pass | Pass | ||||||
| Stage Load | 180 | 4,446 | Pass | 1.2E-01 | 0 | 10 | Pass | Pass | ||||||
| Stage Load | 200 | 3,969 | Pass | 1.1E-01 | 1 | 11 | Fail | Fail | ||||||
| Stage Load | 220 | 3,573 | Pass | 9.9E-02 | 1 | 12 | Fail | Fail | ||||||
| Stage Load | 240 | 3,221 | Pass | 8.9E-02 | 0 | 12 | Fail | Fail |
| Note: | Primary Pass/Fail Criteria |
| 1. | In KCA’s compacted agglomeration tests, a slump of over 10% is generally an indication of failure. One item also examined is the consistency of results with regard to slump. If things worked perfectly, a lower slump with higher cement levels could be expected. |
| 2. | A typical heap leach solution application rate of 10 to 12 liters per hour per square meter is utilized when examining the agglomeration data. When examining results from this type of agglomeration test a measured flow of ten times (10X) the heap design rate is considered a “pass”. A measured flow less than 10X the heap design flow is not necessarily a failure. If there are enough tests with enough consistency between tests, and all other points indicate a “pass,” and then sometimes a test will pass with less than the 10X flow. However, a test will not likely pass at 1X and probably not at 4X. |
| 3. | In examining the pellet breakdown, about 10% is marginally acceptable and anything higher is a failure. In general, a higher range is allowable in pellet breakdown as this is a subjective value based on the visual observation of the pellets after the test by the technicians performing the test. When the samples tested are not agglomerated using cement, this test is not applicable. |
| 4. | Solution color and clarity typically is an indicator of agglomerate failure and fines migration. This information is utilized in coordination with both slump as well as pellet breakdown to determine if the test passes. |
| Effective Date: May 31st, 2022 | | 96 |
| Technical Report - Mineral Resource Estimate Reward Project, Nye County, Nevada, USA |
| 13.5.4 | KCA 2018 Column Leach Tests |
Duplicate column leach tests were performed on each composite at a crush size of P100 of 9.5 mm. The columns were leached for 120 days. After 120 days, one column from each duplicate set from the Good Hope Deposit was taken off-line and the other column was allowed to continue leaching for an additional 34 days. Both duplicate Gold Ace Zone columns were leached for 121 days before being taken off-line. Results from the column leach tests are presented in Table 13.16. Column leach recovery curves based on carbon assays are shown in Figure 13.8 and based on tonnes of solution per tonne of ore in Figure 13.9.
Results of the column tests for the Good Hope Deposit confirm the results from the 2008 McClelland program. Gold recoveries ranged from 78% to 83% with an average recovery of 81%. Gold recoveries on the composite from the Gold Ace Zone were significantly lower, averaging 60.5%. Reagent consumptions for the Good Hope Deposit were low to moderate averaging 3.06 lb/st for NaCN and 2.18 lbs/t for lime. Gold Ace Zone reagent consumptions averaged 2.18 lb/st for NaCN and 3.52 lb/st for lime.
Based on the leach curves, most of the columns were still leaching when the columns were terminated. Additional leaching may be realized during secondary leaching from higher lifts or from heap rinsing.
Figure 13.8. KCA 2018 Column Leach Curves – Carbon Assays.

Note: Figure prepared by KCA, 2018.
| Effective Date: May 31st, 2022 | | 97 |
| Technical Report - Mineral Resource Estimate Reward Project, Nye County, Nevada, USA |
Table 13.16. KCA 2018 Column Leach Tests.
| Description | Avg. Head Assay |
Wt. Avg. Screen Head |
Calculated Head |
GAC Extracted |
Weighted Avg. Tails, |
Extracted % Au |
Calculated Tail p80 Size (mm) |
Days of Leach |
Consumption NaCN (kg/mt) |
Addition Ca(OH)2 |
| CRR17-001 | 0.644 | 0.632 | 0.656 | 0.529 | 0.127 | 81 | 6.24 | 120 | 1.53 | 1.29 |
| CRR17-001 | 0.644 | 0.632 | 0.653 | 0.507 | 0.146 | 78 | 6.69 | 154 | 1.98 | 1.26 |
| CRR17-002A | 1.075 | 1.070 | 0.992 | 0.820 | 0.172 | 83 | 6.23 | 120 | 1.44 | 1.00 |
| CRR17-002A | 1.075 | 1.070 | 1.072 | 0.835 | 0.237 | 78 | 6.24 | 154 | 1.54 | 1.00 |
| CRR17-003 | 0.675 | 0.668 | 0.677 | 0.556 | 0.121 | 82 | 6.13 | 120 | 1.14 | 1.01 |
| CRR17-003 | 0.675 | 0.668 | 0.654 | 0.539 | 0.115 | 82 | 6.60 | 154 | 1.53 | 0.99 |
| CRR18-027 | 1.769 | 1.578 | 1.134 | 0.685 | 0.449 | 60 | 6.52 | 121 | 1.10 | 1.76 |
| CRR18-027 | 1.769 | 1.578 | 1.113 | 0.676 | 0.437 | 61 | 6.36 | 121 | 1.07 | 1.76 |
| CRR17-001 | 0.62 | 0.51 | 0.54 | 0.16 | 0.38 | 30 | 6.24 | 120 | 1.53 | 1.29 |
| CRR17-001 | 0.62 | 0.51 | 0.56 | 0.19 | 0.37 | 34 | 6.69 | 154 | 1.98 | 1.26 |
| CRR17-002A | 0.62 | 0.55 | 0.62 | 0.22 | 0.40 | 36 | 6.23 | 120 | 1.44 | 1.00 |
| CRR17-002A | 0.62 | 0.55 | 0.62 | 0.24 | 0.38 | 39 | 6.24 | 154 | 1.54 | 1.00 |
| CRR17-003 | 0.62 | 0.53 | 0.56 | 0.20 | 0.36 | 35 | 6.13 | 120 | 1.14 | 1.01 |
| CRR17-003 | 0.62 | 0.53 | 0.57 | 0.21 | 0.36 | 37 | 6.60 | 154 | 1.53 | 0.99 |
| CRR18-027 | 1.61 | 1.61 | 1.66 | 0.46 | 1.20 | 28 | 6.52 | 121 | 1.10 | 1.76 |
| CRR18-027 | 1.61 | 1.61 | 1.70 | 0.44 | 1.26 | 26 | 6.36 | 121 | 1.07 | 1.76 |
| Effective Date: May 31st, 2022 | | 98 |
| Technical Report - Mineral Resource Estimate Reward Project, Nye County, Nevada, USA |
Figure 13.9. KCA 2018 Column Leach Curves – Tonnes Solution per Tonne Ore.

Note: Figure prepared by KCA, 2018.
| 13.5.5 | 2018 KCA Program Conclusions |
Results from the KCA 2018 program were consistent with results observed during the 2008 McClelland program with gold recoveries for the main ore body at P80 of ¼ inch (P100 of ⅜ inch) averaging 81% without field deduction. Reagent consumptions were also low to moderate with cyanide consumptions averaging 3.06 lb/st for NaCN and 2.18 lb/st for lime. Results from the program also show no significant variations in recovery or reagent consumptions based on material grade or spatial representation for the Good Hope Deposit. Cement agglomeration is not required for heap heights up to 262 ft.
Recoveries for the Gold Ace Zone were significantly lower, averaging 60.5% for gold and reagent consumptions averaging 2.18 lb/st for NaCN and 3.52 lb/st for lime.
| 13.6 | Analysis and Discussion |
Metallurgical samples from historical and recent KCA test programs appear to be spatially representative for the Good Hope Deposit.
Only limited data are available for the Gold Ace Zone, which includes two column leach tests on duplicate samples and one pulverized bottle roll test.
| 13.6.1 | Crush Size and Grade versus Recovery |
A plot of size versus recovery for all column and bottle roll tests completed by McClelland and KCA is presented in Figure 13.10.
| Effective Date: May 31st, 2022 | | 99 |
| Technical Report - Mineral Resource Estimate Reward Project, Nye County, Nevada, USA |
Figure 13.10. Size versus Recovery – 2018 KCA and 2008 McClelland Test Data.
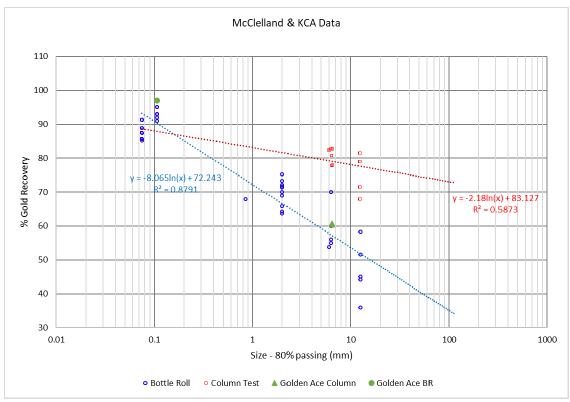
Note: Figure prepared by KCA, 2019.
Figure 13.10 shows a strong correlation between crush size and recovery with recoveries generally decreasing with coarser crush sizes. Based on the graph of all crush size data, the expected laboratory recovery for gold at a crush size of P80 of ¼ inch would be approximately 79%; however, relying on the consistent results from the 2018 KCA and 2008 McClelland column leach tests, KCA believes the average laboratory recovery of 81% is the best estimate of that crush size. Including a 2% field recovery deduction, KCA recommends a 79% field recovery for gold for the Good Hope Deposit.
Only limited data is available for the Gold Ace Zone, including one bottle roll and two duplicate column leach tests. Although the bottle roll results at P100 of 150 µm are consistent with the results of the Good Hope Deposit, column leach tests were significantly lower, averaging 60.5%. It is unclear why the Gold Ace recoveries are at variance with the Good Hope Deposit, given the proximity and similar makeup of the material; however, preliminary mineralogy results suggest the gold in the Gold Ace Zone is finely disseminated while the Good Hope mineralization is coarser, allowing for more adequate liberation at coarser crush sizes. Although not confirmed, KCA suspects there may be some silica encapsulation of the gold in the Gold Ace mineralization. Based on data available, KCA recommends a field recovery of 58.5% for the Gold Ace mineralization, including field deduct.
As presented in Figure 13.7, gold grade does not appear to have any appreciable impact on overall gold recoveries.
| Effective Date: May 31st, 2022 | | 100 |
| Technical Report - Mineral Resource Estimate Reward Project, Nye County, Nevada, USA |
| 13.6.2 | Leach Cycle |
The leach cycle has been estimated based on column test work at P80 of ¼ inch, including six column tests by KCA in 2018, and one column test from McClelland, completed in 2008. Columns for the Gold Ace Zone are not included in this evaluation.
The leach cycle considers tonne of solution per tonne ore as well as the total time required to reach the ultimate recovery in the column leach tests. Based on this data, the estimated leach cycle is 125 days.
| 13.6.3 | Reagent Consumptions |
| 13.6.3.1 | Cyanide |
Cyanide consumptions are based on the column test data at P80 of ¼ inch. The average laboratory cyanide consumption is estimated at 2.92 lb/st. KCA typically estimates field consumption of cyanide to be 25% to 33% of the laboratory cyanide consumption observed in column tests. The higher end of the spectrum (33%) is used when silver and/or other metals are present in above average quantities or when the observed laboratory consumption is unusually low. If the observed consumption is “average” and the ore is “clean”, i.e., a gold only ore, 25% is used. In the case of the Good Hope material, the observed laboratory cyanide consumption is quite low, so the field cyanide consumption is estimated at 25% of laboratory consumption.
| 13.6.3.2 | Lime |
Lime is required for pH control during leaching. Since hydrated lime was used for the laboratory leach tests, the laboratory lime consumptions are adjusted to accurately predict the consumption of quick lime (CaO at 100% purity) in the field. Lime consumptions are based on the column test data at P80 of ¼ inch with an estimated field consumption of 1.53 lb/st. Lime consumption from the 2008 McClelland column at P80 of ¼ inch is not considered in this calculation as it is significantly lower than the other tests and does not appear to be representative.
| 13.6.4 | Conclusions and Key Design Parameters |
Key design parameters from the metallurgical test work for the Good Hope Deposit include:
| • | Crush size P80 of ¼ inch. |
| • | Estimated gold field recovery of 79% including 2% field deduction. Based on column tests it is possible additional ounces may be realized during secondary leaching from leaching upper lifts and during heap rinsing, as it appears most columns were still slowly leaching at column termination. |
| • | Design leach cycle of 125 days. |
| • | Average field sodium cyanide consumption of 0.73 lb/st. |
| • | Average field lime consumption of 1.53 lb/st based on 100% CaO purity. |
| Effective Date: May 31st, 2022 | | 101 |
| Technical Report - Mineral Resource Estimate Reward Project, Nye County, Nevada, USA |
| • | Cement agglomeration not required up to heap heights of 262 ft. |
Key design parameters from the metallurgical test work for the Gold Ace Zone are include:
| • | Crush size P80 of ¼ inch. |
| • | Estimated gold recovery of 58.5% including 2% field deduction. Based on column tests, it is possible additional ounces may be realized during secondary leaching from leaching upper lifts and during heap rinsing as it appears most columns were still slowly leaching at column termination. |
| • | Design leach cycle of 125 days. |
| • | Average field sodium cyanide consumption of 0.72 lb/st. |
| • | Average field lime consumption of 2.46 lb/st based on 100% CaO purity. |
| • | Cement agglomeration not required up to heap heights of 262 ft. |
| Effective Date: May 31st, 2022 | | 102 |
| Technical Report - Mineral Resource Estimate Reward Project, Nye County, Nevada, USA |
| 14 | Mineral Resource Estimates |
Several prior NI 43-101 Mineral Resource estimates for the Project are outlined by Barnard et al. (2012). The Mineral Resource Estimate (MRE) for this study is based upon historic drilling and drilling conducted by CR Reward during 2017 and 2018 and this estimate supersedes all prior resource estimates.
The MRE was undertaken by APEX personnel of Edmonton, Alberta, Canada. The Mineral Resource estimate was completed by Mr. Warren Black, M.Sc., P.Geo. and Mr. Steven Nicholls, BA.Sc., MAIG under the direct supervision of Mr. Michael Dufresne, M.Sc., P.Geol., P.Geo., all of whom are independent qualified persons employed by APEX. Mr. Dufresne takes responsibility for the for MRE herein.
Definitions used in this section are consistent with those adopted by the Canadian Institute of Mining, Metallurgy and Petroleum ("CIM") Council in “Estimation of Mineral Resources and Mineral Reserves Best Practice Guidelines” dated November 29th, 2019 and “Definition Standards for Mineral Resources and Mineral Reserves” dated May 10th, 2014, and prescribed by the Canadian Securities Administrators' NI 43-101 and Form 43-101F1, Standards of Disclosure for Mineral Projects and the standards of SK 1300. Mineral Resources that are not Mineral Reserves do not have demonstrated economic viability.
| 14.1 | Introduction |
Statistical analysis, three-dimensional (3D) modelling and resource estimation were completed by Mr. Warren Black with assistance from Mr. Steven Nicholls. The workflow implemented for the estimate was completed using the commercially available Micromine (v 18.0) software. The workflow implemented for the evaluation of reasonable prospects for eventual economic extraction was completed using the Datamine Studio MaxiPit (v1.3.43.0) optimization software. The Anaconda Python distribution (Continuum Analytics, 2017) and contributions made by Mr. Black to the Python package pygeostat (CCG, 2016) were used for supplemental data analysis.
CR Reward provided APEX with a drill hole database that consisted of analytical, geological, density, and collar survey information; initial estimation domains for both the Good Hope Deposit and Gold Ace Zone; and a geological model for the mineralization that contains a stratigraphic and structural 3D interpretation. APEX thoroughly reviewed the provided data from late 2017 to 2018 data to ensure the database was in good shape and considered suitable for resource estimation. However, APEX personnel did not conduct a detailed validation of the data provided. The initial data and project review conducted in the fall of 2017 was, in part, the reason for additional drilling conducted by CR Reward. In the opinion of the QP, the current Reward drill hole database is suitable for use in resource estimation.
| Effective Date: May 31st, 2022 | | 103 |
| Technical Report - Mineral Resource Estimate Reward Project, Nye County, Nevada, USA |
APEX personnel conducted resource modelling in local grid coordinate space in feet relative to the North American Datum (NAD) of 1927 (Zone 11). The database comprises 376 drill holes completed in the period 1987 to 2018 of which 264 were used in the Good Hope and Gold Ace resource modelling. APEX and CR Reward personnel constructed estimation domains using a combination of gold grade, silica alteration, and quartz veining (Figure 14.1). The domains were used to subdivide the deposit into volumes of rock and the measured sample intervals within those volumes for geostatistical analysis.
The MRE was prepared using a block model size of 20 ft (X) by 20 ft (Y) by 20 ft (Z). APEX personnel estimated the gold grade for each block using ordinary kriging (OK) with locally varying anisotropy to ensure grade continuity in various directions is reproduced in the block model. The block model was diluted by estimating a waste grade for the outer blocks using composites within a transition zone along the outer edge of the mineralized estimation domain that was then proportionately combined with the estimated grade for the portion of the block within the mineralized domain.
Figure 14.1. Mineral Resource Estimate Mineralized Domain Outlines.

Note: Figure prepared by APEX, 2019.
| Effective Date: May 31st, 2022 | | 104 |
| Technical Report - Mineral Resource Estimate Reward Project, Nye County, Nevada, USA |
| 14.2 | Data |
| 14.2.1 | Drill Hole Data |
The Reward drill hole database utilized by APEX for resource estimation, including the recently completed 2017-2018 drill holes, consists of 143,465 ft (43,728 m) in 376 holes, including 348 historic drill holes. The database includes 130,032 ft (39,634 m) in 341 historic RC holes, 2,137 ft (651 m) in 7 core holes, and 11,296 ft (3,443 m) in 28 core holes completed during late 2017 to early 2018. The 2017 – 2018 core holes combined with the historic core holes represent 9.3% of the drill hole population by number of holes and footage. The historic drill holes were completed between 1987 and 2013, with 276 holes completed between 1987 and 1999, 72 holes between 2000 and 2013.
The drill hole assay database consists of 26,092 sample/interval entries with 336 intervals with a value of -9 and 80 blank assay intervals. The bulk of the blank and -9 intervals are generally top of hole casing intervals that were not sampled, top of hole waste not sampled, or poor recovery intervals. The 2017 – 2018 drill hole database is comprised of 2,356 sample intervals. The holes contain 28 blank assay intervals that are mostly top of hole casing intervals with a few poor recovery intervals.
Within the provided DHDB, a total of 264 drill holes intersect the Good Hope or the Gold Ace mineralized domains, including 33 core holes and 231 RC holes. A total of 179 reverse circulation (RC) and 24 diamond drill holes (DDH) intercept the Good Hope estimation domains with 9 core and 52 RC holes intercepting the Gold Ace estimation domain.
Within the Good Hope Zone database, 34 samples have a value if -9 or have no value and are within the Good Hope estimation domains, of which, are indicated as “not assayed” or “not sampled.” Therefore, the 34 samples are assigned a value of 0.0025 ppm Au (0.0001 oz/st).
Within the Gold Ace Zone database, 14 samples have a value if -9 or have no value and are within the Gold Ace estimation domain, all of which have a “Sample_Au_Assay” value of -99, NA or NS. Within the provided “2018_Reward_Code_Sheet.xlsx” spreadsheet, “-99” indicates “Not samples, Not assayed, no log”; “NA” indicates “not assayed;” and “NS” indicated “not sampled.” Therefore, the 14 samples are assigned a value of 0.0025 ppm Au (0.0001 oz/st).
Histograms, cumulative frequency plots and summary statistics for the Reward project un-composited samples that are situated within the interpreted mineralized lodes are presented in Figure 14.2 to Figure 14.4 and tabulated in Table 14.1. The Reward gold samples generally exhibit a single population of assay data. Due to the single population present, linear estimation techniques are suitable for statistical estimation use for the Good Hope and Gold Ace Deposits.
| Effective Date: May 31st, 2022 | | 105 |
| Technical Report - Mineral Resource Estimate Reward Project, Nye County, Nevada, USA |
Figure 14.2. Histogram of the Raw Gold Assay Values of Sample Intervals Flagged within the Good Hope and Gold Ace Estimation Domains.

Figure 14.3. Cumulative Frequency Plot of Raw Gold Assay Values of Sample Intervals Flagged within the Good Hope Zone Estimation Domains.

| Effective Date: May 31st, 2022 | | 106 |
| Technical Report - Mineral Resource Estimate Reward Project, Nye County, Nevada, USA |
Figure 14.4. Cumulative Frequency Plot of Raw Gold Assay Values of Sample Intervals Flagged within the Gold Ace Estimation Domain.
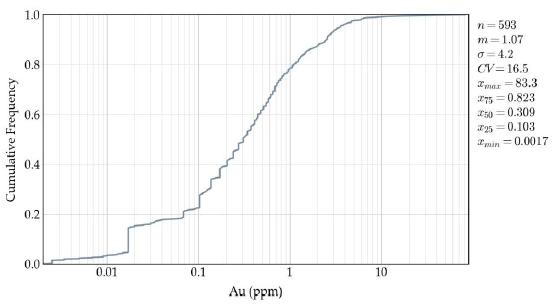
Table 14.1. Summary Statistics of Raw Gold Assays (in ppm) of Sample Intervals Flagged within the Good Hope and Gold Ace Estimation Domains.
| Global | Good Hope | Gold Ace | |
| count | 7,340 | 6,747 | 593 |
| mean | 0.798 | 0.774 | 1.067 |
| std | 1.701 | 1.262 | 4.203 |
| var | 2.894 | 1.592 | 17.666 |
| CV | 2.133 | 1.630 | 3.939 |
| min | 0.002 | 0.003 | 0.002 |
| 25% | 0.137 | 0.140 | 0.103 |
| 50% | 0.375 | 0.377 | 0.309 |
| 75% | 0.891 | 0.891 | 0.823 |
| max | 83.300 | 37.890 | 83.300 |
| 14.2.2 | APEX Micromine Database Validation |
The Micromine software has a set of verification tools to evaluate drill hole data. These tools were run on the data when initially received in 2017, and again when the data for the 2017–2018 drill holes were added. The verification returned 260 warnings, all indicating that there were samples in the assay database that were greater than 10 feet in length. It appeared that portions of, or all of, drill holes 88-01 to 88-09 used 15 ft as a standard sampling length protocol. With the 15 ft samples removed from the 88-01 to 88-09 drill holes, the warnings dropped to a total of 139 samples which had sample lengths ranging from 15 ft to 300 ft. A total of 83 of these intervals start from the collar and represent overburden or disturbed material at the top of the drill hole, or rock that was considered unmineralized at the top of the drill holes. The remaining 55 sample intervals likely represent composite sampling of material that was initially considered to be unmineralized in the older drill holes
| Effective Date: May 31st, 2022 | | 107 |
| Technical Report - Mineral Resource Estimate Reward Project, Nye County, Nevada, USA |
Based upon the validation and review of the drill hole database performed by APEX, the drill hole database, Mr. Dufresne considers the drill hole database acceptable for Mineral Resource estimation.
| 14.3 | Geological Model and Domains |
CR Reward provided APEX with a structural and formation model that was created to support resource modelling. The area of the Good Hope fault zone has greatest density of available drill data. A total of 171 geologic logs and four geotechnical logs were used to create the models using east–west-oriented, hand-interpreted, paper cross-sections that were translated into a 3D geological model in Micromine including lithology/stratigraphy and faults. APEX did not directly use the lithological model when creating estimation domains. However, it was, in addition to the structural model, used to guide the orientation of structural controls on gold mineralization when modelling the estimation domains.
CR Reward also provided preliminary solids for alteration zones at Good Hope and Gold Ace. The solids consisted of low silica and high silica shapes. These solids were initially prepared and reviewed in late 2017. The shapes were modified and reviewed after the results of the 2017 and 2018 drilling campaigns were available.
Gold mineralization at the Good Hope Deposit and Gold Ace Zone are both geographically and geologically distinct and require separate treatment. Three estimation domains were used. The estimation domains are 3D wireframes modelled using a sectional approach that considers all available subsurface geological data pertinent to gold mineralization. CR Reward provided APEX with a low-grade (LG) gold mineralization estimation domain for the Good Hope Deposit. APEX created a high-grade (HG) domain for the Good Hope Deposit and generated an estimation domain for the Gold Ace Zone.
| 14.3.1 | Good Hope Deposit |
APEX interpreted two primary mineralization orientations in the Good Hope Deposit:
| • | Fault-controlled mineralization generally striking north to north-northwest that dips steeply to the east. |
| • | Stratigraphic-controlled mineralization generally striking north-northeast that dips moderately to the east. |
Two estimation domains were created to ensure that the spatially restricted HG zone and the peripheral LG mineralization could not unreasonably influence each other during estimation. The final estimation domains used during the calculation of the resource estimate for the Good Hope Zone are illustrated in Figure 14.5.
| Effective Date: May 31st, 2022 | | 108 |
| Technical Report - Mineral Resource Estimate Reward Project, Nye County, Nevada, USA |
Figure 14.5. Orthogonal View of LG (Blue) and HG (Orange) Estimation Domains, Good Hope Deposit.

Note: Figure prepared by APEX, 2019.
| 14.3.1.1 | Low-Grade Alteration Domain (LG) |
CR Reward created the LG domain for the Good Hope Deposit using the following criteria:
| • | Assay greater than or equal to 0.002 oz/st Au with logged quartz veining and/or any intensity of silica alteration. |
| • | Assay values greater than or equal to 0.005 oz/st Au. |
The LG domain was interpreted using east–west sections at 50 ft spacing. APEX edited the interpretations to ensure that the domain did not extend into areas with no drill support or into zones of waste without silica alteration or veining.
| 14.3.1.2 | High Grade Gold Shell (HG) |
APEX modelled a HG gold grade shell using an assay value of greater than 0.015 oz/st Au. While constructing the HG domain, the structural and lithological interpretation provided by CR Reward were used as guides in addition to the trend of the Good Hope LG domain. The interpretation was completed using east-west drill sections spaced at approximately 100 ft intervals and is restricted to the extents of the LG domain.
| Effective Date: May 31st, 2022 | | 109 |
| Technical Report - Mineral Resource Estimate Reward Project, Nye County, Nevada, USA |
| 14.3.2 | Gold Ace Zone |
APEX observed one primary orientation of mineralization in the Good Ace zone, consisting of stratigraphically controlled mineralization generally striking north-northeast that dips moderately to the east. The Gold Ace Zone was remodelled several times by CR Reward and APEX geologists and, in general, was too thin and discontinuous to model a HG zone within the LG estimation domain. As a result, only a LG domain was used in estimation. The final estimation domain used during the calculation of the resource estimate for the Good Hope Zone are illustrated in Figure 14.6.
Figure 14.6. Orthogonal View of the LG (Solid Orange) Estimation Domain, Gold Ace Zone.

Note: Figure prepared by APEX, 2019.
| 14.4 | Drill Hole Flagging and Compositing |
| 14.4.1 | Sample Width Analysis |
Downhole sample width analysis shows that the drill hole samples ranged from 0.5 ft to 25 ft with the dominant sample length being 5 ft. A composite length of 10 ft was selected as it provides adequate resolution for mining purposes and is equal to or larger in length than 99.9 % of the drill hole samples (Figure 14.7). Length-weighted composites were calculated using all raw gold assays with interval centroids within the estimation domains for both the Good Hope Deposit and Gold Ace Zone.
The compositing process started from the drill hole collar and ended at the bottom of the hole. However, when the Good Hope HG estimation domain was intersected, composites within the domain began at the first point of intersection between the drill hole and the estimation domain wireframe and stopped upon exiting the wireframe. In this case, the composite before the first intersection of the HG estimation domain was truncated at the upper contact and composites after exiting the HG estimation domain wireframe began at the lower contact. The centroids of the resulting composites were flagged as lying within either the LG or HG estimation domain.
| Effective Date: May 31st, 2022 | | 110 |
| Technical Report - Mineral Resource Estimate Reward Project, Nye County, Nevada, USA |
Figure 14.7. Histogram of Sample Lengths within Estimation Domains for both the Good Hope and Gold Ace Zones.

| 14.4.2 | Remnant Analysis |
The distributions of the composites with and without remnant intervals (composites with a length of less than 10 ft) were examined to determine if there is any noticeable bias in gold grade during the compositing process. Composites equal to 10 ft, greater than or equal to 5 ft, and 10 ft composites with all remnants were evaluated. Summary statistics for this analysis are provided in Table 14.2. While the decrease in mean is not favourable, the exclusion of remnants greater than or equal to 5 ft decreases the number of composites by 11.4%. Their removal would significantly increase the error in the estimated Mineral Resource as the amount of available conditioning data would be reduced; therefore, they are included as conditioning data. The 31 samples that are less than 5 ft in length were excluded.
Remnant analysis for the Good Hope composites showed a decrease in the mean of approximately 0.001 oz/st Au when remnants are included, compared to composites that are equal to 10 ft as shown in Table 14.2. Figure 14.8 illustrates that there is little difference between the distributions of composited gold grades with the various composite length scenarios.
Remnant analysis for the Gold Ace Zone composites reveals an increase in the mean of approximately 0.002 oz/st Au when orphans are included, compared to composites that are equal to 10 ft (refer to Table 14.2). Figure 14.9 illustrates little difference between the distribution of composited gold grade with the various composite length scenarios. A significant drop in mean is observed when compositing raw samples at the Gold Ace Zone as there are numerous large intervals (e.g., 150 ft) in the drill hole database that are not sampled and assigned a value of 0.0001 oz/st Au. During the composite process, these samples are split into multiple composites, leading to a lower but more representative mean value. The exclusion of remnants greater than or equal to 5 ft decreases the number of composites by 9.1%. As their removal would significantly increase error in the estimated Mineral Resource, they are included as conditioning data. The six samples that are less than 5 ft in length were excluded.
| Effective Date: May 31st, 2022 | | 111 |
Technical Report - Mineral Resource Estimate Reward Project, Nye County, Nevada, USA
Table 14.2. Remnant Analysis comparing the Gold Statistics (in ppm) of Raw Assays and Uncapped Composite Samples with and without Orphans.
| Good Hope | Gold Ace | |||||||
Raw Assays |
Comps with Orphans |
Comps 10 ft Only |
Comps ≥ 5 ft |
Raw Assays |
Comps with Orphans |
Comps 10 ft Only |
Comps ≥ 5 ft | |
| count | 6,747 | 3,577 | 3,164 | 3,546 | 593 | 327 | 293 | 321 |
| mean | 0.774 | 0.756 | 0.789 | 0.756 | 1.067 | 0.956 | 0.903 | 0.856 |
| std | 1.262 | 1.061 | 1.101 | 1.062 | 4.203 | 2.455 | 1.848 | 1.776 |
| var | 1.592 | 1.125 | 1.212 | 1.128 | 17.666 | 6.028 | 3.416 | 3.155 |
| CV | 1.630 | 1.403 | 1.396 | 1.404 | 3.939 | 2.568 | 2.047 | 2.075 |
| min | 0.003 | 0.003 | 0.003 | 0.003 | 0.002 | 0.003 | 0.003 | 0.003 |
| 25% | 0.140 | 0.171 | 0.178 | 0.171 | 0.103 | 0.120 | 0.120 | 0.120 |
| 50% | 0.377 | 0.397 | 0.411 | 0.397 | 0.309 | 0.334 | 0.360 | 0.343 |
| 75% | 0.891 | 0.925 | 0.983 | 0.926 | 0.823 | 0.913 | 1.011 | 0.909 |
| max | 37.890 | 19.107 | 19.107 | 19.107 | 83.300 | 31.346 | 22.834 | 22.834 |
Figure 14.8. Remnant Analysis Illustrating the Gold Distribution of Calculated Composite within the Good Hope Deposit.
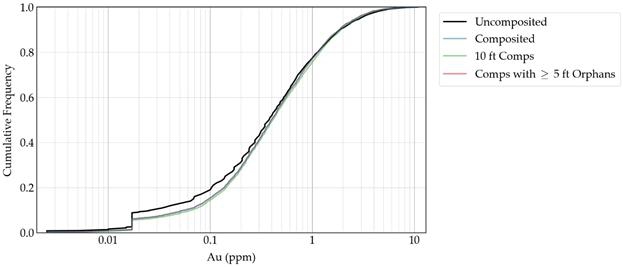
| Effective Date: May 31st, 2022 | | 112 |
Technical Report - Mineral Resource Estimate Reward Project, Nye County, Nevada, USA
Figure 14.9. Orphan Analysis Illustrating the Gold Distribution of Calculated Composite within the Gold Ace Zone.

| 14.5 | Capping |
To ensure gold grade is not over-estimated by including outlier values during estimation, composites were capped to a specified maximum value. Probability plots illustrating all values were used to identify outlier values that appear higher than expected relative to the estimation domain’s gold composite population.
The probability plot of composited gold grades within the Good Hope Deposit (Figure 14.10) suggests there are five outlier composites that have gold values greater than 0.292 oz/st Au. Visual inspection of the potential outliers in Micromine revealed that they have no spatial continuity with each other. Therefore, a capping level of 0.292 oz/st Au was applied. The resulting gold grade distribution of the capped composites is illustrated in Figure 14.11 and summary statistics are detailed in Table 14.3.
| Effective Date: May 31st, 2022 | | 113 |
Technical Report - Mineral Resource Estimate Reward Project, Nye County, Nevada, USA
Figure 14.10. Probability Plot of the Composited Gold Grade at the Good Hope Zone before Capping

Figure 14.11. Cumulative Frequency Plots of the Composited and Capped Gold Grade within the Good Hope Zone Estimation Domains
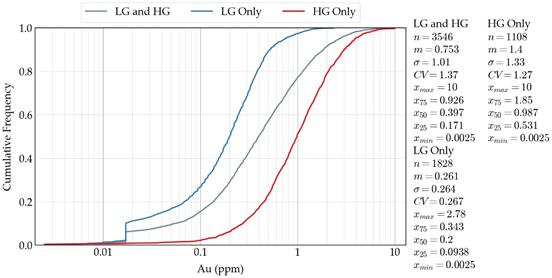
| Effective Date: May 31st, 2022 | | 114 |
Technical Report - Mineral Resource Estimate Reward Project, Nye County, Nevada, USA
The probability plot of composited gold grades within the Gold Ace Zone (Figure 14.12) suggests there are eight outlier composites that have gold values greater than 0.146 oz/st Au. Visual inspection of the potential outliers reveal they have no spatial continuity with each other. Therefore, a capping level of 0.146 oz/st Au was applied to composites used to calculate the Gold Ace Zone resource estimate. The resulting gold grade distribution of the capped composites is illustrated in Figure 14.13 and summary statistics are detailed in Table 14.3.
Figure 14.12. Probability Plot of the Composited Gold Grade at the Gold Ace Zone before Capping.

Figure 14.13. Cumulative Frequency Plot of the Composited and Capped Gold Grade within Gold Ace Zone Estimation Domain.

| Effective Date: May 31st, 2022 | | 115 |
Technical Report - Mineral Resource Estimate Reward Project, Nye County, Nevada, USA
Table 14.3. Summary Statistics of Gold Grade (in ppm) of Capped Composite Intervals Flagged within the Good Hope and Gold Ace Estimation Domains.
| Global | Good
Hope Uncapped |
Good
Hope Capped |
Gold
Ace Uncapped |
Gold
Ace Capped | |
| count | 3,867 | 3546 | 3,546 | 321 | 321 |
| mean | 0.753 | 0.756 | 0.753 | 0.856 | 0.756 |
| std | 1.015 | 1.1062 | 1.014 | 1.776 | 1.021 |
| var | 1.030 | 1.212 | 1.029 | 3.155 | 1.042 |
| CV | 1.348 | 1.404 | 1.348 | 2.075 | 1.349 |
| min | 0.003 | 0.003 | 0.003 | 0.003 | 0.003 |
| 25% | 0.169 | 0.171 | 0.171 | 0.12 | 0.120 |
| 50% | 0.394 | 0.397 | 0.397 | 0.343 | 0.343 |
| 75% | 0.926 | 0.926 | 0.926 | 0.909 | 0.909 |
| max | 10.000 | 19.107 | 10.000 | 22.834 | 5.000 |
| 14.6 | Variography and Grade Continuity |
APEX calculated and modelled semi-variograms for gold using the 10 ft composites flagged within the estimation domains. Experimental semi-variograms for each zone were calculated along the major, minor, and vertical principle directions of continuity that are defined by three Euler angles. Euler angles describe the orientation of anisotropy as a series of rotations (using a left-hand rule) that are as follows:
| 1. | A rotation about the Z-axis (azimuth) with positive angles being clockwise rotation and negative representing counter-clockwise rotation; |
| 2. | A rotation about the X-axis (dip) with positive angles being counter-clockwise rotation and negative representing clockwise rotation; and |
| 3. | A rotation about the Y-axis (tilt) with positive angles being clockwise rotation and negative representing counter-clockwise rotation. |
Parameters of the modelled semi-variograms are documented in Table 14.4 and the calculated experimental semi-variogram and models used for resource estimation are illustrated in Figure 14.14and Figure 14.15 respectively.
| Effective Date: May 31st, 2022 | | 116 |
Technical Report - Mineral Resource Estimate Reward Project, Nye County, Nevada, USA
Table 14.4. Gold Variogram Model Parameters.
| Zone | C0 | Sill | Azm | Dip | Tilt | Structure 1 | Structure 2 | |||||||||
| Type | C1 | Ranges (ft) | Type | C2 | Ranges (ft) | |||||||||||
| Major | Minor | Vertical | Major | Minor | Vertical | |||||||||||
| Good Hope | 0.370 | 1.027 | 176 | -16 | -34 | sph | 0.411 | 80 | 140 | 60 | exp | 0.246 | 250 | 140 | 60 | |
| Gold Ace | 0.261 | 0.622 | 137 | -10 | -15 | sph | 0.124 | 220 | 120 | 30 | exp | 0.236 | 220 | 120 | 30 | |
| Note: | azm: azimuth, sph: spherical, exp: exponential; C0: nugget effect; C1: covariance contribution of structure 1; C2: covariance contribution of structure 2. |
Figure 14.14. Calculated and Modelled Semi-Variogram of Gold within the Good Hope Zone. Dip Direction and Dip for each Principle Direction is in each Subplot Title.

| Effective Date: May 31st, 2022 | | 117 |
Technical Report - Mineral Resource Estimate Reward Project, Nye County, Nevada, USA
Figure 14.15. Calculated and Modelled Semi-Variogram of Gold within the Gold Ace Zone. Dip Direction and Dip for each Principle Direction is in each Subplot Title.

| 14.7 | Bulk Density |
To determine what bulk densities should be applied to the block model, APEX completed EDA on the available density data. The database contains 464 bulk density measurements, of which 134 are from the Good Hope Deposit, 32 are from the Gold Ace Zone and 298 are from waste rock. The centroids of intervals that were selected for bulk density measurements were flagged using the estimation domain and stratigraphic wireframes are discussed in Section 14.3. All measurements were flagged with the stratigraphic unit they lie in and the estimation domain the sample is from, if it is not classed as waste.
At the Good Hope Deposit, little variation in the mean and median values were observed between bulk density measurements flagged within either the HG or LG estimation domains or individually (Table 14.5).
| Effective Date: May 31st, 2022 | | 118 |
Technical Report - Mineral Resource Estimate Reward Project, Nye County, Nevada, USA
Table 14.5. Bulk Density Measurements (g/cm3), Good Hope Deposit and Gold Ace Zone.
| Good Hope | Gold Ace | Waste | |||||||||||
| HG+LG | HG | LG | Zwc | Zsj | LG | Zss | Zsm | Zsb | Zsj | Zsm | Zss | Zwc | |
| count | 134 | 76 | 58 | 121 | 13 | 32 | 7 | 24 | 5 | 21 | 13 | 45 | 145 |
| mean | 2.58 | 2.58 | 2.59 | 2.59 | 2.55 | 2.69 | 2.61 | 2.71 | 2.59 | 2.58 | 2.65 | 2.59 | 2.62 |
| std | 0.14 | 0.16 | 0.11 | 0.14 | 0.05 | 0.16 | 0.18 | 0.16 | 0.11 | 0.04 | 0.12 | 0.11 | 0.12 |
| min | 1.62 | 1.62 | 2.35 | 1.62 | 2.46 | 2.31 | 2.31 | 2.32 | 2.48 | 2.48 | 2.29 | 2.40 | 2.23 |
| 25% | 2.53 | 2.54 | 2.52 | 2.54 | 2.51 | 2.58 | 2.53 | 2.60 | 2.49 | 2.56 | 2.63 | 2.51 | 2.56 |
| 50% | 2.59 | 2.59 | 2.59 | 2.60 | 2.54 | 2.70 | 2.61 | 2.72 | 2.59 | 2.58 | 2.69 | 2.57 | 2.63 |
| 75% | 2.64 | 2.64 | 2.66 | 2.66 | 2.59 | 2.80 | 2.71 | 2.82 | 2.69 | 2.60 | 2.72 | 2.68 | 2.71 |
| max | 2.97 | 2.97 | 2.79 | 2.97 | 2.66 | 3.04 | 2.86 | 3.04 | 2.70 | 2.64 | 2.76 | 2.84 | 2.89 |
| CV | 0.02 | 0.03 | 0.04 | 0.02 | 0.20 | 0.08 | 0.37 | 0.11 | 0.52 | 0.12 | 0.20 | 0.06 | 0.02 |
The blocks within the Good Hope Deposit are predominantly classed as Wood Canyon Formation with nearly equal amounts of Juhl Member and Sutton Member of the Stirling Formation (Table 14.6). There is a slight decrease in bulk density when comparing measurements within the Wood Canyon Formation lithologies and the Juhl Member, both inside and outside of the Good Hope estimation domains (Table 14.5; Figure 14.6). It is hard to determine with certainty if there is a relationship between gold grade and bulk density with the current dataset (Figure 14.17).
Figure 14.16. Bulk Density Box Plots, Good Hope Deposit.
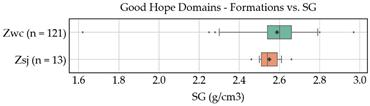

| Effective Date: May 31st, 2022 | | 119 |
Technical Report - Mineral Resource Estimate Reward Project, Nye County, Nevada, USA
Figure 14.17. Bulk Density Scatter Plots Showing 3D Solids vs. Gold Grade, Good Hope Deposit.
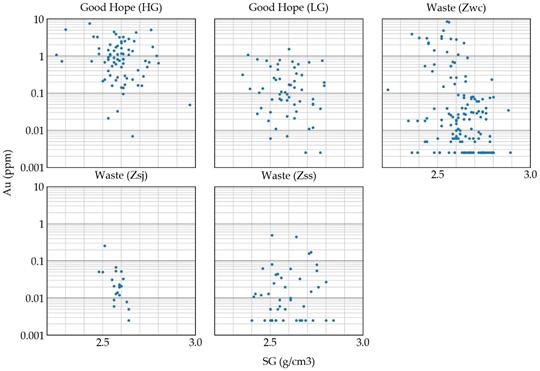
As there are no discrepancies in the median (50th percentile) values of bulk density measurements within the Good Hope estimation domains, a bulk density value of 2.59 g/cm3 was applied to all blocks within the Good Hope mineralized zone.
At the Gold Ace Zone, there is a change in bulk density between lithological units (Table 14.5). The blocks within the Gold Ace Zone are predominantly Morris Member with most other blocks being within the Sutton Member (Table 14.6). There is a decrease in bulk density when comparing bulk density measurements within the Morris Member and Sutton Member, both inside and outside of the Gold Ace estimation domain (Table 14.5, Figure 14.18). It is hard to determine with certainty if there is a relationship between gold grade and bulk density with the current dataset (Figure 14.19). As there is evidence for the need for a higher bulk density value for blocks flagged within the Morris Member, these blocks are assigned a value of 2.70 g/cm3. However, as there is an insufficient number of bulk density measurements of the Sutton Member within the Gold Ace estimation domain, all other blocks at the Gold Ace Zone were assigned a bulk density value of 2.59 g/cm3.
| Effective Date: May 31st, 2022 | | 120 |
Technical Report - Mineral Resource Estimate Reward Project, Nye County, Nevada, USA
Table 14.6. Percentage of Blocks Flagged within each Formation for the Good Hope and Gold Ace Zones.
| Formation | Good Hope % |
Gold Ace % |
| Qal | 1 | 4 |
| Zwc | 75 | 0 |
| Zsj | 13 | 0 |
| Zss | 11 | 16 |
| Zsm | 0 | 79 |
| Zsb | 0 | 1 |
Figure 14.18. Bulk Density Box Plots, Gold Ace Zone.


Figure 14.19. Bulk Density Scatter Plots Showing 3D Solids vs. Gold Grade, Gold Ace Zone.
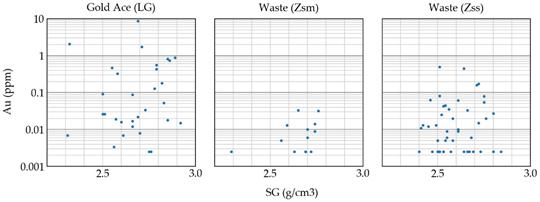
| Effective Date: May 31st, 2022 | | 121 |
Technical Report - Mineral Resource Estimate Reward Project, Nye County, Nevada, USA
| 14.8 | Block Model |
| 14.8.1 | Block Model Parameters |
The block model used fully encapsulates the estimation domains. When determining block model parameters, data spacing is the primary consideration in addition to ensuring the volume of the 3D estimation domain wireframes are adequately captured, and that potential mining equipment parameters are considered.
The data spacing of irregularly spaced drilling can be approximated by calculating the 90th percentile of a high-resolution block model of the distance from each block’s centroid to the nearest sample. Estimation errors are introduced when kriging is used to estimate a grade for blocks with a size larger than 25% of the data spacing. As illustrated in Figure 14.20 and Figure 14.21, the 90th percentile is 98 ft and 83 ft for the Good Hope Deposit and Gold Ace Zone respectively.
Figure 14.20. Cumulative Frequency Plot Illustrating the Distance from each Block Centroid to the nearest Composite Sample within the Good Hope Zone.
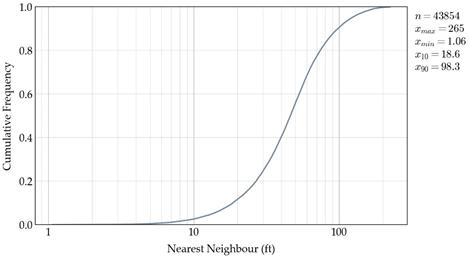
| Effective Date: May 31st, 2022 | | 122 |
Technical Report - Mineral Resource Estimate Reward Project, Nye County, Nevada, USA
Figure 14.21. Cumulative Frequency Plot Illustrating the Distance from each Block Centroid to the nearest Composite Sample within the Gold Ace Zone.

The previous resource estimate completed for the Project (CR Reward, 2017) used a parent block size of 20 by 20 by 20 ft that is less than 25% of the approximated data spacing for both the Good Hope Deposit and Gold Ace Zone. This size is a fairly standard mining unit size selected by many open pits in Nevada and is considered acceptable for use in the current estimate. The final block model is 4,920 ft long in the east-west direction, 5,480 ft long in the north-south direction and 1,900 ft deep (Table 14.7).
Table 14.7. Project Block Model Size and Extents.
| Axis | Number of Blocks | Block Size (ft) |
Minimum Extent (ft) |
Maximum Extent (ft) |
| X (Easting) | 246 | 20 | 62,460 | 67,380 |
| Y (Northing) | 274 | 20 | 1,690 | 7,170 |
| Z (Elevation) | 95 | 20 | 3,040 | 4,940 |
A block factor that represents the percentage of each blocks volume that lies within each estimation domain is calculated for all three domains. The block factor is used to:
| • | Flag which estimation domain each block belongs. |
| • | Calculate the percentage of mineralized material and waste for each block. |
| • | Calculate the volume of mineralized material of each block when undertaking the Mineral Resource estimate. |
| Effective Date: May 31st, 2022 | | 123 |
Technical Report - Mineral Resource Estimate Reward Project, Nye County, Nevada, USA
| 14.8.2 | Volumetric Checks |
A comparison of wireframe volume versus block model volume was performed to ensure there is no considerable over or understating of tonnages (Table 14.8). The calculated block factor for each block was used to scale its volume when calculating the total volume of the block model.
Table 14.8. Wireframe versus Block Model Volume Comparison.
| Wireframe | Wireframe Volume (ft3) |
Block Model Volume with Block Factor (ft3) |
Volume Difference (%) |
| Good Hope | 264,316,535 | 264,345,000 | 0.01 |
| Gold Ace | 20,694,986 | 20,687,500 | -0.04 |
| Total | 285,011,521 | 285,032,500 | 0.01 |
| 14.9 | Grade Estimation |
| 14.9.1 | Estimation Methodology |
Ordinary kriging was used to estimate gold grade for the Good Hope and Gold Ace block models. Grade estimates are only calculated for blocks that contain more than 1.56% mineralized material by volume. A block discretization of 2 (X) by 2 (Y) by 2 (Z) was applied to all blocks during estimation.
A two-pass method was employed that uses two different variogram model, search ellipsoid, and kriging parameter configurations (Table 14.9). A minimum of two drill holes was required for the first pass to ensure there are sufficient data when calculating the mean value used by OK. Volume-variance corrections were enforced by restricting the maximum number of conditioning data to 15 and the maximum number of composites from each drill hole to three. These restrictions were implemented to ensure the estimated models were not over smoothed which would lead to inaccurate estimation of global tonnage and grade. These corrections caused local conditional bias but ensured that the global estimate of grade and tonnage is accurately estimated.
| Effective Date: May 31st, 2022 | | 124 |
Technical Report - Mineral Resource Estimate Reward Project, Nye County, Nevada, USA
Table 14.9. Estimation Search and Kriging Parameters (LV – locally varying).
| Pass | Variogram and Search Orientations (Dip Dir/Dip) |
Max Variogram and Search Range |
Min No. Holes |
Max Comps Per Hole |
Min No. Comps |
Max No. Comps | ||||
| Major | Minor | Vertical | Major | Minor | Vertical | |||||
| Good Hope Zone | ||||||||||
| 1 | LV | LV | LV | 250 | 140 | 60 | 2 | 3 | 2 | 15 |
| 2 | LV | LV | LV | 500 | 280 | 120 | 1 | 3 | 1 | 15 |
| Gold Ace Zone | ||||||||||
| 1 | 137/-10 | 044/-15 | 260/-72 | 220 | 120 | 30 | 2 | 3 | 2 | 15 |
| 2 | 137/-10 | 044/-15 | 260/-72 | 440 | 240 | 60 | 1 | 3 | 1 | 15 |
Estimation of the Good Hope block model was completed with locally varying anisotropy which uses different rotation angles to define the principal directions of the variogram model and search ellipsoid on a per-block basis. Blocks within the estimation domains were assigned rotation angles using a trend surface wireframe. This method allowed structural complexities to be reproduced in the estimated block model. Variogram and search ranges were defined by the variogram model described in Section 0 and Table 14.4.
The Gold Ace Zone block model was calculated using a single variogram and search orientation configuration as described in Section 0 and Table 14.4.
The Good Hope HG and LG estimation domains were separately estimated. To ensure the nature of the boundary between the two estimation domains was reproduced, the centroids of blocks within a specified window of the HG and LG contact were flagged as transitional. Contact analysis was performed to understand the behaviour of gold grades at the boundary and to determine the window used to flag blocks as transitional. As illustrated in Figure 14.22, gold behaves in a statistically semi-soft manner, where the grade of the composites flagged within the LG or HG estimation domains transitions over a short window from a mean of 0.267 ppm Au (0.0078 oz/st Au) to a mean of 1.32 ppm Au (0.0385 oz/st Au). A window of 1 ft into the LG estimation domain from the contact to 5 ft into the HG estimation domain from the contact was used to flag block centroids as transition. Block centroids flagged within the LG or HG estimation domains are estimated using composites flagged within each respective domain in addition to composites flagged within the transition window. Blocks flagged as transition were estimated using only composites flagged within the transition window.
| Effective Date: May 31st, 2022 | | 125 |
Technical Report - Mineral Resource Estimate Reward Project, Nye County, Nevada, USA
Figure 14.22. Gold Grade Contact Plot Analysis, Good Hope LG and HG Grade Domain Contacts.

| Note: | The dashed line represents the mean of composites within each domain. Samples within the LG estimation domain are assigned a negative distance value, and samples within the HG estimation domain are assigned a positive distance value. |
Blocks that contain more than or equal to 1.56% waste by volume were diluted by estimating a waste gold value that was volume-weight averaged with the estimated gold grade. Similar to the transition methodology used along the HG and LG contact at the Good Hope Zone, the intention was to reproduce the gold grade along the estimation domain/waste domain boundary. The nature of gold mineralization at the mineralized/waste contact was evaluated and used to determine a window to flag composites that were used to condition a waste gold estimate for blocks containing waste material. As illustrated in Figure 14.23, gold behaves in a statistically soft manner, where the grade of the composite centroids flagged within the Good Hope estimation domain transitions from mineralization to waste over a window of approximately 5 ft into waste and 20 ft into mineralized material. As illustrated in Figure 14.24, gold behaves in a statistically hard manner, where the grade of the composite centroids flagged within the Gold Ace estimation domain abruptly transitions from mineralized material to waste at the contact.
| Effective Date: May 31st, 2022 | | 126 |
| Technical Report - Mineral Resource Estimate Reward Project, Nye County, Nevada, USA |
Figure 14.23. Contact Plot Analysis, Good Hope Grade and Waste Domain Contacts.
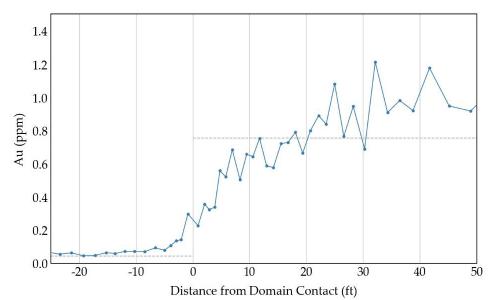
| Note: | The dashed line represents the mean of composites within each domain. Samples within the LG estimation domain are assigned a negative distance value, and samples within the HG estimation domain are assigned a positive distance value. |
Figure 14.24. Contact Analysis, Gold Ace Grade and Waste Domain Contacts.
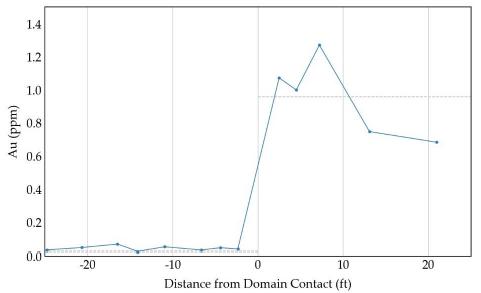
| Note: | The dashed line represents the mean of composites within each domain. Samples within the LG estimation domain are assigned a negative distance value, and samples within the HG estimation domain are assigned a positive distance value. |
A sensitivity analysis was performed to determine the parameters used to flag composite centroids within the mineralization/waste transition zone. The analysis evaluated various window parameters to flag composites within the mineralization/waste transition zone that were then used to estimate a waste gold value for each block containing waste. A diluted gold value was calculated and the parameters were evaluated by comparing the block models contact analysis profile with the composites profile. Based on the results of the sensitivity analysis, a window of 20 ft into waste and 5 ft into the Good Hope Deposit and a window of 20 ft into waste and 4 ft into the Gold Ace Zone mineralized domains best reproduces the gold profile observed at the mineralization/waste transition zone. Additional discussion regarding the validation of this approach is found in Section 4.12.2.
| Effective Date: May 31st, 2022 | | 127 |
| Technical Report - Mineral Resource Estimate Reward Project, Nye County, Nevada, USA |
| 14.10 | Model Validation |
| 14.10.1 | Visual Validation |
The block models for the Good Hope Deposit and Gold Ace Zone were visually validated in plan view and in cross-section to compare the estimated gold grade versus the conditioning composites (Figure 14.25 to Figure 14.28). APEX concluded that the model compared well with the composites on an overall basis. There was some local over and under estimation observed, but due to the limited number of conditioning data available for the estimation in those areas, this was an expected result.
Figure 14.25. Cross-Section 6000N, Showing Block Gold Estimates at the Good Hope Deposit.

Note: Figure prepared by APEX, 2019. The boundary of the HG estimation domain within the LG estimation domain is illustrated by the red polygons
| Effective Date: May 31st, 2022 | | 128 |
| Technical Report - Mineral Resource Estimate Reward Project, Nye County, Nevada, USA |
Figure 14.26. Cross-Section 4800N, Showing Block Gold Estimates at the Good Hope Deposit.

| Note: | Figure prepared by APEX, 2019. The boundary of the HG estimation domain within the LG estimation domain is illustrated by the red polygons |
Figure 14.27. Cross-Section 4100N, Showing Block Gold Estimates at the Good Hope Deposit.

| Note: | Figure prepared by APEX, 2019. The boundary of the HG estimation domain within the LG estimation domain is illustrated by the red polygons |
| Effective Date: May 31st, 2022 | | 129 |
| Technical Report - Mineral Resource Estimate Reward Project, Nye County, Nevada, USA |
Figure 14.28. Cross-Section 2700N, Showing Block Gold Estimates at the Gold Ace deposit.
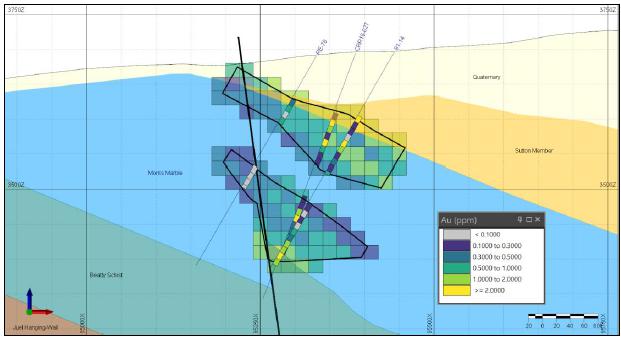
Note: Figure prepared by APEX, 2019.
| 14.10.2 | Statistical Validation |
Swath plots were used to verify that directional trends were honoured in the estimated block model and to identify potential areas of over or under estimation. They were generated by calculating the average gold grade of composites and estimated block models within directional slices. A window of 100 ft was used in east-west slices, 180 ft in north-south slices and 20 ft in vertical slices.
There are minor instances of localized over estimation; however, APEX believes this is a product of a lack of conditioning data in those areas and the smoothing effect of kriging. Overall, trends observed in the composites in all three directions were adequately reproduced in the block model.
Swath plots for the Good Hope and Gold Ace Zones are illustrated in Figure 14.29 and Figure 14.30, respectively.
| Effective Date: May 31st, 2022 | | 130 |
| Technical Report - Mineral Resource Estimate Reward Project, Nye County, Nevada, USA |
Figure 14.29. Swath Plots Showing Composite versus Estimated Gold Grade, Good Hope.


| Effective Date: May 31st, 2022 | | 131 |
| Technical Report - Mineral Resource Estimate Reward Project, Nye County, Nevada, USA |
Figure 14.30. Swath Plots Showing Composite versus Estimated, Gold Grade Gold Ace.


| Effective Date: May 31st, 2022 | | 132 |
| Technical Report - Mineral Resource Estimate Reward Project, Nye County, Nevada, USA |
Volume-variance corrections were used to ensure the estimated models were not over-smoothed, which would lead to inaccurate estimation of global tonnage and grade. To verify that the correct level of smoothing was achieved, theoretical histograms that indicated the anticipated variance and distribution of gold grade at the selected block model size were calculated and plotted against estimated final block model for the Good Hope Deposit and Gold Ace Zone. These are shown in Figure 14.31 and Figure 14.32 respectively. Some smoothing is observed; however, in APEX’s opinion, further restrictions to the estimation search strategy would result in an unacceptable increase in estimation error.
Figure 14.31. Volume Variance Check, Good Hope.

| Effective Date: May 31st, 2022 | | 133 |
| Technical Report - Mineral Resource Estimate Reward Project, Nye County, Nevada, USA |
Figure 14.32. Volume Variance Check, Gold Ace.

Blocks within the Good Hope and Gold Ace block models that contained more than or equal to 1.56% waste by volume were diluted using the estimated waste gold and ore gold values. Ideally, the nature of gold mineralization at the ore/waste contact observed in the composites is reproduced in the block model. Contact analysis plots checking contact profile reproduction for the Good Hope Deposit and Gold Ace Zone are illustrated in Figure 14.33 and Figure 14.34, respectively. APEX personnel and the QP considers that the mineralization/waste contact profile at the Good Hope Deposit is adequately reproduced with a slight over estimation into waste. The mineralization/waste contact profile at the Gold Ace Zone is abrupt (hard) when evaluating composites; however, this cannot be perfectly reproduced with a block model, as each block can only have a single value. Considering this, the contact profile observed in the Gold Ace block model is considered by APEX personnel and the QP to be an adequate reproduction of the profile observed in the conditioning data.
| Effective Date: May 31st, 2022 | | 134 |
| Technical Report - Mineral Resource Estimate Reward Project, Nye County, Nevada, USA |
Figure 14.33. Contact Analysis, Good Hope Grade and Waste Domain Boundary.

Figure 14.34. Contact Analysis, Gold Ace Grade and Waste Domain Boundary.

| Effective Date: May 31st, 2022 | | 135 |
| Technical Report - Mineral Resource Estimate Reward Project, Nye County, Nevada, USA |
| 14.11 | Mineral Resource Classification |
| 14.11.1 | 2019 CIM and SK 1300 Definitions |
The Reward Project MRE discussed in this report has been classified in accordance with guidelines established by the CIM “Estimation of Mineral Resources and Mineral Reserves Best Practice Guidelines” dated November 29th, 2019 and CIM “Definition Standards for Mineral Resources and Mineral Reserves” dated May 14th, 2014 and the standards of SK 1300. Due to the substantial similarity in the CIM and SK 1300 standards, application of both standards produced the same MRE classification.
CIM Definitions
A Measured Mineral Resource is that part of a Mineral Resource for which quantity, grade or quality, densities, shape, and physical characteristics are estimated with confidence sufficient to allow the application of Modifying Factors to support detailed mine planning and final evaluation of the economic viability of the deposit. Geological evidence is derived from detailed and reliable exploration, sampling and testing and is sufficient to confirm geological and grade or quality continuity between points of observation. A Measured Mineral Resource has a higher level of confidence than that applying to either an Indicated Mineral Resource or an Inferred Mineral Resource. It may be converted to a Proven Mineral Reserve or to a Probable Mineral Reserve.
An Indicated Mineral Resource is that part of a Mineral Resource for which quantity, grade or quality, densities, shape and physical characteristics are estimated with sufficient confidence to allow the application of Modifying Factors in sufficient detail to support mine planning and evaluation of the economic viability of the deposit. Geological evidence is derived from adequately detailed and reliable exploration, sampling and testing and is sufficient to assume geological and grade or quality continuity between points of observation. An Indicated Mineral Resource has a lower level of confidence than that applying to a Measured Mineral Resource and may only be converted to a Probable Mineral Reserve.
An Inferred Mineral Resource is that part of a Mineral Resource for which quantity and grade or quality are estimated on the basis of limited geological evidence and sampling. Geological evidence is sufficient to imply but not verify geological and grade or quality continuity. An Inferred Mineral Resource has a lower level of confidence than that applying to an Indicated Mineral Resource and must not be converted to a Mineral Reserve. It is reasonably expected that the majority of Inferred Mineral Resources could be upgraded to Indicated Mineral Resources with continued exploration.
SK 1300 Definitions
An Indicated Mineral Resource is that part of a mineral resource for which quantity and grade or quality are estimated on the basis of adequate geological evidence and sampling. The level of geological certainty associated with an indicated mineral resource is sufficient to allow a qualified person to apply modifying factors in sufficient detail to support mine planning and evaluation of the economic viability of the deposit. Because an indicated mineral resource has a lower level of confidence than the level of confidence of a measured mineral resource, an indicated mineral resource may only be converted to a probable mineral reserve.
| Effective Date: May 31st, 2022 | | 136 |
| Technical Report - Mineral Resource Estimate Reward Project, Nye County, Nevada, USA |
An Inferred Mineral Resource is that part of a mineral resource for which quantity and grade or quality are estimated on the basis of limited geological evidence and sampling. The level of geological uncertainty associated with an inferred mineral resource is too high to apply relevant technical and economic factors likely to influence the prospects of economic extraction in a manner useful for evaluation of economic viability. Because an inferred mineral resource has the lowest level of geological confidence of all mineral resources, which prevents the application of the modifying factors in a manner useful for evaluation of economic viability, an inferred mineral resource may not be considered when assessing the economic viability of a mining project, and may not be converted to a mineral reserve.
A Measured Mineral Resource is that part of a mineral resource for which quantity and grade or quality are estimated on the basis of conclusive geological evidence and sampling. The level of geological certainty associated with a measured mineral resource is sufficient to allow a qualified person to apply modifying factors, as defined in this section, in sufficient detail to support detailed mine planning and final evaluation of the economic viability of the deposit. Because a measured mineral resource has a higher level of confidence than the level of confidence of either an indicated mineral resource or an inferred mineral resource, a measured mineral resource may be converted to a proven mineral reserve or to a probable mineral reserve.
| Effective Date: May 31st, 2022 | | 137 |
| Technical Report - Mineral Resource Estimate Reward Project, Nye County, Nevada, USA |
| 14.11.2 | Classification Criteria |
The classification of the Measured, Indicated, and Inferred Mineral Resources was based on a combination of geological confidence, data quality, and grade continuity. The most relevant factors used in the classification process were as follows:
| • | Density of conditioning data. |
| • | Level of confidence in the geological interpretation, which is a result of the extensive re-logging of drill chips. The observed stratigraphic horizons are easily identifiable along strike and across the deposit, which provides confidence in the geological and mineralization continuity. |
| • | Continuity of mineralization. |
Resource classification was determined using a multiple-pass strategy that consisted of a sequence of runs that flagged each block, when a block first met the search restrictions of that run. With each subsequent pass, the search restrictions were decreased, and therefore, represented a decrease in confidence and classification from the previous run. During each run, a search ellipsoid centred and orientated as described in Section 4.8 had its ranges modified (Table 14.10) and the number of composites and drill holes found within the run were used to determine if the restrictions described in Table 14.10 for that run were met. The runs were executed in sequence from Run 1 to Run 3. Classification was then determined by relating the run number that each block is flagged to: Measured (Run 1), Indicated (Run 2) and Inferred (Run 3).
Table 14.10. Interpolation Search Restrictions.
| Zone | Run No. | Classification | Min No. |
Min No. |
Search Ellipsoid |
Major |
Minor |
Vertical |
| Good Hope | Run 1 | Measured | 3 | 12 | 2/3 | 165 | 95 | 40 |
| Run 2 | Indicated | 2 | 2 | 1 | 250 | 140 | 60 | |
| Run 3 | Inferred | 1 | 1 | 2 | 500 | 280 | 120 | |
| Gold Ace | Run 2 | Indicated | 3 | 12 | 1 | 220 | 120 | 30 |
| Run 3 | Inferred | 1 | 1 | 2 | 440 | 240 | 60 |
APEX personnel visually validated the results and believe them to be reasonable given the drilling density. However, a small portion of blocks at the northern (greater than 6500 N) and southern (less than 2750 N) extents of the Good Hope Deposit were manually adjusted to Inferred as there is insufficient drilling density to justify higher confidence classifications.
| 14.12 | Evaluation of Reasonable Prospects for Eventual Economic Extraction |
Reasonable prospects for eventual economic extraction assume open pit mining methods and heap leach processing. The unconstrained resource block model was subjected to several pit optimization scenarios to look at the prospects for eventual economic extraction. The criteria in Table 14.11 and the Datamine Studio MaxiPit optimization software were used in creating the conceptual open pit shell.
| Effective Date: May 31st, 2022 | | 138 |
| Technical Report - Mineral Resource Estimate Reward Project, Nye County, Nevada, USA |
Table 14.11. Parameters for Pit Optimization for Mineral Resource Estimate.
| Parameter | Unit (Imperial) | Cost (Imperial) | Unit (Metric) | Cost (Metric) |
| Gold Price | US$/oz | 1,700 | US$/g | 54.656 |
| Gold Metallurgical Recovery | % | 80 | % | 80 |
| Pit Wall Angles | ° | 48-58 | ° | 48-58 |
| Mining Cost | US$/st | 2.00 | US$/tonne | 2.20 |
| Processing Rate | Mst/a | 3 | Mtonne/a | 2.7 |
| Processing Cost | US$/st | $5.50 | US$/tonne | $6.06 |
| G & A Cost | US$/st | 0.75 | US$/tonne | 0.80 |
| Cut-off Grade (break even) | oz/st | 0.0047 | g/tonne | 0.158 |
| Royalty | % | 3 | % | 3 |
The criteria used in the pit optimizer were considered reasonable for Nevada heap leach deposits. The volume and tonnage for the reported resources within the $1,700/oz optimized pit shell represents approximately 88% of the total volume and tonnage of the unconstrained block model which utilized a lower gold cut-off of 0.2 ppm Au (0.006 oz/st Au) for the Mineral Resource statement.
The MRE was estimated within three-dimensional (3D) solids representing the Low Grade and High Grade mineralized estimation domains. Grade was estimated into a percent style block model with a block size of 20 ft (X) by 20 ft (Y) by 20 ft (Z). Block were assigned density samples for a given formation for the ore and waste blocks. Grade estimation of gold was performed using OK. For the purposes of the pit shell optimization, blocks along the estimation domain boundaries that partially contain waste were diluted by estimating a waste value using composites within a transition zone along the outer boundary of the estimation domains. The final diluted gold grade for the diluted model assigned to each block is a volume-weighted average of the estimated gold and waste grade values. The MRE is reported within that pit shell and using the diluted gold grades.
| Effective Date: May 31st, 2022 | | 139 |
| Technical Report - Mineral Resource Estimate Reward Project, Nye County, Nevada, USA |
| 14.13 | Mineral Resource Statement |
The Reward Project MRE has an effective date of May 31st, 2022 and is reported in accordance with the CSA’s NI 43-101 rules for disclosure and has been estimated using the CIM “Estimation of Mineral Resources and Mineral Reserves Best Practice Guidelines” dated November 29th, 2019 and CIM “Definition Standards for Mineral Resources and Mineral Reserves” dated May 10th, 2014 and in accordance with the requirements of SK 1300.
The MRE was estimated by Mr. Warren Black, M.Sc., P.Geo. and audited by Mr. Steven Nicholls, BA.Sc., MAIG, both APEX employees. The Qualified Person for the estimate is Mr. Michael Dufresne, M.Sc., P.Geol., P.Geo.
The Measured and Indicated resources are reported in Table 14.12 using a base case cut-off of 0.2 ppm Au (0.006 oz/st Au). The Inferred resource base case is reported in Table 14.13 using a base case cut-off of 0.2 ppm Au (0.006 oz/st Au). Sensitivity cases ranging from 0.1 ppm Au (0.003 oz/st Au) to 0.5 ppm Au (0.015 oz/st Au) are included in the Table 14.14 and Table 14.15 for Good Hope and in Table 14.16 and Table 14.17 for Gold Ace. Table 14.18 and Table 14.19 provides the sensitivity case for the combined Good Hope and Gold Ace estimates. In each sensitivity table, the 0.2 ppm Au (0.006 oz/st Au) base case is bolded.
Table 14.12. Measured and Indicated Mineral Resource Statement.
| Classification |
Au |
Tonnage |
Average |
Contained Au |
| Good Hope Zone | ||||
| Measured | 0.2 | 6,185,000 | 0.855 | 169,900 |
| Indicated | 0.2 | 10,757,000 | 0.694 | 240,000 |
| M & I Total | 0.2 | 16,942,000 | 0.753 | 409,900 |
| Gold Ace Zone | ||||
| Indicated | 0.2 | 828,000 | 0.632 | 16,800 |
| Reward (Combined Good Hope and Gold Ace) | ||||
| Measured | 0.2 | 6,185,000 | 0.855 | 169,900 |
| Indicated | 0.2 | 11,584,000 | 0.689 | 256,800 |
| M & I Total | 0.2 | 17,770,000 | 0.747 | 426,700 |
Notes:
| 1. | Oxide estimated Mineral Resources are reported within a pit shell using the Lerch Grossman algorithm, a gold price of US$1,700/oz and a recovery of 80% for Au were utilized. |
| 2. | Mining costs for mineralized material and waste are US$2.20/tonne. |
| 3. | Processing and general and administration are US$6.06/tonne and US$0.83/tonne per tonne processed respectively. |
| 4. | Due to rounding, some columns or rows may not compute as shown. |
| 5. | Estimated Mineral Resources are stated as in situ dry metric tonnes and are partially diluted. |
| 6. | The estimate of Mineral Resources may be materially affected by legal, title, taxation, socio-political, marketing, or other relevant issues. |
| 7. | The effective date of the Reward mineral resource estimate is May 31st, 2022. |
| Effective Date: May 31st, 2022 | | 140 |
| Technical Report - Mineral Resource Estimate Reward Project, Nye County, Nevada, USA |
Table 14.13. Inferred Mineral Resource Statement.
| Classification |
Au |
Tonnage |
Average |
Contained Au |
| Good Hope Zone | ||||
| Inferred | 0.2 | 294,000 | 0.555 | 5,300 |
| Gold Ace Zone | ||||
| Inferred | 0.2 | 931,000 | 0.729 | 21,800 |
| Reward (Combined Good Hope and Gold Ace) | ||||
| Inferred | 0.2 | 1,225,000 | 0.687 | 27,100 |
Notes:
| 1. | Oxide estimated Mineral Resources are reported within a pit shell using the Lerch Grossman algorithm, a gold price of US$1,700/oz and a recovery of 80% for Au were utilized. |
| 2. | Mining costs for mineralized material and waste are US$2.20/tonne. |
| 3. | Processing and general and administration are US$6.06/tonne and US$0.83/tonne per tonne processed respectively. |
| 4. | Due to rounding, some columns or rows may not compute as shown. |
| 5. | Estimated Mineral Resources are stated as in situ dry metric tonnes and are partially diluted. |
| 6. | The estimate of Mineral Resources may be materially affected by legal, title, taxation, socio-political, marketing, or other relevant issues. |
| 7. | The effective date of the Reward mineral resource estimate is May 31st, 2022. |
Table 14.14. Sensitivity Table, Measured and Indicated Mineral Resources, Good Hope (base case is bolded).
| Classification |
Au Cutoff Grade (ppm) |
Tonnage (metric tonnes) |
Average Au Grade (ppm) |
Contained Au (troy ounces) |
| Measured | 0.1 | 6,672,000 | 0.804 | 172,400 |
| 0.2 | 6,185,000 | 0.855 | 169,900 | |
| 0.3 | 5,269,000 | 0.960 | 162,500 | |
| 0.4 | 4,446,000 | 1.073 | 153,300 | |
| 0.5 | 3,866,000 | 1.167 | 145,000 | |
| Indicated | 0.1 | 12,063,000 | 0.636 | 246,600 |
| 0.2 | 10,757,000 | 0.694 | 240,000 | |
| 0.3 | 8,805,000 | 0.792 | 224,300 | |
| 0.4 | 6,988,000 | 0.907 | 203,900 | |
| 0.5 | 5,706,000 | 1.011 | 185,400 | |
|
Measured |
0.1 | 18,735,000 | 0.696 | 419,000 |
| 0.2 | 16,942,000 | 0.753 | 409,900 | |
| 0.3 | 14,074,000 | 0.855 | 386,800 | |
| 0.4 | 11,434,000 | 0.972 | 357,200 | |
| 0.5 | 9,573,000 | 1.074 | 330,500 |
| Effective Date: May 31st, 2022 | | 141 |
Technical Report - Mineral Resource Estimate Reward Project, Nye County, Nevada, USA
Notes:
| 1. | Oxide estimated Mineral Resources are reported within a pit shell using the Lerch Grossman algorithm, a gold price of US$1,700/oz and a recovery of 80% for Au were utilized. |
| 2. | Mining costs for mineralized material and waste are US$2.20/tonne. |
| 3. | Processing and general and administration are US$6.06/tonne and US$0.83/tonne per tonne processed respectively. |
| 4. | Due to rounding, some columns or rows may not compute as shown. |
| 5. | Estimated Mineral Resources are stated as in situ dry metric tonnes and are partially diluted. |
| 6. | The estimate of Mineral Resources may be materially affected by legal, title, taxation, socio-political, marketing, or other relevant issues. |
| 7. | The effective date of the Reward mineral resource estimate is May 31st, 2022. |
Table 14.15. Sensitivity Table, Inferred Mineral Resources, Good Hope (base case is bolded).
| Classification | Au Cutoff Grade (ppm) |
Tonnage (metric tonnes) |
Average Au Grade (ppm) |
Contained Au (troy ounces) |
| Inferred | 0.1 | 331,000 | 0.510 | 5,400 |
| 0.2 | 294,000 | 0.555 | 5,300 | |
| 0.3 | 255,000 | 0.602 | 4,900 | |
| 0.4 | 205,000 | 0.663 | 4,400 | |
| 0.5 | 141,000 | 0.755 | 3,400 |
Notes:
| 1. | Oxide estimated Mineral Resources are reported within a pit shell using the Lerch Grossman algorithm, a gold price of US$1,700/oz and a recovery of 80% for Au were utilized. |
| 2. | Mining costs for mineralized material and waste are US$2.20/tonne. |
| 3. | Processing and general and administration are US$6.06/tonne and US$0.83/tonne per tonne processed respectively. |
| 4. | Due to rounding, some columns or rows may not compute as shown. |
| 5. | Estimated Mineral Resources are stated as in situ dry metric tonnes and are partially diluted. |
| 6. | The estimate of Mineral Resources may be materially affected by legal, title, taxation, socio-political, marketing, or other relevant issues. |
| 7. | The effective date of the Reward mineral resource estimate is May 31st, 2022. |
Table 14.16. Sensitivity Table, Indicated Mineral Resources, Gold Ace (base case is bolded).
| Classification | Au Cutoff Grade (ppm) |
Tonnage (metric tonnes) |
Average Au Grade (ppm) |
Contained Au (troy ounces) |
| Indicated | 0.1 | 899,000 | 0.594 | 17,200 |
| 0.2 | 828,000 | 0.632 | 16,800 | |
| 0.3 | 716,000 | 0.690 | 15,900 | |
| 0.4 | 585,000 | 0.767 | 14,400 | |
| 0.5 | 472,000 | 0.843 | 12,800 |
Notes:
| 1. | Oxide estimated Mineral Resources are reported within a pit shell using the Lerch Grossman algorithm, a gold price of US$1,700/oz and a recovery of 80% for Au were utilized. |
| 2. | Mining costs for mineralized material and waste are US$2.20/tonne. |
| 3. | Processing and general and administration are US$6.06/tonne and US$0.83/tonne per tonne processed respectively. |
| 4. | Due to rounding, some columns or rows may not compute as shown. |
| 5. | Estimated Mineral Resources are stated as in situ dry metric tonnes and are partially diluted. |
| 6. | The estimate of Mineral Resources may be materially affected by legal, title, taxation, socio-political, marketing, or other relevant issues. |
| 7. | The effective date of the Reward mineral resource estimate is May 31st, 2022. |
| Effective Date: May 31st, 2022 | | 142 |
Technical Report - Mineral Resource Estimate Reward Project, Nye County, Nevada, USA
Table 14.17. Sensitivity Table, Inferred Mineral Resources, Gold Ace (base case is bolded).
| Classification | Au Cutoff Grade (ppm) |
Tonnage (metric tonnes) |
Average Au Grade (ppm) |
Contained Au (troy ounces) |
| Inferred | 0.1 | 1,031,000 | 0.673 | 22,300 |
| 0.2 | 931,000 | 0.729 | 21,800 | |
| 0.3 | 802,000 | 0.806 | 20,800 | |
| 0.4 | 671,000 | 0.896 | 19,300 | |
| 0.5 | 537,000 | 1.009 | 17,400 |
Notes:
| 1. | Oxide estimated Mineral Resources are reported within a pit shell using the Lerch Grossman algorithm, a gold price of US$1,700/oz and a recovery of 80% for Au were utilized. |
| 2. | Mining costs for mineralized material and waste are US$2.20/tonne. |
| 3. | Processing and general and administration are US$6.06/tonne and US$0.83/tonne per tonne processed respectively. |
| 4. | Due to rounding, some columns or rows may not compute as shown. |
| 5. | Estimated Mineral Resources are stated as in situ dry metric tonnes and are partially diluted. |
| 6. | The estimate of Mineral Resources may be materially affected by legal, title, taxation, socio-political, marketing, or other relevant issues. |
| 7. | The effective date of the Reward mineral resource estimate is May 31, 2022. |
Table 14.18. Sensitivity Table, Measured and Indicated Mineral Resources, Good Hope and Gold Ace (base case is bolded).
| Classification | Au Cutoff Grade (ppm) |
Tonnage (metric tonnes) |
Average Au Grade (ppm) |
Contained Au (troy ounces) |
| Measured | 0.1 | 6,672,000 | 0.804 | 172,400 |
| 0.2 | 6,185,000 | 0.855 | 169,900 | |
| 0.3 | 5,269,000 | 0.960 | 162,500 | |
| 0.4 | 4,446,000 | 1.073 | 153,300 | |
| 0.5 | 3,866,000 | 1.167 | 145,000 | |
| Indicated | 0.1 | 12,962,000 | 0.633 | 263,700 |
| 0.2 | 11,584,000 | 0.689 | 256,800 | |
| 0.3 | 9,521,000 | 0.785 | 240,200 | |
| 0.4 | 7,573,000 | 0.897 | 218,300 | |
| 0.5 | 6,178,000 | 0.998 | 198,200 | |
Measured and Indicated |
0.1 | 19,634,000 | 0.691 | 436,200 |
| 0.2 | 17,770,000 | 0.747 | 426,700 | |
| 0.3 | 14,790,000 | 0.847 | 402,700 | |
| 0.4 | 12,019,000 | 0.962 | 371,700 | |
| 0.5 | 10,044,000 | 1.063 | 343,300 |
Notes:
| 1. | Oxide estimated Mineral Resources are reported within a pit shell using the Lerch Grossman algorithm, a gold price of US$1,700/oz and a recovery of 80% for Au were utilized. |
| 2. | Mining costs for mineralized material and waste are US$2.20/tonne. |
| 3. | Processing and general and administration are US$6.06/tonne and US$0.83/tonne per tonne processed respectively. |
| 4. | Due to rounding, some columns or rows may not compute as shown. |
| 5. | Estimated Mineral Resources are stated as in situ dry metric tonnes and are partially diluted. |
| 6. | The estimate of Mineral Resources may be materially affected by legal, title, taxation, socio-political, marketing, or other relevant issues. |
| 7. | The effective date of the Reward mineral resource estimate is May 31, 2022. |
| Effective Date: May 31st, 2022 | | 143 |
Technical Report - Mineral Resource Estimate Reward Project, Nye County, Nevada, USA
Table 14.19. Sensitivity Table, Inferred Mineral Resources, Good Hope and Gold Ace (base case is bolded).
| Classification | Au Cutoff Grade (ppm) |
Tonnage (metric tonnes) |
Average Au Grade (ppm) |
Contained Au (troy ounces) |
| Inferred | 0.1 | 1,362,000 | 0.633 | 27,700 |
| 0.2 | 1,225,000 | 0.687 | 27,100 | |
| 0.3 | 1,057,000 | 0.757 | 25,700 | |
| 0.4 | 876,000 | 0.841 | 23,700 | |
| 0.5 | 678,000 | 0.956 | 20,800 |
Notes:
| 1. | Oxide estimated Mineral Resources are reported within a pit shell using the Lerch Grossman algorithm, a gold price of US$1,700/oz and a recovery of 80% for Au were utilized. |
| 2. | Mining costs for mineralized material and waste are US$2.20/tonne. |
| 3. | Processing and general and administration are US$6.06/tonne and US$0.83/tonne per tonne processed respectively. |
| 4. | Due to rounding, some columns or rows may not compute as shown. |
| 5. | Estimated Mineral Resources are stated as in situ dry metric tonnes and are partially diluted. |
| 6. | The estimate of Mineral Resources may be materially affected by legal, title, taxation, socio-political, marketing, or other relevant issues. |
| 7. | The effective date of the Reward mineral resource estimate is May 31, 2022. |
14.14 Discussion of Mineral Resources Modelling, Risks and Uncertainties
The complete assay database comprises assays from 18 drilling programs from 1987 to 2018, utilizing six different analytical labs and two mine labs. The uniformity of analytical data across these numerous generations of data collection is complex and difficult to interpret in some instances because of the large number of drilling programs and laboratories used, which provides a source of risk. To date, data verification of historical data has been completed to industry standards as described in Section 12, including a number of twin drill holes. To help decrease this risk further, additional drilling in critical volumes of the deposit that contain large amounts of contained metal dominated by historical RC drilling would allow for additional data analysis to help establish the quality and uniformity of the various generations of analytical data.
At the Good Hope Deposit, gold mineralization is predominantly associated with logged oxide and, to a lesser extent, with transition material (sulphides comprise <1% of the rock mass). Gold solubility is consistently high (>70%) across the Good Hope Deposit, and total sulphur values are predominantly low, with an average of 0.1 wt%. Logged redox correlates well with total sulphur. However, recoveries from the Gold Ace Zone are lower than Good Hope. Gold solubility using Cyanide Ratio to Fire Assay ratios from lab assays does not appear to correlate with either logged REDOX or total sulphur. Section 13.6.1 describes that silica encapsulation may explain the observed lower gold recoveries; however, metallurgical testing has not determined this definitively. Silica encapsulation provides a source of uncertainty when defining reasonable prospects for eventual economic extraction. Metallurgical testing at Gold Ace is limited, and future work should aim to determine the expected heap leach recovery of material from the Gold Ace Zone.
| Effective Date: May 31st, 2022 | | 144 |
Technical Report - Mineral Resource Estimate Reward Project, Nye County, Nevada, USA
The authors are not aware of any other significant material risks to the MRE other than the risks that are inherent to mineral exploration and development in general. The authors of this report are not aware of any specific environmental, permitting, legal, title, taxation, socio-economic, marketing, political or other relevant factors that might materially affect the results of this resource estimate and there appear to be no obvious impediments to developing the MRE at the Reward Gold Project.
------
Sections 15-22 are not included. This Technical Report for the Reward Project provides an initial Mineral Resource Estimate only.
------
23 Adjacent Properties
23.1 Bullfrog
The Bullfrog property, owned by Augusta, is located in the Walker Lane district, a prolific gold-producing region. The property is 11.27 km (7 miles) northwest of the Project, and the two properties are connected via paved highway (Figure 23.1). The Bullfrog property consists of approximately 3,157 ha (7,800 acres) of mineral rights (Augusta Gold, 2021). Bullfrog contains three historical operating pits: Montgomery-Shoshone, Bullfrog, and Bonanza Mountain (Augusta Gold, 2021).
The Bullfrog property is located in brittle middle Miocene volcanic rocks, ranging from latite lavas to rhyolitic Ammonia Tanks Tuff (Downer and House, 2022). These rocks were severely deformed from detachment faulting and associated dip-slip and strike-slip displacements (Downer and House, 2022). Epithermal solutions permeated the broken host rocks, precipitating micron-sized, relatively high-grade gold within major quartz-calcite veins and disseminated gold in associated stock-works (Downer and House, 2022).
Effective December 31, 2021, the measured resource estimate for the Bullfrog property is 16,381,580 g (526,680 oz) gold grading 0.544 g/t (0.016 oz/t) gold, an indicated mineral resource of 21,231,540 g (682,610 oz) gold grading 0.519 g/t (0.015 oz/t) and an inferred mineral resource of 8,021,590 g (257,900 oz) gold grading 0.481 g/t (0.014 oz/t) (Augusta Gold, 2022).
The Bullfrog property occurs outside of the Reward Project. The QPs have not visited this property and are unable to verify the information pertaining to the mineralization at Bullfrog. The information presented in this section is not necessarily indicative of the mineralization on the Property that is the subject of this Technical Report. The information provided in this section is simply intended to describe examples of the type and tenor of mineralization that exists in the region and is being explored for at Reward.
| Effective Date: May 31st, 2022 | | 145 |
Technical Report - Mineral Resource Estimate Reward Project, Nye County, Nevada, USA
Figure 23.1. Adjacent Properties.
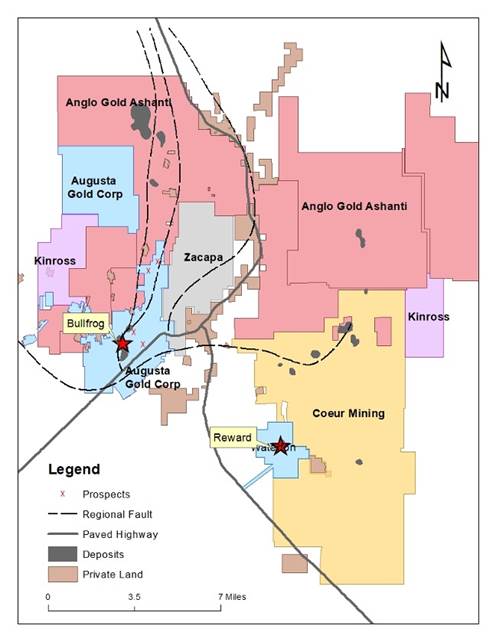
Note: Source is Augusta Gold, 2022.
23.2 Sterling and Crown
The Sterling and Crown properties are owned by Coeur Mining Inc. and are adjacent to the Property on its northern, eastern, and southern edges (Figure 23.1). The Sterling and Crown properties consist of 5,710 hectares (14,109 acres) of mineral claims, including the Sterling, Daisy, Secret Pass, and SNA gold deposits. The Sterling and Crown properties also include the Sterling open pit and underground heap leach gold mine, which ceased gold production in 2000 (Ennis et al., 2017).
| Effective Date: May 31st, 2022 | | 146 |
Technical Report - Mineral Resource Estimate Reward Project, Nye County, Nevada, USA
The Sterling deposit occurred at and below the Sterling Thrust contact between the Wood Canyon and Bonanza King formations (Ennis et al., 2017). Gold is hosted by argillaceous arkosic siltstones, arkosic sandstones, quartzites, dolomites, limestones, and breccias, occurring as submicron to micron size particles (Ennis et al., 2017).
The Daisy, Secret Pass, and SNA deposits are hosted by Tertiary volcanics and Paleozoic-aged rocks and are found in the Nopah Formation, Crater Flat Tuff deposit, and Antelope Valley Formation, respectively (Ennis et al., 2017). North-striking normal faulting is the principal control for mineralization, regardless of the deposit, and the highest gold grades are commonly associated with fault intersections (Ennis et al., 2017).
Effective December 31, 2021, the properties have an inferred mineral resource of 28,428,580 g (914,000 oz) gold grading 0.86 g/t (0.025 oz/t) (Coeur Mining, 2022).
The Sterling and Crown properties occur outside of the Reward Project. The QPs have not visited this property and are unable to verify the information pertaining to the mineralization at Sterling and Crown. The information presented in this section is not necessarily indicative of the mineralization on the Property that is the subject of this Technical Report. The information provided in this section is simply intended to describe examples of the type and tenor of mineralization that exists in the region and is being explored for at Reward.
24 Other Relevant Data and Information
This section is not relevant to this Report.
25 Interpretation and Conclusions
25.1 Introduction
The QPs note the following interpretations and conclusions in their respective areas of expertise, based on the review of data available for this Report.
25.2 Mineral Tenure, Surface Rights, Water Rights, Royalties/Agreements
Information obtained from CR Reward supports that the mineral tenure held is valid, and the granted exploitation licence is sufficient to support a declaration of Mineral Resources and eventually Mineral Reserves.
CR Reward, a wholly owned subsidiary of Augusta, holds a 100% interest in the mineral claims and mineral leases that form the Project.
| Effective Date: May 31st, 2022 | | 147 |
Technical Report - Mineral Resource Estimate Reward Project, Nye County, Nevada, USA
A 3% NSR royalty is payable on any minerals mined from the Connolly Claims, but is reduced to 2% as CR Reward only owns a two-third interest in the Connolly Claims. Annual advance minimum royalty payments are payable under the Connolly Lease in an amount equal to $10,000/year.
A 3% NSR royalty is payable on any minerals mined from the Webster Claims, but is (i) reduced to 1% on the Sunshine and Reward claims as the lessee only owns a one-third interest, and (ii) reduced to 1.5% on the Good Hope claim as CR Reward only owns a half interest in this claim. Annual advance minimum royalty payments are payable under the Webster Lease in an amount equal to $7,500/year.
A 3% NSR royalty is payable on minerals mined from the Orser–McFall Claims, but is reduced to 1.5% on the Good Hope claim as the lessee only owns a half interest in that claim. Annual advance minimum royalty payments are payable under the Orser–McFall Lease in an amount equal to $20,000/year.
A 3% NSR royalty is payable on minerals mined from the Van Meeteren Claims. Annual advance minimum royalty payments are payable under the Van Meeteren Lease in an amount equal to $15/acre from 2011 through 2020, for a total of $1,800/year, and $20/acre from and after 2021, for a total of $2,400/year.
The Project area mainly consists of Federal public domain lands administered by the BLM. There are no State or private tracts within the Project area, except the six patented claims owned by CR Reward, all of which carry surface and mineral rights ownership.
Water rights are granted, and sufficient to support potential mining operations.
The Project is not subject to any other back-in rights payments, agreements or encumbrances.
To the extent known to the QPs, there are no other significant factors and risks that may affect access, title, or the right or ability to perform work on the Project that have not been discussed in this Report.
25.3 Geology
Mineralization the Good Hope Deposit and Golden Ace Zone can be classified as examples of a structurally-controlled, locally-disseminated, sediment-hosted, mesothermal quartz vein gold deposit.
The geological understanding of the settings, lithologies, and structural and alteration controls on mineralization in the different zones is sufficient to support estimation of Mineral Resources and Mineral Reserves. The geological knowledge of the area is also considered sufficiently acceptable to reliably inform mine planning.
| Effective Date: May 31st, 2022 | | 148 |
Technical Report - Mineral Resource Estimate Reward Project, Nye County, Nevada, USA
The mineralization style and setting are well understood and can support declaration of Mineral Resources and Mineral Reserves.
At the Good Hope Deposit, gold mineralization remains open to the east towards the Good Fortune fault and south of 3000 N. The eastern area of the deposit, most notably along the Good Fortune fault, has had limited drilling. Wide-spaced drilling along the southern extension of the fault zone has intersected anomalous gold mineralization. The projected intersection of the Good Hope fault zone and the Gold Ace trend also remains under drilled.
25.4 Exploration, Drilling and Analytical Data Collection in Support of Mineral Resource Estimation
The exploration programs completed to date are appropriate for the style of the deposits on the Project.
Sampling methods are acceptable for Mineral Resource and Mineral Reserve estimation.
Sample preparation, analysis and security are generally performed in accordance with exploration best practices and industry standards.
The quantity and quality of the lithological, geotechnical, collar and down-hole survey data collected during the exploration and delineation drilling programs are sufficient to support Mineral Resource and Mineral Reserve estimation. The collected sample data adequately reflect deposit dimensions, true widths of mineralization, and the style of the deposits. Sampling is representative of the gold grades in the deposits, reflecting areas of higher and lower grades.
The QA/QC programs adequately address issues of precision, accuracy and contamination. Drilling programs typically included blanks, duplicates and standard samples. QA/QC submission rates meet industry-accepted standards.
The data verification programs concluded that the data collected from the Project adequately support the geological interpretations and constitute a database of sufficient quality to support the use of the data in Mineral Resource and Mineral Reserve estimation.
25.5 Metallurgical Test work
Metallurgical test work and associated analytical procedures were appropriate to the mineralization type, appropriate to establish the optimal processing routes, and were performed using samples that are typical of the mineralization styles found within the Good Hope Deposit area. Recovery factors estimated are based on appropriate metallurgical test work.
Results from the metallurgical test work show that Good Hope ore is amenable to cyanide leaching with an expected field recovery of 79% at the nominated P80 minus ¼ inch crush size. Reagent consumption is low to moderate with expected cyanide consumption of 0.73 lb/st and a lime consumption of 1.53 lb/st. Cement agglomeration is not required for heap heights under 262 ft.
| Effective Date: May 31st, 2022 | | 149 |
Technical Report - Mineral Resource Estimate Reward Project, Nye County, Nevada, USA
The Gold Ace deposit is less amenable to cyanide leaching with an estimated field recovery of 58.5% and reagent consumptions of 0.72 lb/st and 2.46 lb/st for cyanide and lime, respectively. At present, the Gold Ace deposit is not included in the Mineral Reserve estimate.
There are no deleterious elements known that would affect process activities or metallurgical recoveries.
25.6 Mineral Resource Estimate
Mineral Resources are reported using the 2019 CIM Definition Standards and the standards of SK 1300 and assume open pit mining methods.
Factors that may affect the Mineral Resource estimates include: metal price assumptions; changes to the assumptions used to generate the gold cut-off grade; changes in local interpretations of mineralization geometry and continuity of mineralized zones; changes to geological and mineralization shape and geological and grade continuity assumptions; density and domain assignments; changes to geotechnical, mining and metallurgical recovery assumptions; change to the input and design parameter assumptions that pertain to the conceptual pit constraining the estimates; and assumptions as to the continued ability to access the site, retain mineral and surface rights titles, maintain environment and other regulatory permits, and maintain the social license to operate.
There is upside potential for the estimates if mineralization that is currently classified as Inferred or exploration target can be upgraded to higher-confidence Mineral Resource categories.
25.7 Risks and Uncertainties
The complete assay database comprises assays from 18 drilling programs from 1987 to 2018, utilizing six different analytical labs and two mine labs. The uniformity of analytical data across these numerous generations of data collection is complex and difficult to interpret in some instances because of the large number of drilling programs and laboratories used, which provides a source of risk. To date, data verification of historical data has been completed to industry standards as described in Section 12, including a number of twin drill holes. To help decrease this risk further, additional drilling in critical volumes of the deposit that contain large amounts of contained metal dominated by historical RC drilling would allow for additional data analysis to help establish the quality and uniformity of the various generations of analytical data.
| Effective Date: May 31st, 2022 | | 150 |
Technical Report - Mineral Resource Estimate Reward Project, Nye County, Nevada, USA
At the Good Hope Deposit, gold mineralization is predominantly associated with logged oxide and, to a lesser extent, with transition material (sulphides comprise <1% of the rock mass). Gold solubility is consistently high (>70%) across the Good Hope zone, and total sulphur values are predominantly low, with an average of 0.1 wt%. Logged redox correlates well with total sulphur. However, recoveries from the Gold Ace Zone are lower than Good Hope. Au solubility using Cyanide Ratio to Fire Assay ratios from lab assays does not appear to correlate with either logged REDOX or total sulphur. Section 13.6.1 describes that silica encapsulation may explain the observed lower gold recoveries; however, metallurgical testing has not determined this definitively. Silica encapsulation provides a source of uncertainty when defining reasonable prospects for eventual economic extraction. Metallurgical testing at Gold Ace is limited, and future work should aim to determine the expected heap leach recovery of material from the Gold Ace. In the opinion of the authors, additional drilling and metallurgical work could improve the metallurgical model at the Good Hope Deposit, which may lead to an increase in the amount of high and moderate recovery material.
With any intermediate stage exploration project there exists potential risks and uncertainties. The Company will attempt to reduce risk/uncertainty through effective project management, engaging technical experts and developing contingency plans. Potential risks include changes in the price of gold, availability of investment capital, changes in government regulations, community engagement and socio-economic community relations, permitting and legal challenge risks and general environment concerns.
The authors are not aware of any other significant material risks to the MRE other than the risks mentioned above. The authors of this report are not aware of any specific environmental, permitting, legal, title, taxation, socio-economic, marketing, political or other relevant factors that might materially affect the results of this resource estimate and there appear to be no obvious impediments to developing the MRE at the Reward Gold Project. There is no guarantee that further exploration will result in the discovery of additional mineralization at the Reward Project.
25.8 Conclusions
Based upon a review of available information, historical and recent exploration data, the authors site visits and the current MRE for the Good Hope Deposit and Gold Ace Zone of the Reward Project, the authors view the Project as an intermediate stage exploration property of merit prospective for the additional discovery, and future development, of potentially economic structurally-controlled, locally-disseminated, sediment-hosted, mesothermal quartz vein gold mineralization. This contention is supported by the following:
| • | The favourable geological setting of the Reward Project and its position within the Walker Land Trend, a prolifically mineralized belt that is host to numerous gold deposits and current and past producing mines in south-central Nevada. |
| Effective Date: May 31st, 2022 | | 151 |
Technical Report - Mineral Resource Estimate Reward Project, Nye County, Nevada, USA
| • | Historical exploration and recent work by CR Reward has delineated a large zone of gold mineralization at Good Hope and Gold Ace and led to the calculation of the current MRE. |
| • | Recent metallurgical testwork indicates projected field gold recovery of 79% for the Good Hope Deposit at the nominated P80 minus ¼ inch crush size. |
| • | A current MRE has been estimated herein and is provided in Table 25.1 below: |
Table 25.1. Reward Project Mineral Resource Estimate at May 31st, 2022 Based on USD$1,700/oz. Au.
| Classification | Tonnage (Mt) | Average Grade (g/t) | Contained Au (koz) |
| Good Hope | |||
Measured Indicated M&I Total |
6.19 10.76 16.94 |
0.86 0.69 0.75 |
169.9 240.0 409.9 |
| Inferred | 0.29 | 0.56 | 5.3 |
| Gold Ace | |||
Indicated Inferred |
0.83 1.03 |
0.63 0.73 |
16.8 21.8 |
| Reward (Combined Good Hope and Gold Ace) | |||
Measured Indicated M&I Total |
6.19 11.58 17.77 |
0.86 0.69 0.75 |
169.9 256.8 426.7 |
| Inferred | 1.23 | 0.68 | 27.1 |
Notes:
| 1. | Oxide estimated Mineral Resources are reported within a pit shell using the Lerch Grossman algorithm, a gold price of US$1,700/oz and a recovery of 80% for Au were utilized. |
| 2. | Mining costs for mineralized material and waste are US$2.20/tonne. |
| 3. | Processing and general and administration are US$6.06/tonne and US$0.83/tonne per tonne processed, respectively. |
| 4. | Due to rounding, some columns or rows may not compute as shown. |
| 5. | Estimated Mineral Resources are stated as in situ dry metric tonnes and are partially diluted. |
| 6. | The estimate of Mineral Resources may be materially affected by legal, title, taxation, socio-political, marketing, or other relevant issues. |
| 7. | The effective date of the Reward mineral resource estimate is May 31st, 2022. |
26 Recommendations
Based on the outcomes of this Technical Report and prior work conducted by CR Reward, it is recommended that CR Reward and Augusta proceed to a Preliminary Feasibility Study (PFS) for the Reward Project in order to examine opportunities to develop the Project. The PFS will be an update to a historical internal Feasibility Study (FS) prepared in 2019 on behalf of CR Reward and Waterton. The recommended PFS will incorporate current pricing for major equipment, contract mining costs, construction costs, major consumables, and labor costs.
| Effective Date: May 31st, 2022 | | 152 |
Technical Report - Mineral Resource Estimate Reward Project, Nye County, Nevada, USA
The budget for completing a PFS is $US1,100,000, including contingency, as summarized in Table 26.1.
Table 26.1. Estimated budget for the recommended PFS.
| Item | Cost USD$ |
| Primary Engineer, includes Process and Infrastructure | 420,000 |
| Mineral Resource Estimate | 20,000 |
| Mining and Mineral Reserve | 40,000 |
| Geotechnical and Earthworks | 110,000 |
| Power and Other Consulting | 400,000 |
| Contingency | 110,000 |
| Total | 1,100,000 |
| Effective Date: May 31st, 2022 | | 153 |
Technical Report - Mineral Resource Estimate Reward Project, Nye County, Nevada, USA
27 References
Albert, Terry: Report of Metallurgical Testwork (Kappes, Cassiday and Associates Project 9147C, Report KCA 0180001_REW01_05, 2018).
ALS, 2017. Geochemistry schedule of services and fees 2017 USD, ALS Global, p42.
Armbrust, George A., et al., Reward Project Pre-feasibility Study (CAM Report No. 057111, 2006), Section 7.0, p78-86.
ASTM D4543 - 08 Standard Practices for Preparing Rock Core as Cylindrical Test Specimens and Verifying Conformance to Dimensional and Shape Tolerances.
ASTM D5607 - 08 Standard Test Method for Performing Laboratory Direct Shear Strength Tests of Rock Specimens Under Constant Normal Force.
ASTM D5731 - 08 Standard Test Method for Determination of the Point Load Strength Index of Rock and Application to Rock Strength Classifications.
ASTM D7012 - 14 Standard Test Methods for Compressive Strength and Elastic Moduli of Intact Rock Core Specimens under Varying States of Stress and Temperatures.
Augusta Gold Corp. (2021): Augusta Gold commences 2021 exploration program at its Bullfrog gold project; Augusta Gold Corp. News Release dated February 11, 2021, < https://www.augustagold.com/_resources/news/nr_20210211.pdf >
Augusta Gold Corp. (2022): Augusta Gold announces Reward mineral resource estimate; Augusta Gold Corp. News Release dated June 7, 2022, < https://www.augustagold.com/news/augusta-gold-announces-reward-mineral-resource-estimate >
Barcia, M., 2017. Reward – Structural & Formation Modeling; Elko Mining Group, unpublished internal memorandum dated May 9, 2017, p16
Bernard, F., Chlumsky, G., Read, M.J., Reilly, M.P., and Sandefur, R.L., 2012. NI 43-101 Technical Report on the Reward Gold Project, Nye County, Nevada USA. Unpublished Technical Report (NI 43-101 compliant) prepared for Atna Resources Ltd. dated June 29, 2012, p146.
Bernard, Fred et al., Reward Project Feasibility Study (CAM Report No. 077111, 2008), Section 6.0, p.95-117.
BLM, 2009. Environmental Assessment DOI-BLM-NV-S030-2007-0295-EA: CR Reward Corporation Reward Project. Report prepared by U.S. Department of the Interior, Bureau of Land Management (BLM) for the CR Reward Corporation. June 26, 2009.
Brown, C., 2018. Reward Oriented Core Analysis; Unpublished consulting report prepared by Oriented Targeting Solutions on behalf of CR Reward, dates June 2018, p44.
| Effective Date: May 31st, 2022 | | 154 |
Technical Report - Mineral Resource Estimate Reward Project, Nye County, Nevada, USA
Bryan, R., 2017. NI 43-101 Technical Report Mineral Estimate Bullfrog Gold Project, Nye County, Nevada. Unpublished Technical Report (NI 43-101 compliant) prepared for Bullfrog Gold Corp., dated August 9, 2017, p93.
Bryan, R., 2017. NI 43-101 Technical Report Mineral Resource Estimate Bullfrog Gold Project Nye County, Nevada, Document: 910557-REP-R0001-01.
Call, R.D. and Savely, J.P., 1990. Open Pit Rock Mechanics. Surface Mining, ed. B.A. Kennedy, 2nd ed., Chapter 6.8. Littleton, Colorado: SME.
CAM, 2006. Pre-Feasibility Study - Reward Project: consulting report dated 26 January 2006, prepared for Canyon Resources Corporation by Chlumsky, Armbrust & Meyer, LLC (George A. Armbrust Ph.D., C.P.G; Gregory F. Chlumsky; Kenneth L. Meyer; Michael J. Read; Robert L. Sandefur P.E.).
CAM, 2008b. Technical Report, Reward Project, Nye County, Nevada: consulting report dated December 15, 2008, prepared for Atna Resources Ltd. by Chlumsky, Armbrust & Meyer, LLC (Fred Barnard, Ph.D., Gregory F. Chlumsky; Kenneth L. Meyer; Michael J. Read; Robert L. Sandefur P.E.). In pdf format.
CAM, 2012. NI 43-101 Technical Report, Reward Project, Nye County, Nevada prepared for Atna Resources Ltd. by Barnard, F., Ph, D., Cpg-, A.C.M., Chlumsky, G., Read, M.J., Member, S.M.E.R., Sandefur, R.L., and Colorado, P.E. 140 pages in pdf format.
Canadian Institute of Mining, Metallurgy and Petroleum (CIM), 2003: Estimation of Mineral Resources and Mineral Reserves – Best Practice Guidelines, May 30, 2003: adopted by CIM Council on November 23, 2003.
Canadian Institute of Mining, Metallurgy and Petroleum (CIM), 2014: CIM Definition Standards – for Mineral Resources and Mineral Reserves, prepared by the CIM Standing Committee on Reserve Definitions: adopted by the CIM Council, May 2014.
Canadian Securities Administrators (CSA), 2011: National Instrument 43-101, Standards of Disclosure for Mineral Projects, Canadian Securities Administrators.
Carisey, 1989. Continuum Analytics, 2017. Anaconda Software Distribution. Retrieved from https://continuum.io
Centre for Computational Geostatistics (CCG). 2016. Pygeostat. Edmonton AB: Centre for Computational Geostatistics. Retrieved from http://www.ccgalberta.com
Code of Federal Regulations (CFR): Commodity and Securities Exchange Regulation S-K 1300, Title 17 subpart 229.1300, pp. 1300-1305.
Continuum Analytics, 2017. Anaconda Software Distribution. Retrieved from https://continuum.io
Coeur Mining Inc., 2022: Coeur reports year-end 2021 mineral reserves and resources; Coeur Mining Inc. News Release dated February 16, 2022, < https://www.coeur.com/_resources/news/nr_20220216.pdf >
| Effective Date: May 31st, 2022 | | 155 |
Technical Report - Mineral Resource Estimate Reward Project, Nye County, Nevada, USA
Converse, 2007. Canyon Resources Reward Mine Biological Assessment, Nye County, Nevada: Desert Tortoise, Sensitive Species, Bats, Migratory Birds, Noxious Weeds. Report prepared by Converse Consultants (Converse) for CR Briggs Corporation. September 27, 2007.
Cornwall, H.R. and Kleinhampl, F.J., 1961, Preliminary Geologic Map and Sections of the Bullfrog Quadrangle, Nevada-California: U.S. Geological Survey, Miscellaneous Field Studies Map MF-177.
Cornwall, H.R. and Kleinhampl, F.J, 1964, Geology of Bullfrog Quadrangle and Ore Deposits related to Bullfrog Hills Caldera, Nye County, Nevada and Inyo County, California,1964: U.S. Geological Survey Professional Paper 454-J
CR., 2018. Application for Renewal Water Pollution Control Permit NEV2007101. Report prepared by CR Reward Corporation (CR) and submitted to Nevada Division of Environmental Protection (NDEP). March 2018.
CRC., 2007. Reward Project: Water Pollution Control Permit Application. Prepared by Canyon Resources Corporation (CRC) for a Water Pollution Control Permit. March 2007.
CRRC., 2009. Reward Project: Updated Plan of Operations and Reclamation Plan. BLM Case File Serial Number N-82840. Prepared by CR Reward Corporation (CRRC) for the Bureau of Land Management (BLM) and the Bureau of Mining Regulation and Reclamation (BMRR). July 2009.
CRRC., 2018. Application for Renewal Water Pollution Control Permit NEV2007101: CR Reward Corporation Reward Project. Volume 3: Meteorological Report. Submitted by CR Reward Corporation (CRRC) to Nevada Division of Environmental Protection (NDEP). March 2018.
County, Nevada: internal memo prepared for Barrick Bullfrog, Inc, dated February 9, 1996, p15Fowlow, Keith, 2017. Reward Database Verification; Elko Mining Group, unpublished internal memorandum dated May 9, 2017, p6
Downer, R., and House, A., 2022: NI 43-101 Technical Report and Mineral Resource Estimate on the Bullfrog Gold Project, Nye County, Nevada, Canada; submitted by Augusta Gold Corp., 186 p., < Available at www.sedar.com >
Eliopulos, G.J., 1996. Report on Exploration and Drilling during 1995 at the Reward Property, Nye
Ennis, S., Loveday, D., Turner, W.A., DeLong, R.F., 2017: Technical Report on the Sterling Property, Nye County, Nevada, USA: A Property Under Option to Purchase by Northern Empire., 165 p., < Available at www.sedar.com >
Evans, D., Lincoln, N., Scott, T., Willow, M., Cremeens, J., Dufresne, M. and Dyer, T., 2019: Reward Project feasibility study NI 43-101 technical report Nevada, USA, internal report prepared by Lycopodium Minerals Canada Ltd., dated September 6, 2019, p242.
Fowlow, Keith, 2018a. Reward 2018 DataShed database and exports; CR Reward Corp., unpublished internal report dated March 28, 2018, p12.
Fowlow, Keith, 2018b. February 2017 Reward database verification with 2018 addendum; Elko Mining Group, unpublished internal memorandum p7.
| Effective Date: May 31st, 2022 | | 156 |
| Technical Report - Mineral Resource Estimate Reward Project, Nye County, Nevada, USA |
Geological Survey (US), & Monsen, S. A., 1992. Geologic map of Bare Mountain, Nye County, Nevada. The Survey.
Gillstrom, G., 2006. Technical Report on the Sterling Property 144 Zone: Resource Summary and Exploration Proposal, Nevada, U.S.A., p89.
Golder, 2007. Golder Associates Inc., Draft Report on Slope Design Recommendations - Reward Project, Nye County, Nevada.
Golder Associates Inc., Design Report for Reward Mine Heap Leach Facility. March 2007.
Golder Associates Inc., Reward Leach Event Pond, J-629. January 2013.
Goldfarb, R.J., Baker, T., Dube, B., Groves, D.I., Hart, C.J R. and Gosselin, P., 2005: Distribution, Characters and Genesis of Gold Deposits in Metamorphic Terranes: Economic Geology 100th Anniversary Volume, Society of Economic Geologists, Littleton, Colorado, USA, pp. 407–450.
Groves, D.I., Goldfarb, R.J., Gebre-Mariam, M., Hagemann, S.G., and Robert, F. 1998: Orogenic Gold Deposits: A Proposed Classification in the Context of their Crustal Distribution and Relationship to Other Gold Deposit Types: Ore Geology Review, Special Issue, Vol. 13, pp. 7–27.
Groves, D.I., Goldfarb, R.J., Robert, F., and Hart, C.J.R., 2003: Gold Deposits in Metamorphic Belts: Overview of Current Understanding, Outstanding Problems, Future Research, and Exploration Significance: Economic Geology, Vol. 98, pp. 1–29.
Greybeck, J.D., and Wallace, A.B., 1991. Gold Mineralization at Fluorspar Canyon Near Beatty, Nye Country, Nevada. Geology of Ore Deposits of the Great Basin. Symposium Proceedings. Geological Society of Nevada, Reno, Nevada. pp935-946.
Hoisch, T.D., Heizler, M.T., and Zartman, R.E., 1997. Timing of detachment faulting in the Bullfrog Hills and Bare Mountain area, southwest Nevada—Inferences from 40Ar/39Ar, K-Ar, U-Pb, and fission track thermochronology: Journal of Geophysical Research, v. 102, p. 2815–2833.HydroCAD, 2015
Hynes-Griffin, M.E. and Franklin, A.G., 1984. Rationalizing the Seismic Coefficient Method; United States Army Corp of Engineers, Waterways Experiment Station, CWIS Work Unit 31145.
Jensen, Daniel A., 2022A. Title Report Update, Reward Property, 119 Unpatented Mining Claims, Nye County, Nevada, Unpublished Title Report on behalf of CR Reward LLC dated April 9, 2022, 6 Pages and Exhibits.
Jensen, Daniel A., 2022B. Title Report Update, Reward Property, 2 Unpatented Mining Claims, Nye County, Nevada, Unpublished Title Report on behalf of CR Reward LLC dated April 10, 2022, 9 Pages and Exhibits.
| Effective Date: May 31st, 2022 | | 157 |
| Technical Report - Mineral Resource Estimate Reward Project, Nye County, Nevada, USA |
Jensen, Daniel A., 2022C. Title Report Update, Reward Property, 2 Unpatented Mining Claims, Nye County, Nevada, Unpublished Title Report on behalf of CR Reward LLC dated April 11, 2022, 10 Pages and Exhibits.
Jensen, Daniel A., 2022D. Title Report Update, Reward Property, 6 Patented Mining Claims, Nye County, Nevada, Unpublished Title Report on behalf of CR Reward LLC dated April 12, 2022, 5 Pages and Exhibits.
Kautz, 2007. Reward Mining Project Historic Context, Nye County, Nevada: 2.0 Prehistoric, Ethnohistoric, and Historic Contexts and Research Themes. Report prepared by Kautz Environmental Consultants, Inc. (Kautz) for the CR Briggs Corporation.
Laney, Debbie Column Leach Tests on Barrick Core Samples from Reward Property (Rayrock Mines, Inc. Memorandum, 1998).
Laney, Debbie Column Leach Tests on Rayrock Trench Samples from Reward Property (Rayrock Mines, Inc. Memorandum, 1998).
Lycopodium Minerals Canada, 2019: Reward Project feasibility study report; internal report prepared for CR Reward Limited Liability Company; dated September 6, 2019, p402.
Marinos, P. and Hoek, E., 2002. GSI: A Geologically Friendly Tool for Rock Mass Strength Estimation.
Marr, J., 2006. Geological Report and Proposal for Exploration Fluorspar Canyon. Sterling Gold Mining Corporation. Beatty, Nevada. Internal Report. p23.
McPartland, Jack S., Report on Bottle Roll Cyanidation Tests – Reward Cuttings Composites (McClelland Laboratories, Inc. Job No. 3175, 2007).
McPartland, Jack S., Report on Metallurgical Testing – Reward Drill Core Composites (McClelland Laboratories, Inc. Job No. 3206, 2008).
Monsen, S.A., Carr, M.D., Reheis, M.C. and Orkild, P.P., 1992. Geologic Map of Bare Mountain, Nye County, Nevada (1:24,000); U.S. Geological Survey, Miscellaneous Investigations Series Map 1-2201.
Moritz, R., 2000: What Have We Learnt About Orogenic Lode Gold Deposits Over the Past 20 Years?: article posted to University of Geneva, Switzerland, website, 7 p. accessed 8 February 2010, http://www.unige.ch/sciences/terre/mineral/publications/onlinepub/moritz_gold_brgm_2000.doc.
Natural Resources Conservation Service (NRCS), 2004. Soil Survey of Nye County, Nevada, Southwest Part: Part 1. United States Department of Agriculture. In cooperation with United States Department of Interior, Bureau of Land Management; and University of Nevada Agricultural Experiment Station.
Nevada Bureau of Mines and Geology, 1997. The Nevada Mineral Industry – 1997. Special Publication MI-1997.
| Effective Date: May 31st, 2022 | | 158 |
| Technical Report - Mineral Resource Estimate Reward Project, Nye County, Nevada, USA |
Nevada Bureau of Mines and Geology, 1999. The Nevada Mineral Industry – 1999. Special Publication MI-1999.
Nevada Bureau of Mines and Geology, 2001. The Nevada Mineral Industry – 2001. Special Publication MI-2001.
Noble, D.C., Weiss, S.I., and McKee, E.H., 1991, Magmatic and hydro- thermal activity, caldera geology, and regional extension in the western part of the southwestern Nevada volcanic field, in Raines, G.L., Lisle, R.E., Schaefer, R.W., and Wilkinson, W.H., eds., Geology and ore deposits of the Great Basin: Geological Society of Nevada, symposium proceedings, Reno, p. 913-934.
Papke K.G., and Davis, D.A., 2019: Mining Claim Procedures for Nevada Prospectors and Miners: Nevada Bureau of Mines and Geology, Sixth Edition, accessed via the internet, https://pubs.nbmg.unr.edu/Mining-claim-procedures-for-NV-p/sp006.htm
Rasmussen, J.C. and Keith, S.B., 2015. Magma-Metal Series Classification of Mineralization in the Vicinity of Yucca Mountain, Nevada; n book: In New concepts and discoveries, volume II; Geological Society of Nevada, Editors: W.M. Pennell, L.J. Garside, P. 1131-1152.
Sawyer, D.A., Fleck,R.J., Lanphere, M.A., Warren, R.G., Broxton, D.E. and Hudson, M.R., 1994. Episodic caldera volcanism in the Miocene southwestern Nevada volcanic field: revised stratigraphic framework, 4OAd39Ar geochronology, and implications for magmatism and extension. Geological Society of America Bulletin 106, 304-1318.
Sloan, Robert, Mineralogical Assessment of Good Hope and Gold Ace Samples (ALS Metallurgy Report KM5696 2018).
Teal, L. and Jackson, M., 1997. Geological overview of the Carlin trend gold deposits and descriptions of recent discoveries; Society of Economic Geologists Newsletter, Number 31, October 1997, pp13-25.
Weiss, S.I., 1996. Hydrothermal Activity, Epithermal Mineralization and Regional Extension in the Southwestern Nevada Volcanic Field, University of Nevada, Reno, Nevada, unpublished Ph.D. dissertation, p212.
| Effective Date: May 31st, 2022 | | 159 |
| Technical Report - Mineral Resource Estimate Reward Project, Nye County, Nevada, USA |
| 28 | Date and Signature |
This Technical Report titled “Mineral Resource Estimate for the Reward Project, Nye County, Nevada, USA” is current as of the effective date of May 31, 2022 and was prepared and signed by Mr. Michael Dufresne of APEX Geoscience Ltd. and Mr. Tim Scott of Kappes, Cassiday & Associates.
Date: June 29, 2022
Location: Edmonton, Alberta, Canada
and Reno, Nevada, USA
In relation to Sections: 1.1 to 1.8, 1.10 to 12 and 14 to 25.4, 25.6, 25.8 to 27 and co-responsible for 25.7
“Signed & Sealed”
__________________
Michael B. Dufresne, M.Sc., P. Geol., P. Geo.
President
APEX Geoscience Ltd.
EGBC Permit to Practice # 1003016
APEGA Permit to Practice # P005824
In relation to Sections: 1.9, 13, 25.5 and co-responsible for 25.7
“Signed & Sealed”
__________________
Timothy D. Scott, BA.Sc., RM SME
Senior Engineer and Project Manager
Kappes, Cassiday & Associates
| Effective Date: May 31st, 2022 | | 160 |
| Technical Report - Mineral Resource Estimate Reward Project, Nye County, Nevada, USA |
| 29 | Certificate of Author |
I, Michael Dufresne, M.Sc., P. Geol., P.Geo., do hereby certify that:
| 1. | I am President and a Principal of APEX Geoscience Ltd., Suite 100, 11450 – 160th Street NW, Edmonton, AB, Canada, T5M 3Y7. |
| 2. | I graduated with a B.Sc. in Geology from the University of North Carolina at Wilmington in 1983 and with a M.Sc. in Economic Geology from the University of Alberta in 1987. |
| 3. | I am and have been registered as a Professional Geologist with the Association of Professional Engineers and Geoscientists (“APEGA”) of Alberta since 1989. I have been registered as a Professional Geologist with the association of Professional Engineers and Geoscientists of BC since 2012. |
| 4. | I have worked as a geologist for more than 35 years since my graduation from University and have extensive experience with exploration for, and the evaluation of, gold deposits of various types, including structurally-controlled, locally-disseminated, sediment-hosted, quartz vein mineralization including mineral resource estimates. |
| 5. | I have read the definition of “Qualified Person” set out in National Instrument 43-101 (“NI 43-101”) and certify that by reason of my education, affiliation with a professional association (as defined in NI 43-101) and past relevant work experience, I fulfill the requirements to be a “Qualified Person” for the purposes of NI 43-101. |
| 6. | I am responsible for sections 1.1 to 1.8, 1.10 to 12 and 14 to 25.4, 25.6, 25.8 to 27 and co-responsible for 25.7 of the technical report titled “Mineral Resource Estimate for the Reward Project, Nye County, Nevada, USA”, with an effective date of May 31st, 2022 (the “Technical Report”). I visited the Reward Project on August 2nd, 2017 and August 12th and 15th, 2019. |
| 7. | To the best of my knowledge, information and belief, the Technical Report contains all relevant scientific and technical information that is required to be disclosed, to make the Technical Report not misleading. |
| 8. | I have read National Instrument 43-101 and Form 43-101F1, and the Technical Report has been prepared in compliance with that instrument and form. |
| 9. | I am independent of the issuer, the vendor and the Property applying all of the tests in section 1.5 of both NI 43-101 and 43-101CP. |
| 10. | I have had prior involvement with the Property as a QP and co-author of a Feasibility Study and Technical Report on behalf of CR Reward in September 2019. |
| 11. | I consent to the filing of the Technical Report with any stock exchange and other regulatory authority and any publication by them for regulatory purposes, including electronic publication in the public company files or their websites. |
Signing date: June 29th, 2022
Edmonton, Alberta, Canada
“Signed & Sealed”
___________________
Michael Dufresne, M.Sc., P. Geol., P.Geo.
| Effective Date: May 31st, 2022 | | 161 |
| Technical Report - Mineral Resource Estimate Reward Project, Nye County, Nevada, USA |
 |
Kappes, Cassiday & Associates |
Certificate of Qualified Person
I, Timothy D. Scott, of Las Vegas Nevada, USA do hereby certify that as an author of "Mineral Resource Estimate for the Reward Project, Nye County, Nevada, USA" prepared for CR Reward LLC. and Augusta Gold Corp., Effective Date 31 May 2022, and dated 29 June 2022 that:
| 1. | I am an independent consultant affiliated as an Associate with the firm of Kappes, Cassiday and Associates, 7950 Security Circle, Reno, Nevada, USA 89506 since 2006 and my personal address is 140 S. Buteo Woods Ln., Las Vegas, Nevada USA 89144. | |
| 2. | I graduated from Montana College of Mineral Science and Technology in 1987 with a Bachelor of Science in Geological Engineering degree. | |
| 3. | I am a Registered Member in good standing of the Society of Mining, Metallurgy and Exploration (4153680RM). I have practiced my profession continuously since 1987 in all aspects of mineral processing, metallurgy, and gold extraction; heap leaching; and design and construction of mineral processing and metals extraction facilities. I am a "Qualified Person" for the purposes of NI 43-101 by reason of my education, affiliation with a professional association as defined by NI-43-101 and past relevant work experience. | |
| 4. | I have practiced my profession continuously for 35 years. | |
| 5. | I am responsible for sections 1.9, 13.0, 25.5 and co responsible for section 25.7. | |
| 6. | I have read the definition of "Qualified Person" set out in National Instrument 43-101 (NI 43-101) and certify that, by reason of my education, affiliation with a professional association (as defined in NI 43-101) and past relevant work experience, I am a "qualified person" for the purpose of NI 43-101. | |
| 7. | I visited the site on 22 September 2018, and May 16, 2022. | |
| 8. | I am independent of the issuer in accordance with the application of Section 1.5 of National Instrument 43-101. | |
| 9. | I have been involved with previous studies regarding the Property since June, 2017. | |
| 10. | I have read National Instrument 43-101 and Form 43-101F1 and the Technical Report has been prepared in compliance with same. | |
| 11. | At the effective date of the Technical Report, to the best of my knowledge, information and belief, the Technical Report contains all scientific and technical information that is required to be disclosed to make the Technical Report not misleading. |
Dated at Reno, Nevada, USA this 29' day of June 2022.
"Signed & Sealed"
____________________
Timothy D. Scitt, SME (4153680RM)
| Effective Date: May 31st, 2022 | | 162 |
Serious News for Serious Traders! Try StreetInsider.com Premium Free!
You May Also Be Interested In
- Globe Life Inc. (GL) Misses Q1 EPS by 1c, Offers Guidance
- Lowey Dannenberg, P.C. is Investigating Global Life Inc. (“Global Life”) (NYSE: GL) for Potential Violations of the Federal Securities Laws and Encourages Investors with more than $50,000 in Losse
- Endeavour Silver Provides Q1 2024 Construction Progress Update on Terronera; Construction Progress Reaches 53% Completion
Create E-mail Alert Related Categories
SEC FilingsSign up for StreetInsider Free!
Receive full access to all new and archived articles, unlimited portfolio tracking, e-mail alerts, custom newswires and RSS feeds - and more!
