Form 8-K ASSOCIATED BANC-CORP For: May 23
Updated May 23, 2022 Second Quarter Investor Presentation Associated Banc-Corp Exhibit 99.1
1 Forward-Looking Statements Important note regarding forward-looking statements: Statements made in this presentation which are not purely historical are forward-looking statements, as defined in the Private Securities Litigation Reform Act of 1995. This includes any statements regarding management’s plans, objectives, or goals for future operations, products or services, and forecasts of its revenues, earnings, or other measures of performance. Such forward-looking statements may be identified by the use of words such as “believe,” “expect,” “anticipate,” “plan,” “estimate,” “should,” “will,” “intend,” "target,“ “outlook,” “project,” “guidance,” or similar expressions. Forward-looking statements are based on current management expectations and, by their nature, are subject to risks and uncertainties. Actual results may differ materially from those contained in the forward-looking statements. Factors which may cause actual results to differ materially from those contained in such forward-looking statements include those identified in the Company’s most recent Form 10-K and subsequent Form 10-Qs and other SEC filings, and such factors are incorporated herein by reference. Trademarks: All trademarks, service marks, and trade names referenced in this material are official trademarks and the property of their respective owners. Presentation: Within the charts and tables presented, certain segments, columns and rows may not sum to totals shown due to rounding.
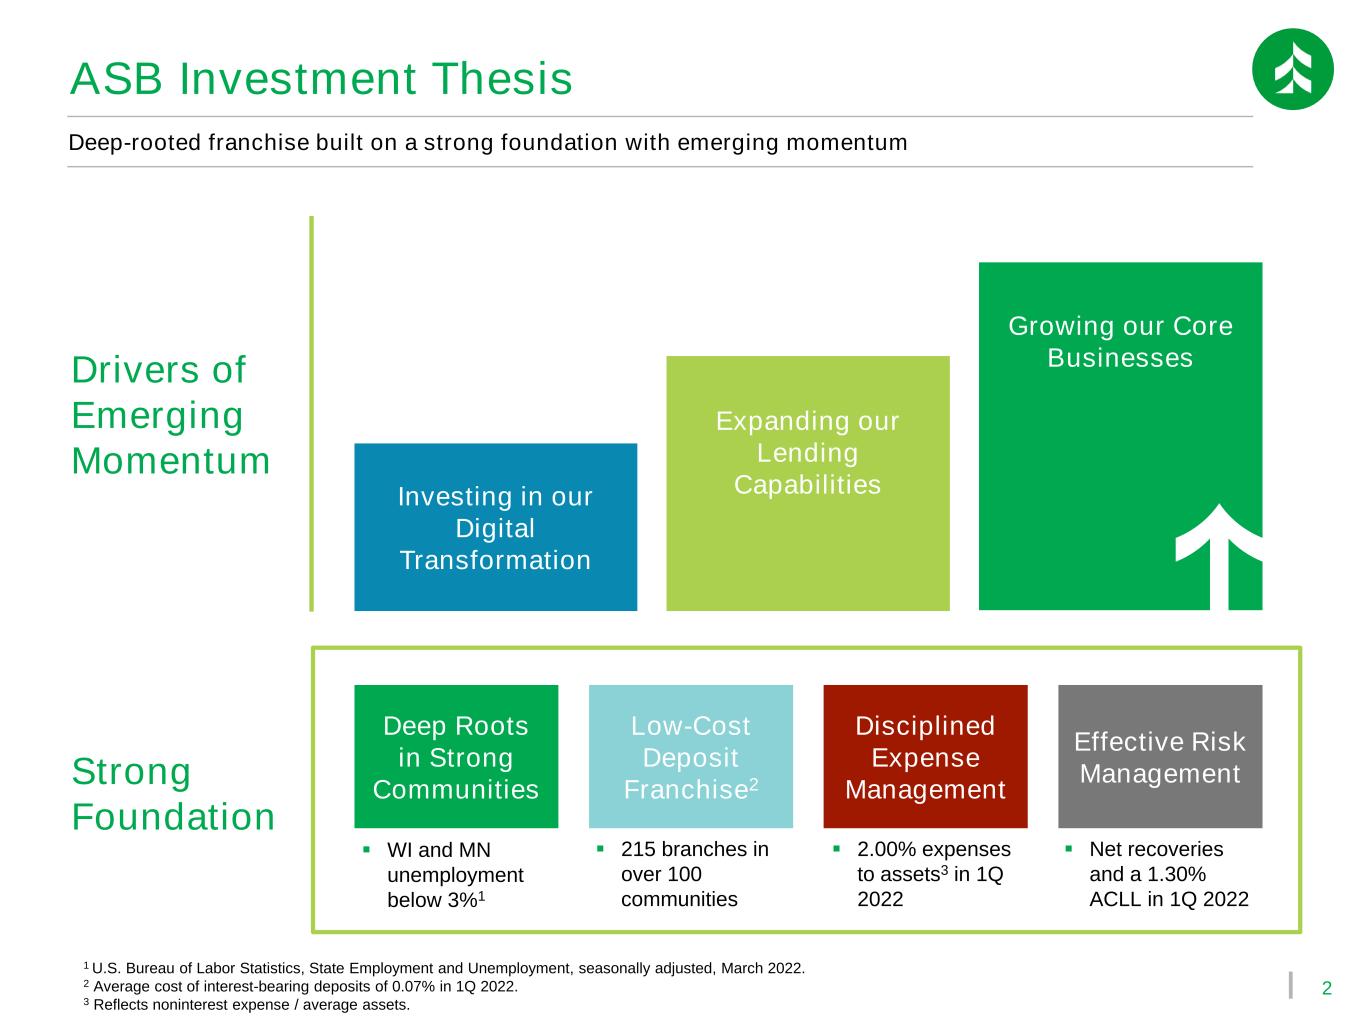
2 ASB Investment Thesis Strong Foundation Deep-rooted franchise built on a strong foundation with emerging momentum Drivers of Emerging Momentum Deep Roots in Strong Communities Low-Cost Deposit Franchise2 Effective Risk Management Disciplined Expense Management 1 U.S. Bureau of Labor Statistics, State Employment and Unemployment, seasonally adjusted, March 2022. 2 Average cost of interest-bearing deposits of 0.07% in 1Q 2022. 3 Reflects noninterest expense / average assets. Expanding our Lending Capabilities Growing our Core Businesses Investing in our Digital Transformation ▪ WI and MN unemployment below 3%1 ▪ 215 branches in over 100 communities ▪ 2.00% expenses to assets3 in 1Q 2022 ▪ Net recoveries and a 1.30% ACLL in 1Q 2022
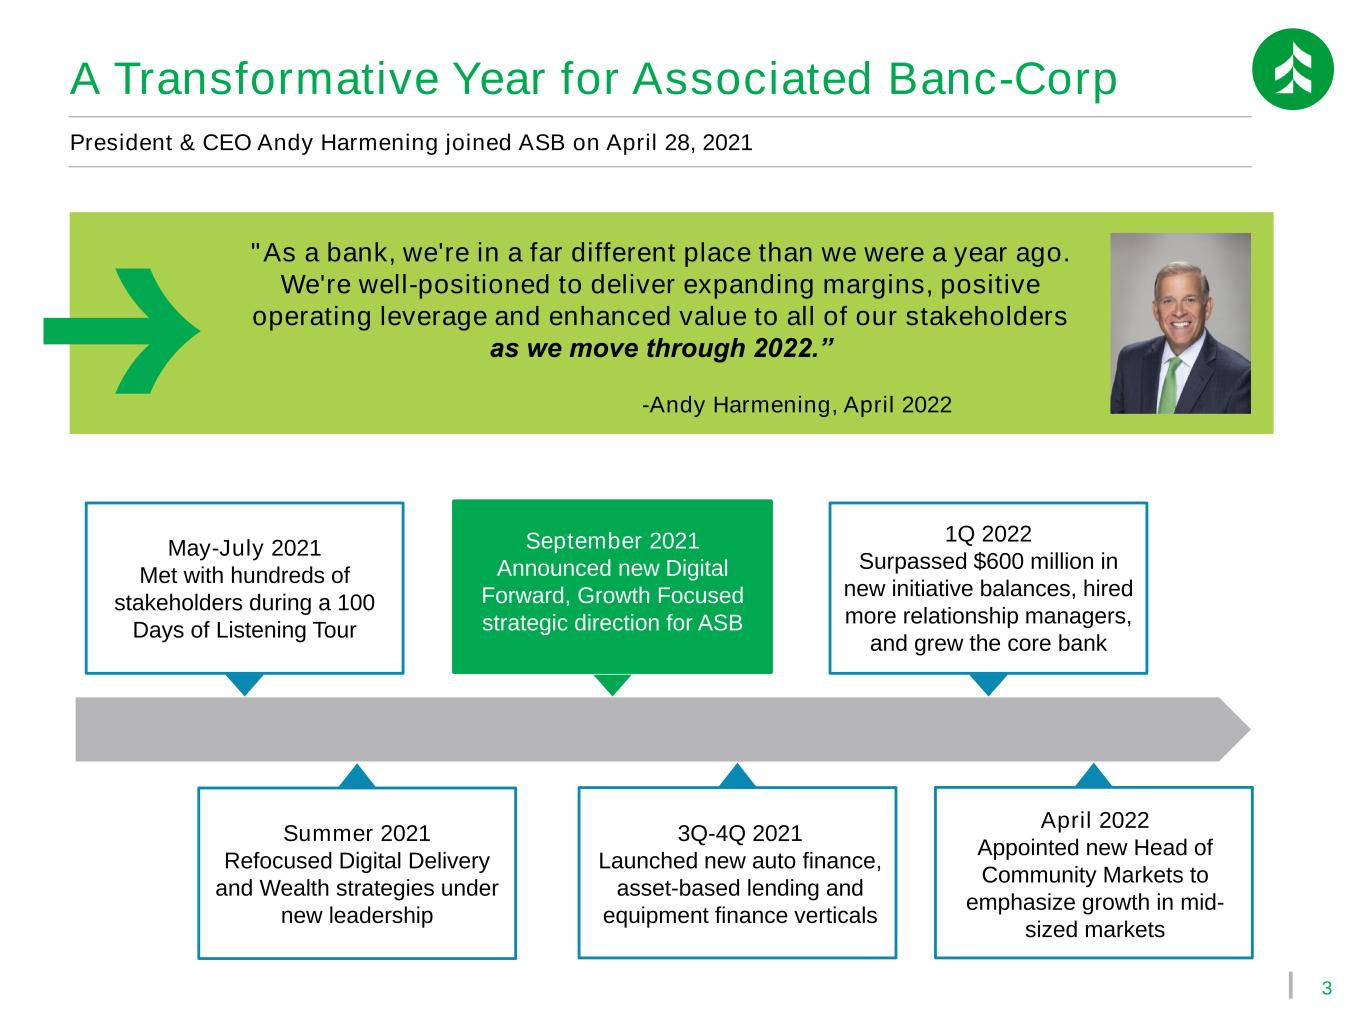
3 A Transformative Year for Associated Banc-Corp President & CEO Andy Harmening joined ASB on April 28, 2021 May-July 2021 Met with hundreds of stakeholders during a 100 Days of Listening Tour September 2021 Announced new Digital Forward, Growth Focused strategic direction for ASB 3Q-4Q 2021 Launched new auto finance, asset-based lending and equipment finance verticals Summer 2021 Refocused Digital Delivery and Wealth strategies under new leadership 1Q 2022 Surpassed $600 million in new initiative balances, hired more relationship managers, and grew the core bank April 2022 Appointed new Head of Community Markets to emphasize growth in mid- sized markets "As a bank, we're in a far different place than we were a year ago. We're well-positioned to deliver expanding margins, positive operating leverage and enhanced value to all of our stakeholders as we move through 2022.” -Andy Harmening, April 2022
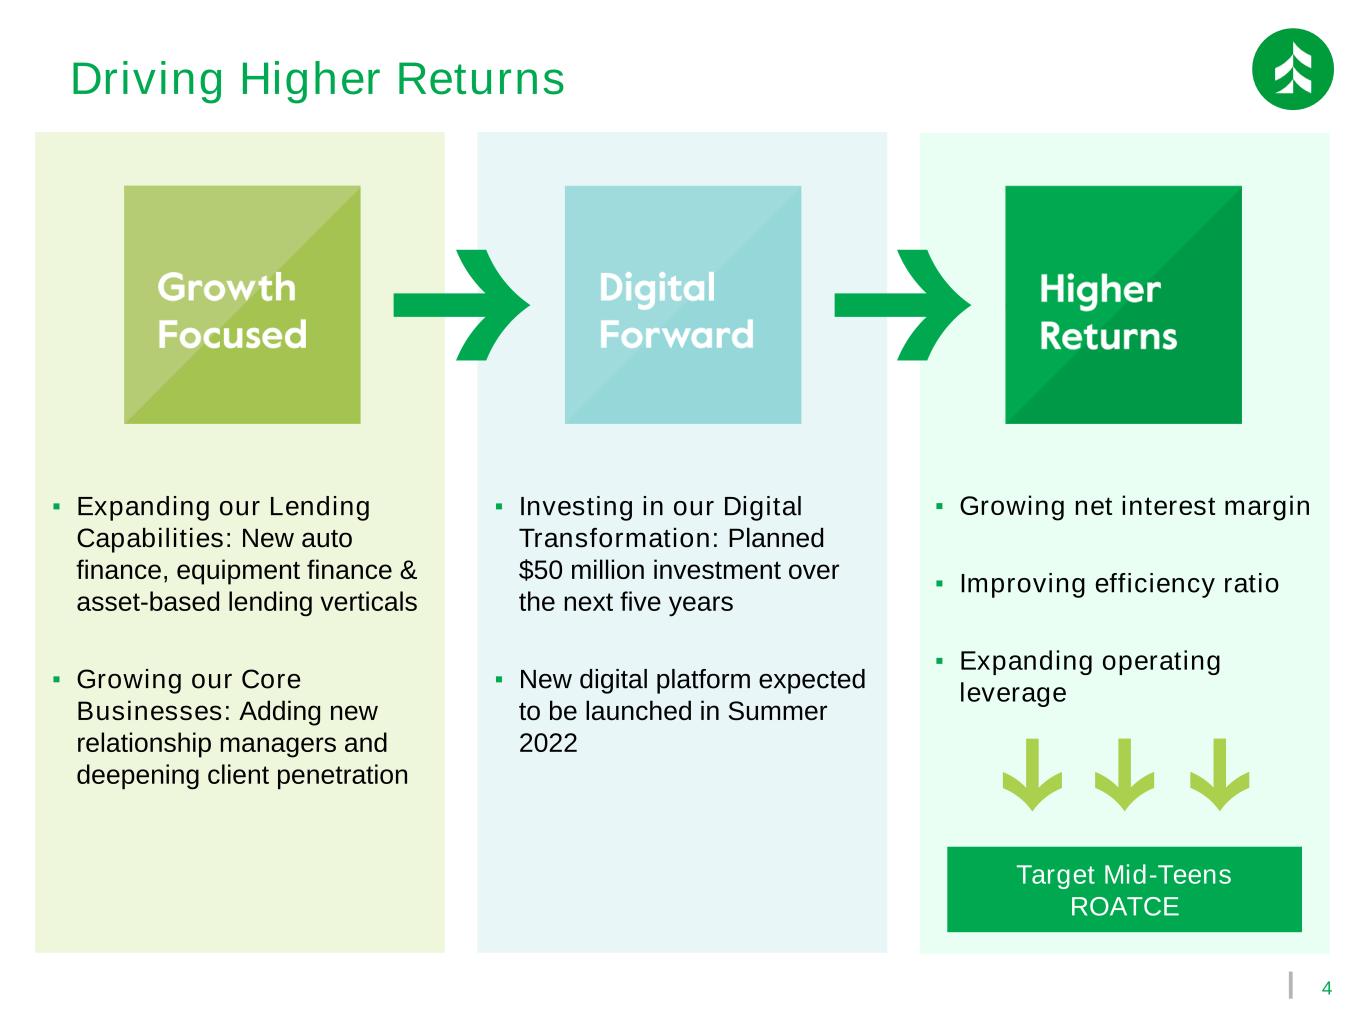
4 ▪ Expanding our Lending Capabilities: New auto finance, equipment finance & asset-based lending verticals ▪ Growing our Core Businesses: Adding new relationship managers and deepening client penetration ▪ Investing in our Digital Transformation: Planned $50 million investment over the next five years ▪ New digital platform expected to be launched in Summer 2022 ▪ Growing net interest margin ▪ Improving efficiency ratio ▪ Expanding operating leverage Driving Higher Returns Target Mid-Teens ROATCE
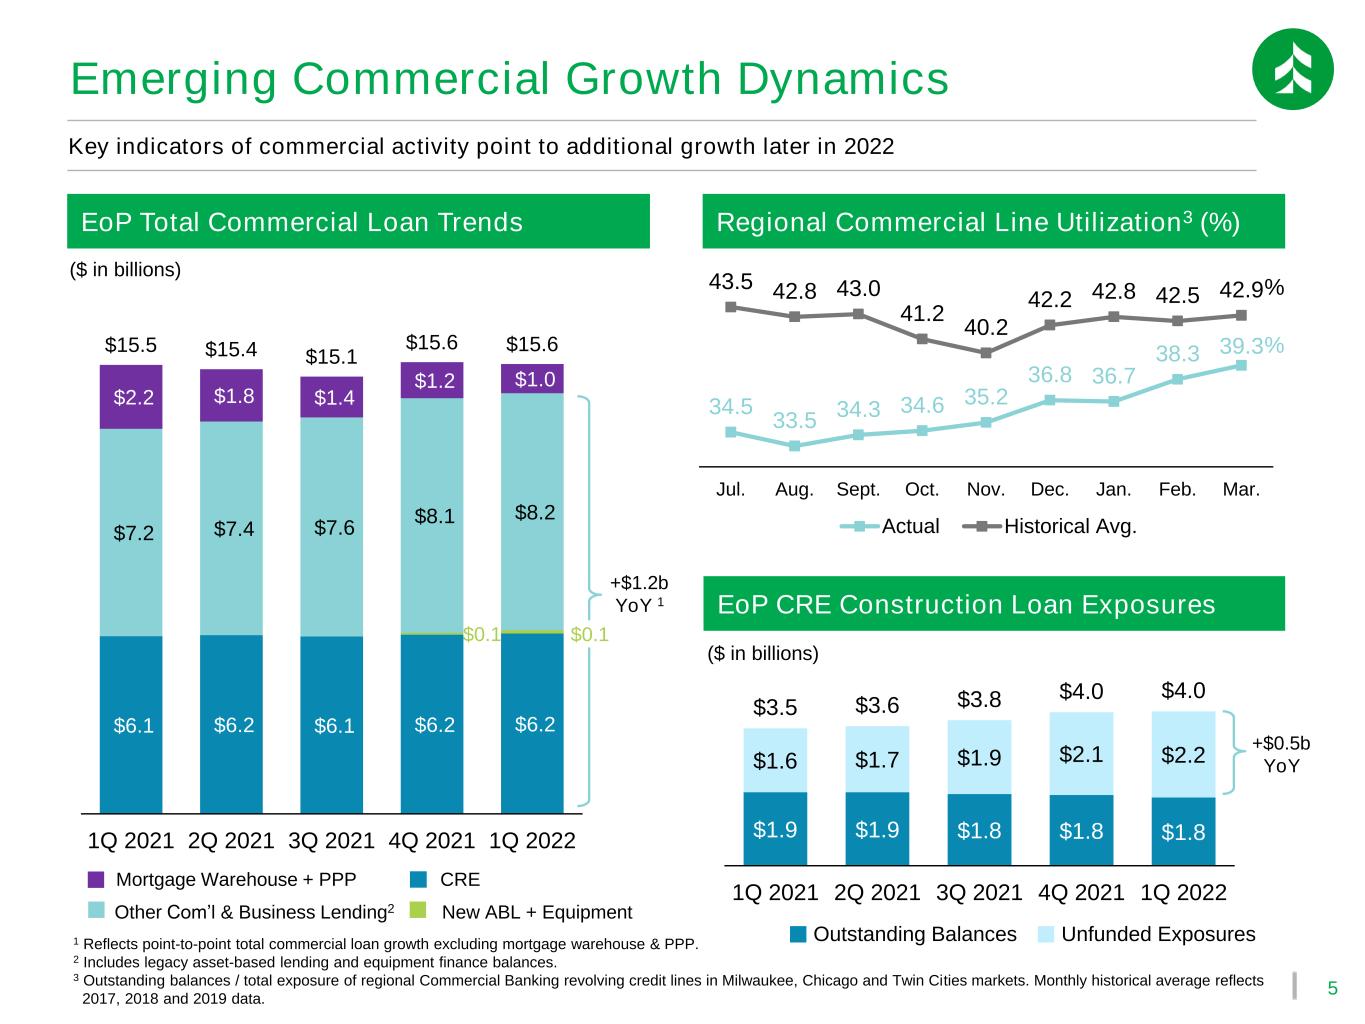
5 Mortgage Warehouse + PPP $1.9 $1.9 $1.8 $1.8 $1.8 $1.6 $1.7 $1.9 $2.1 $2.2 $3.5 $3.6 $3.8 $4.0 $4.0 1Q 2021 2Q 2021 3Q 2021 4Q 2021 1Q 2022 34.5 33.5 34.3 34.6 35.2 36.8 36.7 38.3 39.3 43.5 42.8 43.0 41.2 40.2 42.2 42.8 42.5 42.9 Jul. Aug. Sept. Oct. Nov. Dec. Jan. Feb. Mar. Actual Historical Avg. Emerging Commercial Growth Dynamics Key indicators of commercial activity point to additional growth later in 2022 Regional Commercial Line Utilization3 (%) 1 Reflects point-to-point total commercial loan growth excluding mortgage warehouse & PPP. 2 Includes legacy asset-based lending and equipment finance balances. 3 Outstanding balances / total exposure of regional Commercial Banking revolving credit lines in Milwaukee, Chicago and Twin Cities markets. Monthly historical average reflects 2017, 2018 and 2019 data. EoP CRE Construction Loan Exposures ($ in billions) % % Outstanding Balances Unfunded Exposures +$0.5b YoY EoP Total Commercial Loan Trends +$1.2b YoY 1 New ABL + Equipment CRE Other Com’l & Business Lending2 ($ in billions) $6.1 $6.2 $6.1 $6.2 $6.2 $0.1 $0.1 $7.2 $7.4 $7.6 $8.1 $8.2 $2.2 $1.8 $1.4 $1.2 $1.0 $15.5 $15.4 $15.1 $15.6 $15.6 1Q 2021 2Q 2021 3Q 2021 4Q 2021 1Q 2022
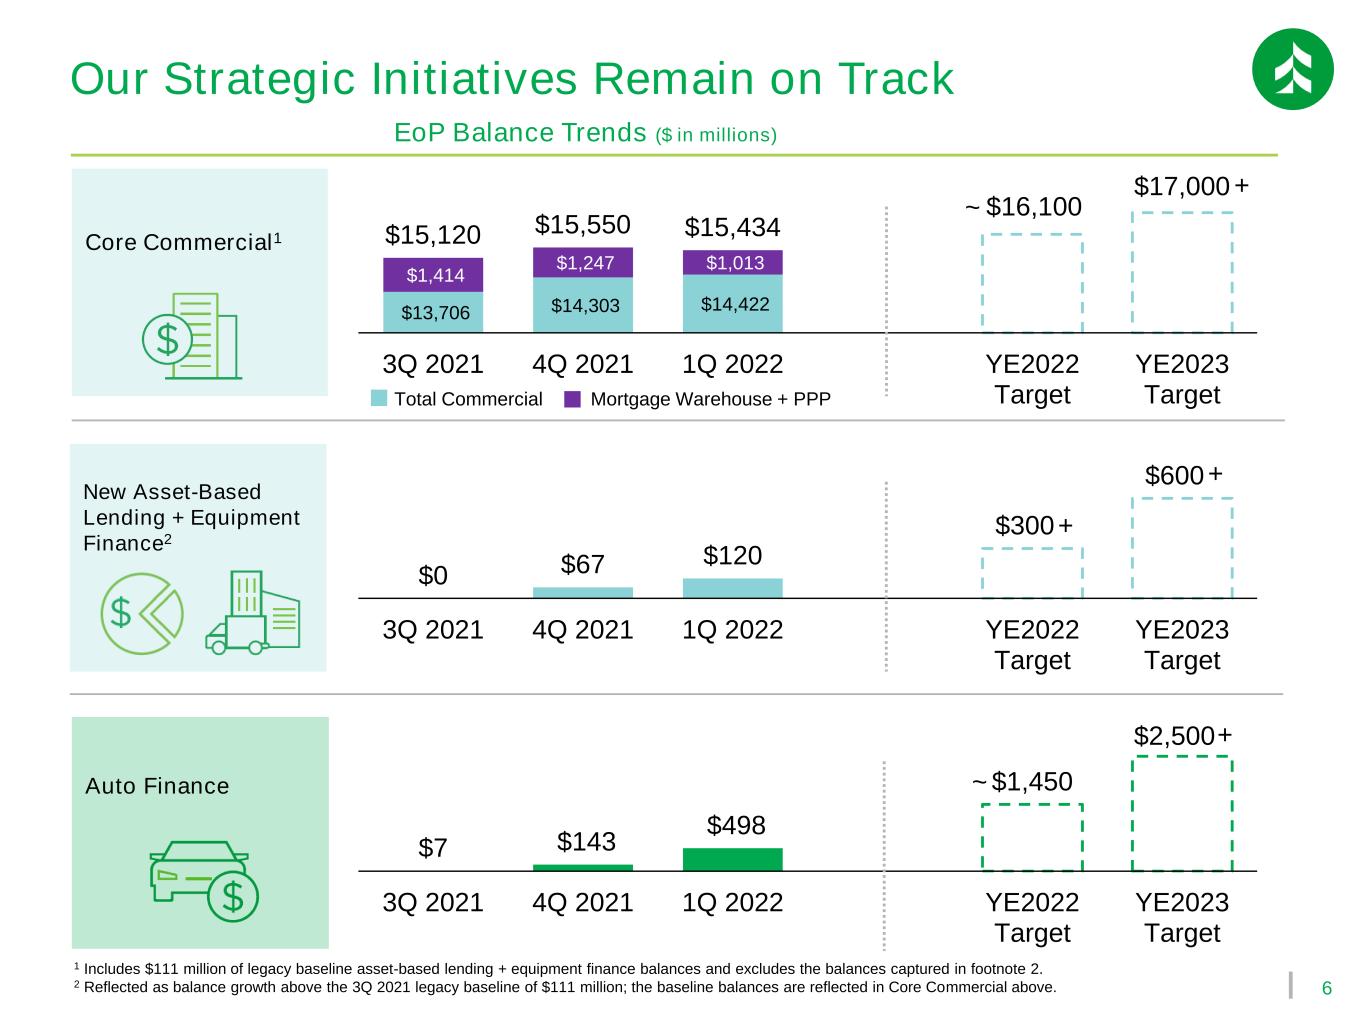
6 $13,706 $14,303 $14,422 $16,100 $17,000 $1,414 $1,247 $1,013 $15,120 $15,550 $15,434 3Q 2021 4Q 2021 1Q 2022 YE2022 Target YE2023 Target New Asset-Based Lending + Equipment Finance2 Core Commercial1 Auto Finance Our Strategic Initiatives Remain on Track $7 $143 $498 $1,450 $2,500 3Q 2021 4Q 2021 1Q 2022 YE2022 Target YE2023 Target $0 $67 $120 $300 $600 3Q 2021 4Q 2021 1Q 2022 YE2022 Target YE2023 Target EoP Balance Trends ($ in millions) Mortgage Warehouse + PPPTotal Commercial 1 Includes $111 million of legacy baseline asset-based lending + equipment finance balances and excludes the balances captured in footnote 2. 2 Reflected as balance growth above the 3Q 2021 legacy baseline of $111 million; the baseline balances are reflected in Core Commercial above. + + ~ ~ + +
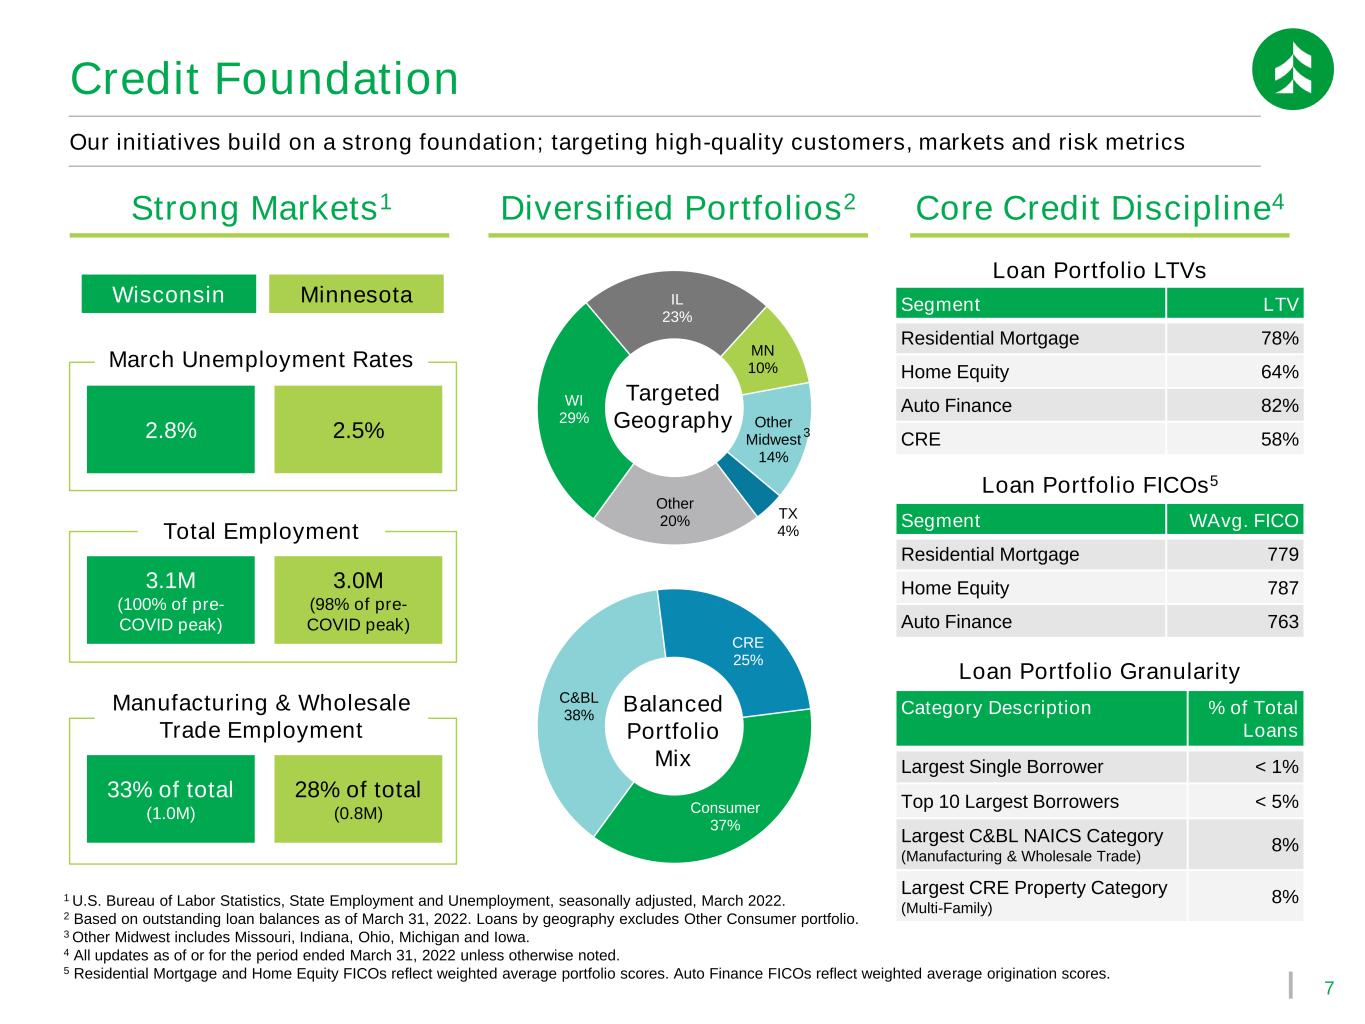
7 Credit Foundation Strong Markets1 Core Credit Discipline4Diversified Portfolios2 1 U.S. Bureau of Labor Statistics, State Employment and Unemployment, seasonally adjusted, March 2022. 2 Based on outstanding loan balances as of March 31, 2022. Loans by geography excludes Other Consumer portfolio. 3 Other Midwest includes Missouri, Indiana, Ohio, Michigan and Iowa. 4 All updates as of or for the period ended March 31, 2022 unless otherwise noted. 5 Residential Mortgage and Home Equity FICOs reflect weighted average portfolio scores. Auto Finance FICOs reflect weighted average origination scores. WI 29% IL 23% MN 10% Other Midwest 14% TX 4% Other 20% Targeted Geography C&BL 38% CRE 25% Consumer 37% Balanced Portfolio Mix 2.8% 2.5% Segment LTV Residential Mortgage 78% Home Equity 64% Auto Finance 82% CRE 58% Segment WAvg. FICO Residential Mortgage 779 Home Equity 787 Auto Finance 763 Our initiatives build on a strong foundation; targeting high-quality customers, markets and risk metrics 3.1M (100% of pre- COVID peak) 3.0M (98% of pre- COVID peak) 33% of total (1.0M) 28% of total (0.8M) Loan Portfolio FICOs5 Loan Portfolio LTVs Wisconsin Minnesota March Unemployment Rates Total Employment Manufacturing & Wholesale Trade Employment Category Description % of Total Loans Largest Single Borrower < 1% Top 10 Largest Borrowers < 5% Largest C&BL NAICS Category (Manufacturing & Wholesale Trade) 8% Largest CRE Property Category (Multi-Family) 8% Loan Portfolio Granularity 3
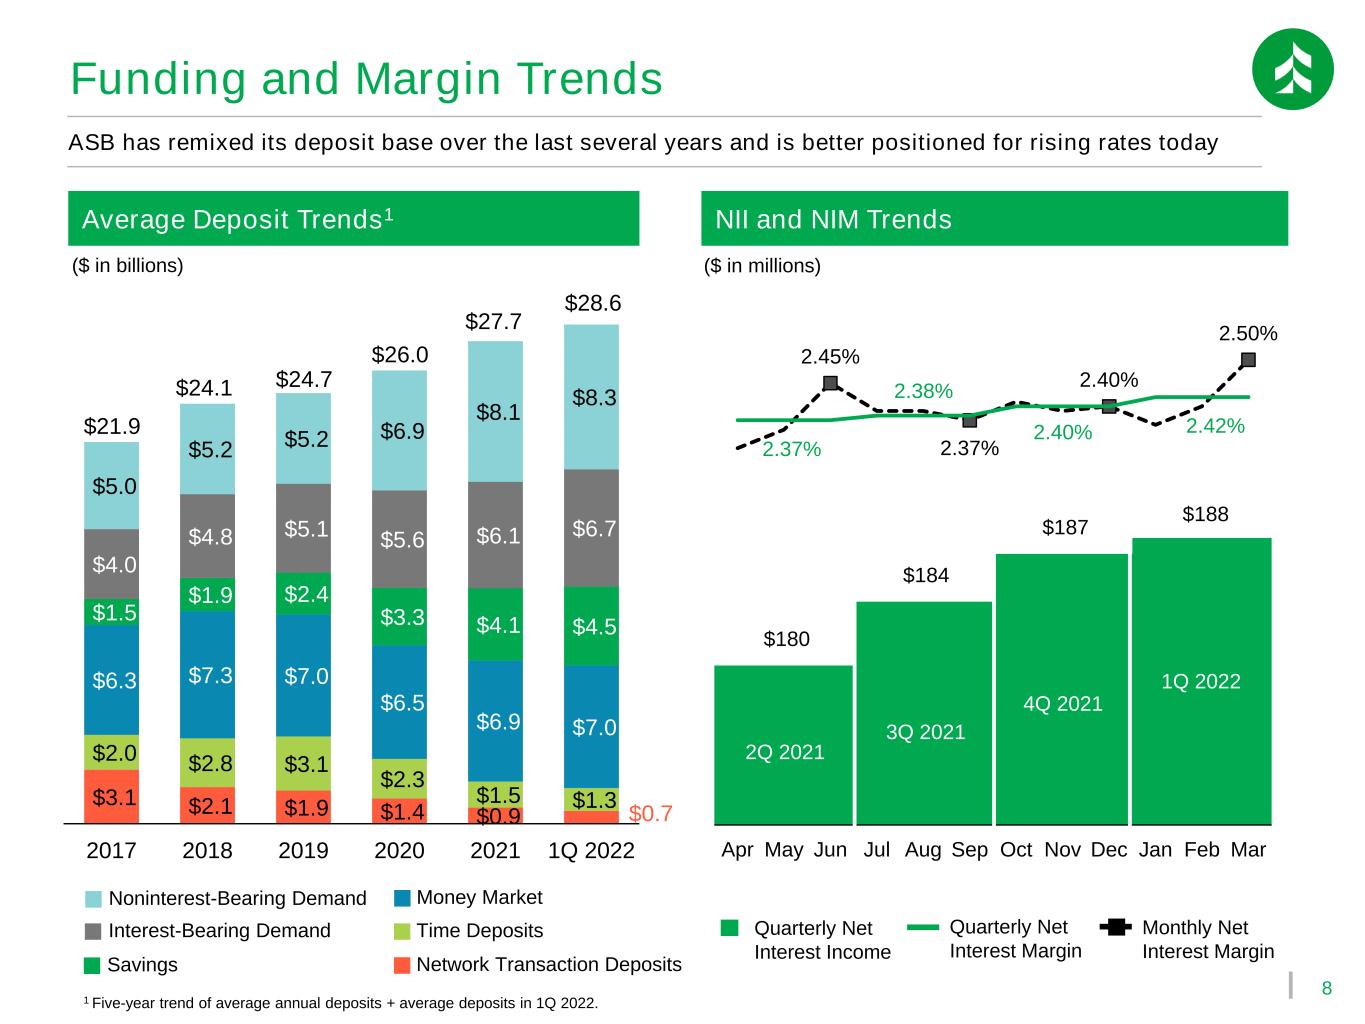
8 Funding and Margin Trends $3.1 $2.1 $1.9 $1.4 $0.9 $2.0 $2.8 $3.1 $2.3 $1.5 $1.3 $6.3 $7.3 $7.0 $6.5 $6.9 $7.0 $1.5 $1.9 $2.4 $3.3 $4.1 $4.5 $4.0 $4.8 $5.1 $5.6 $6.1 $6.7 $5.0 $5.2 $5.2 $6.9 $8.1 $8.3 $21.9 $24.1 $24.7 $26.0 $27.7 $28.6 2017 2018 2019 2020 2021 1Q 2022 ($ in billions) Average Deposit Trends1 Time Deposits Savings Money Market Network Transaction Deposits Noninterest-Bearing Demand Interest-Bearing Demand ASB has remixed its deposit base over the last several years and is better positioned for rising rates today $180 $184 $187 $188 2.45% 2.37% 2.40% 2.50% 2.37% 2.38% 2.40% 2.42% Apr May Jun Jul Aug Sep Oct Nov Dec Jan Feb Mar NII and NIM Trends ($ in millions) Quarterly Net Interest Income Quarterly Net Interest Margin 2Q 2021 3Q 2021 4Q 2021 1Q 2022 Monthly Net Interest Margin 1 Five-year trend of average annual deposits + average deposits in 1Q 2022. $0.7
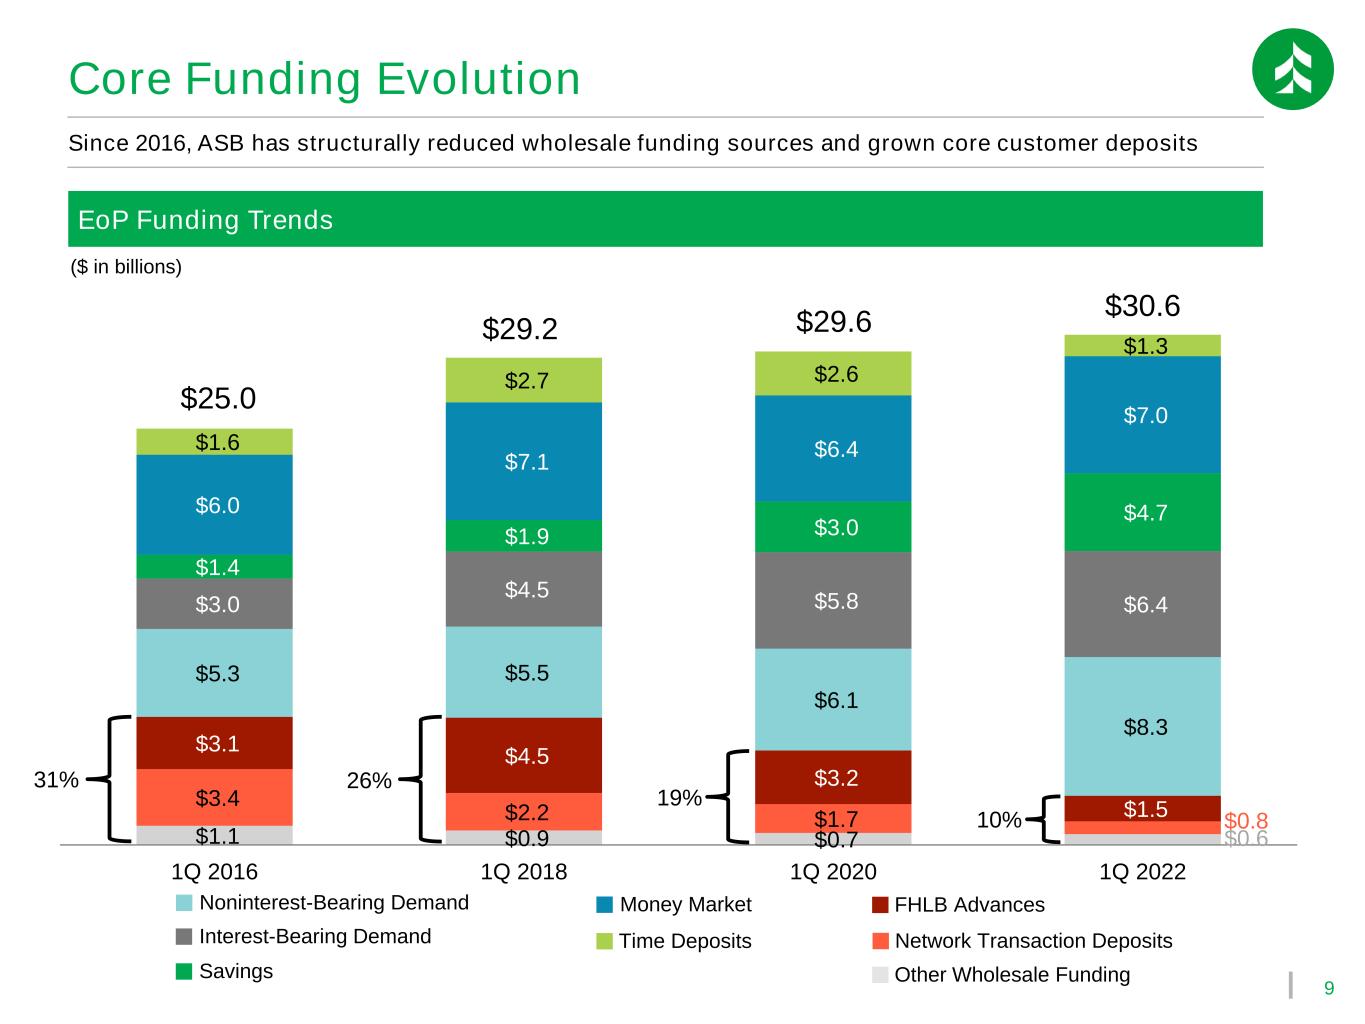
9 Core Funding Evolution $1.1 $0.9 $0.7 $0.6 $3.4 $2.2 $1.7 $0.8 $3.1 $4.5 $3.2 $1.5 $5.3 $5.5 $6.1 $8.3 $3.0 $4.5 $5.8 $6.4 $1.4 $1.9 $3.0 $4.7 $6.0 $7.1 $6.4 $7.0 $1.6 $2.7 $2.6 $1.3 1Q 2016 1Q 2018 1Q 2020 1Q 2022 31% 26% 19% 10% $25.0 $30.6 $29.2 $29.6 Since 2016, ASB has structurally reduced wholesale funding sources and grown core customer deposits Time Deposits Savings Money Market Network Transaction Deposits Noninterest-Bearing Demand Interest-Bearing Demand FHLB Advances Other Wholesale Funding ($ in billions) EoP Funding Trends
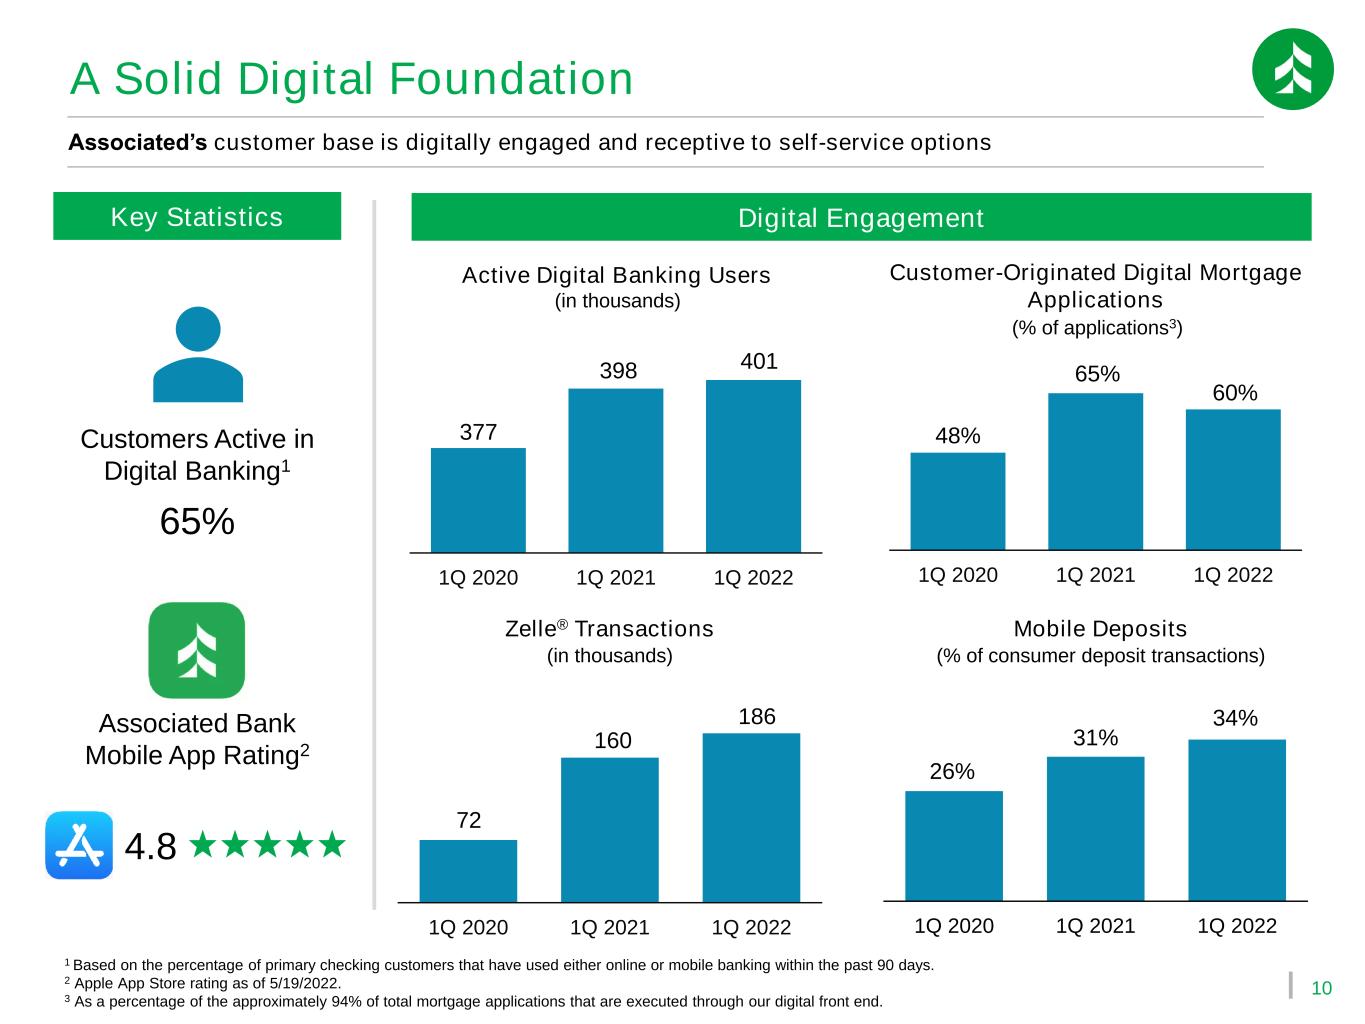
10 377 398 401 1Q 2020 1Q 2021 1Q 2022 Customer-Originated Digital Mortgage Applications 26% 31% 34% 1Q 2020 1Q 2021 1Q 2022 A Solid Digital Foundation Digital Engagement Associated’s customer base is digitally engaged and receptive to self-service options Active Digital Banking Users (in thousands) Mobile Deposits 72 160 186 1Q 2020 1Q 2021 1Q 2022 Zelle® Transactions (in thousands) Key Statistics Customers Active in Digital Banking1 65% Associated Bank Mobile App Rating2 4.8 1 Based on the percentage of primary checking customers that have used either online or mobile banking within the past 90 days. 2 Apple App Store rating as of 5/19/2022. 3 As a percentage of the approximately 94% of total mortgage applications that are executed through our digital front end. (% of consumer deposit transactions) 48% 65% 60% 1Q 2020 1Q 2021 1Q 2022 (% of applications3)
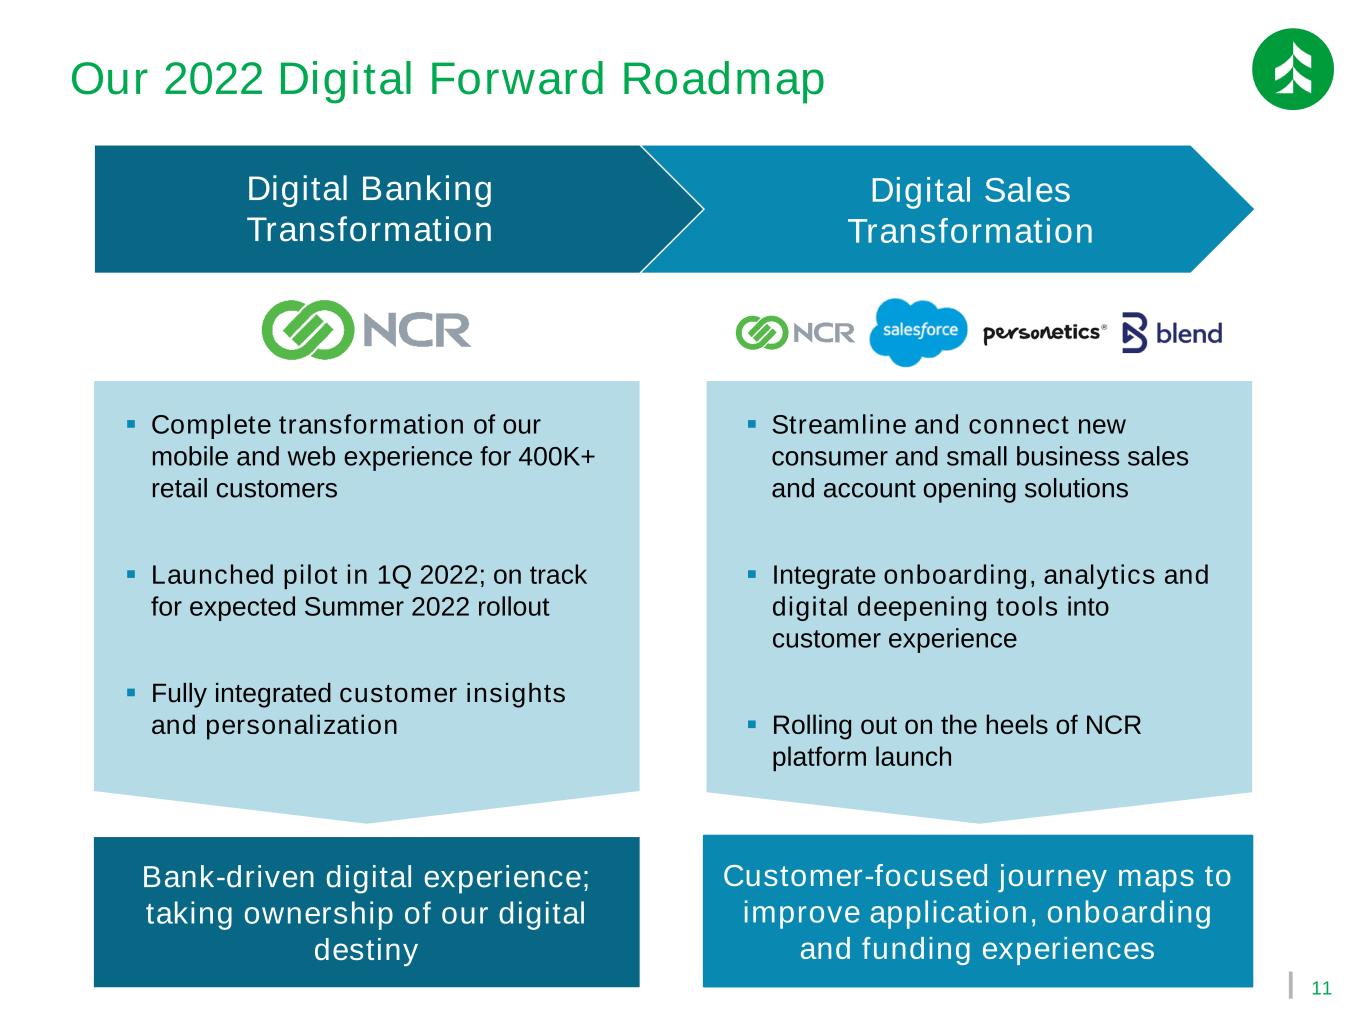
11 Our 2022 Digital Forward Roadmap ▪ Complete transformation of our mobile and web experience for 400K+ retail customers ▪ Launched pilot in 1Q 2022; on track for expected Summer 2022 rollout ▪ Fully integrated customer insights and personalization ▪ Streamline and connect new consumer and small business sales and account opening solutions ▪ Integrate onboarding, analytics and digital deepening tools into customer experience ▪ Rolling out on the heels of NCR platform launch Digital Banking Transformation Digital Sales Transformation Customer-focused journey maps to improve application, onboarding and funding experiences Bank-driven digital experience; taking ownership of our digital destiny
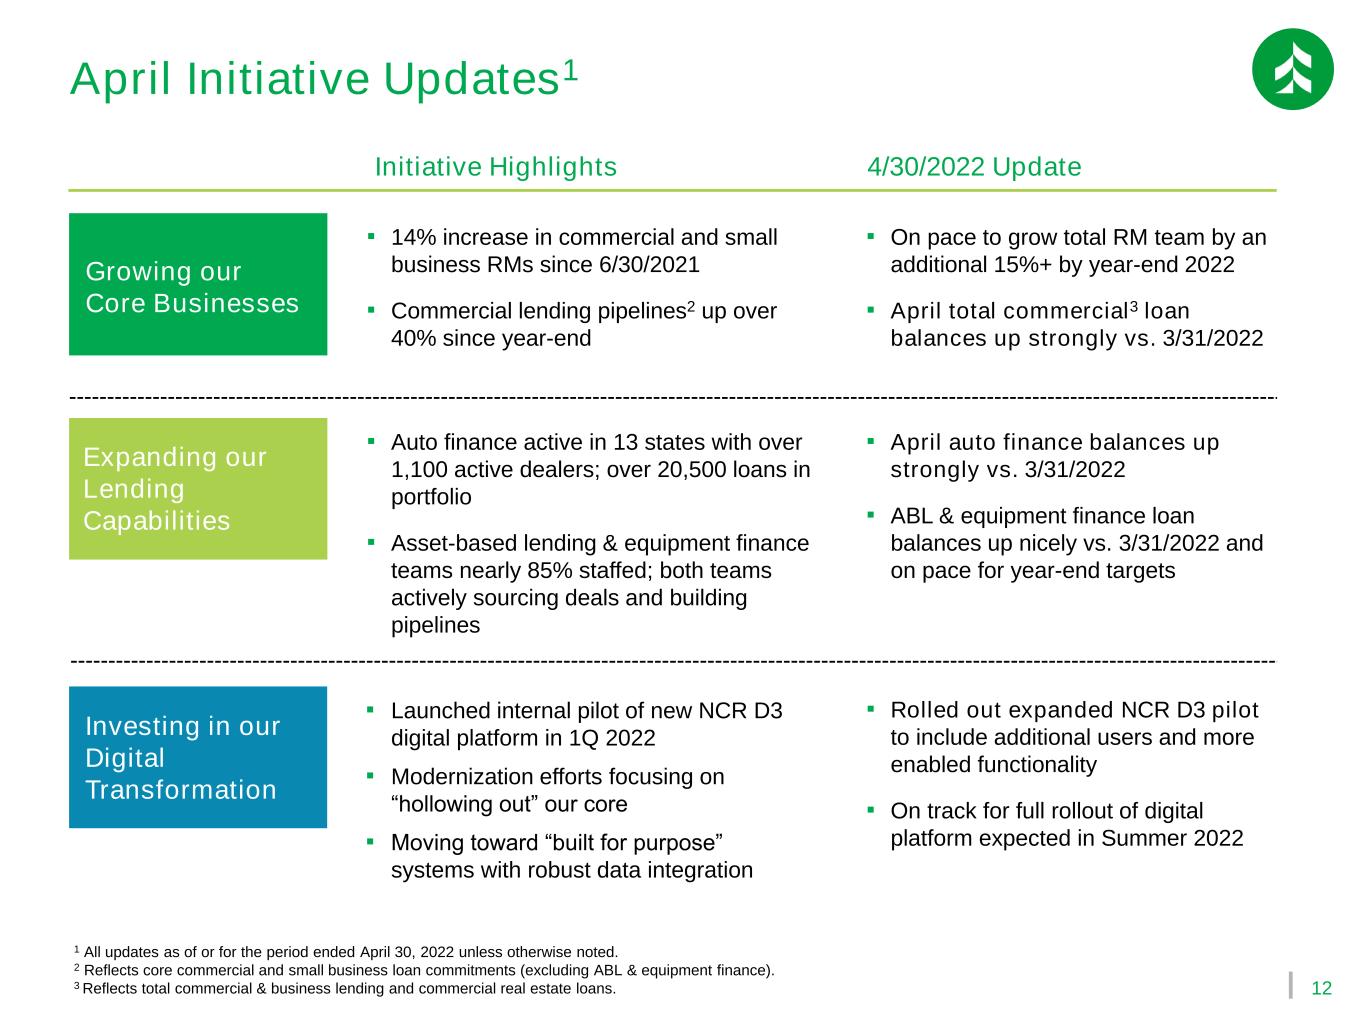
12 April Initiative Updates1 Expanding our Lending Capabilities Growing our Core Businesses Investing in our Digital Transformation Initiative Highlights 4/30/2022 Update ▪ Launched internal pilot of new NCR D3 digital platform in 1Q 2022 ▪ Modernization efforts focusing on “hollowing out” our core ▪ Moving toward “built for purpose” systems with robust data integration ▪ 14% increase in commercial and small business RMs since 6/30/2021 ▪ Commercial lending pipelines2 up over 40% since year-end ▪ Rolled out expanded NCR D3 pilot to include additional users and more enabled functionality ▪ On track for full rollout of digital platform expected in Summer 2022 ▪ On pace to grow total RM team by an additional 15%+ by year-end 2022 ▪ April total commercial3 loan balances up strongly vs. 3/31/2022 ▪ Auto finance active in 13 states with over 1,100 active dealers; over 20,500 loans in portfolio ▪ Asset-based lending & equipment finance teams nearly 85% staffed; both teams actively sourcing deals and building pipelines ▪ April auto finance balances up strongly vs. 3/31/2022 ▪ ABL & equipment finance loan balances up nicely vs. 3/31/2022 and on pace for year-end targets 1 All updates as of or for the period ended April 30, 2022 unless otherwise noted. 2 Reflects core commercial and small business loan commitments (excluding ABL & equipment finance). 3 Reflects total commercial & business lending and commercial real estate loans.
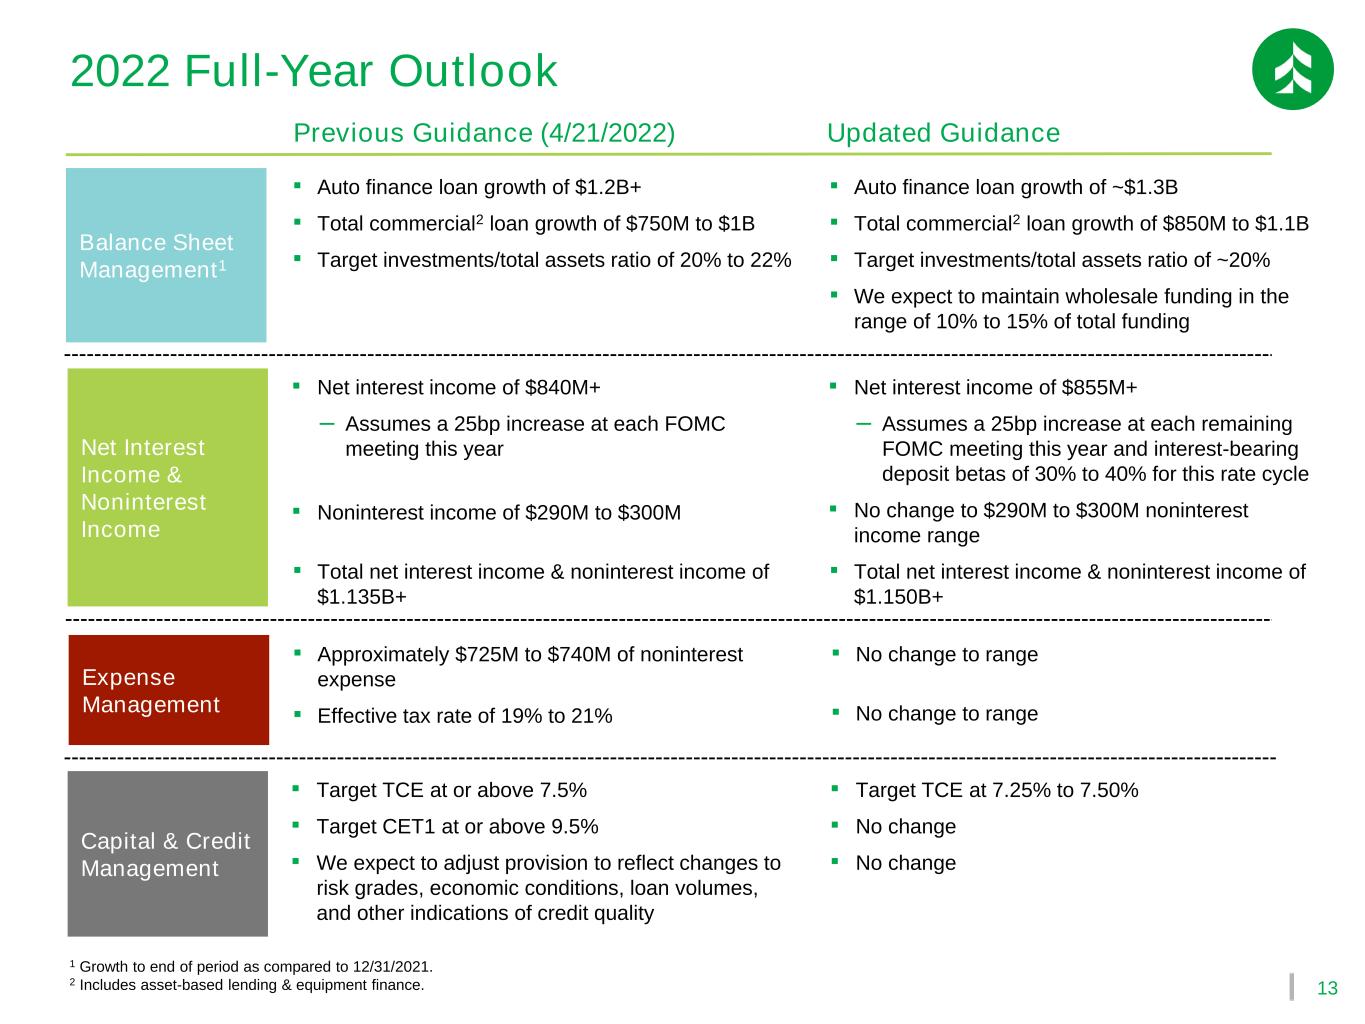
13 Balance Sheet Management1 ▪ Auto finance loan growth of ~$1.3B ▪ Total commercial2 loan growth of $850M to $1.1B ▪ Target investments/total assets ratio of ~20% ▪ We expect to maintain wholesale funding in the range of 10% to 15% of total funding Net Interest Income & Noninterest Income ▪ Net interest income of $855M+ ‒ Assumes a 25bp increase at each remaining FOMC meeting this year and interest-bearing deposit betas of 30% to 40% for this rate cycle ▪ No change to $290M to $300M noninterest income range ▪ Total net interest income & noninterest income of $1.150B+ Expense Management ▪ No change to range ▪ No change to range Capital & Credit Management ▪ Target TCE at 7.25% to 7.50% ▪ No change ▪ No change Updated Guidance 1 Growth to end of period as compared to 12/31/2021. 2 Includes asset-based lending & equipment finance. Previous Guidance (4/21/2022) ▪ Auto finance loan growth of $1.2B+ ▪ Total commercial2 loan growth of $750M to $1B ▪ Target investments/total assets ratio of 20% to 22% ▪ Net interest income of $840M+ ‒ Assumes a 25bp increase at each FOMC meeting this year ▪ Noninterest income of $290M to $300M ▪ Total net interest income & noninterest income of $1.135B+ ▪ Approximately $725M to $740M of noninterest expense ▪ Effective tax rate of 19% to 21% ▪ Target TCE at or above 7.5% ▪ Target CET1 at or above 9.5% ▪ We expect to adjust provision to reflect changes to risk grades, economic conditions, loan volumes, and other indications of credit quality 2022 Full-Year Outlook

Appendix
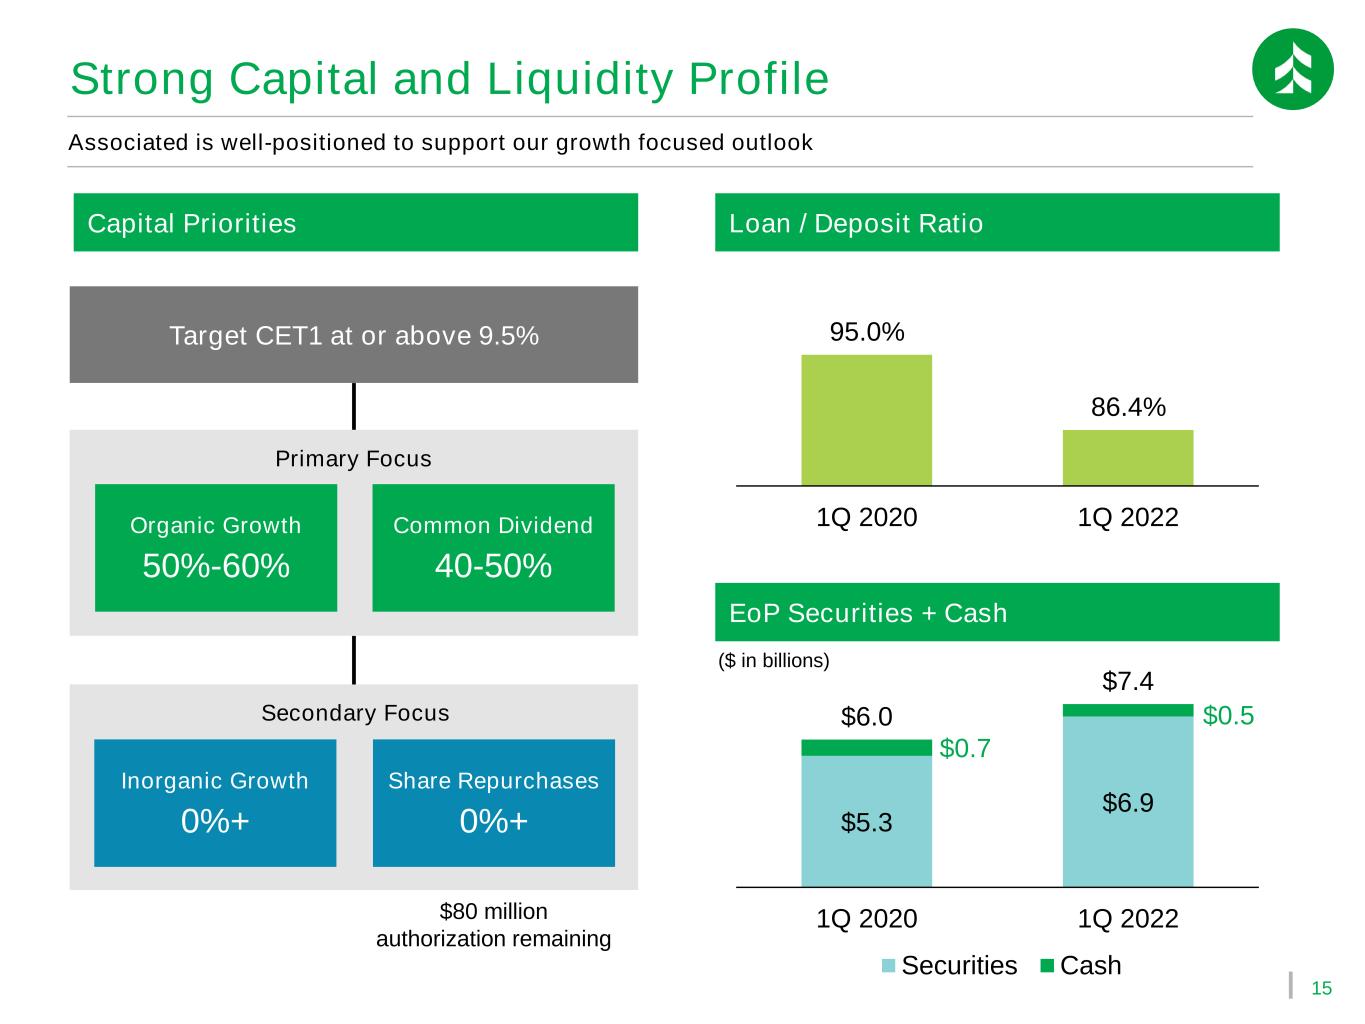
15 Loan / Deposit Ratio 95.0% 86.4% 1Q 2020 1Q 2022 $5.3 $6.9 $0.7 $0.5$6.0 $7.4 1Q 2020 1Q 2022 Securities Cash ($ in billions) Strong Capital and Liquidity Profile Capital Priorities EoP Securities + Cash Target CET1 at or above 9.5% Common Dividend 40-50% Organic Growth 50%-60% Inorganic Growth 0%+ Share Repurchases 0%+ Primary Focus Secondary Focus $80 million authorization remaining Associated is well-positioned to support our growth focused outlook
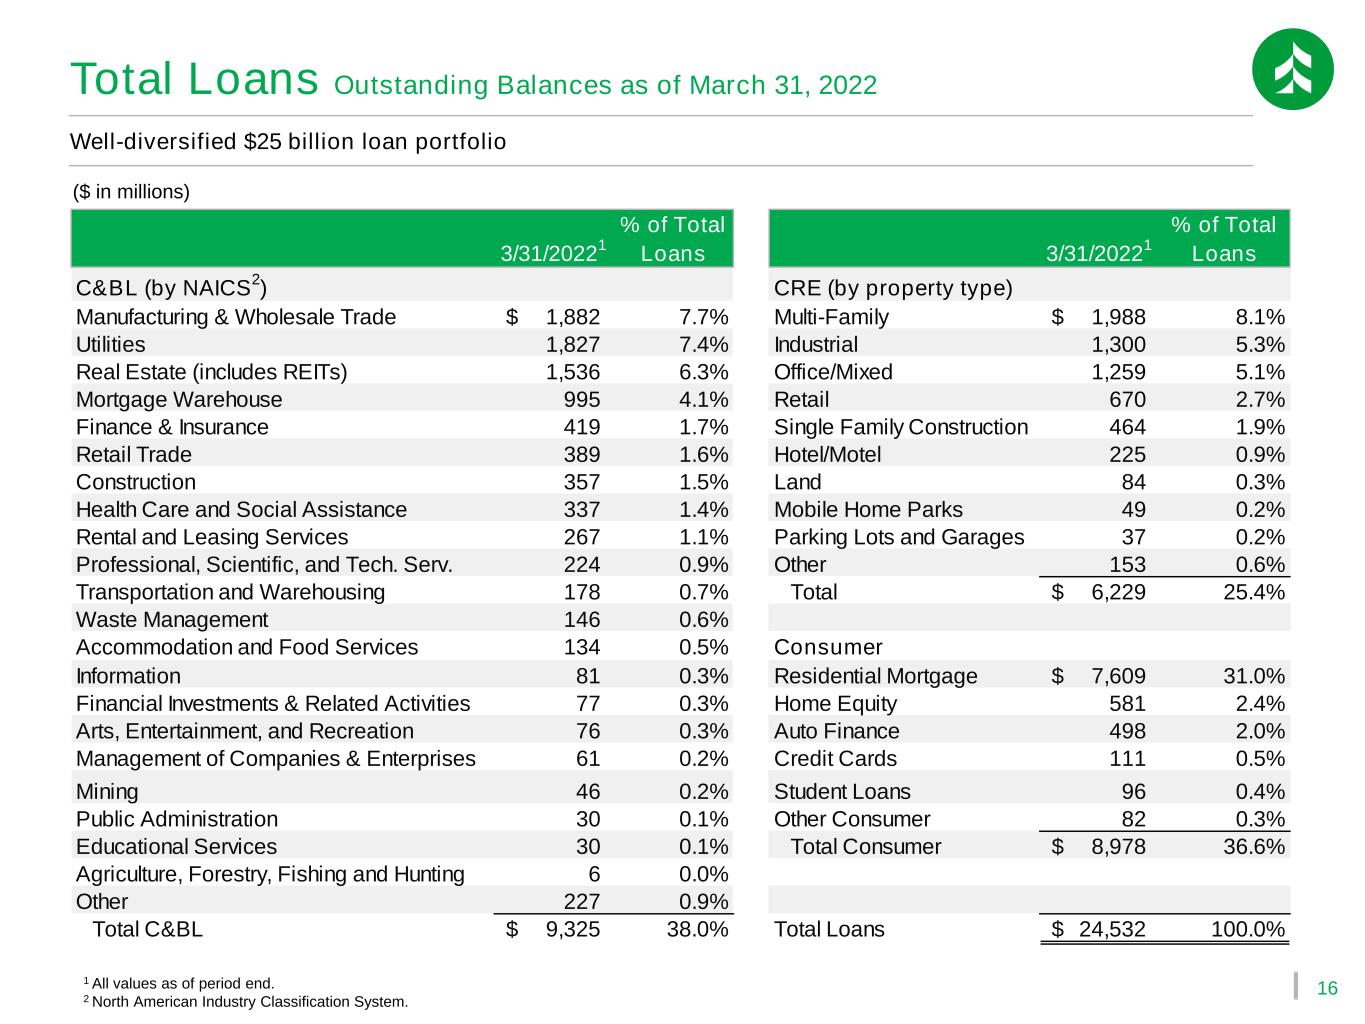
16 Total Loans Outstanding Balances as of March 31, 2022 Well-diversified $25 billion loan portfolio ($ in millions) 1 All values as of period end. 2 North American Industry Classification System. 3/31/2022 1 % of Total Loans 3/31/2022 1 % of Total Loans C&BL (by NAICS 2 ) CRE (by property type) Manufacturing & Wholesale Trade 1,882$ 7.7% Multi-Family 1,988$ 8.1% Utilities 1,827 7.4% Industrial 1,300 5.3% Real Estate (includes REITs) 1,536 6.3% Office/Mixed 1,259 5.1% Mortgage Warehouse 995 4.1% Retail 670 2.7% Finance & Insurance 419 1.7% Single Family Construction 464 1.9% Retail Trade 389 1.6% Hotel/Motel 225 0.9% Construction 357 1.5% Land 84 0.3% Health Care and Social Assistance 337 1.4% Mobile Home Parks 49 0.2% Rental and Leasing Services 267 1.1% Parking Lots and Garages 37 0.2% Professional, Scientific, and Tech. Serv. 224 0.9% Other 153 0.6% Transportation and Warehousing 178 0.7% Total 6,229$ 25.4% Waste Management 146 0.6% Accommodation and Food Services 134 0.5% Consumer Information 81 0.3% Residential Mortgage 7,609$ 31.0% Financial Investments & Related Activities 77 0.3% Home Equity 581 2.4% Arts, Entertainment, and Recreation 76 0.3% Auto Finance 498 2.0% Management of Companies & Enterprises 61 0.2% Credit Cards 111 0.5% Mining 46 0.2% Student Loans 96 0.4% Public Administration 30 0.1% Other Consumer 82 0.3% Educational Services 30 0.1% Total Consumer 8,978$ 36.6% Agriculture, Forestry, Fishing and Hunting 6 0.0% Other 227 0.9% Total C&BL 9,325$ 38.0% Total Loans 24,532$ 100.0%
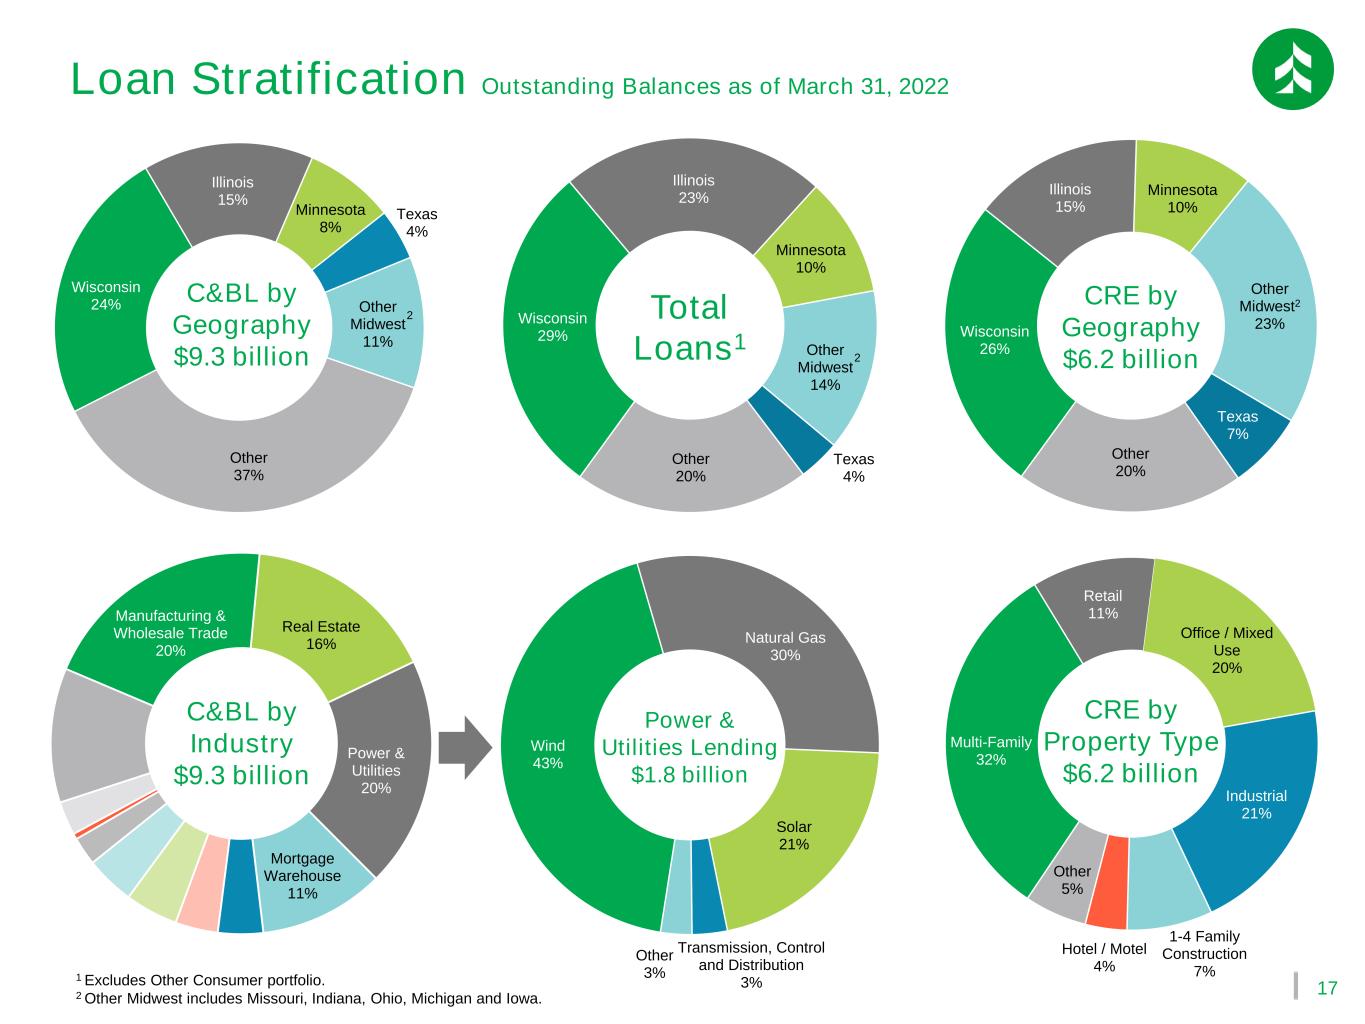
17 Wisconsin 29% Illinois 23% Minnesota 10% Other Midwest 14% Texas 4% Other 20% Manufacturing & Wholesale Trade 20% Real Estate 16% Power & Utilities 20% Mortgage Warehouse 11% 1 Excludes Other Consumer portfolio. 2 Other Midwest includes Missouri, Indiana, Ohio, Michigan and Iowa. Wind 43% Natural Gas 30% Solar 21% Transmission, Control and Distribution 3% Other 3% Wisconsin 24% Illinois 15% Minnesota 8% Texas 4% Other Midwest 11% Other 37% Wisconsin 26% Illinois 15% Minnesota 10% Other Midwest2 23% Texas 7% Other 20% 2 2 Loan Stratification Outstanding Balances as of March 31, 2022 C&BL by Geography $9.3 billion Power & Utilities Lending $1.8 billion C&BL by Industry $9.3 billion Total Loans1 CRE by Geography $6.2 billion Multi-Family 32% Retail 11% Office / Mixed Use 20% Industrial 21% 1-4 Family Construction 7% Hotel / Motel 4% Other 5% CRE by Property Type $6.2 billion

18 2021-2023 Community Commitment Plan Associated is working to address economic development and equity issues in each of our markets $3.37 billion Three-year commitment To support minority communities, low-to-moderate income (LMI) communities and small businesses in our three-state branch footprint of Wisconsin, Illinois and Minnesota. $2.4 billion in residential mortgages and $15 million in down payment assistance. $8 million in Community Reinvestment Act-qualified grants and/or in-kind donations. 14,000 hours of Community Reinvestment Act-qualified volunteer time. $350 million in loans to support small businesses. $600 million in community development loans and investments to support affordable housing development and small business growth. Continued collaboration with community advisors to address the needs of underserved markets.
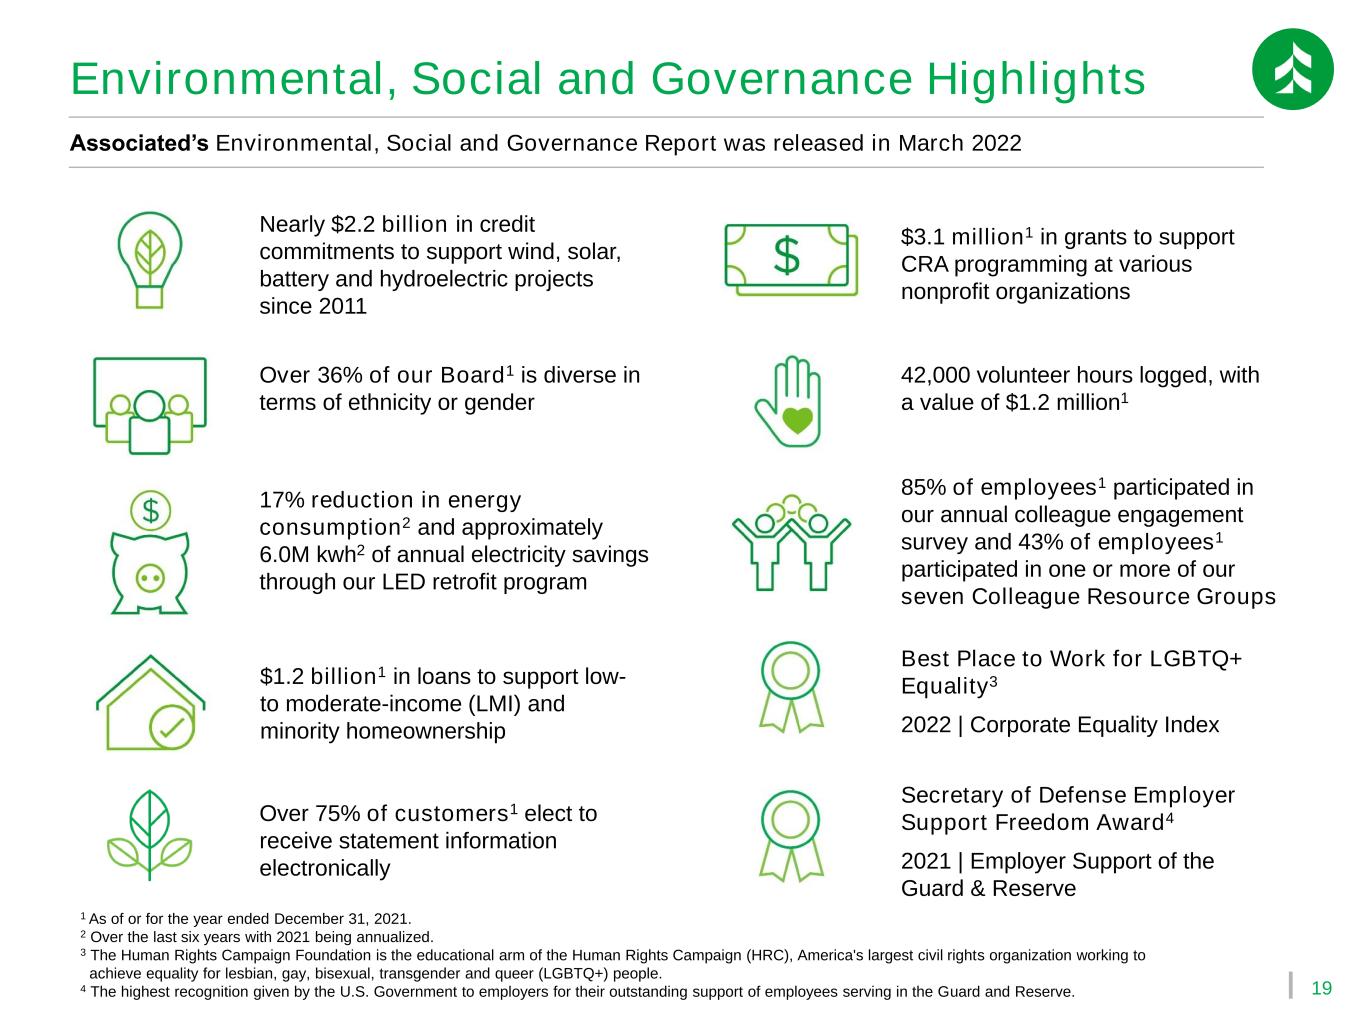
19 Environmental, Social and Governance Highlights Associated’s Environmental, Social and Governance Report was released in March 2022 Nearly $2.2 billion in credit commitments to support wind, solar, battery and hydroelectric projects since 2011 Over 36% of our Board1 is diverse in terms of ethnicity or gender 17% reduction in energy consumption2 and approximately 6.0M kwh2 of annual electricity savings through our LED retrofit program 85% of employees1 participated in our annual colleague engagement survey and 43% of employees1 participated in one or more of our seven Colleague Resource Groups $3.1 million1 in grants to support CRA programming at various nonprofit organizations 1 As of or for the year ended December 31, 2021. 2 Over the last six years with 2021 being annualized. 3 The Human Rights Campaign Foundation is the educational arm of the Human Rights Campaign (HRC), America's largest civil rights organization working to achieve equality for lesbian, gay, bisexual, transgender and queer (LGBTQ+) people. 4 The highest recognition given by the U.S. Government to employers for their outstanding support of employees serving in the Guard and Reserve. 42,000 volunteer hours logged, with a value of $1.2 million1 $1.2 billion1 in loans to support low- to moderate-income (LMI) and minority homeownership Best Place to Work for LGBTQ+ Equality3 2022 | Corporate Equality Index Secretary of Defense Employer Support Freedom Award4 2021 | Employer Support of the Guard & Reserve Over 75% of customers1 elect to receive statement information electronically
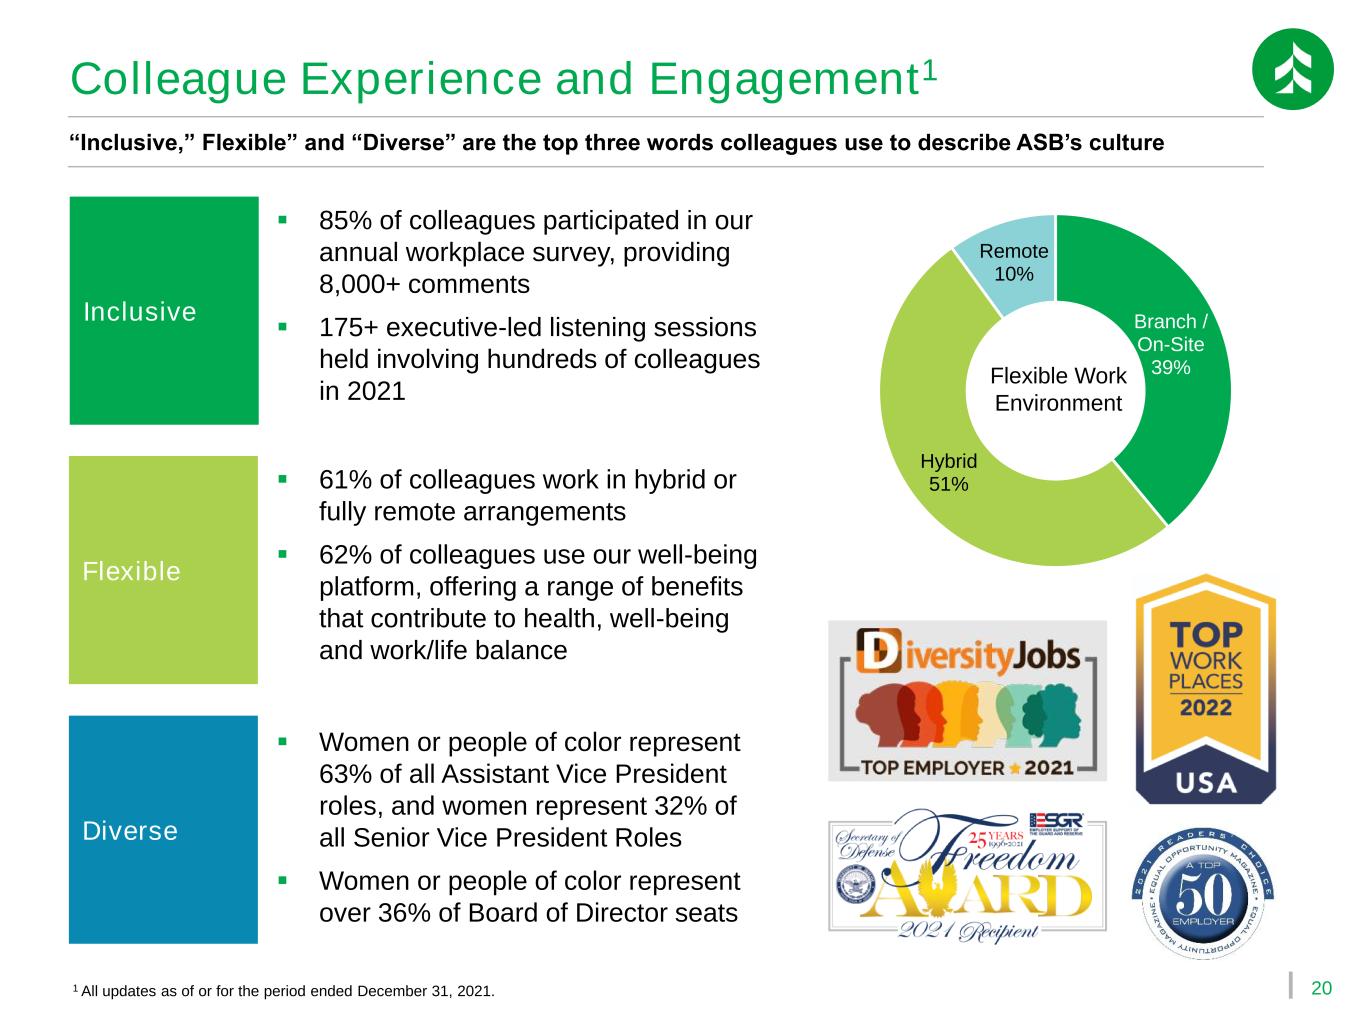
20 Colleague Experience and Engagement1 “Inclusive,” Flexible” and “Diverse” are the top three words colleagues use to describe ASB’s culture 1 All updates as of or for the period ended December 31, 2021. Branch / On-Site 39% Hybrid 51% Remote 10% Flexible Work Environment ▪ 85% of colleagues participated in our annual workplace survey, providing 8,000+ comments ▪ 175+ executive-led listening sessions held involving hundreds of colleagues in 2021 Inclusive Diverse Flexible ▪ 61% of colleagues work in hybrid or fully remote arrangements ▪ 62% of colleagues use our well-being platform, offering a range of benefits that contribute to health, well-being and work/life balance ▪ Women or people of color represent 63% of all Assistant Vice President roles, and women represent 32% of all Senior Vice President Roles ▪ Women or people of color represent over 36% of Board of Director seats
Serious News for Serious Traders! Try StreetInsider.com Premium Free!
You May Also Be Interested In
- PR Nexity - Q1 2024 business activity and revenue
- La Roche-Posay Unveils Breakthrough Dark Spot Innovation: MelaB3 Serum & UV with Multi-Patented Ingredient Melasyl™ Born from 18 Years of Research
- Aelis Farma: Availability of the 2023 Universal Registration Document
Create E-mail Alert Related Categories
SEC FilingsSign up for StreetInsider Free!
Receive full access to all new and archived articles, unlimited portfolio tracking, e-mail alerts, custom newswires and RSS feeds - and more!


 Tweet
Tweet Share
Share