Form 8-K ARROW ELECTRONICS INC For: May 05
ARROW ELECTRONICS, INC. 9201 E. DRY CREEK ROAD CENTENNIAL, CO 80112 303-824-4000 | NEWS | |||||||
Exhibit 99.1
Arrow Electronics Reports First-Quarter 2022 Results
-- Record Sales, Gross Profit, Operating Income, and Earnings Per Share --
-- First-Quarter Earnings Per Share of $5.31; Non-GAAP Earnings Per Share of $5.43 --
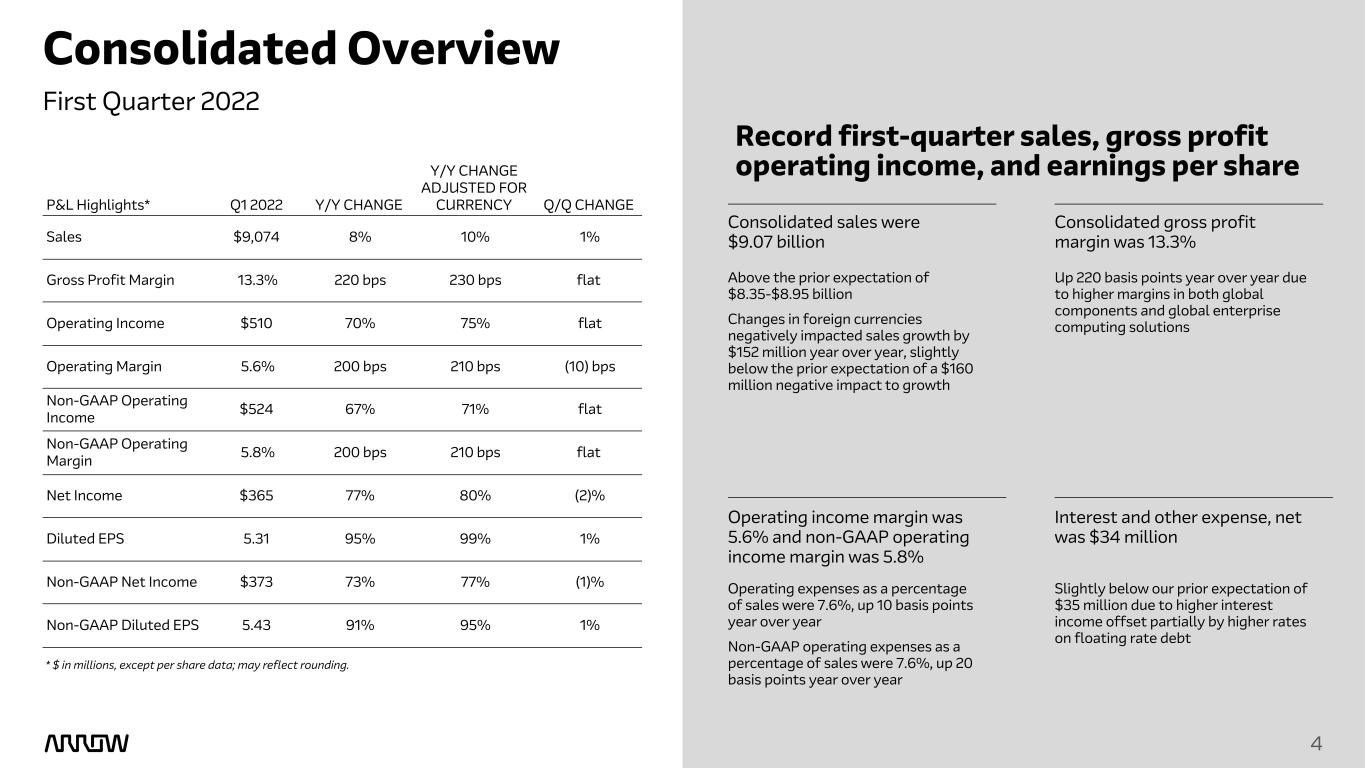
CENTENNIAL, Colo.--(BUSINESS WIRE)-May 5, 2022--Arrow Electronics, Inc. (NYSE:ARW) today reported first-quarter 2022 sales of $9.07 billion, an increase of 8 percent from sales of $8.39 billion in the first quarter of 2021. First-quarter net income was $365 million, or $5.31 per share on a diluted basis, compared with a net income of $206 million, or $2.72 per share on a diluted basis, in the first quarter of 2021. Non-GAAP net income1 was $373 million, or $5.43 per share on a diluted basis, in the first quarter of 2022, compared with non-GAAP net income of $216 million, or $2.84 per share on a diluted basis, in the first quarter of 2021.
“Arrow’s unwavering commitment to our customers’ success continues to foster expanding opportunities for our own business in the areas of supply chain as a service, designed and engineered value-enhancing solutions, and secure management of mission-critical software workloads,” said Michael J. Long, chairman, president, and chief executive officer. “At Arrow, we continue to enhance the solutions and services we provide as the markets we serve change at an increasingly rapid pace. Our record results this quarter demonstrate that we remain ahead of the curve, supported by the best team in the industry. We expect component supply to remain well below demand in the coming quarters and through the better part of 2022.”
Global components first-quarter sales of $7.20 billion reflected an increase of 12 percent year over year and non-GAAP sales increased 13 percent year over year. Asia-Pacific components first-quarter sales decreased 8 percent year over year. Americas components first-quarter sales increased 38 percent year over year. Europe components first-quarter sales increased 23 percent year over year and non-GAAP sales in the region increased 31 percent year over year. Global components first-quarter operating income was $499 million, and first-quarter non-GAAP operating income was $506 million.
“The current market environment has enabled the global components business to showcase our experience and industry knowledge that makes us uniquely positioned to help our customers navigate today’s challenges. This includes helping to mitigate production risks and facilitate a continuous stream of products to market,” said Mr. Long.
Global enterprise computing solutions ("ECS") first-quarter sales of $1.88 billion reflected a decrease of 3 percent year over year and non-GAAP sales decreased 1 percent year over year. Europe enterprise computing solutions first-quarter sales increased 5 percent year over year and non-GAAP sales in the region increased 11 percent year over year. Americas enterprise computing solutions first-quarter sales decreased 9 percent year over year. Global enterprise computing solutions first-quarter operating income was $86 million, and first-quarter non-GAAP operating income was $88 million.
“Demand for complex IT solutions continues to grow, and we expect to see significant upside in this area when near-term project postponements and incompletions resulting from supply chain challenges are resolved,” said Mr. Long.
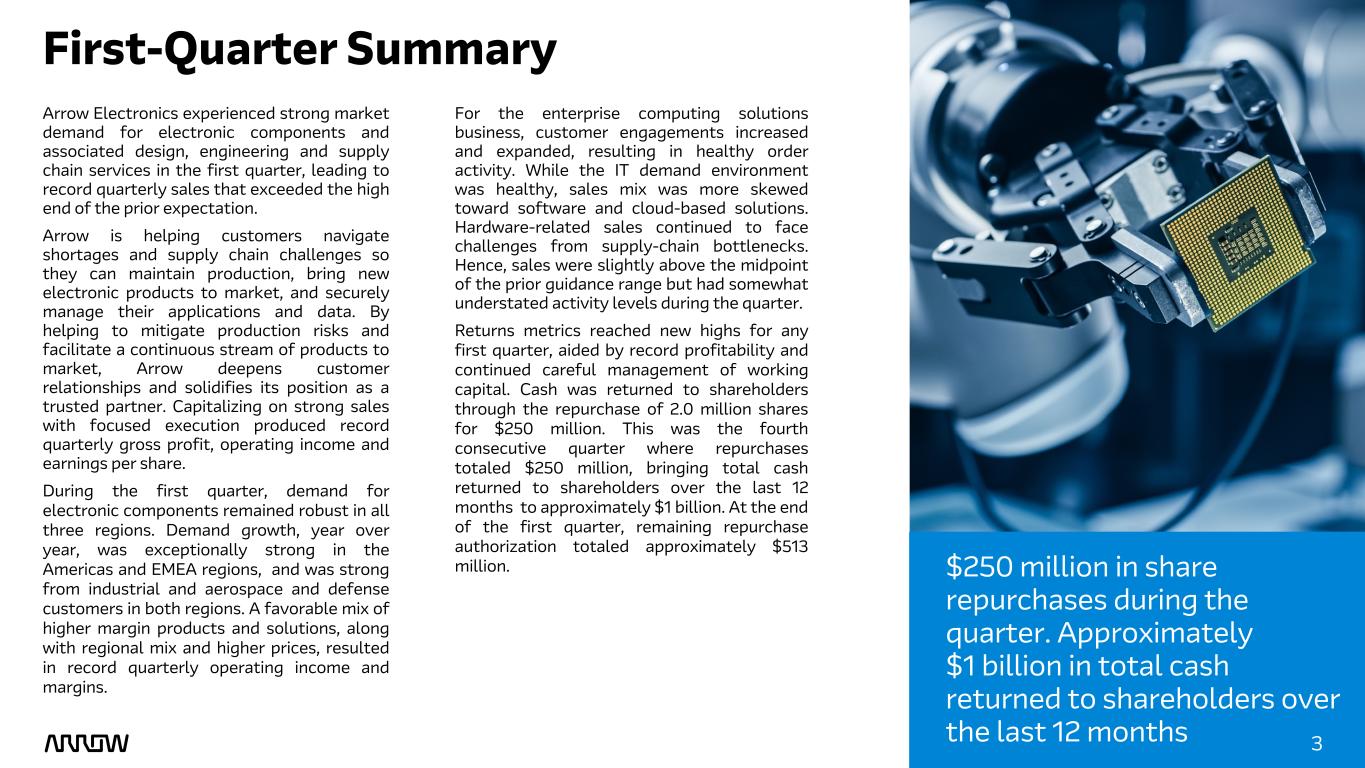
“Our return on invested capital remains favorable, and our leverage ratios are near their lowest levels in ten years,” said Rick Seidlitz, vice president and interim principal financial officer. “Our strong profitability and the effective management of our balance sheet enabled us to deliver on our commitment to return cash to shareholders through the repurchase of approximately $250 million of shares for the fourth consecutive quarter, bringing total cash returned to shareholders over the last 12 months to approximately $1 billion. Our current repurchase authorization stands at approximately $513 million.”
1 A reconciliation of non-GAAP financial measures, including sales, gross profit, operating income, net income attributable to shareholders, and net income per share, to GAAP financial measures is presented in the reconciliation tables included herein.
 | 1 | |||||||
SECOND-QUARTER 2022 OUTLOOK
•Consolidated sales of $9.04 billion to $9.64 billion, with global components sales of $7.29 billion to $7.59 billion, and global enterprise computing solutions sales of $1.75 billion to $2.05 billion
•Net income per share on a diluted basis of $5.32 to $5.48, and non-GAAP net income per share on a diluted basis of $5.48 to $5.64
•Average tax rate of approximately 23.5 percent compared to the long-term range of 23 to 25 percent
•Average diluted shares outstanding of 67 million
•Interest expense of approximately $36 million
•Expecting average USD-to-Euro exchange rate of $1.08 to €1; changes in foreign currencies to decrease sales by approximately $300 million, and earnings per share on a diluted basis by $.20 compared to the second quarter of 2021
Second-Quarter 2022 Outlook | ||||||||||||||
| Reported GAAP measure | Intangible amortization expense | Restructuring & integration charges | Non-GAAP measure | |||||||||||
| Net income per diluted share | $5.32 - $5.48 | $.10 | $.06 | $5.48 to $5.64 | ||||||||||
Please refer to the CFO commentary, which can be found at investor.arrow.com, as a supplement to the company’s earnings release. The company uses its website as a tool to disclose important information about the company and comply with its disclosure obligations under Regulation Fair Disclosure.
Arrow Electronics guides innovation forward for over 220,000 leading technology manufacturers and service providers. With 2021 sales of $34 billion, Arrow develops technology solutions that improve business and daily life. Learn more at fiveyearsout.com.
Information Relating to Forward-Looking Statements
This press release includes “forward-looking” statements, as the term is defined under the federal securities laws, including but not limited to the statements contained in quotes of Arrow's executives and statements regarding: Arrow’s future financial performance, including its outlook on financial results for the second quarter of fiscal 2022, such as sales, net income per diluted share, non-GAAP net income per diluted share, average tax rate, average diluted shares outstanding, interest expense, average USD-to-Euro exchange rate, impact to sales due to changes in foreign currencies, intangible amortization expense per diluted share, restructuring and integration charges per diluted share, and expectation regarding market demand. These forward-looking statements are subject to numerous assumptions, risks, and uncertainties, which could cause actual results or facts to differ materially from such statements for a variety of reasons, including, but not limited to: potential adverse effects of the ongoing global COVID-19 pandemic, including actions taken to contain or mitigate the impact of COVID-19, impacts of the conflict in Ukraine, industry conditions, changes in product supply, pricing and customer demand, the global supply chain disruption, economic conditions, inflationary pressures, competition, other vagaries in the global components and the global enterprise computing solutions markets, changes in relationships with key suppliers, increased profit margin pressure, foreign currency fluctuation, changes in legal and regulatory matters, non-compliance with certain regulations, such as export, antitrust, and anti-corruption laws, foreign tax and other loss contingencies, and the company's ability to generate cash flow. For a further discussion of these and other factors that could cause the company’s future results to differ materially from any forward-looking statements, see the section entitled “Risk Factors” in the company's periodic reports on Form 10-K and Form 10-Q and subsequent filings made with the Securities and Exchange Commission. Shareholders and other readers are cautioned not to place undue reliance on these forward-looking statements, which speak only as of the date on which they are made. The company undertakes no obligation to update publicly or revise any of the forward-looking statements.
Certain Non-GAAP Financial Information
In addition to disclosing financial results that are determined in accordance with accounting principles generally accepted in the United States (“GAAP”), the company also provides certain non-GAAP financial information The company provides non-GAAP sales, gross profit, operating income, income before income taxes, provision for income taxes, net income, noncontrolling interests, net income attributable to shareholders, and net income per share on a diluted basis, which are non-GAAP measures adjusted for the impact of changes in foreign currencies (referred to as "changes in foreign currencies") by re-translating prior-period results at current period foreign exchange rates, identifiable intangible asset amortization, restructuring, integration, and other charges, and net gains and losses on investments. Management believes that providing this additional information is useful to the reader to better assess and understand the company’s operating performance, especially when comparing results with previous periods, primarily because management typically monitors the business adjusted for these items in addition to GAAP results. However, analysis of results on a non-GAAP basis should be used as a complement to, and in conjunction with, data presented in accordance with GAAP. A reconciliation of the company’s non-GAAP financial information to GAAP is set forth in the tables below.
 | 2 | |||||||
| ARROW ELECTRONICS, INC. | |||||||||||
| CONSOLIDATED STATEMENTS OF OPERATIONS | |||||||||||
| (In thousands except per share data) | |||||||||||
| (Unaudited) | |||||||||||
| Quarter Ended | |||||||||||
| April 2, 2022 | April 3, 2021 | ||||||||||
| Sales | $ | 9,074,125 | $ | 8,385,919 | |||||||
| Cost of sales | 7,866,621 | 7,455,809 | |||||||||
| Gross profit | 1,207,504 | 930,110 | |||||||||
| Operating expenses: | |||||||||||
| Selling, general, and administrative expenses | 643,925 | 574,567 | |||||||||
| Depreciation and amortization | 48,305 | 50,331 | |||||||||
| Restructuring, integration, and other charges | 4,898 | 5,709 | |||||||||
| 697,128 | 630,607 | ||||||||||
| Operating income | 510,376 | 299,503 | |||||||||
| Equity in earnings of affiliated companies | 843 | 844 | |||||||||
| Gain on investments, net | 2,011 | 2,793 | |||||||||
| Employee benefit plan expense, net | (889) | (1,230) | |||||||||
| Interest and other financing expense, net | (33,985) | (33,656) | |||||||||
| Income before income taxes | 478,356 | 268,254 | |||||||||
| Provision for income taxes | 112,360 | 61,026 | |||||||||
| Consolidated net income | 365,996 | 207,228 | |||||||||
| Noncontrolling interests | 1,247 | 907 | |||||||||
| Net income attributable to shareholders | $ | 364,749 | $ | 206,321 | |||||||
| Net income per share: | |||||||||||
| Basic | $ | 5.38 | $ | 2.76 | |||||||
| Diluted | $ | 5.31 | $ | 2.72 | |||||||
| Weighted-average shares outstanding: | |||||||||||
| Basic | 67,840 | 74,882 | |||||||||
| Diluted | 68,749 | 75,794 | |||||||||
 | 3 | |||||||
| ARROW ELECTRONICS, INC. | |||||||||||
| CONSOLIDATED BALANCE SHEETS | |||||||||||
| (In thousands except par value) | |||||||||||
| (Unaudited) | |||||||||||
| April 2, 2022 | December 31, 2021 | ||||||||||
| ASSETS | |||||||||||
| Current assets: | |||||||||||
| Cash and cash equivalents | $ | 242,791 | $ | 222,194 | |||||||
| Accounts receivable, net | 10,621,942 | 11,123,946 | |||||||||
| Inventories | 4,645,116 | 4,201,965 | |||||||||
| Other current assets | 431,635 | 345,218 | |||||||||
| Total current assets | 15,941,484 | 15,893,323 | |||||||||
| Property, plant, and equipment, at cost: | |||||||||||
| Land | 5,691 | 5,736 | |||||||||
| Buildings and improvements | 185,000 | 186,097 | |||||||||
| Machinery and equipment | 1,533,688 | 1,523,919 | |||||||||
| 1,724,379 | 1,715,752 | ||||||||||
| Less: Accumulated depreciation and amortization | (1,066,180) | (1,032,941) | |||||||||
| Property, plant, and equipment, net | 658,199 | 682,811 | |||||||||
| Investments in affiliated companies | 65,239 | 63,695 | |||||||||
| Intangible assets, net | 185,753 | 195,029 | |||||||||
| Goodwill | 2,067,249 | 2,080,371 | |||||||||
| Other assets | 594,929 | 620,311 | |||||||||
| Total assets | $ | 19,512,853 | $ | 19,535,540 | |||||||
| LIABILITIES AND EQUITY | |||||||||||
| Current liabilities: | |||||||||||
| Accounts payable | $ | 9,110,391 | $ | 9,617,084 | |||||||
| Accrued expenses | 1,243,853 | 1,326,386 | |||||||||
| Short-term borrowings, including current portion of long-term debt | 317,399 | 382,619 | |||||||||
| Total current liabilities | 10,671,643 | 11,326,089 | |||||||||
| Long-term debt | 2,790,819 | 2,244,443 | |||||||||
| Other liabilities | 621,508 | 624,162 | |||||||||
| Equity: | |||||||||||
| Shareholders’ equity: | |||||||||||
| Common stock, par value $1: | |||||||||||
| Authorized - 160,000 shares in both 2022 and 2021 | |||||||||||
| Issued - 125,424 shares in both 2022 and 2021 | 125,424 | 125,424 | |||||||||
Capital in excess of par value | 1,186,595 | 1,189,845 | |||||||||
| Treasury stock (58,987 and 57,358 shares in 2022 and 2021, respectively), at cost | (3,861,793) | (3,629,265) | |||||||||
Retained earnings | 8,152,697 | 7,787,948 | |||||||||
| Accumulated other comprehensive loss | (232,969) | (191,657) | |||||||||
| Total shareholders’ equity | 5,369,954 | 5,282,295 | |||||||||
| Noncontrolling interests | 58,929 | 58,551 | |||||||||
| Total equity | 5,428,883 | 5,340,846 | |||||||||
| Total liabilities and equity | $ | 19,512,853 | $ | 19,535,540 | |||||||
 | 4 | |||||||
| ARROW ELECTRONICS, INC. | |||||||||||
| CONSOLIDATED STATEMENTS OF CASH FLOWS | |||||||||||
| (In thousands) | |||||||||||
| (Unaudited) | |||||||||||
| Quarter Ended | |||||||||||
| April 2, 2022 | April 3, 2021 | ||||||||||
| Cash flows from operating activities: | |||||||||||
| Consolidated net income | $ | 365,996 | $ | 207,228 | |||||||
| Adjustments to reconcile consolidated net income to net cash used for operations: | |||||||||||
| Depreciation and amortization | 48,305 | 50,331 | |||||||||
| Amortization of stock-based compensation | 17,351 | 13,223 | |||||||||
| Equity in earnings of affiliated companies | (843) | (844) | |||||||||
| Deferred income taxes | 1,352 | 13,663 | |||||||||
| Gain on investments, net | (2,011) | (2,793) | |||||||||
| Other | 686 | 1,374 | |||||||||
| Change in assets and liabilities: | |||||||||||
| Accounts receivable, net | 430,710 | 596,777 | |||||||||
| Inventories | (460,902) | (13,147) | |||||||||
| Accounts payable | (477,825) | (840,124) | |||||||||
| Accrued expenses | (43,641) | 3,643 | |||||||||
| Other assets and liabilities | (79,426) | (33,867) | |||||||||
| Net cash used for operating activities | (200,248) | (4,536) | |||||||||
| Cash flows from investing activities: | |||||||||||
| Acquisition of property, plant, and equipment | (19,270) | (20,180) | |||||||||
| Proceeds from sale of property, plant, and equipment | — | 22,171 | |||||||||
| Proceeds from collections of notes receivable | 20,169 | — | |||||||||
| Net cash provided by investing activities | 899 | 1,991 | |||||||||
| Cash flows from financing activities: | |||||||||||
| Change in short-term and other borrowings | (14,293) | (12,452) | |||||||||
| Proceeds from long-term bank borrowings, net | 845,000 | 154,674 | |||||||||
| Redemption of notes | (350,000) | (130,860) | |||||||||
| Proceeds from exercise of stock options | 11,302 | 26,091 | |||||||||
| Repurchases of common stock | (264,431) | (160,619) | |||||||||
| Net cash provided by (used for) financing activities | 227,578 | (123,166) | |||||||||
| Effect of exchange rate changes on cash | (7,632) | (20,203) | |||||||||
| Net increase (decrease) in cash and cash equivalents | 20,597 | (145,914) | |||||||||
| Cash and cash equivalents at beginning of period | 222,194 | 373,615 | |||||||||
| Cash and cash equivalents at end of period | $ | 242,791 | $ | 227,701 | |||||||
 | 5 | |||||||
| ARROW ELECTRONICS, INC. | |||||||||||||||||
| NON-GAAP SALES RECONCILIATION | |||||||||||||||||
| (In thousands) | |||||||||||||||||
| (Unaudited) | |||||||||||||||||
| Quarter Ended | |||||||||||||||||
| April 2, 2022 | April 3, 2021 | % Change | |||||||||||||||
| Consolidated sales, as reported | $ | 9,074,125 | $ | 8,385,919 | 8.2 | % | |||||||||||
| Impact of changes in foreign currencies | — | (151,551) | |||||||||||||||
| Non-GAAP consolidated sales | $ | 9,074,125 | $ | 8,234,368 | 10.2 | % | |||||||||||
| Global components sales, as reported | $ | 7,199,075 | $ | 6,443,253 | 11.7 | % | |||||||||||
| Impact of changes in foreign currencies | — | (100,301) | |||||||||||||||
| Non-GAAP global components sales | $ | 7,199,075 | $ | 6,342,952 | 13.5 | % | |||||||||||
| Americas components sales, as reported | $ | 2,340,543 | $ | 1,701,173 | 37.6 | % | |||||||||||
| Impact of changes in foreign currencies | — | (772) | |||||||||||||||
| Non-GAAP Americas components sales | $ | 2,340,543 | $ | 1,700,401 | 37.6 | % | |||||||||||
| Asia components sales, as reported | $ | 2,931,529 | $ | 3,173,478 | (7.6) | % | |||||||||||
| Impact of changes in foreign currencies | — | (630) | |||||||||||||||
| Non-GAAP Asia components sales | $ | 2,931,529 | $ | 3,172,848 | (7.6) | % | |||||||||||
| Europe components sales, as reported | $ | 1,927,003 | $ | 1,568,602 | 22.8 | % | |||||||||||
| Impact of changes in foreign currencies | — | (98,899) | |||||||||||||||
| Non-GAAP Europe components sales | $ | 1,927,003 | $ | 1,469,703 | 31.1 | % | |||||||||||
| Global ECS sales, as reported | $ | 1,875,050 | $ | 1,942,666 | (3.5) | % | |||||||||||
| Impact of changes in foreign currencies | — | (51,250) | |||||||||||||||
| Non-GAAP global ECS sales | $ | 1,875,050 | $ | 1,891,416 | (0.9) | % | |||||||||||
| Americas ECS sales, as reported | $ | 1,047,849 | $ | 1,151,338 | (9.0) | % | |||||||||||
| Impact of changes in foreign currencies | — | (2,453) | |||||||||||||||
| Non-GAAP Americas ECS sales | $ | 1,047,849 | $ | 1,148,885 | (8.8) | % | |||||||||||
| Europe ECS sales, as reported | $ | 827,201 | $ | 791,328 | 4.5 | % | |||||||||||
| Impact of changes in foreign currencies | — | (48,797) | |||||||||||||||
| Non-GAAP Europe ECS sales | $ | 827,201 | $ | 742,531 | 11.4 | % | |||||||||||
 | 6 | |||||||
| ARROW ELECTRONICS, INC. | |||||||||||||||||||||||||||||
| NON-GAAP EARNINGS RECONCILIATION | |||||||||||||||||||||||||||||
| (In thousands except per share data) | |||||||||||||||||||||||||||||
| (Unaudited) | |||||||||||||||||||||||||||||
| Three months ended April 2, 2022 | |||||||||||||||||||||||||||||
| Reported GAAP measure | Intangible amortization expense | Restructuring & Integration charges | Other(1) | Non-GAAP measure | |||||||||||||||||||||||||
| Sales | $9,074,125 | $ | — | $ | — | $ | — | $9,074,125 | |||||||||||||||||||||
| Gross Profit | 1,207,504 | — | — | — | 1,207,504 | ||||||||||||||||||||||||
| Operating income | 510,376 | 9,018 | 4,898 | — | 524,292 | ||||||||||||||||||||||||
| Income before income taxes | 478,356 | 9,018 | 4,898 | (2,011) | 490,261 | ||||||||||||||||||||||||
| Provision for income taxes | 112,360 | 2,310 | 1,205 | (486) | 115,389 | ||||||||||||||||||||||||
| Consolidated net income | 365,996 | 6,708 | 3,693 | (1,525) | 374,872 | ||||||||||||||||||||||||
| Noncontrolling interests | 1,247 | 140 | — | — | 1,387 | ||||||||||||||||||||||||
| Net income attributable to shareholders | $364,749 | $6,568 | $3,693 | ($1,525) | $373,485 | ||||||||||||||||||||||||
Net income per diluted share (3) | $5.31 | $0.10 | $0.05 | ($0.02) | $5.43 | ||||||||||||||||||||||||
Effective tax rate (2) | 23.5 | % | 23.5 | % | |||||||||||||||||||||||||
| Three months ended April 3, 2021 | |||||||||||||||||||||||||||||
| Reported GAAP measure | Intangible amortization expense | Restructuring & Integration charges | Other(1) | Non-GAAP measure | |||||||||||||||||||||||||
| Sales | $8,385,919 | $ | — | $ | — | $ | — | $8,385,919 | |||||||||||||||||||||
| Gross Profit | 930,110 | — | — | — | 930,110 | ||||||||||||||||||||||||
| Operating income | 299,503 | 9,326 | 5,709 | — | 314,538 | ||||||||||||||||||||||||
| Income before income taxes | 268,254 | 9,326 | 5,709 | (2,793) | 280,496 | ||||||||||||||||||||||||
| Provision for income taxes | 61,026 | 2,385 | 1,166 | (672) | 63,905 | ||||||||||||||||||||||||
| Consolidated net income | 207,228 | 6,941 | 4,543 | (2,121) | 216,591 | ||||||||||||||||||||||||
| Noncontrolling interests | 907 | 150 | — | — | 1,057 | ||||||||||||||||||||||||
| Net income attributable to shareholders | $206,321 | $6,791 | $4,543 | ($2,121) | $215,534 | ||||||||||||||||||||||||
| Net income per diluted share | $2.72 | $0.09 | $0.06 | ($0.03) | $2.84 | ||||||||||||||||||||||||
Effective tax rate (2) | 22.7 | % | 22.8 | % | |||||||||||||||||||||||||
| (1) Other includes gain on investments, net. | |||||||||||||||||||||||||||||
(2) The items as shown in this table, represent the reconciling items for the tax rate as reported by GAAP measure and as a non-GAAP measure. | |||||||||||||||||||||||||||||
| (3) The sum of the components for diluted EPS, as adjusted may not agree to totals, as presented, due to rounding. | |||||||||||||||||||||||||||||
 | 7 | |||||||
| ARROW ELECTRONICS, INC. | |||||||||||
| SEGMENT INFORMATION | |||||||||||
| (In thousands) | |||||||||||
| (Unaudited) | |||||||||||
| Quarter Ended | |||||||||||
| April 2, 2022 | April 3, 2021 | ||||||||||
| Sales: | |||||||||||
| Global components | $ | 7,199,075 | $ | 6,443,253 | |||||||
| Global ECS | 1,875,050 | 1,942,666 | |||||||||
| Consolidated | $ | 9,074,125 | $ | 8,385,919 | |||||||
| Operating income (loss): | |||||||||||
| Global components (a) | $ | 499,342 | $ | 289,383 | |||||||
| Global ECS | 85,798 | 77,359 | |||||||||
| Corporate (b) | (74,764) | (67,239) | |||||||||
| Consolidated | $ | 510,376 | $ | 299,503 | |||||||
(a)Global components operating income includes $4.3 million related to proceeds from legal settlements for the first quarter of 2021.
(b)Corporate operating income includes restructuring, integration, and other charges of $4.9 million for the first quarter of 2022 and $5.7 million for the first quarter of 2021.
| NON-GAAP SEGMENT RECONCILIATION | |||||||||||
| Quarter Ended | |||||||||||
| April 2, 2022 | April 3, 2021 | ||||||||||
| Global components operating income, as reported | $ | 499,342 | $ | 289,383 | |||||||
| Intangible assets amortization expense | 6,873 | 7,004 | |||||||||
| Global components non-GAAP operating income | $ | 506,215 | $ | 296,387 | |||||||
| Global ECS operating income, as reported | $ | 85,798 | $ | 77,359 | |||||||
| Intangible assets amortization expense | 2,145 | 2,322 | |||||||||
| Global ECS non-GAAP operating income | $ | 87,943 | $ | 79,681 | |||||||
Contact: Richard Seidlitz,
Vice President, Principal Accounting Officer, Interim Principal Financial Officer
303-305-4936
Media Contact: John Hourigan,
Vice President, Global Communications
303-824-4586
 | 8 | |||||||
investor.arrow.com First Quarter 2022 CFO Commentary
2 2 CFO Commentary As reflected in our earnings release, there are a number of items that impact the comparability of our results with those in the trailing quarter and prior quarter of last year. The discussion of our results may exclude these items to give you a better sense of our operating results. As always, the operating information we provide to you should be used as a complement to GAAP numbers. For a complete reconciliation between our GAAP and non-GAAP results, please refer to our earnings release and the earnings reconciliation found at the end of this document. The following reported and non-GAAP information included in this CFO commentary is unaudited and should be read in conjunction with the company’s Form 10-Q for the quarterly period ended April 2, 2022, and the company's 2021 Annual Report on Form 10-K as filed with the Securities and Exchange Commission.
3 3 First-Quarter Summary Arrow Electronics experienced strong market demand for electronic components and associated design, engineering and supply chain services in the first quarter, leading to record quarterly sales that exceeded the high end of the prior expectation. Arrow is helping customers navigate shortages and supply chain challenges so they can maintain production, bring new electronic products to market, and securely manage their applications and data. By helping to mitigate production risks and facilitate a continuous stream of products to market, Arrow deepens customer relationships and solidifies its position as a trusted partner. Capitalizing on strong sales with focused execution produced record quarterly gross profit, operating income and earnings per share. During the first quarter, demand for electronic components remained robust in all three regions. Demand growth, year over year, was exceptionally strong in the Americas and EMEA regions, and was strong from industrial and aerospace and defense customers in both regions. A favorable mix of higher margin products and solutions, along with regional mix and higher prices, resulted in record quarterly operating income and margins. For the enterprise computing solutions business, customer engagements increased and expanded, resulting in healthy order activity. While the IT demand environment was healthy, sales mix was more skewed toward software and cloud-based solutions. Hardware-related sales continued to face challenges from supply-chain bottlenecks. Hence, sales were slightly above the midpoint of the prior guidance range but had somewhat understated activity levels during the quarter. Returns metrics reached new highs for any first quarter, aided by record profitability and continued careful management of working capital. Cash was returned to shareholders through the repurchase of 2.0 million shares for $250 million. This was the fourth consecutive quarter where repurchases totaled $250 million, bringing total cash returned to shareholders over the last 12 months to approximately $1 billion. At the end of the first quarter, remaining repurchase authorization totaled approximately $513 million. $250 million in share repurchases during the quarter. Approximately $1 billion in total cash returned to shareholders over the last 12 months
4 Consolidated sales were $9.07 billion Above the prior expectation of $8.35-$8.95 billion Changes in foreign currencies negatively impacted sales growth by $152 million year over year, slightly below the prior expectation of a $160 million negative impact to growth 4 Consolidated Overview First Quarter 2022 * $ in millions, except per share data; may reflect rounding. Record first-quarter sales, gross profit operating income, and earnings per share Consolidated gross profit margin was 13.3% Up 220 basis points year over year due to higher margins in both global components and global enterprise computing solutions Operating income margin was 5.6% and non-GAAP operating income margin was 5.8% Interest and other expense, net was $34 million P&L Highlights* Q1 2022 Y/Y CHANGE Y/Y CHANGE ADJUSTED FOR CURRENCY Q/Q CHANGE Sales $9,074 8% 10% 1% Gross Profit Margin 13.3% 220 bps 230 bps flat Operating Income $510 70% 75% flat Operating Margin 5.6% 200 bps 210 bps (10) bps Non-GAAP Operating Income $524 67% 71% flat Non-GAAP Operating Margin 5.8% 200 bps 210 bps flat Net Income $365 77% 80% (2)% Diluted EPS 5.31 95% 99% 1% Non-GAAP Net Income $373 73% 77% (1)% Non-GAAP Diluted EPS 5.43 91% 95% 1% Operating expenses as a percentage of sales were 7.6%, up 10 basis points year over year Non-GAAP operating expenses as a percentage of sales were 7.6%, up 20 basis points year over year Slightly below our prior expectation of $35 million due to higher interest income offset partially by higher rates on floating rate debt
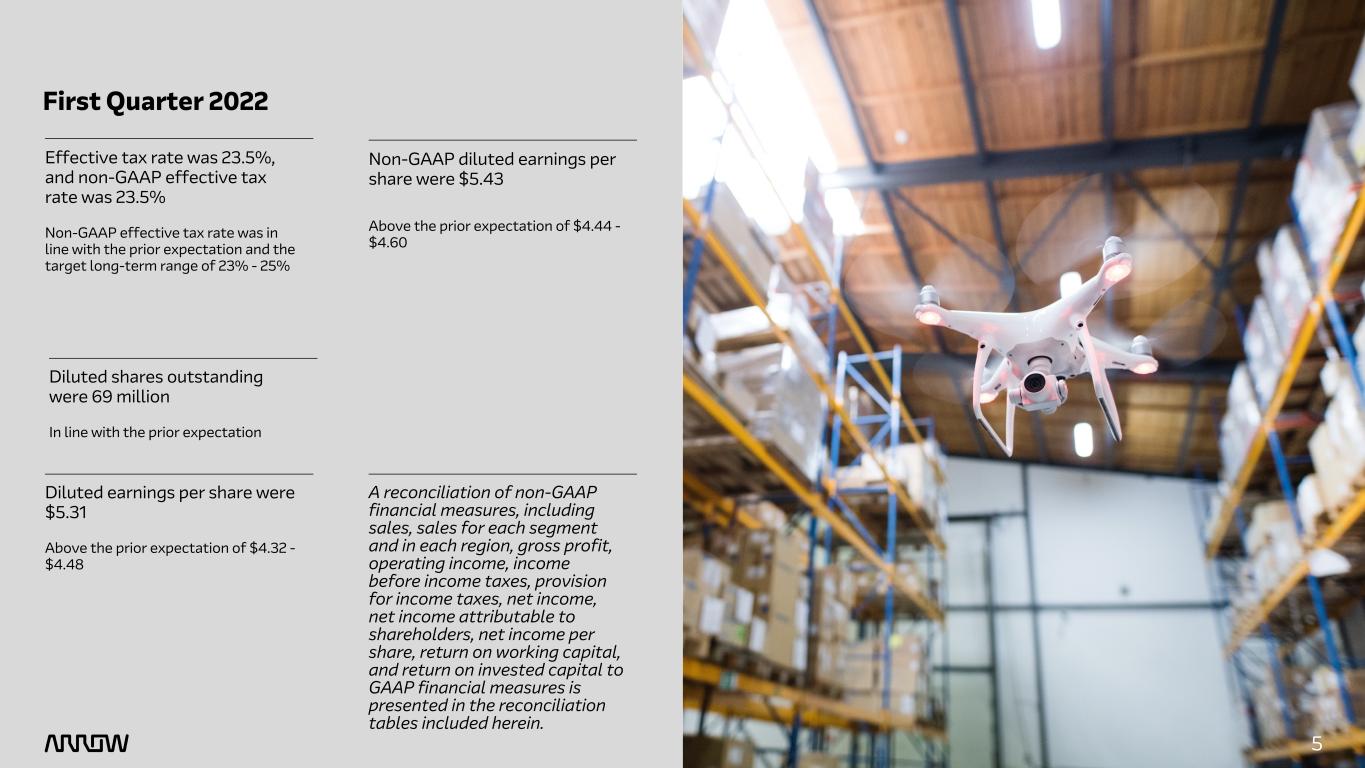
5 5 Effective tax rate was 23.5%, and non-GAAP effective tax rate was 23.5% Non-GAAP effective tax rate was in line with the prior expectation and the target long-term range of 23% - 25% Diluted shares outstanding were 69 million In line with the prior expectation Diluted earnings per share were $5.31 Above the prior expectation of $4.32 - $4.48 Non-GAAP diluted earnings per share were $5.43 Above the prior expectation of $4.44 - $4.60 A reconciliation of non-GAAP financial measures, including sales, sales for each segment and in each region, gross profit, operating income, income before income taxes, provision for income taxes, net income, net income attributable to shareholders, net income per share, return on working capital, and return on invested capital to GAAP financial measures is presented in the reconciliation tables included herein. First Quarter 2022
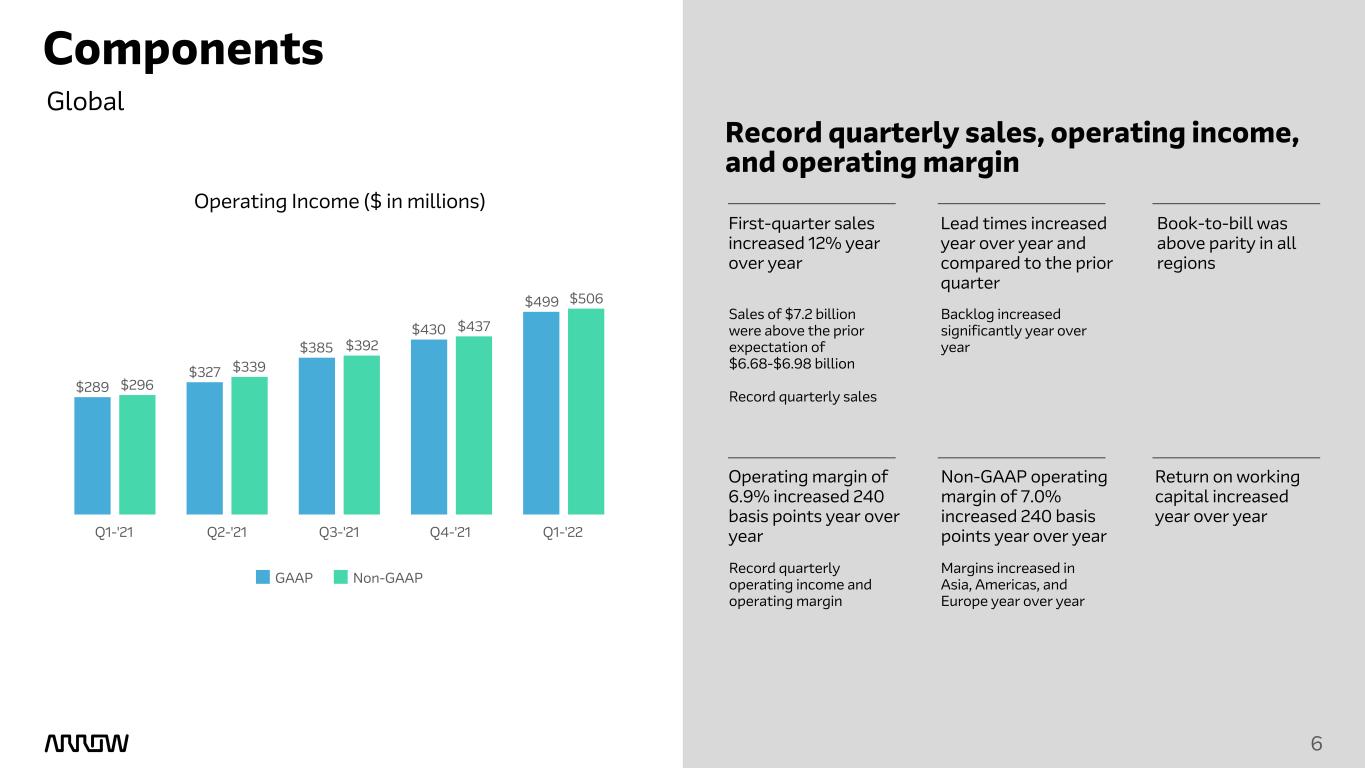
6 6 Components Global Record quarterly sales, operating income, and operating margin First-quarter sales increased 12% year over year Lead times increased year over year and compared to the prior quarter Book-to-bill was above parity in all regions Backlog increased significantly year over year Operating margin of 6.9% increased 240 basis points year over year Non-GAAP operating margin of 7.0% increased 240 basis points year over year Return on working capital increased year over year Operating Income ($ in millions) $289 $327 $385 $430 $499 $296 $339 $392 $437 $506 GAAP Non-GAAP Q1-'21 Q2-'21 Q3-'21 Q4-'21 Q1-'22 Sales of $7.2 billion were above the prior expectation of $6.68-$6.98 billion Record quarterly sales Record quarterly operating income and operating margin Margins increased in Asia, Americas, and Europe year over year
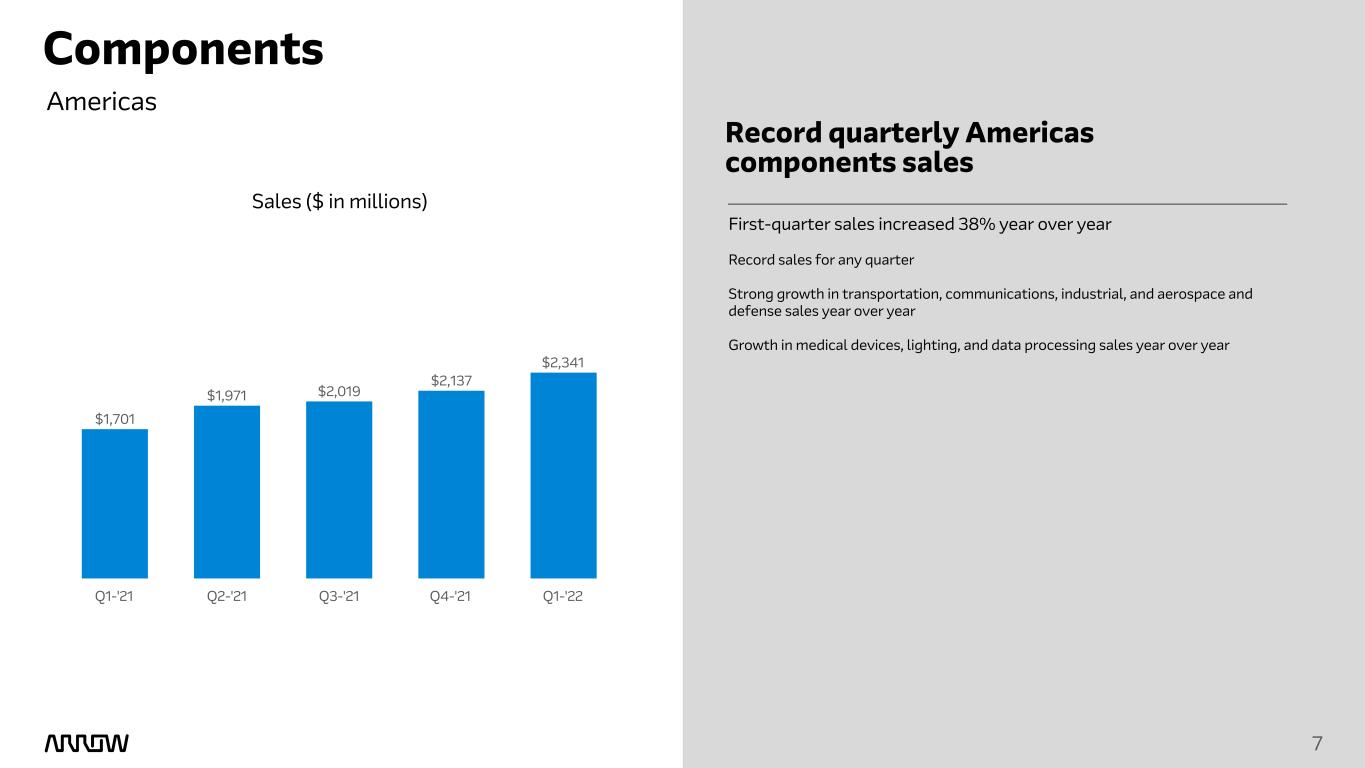
7 7 Components First-quarter sales increased 38% year over year Record sales for any quarter Strong growth in transportation, communications, industrial, and aerospace and defense sales year over year Growth in medical devices, lighting, and data processing sales year over year Sales ($ in millions) Americas Record quarterly Americas components sales $1,701 $1,971 $2,019 $2,137 $2,341 Q1-'21 Q2-'21 Q3-'21 Q4-'21 Q1-'22
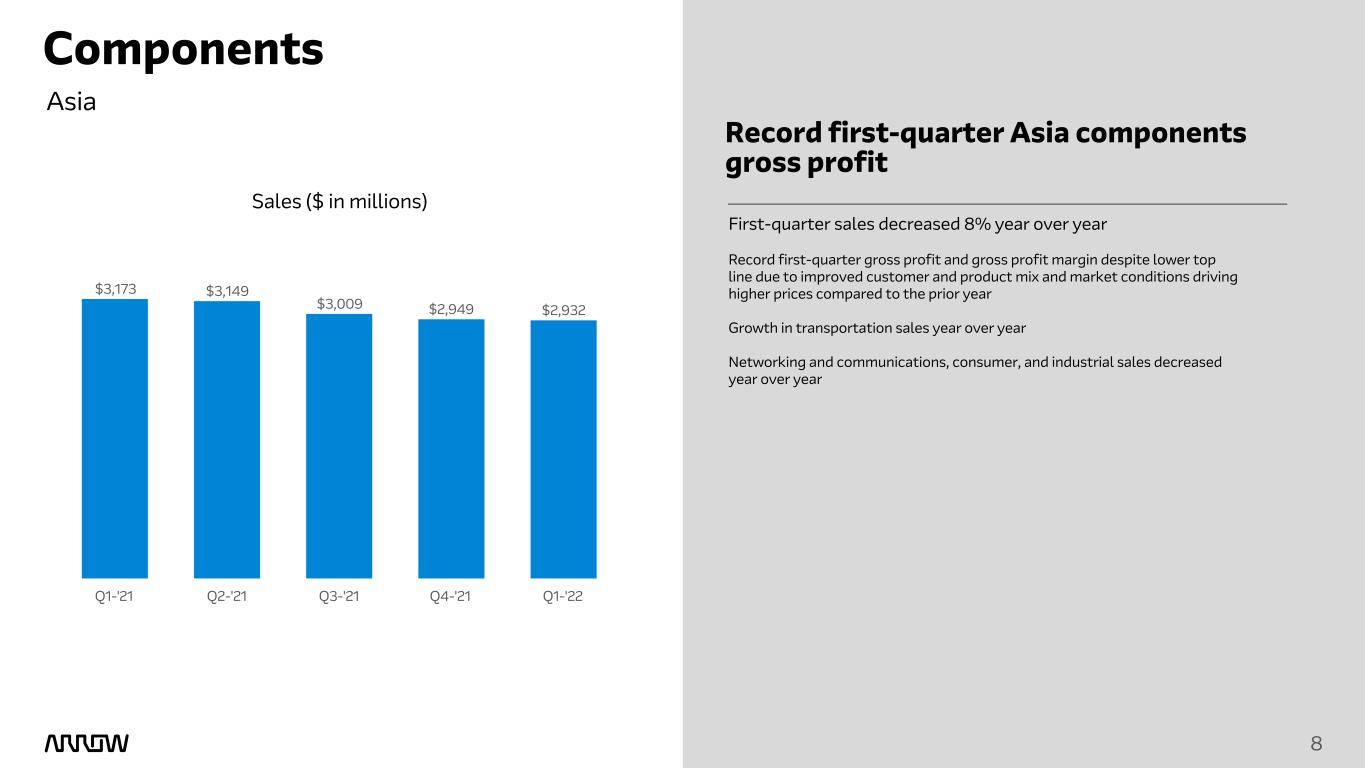
8 8 Components First-quarter sales decreased 8% year over year Record first-quarter gross profit and gross profit margin despite lower top line due to improved customer and product mix and market conditions driving higher prices compared to the prior year Growth in transportation sales year over year Networking and communications, consumer, and industrial sales decreased year over year Sales ($ in millions) Asia Record first-quarter Asia components gross profit $3,173 $3,149 $3,009 $2,949 $2,932 Q1-'21 Q2-'21 Q3-'21 Q4-'21 Q1-'22
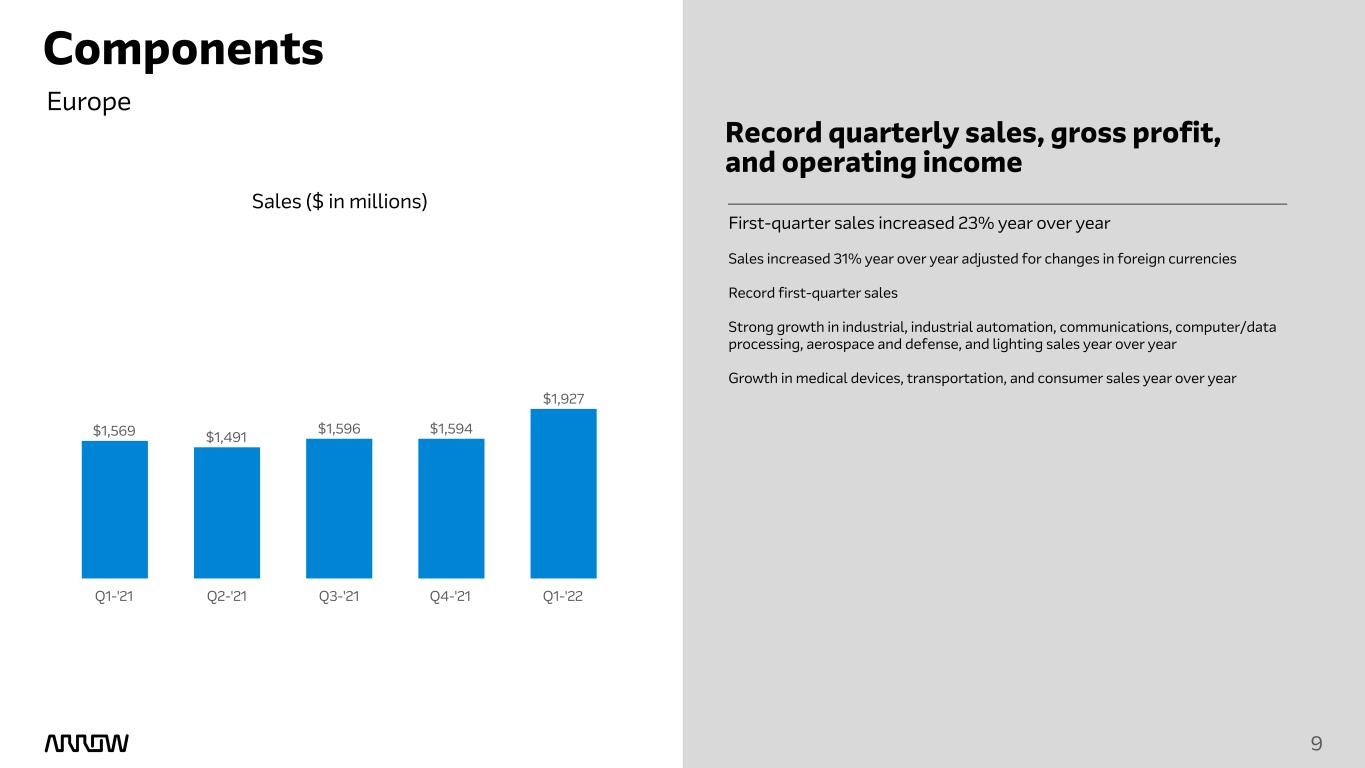
9 9 Components First-quarter sales increased 23% year over year Sales increased 31% year over year adjusted for changes in foreign currencies Record first-quarter sales Strong growth in industrial, industrial automation, communications, computer/data processing, aerospace and defense, and lighting sales year over year Growth in medical devices, transportation, and consumer sales year over year Sales ($ in millions) Europe Record quarterly sales, gross profit, and operating income $1,569 $1,491 $1,596 $1,594 $1,927 Q1-'21 Q2-'21 Q3-'21 Q4-'21 Q1-'22
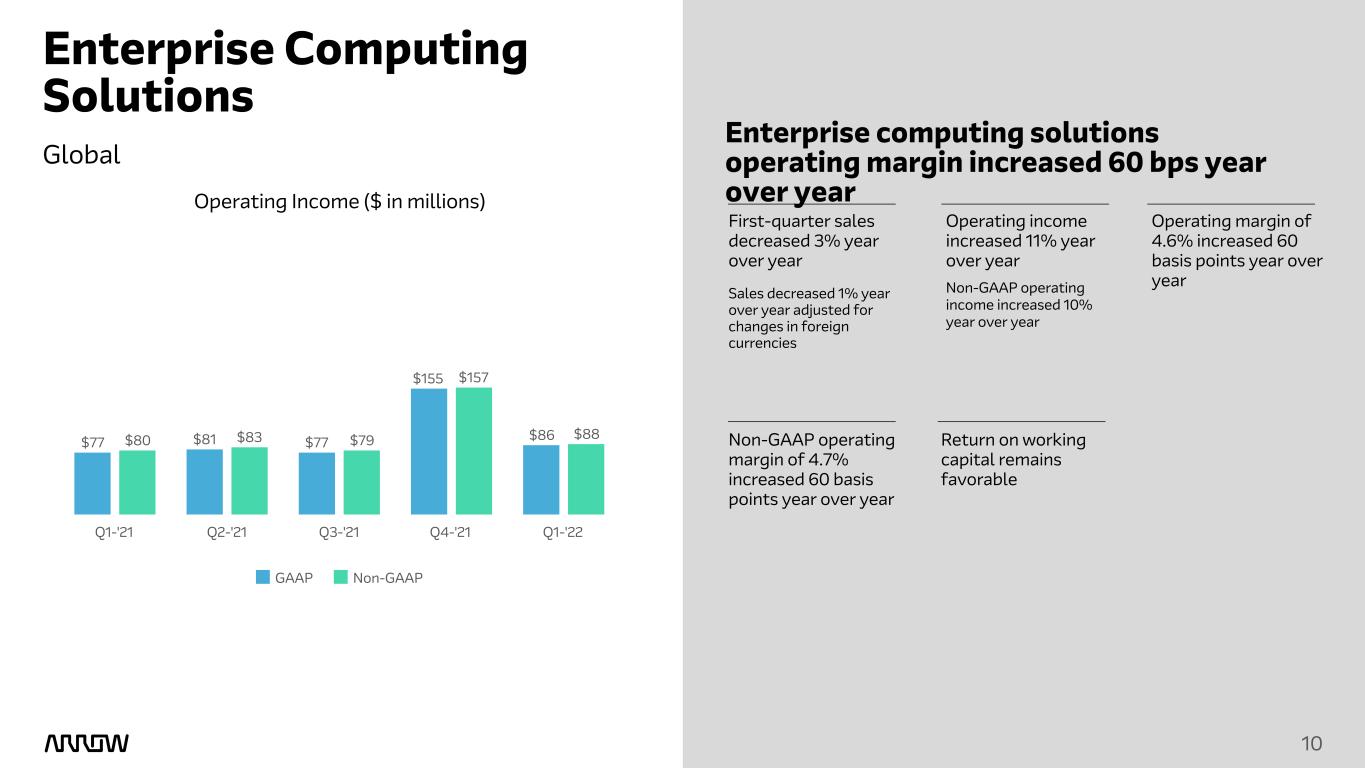
10 10 Enterprise Computing Solutions Global First-quarter sales decreased 3% year over year Sales decreased 1% year over year adjusted for changes in foreign currencies Operating income increased 11% year over year Non-GAAP operating income increased 10% year over year Operating margin of 4.6% increased 60 basis points year over year Non-GAAP operating margin of 4.7% increased 60 basis points year over year Return on working capital remains favorable Operating Income ($ in millions) Enterprise computing solutions operating margin increased 60 bps year over year $77 $81 $77 $155 $86$80 $83 $79 $157 $88 GAAP Non-GAAP Q1-'21 Q2-'21 Q3-'21 Q4-'21 Q1-'22
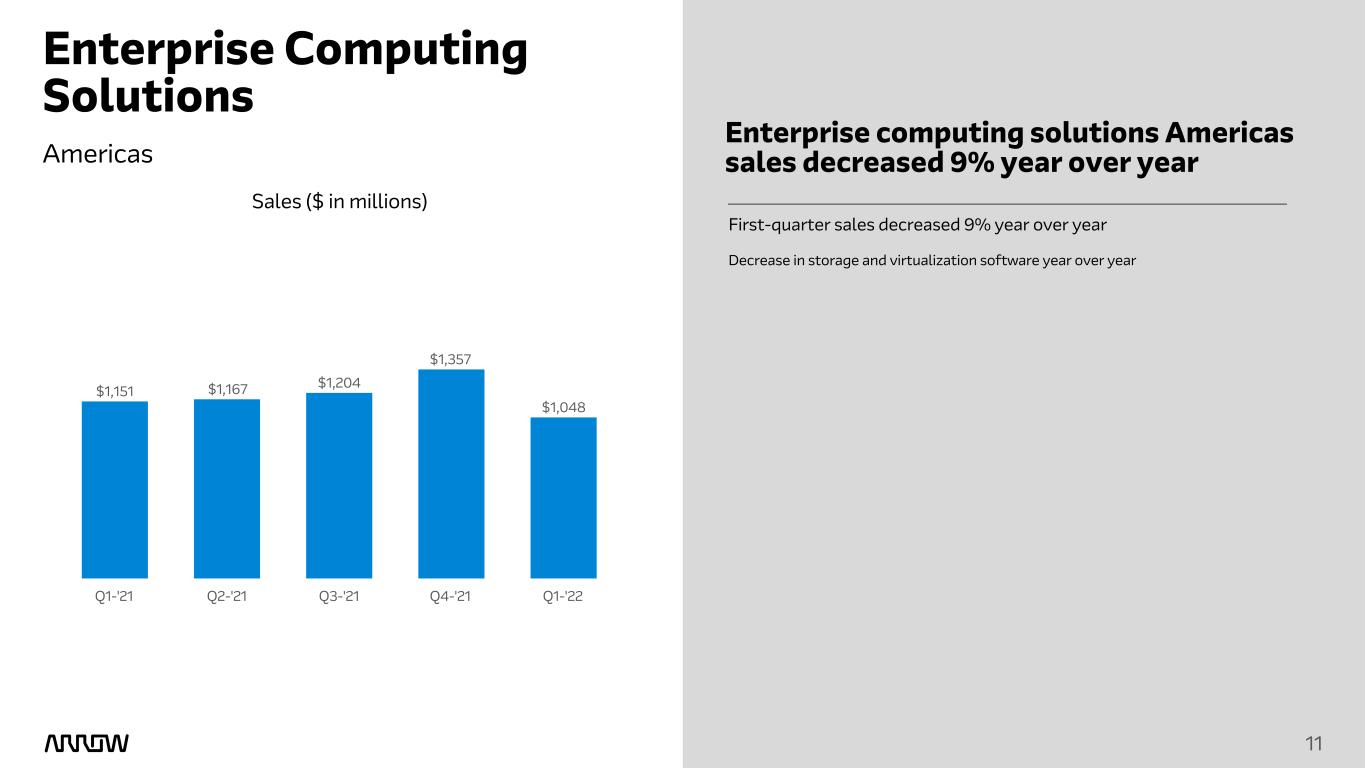
11 11 First-quarter sales decreased 9% year over year Decrease in storage and virtualization software year over year Sales ($ in millions) Americas Enterprise computing solutions Americas sales decreased 9% year over year $1,151 $1,167 $1,204 $1,357 $1,048 Q1-'21 Q2-'21 Q3-'21 Q4-'21 Q1-'22 Enterprise Computing Solutions
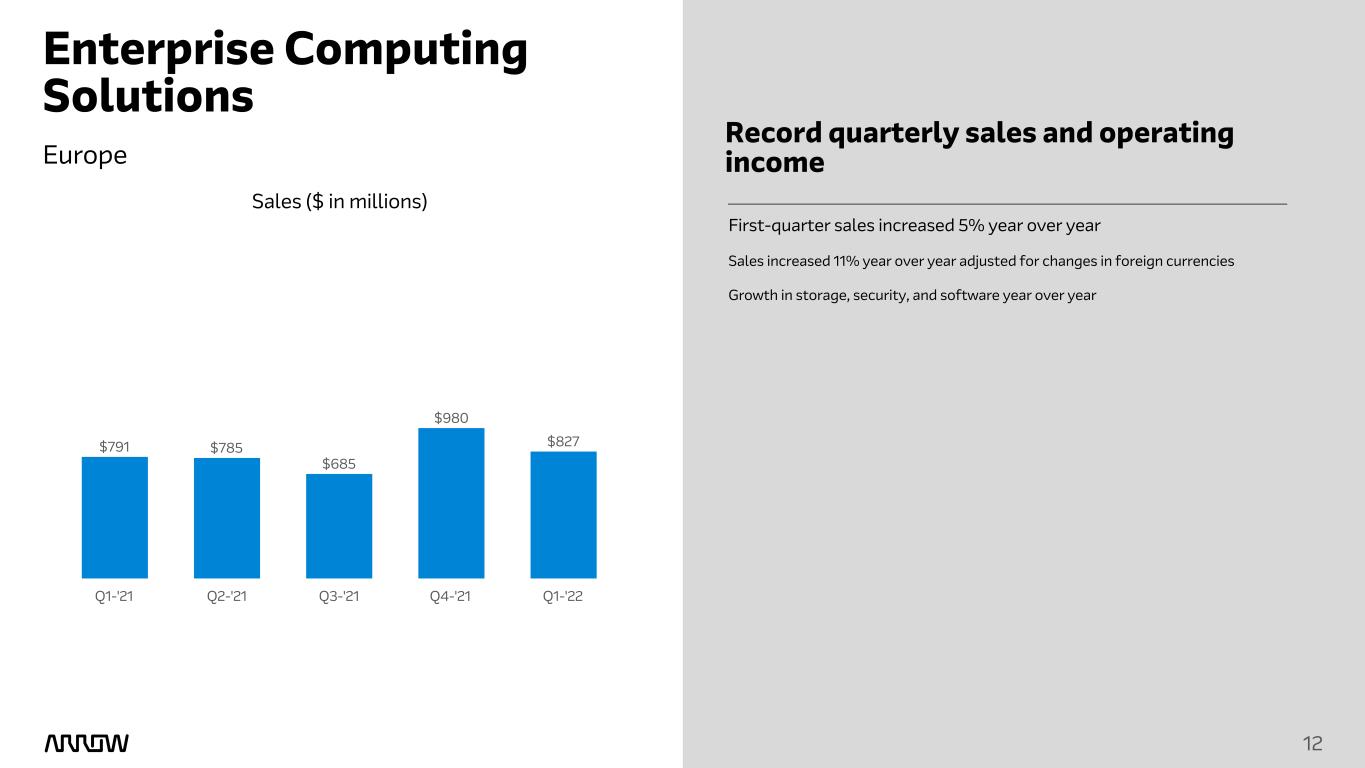
12 12 Sales ($ in millions) Enterprise Computing Solutions Europe Record quarterly sales and operating income $791 $785 $685 $980 $827 Q1-'21 Q2-'21 Q3-'21 Q4-'21 Q1-'22 First-quarter sales increased 5% year over year Sales increased 11% year over year adjusted for changes in foreign currencies Growth in storage, security, and software year over year
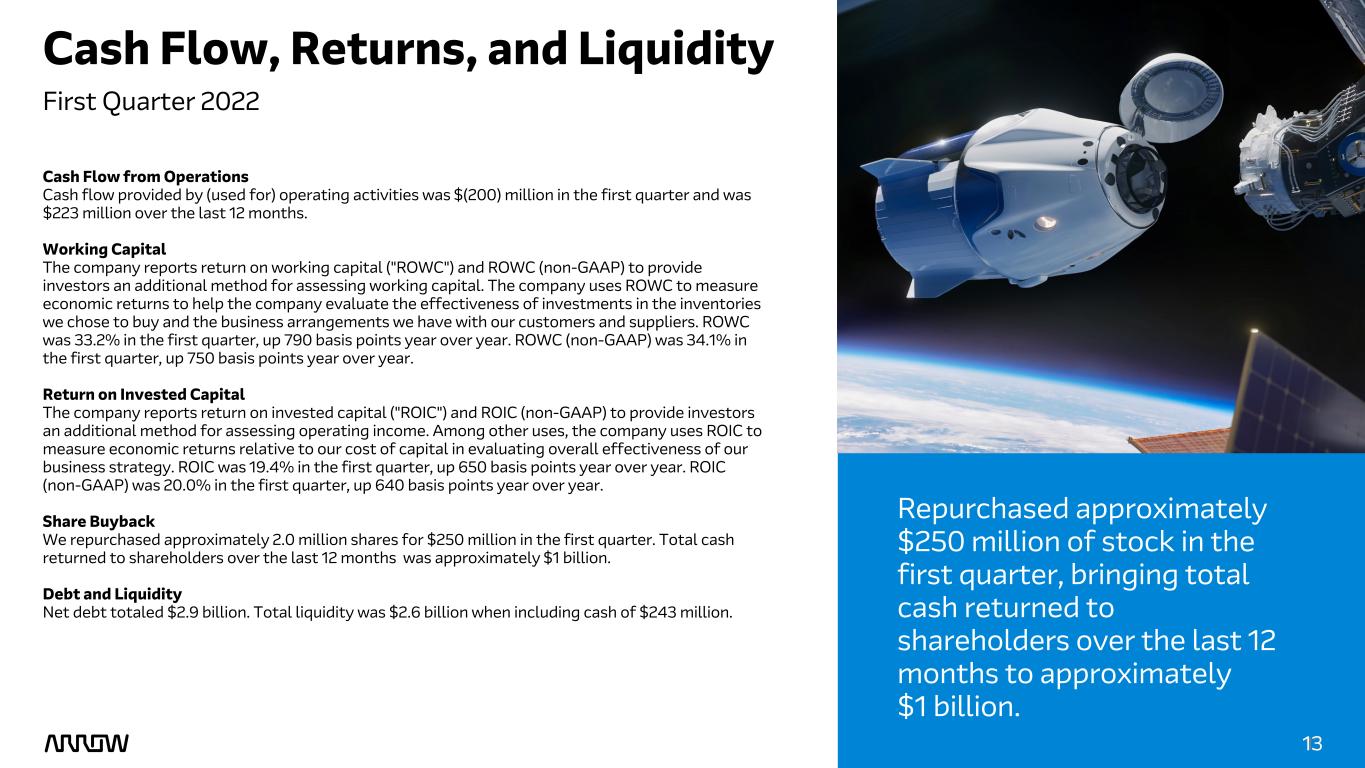
13 131 Repurchased approximately $250 million of stock in the first quarter, bringing total cash returned to shareholders over the last 12 months to approximately $1 billion. Cash Flow from Operations Cash flow provided by (used for) operating activities was $(200) million in the first quarter and was $223 million over the last 12 months. Working Capital The company reports return on working capital ("ROWC") and ROWC (non-GAAP) to provide investors an additional method for assessing working capital. The company uses ROWC to measure economic returns to help the company evaluate the effectiveness of investments in the inventories we chose to buy and the business arrangements we have with our customers and suppliers. ROWC was 33.2% in the first quarter, up 790 basis points year over year. ROWC (non-GAAP) was 34.1% in the first quarter, up 750 basis points year over year. Return on Invested Capital The company reports return on invested capital ("ROIC") and ROIC (non-GAAP) to provide investors an additional method for assessing operating income. Among other uses, the company uses ROIC to measure economic returns relative to our cost of capital in evaluating overall effectiveness of our business strategy. ROIC was 19.4% in the first quarter, up 650 basis points year over year. ROIC (non-GAAP) was 20.0% in the first quarter, up 640 basis points year over year. Share Buyback We repurchased approximately 2.0 million shares for $250 million in the first quarter. Total cash returned to shareholders over the last 12 months was approximately $1 billion. Debt and Liquidity Net debt totaled $2.9 billion. Total liquidity was $2.6 billion when including cash of $243 million. Cash Flow, Returns, and Liquidity First Quarter 2022
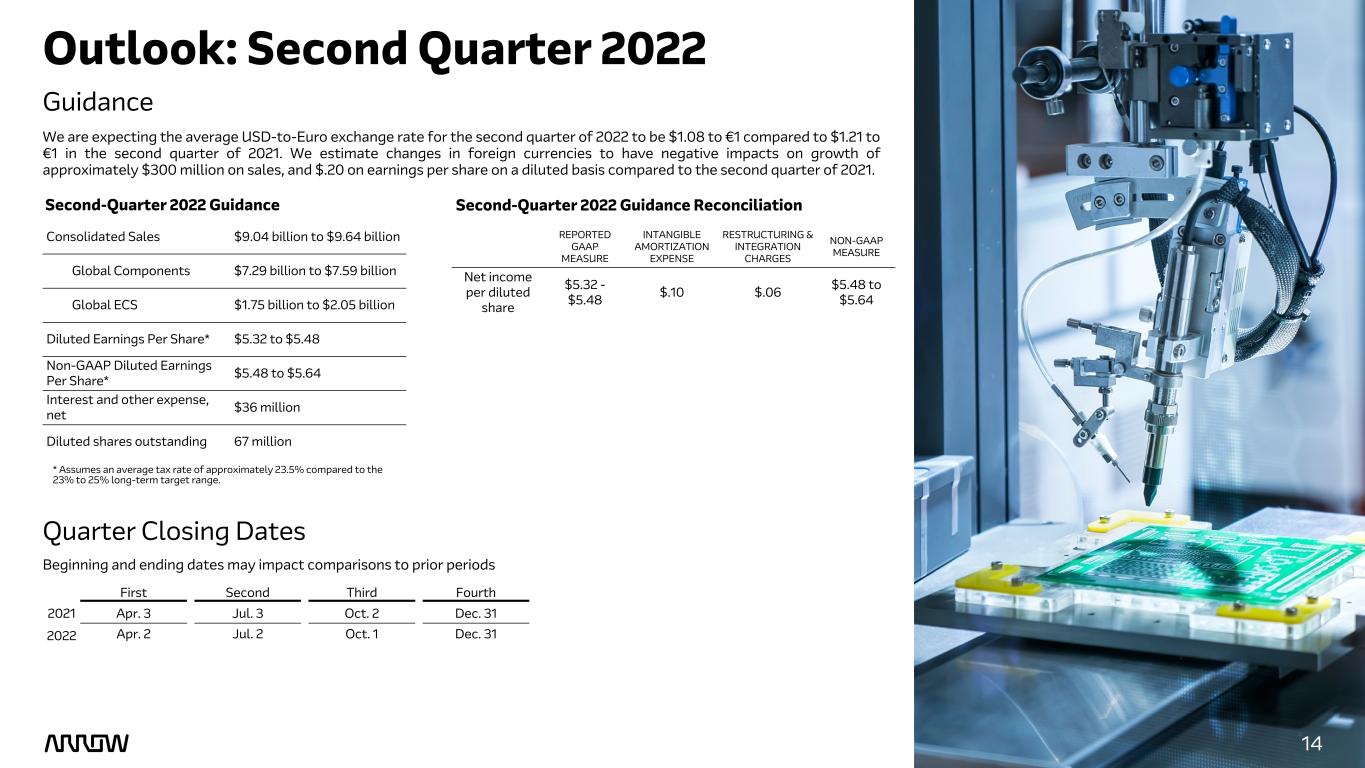
14 14 Outlook: Second Quarter 2022 We are expecting the average USD-to-Euro exchange rate for the second quarter of 2022 to be $1.08 to €1 compared to $1.21 to €1 in the second quarter of 2021. We estimate changes in foreign currencies to have negative impacts on growth of approximately $300 million on sales, and $.20 on earnings per share on a diluted basis compared to the second quarter of 2021. Guidance Second-Quarter 2022 Guidance Quarter Closing Dates Beginning and ending dates may impact comparisons to prior periods Second-Quarter 2022 Guidance Reconciliation * Assumes an average tax rate of approximately 23.5% compared to the 23% to 25% long-term target range. Consolidated Sales $9.04 billion to $9.64 billion Global Components $7.29 billion to $7.59 billion Global ECS $1.75 billion to $2.05 billion Diluted Earnings Per Share* $5.32 to $5.48 Non-GAAP Diluted Earnings Per Share* $5.48 to $5.64 Interest and other expense, net $36 million Diluted shares outstanding 67 million REPORTED GAAP MEASURE INTANGIBLE AMORTIZATION EXPENSE RESTRUCTURING & INTEGRATION CHARGES NON-GAAP MEASURE Net income per diluted share $5.32 - $5.48 $.10 $.06 $5.48 to $5.64 First Second Third Fourth 2021 Apr. 3 Jul. 3 Oct. 2 Dec. 31 2022 Apr. 2 Jul. 2 Oct. 1 Dec. 31
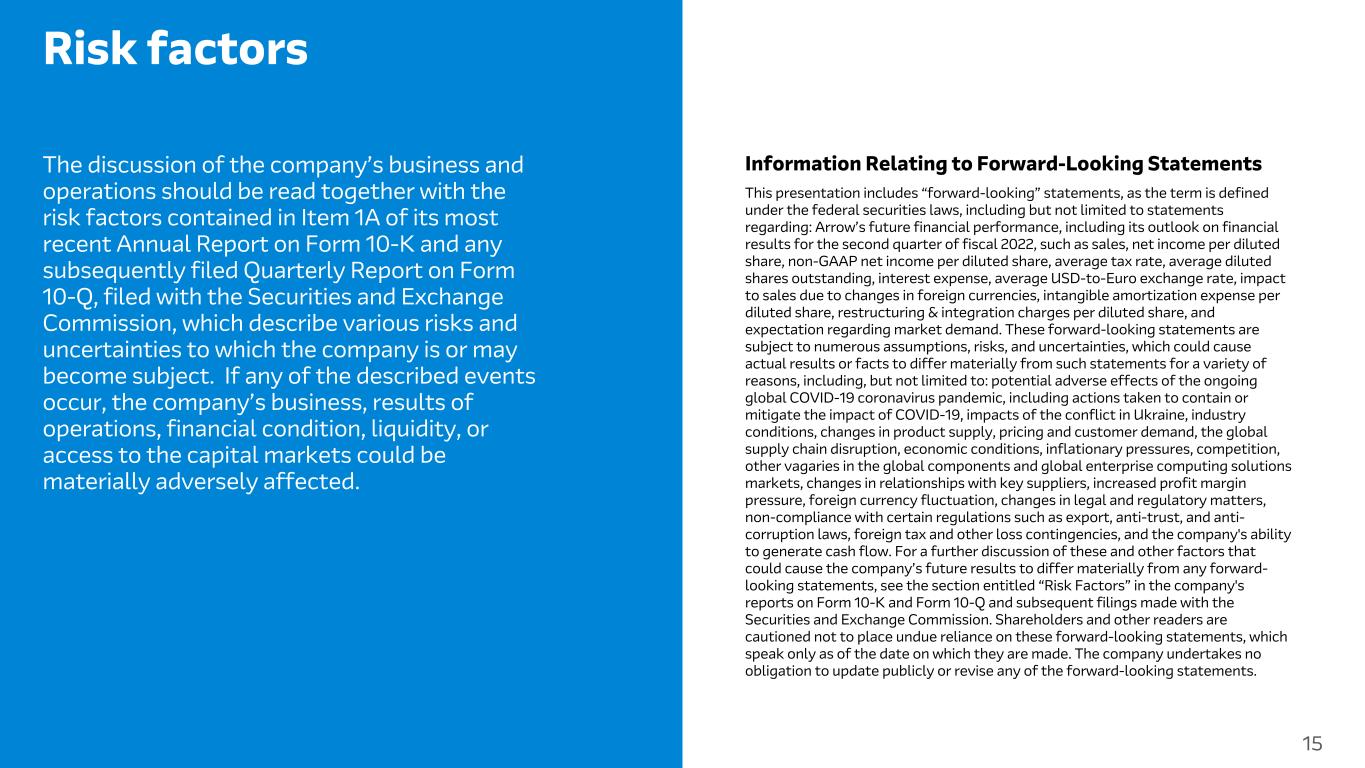
15 Information Relating to Forward-Looking Statements This presentation includes “forward-looking” statements, as the term is defined under the federal securities laws, including but not limited to statements regarding: Arrow’s future financial performance, including its outlook on financial results for the second quarter of fiscal 2022, such as sales, net income per diluted share, non-GAAP net income per diluted share, average tax rate, average diluted shares outstanding, interest expense, average USD-to-Euro exchange rate, impact to sales due to changes in foreign currencies, intangible amortization expense per diluted share, restructuring & integration charges per diluted share, and expectation regarding market demand. These forward-looking statements are subject to numerous assumptions, risks, and uncertainties, which could cause actual results or facts to differ materially from such statements for a variety of reasons, including, but not limited to: potential adverse effects of the ongoing global COVID-19 coronavirus pandemic, including actions taken to contain or mitigate the impact of COVID-19, impacts of the conflict in Ukraine, industry conditions, changes in product supply, pricing and customer demand, the global supply chain disruption, economic conditions, inflationary pressures, competition, other vagaries in the global components and global enterprise computing solutions markets, changes in relationships with key suppliers, increased profit margin pressure, foreign currency fluctuation, changes in legal and regulatory matters, non-compliance with certain regulations such as export, anti-trust, and anti- corruption laws, foreign tax and other loss contingencies, and the company's ability to generate cash flow. For a further discussion of these and other factors that could cause the company’s future results to differ materially from any forward- looking statements, see the section entitled “Risk Factors” in the company's reports on Form 10-K and Form 10-Q and subsequent filings made with the Securities and Exchange Commission. Shareholders and other readers are cautioned not to place undue reliance on these forward-looking statements, which speak only as of the date on which they are made. The company undertakes no obligation to update publicly or revise any of the forward-looking statements. 15 Risk factors The discussion of the company’s business and operations should be read together with the risk factors contained in Item 1A of its most recent Annual Report on Form 10-K and any subsequently filed Quarterly Report on Form 10-Q, filed with the Securities and Exchange Commission, which describe various risks and uncertainties to which the company is or may become subject. If any of the described events occur, the company’s business, results of operations, financial condition, liquidity, or access to the capital markets could be materially adversely affected.
16 The company believes that such non-GAAP financial information is useful to investors to assist in assessing and understanding the company’s operating performance. 16 Certain Non-GAAP Financial Information In addition to disclosing financial results that are determined in accordance with accounting principles generally accepted in the United States (“GAAP”), the company also provides certain non-GAAP financial information relating to sales, gross profit, operating income, income before income taxes, provision for income taxes, net income, noncontrolling interests, net income attributable to shareholders, net income per share on a diluted basis, effective tax rate, return on working capital, and return on invested capital. These non-GAAP measures are adjusted for the impact of changes in foreign currencies (referred to as "changes in foreign currencies") by re-translating prior period results at current period foreign exchange rates, identifiable intangible asset amortization, restructuring, integration, and other charges, and net gains and losses on investments. Management believes that providing this additional information is useful to the reader to better assess and understand the company’s operating performance, especially when comparing results with previous periods, primarily because management typically monitors the business adjusted for these items in addition to GAAP results. However, analysis of results on a non-GAAP basis should be used as a complement to, and in conjunction with, data presented in accordance with GAAP. A reconciliation of the company’s non-GAAP financial information to GAAP is set forth below.
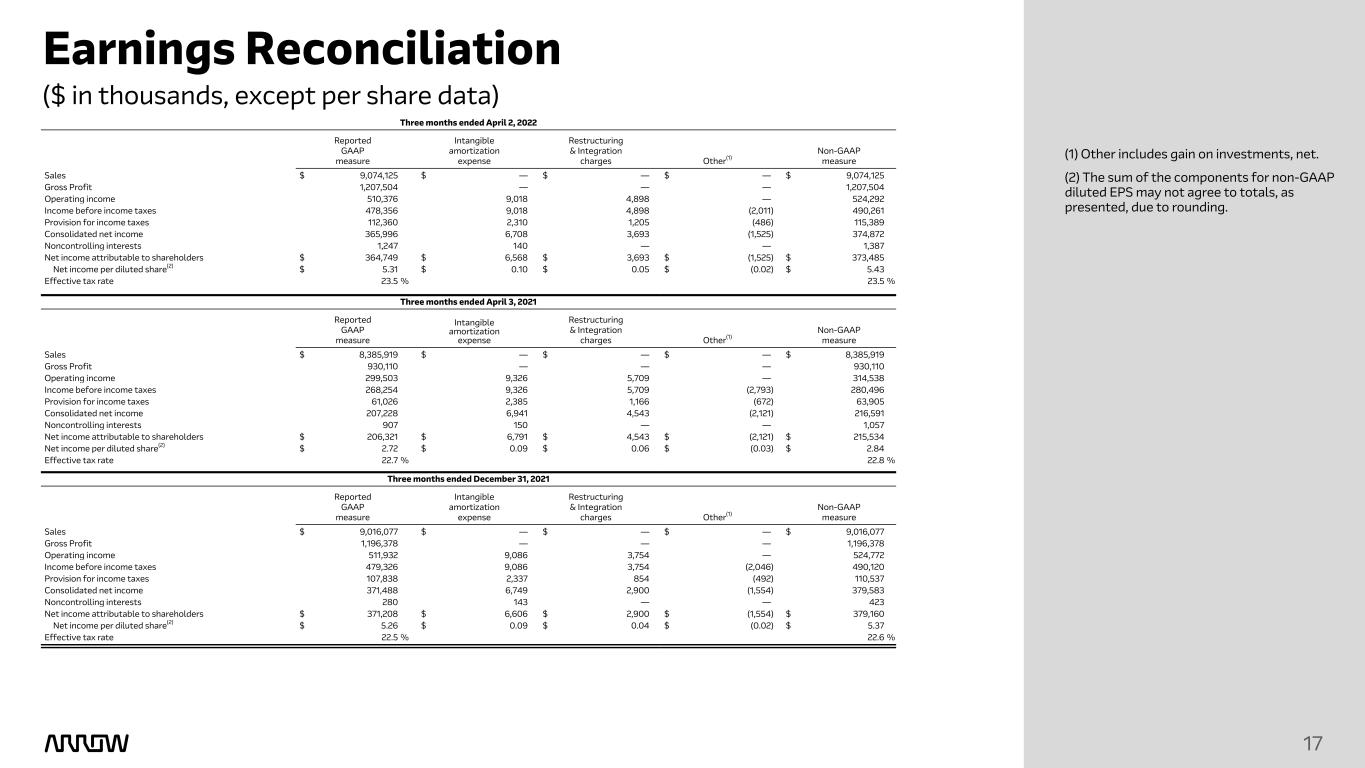
($ in thousands, except per share data) Earnings Reconciliation (1) Other includes gain on investments, net. (2) The sum of the components for non-GAAP diluted EPS may not agree to totals, as presented, due to rounding. 17 Three months ended April 2, 2022 Reported GAAP measure Intangible amortization expense Restructuring & Integration charges Other(1) Non-GAAP measure Sales $ 9,074,125 $ — $ — $ — $ 9,074,125 Gross Profit 1,207,504 — — — 1,207,504 Operating income 510,376 9,018 4,898 — 524,292 Income before income taxes 478,356 9,018 4,898 (2,011) 490,261 Provision for income taxes 112,360 2,310 1,205 (486) 115,389 Consolidated net income 365,996 6,708 3,693 (1,525) 374,872 Noncontrolling interests 1,247 140 — — 1,387 Net income attributable to shareholders $ 364,749 $ 6,568 $ 3,693 $ (1,525) $ 373,485 Net income per diluted share(2) $ 5.31 $ 0.10 $ 0.05 $ (0.02) $ 5.43 Effective tax rate 23.5 % 23.5 % Three months ended April 3, 2021 Reported GAAP measure Intangible amortization expense Restructuring & Integration charges Other(1) Non-GAAP measure Sales $ 8,385,919 $ — $ — $ — $ 8,385,919 Gross Profit 930,110 — — — 930,110 Operating income 299,503 9,326 5,709 — 314,538 Income before income taxes 268,254 9,326 5,709 (2,793) 280,496 Provision for income taxes 61,026 2,385 1,166 (672) 63,905 Consolidated net income 207,228 6,941 4,543 (2,121) 216,591 Noncontrolling interests 907 150 — — 1,057 Net income attributable to shareholders $ 206,321 $ 6,791 $ 4,543 $ (2,121) $ 215,534 Net income per diluted share(2) $ 2.72 $ 0.09 $ 0.06 $ (0.03) $ 2.84 Effective tax rate 22.7 % 22.8 % Three months ended December 31, 2021 Reported GAAP measure Intangible amortization expense Restructuring & Integration charges Other(1) Non-GAAP measure Sales $ 9,016,077 $ — $ — $ — $ 9,016,077 Gross Profit 1,196,378 — — — 1,196,378 Operating income 511,932 9,086 3,754 — 524,772 Income before income taxes 479,326 9,086 3,754 (2,046) 490,120 Provision for income taxes 107,838 2,337 854 (492) 110,537 Consolidated net income 371,488 6,749 2,900 (1,554) 379,583 Noncontrolling interests 280 143 — — 423 Net income attributable to shareholders $ 371,208 $ 6,606 $ 2,900 $ (1,554) $ 379,160 Net income per diluted share(2) $ 5.26 $ 0.09 $ 0.04 $ (0.02) $ 5.37 Effective tax rate 22.5 % 22.6 %
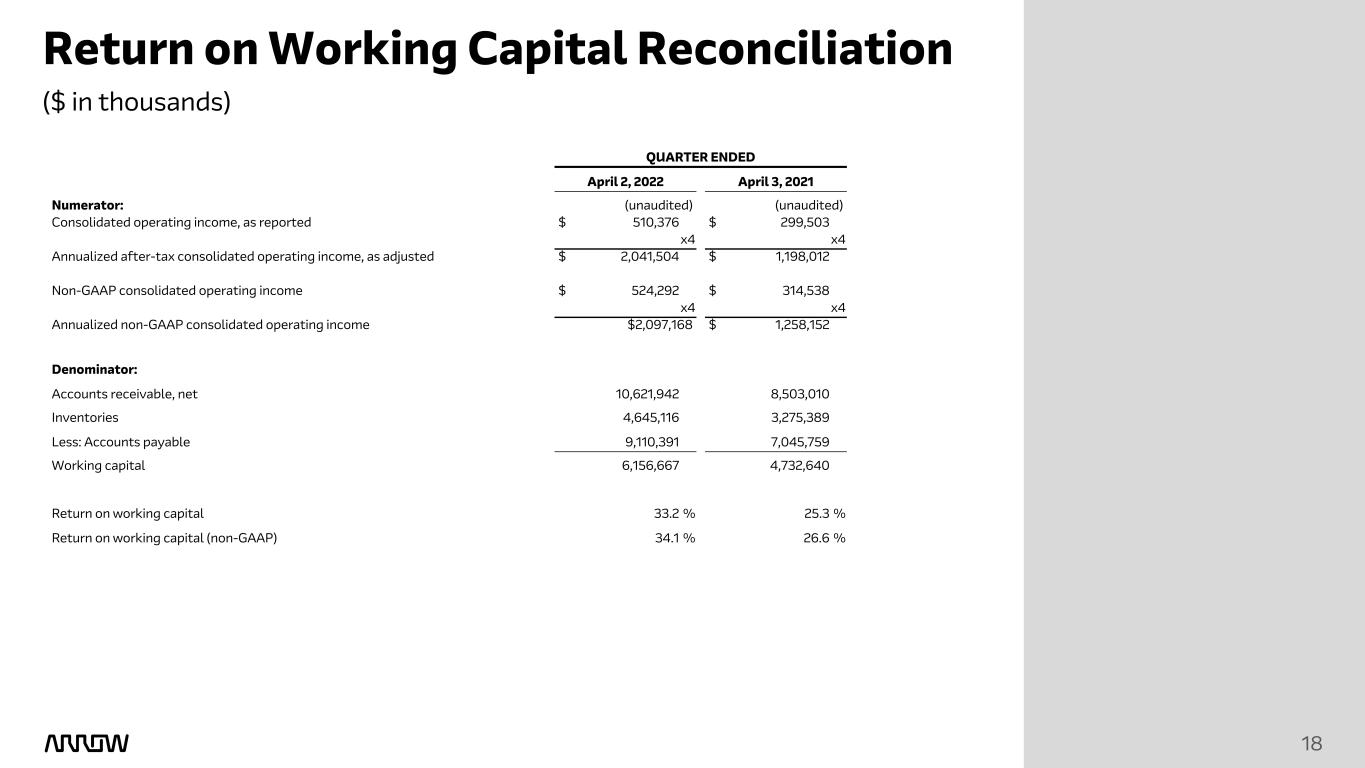
18 18 Return on Working Capital Reconciliation ($ in thousands) QUARTER ENDED April 2, 2022 April 3, 2021 Numerator: (unaudited) (unaudited) Consolidated operating income, as reported $ 510,376 $ 299,503 x4 x4 Annualized after-tax consolidated operating income, as adjusted $ 2,041,504 $ 1,198,012 Non-GAAP consolidated operating income $ 524,292 $ 314,538 x4 x4 Annualized non-GAAP consolidated operating income $2,097,168 $ 1,258,152 Denominator: Accounts receivable, net 10,621,942 8,503,010 Inventories 4,645,116 3,275,389 Less: Accounts payable 9,110,391 7,045,759 Working capital 6,156,667 4,732,640 Return on working capital 33.2 % 25.3 % Return on working capital (non-GAAP) 34.1 % 26.6 %
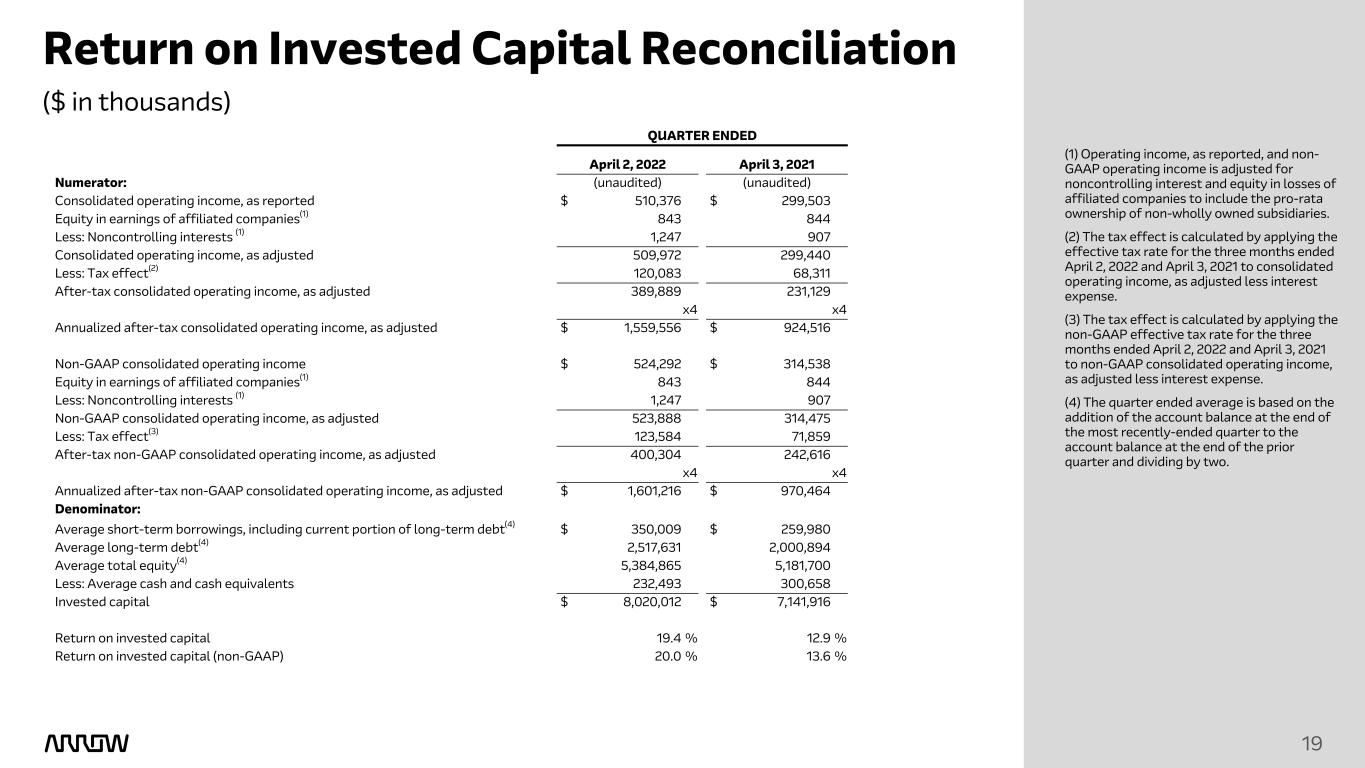
19 19 Return on Invested Capital Reconciliation (1) Operating income, as reported, and non- GAAP operating income is adjusted for noncontrolling interest and equity in losses of affiliated companies to include the pro-rata ownership of non-wholly owned subsidiaries. (2) The tax effect is calculated by applying the effective tax rate for the three months ended April 2, 2022 and April 3, 2021 to consolidated operating income, as adjusted less interest expense. (3) The tax effect is calculated by applying the non-GAAP effective tax rate for the three months ended April 2, 2022 and April 3, 2021 to non-GAAP consolidated operating income, as adjusted less interest expense. (4) The quarter ended average is based on the addition of the account balance at the end of the most recently-ended quarter to the account balance at the end of the prior quarter and dividing by two. ($ in thousands) QUARTER ENDED April 2, 2022 April 3, 2021 Numerator: (unaudited) (unaudited) Consolidated operating income, as reported $ 510,376 $ 299,503 Equity in earnings of affiliated companies(1) 843 844 Less: Noncontrolling interests (1) 1,247 907 Consolidated operating income, as adjusted 509,972 299,440 Less: Tax effect(2) 120,083 68,311 After-tax consolidated operating income, as adjusted 389,889 231,129 x4 x4 Annualized after-tax consolidated operating income, as adjusted $ 1,559,556 $ 924,516 Non-GAAP consolidated operating income $ 524,292 $ 314,538 Equity in earnings of affiliated companies(1) 843 844 Less: Noncontrolling interests (1) 1,247 907 Non-GAAP consolidated operating income, as adjusted 523,888 314,475 Less: Tax effect(3) 123,584 71,859 After-tax non-GAAP consolidated operating income, as adjusted 400,304 242,616 x4 x4 Annualized after-tax non-GAAP consolidated operating income, as adjusted $ 1,601,216 $ 970,464 Denominator: Average short-term borrowings, including current portion of long-term debt(4) $ 350,009 $ 259,980 Average long-term debt(4) 2,517,631 2,000,894 Average total equity(4) 5,384,865 5,181,700 Less: Average cash and cash equivalents 232,493 300,658 Invested capital $ 8,020,012 $ 7,141,916 Return on invested capital 19.4 % 12.9 % Return on invested capital (non-GAAP) 20.0 % 13.6 %
Serious News for Serious Traders! Try StreetInsider.com Premium Free!
You May Also Be Interested In
- Arrow Electronics (ARW) Announces Upcoming Resignation of Board Chair Fabian Garcia
- Mativ Announces Appointment of New Chair of its Board of Directors
- WM Announces First Quarter 2024 Earnings
Create E-mail Alert Related Categories
SEC FilingsSign up for StreetInsider Free!
Receive full access to all new and archived articles, unlimited portfolio tracking, e-mail alerts, custom newswires and RSS feeds - and more!


 Tweet
Tweet Share
Share