Form 8-K ABERCROMBIE & FITCH CO For: May 24
ABERCROMBIE & FITCH CO. REPORTS FIRST QUARTER RESULTS
Delivers highest first quarter net sales since 2014
Operating margin below company expectations on higher-than-expected freight and product costs
Repurchased 3.3 million shares, reducing outstanding share count by 6% from fiscal year-end 2021
New Albany, Ohio, May 24, 2022: Abercrombie & Fitch Co. (NYSE: ANF) today announced results for the first quarter ended April 30, 2022. These compare to results for the first quarter ended May 1, 2021. Descriptions of the use of non-GAAP financial measures and reconciliations of GAAP and non-GAAP financial measures accompany this release.
Fran Horowitz, Chief Executive Officer, said “First quarter net sales exceeded expectations, rising 4% to $813 million, our highest first quarter level since 2014. Results were driven by ongoing strength at the Abercrombie & Fitch brand, where global sales were above plan. Net sales at Hollister were in line with expectations. By region, the U.S. continued to outperform, EMEA net sales returned to positive territory, and APAC was impacted by COVID lockdowns in China. We continued to reduce our promotional activity, contributing to our eighth consecutive quarter of AUR improvement. This was more than offset by higher-than-expected freight and product costs.
Looking forward, we expect higher costs to remain a headwind through at least year-end. We expect freight relief in the fourth quarter as we anniversary increased air usage last year due to the Vietnam shutdown. We will continue to manage expenses tightly and are committed to finding opportunities to offset these costs while protecting strategic investments in marketing, technology and our customer experience, which should drive sustained, long-term sales growth.”
Details related to net income (loss) per diluted share for the first quarter are as follows:
| 2022 | 2021 | |||||||||||||
| GAAP | $ | (0.32) | $ | 0.64 | ||||||||||
Excluded items, net of tax effect (1) | (0.05) | (0.03) | ||||||||||||
| Adjusted non-GAAP | $ | (0.27) | $ | 0.67 | ||||||||||
Impact from changes in foreign currency exchange rates (2) | — | 0.05 | ||||||||||||
| Adjusted non-GAAP constant currency | $ | (0.27) | $ | 0.72 | ||||||||||
(1)Excluded items consist of pre-tax store asset impairment charges.
(2)The estimated impact from foreign currency is calculated by applying current period exchange rates to prior year results using a 26% tax rate.
A summary of results for the first quarter ended April 30, 2022 as compared to the first quarter ended May 1, 2021:
•Net sales of $813 million, up 4% as compared to last year.
•Gross profit rate of 55.3%, down approximately 810 basis points as compared to last year. The year-over-year decline is driven by approximately $80 million of higher freight costs, partially offset by higher average unit retail on lower promotions.
•Operating expense, excluding other operating income, net, was up 5% compared to last year. Approximately half of the increase was due to the lapping of COVID-related rent abatements and payroll credits last year, and the other half due to an increase in marketing and digital fulfillment expenses. Operating expense as a percentage of sales increased to 56.9% from 56.2% last year.
• Operating loss of $10 million and $6 million on a reported and adjusted non-GAAP basis, respectively, as compared to operating income of $57 million and $60 million last year, on a reported and adjusted non-GAAP basis, respectively.
•Net loss per diluted share of $0.32 and $0.27 on a reported and adjusted non-GAAP basis, respectively, as compared to net income per diluted share last year of $0.64 and $0.67 on a reported and adjusted non-GAAP basis, respectively
1
| Net Sales | ||
Net sales by brand and region for the first quarter are as follows:
| (in thousands) | 2022 | 2021 | 1 YR % Change | ||||||||||||||
| Net sales by brand: | |||||||||||||||||
Hollister (1) | $ | 428,834 | $ | 442,408 | (3)% | ||||||||||||
Abercrombie (2) | 383,928 | 338,997 | 13% | ||||||||||||||
| Total company | $ | 812,762 | $ | 781,405 | 4% | ||||||||||||
Net sales by region: (3) | 2022 | 2021 | 1 YR % Change | ||||||||||||||
| United States | $ | 585,106 | $ | 553,846 | 6% | ||||||||||||
| EMEA | 163,969 | 159,002 | 3% | ||||||||||||||
| APAC | 29,897 | 46,046 | (35)% | ||||||||||||||
Other (4) | 33,790 | 22,511 | 50% | ||||||||||||||
| International | $ | 227,656 | $ | 227,559 | 0% | ||||||||||||
| Total company | $ | 812,762 | $ | 781,405 | 4% | ||||||||||||
(1) Hollister includes the Hollister, Gilly Hicks and Social Tourist brands.
(2) Abercrombie includes the Abercrombie & Fitch and abercrombie kids brands.
(3) Net sales by geographic area are presented by attributing revenues to an individual country on the basis of the country in which the merchandise was sold for in-store purchases and on the basis of the shipping location provided by customers for digital orders.
(4) Other includes all sales that do not fall within the United States, EMEA, or APAC regions.
| Financial Position and Liquidity | ||
As of April 30, 2022 the company had:
•Cash and equivalents of $468 million. This compares to cash and equivalents of $823 million and $909 million as of January 29, 2022 and May 1, 2021, respectively.
•Inventories of $563 million, an increase of approximately 45% over last year due to increased in-transit inventory, higher units on hand, and increased average unit costs driven by freight compared to May 1, 2021.
•Long-term gross borrowings under the company’s senior secured notes of $308 million (the “Senior Secured Notes”) which mature in July 2025 and bear interest at a rate of 8.75% per annum.
•Borrowing available under the senior-secured asset-based revolving credit facility (the “ABL Facility”) of $314 million.
•Liquidity, comprised of cash and equivalents and borrowing available under the ABL Facility, of approximately $0.8 billion. This compares to liquidity of $1.1 billion and $1.1 billion as of January 29, 2022 and May 1, 2021, respectively.
Cash Flow and Capital Allocation | ||
Details related to the company’s cash flows for the year-to-date period ended April 30, 2022 are as follows:
•Net cash used for operating activities of $218 million.
•Net cash used for investing activities of $19 million.
•Net cash used for financing activities of $117 million.
In the quarter, the company returned approximately $100 million to shareholders through the repurchase of approximately 3.3 million shares. The company has $258 million remaining on the share repurchase authorization established in November 2021.
Depreciation and amortization was $34 million for the year-to-date period ended April 30, 2022.
| Fiscal 2022 Full Year Outlook | ||
To more closely align with industry practices, and the company’s plans to flex operating expenses in response to volatility in freight and other costs, beginning this quarter, the company will no longer provide a full year outlook on gross profit rate or operating expense. The following outlook replaces all previous full year guidance. For fiscal 2022, the company now expects:
•Net sales to be flat to up 2% from $3.7 billion in 2021, down from previous outlook of up 2 to 4% driven by a combined 200 basis point adverse impact from foreign currency and an assumed inflationary impact on consumer demand, partially offset by higher-than-expected sales in Q1.
•Operating margin in the range of 5 to 6%, down from previous outlook of 7 to 8% reflecting a combined 200 basis point adverse impact from higher freight and raw material costs, foreign currency, and lower sales due to an assumed inflationary impact on consumer. Mitigating these factors will be actions to drive AUR growth, reduce certain expenses, and adjust inventory flows by region in response to current market forces.
•Effective tax rate to be in the mid-30s.
•Capital expenditures of approximately $150 million.
2
| Fiscal 2022 Second Quarter Outlook | ||
•Net sales to be down low-single-digits to fiscal second quarter 2021 level of $865 million, reflecting a combined, estimated adverse impact of approximately 300 basis points from foreign currency and COVID-related lockdowns in China and approximately 300 basis points due to an assumed impact of inflationary impact on consumer demand.
•Operating margin in the range of 3 to 4% with the year-over-year decline driven by higher freight and raw material costs.
•Effective tax rate to be in the mid-to-high 30s.
| Conference Call | ||
Today at 8:30 AM, ET, the company will conduct a conference call and provide additional details around its quarterly results and its outlook for the second quarter. To listen to the conference call, dial (800) 458-4121 or go to corporate.abercrombie.com. The international call-in number is (323) 794-2093. This call will be recorded and made available by dialing the replay number (888) 203-1112 or the international number (719) 457-0820 followed by the conference ID number 5209585 or through corporate.abercrombie.com. A presentation of first quarter results will be available in the “Investors” section at corporate.abercrombie.com at approximately 7:30 AM, ET, today.
| Safe Harbor Statement Under the Private Securities Litigation Reform Act of 1995 | ||
A&F cautions that any forward-looking statements (as such term is defined in the Private Securities Litigation Reform Act of 1995) contained in this Press Release or made by management or spokespeople of A&F involve risks and uncertainties and are subject to change based on various important factors, many of which may be beyond the company’s control. Words such as “estimate,” “project,” “plan,” “believe,” “expect,” “anticipate,” “intend,” “should,” “are confident,” and similar expressions may identify forward-looking statements. Except as may be required by applicable law, we undertake no obligation to publicly update or revise any forward-looking statements. The following factors, in addition to those disclosed in “ITEM 1A. RISK FACTORS” of A&F’s Annual Report on Form 10-K for the fiscal year ended January 29, 2022, in some cases have affected, and in the future could affect, A&F’s financial performance and could cause actual results for fiscal 2022 and beyond to differ materially from those expressed or implied in any of the forward-looking statements included in this Press Release or otherwise made by management: COVID‐19 has and may continue to materially adversely impact and cause disruption to our business; changes in global economic and financial conditions, and the resulting impact on consumer confidence and consumer spending, as well as other changes in consumer discretionary spending habits could have a material adverse impact on our business; failure to engage our customers, anticipate customer demand and changing fashion trends, and manage our inventory commensurately could have a material adverse impact on our business; our failure to operate effectively in a highly competitive and constantly evolving industry could have a material adverse impact on our business; fluctuations in foreign currency exchange rates could have a material adverse impact on our business; recent inflationary pressures and global supply chain constraints could continue to affect freight and other costs and could have a material adverse impact on our business; our ability to attract customers to our stores depends, in part, on the success of the shopping malls or area attractions that our stores are located in or around; the impact of geopolitical conflict, including the on-going hostilities in Ukraine, acts of terrorism, mass casualty events, social unrest, civil disturbance or disobedience could have a material adverse impact on our business; the impact of extreme weather, infectious disease outbreaks, including COVID-19, and other unexpected events could result in an interruption to our business, as well as to the operations of our third-party partners, and have a material adverse impact on our business; failure to successfully develop an omnichannel shopping experience, a significant component of our growth strategy, or failure to successfully invest in customer, digital and omnichannel initiatives could have a material adverse impact on our business; our failure to optimize our global store network could have a material adverse impact on our business; our failure to execute our international growth strategy successfully and inability to conduct business in international markets as a result of legal, tax, regulatory, political and economic risks could have a material adverse impact on our business; our failure to appropriately address emerging environmental, social and governance (“ESG”) matters, including the perceived adequacy of our responses to new laws and regulations relating to ESG, could have a material adverse impact on our reputation and, as a result, our business; failure to protect our reputation could have a material adverse impact on our business; if our information technology systems are disrupted or cease to operate effectively, it could have a material adverse impact on our business; we may be exposed to risks and costs associated with cyber-attacks, state-sponsored cyberthreats, data protection, credit card fraud and identity theft that could have a material adverse impact on our business; our reliance on our distribution centers makes us susceptible to disruptions or adverse conditions affecting our supply chain; Trade relations and changes in the cost, availability and quality of raw materials, labor, and transportation could have a material adverse impact on our business; we depend upon independent third parties for the manufacture and delivery of all our merchandise, and a disruption of the manufacture or delivery of our merchandise could have a material adverse impact on our business; we rely on the experience and skills of our executive officers and associates, and the failure to attract or retain this talent, effectively manage succession, and establish a diverse workforce could have a material adverse impact on our business; in the past, we have identified a material weakness in our internal control over financial reporting and may identify additional material weaknesses in the future. If we fail to establish and maintain effective internal control over financial reporting, our ability to accurately and timely report our financial results could be adversely affected; fluctuations in our tax obligations and effective tax rate may result in volatility in our results of operations could have a material adverse impact on our business; our litigation exposure, or any securities litigation and any potential stockholder activism, could have a material adverse impact on our business; failure to adequately protect our trademarks could have a negative impact on our brand image and limit our ability to penetrate new markets which could have a material adverse
3
impact on our business; changes in the regulatory or compliance landscape could have a material adverse impact on our business; and the agreements related to our senior secured asset-based revolving credit facility and our senior secured notes include restrictive covenants that limit our flexibility in operating our business and our inability to obtain credit on reasonable terms in the future could have an adverse impact on our business.
| Other Information | ||
This document includes certain adjusted non-GAAP financial measures where management believes it to be helpful in understanding the Company's results of operations or financial position. Additional details about non-GAAP financial measures and a reconciliation of GAAP financial measures to non-GAAP financial measures can be found in the "Reporting and Use of GAAP and Non-GAAP Measures" section. As used in the presentation, "Hollister" refers to the company's Hollister, Gilly Hicks, and Social Tourist brands and "Abercrombie" refers to the company's Abercrombie & Fitch and abercrombie kids brands. Sub-totals and totals may not foot due to rounding. Net income (loss) and net income (loss) per share financial measures included herein are attributable to Abercrombie & Fitch Co., excluding net income attributable to noncontrolling interests.
| About Abercrombie & Fitch Co. | ||
Abercrombie & Fitch Co. (NYSE: ANF) is a leading, global, omnichannel specialty retailer of apparel and accessories for men, women and kids through five renowned brands. The iconic Abercrombie & Fitch brand was born in 1892 and aims to make every day feel as exceptional as the start of a long weekend. abercrombie kids sees the world through kids’ eyes, where play is life and every day is an opportunity to be anything and better anything. The Hollister brand believes in liberating the spirit of an endless summer inside everyone and making teens feel celebrated and comfortable in their own skin. Gilly Hicks, offering intimates, loungewear and sleepwear, is designed to give all Gen Z customers their daily dose of happy. Social Tourist, the creative vision of Hollister and social media personalities, Dixie and Charli D’Amelio, offers trend forward apparel that allows teens to experiment with their style, while exploring the duality of who they are both on social media and in real life.
The brands share a commitment to offering products of enduring quality and exceptional comfort that allow consumers around the world to express their own individuality and style. Abercrombie & Fitch Co. operates approximately 730 stores under these brands across North America, Europe, Asia and the Middle East, as well as the e-commerce sites www.abercrombie.com, www.abercrombiekids.com, www.hollisterco.com, www.gillyhicks.com and www.socialtourist.com.
| Investor Contact: | Media Contact: | |||||||
| Pamela Quintiliano | Mackenzie Gusweiler | |||||||
| Abercrombie & Fitch Co. | Abercrombie & Fitch Co. | |||||||
| (614) 283-6751 | (614) 283-6192 | |||||||
| Investor_Relations@anfcorp.com | Public_Relations@anfcorp.com | |||||||
4
| Abercrombie & Fitch Co. | |||||||||||||||||||||||
| Condensed Consolidated Statements of Operations | |||||||||||||||||||||||
| (in thousands, except per share data) | |||||||||||||||||||||||
| (Unaudited) | |||||||||||||||||||||||
| Thirteen Weeks Ended | Thirteen Weeks Ended | ||||||||||||||||||||||
| April 30, 2022 | % of Net Sales | May 1, 2021 | % of Net Sales | ||||||||||||||||||||
| Net sales | $ | 812,762 | 100.0 | % | $ | 781,405 | 100.0 | % | |||||||||||||||
| Cost of sales, exclusive of depreciation and amortization | 363,216 | 44.7 | % | 286,271 | 36.6 | % | |||||||||||||||||
| Gross profit | 449,546 | 55.3 | % | 495,134 | 63.4 | % | |||||||||||||||||
| Stores and distribution expense | 337,543 | 41.5 | % | 316,608 | 40.5 | % | |||||||||||||||||
| Marketing, general and administrative expense | 122,149 | 15.0 | % | 120,947 | 15.5 | % | |||||||||||||||||
| Flagship store exit benefits | — | 0.0 | % | (1,100) | (0.1) | % | |||||||||||||||||
| Asset impairment | 3,422 | 0.4 | % | 2,664 | 0.3 | % | |||||||||||||||||
| Other operating income, net | (3,842) | (0.5) | % | (1,418) | (0.2) | % | |||||||||||||||||
| Operating (loss) income | (9,726) | (1.2) | % | 57,433 | 7.3 | % | |||||||||||||||||
| Other expense, net | 7,307 | 0.9 | % | 8,606 | 1.1 | % | |||||||||||||||||
| (Loss) income before income taxes | (17,033) | (2.1) | % | 48,827 | 6.2 | % | |||||||||||||||||
| Income tax (benefit) expense | (2,187) | (0.3) | % | 6,121 | 0.8 | % | |||||||||||||||||
| Net (loss) income | (14,846) | (1.8) | % | 42,706 | 5.5 | % | |||||||||||||||||
| Less: Net income attributable to noncontrolling interests | 1,623 | 0.2 | % | 938 | 0.1 | % | |||||||||||||||||
| Net (loss) income attributable to A&F | $ | (16,469) | (2.0) | % | $ | 41,768 | 5.3 | % | |||||||||||||||
| Net (loss) income per share attributable to A&F | |||||||||||||||||||||||
| Basic | $ | (0.32) | $ | 0.67 | |||||||||||||||||||
| Diluted | $ | (0.32) | $ | 0.64 | |||||||||||||||||||
| Weighted-average shares outstanding: | |||||||||||||||||||||||
| Basic | 52,077 | 62,380 | |||||||||||||||||||||
| Diluted | 52,077 | 65,305 | |||||||||||||||||||||
5
Reporting and Use of GAAP and Non-GAAP Measures
The company believes that each of the non-GAAP financial measures presented are useful to investors as they provide a measure of the company’s operating performance excluding the effect of certain items which the company believes do not reflect its future operating outlook, such as asset impairment charges, therefore supplementing investors’ understanding of comparability of operations across periods. Management used these non-GAAP financial measures during the periods presented to assess the company’s performance and to develop expectations for future operating performance. Non-GAAP financial measures should be used supplemental to, and not as an alternative to, the company’s GAAP financial results, and may not be calculated in the same manner as similar measures presented by other companies.
In addition, at times the company provides comparable sales, defined as the percentage year-over-year change in the aggregate of: (1) sales for stores that have been open as the same brand at least one year and whose square footage has not been expanded or reduced by more than 20% within the past year, with prior year’s net sales converted at the current year’s foreign currency exchange rate to remove the impact of foreign currency rate fluctuation, and (2) digital net sales with prior year’s net sales converted at the current year’s foreign currency exchange rate to remove the impact of foreign currency rate fluctuation.
The company also provides certain financial information on a constant currency basis to enhance investors’ understanding of underlying business trends and operating performance, by removing the impact of foreign currency exchange rate fluctuations. The effect from foreign currency, calculated on a constant currency basis, is determined by applying current year average exchange rates to prior year results and is net of the year-over-year impact from hedging. The per diluted share effect from foreign currency is calculated using a 26% tax rate.
| Abercrombie & Fitch Co. | |||||||||||||||||
| Schedule of Non-GAAP Financial Measures | |||||||||||||||||
| Thirteen Weeks Ended April 30, 2022 | |||||||||||||||||
| (in thousands, except per share data) | |||||||||||||||||
| (Unaudited) | |||||||||||||||||
GAAP (1) | Excluded items | Adjusted non-GAAP | |||||||||||||||
Asset impairment, exclusive of flagship store exit charges (2) | $ | 3,422 | $ | 3,422 | $ | — | |||||||||||
| Operating loss | (9,726) | (3,422) | (6,304) | ||||||||||||||
| Loss before income taxes | (17,033) | (3,422) | (13,611) | ||||||||||||||
Income tax benefit (3) | (2,187) | (918) | (1,269) | ||||||||||||||
| Net loss attributable to Abercrombie & Fitch Co. | $ | (16,469) | $ | (2,504) | $ | (13,965) | |||||||||||
| Net loss per diluted share attributable to Abercrombie & Fitch Co. | $ | (0.32) | $ | (0.05) | $ | (0.27) | |||||||||||
| Diluted weighted-average shares outstanding: | 52,077 | 52,077 | |||||||||||||||
(1) “GAAP” refers to accounting principles generally accepted in the United States of America.
(2) Excluded items consist of pre-tax store asset impairment charges of $3.4 million.
(3) The tax effect of excluded items is the difference between the tax provision calculated on a GAAP basis and an adjusted non-GAAP basis.
6
| Abercrombie & Fitch Co. | |||||||||||||||||
| Schedule of Non-GAAP Financial Measures | |||||||||||||||||
| Thirteen Weeks Ended May 1, 2021 | |||||||||||||||||
| (in thousands, except per share data) | |||||||||||||||||
| (Unaudited) | |||||||||||||||||
GAAP (1) | Excluded items | Adjusted non-GAAP | |||||||||||||||
Asset impairment, exclusive of flagship store exit charges (2) | $ | 2,664 | $ | 2,664 | $ | — | |||||||||||
| Operating income | 57,433 | (2,664) | 60,097 | ||||||||||||||
| Income before income taxes | 48,827 | (2,664) | 51,491 | ||||||||||||||
Income tax expense (3) | 6,121 | (449) | 6,570 | ||||||||||||||
| Net income attributable to Abercrombie & Fitch Co. | $ | 41,768 | $ | (2,215) | $ | 43,983 | |||||||||||
| Net income per diluted share attributable to Abercrombie & Fitch Co. | $ | 0.64 | $ | (0.03) | $ | 0.67 | |||||||||||
| Diluted weighted-average shares outstanding: | 65,305 | 65,305 | |||||||||||||||
(1) “GAAP” refers to accounting principles generally accepted in the United States of America.
(2) Excluded items consist of pre-tax store asset impairment charges of $2.7 million.
(3) The tax effect of excluded items is the difference between the tax provision calculated on a GAAP basis and an adjusted non-GAAP basis.
7
| Abercrombie & Fitch Co. | |||||||||||||||||
| Reconciliation of Constant Currency Financial Measures | |||||||||||||||||
| Thirteen Weeks Ended April 30, 2022 | |||||||||||||||||
| (in thousands, except percentage and basis point changes and per share data) | |||||||||||||||||
| (Unaudited) | |||||||||||||||||
| 2022 | 2021 | % Change | |||||||||||||||
| Net sales | |||||||||||||||||
GAAP (1) | $ | 812,762 | $ | 781,405 | 4% | ||||||||||||
Impact from changes in foreign currency exchange rates (2) | — | (8,529) | 1% | ||||||||||||||
| Net sales on a constant currency basis | $ | 812,762 | $ | 772,876 | 5% | ||||||||||||
| Gross profit | 2022 | 2021 | BPS Change (3) | ||||||||||||||
GAAP (1) | $ | 449,546 | $ | 495,134 | (810) | ||||||||||||
Impact from changes in foreign currency exchange rates (2) | — | (3,283) | (20) | ||||||||||||||
| Gross profit on a constant currency basis | $ | 449,546 | $ | 491,851 | (830) | ||||||||||||
| Operating (loss) income | 2022 | 2021 | BPS Change (3) | ||||||||||||||
GAAP (1) | $ | (9,726) | $ | 57,433 | (850) | ||||||||||||
Excluded items (4) | (3,422) | (2,664) | (10) | ||||||||||||||
| Adjusted non-GAAP | $ | (6,304) | $ | 60,097 | (860) | ||||||||||||
Impact from changes in foreign currency exchange rates (2) | — | 4,341 | (50) | ||||||||||||||
| Adjusted non-GAAP constant currency basis | $ | (6,304) | $ | 64,438 | (910) | ||||||||||||
| Net income (loss) per diluted share attributable to Abercrombie & Fitch Co. | 2022 | 2021 | $ Change | ||||||||||||||
GAAP (1) | $ | (0.32) | $ | 0.64 | $(0.96) | ||||||||||||
Excluded items, net of tax (4) | (0.05) | (0.03) | (0.02) | ||||||||||||||
| Adjusted non-GAAP | $ | (0.27) | $ | 0.67 | $(0.94) | ||||||||||||
Impact from changes in foreign currency exchange rates (2) | — | 0.05 | (0.05) | ||||||||||||||
| Adjusted non-GAAP constant currency basis | $ | (0.27) | $ | 0.72 | $(0.99) | ||||||||||||
(1) “GAAP” refers to accounting principles generally accepted in the United States of America.
(2) The estimated impact from foreign currency is determined by applying current period exchange rates to prior year results and is net of the year-over-year impact from hedging. The per diluted share estimated impact from foreign currency is calculated using a 26% tax rate.
(3) The estimated basis point change has been rounded based on the percentage change.
(4) Excluded items consist of pre-tax store asset impairment charges of $3.4 million and $2.7 million for the current year and prior year, respectively.
8
| Abercrombie & Fitch Co. | |||||||||||||||||
| Condensed Consolidated Balance Sheets | |||||||||||||||||
| (in thousands) | |||||||||||||||||
| (Unaudited) | |||||||||||||||||
| April 30, 2022 | January 29, 2022 | May 1, 2021 | |||||||||||||||
| Assets | |||||||||||||||||
| Current assets: | |||||||||||||||||
| Cash and equivalents | $ | 468,378 | $ | 823,139 | $ | 909,008 | |||||||||||
| Receivables | 88,807 | 69,102 | 107,821 | ||||||||||||||
| Inventories | 562,510 | 525,864 | 388,633 | ||||||||||||||
| Other current assets | 93,179 | 89,654 | 78,727 | ||||||||||||||
| Total current assets | 1,212,874 | 1,507,759 | 1,484,189 | ||||||||||||||
| Property and equipment, net | 497,976 | 508,336 | 533,773 | ||||||||||||||
| Operating lease right-of-use assets | 671,991 | 698,231 | 839,003 | ||||||||||||||
| Other assets | 224,462 | 225,165 | 213,585 | ||||||||||||||
| Total assets | $ | 2,607,303 | $ | 2,939,491 | $ | 3,070,550 | |||||||||||
| Liabilities and stockholders’ equity | |||||||||||||||||
| Current liabilities: | |||||||||||||||||
| Accounts payable | $ | 311,352 | $ | 374,829 | $ | 236,667 | |||||||||||
| Accrued expenses | 320,681 | 395,815 | 321,906 | ||||||||||||||
| Short-term portion of operating lease liabilities | 195,599 | 222,823 | 231,750 | ||||||||||||||
| Income taxes payable | 25,400 | 21,773 | 26,672 | ||||||||||||||
| Total current liabilities | 853,032 | 1,015,240 | 816,995 | ||||||||||||||
| Long-term liabilities: | |||||||||||||||||
| Long-term portion of operating lease liabilities | $ | 662,322 | $ | 697,264 | $ | 844,401 | |||||||||||
| Long-term borrowings, net | 303,901 | 303,574 | 344,278 | ||||||||||||||
| Other liabilities | 83,243 | 86,089 | 114,926 | ||||||||||||||
| Total long-term liabilities | 1,049,466 | 1,086,927 | 1,303,605 | ||||||||||||||
| Total Abercrombie & Fitch Co. stockholders’ equity | 695,361 | 826,090 | 941,174 | ||||||||||||||
| Noncontrolling interests | 9,444 | 11,234 | 8,776 | ||||||||||||||
| Total stockholders’ equity | 704,805 | 837,324 | 949,950 | ||||||||||||||
| Total liabilities and stockholders’ equity | $ | 2,607,303 | $ | 2,939,491 | $ | 3,070,550 | |||||||||||
9
| Abercrombie & Fitch Co. | |||||||||||
| Condensed Consolidated Statements of Cash Flows | |||||||||||
| (in thousands, except per share data) | |||||||||||
| (Unaudited) | |||||||||||
| Thirteen Weeks Ended | |||||||||||
| April 30, 2022 | May 1, 2021 | ||||||||||
| Operating activities | |||||||||||
| Net cash used for operating activities | $ | (217,787) | $ | (131,350) | |||||||
| Investing activities | |||||||||||
| Purchases of property and equipment | $ | (26,292) | $ | (14,404) | |||||||
| Proceeds from sale of property and equipment | 7,751 | — | |||||||||
| Net cash used for investing activities | $ | (18,541) | $ | (14,404) | |||||||
| Financing activities | |||||||||||
| Payment of debt issuance or modification costs and fees | — | (1,490) | |||||||||
| Purchases of common stock | (100,000) | (35,249) | |||||||||
| Other financing activities | (16,945) | (16,452) | |||||||||
| Net cash used for financing activities | $ | (116,945) | $ | (53,191) | |||||||
| Effect of foreign currency exchange rates on cash | $ | (2,617) | $ | (1,021) | |||||||
| Net decrease in cash and equivalents, and restricted cash and equivalents | $ | (355,890) | $ | (199,966) | |||||||
| Cash and equivalents, and restricted cash and equivalents, beginning of period | $ | 834,368 | $ | 1,124,157 | |||||||
| Cash and equivalents, and restricted cash and equivalents, end of period | $ | 478,478 | $ | 924,191 | |||||||
10
Abercrombie & Fitch Co.
Store Count
| Thirteen Weeks Ended April 30, 2022 | |||||||||||||||||||||||||||||||||||||||||
Hollister (1) | Abercrombie (2) | Total Company (3) | |||||||||||||||||||||||||||||||||||||||
| United States | International | United States | International | United States | International | Total | |||||||||||||||||||||||||||||||||||
| January 29, 2022 | 351 | 154 | 173 | 51 | 524 | 205 | 729 | ||||||||||||||||||||||||||||||||||
| New | 1 | 2 | 1 | — | 2 | 2 | 4 | ||||||||||||||||||||||||||||||||||
| Permanently closed | — | — | (3) | (2) | (3) | (2) | (5) | ||||||||||||||||||||||||||||||||||
| April 30, 2022 | 352 | 156 | 171 | 49 | 523 | 205 | 728 | ||||||||||||||||||||||||||||||||||
(1)Hollister includes the company’s Hollister and Gilly Hicks brands. Locations with Gilly Hicks carveouts within Hollister stores are represented as a single store count. Excludes 9 international franchise stores as of April 30, 2022, and January 29, 2022. Excludes 13 Company-operated temporary stores as of April 30, 2022 and 14 Company-operated temporary stores January 29, 2022.
(2)Abercrombie includes the company's Abercrombie & Fitch and abercrombie kids brands. Locations with abercrombie kids carveouts within Abercrombie & Fitch stores are represented as a single store count. Excludes 14 international franchise stores as of April 30, 2022 and January 29, 2022. Excludes 5 Company-operated temporary stores as of each of April 30, 2022 and January 29, 2022.
(3)This store count excludes one international third-party operated multi-brand outlet store as of each of April 30, 2022, January 29, 2022, and January 29, 2022.
11
| Abercrombie & Fitch Co. | ||||||||||||||||||||||||||||||||||||||||||||||||||||||||||||||
| Financial Information | ||||||||||||||||||||||||||||||||||||||||||||||||||||||||||||||
| (Unaudited) | ||||||||||||||||||||||||||||||||||||||||||||||||||||||||||||||
| (in thousands, except per share data, store data, and comparable sales data) | ||||||||||||||||||||||||||||||||||||||||||||||||||||||||||||||
| Fiscal 2021 | Fiscal 2022 | |||||||||||||||||||||||||||||||||||||||||||||||||||||||||||||
| 2018 | 2019 | 2020 | Q1 | Q2 | Q3 | Q4 | 2021 | Q1 | 2022 | |||||||||||||||||||||||||||||||||||||||||||||||||||||
| Net sales | $ | 3,590,109 | $ | 3,623,073 | $ | 3,125,384 | $ | 781,405 | $ | 864,850 | $ | 905,160 | $ | 1,161,353 | $ | 3,712,768 | $ | 812,762 | $ | 812,762 | ||||||||||||||||||||||||||||||||||||||||||
| Cost of sales, exclusive of depreciation and amortization | 1,430,193 | 1,472,155 | 1,234,179 | 286,271 | 301,365 | 328,916 | 484,221 | 1,400,773 | 363,216 | 363,216 | ||||||||||||||||||||||||||||||||||||||||||||||||||||
| Gross profit | 2,159,916 | 2,150,918 | 1,891,205 | 495,134 | 563,485 | 576,244 | 677,132 | 2,311,995 | 449,546 | 449,546 | ||||||||||||||||||||||||||||||||||||||||||||||||||||
| Stores and distribution expense | 1,536,216 | 1,551,243 | 1,391,584 | 316,608 | 325,935 | 351,804 | 435,129 | 1,429,476 | 337,543 | 337,543 | ||||||||||||||||||||||||||||||||||||||||||||||||||||
| Marketing, general and administrative expense | 484,863 | 464,615 | 463,843 | 120,947 | 123,913 | 146,269 | 145,686 | 536,815 | 122,149 | 122,149 | ||||||||||||||||||||||||||||||||||||||||||||||||||||
| Flagship store exit charges (benefits) | 5,806 | 47,257 | (11,636) | (1,100) | (88) | 11 | 24 | (1,153) | — | — | ||||||||||||||||||||||||||||||||||||||||||||||||||||
| Asset impairment, exclusive of flagship store exit charges | 11,580 | 19,135 | 72,937 | 2,664 | 786 | 6,749 | 1,901 | 12,100 | 3,422 | 3,422 | ||||||||||||||||||||||||||||||||||||||||||||||||||||
| Other operating (income) loss, net | (5,915) | (1,400) | (5,054) | (1,418) | (1,848) | (1,320) | (3,741) | (8,327) | (3,842) | (3,842) | ||||||||||||||||||||||||||||||||||||||||||||||||||||
| Operating income (loss) | 127,366 | 70,068 | (20,469) | 57,433 | 114,787 | 72,731 | 98,133 | 343,084 | (9,726) | (9,726) | ||||||||||||||||||||||||||||||||||||||||||||||||||||
| Interest expense, net | 10,999 | 7,737 | 28,274 | 8,606 | 11,275 | 7,270 | 6,959 | 34,110 | 7,307 | 7,307 | ||||||||||||||||||||||||||||||||||||||||||||||||||||
| Income (loss) before income taxes | 116,367 | 62,331 | (48,743) | 48,827 | 103,512 | 65,461 | 91,174 | 308,974 | (17,033) | (17,033) | ||||||||||||||||||||||||||||||||||||||||||||||||||||
| Income tax expense (benefit) | 37,559 | 17,371 | 60,211 | 6,121 | (6,944) | 16,383 | 23,348 | 38,908 | (2,187) | (2,187) | ||||||||||||||||||||||||||||||||||||||||||||||||||||
| Net income (loss) | 78,808 | 44,960 | (108,654) | 42,706 | 110,456 | 49,078 | 67,826 | 270,066 | (14,846) | (14,846) | ||||||||||||||||||||||||||||||||||||||||||||||||||||
| Less: Net income attributable to noncontrolling interests | 4,267 | 5,602 | 5,067 | 938 | 1,956 | 1,845 | 2,317 | 7,056 | 1,623 | 1,623 | ||||||||||||||||||||||||||||||||||||||||||||||||||||
| Net income (loss) attributable to Abercrombie & Fitch Co. | $ | 74,541 | $ | 39,358 | $ | (114,021) | $ | 41,768 | $ | 108,500 | $ | 47,233 | $ | 65,509 | $ | 263,010 | $ | (16,469) | $ | (16,469) | ||||||||||||||||||||||||||||||||||||||||||
1
| Fiscal 2021 | Fiscal 2022 | |||||||||||||||||||||||||||||||||||||||||||||||||||||||||||||
| 2018 | 2019 | 2020 | Q1 | Q2 | Q3 | Q4 | 2021 | Q1 | 2022 | |||||||||||||||||||||||||||||||||||||||||||||||||||||
| Net income (loss) per share attributable to Abercrombie & Fitch Co.: | ||||||||||||||||||||||||||||||||||||||||||||||||||||||||||||||
| Basic | $ | 1.11 | $ | 0.61 | $ | (1.82) | $ | 0.67 | $ | 1.77 | $ | 0.80 | $ | 1.18 | $ | 4.41 | $ | (0.32) | $ | (0.32) | ||||||||||||||||||||||||||||||||||||||||||
| Diluted | $ | 1.08 | $ | 0.60 | $ | (1.82) | $ | 0.64 | $ | 1.69 | $ | 0.77 | $ | 1.12 | $ | 4.20 | $ | (0.32) | $ | (0.32) | ||||||||||||||||||||||||||||||||||||||||||
| Weighted-average shares outstanding: | ||||||||||||||||||||||||||||||||||||||||||||||||||||||||||||||
| Basic | 67,350 | 64,428 | 62,551 | 62,380 | 61,428 | 58,796 | 55,740 | 59,597 | 52,077 | 52,077 | ||||||||||||||||||||||||||||||||||||||||||||||||||||
| Diluted | 69,137 | 65,778 | 62,551 | 65,305 | 64,136 | 61,465 | 58,700 | 62,636 | 52,077 | 52,077 | ||||||||||||||||||||||||||||||||||||||||||||||||||||
Hollister comparable sales (1) (2) | 5 | % | (1) | % | Not provided | Not provided | Not provided | Not provided | Not provided | Not provided | Not provided | Not provided | ||||||||||||||||||||||||||||||||||||||||||||||||||
Abercrombie comparable sales (1) (3) | 1 | % | 3 | % | Not provided | Not provided | Not provided | Not provided | Not provided | Not provided | Not provided | Not provided | ||||||||||||||||||||||||||||||||||||||||||||||||||
Comparable sales (1) | 3 | % | 1 | % | Not provided | Not provided | Not provided | Not provided | Not provided | Not provided | Not provided | Not provided | ||||||||||||||||||||||||||||||||||||||||||||||||||
| Shares outstanding | 66,227 | 62,786 | 62,399 | 61,935 | 59,692 | 57,037 | 52,985 | 52,985 | 50,442 | 50,442 | ||||||||||||||||||||||||||||||||||||||||||||||||||||
| Number of stores - end of period | 861 | 857 | 735 | 731 | 733 | 735 | 729 | 729 | 728 | 728 | ||||||||||||||||||||||||||||||||||||||||||||||||||||
| Gross square feet - end of period | 6,566 | 6,314 | 5,232 | 5,189 | 5,150 | 5,159 | 5,052 | 5,052 | 5,029 | 5,029 | ||||||||||||||||||||||||||||||||||||||||||||||||||||
(1) Comparable sales are calculated on a constant currency basis and exclude revenue other than store and online sales. The Company did not provide comparable sales results for fiscal 2020, fiscal 2021 or fiscal 2022 due to temporary store closures as a result of COVID-19. | ||||||||||||||||||||||||||||||||||||||||||||||||||||||||||||||
(2) Hollister includes the Company's Hollister, Gilly Hicks, and Social Tourist brands. | ||||||||||||||||||||||||||||||||||||||||||||||||||||||||||||||
(3) Abercrombie includes the Company's Abercrombie & Fitch and abercrombie kids brands. | ||||||||||||||||||||||||||||||||||||||||||||||||||||||||||||||
2
INVESTOR PRESENTATION: FIRST QUARTER 2022
SAFE HARBOR STATEMENT UNDER THE PRIVATE SECURITIES LITIGATION REFORM ACT OF 1995 A&F cautions that any forward-looking statements (as such term is defined in the Private Securities Litigation Reform Act of 1995) contained in this presentation or made by management or spokespeople of A&F involve risks and uncertainties and are subject to change based on various important factors, many of which may be beyond the company's control. Words such as "estimate," "project," "plan," "believe," "expect," "anticipate," "intend," "should," "are confident," and similar expressions may identify forward-looking statements. Except as may be required by applicable law, we assume no obligation to publicly update or revise our forward-looking statements even if experience or future changes make it clear that any projected results expressed or implied therein will not be realized. The following factors, in addition to those disclosed in "ITEM 1A. RISK FACTORS" of A&F's Annual Report on Form 10-K for the fiscal year ended January 29, 2022, could affect the company's financial performance and could cause actual results to differ materially from those expressed or implied in any of the forward-looking statements included in this presentation or otherwise made by management: the ongoing impact of COVID-19 to our business; changes in global economic and financial conditions and the resulting impact on consumer confidence and consumer spending; failure to anticipate customer demand and changing fashion trends and manage our inventory commensurately; failure to operate effectively in a highly competitive industry; the impact of government sanctions, conflict, war, social unrest, civil disturbance, or disobedience; failure to successfully develop and/or successfully invest in customer, digital, and omnichannel initiatives; failure to appropriately address emerging environmental, social, and governance matters; failure to protect our reputation; cyber- and data privacy-related risks; adverse conditions affecting our supply chain; or ability to attract or retain talent. OTHER INFORMATION The following presentation includes certain adjusted non-GAAP financial measures. Additional details about non-GAAP financial measures and a reconciliation of GAAP financial measures to non-GAAP financial measures is included in the Appendix to this presentation. As used in the presentation, "GAAP" refers to accounting principles generally accepted in the United States of America. References to "Hollister" include the company's Hollister, Gilly Hicks, and Social Tourist brands and references to "Abercrombie" includes the company's Abercrombie & Fitch and abercrombie kids brands. Sub-totals and totals may not foot due to rounding. Net income (loss) and net income (loss) per share financial measures included herein are attributable to Abercrombie & Fitch Co., excluding net income attributable to noncontrolling interests. 2
Safe Harbor and Other Information 2 Company Overview 4 Focus Areas 7 Digital Evolution 10 Global Store Network Optimization 12 Q1 2022 Results 15 Financial Position, Liquidity & Capital Allocation 21 Updated Fiscal 2022 Outlook 27 Appendix 29 TABLE OF CONTENTS
4 COMPANY OVERVIEW
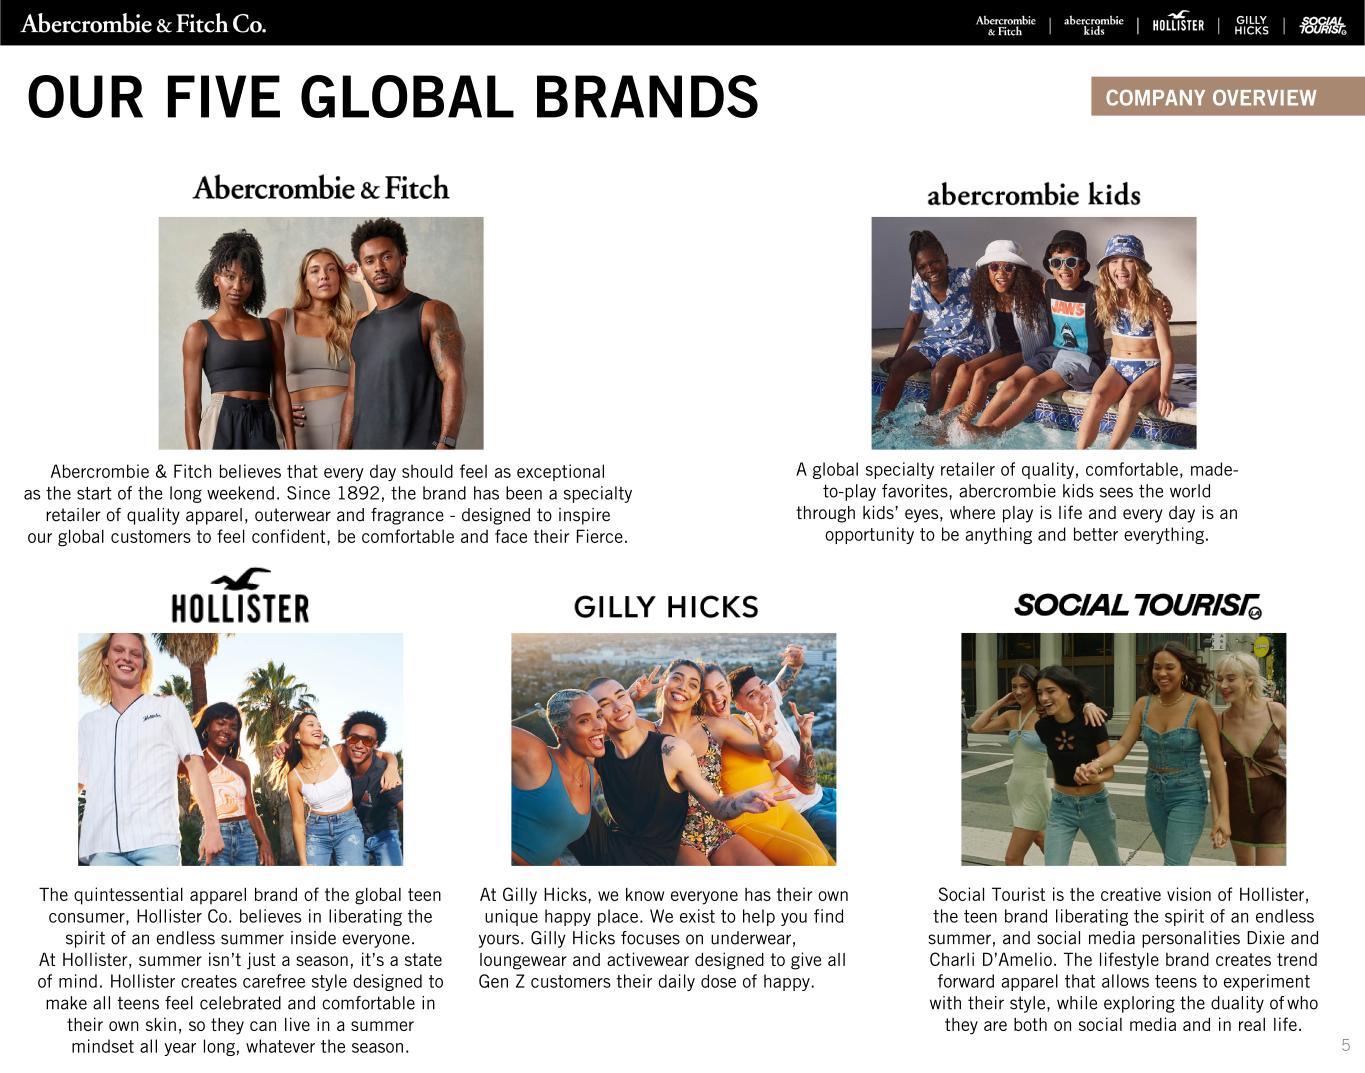
The quintessential apparel brand of the global teen consumer, Hollister Co. believes in liberating the spirit of an endless summer inside everyone. At Hollister, summer isn’t just a season, it’s a state of mind. Hollister creates carefree style designed to make all teens feel celebrated and comfortable in their own skin, so they can live in a summer mindset all year long, whatever the season. At Gilly Hicks, we know everyone has their own unique happy place. We exist to help you find yours. Gilly Hicks focuses on underwear, loungewear and activewear designed to give all Gen Z customers their daily dose of happy. A global specialty retailer of quality, comfortable, made- to-play favorites, abercrombie kids sees the world through kids’ eyes, where play is life and every day is an opportunity to be anything and better everything. Social Tourist is the creative vision of Hollister, the teen brand liberating the spirit of an endless summer, and social media personalities Dixie and Charli D’Amelio. The lifestyle brand creates trend forward apparel that allows teens to experiment with their style, while exploring the duality of who they are both on social media and in real life. Abercrombie & Fitch believes that every day should feel as exceptional as the start of the long weekend. Since 1892, the brand has been a specialty retailer of quality apparel, outerwear and fragrance - designed to inspire our global customers to feel confident, be comfortable and face their Fierce. COMPANY OVERVIEWOUR FIVE GLOBAL BRANDS 5
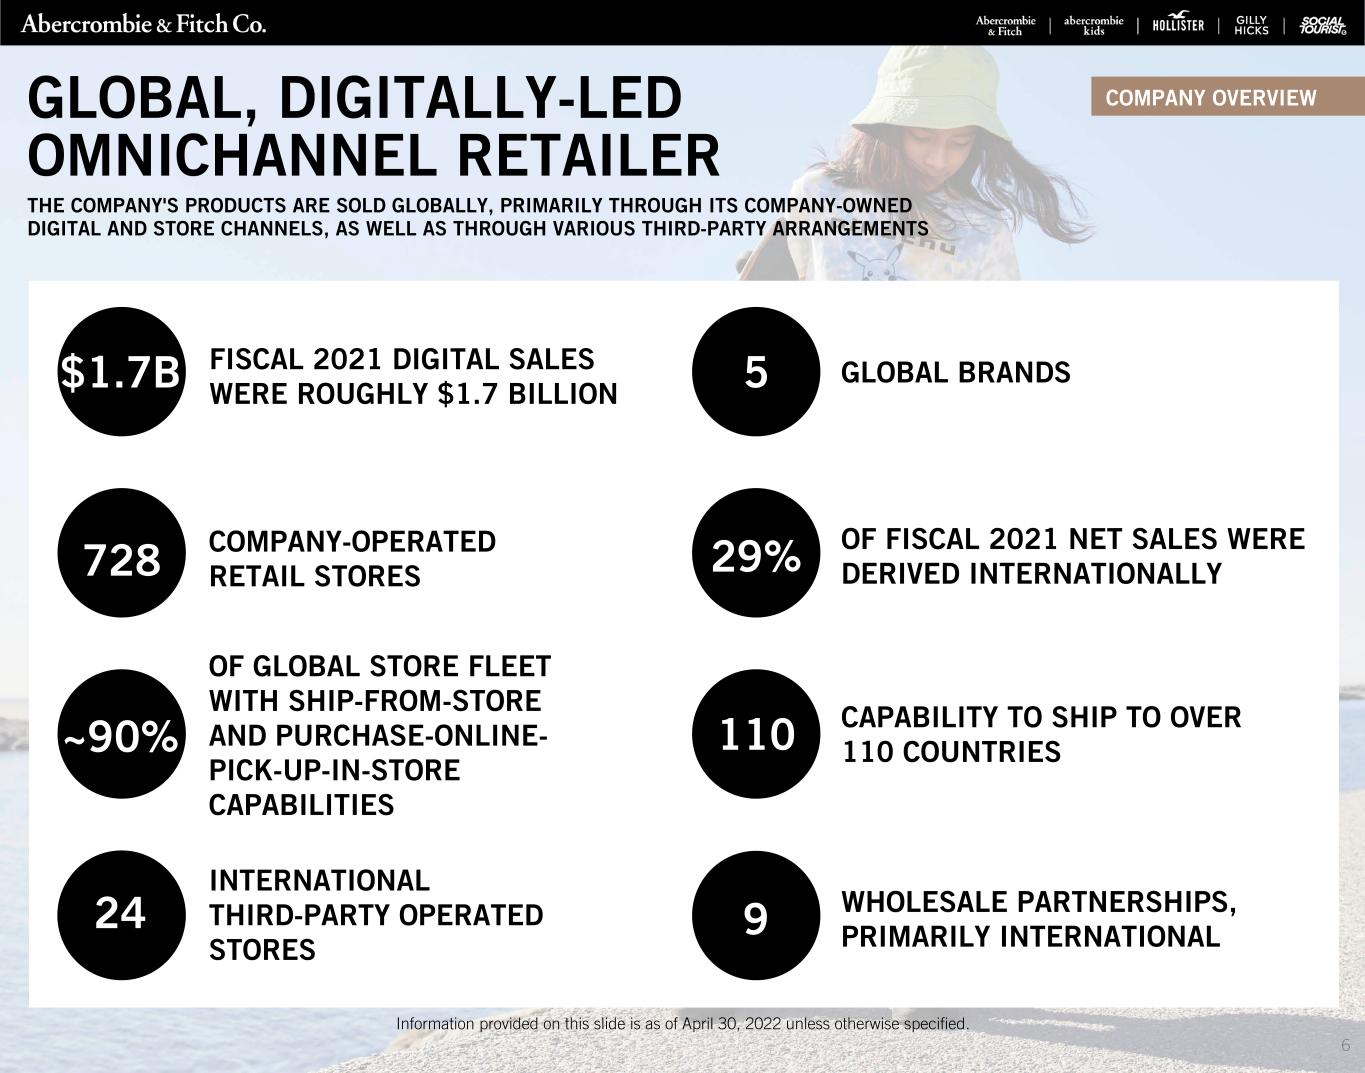
6 728 GLOBAL, DIGITALLY-LED OMNICHANNEL RETAILER COMPANY-OPERATED RETAIL STORES THE COMPANY'S PRODUCTS ARE SOLD GLOBALLY, PRIMARILY THROUGH ITS COMPANY-OWNED DIGITAL AND STORE CHANNELS, AS WELL AS THROUGH VARIOUS THIRD-PARTY ARRANGEMENTS CAPABILITY TO SHIP TO OVER 110 COUNTRIES GLOBAL BRANDS WHOLESALE PARTNERSHIPS, PRIMARILY INTERNATIONAL OF GLOBAL STORE FLEET WITH SHIP-FROM-STORE AND PURCHASE-ONLINE- PICK-UP-IN-STORE CAPABILITIES OF FISCAL 2021 NET SALES WERE DERIVED INTERNATIONALLY FISCAL 2021 DIGITAL SALES WERE ROUGHLY $1.7 BILLION Information provided on this slide is as of April 30, 2022 unless otherwise specified. $1.7B COMPANY OVERVIEW ~90% INTERNATIONAL THIRD-PARTY OPERATED STORES 5 29% 110 924
FOCUS AREAS 7
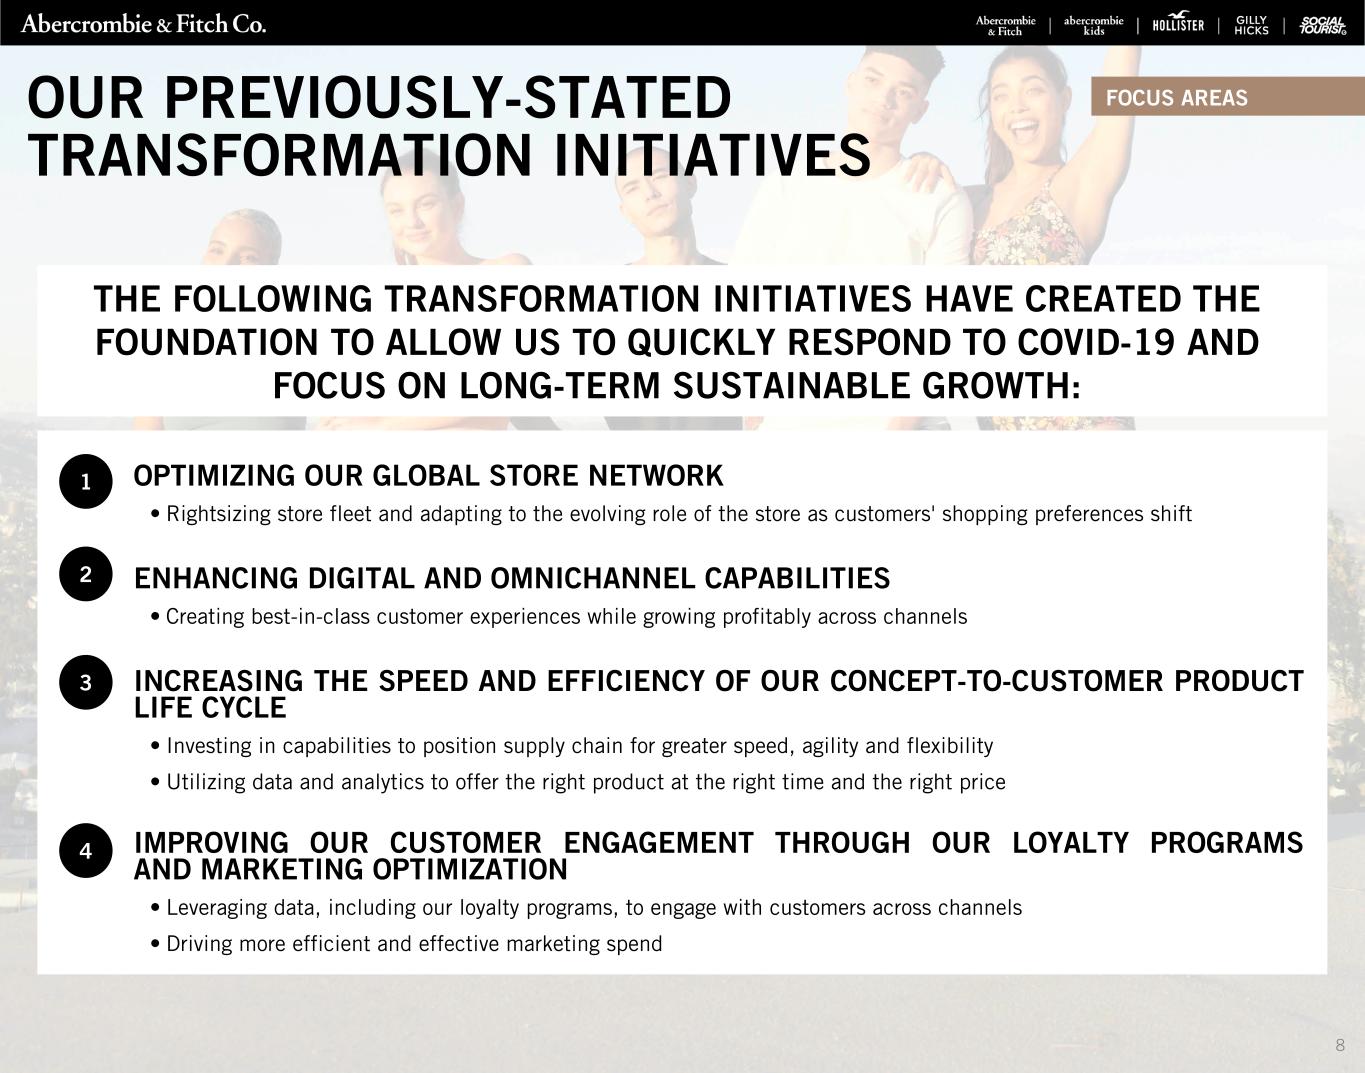
OUR PREVIOUSLY-STATED TRANSFORMATION INITIATIVES OPTIMIZING OUR GLOBAL STORE NETWORK • Rightsizing store fleet and adapting to the evolving role of the store as customers' shopping preferences shift ENHANCING DIGITAL AND OMNICHANNEL CAPABILITIES • Creating best-in-class customer experiences while growing profitably across channels INCREASING THE SPEED AND EFFICIENCY OF OUR CONCEPT-TO-CUSTOMER PRODUCT LIFE CYCLE • Investing in capabilities to position supply chain for greater speed, agility and flexibility • Utilizing data and analytics to offer the right product at the right time and the right price IMPROVING OUR CUSTOMER ENGAGEMENT THROUGH OUR LOYALTY PROGRAMS AND MARKETING OPTIMIZATION • Leveraging data, including our loyalty programs, to engage with customers across channels • Driving more efficient and effective marketing spend THE FOLLOWING TRANSFORMATION INITIATIVES HAVE CREATED THE FOUNDATION TO ALLOW US TO QUICKLY RESPOND TO COVID-19 AND FOCUS ON LONG-TERM SUSTAINABLE GROWTH: 1 2 3 4 FOCUS AREAS 8
THE FOLLOWING FOCUS AREAS FOR FISCAL 2022 SERVE AS A FRAMEWORK TO THE COMPANY ACHIEVING SUSTAINABLE GROWTH AND LONG-TERM OPERATING MARGIN EXPANSION OUR FOCUS AREAS FOR 2022 ACCELERATE DIGITAL, DATA AND TECHNOLOGY INVESTMENTS TO INCREASE AGILITY AND IMPROVE THE CUSTOMER EXPERIENCE CREATE A MORE PERSONALIZED CUSTOMER EXPERIENCE THROUGH A CONNECTED OMNICHANNEL ECOSYSTEM OPTIMIZE OUR GLOBAL DISTRIBUTION NETWORK TO EXPAND DIGITAL CAPACITY AND IMPROVE PRODUCT DELIVERY SPEED OPPORTUNISTICALLY OPEN NEW, OMNI-ENABLED STORES IN UNDER-PENETRATED MARKETS INTEGRATE ENVIRONMENTAL, SOCIAL AND GOVERNANCE PRACTICES AND STANDARDS THROUGHOUT THE ORGANIZATION FOCUS AREAS 9
DIGITAL EVOLUTION 10
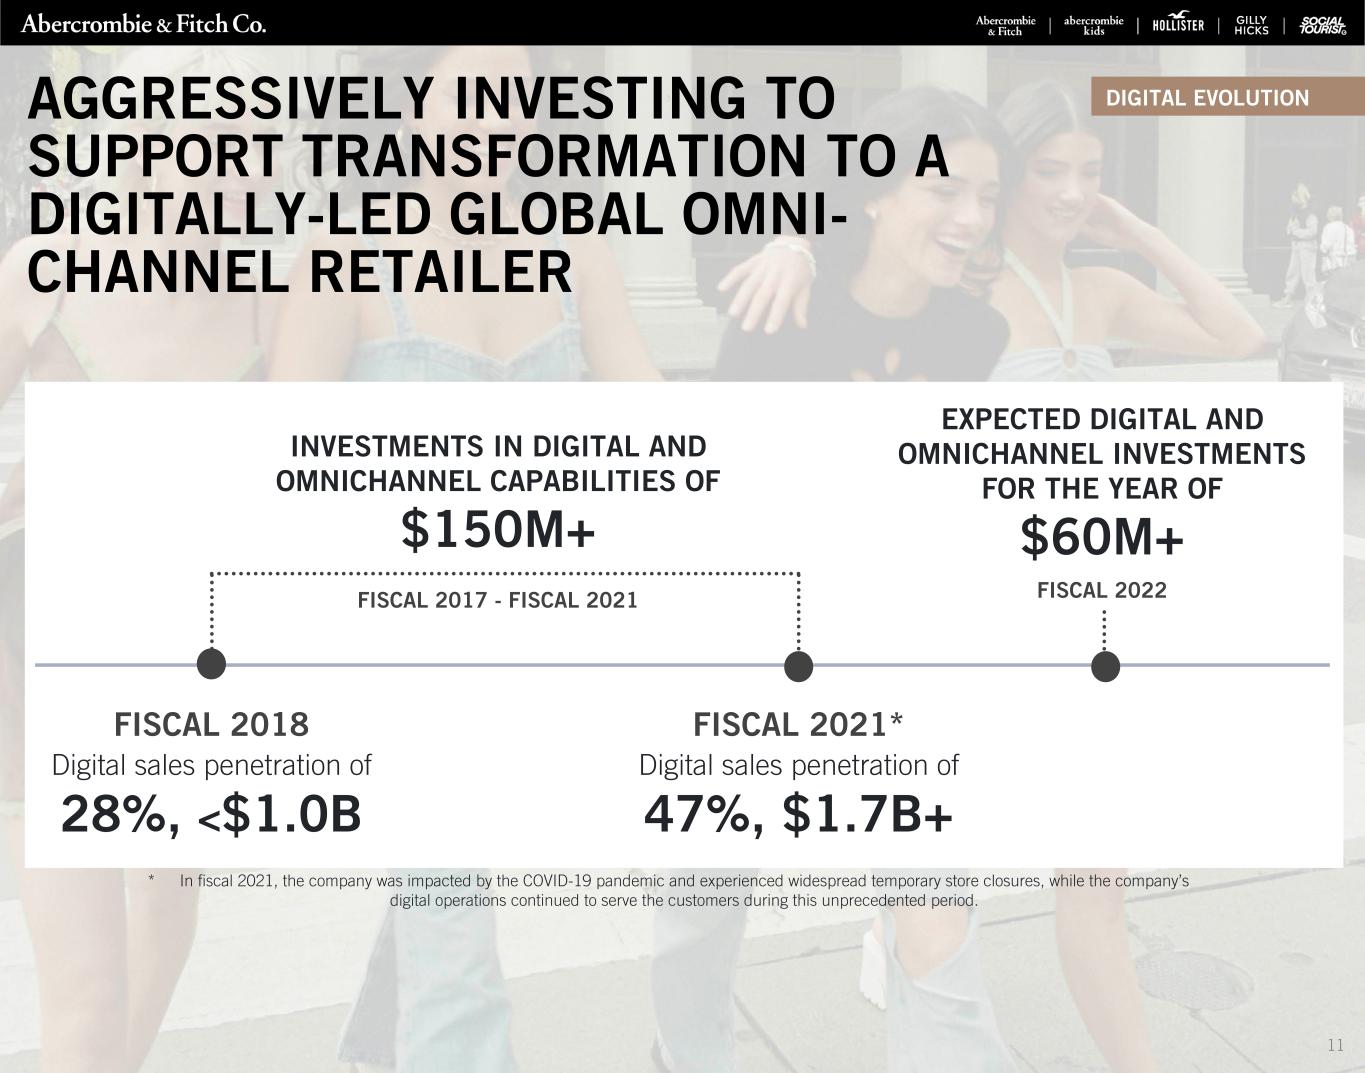
* In fiscal 2021, the company was impacted by the COVID-19 pandemic and experienced widespread temporary store closures, while the company’s digital operations continued to serve the customers during this unprecedented period. INVESTMENTS IN DIGITAL AND OMNICHANNEL CAPABILITIES OF $150M+ FISCAL 2017 - FISCAL 2021 FISCAL 2018 Digital sales penetration of 28%, <$1.0B FISCAL 2021* Digital sales penetration of 47%, $1.7B+ EXPECTED DIGITAL AND OMNICHANNEL INVESTMENTS FOR THE YEAR OF $60M+ FISCAL 2022 DIGITAL EVOLUTIONAGGRESSIVELY INVESTING TO SUPPORT TRANSFORMATION TO A DIGITALLY-LED GLOBAL OMNI- CHANNEL RETAILER 11
GLOBAL STORE NETWORK OPTIMIZATION 12
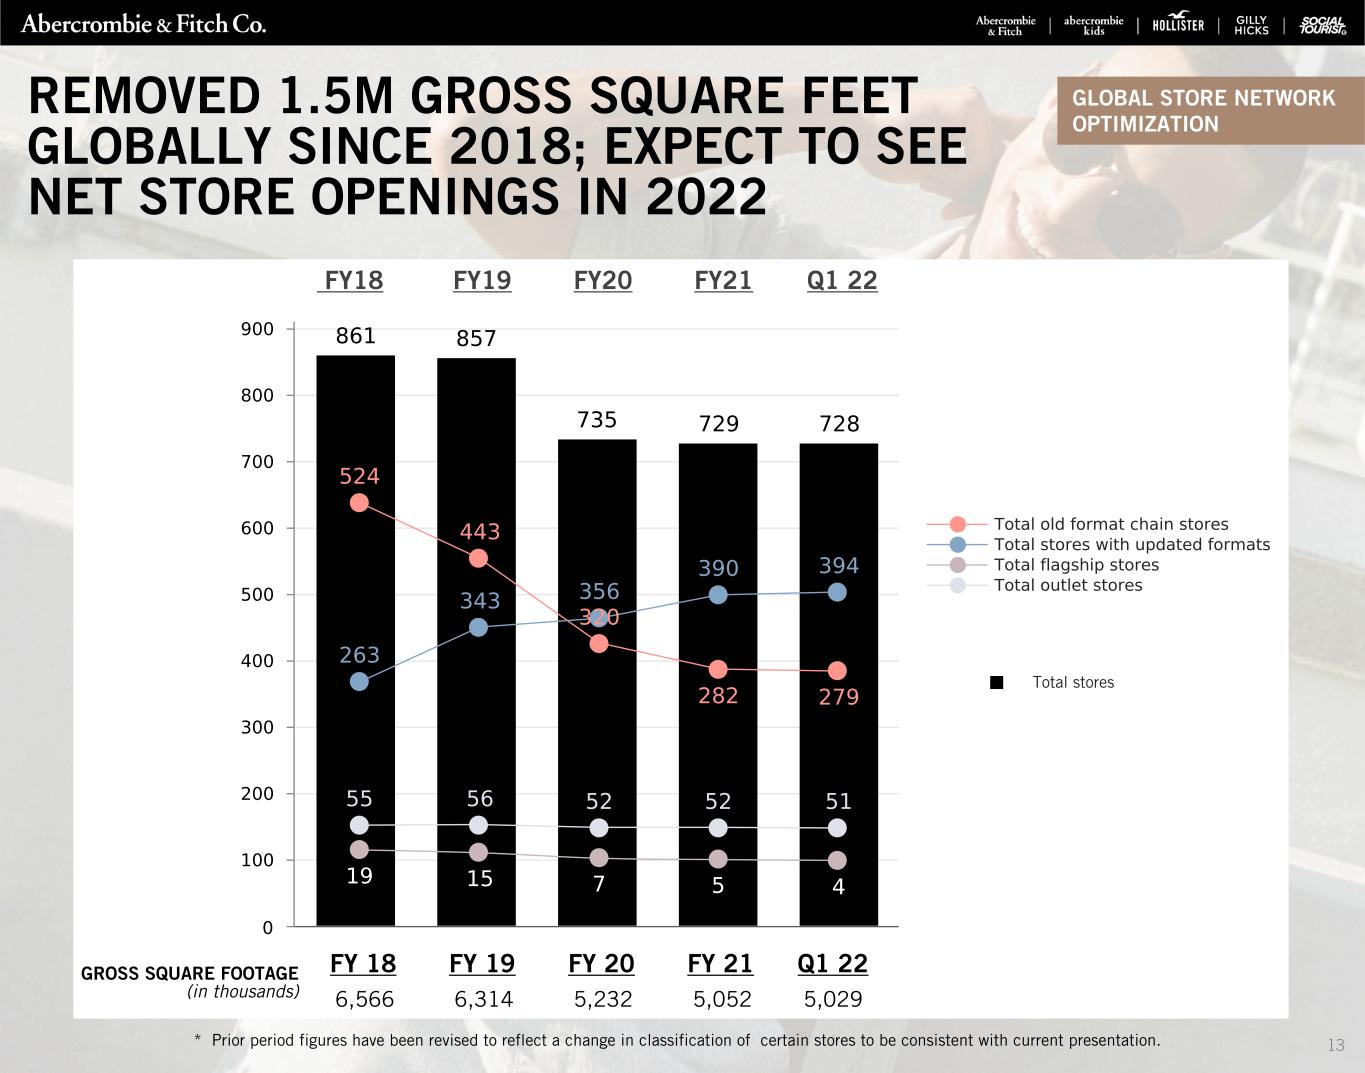
13 REMOVED 1.5M GROSS SQUARE FEET GLOBALLY SINCE 2018; EXPECT TO SEE NET STORE OPENINGS IN 2022 Total stores FY18 FY19 FY20 FY21 Q1 22 * Prior period figures have been revised to reflect a change in classification of certain stores to be consistent with current presentation. GROSS SQUARE FOOTAGE (in thousands) FY 18 FY 19 FY 20 FY 21 Q1 22 6,566 6,314 5,232 5,052 5,029 GLOBAL STORE NETWORK OPTIMIZATION
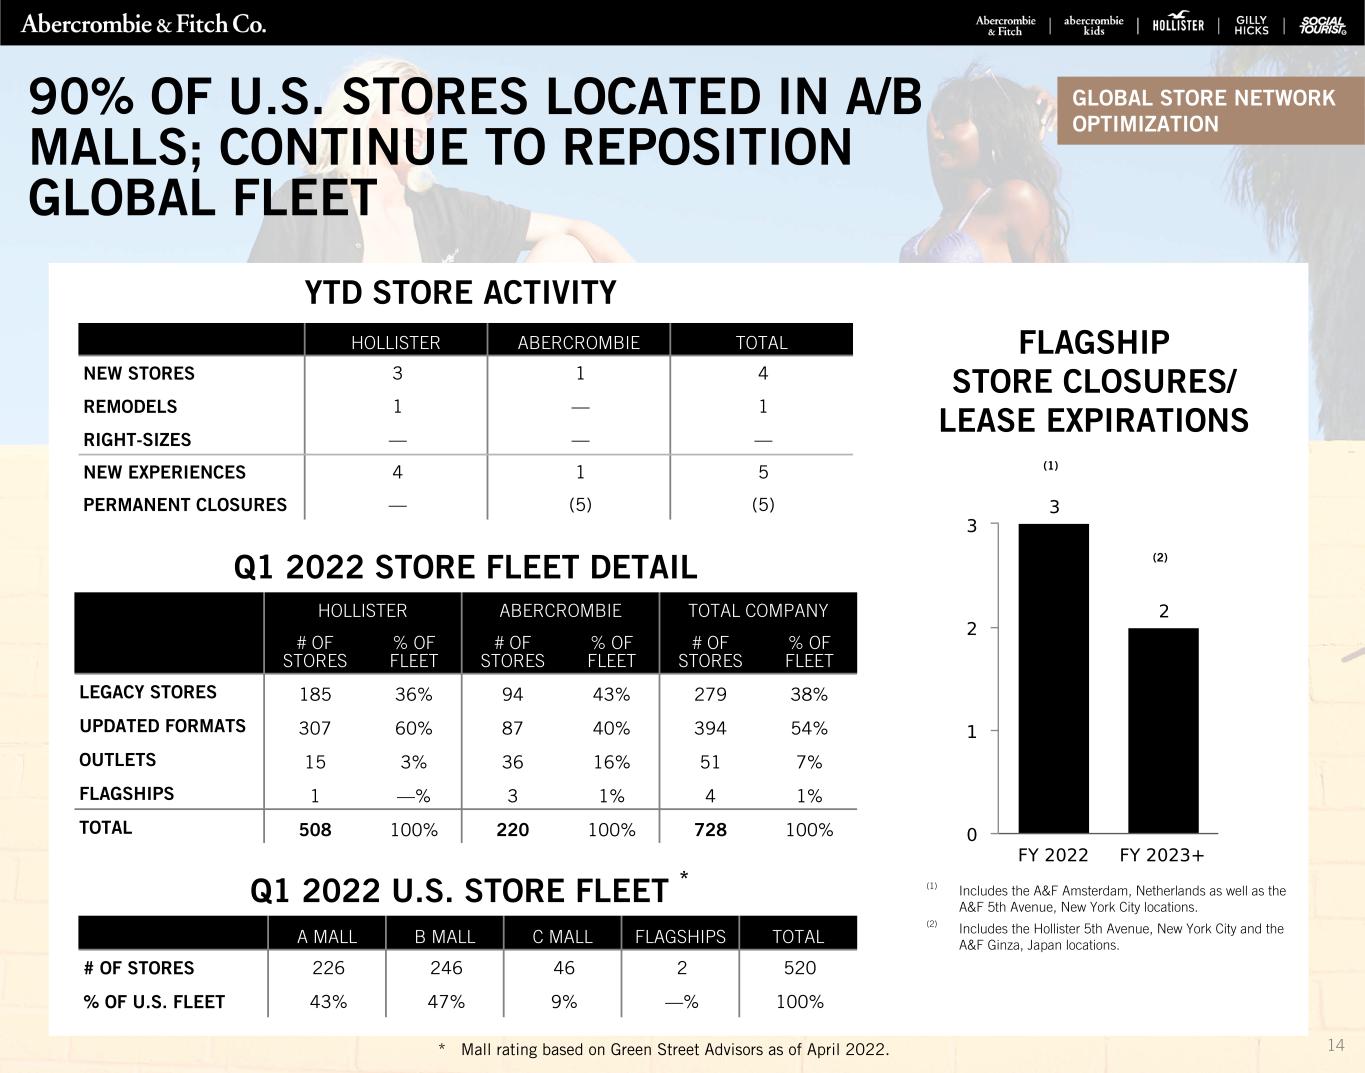
14 90% OF U.S. STORES LOCATED IN A/B MALLS; CONTINUE TO REPOSITION GLOBAL FLEET * Mall rating based on Green Street Advisors as of April 2022. YTD STORE ACTIVITY Q1 2022 STORE FLEET DETAIL HOLLISTER ABERCROMBIE TOTAL COMPANY # OF STORES % OF FLEET # OF STORES % OF FLEET # OF STORES % OF FLEET LEGACY STORES 185 36% 94 43% 279 38% UPDATED FORMATS 307 60% 87 40% 394 54% OUTLETS 15 3% 36 16% 51 7% FLAGSHIPS 1 —% 3 1% 4 1% TOTAL 508 100% 220 100% 728 100% HOLLISTER ABERCROMBIE TOTAL NEW STORES 3 1 4 REMODELS 1 — 1 RIGHT-SIZES — — — NEW EXPERIENCES 4 1 5 PERMANENT CLOSURES — (5) (5) FLAGSHIP STORE CLOSURES/ LEASE EXPIRATIONS (1) (1) Includes the A&F Amsterdam, Netherlands as well as the A&F 5th Avenue, New York City locations. (2) Includes the Hollister 5th Avenue, New York City and the A&F Ginza, Japan locations. (2) Q1 2022 U.S. STORE FLEET * A MALL B MALL C MALL FLAGSHIPS TOTAL # OF STORES 226 246 46 2 520 % OF U.S. FLEET 43% 47% 9% —% 100% GLOBAL STORE NETWORK OPTIMIZATION
Q1 2022 RESULTS 15
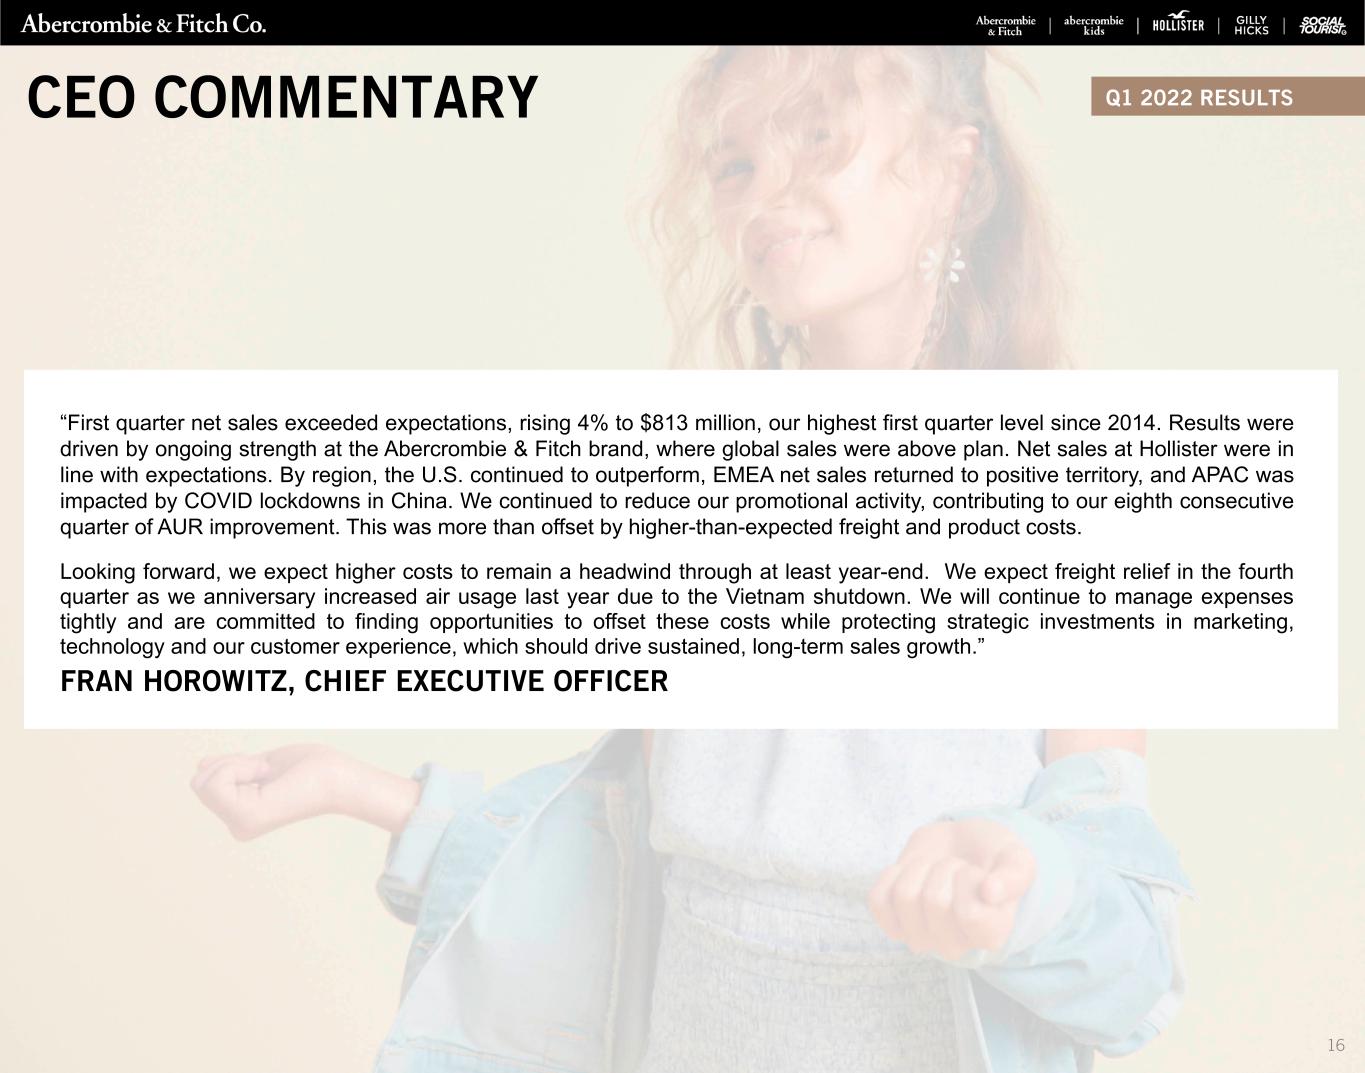
Q1 2022 RESULTS “First quarter net sales exceeded expectations, rising 4% to $813 million, our highest first quarter level since 2014. Results were driven by ongoing strength at the Abercrombie & Fitch brand, where global sales were above plan. Net sales at Hollister were in line with expectations. By region, the U.S. continued to outperform, EMEA net sales returned to positive territory, and APAC was impacted by COVID lockdowns in China. We continued to reduce our promotional activity, contributing to our eighth consecutive quarter of AUR improvement. This was more than offset by higher-than-expected freight and product costs. Looking forward, we expect higher costs to remain a headwind through at least year-end. We expect freight relief in the fourth quarter as we anniversary increased air usage last year due to the Vietnam shutdown. We will continue to manage expenses tightly and are committed to finding opportunities to offset these costs while protecting strategic investments in marketing, technology and our customer experience, which should drive sustained, long-term sales growth.” FRAN HOROWITZ, CHIEF EXECUTIVE OFFICER CEO COMMENTARY 16
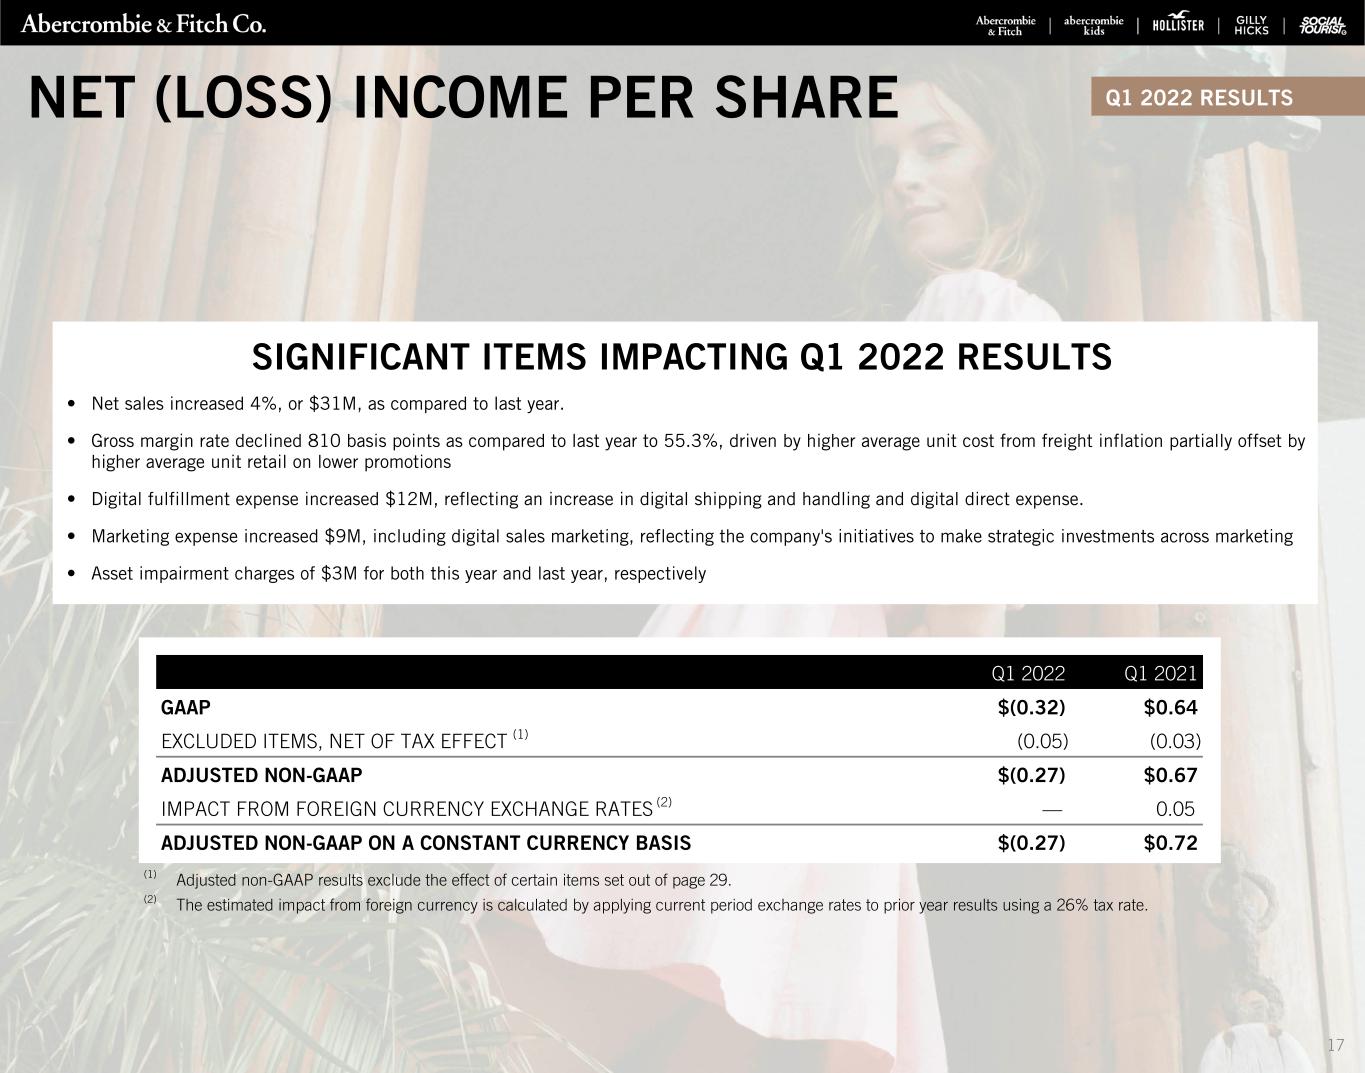
SIGNIFICANT ITEMS IMPACTING Q1 2022 RESULTS • Net sales increased 4%, or $31M, as compared to last year. • Gross margin rate declined 810 basis points as compared to last year to 55.3%, driven by higher average unit cost from freight inflation partially offset by higher average unit retail on lower promotions • Digital fulfillment expense increased $12M, reflecting an increase in digital shipping and handling and digital direct expense. • Marketing expense increased $9M, including digital sales marketing, reflecting the company's initiatives to make strategic investments across marketing • Asset impairment charges of $3M for both this year and last year, respectively (1) Adjusted non-GAAP results exclude the effect of certain items set out of page 29. (2) The estimated impact from foreign currency is calculated by applying current period exchange rates to prior year results using a 26% tax rate. Q1 2022 Q1 2021 GAAP $(0.32) $0.64 EXCLUDED ITEMS, NET OF TAX EFFECT (1) (0.05) (0.03) ADJUSTED NON-GAAP $(0.27) $0.67 IMPACT FROM FOREIGN CURRENCY EXCHANGE RATES (2) — 0.05 ADJUSTED NON-GAAP ON A CONSTANT CURRENCY BASIS $(0.27) $0.72 Q1 2022 RESULTSNET (LOSS) INCOME PER SHARE 17
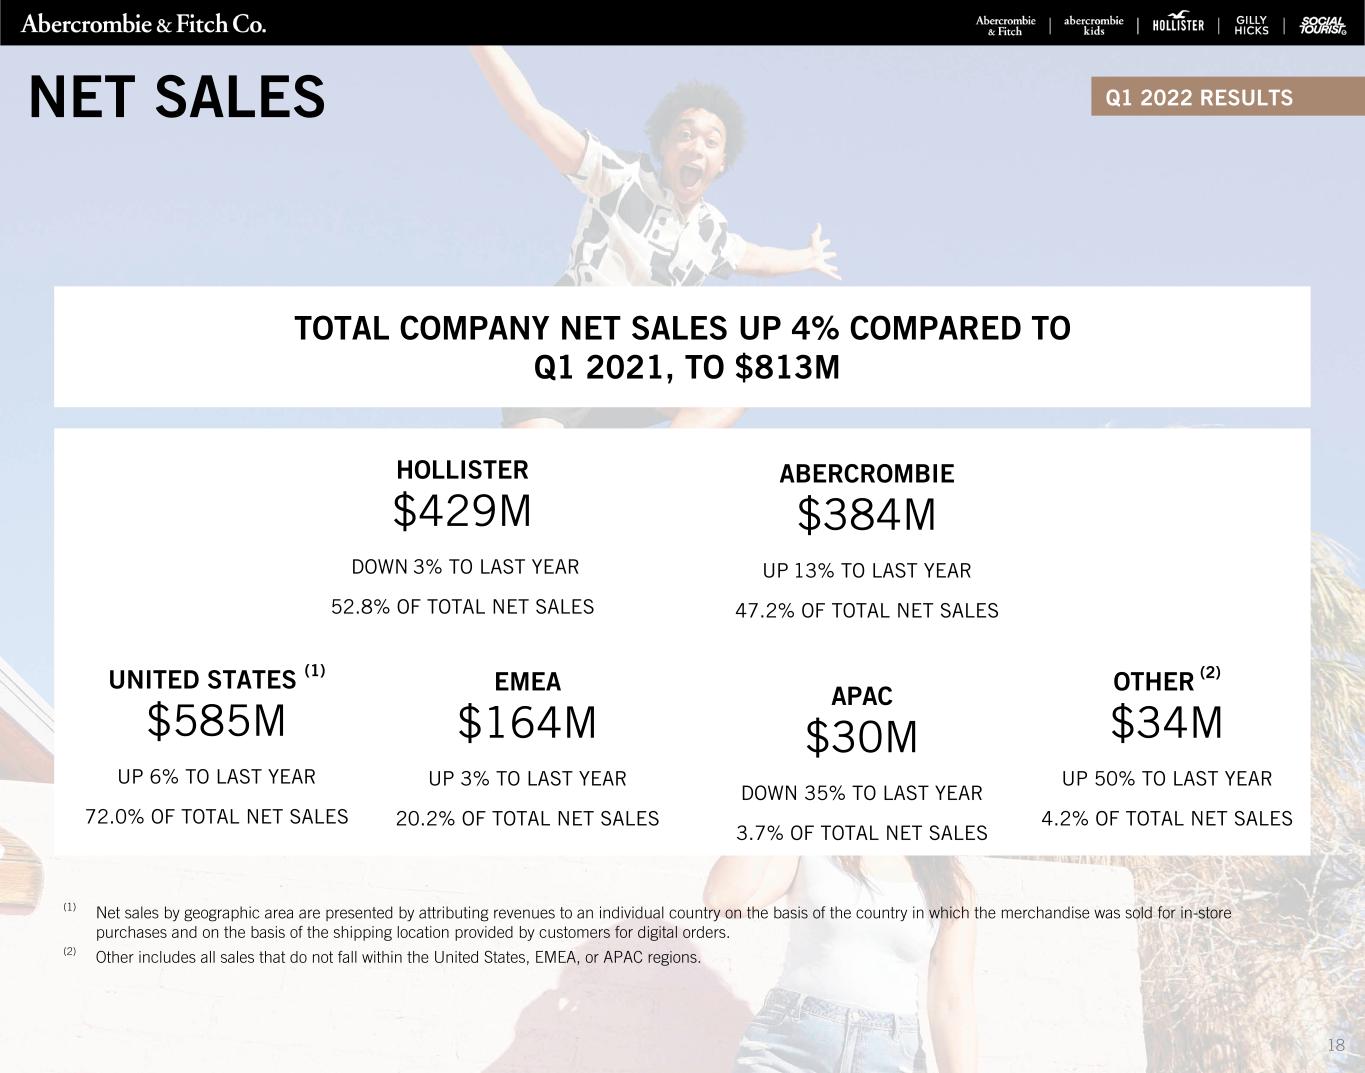
TOTAL COMPANY NET SALES UP 4% COMPARED TO Q1 2021, TO $813M ABERCROMBIE $384M UP 13% TO LAST YEAR 47.2% OF TOTAL NET SALES HOLLISTER $429M DOWN 3% TO LAST YEAR 52.8% OF TOTAL NET SALES EMEA $164M UP 3% TO LAST YEAR 20.2% OF TOTAL NET SALES UNITED STATES (1) $585M UP 6% TO LAST YEAR 72.0% OF TOTAL NET SALES APAC $30M DOWN 35% TO LAST YEAR 3.7% OF TOTAL NET SALES OTHER (2) $34M UP 50% TO LAST YEAR 4.2% OF TOTAL NET SALES Q1 2022 RESULTSNET SALES 18 (1) Net sales by geographic area are presented by attributing revenues to an individual country on the basis of the country in which the merchandise was sold for in-store purchases and on the basis of the shipping location provided by customers for digital orders. (2) Other includes all sales that do not fall within the United States, EMEA, or APAC regions.
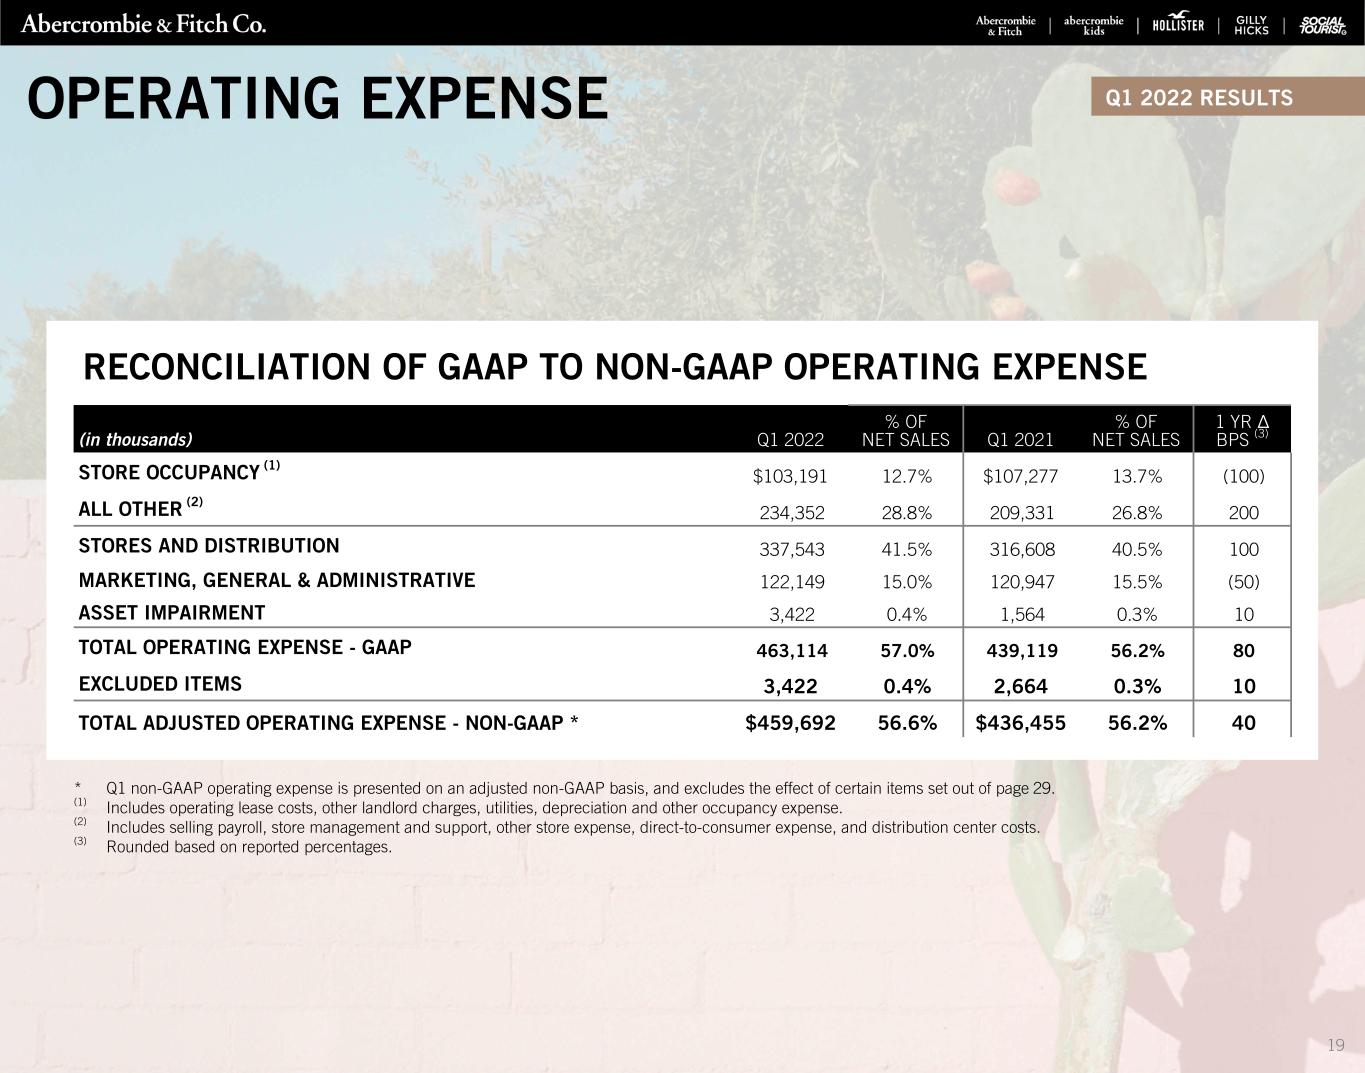
(in thousands) Q1 2022 % OF NET SALES Q1 2021 % OF NET SALES 1 YR Δ BPS (3) STORE OCCUPANCY (1) $103,191 12.7% $107,277 13.7% (100) ALL OTHER (2) 234,352 28.8% 209,331 26.8% 200 STORES AND DISTRIBUTION 337,543 41.5% 316,608 40.5% 100 MARKETING, GENERAL & ADMINISTRATIVE 122,149 15.0% 120,947 15.5% (50) ASSET IMPAIRMENT 3,422 0.4% 1,564 0.3% 10 TOTAL OPERATING EXPENSE - GAAP 463,114 57.0% 439,119 56.2% 80 EXCLUDED ITEMS 3,422 0.4% 2,664 0.3% 10 TOTAL ADJUSTED OPERATING EXPENSE - NON-GAAP * $459,692 56.6% $436,455 56.2% 40 RECONCILIATION OF GAAP TO NON-GAAP OPERATING EXPENSE * Q1 non-GAAP operating expense is presented on an adjusted non-GAAP basis, and excludes the effect of certain items set out of page 29. (1) Includes operating lease costs, other landlord charges, utilities, depreciation and other occupancy expense. (2) Includes selling payroll, store management and support, other store expense, direct-to-consumer expense, and distribution center costs. (3) Rounded based on reported percentages. Q1 2022 RESULTSOPERATING EXPENSE 19
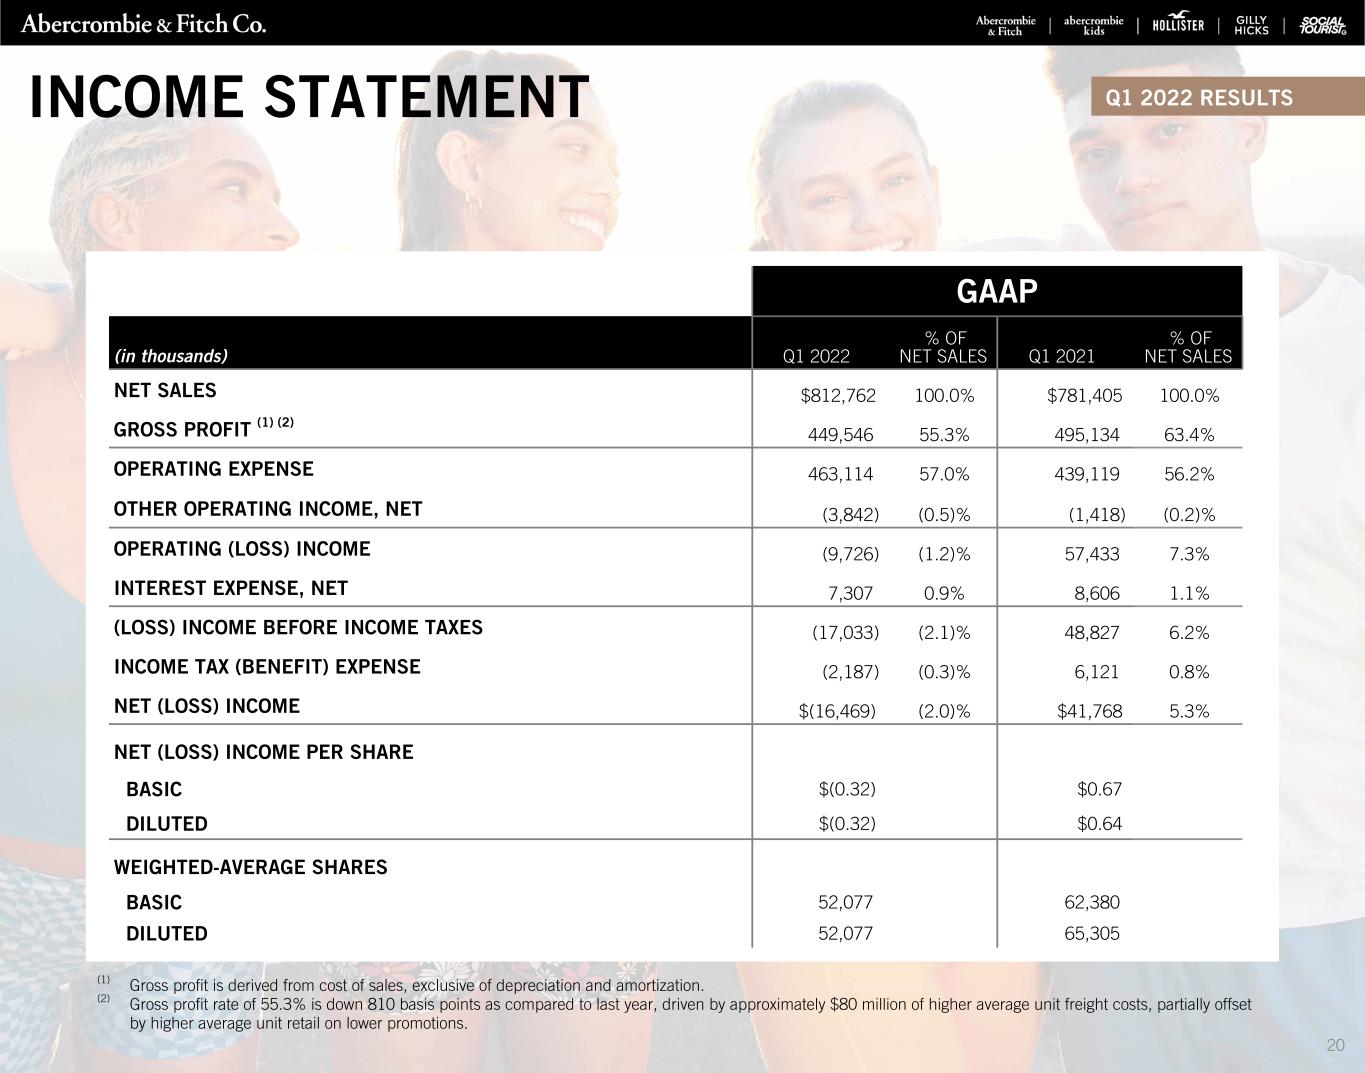
(1) Gross profit is derived from cost of sales, exclusive of depreciation and amortization. (2) Gross profit rate of 55.3% is down 810 basis points as compared to last year, driven by approximately $80 million of higher average unit freight costs, partially offset by higher average unit retail on lower promotions. GAAP (in thousands) Q1 2022 % OF NET SALES Q1 2021 % OF NET SALES NET SALES $812,762 100.0% $781,405 100.0% GROSS PROFIT (1) (2) 449,546 55.3% 495,134 63.4% OPERATING EXPENSE 463,114 57.0% 439,119 56.2% OTHER OPERATING INCOME, NET (3,842) (0.5)% (1,418) (0.2)% OPERATING (LOSS) INCOME (9,726) (1.2)% 57,433 7.3% INTEREST EXPENSE, NET 7,307 0.9% 8,606 1.1% (LOSS) INCOME BEFORE INCOME TAXES (17,033) (2.1)% 48,827 6.2% INCOME TAX (BENEFIT) EXPENSE (2,187) (0.3)% 6,121 0.8% NET (LOSS) INCOME $(16,469) (2.0)% $41,768 5.3% NET (LOSS) INCOME PER SHARE BASIC $(0.32) $0.67 DILUTED $(0.32) $0.64 WEIGHTED-AVERAGE SHARES BASIC 52,077 62,380 DILUTED 52,077 65,305 Q1 2022 RESULTSINCOME STATEMENT 20

FINANCIAL POSITION, LIQUIDITY & CAPITAL ALLOCATION 21
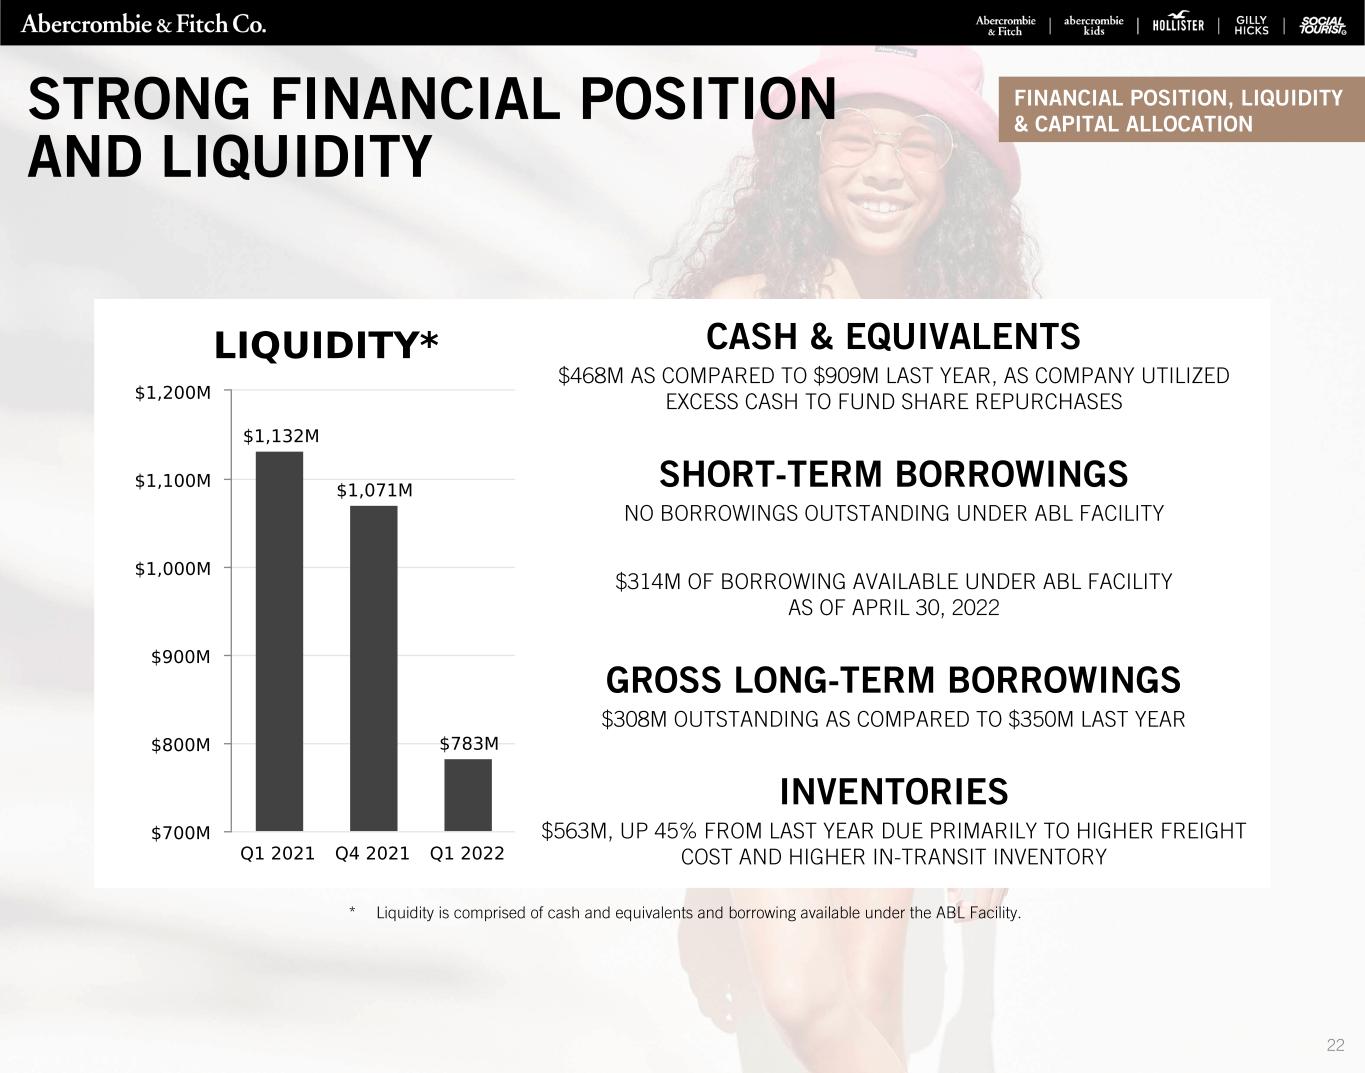
22 FINANCIAL POSITION, LIQUIDITY & CAPITAL ALLOCATIONSTRONG FINANCIAL POSITION AND LIQUIDITY CASH & EQUIVALENTS $468M AS COMPARED TO $909M LAST YEAR, AS COMPANY UTILIZED EXCESS CASH TO FUND SHARE REPURCHASES SHORT-TERM BORROWINGS NO BORROWINGS OUTSTANDING UNDER ABL FACILITY $314M OF BORROWING AVAILABLE UNDER ABL FACILITY AS OF APRIL 30, 2022 GROSS LONG-TERM BORROWINGS $308M OUTSTANDING AS COMPARED TO $350M LAST YEAR INVENTORIES $563M, UP 45% FROM LAST YEAR DUE PRIMARILY TO HIGHER FREIGHT COST AND HIGHER IN-TRANSIT INVENTORY * Liquidity is comprised of cash and equivalents and borrowing available under the ABL Facility.
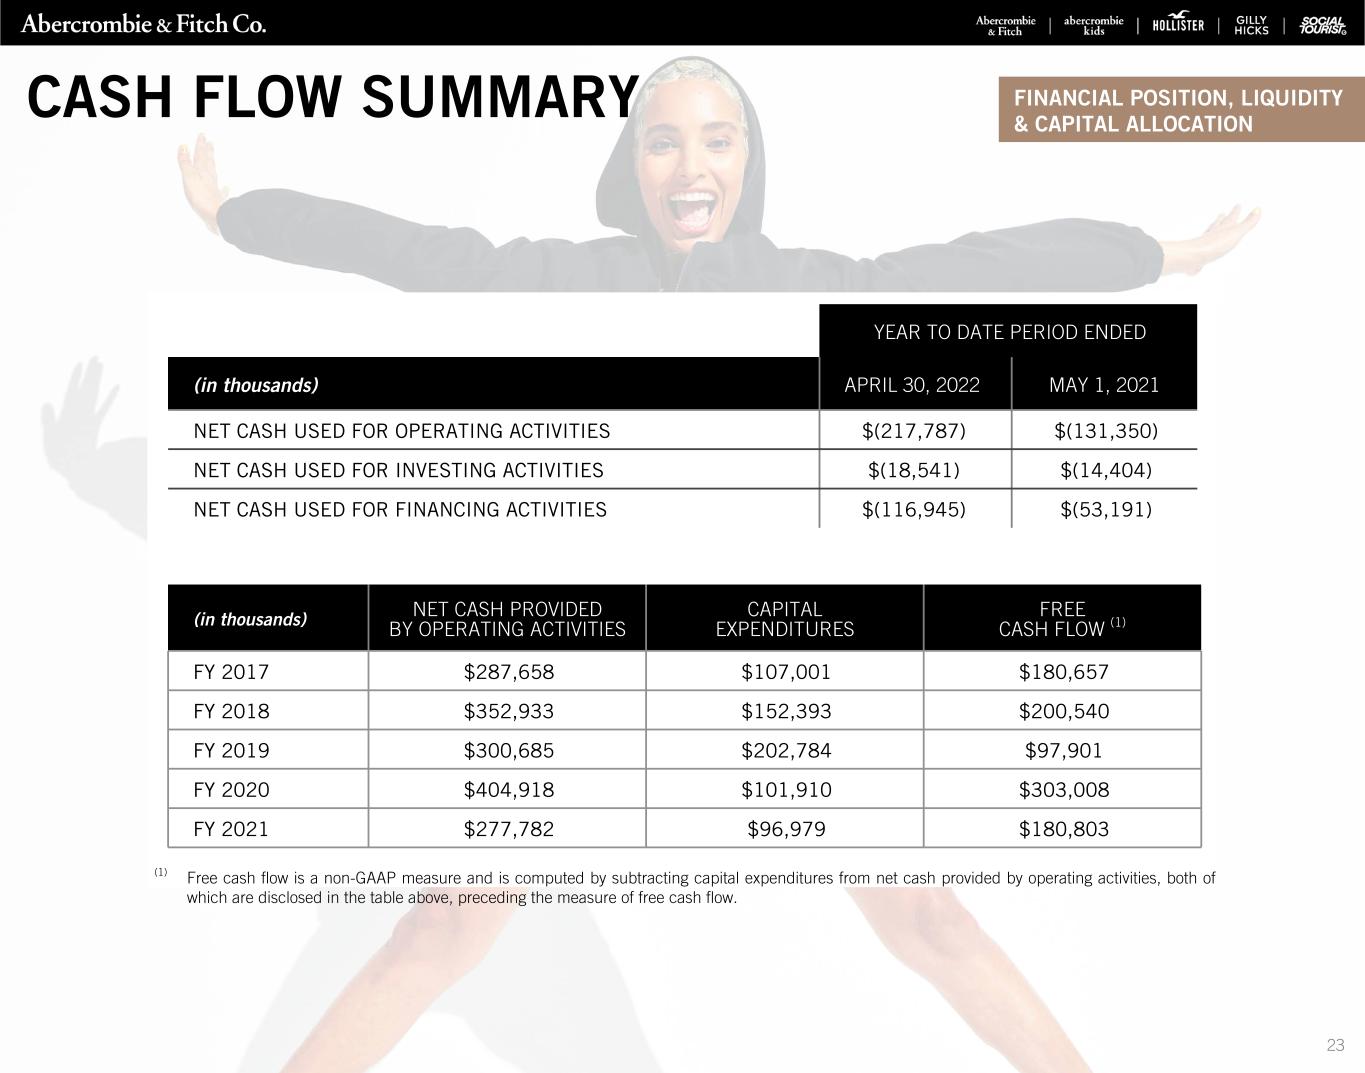
(in thousands) NET CASH PROVIDED BY OPERATING ACTIVITIES CAPITAL EXPENDITURES FREE CASH FLOW (1) FY 2017 $287,658 $107,001 $180,657 FY 2018 $352,933 $152,393 $200,540 FY 2019 $300,685 $202,784 $97,901 FY 2020 $404,918 $101,910 $303,008 FY 2021 $277,782 $96,979 $180,803 (1) Free cash flow is a non-GAAP measure and is computed by subtracting capital expenditures from net cash provided by operating activities, both of which are disclosed in the table above, preceding the measure of free cash flow. YEAR TO DATE PERIOD ENDED (in thousands) APRIL 30, 2022 MAY 1, 2021 NET CASH USED FOR OPERATING ACTIVITIES $(217,787) $(131,350) NET CASH USED FOR INVESTING ACTIVITIES $(18,541) $(14,404) NET CASH USED FOR FINANCING ACTIVITIES $(116,945) $(53,191) CASH FLOW SUMMARY FINANCIAL POSITION, LIQUIDITY & CAPITAL ALLOCATION 23
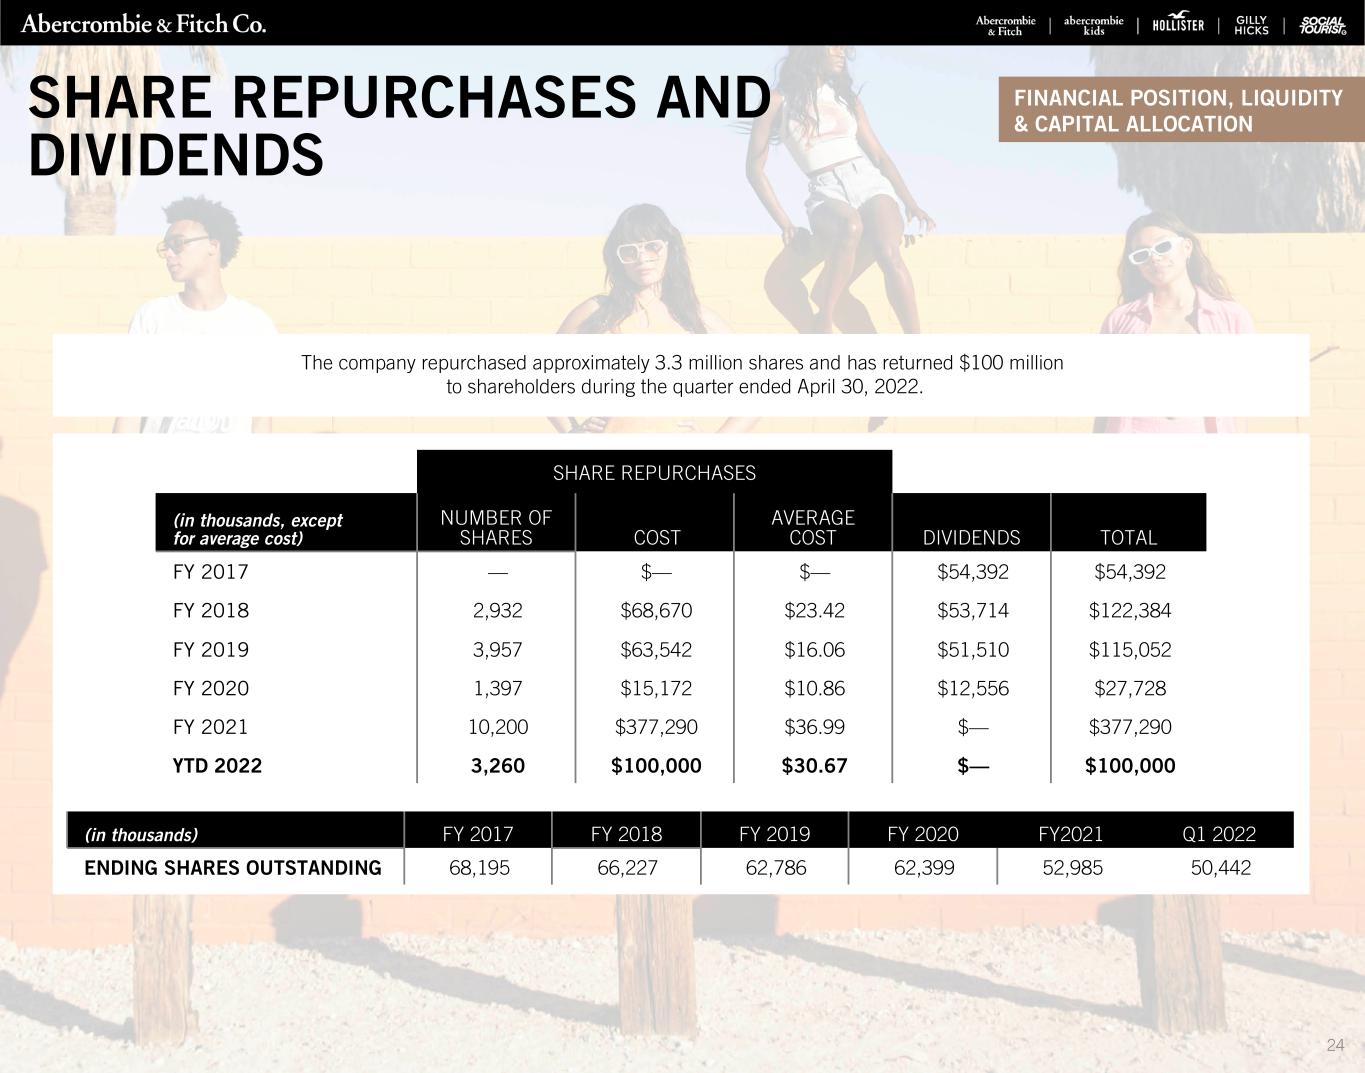
The company repurchased approximately 3.3 million shares and has returned $100 million to shareholders during the quarter ended April 30, 2022. SHARE REPURCHASES (in thousands, except for average cost) NUMBER OF SHARES COST AVERAGE COST DIVIDENDS TOTAL FY 2017 — $— $— $54,392 $54,392 FY 2018 2,932 $68,670 $23.42 $53,714 $122,384 FY 2019 3,957 $63,542 $16.06 $51,510 $115,052 FY 2020 1,397 $15,172 $10.86 $12,556 $27,728 FY 2021 10,200 $377,290 $36.99 $— $377,290 YTD 2022 3,260 $100,000 $30.67 $— $100,000 (in thousands) FY 2017 FY 2018 FY 2019 FY 2020 FY2021 Q1 2022 ENDING SHARES OUTSTANDING 68,195 66,227 62,786 62,399 52,985 50,442 FINANCIAL POSITION, LIQUIDITY & CAPITAL ALLOCATION SHARE REPURCHASES AND DIVIDENDS 24
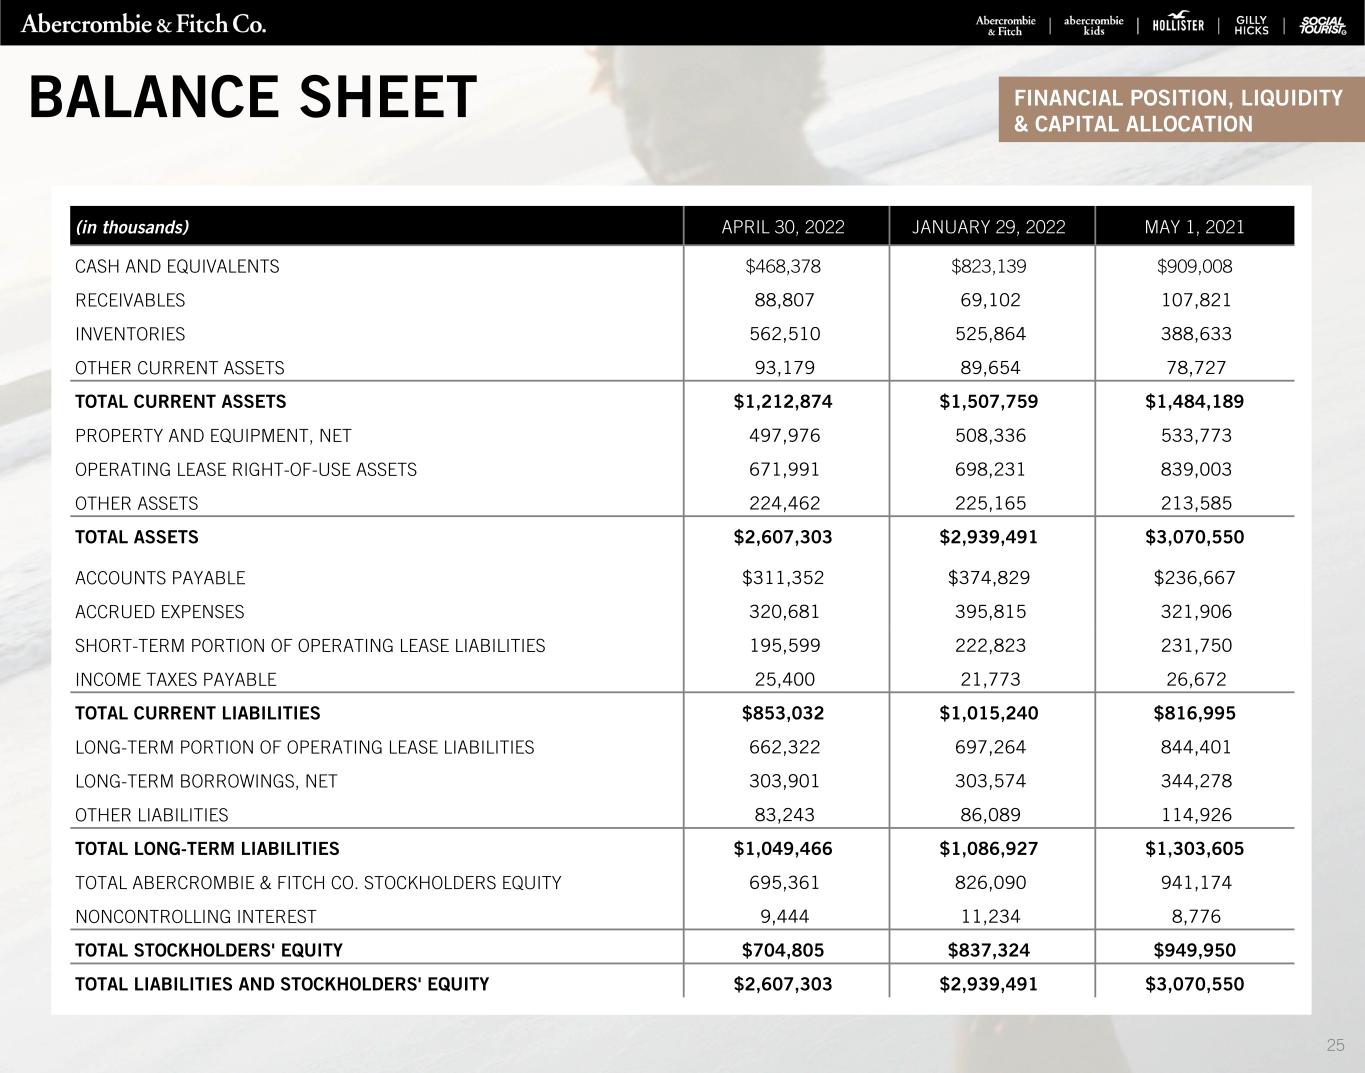
(in thousands) APRIL 30, 2022 JANUARY 29, 2022 MAY 1, 2021 CASH AND EQUIVALENTS $468,378 $823,139 $909,008 RECEIVABLES 88,807 69,102 107,821 INVENTORIES 562,510 525,864 388,633 OTHER CURRENT ASSETS 93,179 89,654 78,727 TOTAL CURRENT ASSETS $1,212,874 $1,507,759 $1,484,189 PROPERTY AND EQUIPMENT, NET 497,976 508,336 533,773 OPERATING LEASE RIGHT-OF-USE ASSETS 671,991 698,231 839,003 OTHER ASSETS 224,462 225,165 213,585 TOTAL ASSETS $2,607,303 $2,939,491 $3,070,550 ACCOUNTS PAYABLE $311,352 $374,829 $236,667 ACCRUED EXPENSES 320,681 395,815 321,906 SHORT-TERM PORTION OF OPERATING LEASE LIABILITIES 195,599 222,823 231,750 INCOME TAXES PAYABLE 25,400 21,773 26,672 TOTAL CURRENT LIABILITIES $853,032 $1,015,240 $816,995 LONG-TERM PORTION OF OPERATING LEASE LIABILITIES 662,322 697,264 844,401 LONG-TERM BORROWINGS, NET 303,901 303,574 344,278 OTHER LIABILITIES 83,243 86,089 114,926 TOTAL LONG-TERM LIABILITIES $1,049,466 $1,086,927 $1,303,605 TOTAL ABERCROMBIE & FITCH CO. STOCKHOLDERS EQUITY 695,361 826,090 941,174 NONCONTROLLING INTEREST 9,444 11,234 8,776 TOTAL STOCKHOLDERS' EQUITY $704,805 $837,324 $949,950 TOTAL LIABILITIES AND STOCKHOLDERS' EQUITY $2,607,303 $2,939,491 $3,070,550 BALANCE SHEET FINANCIAL POSITION, LIQUIDITY & CAPITAL ALLOCATION 25
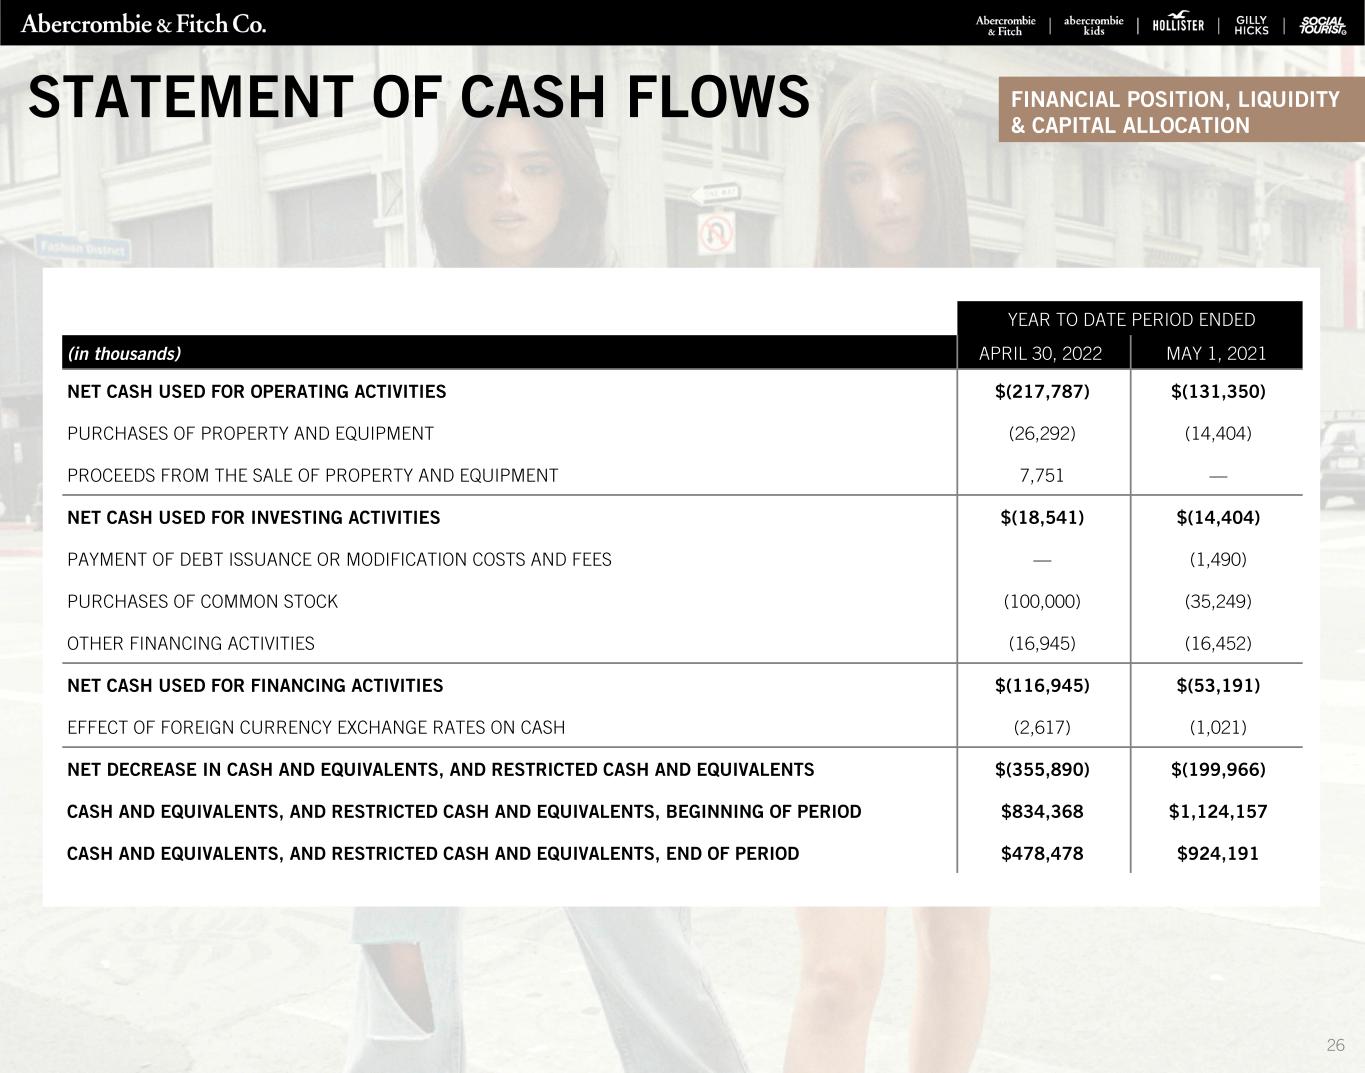
YEAR TO DATE PERIOD ENDED (in thousands) APRIL 30, 2022 MAY 1, 2021 NET CASH USED FOR OPERATING ACTIVITIES $(217,787) $(131,350) PURCHASES OF PROPERTY AND EQUIPMENT (26,292) (14,404) PROCEEDS FROM THE SALE OF PROPERTY AND EQUIPMENT 7,751 — NET CASH USED FOR INVESTING ACTIVITIES $(18,541) $(14,404) PAYMENT OF DEBT ISSUANCE OR MODIFICATION COSTS AND FEES — (1,490) PURCHASES OF COMMON STOCK (100,000) (35,249) OTHER FINANCING ACTIVITIES (16,945) (16,452) NET CASH USED FOR FINANCING ACTIVITIES $(116,945) $(53,191) EFFECT OF FOREIGN CURRENCY EXCHANGE RATES ON CASH (2,617) (1,021) NET DECREASE IN CASH AND EQUIVALENTS, AND RESTRICTED CASH AND EQUIVALENTS $(355,890) $(199,966) CASH AND EQUIVALENTS, AND RESTRICTED CASH AND EQUIVALENTS, BEGINNING OF PERIOD $834,368 $1,124,157 CASH AND EQUIVALENTS, AND RESTRICTED CASH AND EQUIVALENTS, END OF PERIOD $478,478 $924,191 FINANCIAL POSITION, LIQUIDITY & CAPITAL ALLOCATION STATEMENT OF CASH FLOWS 26
27 UPDATED FISCAL 2022 OUTLOOK
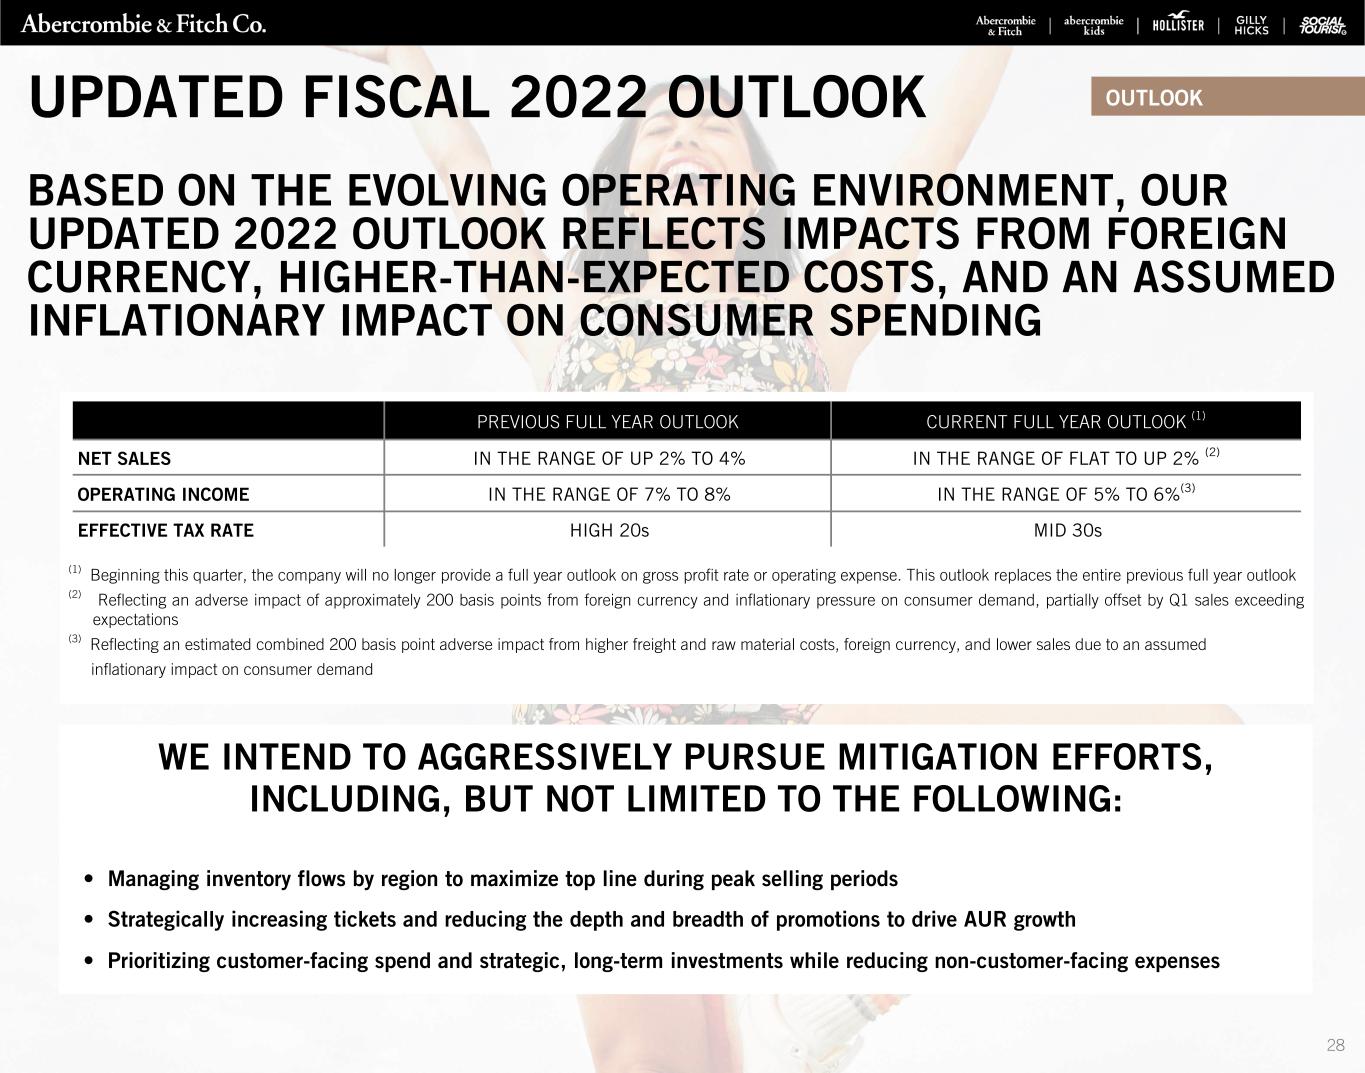
PREVIOUS FULL YEAR OUTLOOK CURRENT FULL YEAR OUTLOOK (1) NET SALES IN THE RANGE OF UP 2% TO 4% IN THE RANGE OF FLAT TO UP 2% (2) OPERATING INCOME IN THE RANGE OF 7% TO 8% IN THE RANGE OF 5% TO 6%(3) EFFECTIVE TAX RATE HIGH 20s MID 30s UPDATED FISCAL 2022 OUTLOOK OUTLOOK WE INTEND TO AGGRESSIVELY PURSUE MITIGATION EFFORTS, INCLUDING, BUT NOT LIMITED TO THE FOLLOWING: • Managing inventory flows by region to maximize top line during peak selling periods • Strategically increasing tickets and reducing the depth and breadth of promotions to drive AUR growth • Prioritizing customer-facing spend and strategic, long-term investments while reducing non-customer-facing expenses 28 (1) Beginning this quarter, the company will no longer provide a full year outlook on gross profit rate or operating expense. This outlook replaces the entire previous full year outlook (2) Reflecting an adverse impact of approximately 200 basis points from foreign currency and inflationary pressure on consumer demand, partially offset by Q1 sales exceeding expectations (3) Reflecting an estimated combined 200 basis point adverse impact from higher freight and raw material costs, foreign currency, and lower sales due to an assumed inflationary impact on consumer demand BASED ON THE EVOLVING OPERATING ENVIRONMENT, OUR UPDATED 2022 OUTLOOK REFLECTS IMPACTS FROM FOREIGN CURRENCY, HIGHER-THAN-EXPECTED COSTS, AND AN ASSUMED INFLATIONARY IMPACT ON CONSUMER SPENDING
APPENDIX 29
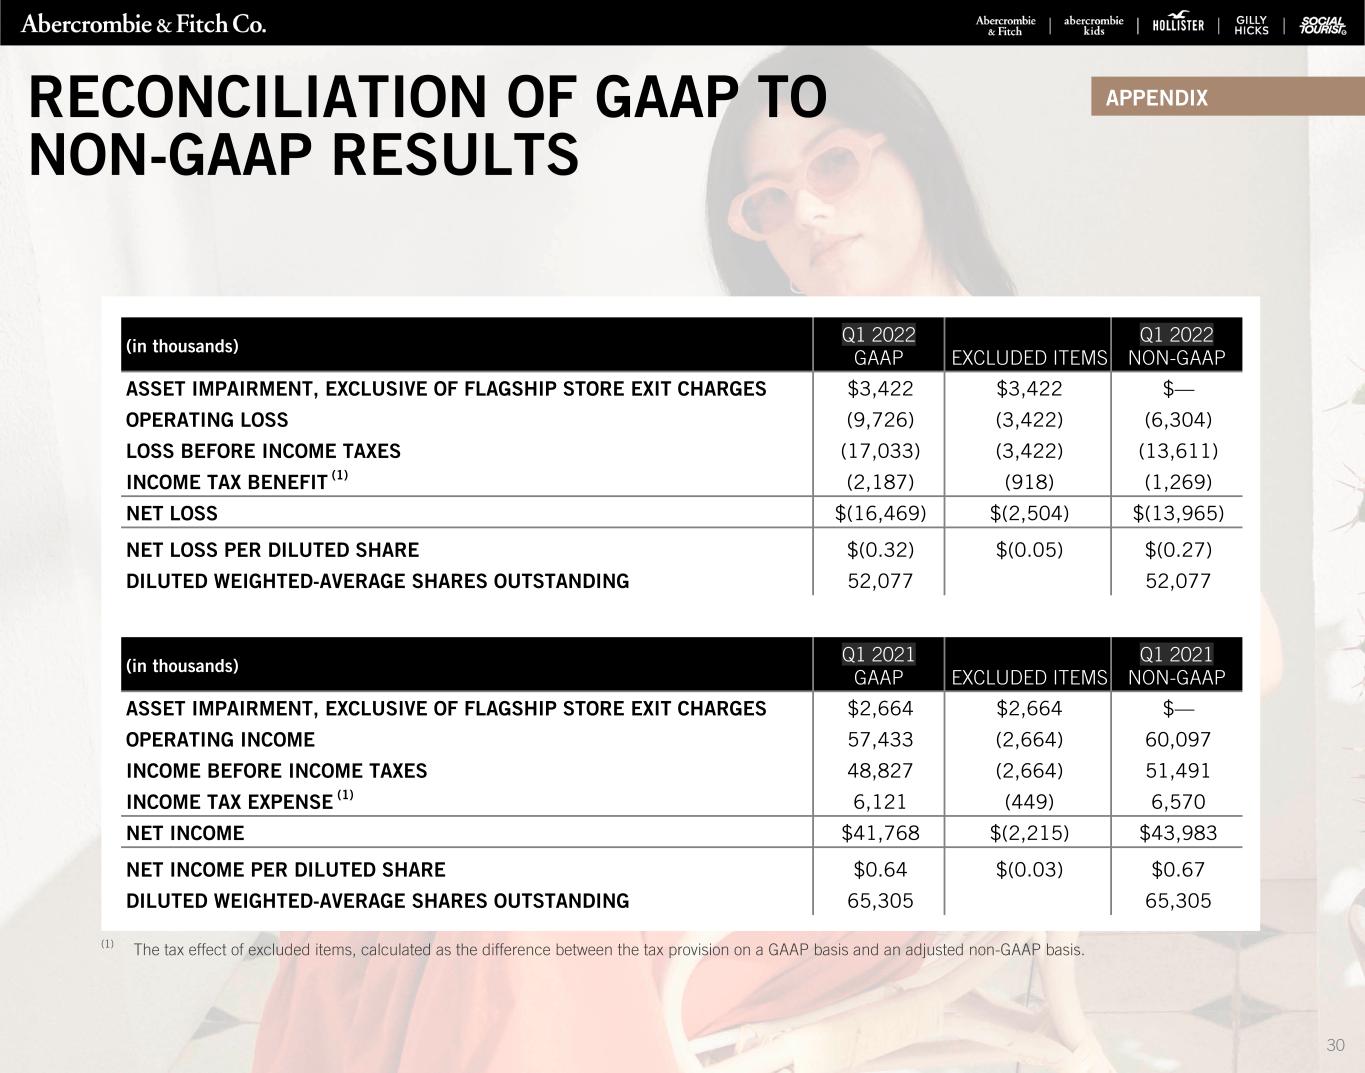
(1) The tax effect of excluded items, calculated as the difference between the tax provision on a GAAP basis and an adjusted non-GAAP basis. (in thousands) Q1 2022 GAAP EXCLUDED ITEMS Q1 2022 NON-GAAP ASSET IMPAIRMENT, EXCLUSIVE OF FLAGSHIP STORE EXIT CHARGES $3,422 $3,422 $— OPERATING LOSS (9,726) (3,422) (6,304) LOSS BEFORE INCOME TAXES (17,033) (3,422) (13,611) INCOME TAX BENEFIT (1) (2,187) (918) (1,269) NET LOSS $(16,469) $(2,504) $(13,965) NET LOSS PER DILUTED SHARE $(0.32) $(0.05) $(0.27) DILUTED WEIGHTED-AVERAGE SHARES OUTSTANDING 52,077 52,077 (in thousands) Q1 2021 GAAP EXCLUDED ITEMS Q1 2021 NON-GAAP ASSET IMPAIRMENT, EXCLUSIVE OF FLAGSHIP STORE EXIT CHARGES $2,664 $2,664 $— OPERATING INCOME 57,433 (2,664) 60,097 INCOME BEFORE INCOME TAXES 48,827 (2,664) 51,491 INCOME TAX EXPENSE (1) 6,121 (449) 6,570 NET INCOME $41,768 $(2,215) $43,983 NET INCOME PER DILUTED SHARE $0.64 $(0.03) $0.67 DILUTED WEIGHTED-AVERAGE SHARES OUTSTANDING 65,305 65,305 APPENDIX 30 RECONCILIATION OF GAAP TO NON-GAAP RESULTS
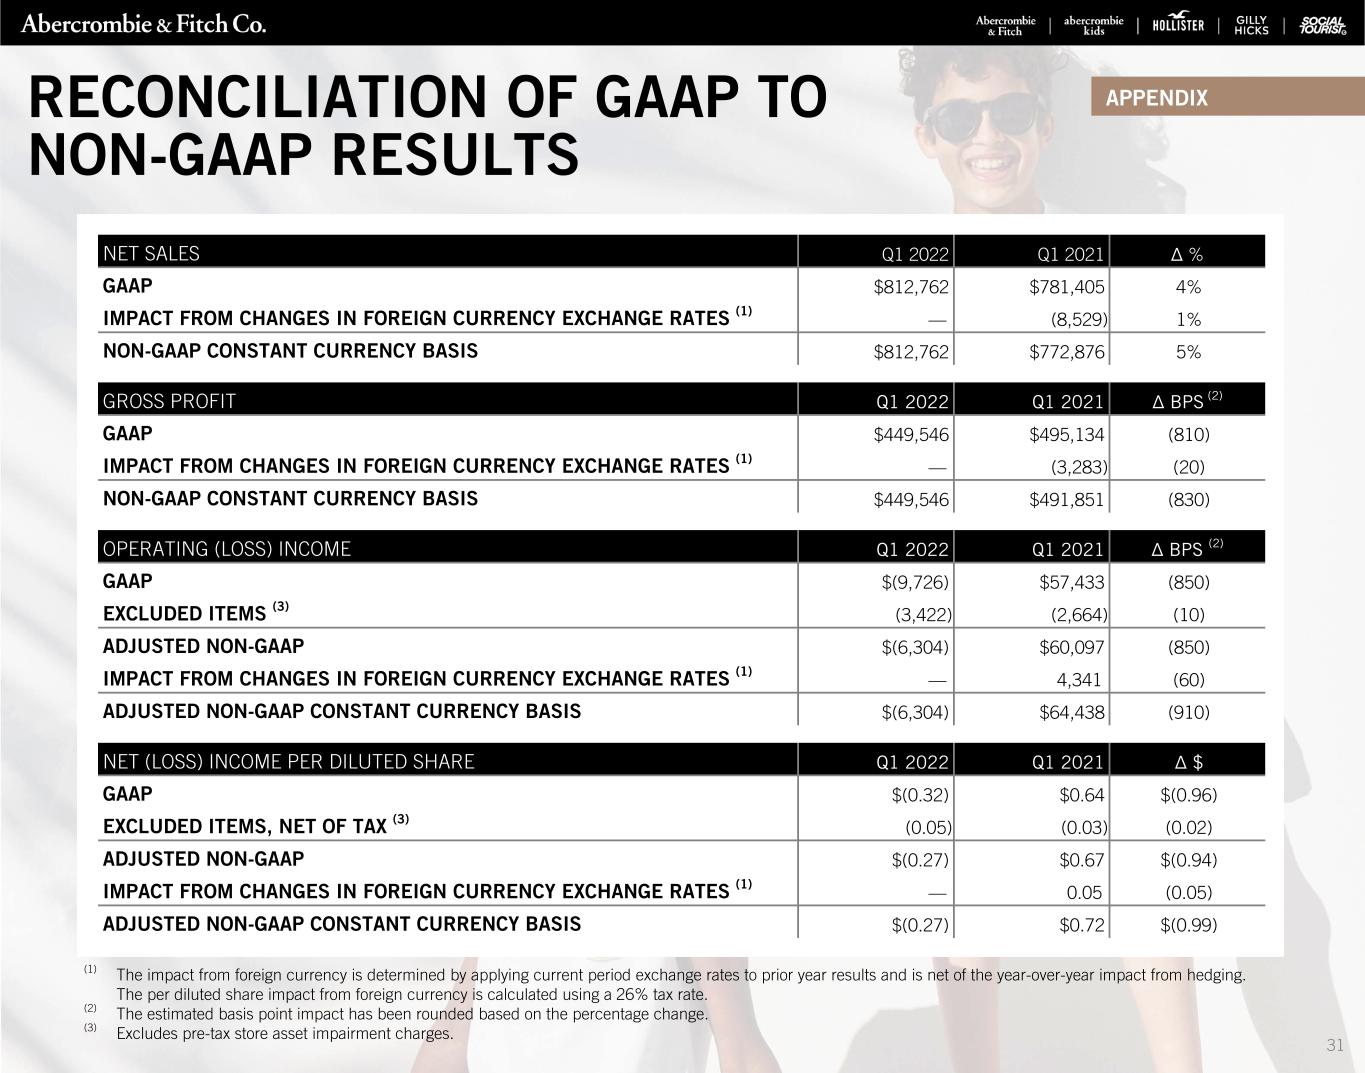
NET SALES Q1 2022 Q1 2021 Δ % GAAP $812,762 $781,405 4% IMPACT FROM CHANGES IN FOREIGN CURRENCY EXCHANGE RATES (1) — (8,529) 1% NON-GAAP CONSTANT CURRENCY BASIS $812,762 $772,876 5% GROSS PROFIT Q1 2022 Q1 2021 Δ BPS (2) GAAP $449,546 $495,134 (810) IMPACT FROM CHANGES IN FOREIGN CURRENCY EXCHANGE RATES (1) — (3,283) (20) NON-GAAP CONSTANT CURRENCY BASIS $449,546 $491,851 (830) OPERATING (LOSS) INCOME Q1 2022 Q1 2021 Δ BPS (2) GAAP $(9,726) $57,433 (850) EXCLUDED ITEMS (3) (3,422) (2,664) (10) ADJUSTED NON-GAAP $(6,304) $60,097 (850) IMPACT FROM CHANGES IN FOREIGN CURRENCY EXCHANGE RATES (1) — 4,341 (60) ADJUSTED NON-GAAP CONSTANT CURRENCY BASIS $(6,304) $64,438 (910) NET (LOSS) INCOME PER DILUTED SHARE Q1 2022 Q1 2021 Δ $ GAAP $(0.32) $0.64 $(0.96) EXCLUDED ITEMS, NET OF TAX (3) (0.05) (0.03) (0.02) ADJUSTED NON-GAAP $(0.27) $0.67 $(0.94) IMPACT FROM CHANGES IN FOREIGN CURRENCY EXCHANGE RATES (1) — 0.05 (0.05) ADJUSTED NON-GAAP CONSTANT CURRENCY BASIS $(0.27) $0.72 $(0.99) (1) The impact from foreign currency is determined by applying current period exchange rates to prior year results and is net of the year-over-year impact from hedging. The per diluted share impact from foreign currency is calculated using a 26% tax rate. (2) The estimated basis point impact has been rounded based on the percentage change. (3) Excludes pre-tax store asset impairment charges. APPENDIXRECONCILIATION OF GAAP TO NON-GAAP RESULTS 31

REFINITIV STREETEVENTS EDITED TRANSCRIPT ANF.N - Q1 2022 Abercrombie & Fitch Co Earnings Call EVENT DATE/TIME: MAY 24, 2022 / 12:30PM GMT REFINITIV STREETEVENTS | www.refinitiv.com | Contact Us ©2022 Refinitiv. All rights reserved. Republication or redistribution of Refinitiv content, including by framing or similar means, is prohibited without the prior written consent of Refinitiv. 'Refinitiv' and the Refinitiv logo are registered trademarks of Refinitiv and its affiliated companies.
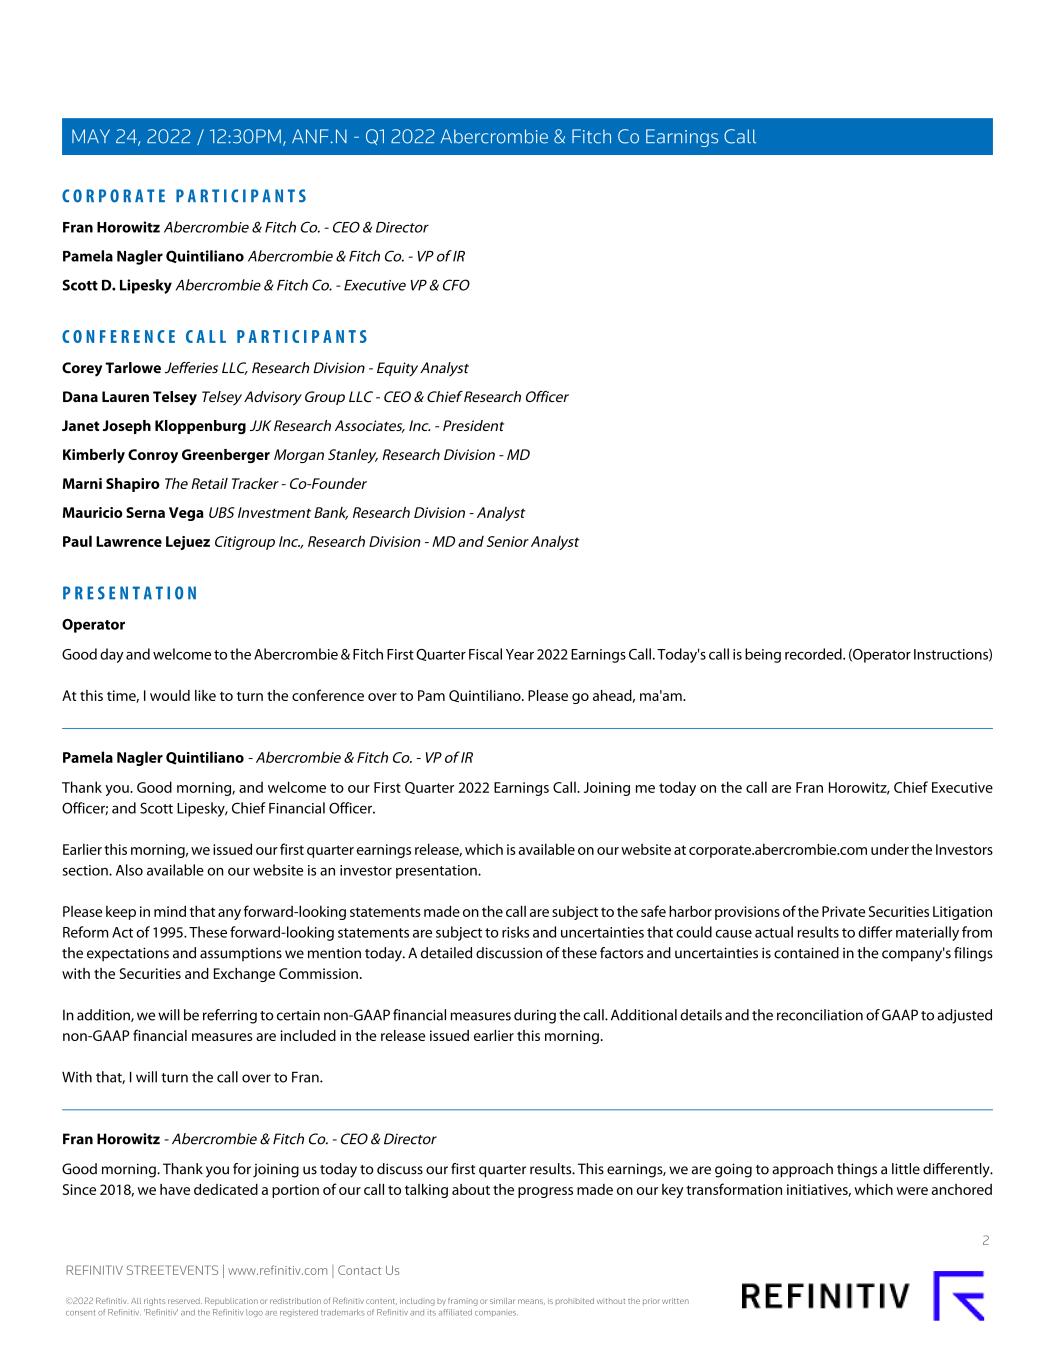
C O R P O R A T E P A R T I C I P A N T S Fran Horowitz Abercrombie & Fitch Co. - CEO & Director Pamela Nagler Quintiliano Abercrombie & Fitch Co. - VP of IR Scott D. Lipesky Abercrombie & Fitch Co. - Executive VP & CFO C O N F E R E N C E C A L L P A R T I C I P A N T S Corey Tarlowe Jefferies LLC, Research Division - Equity Analyst Dana Lauren Telsey Telsey Advisory Group LLC - CEO & Chief Research Officer Janet Joseph Kloppenburg JJK Research Associates, Inc. - President Kimberly Conroy Greenberger Morgan Stanley, Research Division - MD Marni Shapiro The Retail Tracker - Co-Founder Mauricio Serna Vega UBS Investment Bank, Research Division - Analyst Paul Lawrence Lejuez Citigroup Inc., Research Division - MD and Senior Analyst P R E S E N T A T I O N Operator Good day and welcome to the Abercrombie & Fitch First Quarter Fiscal Year 2022 Earnings Call. Today's call is being recorded. (Operator Instructions) At this time, I would like to turn the conference over to Pam Quintiliano. Please go ahead, ma'am. Pamela Nagler Quintiliano - Abercrombie & Fitch Co. - VP of IR Thank you. Good morning, and welcome to our First Quarter 2022 Earnings Call. Joining me today on the call are Fran Horowitz, Chief Executive Officer; and Scott Lipesky, Chief Financial Officer. Earlier this morning, we issued our first quarter earnings release, which is available on our website at corporate.abercrombie.com under the Investors section. Also available on our website is an investor presentation. Please keep in mind that any forward-looking statements made on the call are subject to the safe harbor provisions of the Private Securities Litigation Reform Act of 1995. These forward-looking statements are subject to risks and uncertainties that could cause actual results to differ materially from the expectations and assumptions we mention today. A detailed discussion of these factors and uncertainties is contained in the company's filings with the Securities and Exchange Commission. In addition, we will be referring to certain non-GAAP financial measures during the call. Additional details and the reconciliation of GAAP to adjusted non-GAAP financial measures are included in the release issued earlier this morning. With that, I will turn the call over to Fran. Fran Horowitz - Abercrombie & Fitch Co. - CEO & Director Good morning. Thank you for joining us today to discuss our first quarter results. This earnings, we are going to approach things a little differently. Since 2018, we have dedicated a portion of our call to talking about the progress made on our key transformation initiatives, which were anchored 2 REFINITIV STREETEVENTS | www.refinitiv.com | Contact Us ©2022 Refinitiv. All rights reserved. Republication or redistribution of Refinitiv content, including by framing or similar means, is prohibited without the prior written consent of Refinitiv. 'Refinitiv' and the Refinitiv logo are registered trademarks of Refinitiv and its affiliated companies. MAY 24, 2022 / 12:30PM, ANF.N - Q1 2022 Abercrombie & Fitch Co Earnings Call
to our goal of doubling our operating margin from 2017 levels. Last year, we not only achieved that goal, but we significantly surpassed it, more than tripling our operating margin. At our upcoming June 14 Investor Day, we will discuss the next phase of our corporate journey and how we will execute our Always Forward plan. From there, we will update you regularly on our progress. In the first quarter, we navigated yet another period of global volatility. We remained focused on controlling what we can control and never lost sight of what's important to drive our business, our customers, associates, communities and partners. We exceeded our sales plan, delivering our best Q1 revenue since 2014 despite several major headwinds, including: the lapping of stimulus and return to in-person learning for much of the U.S. last March; global inflationary pressures, significant COVID restrictions in China; and the conflict in Ukraine. For the quarter, total company revenues rose 4% year-over-year, above our outlook for a low single-digit increase. Abercrombie continued to outperform, rising 13% on top of a 60% gain last year. By region, our largest market, the U.S. registered a 6% increase, while international was flat. EMEA accelerated from last quarter and last year, benefiting from the reopening of our largest country in that region, the U.K. In APAC, China remained challenged due to COVID-related lockdowns. Our global revenues were healthy. Customers continue to respond favorably to our product, voice and experience, and we achieved our eighth consecutive quarter of AUR improvement as we benefited from higher tickets and slightly lower promotional activity. As a reminder, we implemented targeted ticket increases in the first quarter based on competitive pricing analysis. We took advantage of colder weather conditions to push through the delayed Q4 receipts to ensure we were clean for spring. Scott will discuss those pressures in more detail, but we remain focused on navigating through these near-term challenges while delivering the right product at the right time, at the right price. Looking ahead, we expect freight and raw material costs to remain elevated. We plan to tightly manage inventories and expenses and are actioning opportunities to offset a portion of these costs. We are carefully evaluating these opportunities and do not plan on trimming areas that support our longer-term growth strategies. Now on to the brands. Q1 represented a continuation of the Abercrombie brand's remarkable turnaround. Abercrombie adults delivered its best first quarter sales since 2014 and its highest Q1 AUR in brand history, benefiting from higher tickets and lower discounting. Results were led by ongoing strength in North America, which posted its highest sales since 2012, although we did also experience a sequential improvement on an international basis. And while we have heard that the consumer is spending more on experiences, our millennial Abercrombie customer is coming to us to refresh their wardrobe as they get back out there. And with an unwavering dedication to listening to our customers about the new, trending styles and fits they're looking for, we've been able to expand market share. And we're not just winning in 1 or 2 areas, strength was broad-based, with multiple categories registering growth. In women's, denim, dresses and knits were standouts, all delivering their highest Q1 sales and AUR in over a decade. In men's, our target customer is also taking notice of the changes we have made. Tops, which is our largest men's revenue driver were strong, with growth in graphics, sweaters and wovens. There is so much more market share opportunity at Abercrombie. In March, we launched YPB, or Your Personal Best. After hearing from customers, they want us to deliver a performance active line with the same dedication to fit, comfort and confidence they experience in our regular assortment. YPB has received high praise from customers, influencers, affiliates and media for its fit, fashion and function. The launch has truly served as a reflection of our personal best, far exceeding expectations. We sold out of over 25% of our SKUs within weeks of the launch and have been quickly working to replenish. The speed with which customers have embraced YPB gives us even more confidence in its future. A big part of Abercrombie's success can be attributed to our marketing team. Throughout the quarter, they continued to tap into human-powered brand building through our influencer and affiliate network, which we view as a vital social commerce revenue stream. In Q1, Abercrombie was the recipient of LTK's most loved product awards in multiple categories, had its best social commerce quarter ever with significant double-digit year-over-year growth and achieved volumes that beat our previous record, which we just hit last quarter. And we are not satisfied. We intend to continue building on the rapid rise of this channel as the team innovates and invents new possibilities. We're excited for Q2. Stay tuned for the third annual Abercrombie Pride collection codesigned with our partners, The Trevor Project, an organization that provides 3 REFINITIV STREETEVENTS | www.refinitiv.com | Contact Us ©2022 Refinitiv. All rights reserved. Republication or redistribution of Refinitiv content, including by framing or similar means, is prohibited without the prior written consent of Refinitiv. 'Refinitiv' and the Refinitiv logo are registered trademarks of Refinitiv and its affiliated companies. MAY 24, 2022 / 12:30PM, ANF.N - Q1 2022 Abercrombie & Fitch Co Earnings Call
a essential services benefiting [LGBTQs]. In June, we're set to launch a getaway-inspired collaboration with 2 influencer friends of the brand, Champagne and Chanel and Dress Up Buttercup. And soon to come, we'll be bringing our popular Curve Love fits to both tops and bottoms in our YPB line. Now on to Abercrombie Kids. During the quarter, we experienced strong conversion and a record-setting basket size. Our comfy, dressy assortments for Easter and spring break drove results. In addition, we had our best Q1 swim season ever and our franchise collections, the cool stuff ready for play active and made for life essentials were well-received. Turning to Hollister, which includes Gilly Hicks and Social Tourist. In North America, we delivered our second-best sales results since 2012 behind only last year, even as we lapped stimulus and the mini back-to-school season in March. Internationally, although trends improved dramatically from last year and last quarter, the business has not yet returned to pre-pandemic levels. Taken together, global sales were in line with our expectations, declining 3% for the quarter. We continue to emphasize our top 30 items and must-win categories, which led the way in the first quarter, and we experienced strength in women's dresses, and fleece and men's woven, and swim. In denim, our customer embraced newer widere-leg fashion assortments, although skinny remains an important part of her wardrobe. Social commerce and affiliate growth continued to be key drivers of our success. In February, we wrapped our Respect the Jeans campaign, which was done in partnership with Black-ish Star and Gen Z favorite, Marsai Martin. The campaign outperformed benchmark goals, driving 11 million impressions and also won Gen Z over on TikTok, with benchmark-beating engagement and comments such as, "Now this is how you do an ad." During the quarter, we also launched our monthly Facebook Live shopping event, which drove social commerce sales up an average of 20%. Now let's talk about Gilly Hicks, where we continue to be excited about the global growth opportunity ahead. Customer response to our updated carve-out and side-by-side locations, which incorporate key elements of our stand-alone store has been very encouraging, with these locations outperforming the balance of the chain. We're also bringing our updated store concept to our global customer. We recently opened our first Gilly Hicks stand-alone EMEA store a few weeks ago in Centro Oberhausen, Germany, and plan to introduce more stores throughout the year, including Carnaby Street in London this summer. Last but not least, Social Tourist. Our newest brand has an engaged fan base who is providing valuable insights into up-and-coming fashion trends and the shopping habits of social-first customers, which we have applied to the brand and to our broader portfolio. Looking ahead, there's a lot of excitement at all 3 brands under the Hollister umbrella. In partnership with GLSEN, an organization that works to make K-12 schools feel safe and inclusive for LGBTQ+ students, we will be launching our sixth annual Hollister Pride Collection. At Gilly Hicks, we have plans to expand our active lifestyle collection, Gilly Go, which has consistently been our top performer since its launch. And at Social Tourist, we are set to open a pop-up shop on Melrose Avenue in Los Angeles, which will be the brand's first stand-alone experience. The pop-up will feature always on social content and programming, monthly activations, including consumer influencer events and PR engagement and visits from Dixie and Charli to meet customers, so exciting. Before turning it over to Scott, I want to take a moment to discuss our thoughts on the health of our global consumer. It is an interesting time. The weather has started to become more seasonal, and collectively, it seems as though we are ready to return to some form of normalcy. In our largest market, the U.S., unemployment is currently low, wages are high and there's hunger to participate in many of the social activities that were missed over the last 2-plus years. However, we are in an extreme inflationary period where experience, everything from food to gas is costing more and we expect those pressures to weigh on consumer confidence. We are keeping a close eye on each of our respective consumers and how they're being impacted and responding. With 5 distinct brands, we will not take a one size fits all approach. We will stay close to our customers and have the ability to quickly recalibrate reflecting their unique stages in life activities and pressure points. Internationally, while encouraged by recent improvements in EMEA, we are cognizant that our European customer is faced with similar inflationary pressures and is more directly impacted from the situation in Ukraine. Across the globe, we know there are a lot of options on where to spend, and as always, we will focus on offering a compelling and inclusive product, voice and experience for each of our respective customer bases with a commitment to fashion, fit and quality. We remain focused on profitable 4 REFINITIV STREETEVENTS | www.refinitiv.com | Contact Us ©2022 Refinitiv. All rights reserved. Republication or redistribution of Refinitiv content, including by framing or similar means, is prohibited without the prior written consent of Refinitiv. 'Refinitiv' and the Refinitiv logo are registered trademarks of Refinitiv and its affiliated companies. MAY 24, 2022 / 12:30PM, ANF.N - Q1 2022 Abercrombie & Fitch Co Earnings Call
growth through leveraging strategic planned promotions, and we intend to tightly manage expenses with the goal of offsetting a portion of freight and raw material inflation. In closing, I would like to reiterate my confidence in our future. We are staying close to our customer and executing to our proven playbooks. With our strong balance sheet, we are well equipped to navigate the current environment and its challenges. We have clearly defined positioning at each of our brands and remain focused on our long-term opportunities. Reflecting the successful execution of our key transformation initiatives, we believe that we are stronger, smarter and faster than ever before and have the foundation firmly in place for the next phase of our corporate journey and our Always Forward plan, which we look forward to sharing in more detail at our June 14 Investor Day. And with that, I will turn it over to Scott. Scott D. Lipesky - Abercrombie & Fitch Co. - Executive VP & CFO Thanks, Fran, and good morning. Over the past several years, we have been providing financial comparisons on a 1- and 2-year basis. Starting this quarter, our discussions will only focus on the year ago period. Now on to Q1 results. In the first quarter, we delivered net sales of $813 million, our highest Q1 since 2014. Sales were up 4% to last year, ahead of our expectation coming into the quarter for a low single-digit increase, despite an estimated combined 100 basis point adverse impact from foreign currency volatility and the COVID-driven lockdowns in China. Net sales were above expectations at Abercrombie, which includes kids, rising 13% compared to 2021; and in line with our expectations at Hollister, which includes Gilly Hicks and Social Tourist, declining 3%. This compares to prior year growth of 60% and 62%, respectively. By region, net sales increased 6% in the U.S. and were flat internationally. Parsing out international. EMEA sales increased year-over-year as COVID-related restrictions were mostly lifted in our larger markets. Our biggest country in EMEA, the U.K., led results, although we were pleased to see year-over-year improvements in Germany and France later in the quarter. In APAC, China remained a challenge with the prolonged COVID-related lockdown in Shanghai, which is one of our largest markets in the region. Moving on to gross profit. Our rate was 55.3% versus 63.4% last year. We continued to increase AUR, registering our eighth consecutive quarter of AUR gains, driven by reductions in the depth and breadth of promotional activity and selective ticket increases, which we took for the first time this quarter. AUR growth was more than offset by higher AUCs, reflecting 2 factors. First, a higher-than-expected freight costs. In total, freight costs were approximately $80 million above last year and roughly $15 million above our estimate. In the current highly volatile global supply chain environment, the estimated freight rates and our outlook proved to be lower than actual rates. Second, we made the decision to take advantage of the unseasonably cold temperatures to proactively accelerate the sell-through of late holiday goods in Hollister and Gilly Hicks, which as a reminder, had the highest exposure to Vietnam-related receipt delays. These clearance sales came with a lower gross margin than our spring goods, causing a reduction in our Q1 rate. Ending the quarter, our inventory is in a good position in all brands. Looking forward, we expect the impact from both of these factors to moderate in Q2 and beyond as we lap rising freight rates from last year and carryover inventory inherently becomes a significantly smaller portion of our sales mix. Moving on to the health of our inventories. We came into Q2 with our in-stocks in a much better place as we have realized the benefits of the multiple adjustments made to our product and sourcing playbooks to ensure timely deliveries. These efforts include diversifying carriers and ports of entry, adjusting our product calendars and further diversifying our countries of origin. We expect these collective efforts to result in more predictable inventory flows, pending additional unforeseen shocks to the supply chain. We ended Q1 with units up 10% off a multiyear low last year and total inventory up 45%, with higher freight costs and in-transit inventory each contributing around 17 percentage points to the increase. As we look to the rest of the year, we expect inventory levels to remain above last year as we flow product in early to guard against potential supply chain disruptions. This compares to last year, where we saw inventory receipt delays increased throughout the year. 5 REFINITIV STREETEVENTS | www.refinitiv.com | Contact Us ©2022 Refinitiv. All rights reserved. Republication or redistribution of Refinitiv content, including by framing or similar means, is prohibited without the prior written consent of Refinitiv. 'Refinitiv' and the Refinitiv logo are registered trademarks of Refinitiv and its affiliated companies. MAY 24, 2022 / 12:30PM, ANF.N - Q1 2022 Abercrombie & Fitch Co Earnings Call
I'll now cover the rest of our Q1 results on an adjusted non-GAAP basis. Excluded from our non-GAAP results this quarter are $3 million of pretax asset impairment charges, which adversely impacted results by approximately $0.05 and -- last year, we excluded $3 million of pretax asset impairment charges, which adversely impacted results by $0.03. Operating expense, excluding other operating income, was $460 million compared to $436 million last year, with approximately half of the increase due to lapping COVID-related rent abatements and government assistance recognized in Q1 2021, and the other half related to investments in marketing and higher digital fulfillment expense. We had an operating loss of $6 million compared to an operating income of $60 million last year. The effective tax rate was 9.3%. Net loss per share was $0.27 compared to net income per diluted share of $0.67 last year. Taking a look at the balance sheet. We ended Q1 with cash of $468 million and liquidity of $783 million. During the quarter, we made further progress in utilizing excess liquidity with continued returns to shareholders through share repurchases. In the first quarter, we repurchased approximately 3.3 million shares for $100 million. At quarter end, we had 50.4 million shares outstanding, down 19% from the start of 2021 and approximately 258 million remaining under our previously authorized share repurchase program. We remain committed to putting excess cash to work and expect to continue to focus on share repurchases, pending market conditions, share price and our ability to accelerate investments in the business. On investments, we expect fiscal 2022 CapEx to be approximately $150 million, with about half related to digital and technology and the other half related to stores and maintenance. As a reminder, we expect to be a net store opener this year for the first time in over a decade and now expect to open approximately 60 new stores this year, up from our prior assumption of 50 new stores. These openings will be weighted towards the back half. This year, we have roughly 250 leases up for renewal, around 33% of our base, which is higher than the last few years, when we were closer to 25%. In line with our prior projections, we expect to close around 30 stores this year, pending negotiations with our landlord partners. I'll finish up with our thoughts on the remainder of the year. As noted in our press release, we are updating how we provide guidance. Going forward, we will provide a sales and operating margin outlook. The reasoning is twofold. First, this approach better aligns with our industry peers. Second, with the current and likely continued volatility in freight and raw material costs, we expect to flex operating expenses in response to unforeseen swings, whether positive or negative. In our updated outlook, which replaces our previous full year outlook, we are making an assumption for inflation-related pressure on consumer demand and also that freight rates will remain at peak levels for the remainder of the year. From a supply chain perspective, our outlook does not anticipate a similar magnitude of inventory delays as experienced last year due to the Vietnam shutdown, but we are closely monitoring the lockdowns in China. For the full year, we are planning as follows: net sales to be flat to up 2% to 2021 level of approximately $3.7 billion. Embedded in this outlook is a combined estimated adverse impact of approximately 200 basis points from foreign currency and inflationary pressure on consumer demand, partially offset by outperformance in Q1. Operating margin in the range of 5% to 6%, down from our previous range of 7% to 8%, reflecting an estimated combined 200 basis point adverse impact from higher freight and raw material costs, foreign currency and lower sales, and an effective tax rate in the mid-30s. For the second quarter, we are planning as follows: net sales to be down low single digits to 2021 level of approximately $865 million. Embedded in this outlook is an estimated adverse impact of approximately 300 basis points from foreign currency and COVID-related lockdowns in China and an approximately 300 basis point adverse impact due to an assumed inflationary pressure on consumer demand. Operating margin in the range of 3% to 4%, with the year-over-year decline driven by higher freight and raw material costs. And an effective tax rate in the mid- to high 30s as the rate remains sensitive at lower levels of income. 6 REFINITIV STREETEVENTS | www.refinitiv.com | Contact Us ©2022 Refinitiv. All rights reserved. Republication or redistribution of Refinitiv content, including by framing or similar means, is prohibited without the prior written consent of Refinitiv. 'Refinitiv' and the Refinitiv logo are registered trademarks of Refinitiv and its affiliated companies. MAY 24, 2022 / 12:30PM, ANF.N - Q1 2022 Abercrombie & Fitch Co Earnings Call
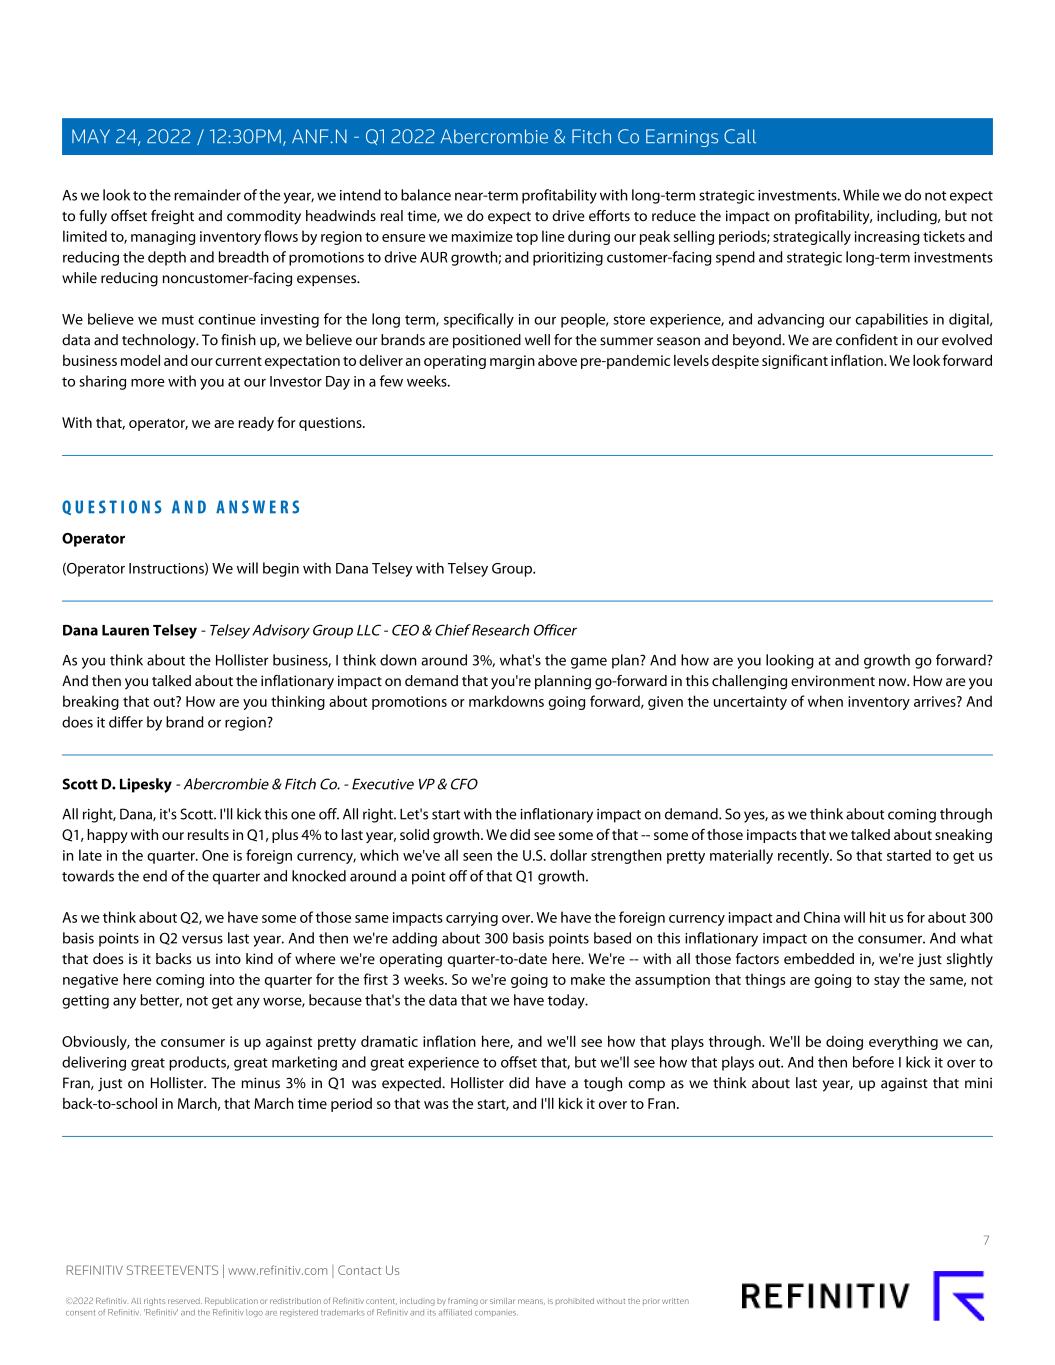
As we look to the remainder of the year, we intend to balance near-term profitability with long-term strategic investments. While we do not expect to fully offset freight and commodity headwinds real time, we do expect to drive efforts to reduce the impact on profitability, including, but not limited to, managing inventory flows by region to ensure we maximize top line during our peak selling periods; strategically increasing tickets and reducing the depth and breadth of promotions to drive AUR growth; and prioritizing customer-facing spend and strategic long-term investments while reducing noncustomer-facing expenses. We believe we must continue investing for the long term, specifically in our people, store experience, and advancing our capabilities in digital, data and technology. To finish up, we believe our brands are positioned well for the summer season and beyond. We are confident in our evolved business model and our current expectation to deliver an operating margin above pre-pandemic levels despite significant inflation. We look forward to sharing more with you at our Investor Day in a few weeks. With that, operator, we are ready for questions. Q U E S T I O N S A N D A N S W E R S Operator (Operator Instructions) We will begin with Dana Telsey with Telsey Group. Dana Lauren Telsey - Telsey Advisory Group LLC - CEO & Chief Research Officer As you think about the Hollister business, I think down around 3%, what's the game plan? And how are you looking at and growth go forward? And then you talked about the inflationary impact on demand that you're planning go-forward in this challenging environment now. How are you breaking that out? How are you thinking about promotions or markdowns going forward, given the uncertainty of when inventory arrives? And does it differ by brand or region? Scott D. Lipesky - Abercrombie & Fitch Co. - Executive VP & CFO All right, Dana, it's Scott. I'll kick this one off. All right. Let's start with the inflationary impact on demand. So yes, as we think about coming through Q1, happy with our results in Q1, plus 4% to last year, solid growth. We did see some of that -- some of those impacts that we talked about sneaking in late in the quarter. One is foreign currency, which we've all seen the U.S. dollar strengthen pretty materially recently. So that started to get us towards the end of the quarter and knocked around a point off of that Q1 growth. As we think about Q2, we have some of those same impacts carrying over. We have the foreign currency impact and China will hit us for about 300 basis points in Q2 versus last year. And then we're adding about 300 basis points based on this inflationary impact on the consumer. And what that does is it backs us into kind of where we're operating quarter-to-date here. We're -- with all those factors embedded in, we're just slightly negative here coming into the quarter for the first 3 weeks. So we're going to make the assumption that things are going to stay the same, not getting any better, not get any worse, because that's the data that we have today. Obviously, the consumer is up against pretty dramatic inflation here, and we'll see how that plays through. We'll be doing everything we can, delivering great products, great marketing and great experience to offset that, but we'll see how that plays out. And then before I kick it over to Fran, just on Hollister. The minus 3% in Q1 was expected. Hollister did have a tough comp as we think about last year, up against that mini back-to-school in March, that March time period so that was the start, and I'll kick it over to Fran. 7 REFINITIV STREETEVENTS | www.refinitiv.com | Contact Us ©2022 Refinitiv. All rights reserved. Republication or redistribution of Refinitiv content, including by framing or similar means, is prohibited without the prior written consent of Refinitiv. 'Refinitiv' and the Refinitiv logo are registered trademarks of Refinitiv and its affiliated companies. MAY 24, 2022 / 12:30PM, ANF.N - Q1 2022 Abercrombie & Fitch Co Earnings Call
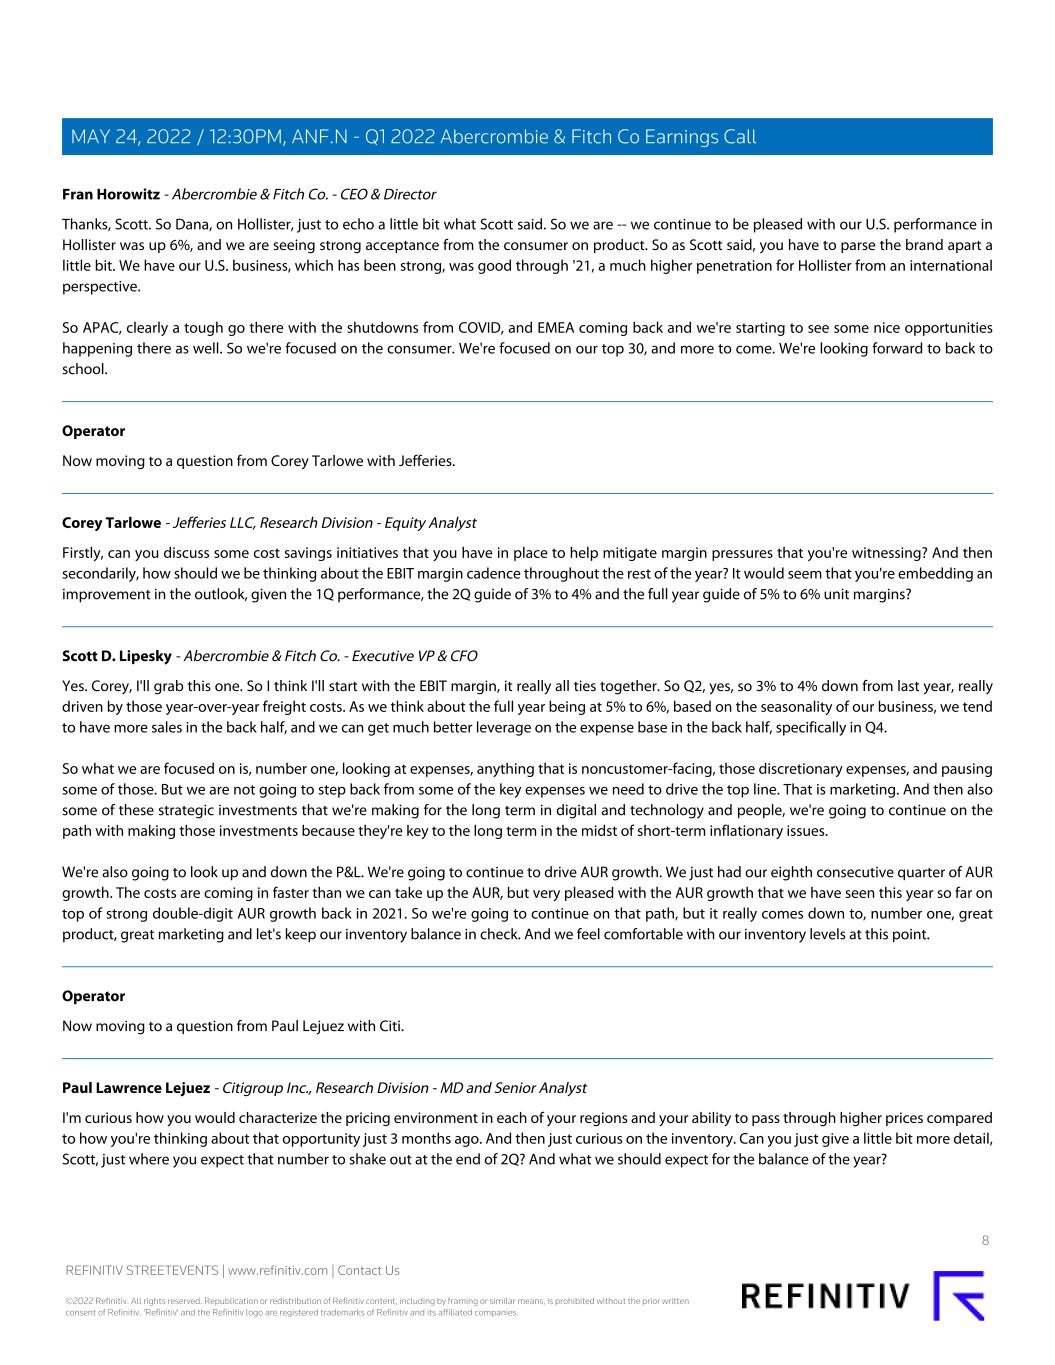
Fran Horowitz - Abercrombie & Fitch Co. - CEO & Director Thanks, Scott. So Dana, on Hollister, just to echo a little bit what Scott said. So we are -- we continue to be pleased with our U.S. performance in Hollister was up 6%, and we are seeing strong acceptance from the consumer on product. So as Scott said, you have to parse the brand apart a little bit. We have our U.S. business, which has been strong, was good through '21, a much higher penetration for Hollister from an international perspective. So APAC, clearly a tough go there with the shutdowns from COVID, and EMEA coming back and we're starting to see some nice opportunities happening there as well. So we're focused on the consumer. We're focused on our top 30, and more to come. We're looking forward to back to school. Operator Now moving to a question from Corey Tarlowe with Jefferies. Corey Tarlowe - Jefferies LLC, Research Division - Equity Analyst Firstly, can you discuss some cost savings initiatives that you have in place to help mitigate margin pressures that you're witnessing? And then secondarily, how should we be thinking about the EBIT margin cadence throughout the rest of the year? It would seem that you're embedding an improvement in the outlook, given the 1Q performance, the 2Q guide of 3% to 4% and the full year guide of 5% to 6% unit margins? Scott D. Lipesky - Abercrombie & Fitch Co. - Executive VP & CFO Yes. Corey, I'll grab this one. So I think I'll start with the EBIT margin, it really all ties together. So Q2, yes, so 3% to 4% down from last year, really driven by those year-over-year freight costs. As we think about the full year being at 5% to 6%, based on the seasonality of our business, we tend to have more sales in the back half, and we can get much better leverage on the expense base in the back half, specifically in Q4. So what we are focused on is, number one, looking at expenses, anything that is noncustomer-facing, those discretionary expenses, and pausing some of those. But we are not going to step back from some of the key expenses we need to drive the top line. That is marketing. And then also some of these strategic investments that we're making for the long term in digital and technology and people, we're going to continue on the path with making those investments because they're key to the long term in the midst of short-term inflationary issues. We're also going to look up and down the P&L. We're going to continue to drive AUR growth. We just had our eighth consecutive quarter of AUR growth. The costs are coming in faster than we can take up the AUR, but very pleased with the AUR growth that we have seen this year so far on top of strong double-digit AUR growth back in 2021. So we're going to continue on that path, but it really comes down to, number one, great product, great marketing and let's keep our inventory balance in check. And we feel comfortable with our inventory levels at this point. Operator Now moving to a question from Paul Lejuez with Citi. Paul Lawrence Lejuez - Citigroup Inc., Research Division - MD and Senior Analyst I'm curious how you would characterize the pricing environment in each of your regions and your ability to pass through higher prices compared to how you're thinking about that opportunity just 3 months ago. And then just curious on the inventory. Can you just give a little bit more detail, Scott, just where you expect that number to shake out at the end of 2Q? And what we should expect for the balance of the year? 8 REFINITIV STREETEVENTS | www.refinitiv.com | Contact Us ©2022 Refinitiv. All rights reserved. Republication or redistribution of Refinitiv content, including by framing or similar means, is prohibited without the prior written consent of Refinitiv. 'Refinitiv' and the Refinitiv logo are registered trademarks of Refinitiv and its affiliated companies. MAY 24, 2022 / 12:30PM, ANF.N - Q1 2022 Abercrombie & Fitch Co Earnings Call
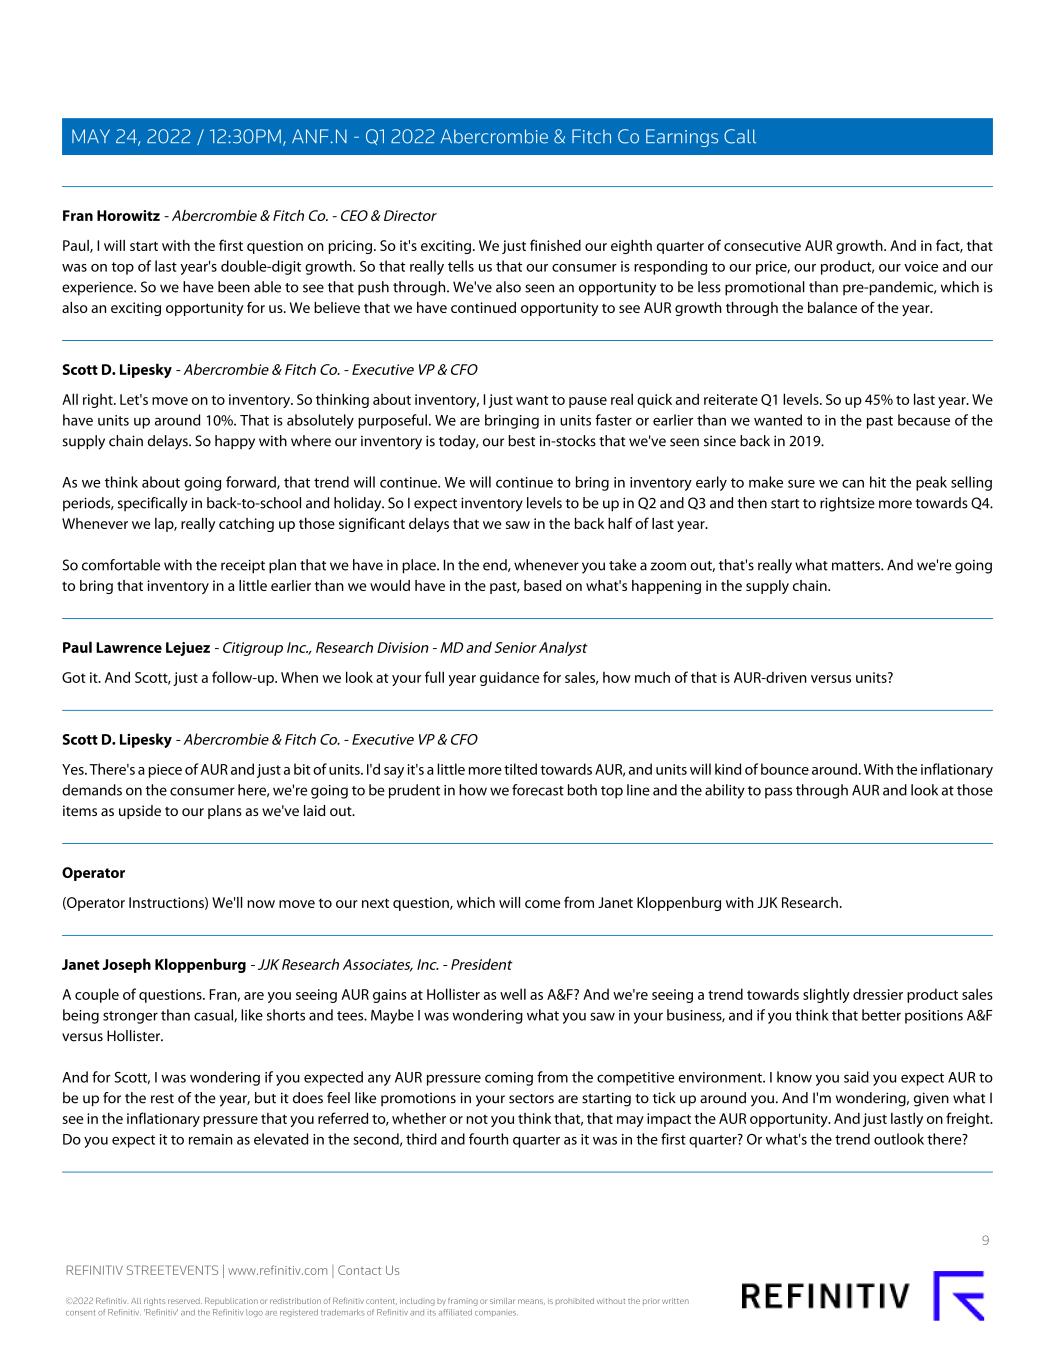
Fran Horowitz - Abercrombie & Fitch Co. - CEO & Director Paul, I will start with the first question on pricing. So it's exciting. We just finished our eighth quarter of consecutive AUR growth. And in fact, that was on top of last year's double-digit growth. So that really tells us that our consumer is responding to our price, our product, our voice and our experience. So we have been able to see that push through. We've also seen an opportunity to be less promotional than pre-pandemic, which is also an exciting opportunity for us. We believe that we have continued opportunity to see AUR growth through the balance of the year. Scott D. Lipesky - Abercrombie & Fitch Co. - Executive VP & CFO All right. Let's move on to inventory. So thinking about inventory, I just want to pause real quick and reiterate Q1 levels. So up 45% to last year. We have units up around 10%. That is absolutely purposeful. We are bringing in units faster or earlier than we wanted to in the past because of the supply chain delays. So happy with where our inventory is today, our best in-stocks that we've seen since back in 2019. As we think about going forward, that trend will continue. We will continue to bring in inventory early to make sure we can hit the peak selling periods, specifically in back-to-school and holiday. So I expect inventory levels to be up in Q2 and Q3 and then start to rightsize more towards Q4. Whenever we lap, really catching up those significant delays that we saw in the back half of last year. So comfortable with the receipt plan that we have in place. In the end, whenever you take a zoom out, that's really what matters. And we're going to bring that inventory in a little earlier than we would have in the past, based on what's happening in the supply chain. Paul Lawrence Lejuez - Citigroup Inc., Research Division - MD and Senior Analyst Got it. And Scott, just a follow-up. When we look at your full year guidance for sales, how much of that is AUR-driven versus units? Scott D. Lipesky - Abercrombie & Fitch Co. - Executive VP & CFO Yes. There's a piece of AUR and just a bit of units. I'd say it's a little more tilted towards AUR, and units will kind of bounce around. With the inflationary demands on the consumer here, we're going to be prudent in how we forecast both top line and the ability to pass through AUR and look at those items as upside to our plans as we've laid out. Operator (Operator Instructions) We'll now move to our next question, which will come from Janet Kloppenburg with JJK Research. Janet Joseph Kloppenburg - JJK Research Associates, Inc. - President A couple of questions. Fran, are you seeing AUR gains at Hollister as well as A&F? And we're seeing a trend towards slightly dressier product sales being stronger than casual, like shorts and tees. Maybe I was wondering what you saw in your business, and if you think that better positions A&F versus Hollister. And for Scott, I was wondering if you expected any AUR pressure coming from the competitive environment. I know you said you expect AUR to be up for the rest of the year, but it does feel like promotions in your sectors are starting to tick up around you. And I'm wondering, given what I see in the inflationary pressure that you referred to, whether or not you think that, that may impact the AUR opportunity. And just lastly on freight. Do you expect it to remain as elevated in the second, third and fourth quarter as it was in the first quarter? Or what's the trend outlook there? 9 REFINITIV STREETEVENTS | www.refinitiv.com | Contact Us ©2022 Refinitiv. All rights reserved. Republication or redistribution of Refinitiv content, including by framing or similar means, is prohibited without the prior written consent of Refinitiv. 'Refinitiv' and the Refinitiv logo are registered trademarks of Refinitiv and its affiliated companies. MAY 24, 2022 / 12:30PM, ANF.N - Q1 2022 Abercrombie & Fitch Co Earnings Call
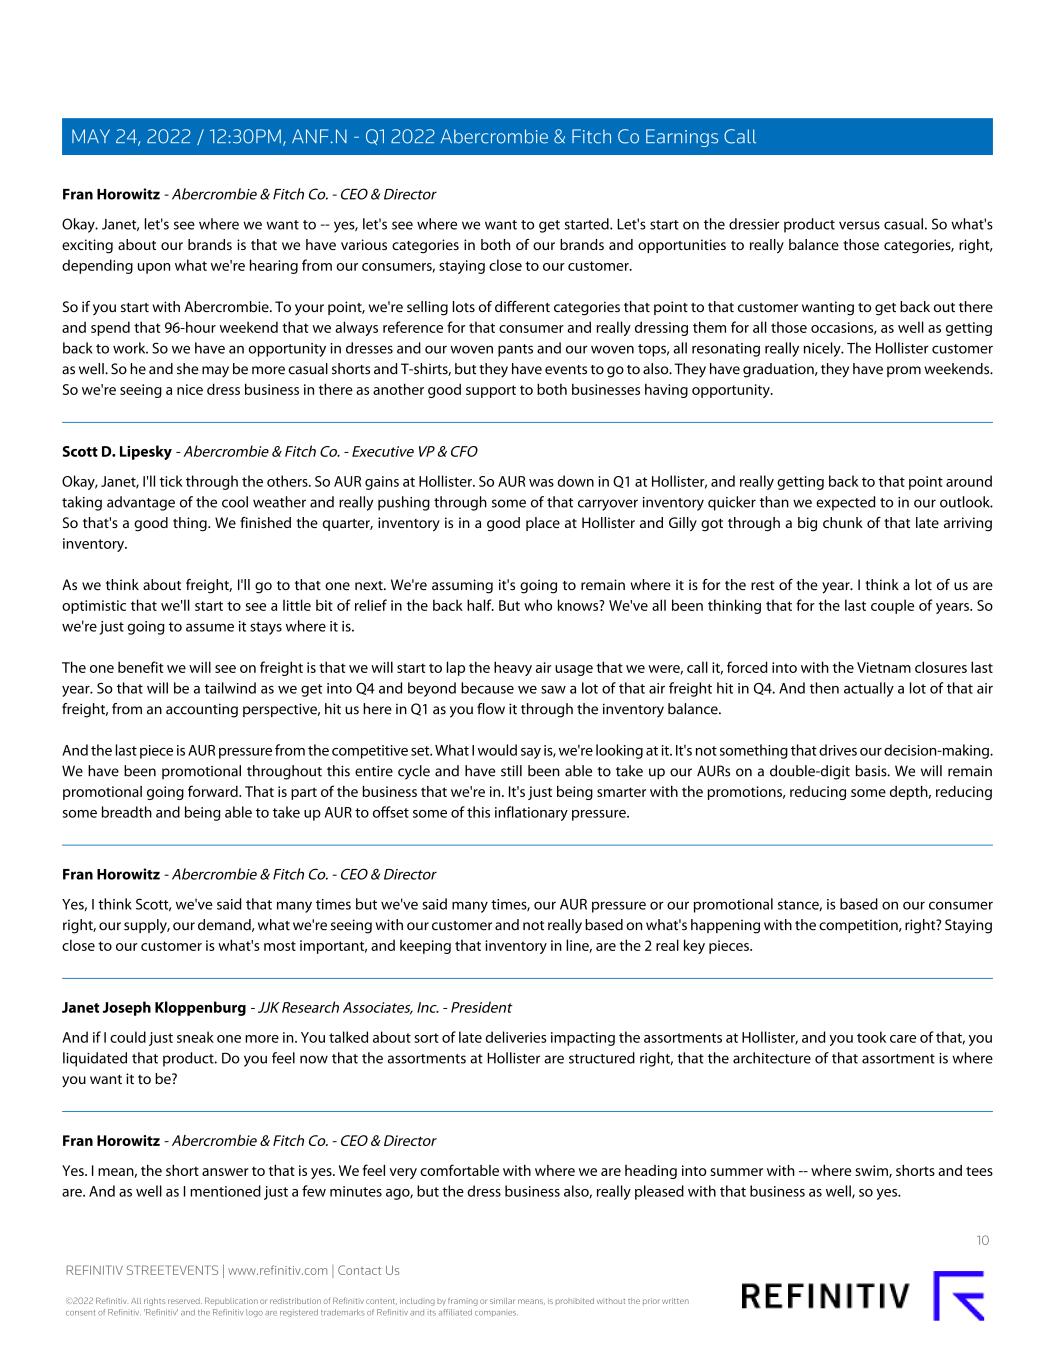
Fran Horowitz - Abercrombie & Fitch Co. - CEO & Director Okay. Janet, let's see where we want to -- yes, let's see where we want to get started. Let's start on the dressier product versus casual. So what's exciting about our brands is that we have various categories in both of our brands and opportunities to really balance those categories, right, depending upon what we're hearing from our consumers, staying close to our customer. So if you start with Abercrombie. To your point, we're selling lots of different categories that point to that customer wanting to get back out there and spend that 96-hour weekend that we always reference for that consumer and really dressing them for all those occasions, as well as getting back to work. So we have an opportunity in dresses and our woven pants and our woven tops, all resonating really nicely. The Hollister customer as well. So he and she may be more casual shorts and T-shirts, but they have events to go to also. They have graduation, they have prom weekends. So we're seeing a nice dress business in there as another good support to both businesses having opportunity. Scott D. Lipesky - Abercrombie & Fitch Co. - Executive VP & CFO Okay, Janet, I'll tick through the others. So AUR gains at Hollister. So AUR was down in Q1 at Hollister, and really getting back to that point around taking advantage of the cool weather and really pushing through some of that carryover inventory quicker than we expected to in our outlook. So that's a good thing. We finished the quarter, inventory is in a good place at Hollister and Gilly got through a big chunk of that late arriving inventory. As we think about freight, I'll go to that one next. We're assuming it's going to remain where it is for the rest of the year. I think a lot of us are optimistic that we'll start to see a little bit of relief in the back half. But who knows? We've all been thinking that for the last couple of years. So we're just going to assume it stays where it is. The one benefit we will see on freight is that we will start to lap the heavy air usage that we were, call it, forced into with the Vietnam closures last year. So that will be a tailwind as we get into Q4 and beyond because we saw a lot of that air freight hit in Q4. And then actually a lot of that air freight, from an accounting perspective, hit us here in Q1 as you flow it through the inventory balance. And the last piece is AUR pressure from the competitive set. What I would say is, we're looking at it. It's not something that drives our decision-making. We have been promotional throughout this entire cycle and have still been able to take up our AURs on a double-digit basis. We will remain promotional going forward. That is part of the business that we're in. It's just being smarter with the promotions, reducing some depth, reducing some breadth and being able to take up AUR to offset some of this inflationary pressure. Fran Horowitz - Abercrombie & Fitch Co. - CEO & Director Yes, I think Scott, we've said that many times but we've said many times, our AUR pressure or our promotional stance, is based on our consumer right, our supply, our demand, what we're seeing with our customer and not really based on what's happening with the competition, right? Staying close to our customer is what's most important, and keeping that inventory in line, are the 2 real key pieces. Janet Joseph Kloppenburg - JJK Research Associates, Inc. - President And if I could just sneak one more in. You talked about sort of late deliveries impacting the assortments at Hollister, and you took care of that, you liquidated that product. Do you feel now that the assortments at Hollister are structured right, that the architecture of that assortment is where you want it to be? Fran Horowitz - Abercrombie & Fitch Co. - CEO & Director Yes. I mean, the short answer to that is yes. We feel very comfortable with where we are heading into summer with -- where swim, shorts and tees are. And as well as I mentioned just a few minutes ago, but the dress business also, really pleased with that business as well, so yes. 10 REFINITIV STREETEVENTS | www.refinitiv.com | Contact Us ©2022 Refinitiv. All rights reserved. Republication or redistribution of Refinitiv content, including by framing or similar means, is prohibited without the prior written consent of Refinitiv. 'Refinitiv' and the Refinitiv logo are registered trademarks of Refinitiv and its affiliated companies. MAY 24, 2022 / 12:30PM, ANF.N - Q1 2022 Abercrombie & Fitch Co Earnings Call
Operator And next, we have Mauricio Serna with UBS. Mauricio Serna Vega - UBS Investment Bank, Research Division - Analyst I wanted to ask if you could provide some details on how sales performed at stores versus digital. And also, if you could talk maybe about how the quarter progressed from month-to-month. And lastly, you could just repeat that portion from your remarks at the beginning when you were talking about the 2 drivers for the AUC. I know you mentioned the freight, but I kind of missed the second part. So I just want to make sure I get that part correctly. Scott D. Lipesky - Abercrombie & Fitch Co. - Executive VP & CFO Sure. Let's start with the last question. So the 2 drivers for AUC. So we saw some incremental freight versus what we assumed coming into Q1. So that hit us for about $15 million more than we thought. The other piece was accelerating the sell-through. As we just talked about, the Hollister and Gilly Hicks late receipts. So we pushed those through. Those fall goods, come with a higher AUC than the spring goods that we're selling, a little heavier apparel, so that comes with a higher AUC. So that hit us from a margin rate perspective in Q1. Backing up into the quarter on a monthly basis. I'd say our trends were consistent with what we've heard in the market. February was a good month and then March was a tough month for a couple of reasons. We had the mini back-to-school here in the U.S. and kind of that reopening and a lot of people going back to school in person last year, and we also had the Easter shift out of March. So whenever you add that in, and then we came back there in April and then thinking we've already talked about how we're trending here in the beginning of May. The last piece is performed, stores versus digital. Yes, stores have continued to claw their way back. We did see the benefit in Q1 of reopening in Europe and a lot of those stores getting back up to kind of full hours or, at least, removing some of those restrictions. And we continue to see the traffic here to stores in the U.S. continue to climb. So nice to see the balance coming back between digital and stores, and we continue to see kind of that 50-50 balance. And we'll continue to track to that. Mauricio Serna Vega - UBS Investment Bank, Research Division - Analyst And if I could just sneak one last one. Just in EMEA, it seemed a sequential recovery, but still like below the U.S. I was just wondering, from a market perspective, you talked about U.K. and Germany and France. I mean, how do -- how much do -- roughly how much does each represent of your sales? And given with the reopening, I would have expected maybe a higher growth rate. So I just want to understand like what could have dragged down the performance in EMEA? Scott D. Lipesky - Abercrombie & Fitch Co. - Executive VP & CFO Sure. We haven't provided the percent of sales for each, but those are the kind of the 1, 2, 3 biggest countries for us in EMEA. So good to see the U.K. performed well in Q1, and then Germany and France really turned on later. They had some pretty heavy restrictions. It really started to kind of pull off as we went throughout the quarter. Thinking about the results in total. The EMEA customer is dealing with even more inflation likely than the U.S. I mean, because of what's happening with the situation in Ukraine, there's pretty significant inflation that, that local consumer is seeing, whether it comes to heating bills or gasoline, just multiples it seems of what we're paying here in the U.S. 11 REFINITIV STREETEVENTS | www.refinitiv.com | Contact Us ©2022 Refinitiv. All rights reserved. Republication or redistribution of Refinitiv content, including by framing or similar means, is prohibited without the prior written consent of Refinitiv. 'Refinitiv' and the Refinitiv logo are registered trademarks of Refinitiv and its affiliated companies. MAY 24, 2022 / 12:30PM, ANF.N - Q1 2022 Abercrombie & Fitch Co Earnings Call
So part of the reason for our outlook that we've set up, like looking at that in inflationary demand on the consumer as we're seeing it in the U.S., we're all seeing that real time, but also in the EMEA region, that is happening in a big way. So feel good about the big 3 countries. We are laser-focused on these countries on the reopening and looking forward to them getting even closer to normalcy and kind of catching up here to the U.S. Operator Our next question will come from Kimberly Greenberger with Morgan Stanley. Kimberly Conroy Greenberger - Morgan Stanley, Research Division - MD Great. I wanted to dig in a little bit more on freight cost, if I could. Scott, have you renegotiated contracts for this year? And are you seeing any sort of relief in -- or still some inflation in those contract negotiations? And I just wanted to check if you are largely in contract for your freight needs? Or are you also availing yourself of the spot market? And then you mentioned that you might experience some relief from the very high use of air freight as we get later in the year, particularly, I think, to the fourth quarter. Assuming that does happen, would you expect to begin to see some benefits of lower freight -- lower airfreight usage in the fourth quarter gross margin? Or would we not see those benefits flow through the P&L until we get into the first half of 2023? Scott D. Lipesky - Abercrombie & Fitch Co. - Executive VP & CFO Okay. Let's start with the freight costs. So we are actually in the midst of finishing up some contracts. Our cycle is happening real time, so I'm not going to provide too much there. What we are trying to do is lock in more than we have in the past, in contracted rates to try to avoid some of the fluctuations that we've seen in the spot market. We've added some new carriers, which is exciting. So our goal is to have optionality and flexibility. And hopefully, that will result in lower rates as we go forward, but this market remains pretty tough out there. On the air freight, yes, we do expect to see some benefits flow through in Q4 and Q1 of next year. Now on the other side of that fence is the commodity cost. And when you think about what's happening in the cotton markets, that's starting to flow through the P&L. So there will be a little bit of an offset to some of the savings we see there in the air freights, with some of those commodity costs starting to flow through because it does take a pretty healthy time to have them lag through the P&L since you buy so forward into the future. So that's what we're thinking about for air freight. We're optimistic that we're not going to see big disruptions like last year. And assuming that happens, we should see a really nice benefit from air freight in the back half. Operator (Operator Instructions) Now moving to Marni Shapiro with Retail Tracker. Marni Shapiro - The Retail Tracker - Co-Founder Just 2 quick ones. Can you just talk a little bit about was the traffic -- I guess, what were the traffic patterns like in the first quarter? Are you seeing a more traditional traffic pattern driven by weather? Or when you run a promotion in the store is she coming in to buy for the promotions, specifically at Hollister as well. And then you've had some good results from this active business. And I'm curious if you could just talk a little bit about it. Is it bringing a new customer into the store? Is that helping to drive traffic to the site and to the store? 12 REFINITIV STREETEVENTS | www.refinitiv.com | Contact Us ©2022 Refinitiv. All rights reserved. Republication or redistribution of Refinitiv content, including by framing or similar means, is prohibited without the prior written consent of Refinitiv. 'Refinitiv' and the Refinitiv logo are registered trademarks of Refinitiv and its affiliated companies. MAY 24, 2022 / 12:30PM, ANF.N - Q1 2022 Abercrombie & Fitch Co Earnings Call
Scott D. Lipesky - Abercrombie & Fitch Co. - Executive VP & CFO Marni, I'll start with the first one, so traffic patterns in Q1. So you are right, we're starting to get back to more normalized traffic clustered around Easter in Q1. There were some spring breaks happening. So I'd say it's more normal. Last year was very abnormal with what we call our mini back-to-school. So we are definitely getting closer to normalized traffic patterns. And we're expecting that as we go forward for the rest of the year. Fran Horowitz - Abercrombie & Fitch Co. - CEO & Director And regarding YPB, yes, we're very excited about the initial response to YPB, which was created by request by our customers, as I always talk about how close we are to our consumer. And it is actually bringing in new consumers, which is even more exciting about it. So driving traffic and bringing in new customers. So excited to see where that's going. We're busy chasing goods. We sold out of almost 1/4 of the SKUs very quickly. So we'll talk about more of it at our Investor Day on June 14. Marni Shapiro - The Retail Tracker - Co-Founder That's exciting. A nice highlight. And did you guys break out what percentage of sales are online versus in-store? I was looking for the number. I wasn't sure if you broke that out. Scott D. Lipesky - Abercrombie & Fitch Co. - Executive VP & CFO No, we have not. We're not going to give that on a quarter-by-quarter basis as we start to normalize in. But we'll keep you posted if there's any large swings. Operator And ladies and gentlemen, that's all the time we have for questions today. I'll turn the call back over to Fran for any additional or closing remarks. Fran Horowitz - Abercrombie & Fitch Co. - CEO & Director Thank you for participating in our call today. I hope you all enjoy your Memorial Day weekend, and I look forward to seeing many of you in New York City at our June 14 Investor Day. Operator Ladies and gentlemen, this will conclude your conference for today. We do thank you for your participation, and you may now disconnect. D I S C L A I M E R Refinitiv reserves the right to make changes to documents, content, or other information on this web site without obligation to notify any person of such changes. In the conference calls upon which Event Transcripts are based, companies may make projections or other forward-looking statements regarding a variety of items. Such forward-looking statements are based upon current expectations and involve risks and uncertainties. Actual results may differ materially from those stated in any forward-looking statement based on a number of important factors and risks, which are more specifically identified in the companies' most recent SEC filings. Although the companies may indicate and believe that the assumptions underlying the forward-looking statements are reasonable, any of the assumptions could prove inaccurate or incorrect and, therefore, there can be no assurance that the results contemplated in the forward-looking statements will be realized. THE INFORMATION CONTAINED IN EVENT TRANSCRIPTS IS A TEXTUAL REPRESENTATION OF THE APPLICABLE COMPANY'S CONFERENCE CALL AND WHILE EFFORTS ARE MADE TO PROVIDE AN ACCURATE TRANSCRIPTION, THERE MAY BE MATERIAL ERRORS, OMISSIONS, OR INACCURACIES IN THE REPORTING OF THE SUBSTANCE OF THE CONFERENCE CALLS. IN NO WAY DOES REFINITIV OR THE APPLICABLE COMPANY ASSUME ANY RESPONSIBILITY FOR ANY INVESTMENT OR OTHER DECISIONS MADE BASED UPON THE INFORMATION PROVIDED ON THIS WEB SITE OR IN ANY EVENT TRANSCRIPT. USERS ARE ADVISED TO REVIEW THE APPLICABLE COMPANY'S CONFERENCE CALL ITSELF AND THE APPLICABLE COMPANY'S SEC FILINGS BEFORE MAKING ANY INVESTMENT OR OTHER DECISIONS. ©2022, Refinitiv. All Rights Reserved. 15207601-2022-05-24T18:47:49.293 13 REFINITIV STREETEVENTS | www.refinitiv.com | Contact Us ©2022 Refinitiv. All rights reserved. Republication or redistribution of Refinitiv content, including by framing or similar means, is prohibited without the prior written consent of Refinitiv. 'Refinitiv' and the Refinitiv logo are registered trademarks of Refinitiv and its affiliated companies. MAY 24, 2022 / 12:30PM, ANF.N - Q1 2022 Abercrombie & Fitch Co Earnings Call
Serious News for Serious Traders! Try StreetInsider.com Premium Free!
You May Also Be Interested In
- Hollister Takes the Stage With Benson Boone, JVKE, Dylan Conrique & More, Launching ‘Feel Good Fest’ Music Program
- Cellares Launches Cell Q, the World’s First Automated cGMP QC Workcell for Cell Therapies, to Resolve Manual QC Processing Bottleneck and Extend IDMO Capabilities from Manufacturing Through Quality
- NioCorp Plans to Investigate Feasibility of Rare Earth Permanent Magnet Recycling
Create E-mail Alert Related Categories
SEC FilingsSign up for StreetInsider Free!
Receive full access to all new and archived articles, unlimited portfolio tracking, e-mail alerts, custom newswires and RSS feeds - and more!


 Tweet
Tweet Share
Share